Embed Size (px)
Citation preview
Glycogen Synthase Kinase-3α Promotes Fatty Acid Uptake and Lipotoxic Cardiomyopathy
Michinari Nakamura1, Tong Liu2, Seema Husain3, Peiyong Zhai1, Junco S. Warren4, Chiao-Po Hsu5, Takahisa Matsuda1, Christopher J. Phiel6, James E. Cox7, Bin Tian3, Hong Li2, Junichi Sadoshima1,8,*
1. Department of Cell Biology and Molecular Medicine, Cardiovascular Research Institute, Rutgers New Jersey Medical School, Newark, New Jersey
2. Center for Advanced Proteomics Core, Department of Biochemistry & Molecular Biology, Rutgers New Jersey Medical School, Newark, New Jersey
3. Department of Microbiology, Biochemistry, and Molecular Genetics, Rutgers New Jersey Medical School, Newark, New Jersey
4. Nora Eccles Harrison Cardiovascular Research and Training Institute, University of Utah, Salt Lake City, Department of Internal Medicine, University of Utah School of Medicine, Salt Lake City, Utah
5. Division of Cardiovascular Surgery, Department of Surgery, Taipei Veterans General Hospital, National Yang-Ming University School of Medicine, Taiwan
6. Department of Integrative Biology, University of Colorado Denver, Denver, Colorado
7. Metabolomics Core Research Facility, University of Utah, Salt Lake City, Utah, Department of Biochemistry, University of Utah, Salt Lake City, Utah
8. Lead Contact
Summary
Obesity induces lipotoxic cardiomyopathy, a condition in which lipid accumulation in
cardiomyocytes causes cardiac dysfunction. Here, we show that glycogen synthase kinase-3α (GSK-3α) mediates lipid accumulation in the heart. Fatty acids (FAs) upregulate GSK-3α, which
phosphorylates PPARα at Ser280 in the ligand binding domain (LBD). This modification ligand-
*Correspondence to Junichi Sadoshima, MD, PhD, Department of Cell Biology and Molecular Medicine, Cardiovascular Research Institute, Rutgers New Jersey Medical School, 185 South Orange Ave, MSB G-609, Newark, NJ 07103, [email protected] contributionsM.N. and J.S. designed the experiments and wrote the paper; M.N. conducted the in vitro and in vivo experiments; M.N., P.Z., and T.M. conducted the animal experiments and analyses; T.L. and H.L. conducted the mass spectrometry analyses; M.N., S.H., and B.T. conducted the gene expression analyses; J.S.W. and J.C. conducted the metabolomic analyses; C-P. H. provided the human heart samples; P.S.K. generated the GSK-3α floxed mice; C.J.P. generated the GSK-3β floxed mice; J.S. supervised the study and generated project resources. All authors reviewed and commented on the manuscript.
Declaration of InterestsThe authors declare no competing interests.
Publisher's Disclaimer: This is a PDF file of an unedited manuscript that has been accepted for publication. As a service to our customers we are providing this early version of the manuscript. The manuscript will undergo copyediting, typesetting, and review of the resulting proof before it is published in its final citable form. Please note that during the production process errors may be discovered which could affect the content, and all legal disclaimers that apply to the journal pertain.
HHS Public AccessAuthor manuscriptCell Metab. Author manuscript; available in PMC 2020 May 07.
Published in final edited form as:Cell Metab. 2019 May 07; 29(5): 1119–1134.e12. doi:10.1016/j.cmet.2019.01.005.
Author M
anuscriptA
uthor Manuscript
Author M
anuscriptA
uthor Manuscript
independently enhances transcription of a subset of PPARα targets, selectively stimulating FAs
uptake and storage, but not oxidation, thereby promoting lipid accumulation. Constitutively-active
GSK-3α, but not GSK-3β, was sufficient to drive PPARα signaling, while cardiac-specific
knockdown of GSK-3α, but not GSK-3β, or replacement of PPARα Ser280 with Ala conferred
resistance to lipotoxicity in the heart. Fibrates, PPARα ligands, inhibited phosphorylation of
PPARα at Ser280 by inhibiting the interaction of GSK-3α with the LBD of PPARα, thereby
reversing lipotoxic cardiomyopathy. These results suggest that GSK-3α promotes lipid anabolism
through PPARα-Ser280 phosphorylation, which underlies the development of lipotoxic
cardiomyopathy in the context of obesity.
eTOC blurb
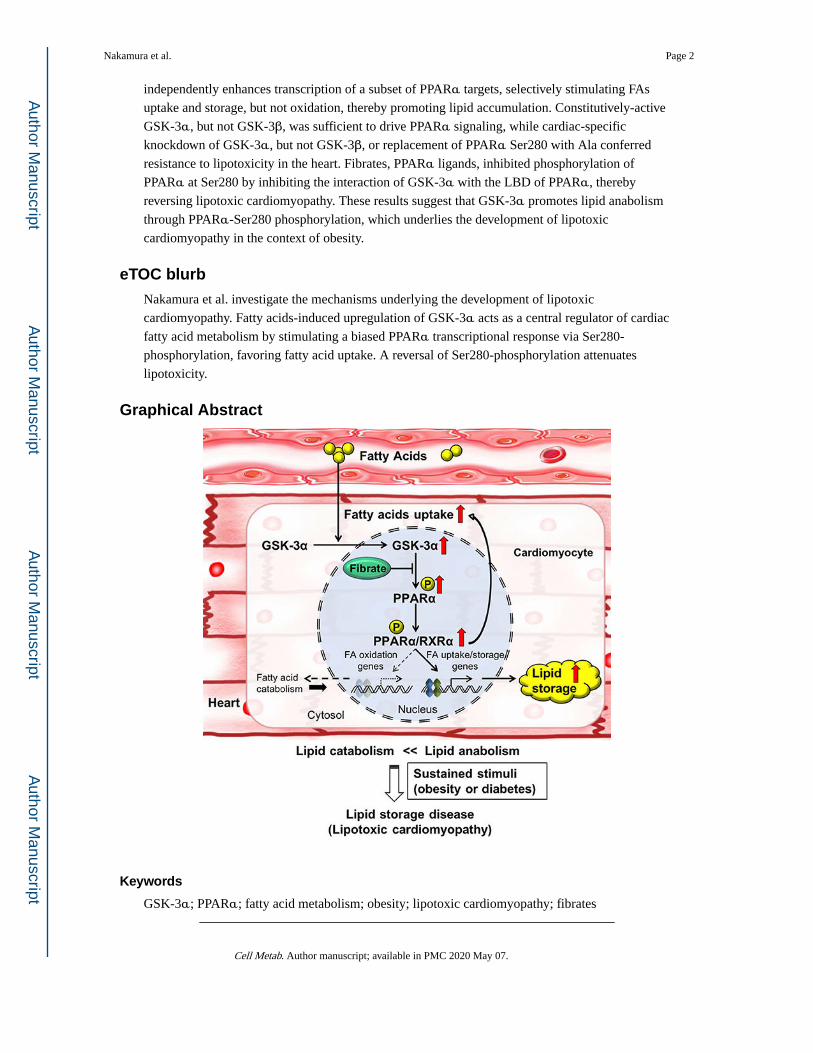
Nakamura et al. investigate the mechanisms underlying the development of lipotoxic
cardiomyopathy. Fatty acids-induced upregulation of GSK-3α acts as a central regulator of cardiac
fatty acid metabolism by stimulating a biased PPARα transcriptional response via Ser280-
phosphorylation, favoring fatty acid uptake. A reversal of Ser280-phosphorylation attenuates
lipotoxicity.
Graphical Abstract
Keywords
GSK-3α; PPARα; fatty acid metabolism; obesity; lipotoxic cardiomyopathy; fibrates
Nakamura et al. Page 2
Cell Metab. Author manuscript; available in PMC 2020 May 07.
Author M
anuscriptA
uthor Manuscript
Author M
anuscriptA
uthor Manuscript
Introduction
Fatty acids are major substrates for ATP generation in oxidative tissues, including the adult
heart (Lopaschuk et al., 2010). Derangement in fatty acid metabolism has significant
consequences for cellular functions, leading to organ failure. Decreases in the level of fatty
acid oxidation (FAO) are a common feature of heart failure (Neubauer, 2007), a condition in
which cardiac output is decreased due to dysfunction or death of individual cardiomyocytes
(CMs). In lipotoxicity, an imbalance between uptake or synthesis of fatty acid and its
consumption results in intracellular accumulation of lipid intermediates, which induces
cellular dysfunction and death in non-adipose tissues, including the kidney, liver, skeletal
muscle, and heart (Goldberg et al., 2012). Lipotoxic cardiomyopathy is the major
mechanism through which patients with insulin resistance, diabetes and obesity develop
cardiac hypertrophy and dysfunction (Schilling and Mann, 2012), and is an important cause
of heart failure with preserved ejection fraction (HFpEF). However, how the balance of fatty
acid metabolism is disrupted in obesity remains poorly understood.
Peroxisome proliferator-activated receptor α (PPARα) is a nuclear receptor transcription
factor that plays a key role in regulating fatty acid metabolism in the heart (Vega and Kelly,
2017). Genetic overexpression of PPARα in the heart mimics the phenotype of lipotoxic
cardiomyopathy (Finck et al., 2002) whereas knockdown of PPARα attenuates lipotoxic
cardiomyopathy (Finck et al., 2003), suggesting that PPARα plays an important role in the
pathogenesis of lipotoxic cardiomyopathy. However, how endogenous PPARα is
functionally modulated in the presence of obesity and diabetes and how its modification
contributes to lipotoxicity remain poorly understood. In particular, given that PPARα broadly controls expression of genes involved in fatty acid metabolism, including uptake,
storage and oxidation, it remains unclear how changes in the level or the activity of PPARα alone can cause the imbalance between the various fatty acid metabolic mechanisms in turn
leads to accumulation of lipid intermediates in CMs.
Through our extensive search for the molecular mechanism mediating lipotoxic
cardiomyopathy in mouse models of obesity and diabetes induced by high-fat diet (HFD)
consumption and genetic alteration, we found that activation of GSK-3α, an isoform of
GSK-3, is essential for the induction of lipotoxic cardiomyopathy. Thus, the goal in this
study was to elucidate the molecular mechanism by which GSK-3α controls lipid
accumulation in CMs in the presence of metabolic syndrome. Our results show that fatty
acids upregulate nuclear GSK-3α, which phosphorylates PPARα at Ser280 in the ligand
binding domain (LBD). This modification induces transcription of genes involved in fatty
acid uptake and storage, but not oxidation. Our data suggest that GSK-3α acts as a fatty
acids sensor in CMs, stimulating lipid uptake and promoting its accumulation in CMs
through biased activation of PPARα, and that this process underlies the development of
lipotoxic cardiomyopathy in obesity and diabetes.
Nakamura et al. Page 3
Cell Metab. Author manuscript; available in PMC 2020 May 07.
Author M
anuscriptA
uthor Manuscript
Author M
anuscriptA
uthor Manuscript
Results
Cardiac-specific haploinsufficiency of GSK-3α ameliorates HFD-induced cardiomyopathy
In order to elucidate changes in the signaling mechanism during the development of
lipotoxic cardiomyopathy, we analyzed publicly available gene expression datasets from the
hearts of obese (GSE16790) and diabetic mice (GSE36875). In order to distinguish the
mechanism of cardiomyopathy caused by obesity or type II diabetes, on which we are
focusing, from that caused by type I diabetes, we excluded gene sets upregulated in
streptozotocin-induced diabetic hearts (GSE5606). Twenty-six genes were upregulated in the
hearts of both obese and diabetic mice (Figure 1A). Consistent with the nature of obesity-
related cardiomyopathy, analysis of gene ontology terms showed that the metabolic process
(GO: 0008152), containing 13 genes, represented the largest biological process among the
26 overlapping genes, wherein GSK-3α was the only kinase (Figure 1B). We validated the
upregulation of GSK-3α in a diet-induced obese model. Obesity induced by HFD (60% kcal
from fat) consumption elicited lipotoxic cardiomyopathy with accumulation of
intramyocardial lipid in the heart. In line with the paper by Bugger and Abel, we also
identified insulin resistance in the heart, as evidenced by decreased Akt phosphorylation in
response to insulin (Bugger and Abel, 2009) (Figure S1A). Since Akt, which negatively
regulates GSK-3α, is downregulated and GSK-3α is translocated to the nucleus in response
to stress (Azoulay-Alfaguter et al., 2011) (Figure S4A), we evaluated the activity of GSK-3α in the nucleus in response to HFD, using immune-complex in vitro kinase assays with
recombinant β-catenin as a substrate. GSK-3α was activated by HFD consumption (Figures
1C, 1D). GSK-3α was similarly activated in genetically obese mouse (ob/ob) hearts (Figure
S1B). These results suggest that the activity of GSK-3α is significantly increased in the
hearts of mice fed a HFD and genetically obese mice.
In order to examine the functional significance of GSK-3α activation in the heart in response
to HFD consumption, we fed cardiac-specific GSK-3α heterozygous knockout (GSK-3α cHKO) and heterozygous floxed (control) mice with HFD for up to 14 weeks (Figure S1C).
Although there was no difference in body weight gain, food intake or systemic insulin
resistance between control and GSK-3α cHKO mice (Figures S1D–F), there was a clear
attenuation in HFD-induced cardiac and individual CM hypertrophy in GSK-3α cHKO mice
(Figures 1E, 1F, S1G). Left ventricular (LV) systolic function was preserved in both groups
(Figure S1H) after HFD consumption. However, HFD induced diastolic dysfunction in
control mice, as evidenced by a longer deceleration time (DT) of the transmitral flow
observed via Doppler echocardiography, a left upward shift of the slope of the end-diastolic
pressure-volume (PV) relation loop (EDPVR), and an increase in Tau in PV loop analyses
(Pacher et al., 2008) (Figures 1G, 1H, S1I–K). The HFD-induced diastolic dysfunction was
significantly alleviated in GSK-3α cHKO mice. HFD consumption did not affect maximum
LV pressure or stroke work in either control or GSK-3a cHKO mice (Figures S1L, S1M).
These results indicate that HFD-mediated cardiac hypertrophy (lipotoxic cardiomyopathy)
may not be induced by altered blood pressure within 3 months, and that suppression of
hypertrophy does not lead to markedly elevated wall stress; thus, the overall function of the
heart in GSK-3α cHKO mice is improved. Together, these results suggest that aberrant
Nakamura et al. Page 4
Cell Metab. Author manuscript; available in PMC 2020 May 07.
Author M
anuscriptA
uthor Manuscript
Author M
anuscriptA
uthor Manuscript
activation of GSK-3α plays a critical role in the development of cardiomyopathy in response
to HFD consumption.
Intramyocardial lipid accumulation, as assessed by Oil Red O staining, and palmitic acid
oxidation, assessed using 3H-palmitic acid, were increased in control mouse hearts in
response to HFD, but were markedly attenuated in GSK-3α cHKO mice (Figures 1I, 1J). A
Seahorse analysis indicated that the mitochondrial FAO rate was also increased in CMs
isolated from the hearts of control mice fed HFD but was significantly suppressed in CMs
isolated from the hearts of GSK-3α cHKO mice fed HFD (Figures S2A–D). In addition,
picric acid Sirius red staining showed reduced cardiac fibrosis in GSK-3α cHKO mice
compared to in control mice (Figure 1K). Glycogen storage in the heart was not significantly
altered by GSK-3α suppression (Figures S2E, S2F). Notably, GSK-3β cHKO mice
developed cardiac systolic dysfunction and more prominent myocardial lipid accumulation
than control mice in response to HFD (Figures S2G–K), suggesting that the role of GSK-3 is
isoform-dependent. HFD upregulated mRNA expression of genes involved in fatty acid
metabolism in control mice, whereas these changes were attenuated in GSK-3α cHKO mice
(Figure 1L). In contrast, gene expression of inflammatory cytokines and other transcription
factors related to cardiac metabolism did not differ significantly between control and
GSK-3α cHKO mice fed a HFD. These results indicate that alleviation of diet-induced
cardiomyopathy and metabolic remodeling in GSK-3α cHKO mice may be mediated, at
least in part, at the level of transcription of genes involved in fatty acid metabolism.
Since HFD activates GSK-3α, we hypothesized that activation of GSK-3α is sufficient to
deregulate expression of fatty acid metabolism-related genes. We analyzed microarray data
obtained from the hearts of GSK-3α S21A homozygous knockin (KI) mice harboring
constitutively active GSK-3α and wild-type (WT) mice fed normal chow (NC) (Matsuda et
al., 2008). Although there was no overt cardiac phenotype at the age of 3 months, the gene
set enrichment analysis (GSEA) showed that, in the hearts of GSK-3α S21A KI mice, PPAR
signaling is the most significantly enriched among the upregulated gene sets related to
energy metabolism (Figure 1M, Table 1 and Table S1). In contrast, GSK-3β S9A
homozygous KI mice, harboring constitutively active GSK-3β, displayed downregulation of
genes involved in cardiac fatty acid metabolism (Figure S2L). One PPAR target gene, CD36,
was significantly increased in GSK-3α S21A KI mice (Figure S2M). Consistent with the
increased CD36 mRNA expression, both palmitate uptake into the heart and intramyocardial
lipid accumulation were increased in GSK-3α S21A KI mice (Figures S2N, S2O). These
results are also consistent with the absence of an increase in expression of CD36 in response
to HFD consumption in GSK-3α cHKO mice (Figure 1L), which could partially explain the
lower FAO, potentially resulting from less fatty acid import, in GSK-3α cHKO mice. Taken
together, these results indicate that upregulation of GSK-3α, but not GSK-3β, positively
regulates lipid metabolism through PPAR modification in the heart.
GSK-3α phosphorylates PPARα at Ser280, located in the ligand binding domain
Since the PPARα transcription factor plays a major role in the regulation of fatty acid
metabolism in the heart, we examined the physical interaction between GSK-3α and
PPARα. YFP-tagged PPARα pulled down endogenous GSK-3α, but not GSK-3β, in CMs
Nakamura et al. Page 5
Cell Metab. Author manuscript; available in PMC 2020 May 07.
Author M
anuscriptA
uthor Manuscript
Author M
anuscriptA
uthor Manuscript
(Figures 2A, S3A). Anti-FLAG immunoprecipitation assays showed that GSK-3α and
PPARα interact with one another in mouse hearts overexpressing FLAG-tagged PPARα (Figure 2B). Co-immunoprecipitation assays also revealed that endogenous GSK-3α and
endogenous PPARα interact with one another in CMs in vitro (Figure 2C). In addition, in vitro binding assays using recombinant GST-PPARα and recombinant GSK-3α or GSK-3β showed that GSK-3α, but not GSK-3β, directly interacts with PPARα (Figures 2D, S3B).
We further evaluated which amino acids of PPARα are involved in the interaction with
endogenous GSK-3α, using truncated recombinant GST-PPARα and CM lysates (Figures
2E, 2F). Although full-length (FL) and N-terminally truncated (T5) GST-PPARα were able
to pull down endogenous GSK-3α, C-terminally truncated GST-PPARα (T1-T4) and GST
alone failed to pull down GSK-3α, suggesting that the LBD of PPARα interacts with
GSK-3α (Figure 2G).
We then hypothesized that GSK-3α phosphorylates PPARα. In vitro kinase assays showed
that both GST-PPARα-FL and a PPARα fragment (amino acids 170–430) containing the
LBD are phosphorylated by GSK-3α (Figure S3C). Furthermore, mass spectrometry
analysis showed that Ser280 of PPARα, located in the LBD and highly conserved in PPARα across species, is phosphorylated by GSK-3α (Figures 2H, S3D). We therefore generated an
antibody against PPARα phosphorylated at Ser280. This antibody effectively detected GST-
tagged WT PPARα, but not GST-tagged PPARα-S280A, a non-phosphorylatable mutant,
after in vitro kinase assays with GSK-3α (Figures S3E, S3F). Using this antibody, we
confirmed that YFP-tagged PPARα-WT, but not PPARα-S280A, was phosphorylated in the
presence of GSK-3α overexpression but not GSK-3α knockdown in CMs (Figure S3G).
YFP-tagged PPARα-S280D, a phospho-mimetic mutant, was detected by the phospho-
specific antibody even in cells in which GSK-3α was knocked down. Immunoblot analyses
using this antibody showed that Ser280 phosphorylation of endogenous PPARα was
increased in control mouse hearts in response to HFD consumption (Figures 2I, S3H),
whereas there was significantly less Ser280 phosphorylation in GSK-3α cHKO mouse
hearts (Figures 2J, S3I). Taken together, these data indicate that GSK-3α directly interacts
with PPARα at the LBD and phosphorylates PPARα at Ser280 in the heart, and that Ser280
phosphorylation of PPARα is increased by HFD consumption through GSK-3α activation.
GSK-3α-mediated phosphorylation enhances PPARα transcriptional activity
We examined the functional role of PPARα-Ser280 phosphorylation. First, we investigated
whether the phosphorylation status of endogenous PPARα is altered by fatty acids through
GSK-3α in CMs in vitro. Bovine serum albumin (BSA)-conjugated palmitic acid, a major
saturated fatty acid in mammals, increased the nuclear localization of GSK-3α in CMs
within 1 hour, whereas GSK-3β was located diffusely in CMs, as shown by
immunofluorescence staining (Figure S4A). The activity of GSK-3α in the nucleus was
increased in response to palmitic acid, as determined by immune-complex in vitro kinase
assays of the nuclear fraction of CMs (Figure S4B). In association with the enhanced
GSK-3α activity, PPARα-Ser280 phosphorylation in the nuclear fraction was increased by
palmitic acid in a dose-dependent manner (Figure 3A), an effect that was suppressed in the
presence of adenovirus-mediated knockdown of GSK-3α (adenovirus (ad)-short-hairpin
(sh)RNA-GSK-3α) (Figures 3B, S4C). Since saturated fatty acids, such as palmitic acid,
Nakamura et al. Page 6
Cell Metab. Author manuscript; available in PMC 2020 May 07.
Author M
anuscriptA
uthor Manuscript
Author M
anuscriptA
uthor Manuscript

monounsaturated fatty acids, such as oleic acid, and polyunsaturated fatty acids, such as
linoleic acid, have distinct effects on metabolic diseases (Roberts et al., 2014), we examined
the impact of unsaturated fatty acids and a fatty acids cocktail containing palmitic acid, oleic
acid, and linoleic acid, on the GSK-3α-PPARα axis. Both oleic acid and the cocktail
induced nuclear localization of GSK-3α and PPARα-Ser280 phosphorylation, an effect
similar to that of palmitic acid. On the other hand, GSK-3α localization was unaffected and
PPARα-Ser280 phosphorylation decreased in the presence of linoleic acid (Figures 3C,
S4D–F). These results suggest that palmitic acid, oleic acid, and the fatty acids cocktail, but
not linoleic acid, increase PPARα-Ser280 phosphorylation through GSK-3α in the CM
nucleus in vitro.
Next, we examined the effect of Ser280-phosphorylation on PPARα transcriptional activity
in response to palmitic acid in CMs. Knockdown of GSK-3α by ad-shRNA-GSK-3α abolished the palmitic acid-induced increase in PPARα activity (Figure S4G). The effect of
PPARα-Ser280 phosphorylation on its activity was further elucidated using PPARα-WT,
PPARα-S280A and PPARα-S280D. Whereas PPARα reporter activity dose-dependently
increased in response to palmitic acid in PPARα-WT-transduced H9C2 cells, it was
significantly attenuated in PPARα-S280A-transduced H9C2 cells (Figure S4H). Conversely,
PPARα-S280D increased transcriptional activity independently of palmitic acid. These
results suggest that GSK-3α positively regulates PPARα activity through Ser280
phosphorylation. Since PPARγ, another PPAR isoform, is phosphorylated at Ser273 by
ERK/CDK5 in adipose tissue in obesity (Banks et al., 2015; Choi et al., 2010), we evaluated
the phosphorylation status of PPARγ at Ser273. Neither palmitic acid nor changes in
GSK-3α expression altered the PPARγ-Ser273 phosphorylation level in CMs (Figures S4I,
S4J).
To demonstrate the functional role of PPARα phosphorylation, we performed an RNA-
sequencing analysis of H9C2 cells transduced with PPARα-WT, PPARα-S280A, PPARα-
S280D or YFP as a control. The results indicated that PPARα phosphorylation induces
global changes in gene expression (Figure 3D). Ingenuity Pathway Analysis showed that
phosphorylation of PPARα significantly alters energy metabolism (Figure S4K).
Furthermore, GSEAs showed that fatty acid and glycerolipid metabolism-related gene sets
are significantly enriched in PPARα-S280D-transduced cells relative to PPARα-WT (Figure
3E and Table S2). Gene expression changes were further examined in CMs by quantitative
RT-PCR (Figure 3F). PPARα-S280D increased expression of genes related to fatty acid
uptake and pyruvate dehydrogenase kinase 4 (PDK4), which inactivates the pyruvate
dehydrogenase (PDH) complex and inhibits glucose oxidation, but genes related to β-
oxidation and mitochondrial oxidative phosphorylation were mostly either unchanged or
decreased (Figure 3F). These results suggest that PPARα-Ser280 phosphorylation
upregulates expression of genes involved in fatty acid uptake and storage but not utilization.
We next investigated the functional significance of PPARα phosphorylation in CMs.
Consistent with the gene expression patterns, transduction with PPARα-S280D markedly
enhanced uptake of BSA-palmitic acid and BSA-fatty acids cocktail into CMs compared to
transduction with either PPARα-WT or PPARα-S280A (Figure 3G). The oxygen
consumption rate (OCR) inhibitable with etomoxir, a Cpt1 inhibitor, was evaluated as a
Nakamura et al. Page 7
Cell Metab. Author manuscript; available in PMC 2020 May 07.
Author M
anuscriptA
uthor Manuscript
Author M
anuscriptA
uthor Manuscript

measure of mitochondrial FAO in CMs using a Seahorse analyzer (Kim et al., 2013). Despite
a significant increase in fatty acid uptake in CMs expressing the PPARα-S280D mutant
compared to in those expressing PPARα-WT, FAO was not further increased in PPARα-
S280D-transduced CMs compared to in PPARα-WT-transduced CMs (Figures 3H, 3I, S4L),
suggesting that CMs expressing PPARα-S280D accumulate more lipids than those
expressing PPARα-WT (Figures 3J, 3K, S4M). Taken together, these results suggest that
Ser280-phosphorylation of PPARα may shift fatty acid metabolism to fatty acid uptake and
storage, thereby promoting lipid accumulation.
Phosphorylation of PPARα at Ser280 increases both interaction between PPARα and RXRα and specific DNA binding
We investigated the mechanism by which Ser280-phosphorylation enhances PPARα activity.
YFP-tagged PPARα-S280A and -S280D mutants were both found primarily in the nucleus
(Figure S5A), indicating that Ser280 phosphorylation does not affect the nuclear localization
of PPARα. PPARα heterodimerizes with retinoid X receptor (RXR) and binds to the PPAR
response element (PPRE) to activate transcription (Evans and Mangelsdorf, 2014).
Immunoprecipitation assays showed that heterodimerization with RXRα occurs more
efficiently in PPARα-S280D than in PPARα-WT or PPARα-S280A (Figure 4A). Although
PPARα activity can be altered by recruitment of Sirt1 to PPARα (Oka et al., 2011),
interaction with Sirt1 was phosphorylation-independent (Figure S5B). According to the
three-dimensional structure of PPARα previously analyzed by X-ray crystallography (Xu et
al., 2002), Ser280 is located on helix 3 near His440 and Lys448/449, basic residues on helix
11 across the ligand binding pocket (Figure S5C). Thus, we predict that Ser280-
phosphorylation shortens the distance between Ser280 and His440 or Lys448/449 through
increased electrostatic interaction, which could allow the activating function-2 (AF-2) on
helix 12 to adopt a more stable and active conformation in an agonist-independent manner
(Figures S5D). In fact, in vitro PPARα reporter assays showed that combined mutations
replacing His440 and Lys448/449 with uncharged amino acids suppressed the activity of
PPARα-S280D to a level similar to that of PPARα-WT (Figures 4B, S5E), consistent with
the aforementioned hypothesis.
Next, we asked whether increased association of PPARα-S280D with RXRα enhances DNA
binding. We compared the chromatin association of the PPARα-WT, PPARα-S280A, and
PPARα-S280D alleles using chromatin immunoprecipitation assays. PPARα-S280D
exhibited enhanced chromatin association with the promoters of genes involved in fatty acid
uptake and transport in CMs compared to PPARα-WT, whereas PPARα-S280A exhibited
less chromatin association than PPARα-WT (Figures 4C, S5F). However, DNA binding of
PPARα-S280D was unchanged or decreased compared to PPARα-WT and PPARα-S280A
when we used primers for the promoters of genes encoding mitochondrial FAO proteins
(Figures 4D, S5F).
We further investigated the underlying mechanisms by which Ser280-phosphorylated
PPARα preferentially stimulates fatty acid uptake-related genes rather than oxidation-related
genes. First, we evaluated whether the binding affinity of PPARα to the PPRE is altered by
the phosphorylation, using a double-stranded oligo pull-down assay. The oligos containing
Nakamura et al. Page 8
Cell Metab. Author manuscript; available in PMC 2020 May 07.
Author M
anuscriptA
uthor Manuscript
Author M
anuscriptA
uthor Manuscript
the PPRE/DR1 sequences in the uptake-related gene promoters were able to pull down
phosphorylated recombinant GST-PPARα to a greater extent than those containing the
PPRE/DR1 sequences in the oxidation-related gene promoters (Figure 4E). On the other
hand, the binding ability of PPARα to the PPRE sequences of the oxidation-related genes
was higher when PPARα was not phosphorylated at Ser280 (recombinant GST-PPARα-
S280A). These results suggest that phosphorylation at Ser280 is sufficient to change the
DNA binding preference of PPARα, even in the absence of other proteins.
In order to test whether differences in the PPRE/DR1 sequence confer a preference for
recruiting either Ser280-phosphorylated or unphosphorylated PPARα and, consequently,
selective control of fatty acid uptake vs oxidation, we first inspected PPRE/DR1 sequences
in the promoters of genes upregulated by PPARα-S280D vs S280A to generate PPRE/DR1
motifs (Figure S5G). The genes identified by the PPARα-S280D-related PPRE/DR1 motif
were more frequently observed in the gene set identified by the fatty acid uptake-related
PPRE/DR1 motif than in that associated with the oxidation-related PPRE/DR1 motif (Figure
4F). These results indicate that the selective control of fatty acid uptake vs oxidation by
PPARα-Ser280 phosphorylation is modulated at least in part by the PPRE/DR1 sequence.
Together, these findings suggest that GSK-3α-mediated phosphorylation of PPARα at
Ser280 increases the interaction between PPARα and RXRα and the binding of PPARα to
specific PPREs, thereby stimulating a subset of PPARα target genes favoring fatty acid
uptake and storage (Figure S5H).
PPARα phosphorylation is critical for HFD-induced lipid derangement in the heart
In order to demonstrate the functional significance of PPARα-Ser280 phosphorylation in the
heart in vivo in response to HFD, we generated KI mice in which the Ser280 residue in
PPARα was replaced with Ala (PPARα-S280A KI mice) on the C57BL/6J background,
using homologous recombination in ES cells (Figures S6A–D). Since homozygous KI mice
were embryonic lethal, we used heterozygous KI (het KI) mice for further characterization.
The cardiac phenotype of the het KI mice was normal at 18 weeks of age. We first evaluated
how the lack of PPARα-Ser280 phosphorylation affects metabolites in the heart at baseline
by GC/MS-based metabolomic analysis. Glucose metabolites and branched-chain amino
acids were similar in WT and het KI mice, whereas myocardial levels of free fatty acids
were decreased in het KI mice, accompanied by decreases in fumaric acid and malic acid
(Figures 5A, 5B, and Table S3). In order to test whether PPARα-Ser280 phosphorylation
mediates HFD-induced lipotoxicity in the heart, het KI and WT mice were subjected to HFD
feeding for 8 weeks. Although HFD induced Ser280 phosphorylation of PPARα in WT
mice, the phosphorylation was reduced in het KI mice (Figure S6E). Cardiac hypertrophy
induced by HFD was ameliorated in het KI mice (Figure 5C). Echocardiography showed a
preserved ejection fraction in both WT and het KI mice in both the presence and absence of
HFD (Figure S6F), while the HFD-induced diastolic dysfunction observed in WT mice was
significantly attenuated in het KI mice (Figures 5D, S6G–J). Lipid accumulation was also
significantly attenuated in het KI mice (Figure 5E). These results suggest that a HFD-
induced increase in PPARα-Ser280 phosphorylation plays a critical role in the development
of lipotoxic cardiomyopathy.
Nakamura et al. Page 9
Cell Metab. Author manuscript; available in PMC 2020 May 07.
Author M
anuscriptA
uthor Manuscript
Author M
anuscriptA
uthor Manuscript

Next, we asked whether an increase in PPARα-Ser280 phosphorylation is sufficient to
induce cardiac lipotoxicity. Either PPARα-WT or PPARα-S280D was expressed in the
hearts of WT mice (C57BL/6J background) fed NC for 8 weeks using adeno-associated
virus (AAV)-DJ/8-mediated gene delivery (Figure 5F). AAV-empty injection was performed
as a control. Although no significant difference in body weight was observed among the
groups (Figure S6K), PPARα-S280D-expressing mice exhibited cardiac hypertrophy and
diastolic dysfunction with preserved ejection fraction (Figures 5G–J, S6L–N). Lung weight/
body weight was increased in PPARα-S280D-expressing mice, suggesting that PPARα phosphorylation leads to the development of HFpEF (Figure S6K). Despite an increase in
FAO rate (Figures 5K, S6O), PPARα-S280D induced cardiac lipid accumulation to a
markedly greater degree than PPARα-WT or AAV-empty injection, accompanied by
increased cardiac fibrosis (Figures 5L, 5M). These results suggest that PPARα phosphorylation at Ser280 is sufficient to induce lipid accumulation and cardiomyopathy.
PPARα ligands inhibit GSK-3α-mediated phosphorylation of PPARα
Fenofibrate is a US Food and Drug Administration (FDA)-approved PPARα agonist. Given
that GSK-3α interacts with and phosphorylates PPARα in the LBD, we asked whether
fenofibrate alters the status of Ser280 phosphorylation. Interestingly, fenofibrate inhibited
PPARα-Ser280 phosphorylation in a dose-dependent manner in CMs in the presence of
palmitic acid or the fatty acids cocktail (Figures 6A, S7A, S7B). Another PPARα agonist,
WY-14643, also inhibited GSK-3α-mediated PPARα-Ser280 phosphorylation in vitro, as
well as palmitic acid-induced Ser280 phosphorylation in cultured CMs (Figures S7C, S7D).
We also tested whether fenofibrate inhibits PPARα-Ser280 phosphorylation in the heart in vivo and whether it ameliorates HFD-induced lipid dysregulation and cardiac dysfunction.
Mice were fed ad libitum with HFD in the presence or absence of 0.2% (wt/wt) fenofibrate
(Haemmerle et al., 2011) for the indicated periods (Figure S7E). Consistent with the in vitro results, fenofibrate treatment suppressed HFD-induced PPARα-Ser280 phosphorylation in
the heart (Figures 6B, S7F). Systolic function was preserved in both the control and
fenofibrate groups (Figure S7G), but fenofibrate significantly attenuated cardiac hypertrophy
and diastolic dysfunction (Figures 6C–D, S7H–K). Although fenofibrate decreased palmitate
oxidation in the hearts of mice fed a HFD (Figure S7L), it significantly suppressed HFD-
induced lipid accumulation in the heart (Figure 6E).
In order to test whether fenofibrate directly affects lipid metabolism in CMs, in vitro experiments were conducted. Fenofibrate enhanced the transcriptional activity of PPARα in
both the absence and presence of low concentrations of palmitic acid in CMs (Figure S7M),
confirming the role of fenofibrate as a PPARα agonist. However, fenofibrate decreased fatty
acid-induced PPARα activation in the presence of high concentrations of palmitic acid
(Figure S7M). Although fenofibrate suppressed PPARα reporter gene activity in response to
a high concentration of palmitic acid in H9C2 cells transduced with PPARα-WT, it failed to
suppress the PPARα activity in those transduced with PPARα-S280D (Figure 6F),
suggesting that fenofibrate-induced suppression of PPARα activity in the presence of a high
concentration of palmitic acid is mediated through suppression of PPARα-Ser280
phosphorylation. To further demonstrate the functional alterations in lipid metabolism in
Nakamura et al. Page 10
Cell Metab. Author manuscript; available in PMC 2020 May 07.
Author M
anuscriptA
uthor Manuscript
Author M
anuscriptA
uthor Manuscript
response to fenofibrate, CMs transduced with either PPARα-WT or PPARα-S280D were
treated with either a low (50 μM) or high (500 μM) concentration of palmitic acid or the
fatty acid cocktail. Seahorse analyses showed that fenofibrate suppressed the FAO rate at
high, but not low, concentrations of fatty acids in CMs expressing PPARα-WT. However,
fenofibrate did not affect the mitochondrial FAO rate at either low or high concentrations of
fatty acids in CMs expressing PPARα-S280D (Figure 6G, data using the cocktail not
shown). Similarly, although intracellular lipid accumulation, evaluated with Oil Red O
staining, induced by a high concentration of palmitic acid was suppressed by fenofibrate in
CMs expressing PPARα-WT, it was not affected by fenofibrate in CMs expressing PPARα-
Ser280D (Figure 6H). These results indicate that fenofibrate acts as a PPARα agonist at low
concentrations of fatty acids but suppresses fatty acid metabolism in the presence of high
concentrations of fatty acids, by inhibiting PPARα-Ser280 phosphorylation (Figure S7N).
Next, we examined the mechanisms by which fenofibrate decreases Ser280 phosphorylation.
GSK-3α and YFP-tagged PPARα physically interact with one another in a palmitic acid
concentration-dependent manner, as evaluated with pull-down assays (Figures 6I, 6J) and in situ proximity ligation assays (Figure 6K). Fenofibrate inhibited the interaction between
endogenous GSK-3α and YFP-tagged PPARα in CMs. Taken together, these results suggest
that fenofibrate negatively regulates PPARα phosphorylation in CMs by inhibiting the
interaction between GSK-3α and PPARα, thereby suppressing PPARα activity and
normalizing lipid derangement in the heart in the presence of high concentrations of fatty
acid.
Finally, we examined GSK-3α activity in human failing hearts. Diabetic patients showed a
reduction in the ratio of Ser21-phosphorylated versus total GSK-3α (Figures 6L, S7O and
Table S4), indicating enhanced GSK-3α activity in the presence of diabetes in human hearts.
Discussion
In this study, we show that GSK-3α acts as a key kinase controlling lipid uptake and storage
through PPARα phosphorylation. Fatty acids upregulate nuclear GSK-3α, which
phosphorylates PPARα at Ser280, selectively stimulating transcription of genes involved in
fatty acid uptake and storage without affecting those involved in FAO. The resultant
imbalance between lipid uptake and consumption leads to intracellular lipid accumulation in
metabolic syndrome. We propose that the GSK-3α-PPARα pathway is an essential mediator
of fatty acid uptake/storage.
Ligand-independent PPARα activation through Ser280 phosphorylation
Our results suggest that Ser280 phosphorylation stimulates PPARα function independently
of ligands. The Ser280 residue of PPARα is located in helix 3 (H3) within the LBD (Zoete
et al., 2007). Based on the crystal structure of the PPARα LBD (Xu et al., 2002) and PPRE
luciferase reporter assays, we predict that phosphorylation of PPARα-Ser280 enhances its
electrostatic interaction with His440 and Lys448/449, basic residues on helix 11 (H11),
thereby shortening the distance between H3 and H11 and allowing the adjacent helix 12
(H12), containing AF-2, to fold up against the LBD core, creating a lid over the ligand-
binding pocket even in the absence of endogenous ligands. PPARα-Ser280 phosphorylation
Nakamura et al. Page 11
Cell Metab. Author manuscript; available in PMC 2020 May 07.
Author M
anuscriptA
uthor Manuscript
Author M
anuscriptA
uthor Manuscript
also enhances the binding of PPARα to the PPRE in the promoters of genes involved in fatty
acid uptake but not mitochondrial FAO. Thus, it is likely that Ser280 phosphorylation affects
the function of PPARα through multiple mechanisms by allosterically affecting the structure
of PPARα. This, in turn, allows Ser280-phosphorylated PPARα to selectively activate
transcription of genes involved in fatty acid uptake and storage but not utilization; this
selectivity is modulated at least in part by the PPRE sequence.
Previous investigations have shown that PPARγ is phosphorylated by ERK/CDK5 at Ser273
in adipose tissues in a model of obesity (Banks et al., 2015; Choi et al., 2010). Although
both Ser280 in PPARα and Ser273 in PPARγ are located in the LBD, there is no amino acid
sequence homology between the regions adjacent to PPARα Ser280 and PPARγ Ser273.
Consistently, neither fatty acids nor changes in GSK-3α activity alter the level of PPARγ-
Ser273 phosphorylation in CMs. Furthermore, although fenofibrate inhibits phosphorylation
of PPARα at Ser280 by competing with GSK-3α, it does not inhibit phosphorylation of
PPARγ at Ser273 (Figure S7P). More importantly, phosphorylation of PPARα at Ser280 and
that of PPARγ at Ser273 affect distinct sets of downstream genes and exhibit distinct
functional consequences, namely promoting fatty acid uptake and lipotoxicity in the heart
and lipid-independent insulin resistance in adipose tissue, respectively.
GSK-3 in metabolism
GSK-3α and GSK-3β share 98% sequence similarity in their catalytic domains and
phosphorylate some common targets in vitro. However, genetic deletion of GSK-3β in mice
causes embryonic lethality, whereas deletion of GSK-3α does not, suggesting that GSK-3α and GSK-3β have distinct biological targets (Hoeflich et al., 2000). The differences in the
amino acid sequences at the N- and C-termini confer distinct substrate specificities, and the
difference in subcellular localization between GSK-3α and GSK-3β allows them to
phosphorylate distinct substrates as well. Here, only GSK-3α, but not GSK-3β, translocates
to the nucleus and interacts with PPARα in CMs in response to fatty acids. Interestingly,
although downregulation of GSK-3α in CMs inhibited the development of cardiomyopathy
in response to HFD consumption, downregulation of GSK-3β exacerbated HFD-induced
cardiomyopathy. Constitutively active GSK-3α and GSK-3β regulate expression of genes
involved in fatty acid uptake and transport in diametrically opposite directions. Elucidating
the molecular mechanisms allowing GSK-3α and GSK-3β to exert opposite functions is
important because none of the currently available small molecule inhibitors for GSK-3 are
isoform specific and, thus, the beneficial effect of GSK-3α inhibition upon lipotoxic
cardiomyopathy could be diminished or overwhelmed by the detrimental effect of GSK-3β inhibition. In theory, only the unique actions of GSK-3α ought to be targeted for the
treatment of lipotoxic cardiomyopathy.
GSK-3 has recently been shown to act as a glucose sensor in B cells in the germinal center
(Jellusova et al., 2017): GSK-3 is inactivated in the presence of abundant glucose, promoting
cell growth and proliferation, whereas GSK-3 is activated under conditions of glucose
deprivation, increasing glycolysis and energy production. Glucose and fatty acid metabolism
are often reciprocally regulated. According to the Randle hypothesis, fatty acid suppresses
glucose oxidation and induces insulin resistance in muscles through an increase in
Nakamura et al. Page 12
Cell Metab. Author manuscript; available in PMC 2020 May 07.
Author M
anuscriptA
uthor Manuscript
Author M
anuscriptA
uthor Manuscript
intracellular citrate concentration (Randle et al., 1963). Alternatively, fatty acid negatively
regulates glucose oxidation through DAG-mediated activation of PKCθ and IRS-1 and the
subsequent inhibition of PI3K and GLUT4 translocation (Samuel and Shulman, 2012;
Shulman, 2014). Our results represent another important mechanism in the heart by which
fatty acids negatively regulate glucose oxidation: increases in fatty acids activate GSK-3α,
which in turn upregulates PDK4 through PPARα phosphorylation. We propose that glucose
and fatty acid metabolism may be coordinately regulated via GSK-3α in the heart and that
the GSK-3α-PPARα axis is a major mechanism in the induction of lipotoxic
cardiomyopathy in obesity. Since expression of GSK-3α is increased in the presence of fatty
acids, GSK-3α and PPARα may constitute a feed-forward mechanism that not only
contributes to myocardial energy production in the intact heart, such as during fasting, but
also facilitates the progression of lipotoxic cardiomyopathy in metabolic syndrome. It is
tempting to speculate that mammals, including humans, have developed this mechanism to
allow the heart to promote fatty acid uptake and storage without stimulating FAO or
consequent production of reactive oxygen species when fat is abundant in preparation for
future use as a backup when fat is less available.
Bidirectional role of fibrates in cardiac lipid metabolism
Fenofibrate is a synthetic PPARα agonist that has been shown to stimulate fatty acid
metabolism in the liver and skeletal muscle. However, the pharmacological action of
fenofibrate in the heart remains elusive because fenofibrate fails to alter myocardial fatty
acid metabolism in healthy human volunteers and, conversely, decreases fatty acid
metabolism in the hearts of mice fed a HFD (Sarma et al., 2012). Here, we demonstrate that
fenofibrate inhibits PPARα activity by blocking GSK-3α-mediated PPARα phosphorylation
in the presence of high concentrations of fatty acids in CMs. GSK-3α is translocated into the
nucleus in the presence of high concentrations of fatty acids, where it phosphorylates
PPARα. Since GSK-3α and fenofibrate both bind to the PPARα LBD, fenofibrate can
competitively inhibit the access of GSK-3α to the LBD of PPARα and inhibit Ser280
phosphorylation.
It should be noted that the effectiveness of fenofibrate for treatment of diabetic patients
remains controversial. Although a recent meta analysis showed that fibrates have an additive
cardioprotective effect upon statin therapy in humans (Silverman et al., 2016), the ACCORD
(Action to Control Cardiovascular Risk in Diabetes) trial had previously showed little or no
effect of combination therapy with fenofibrate and simvastatin compared to simvastatin
alone in patients with diabetes (Group et al., 2010). Given the aforementioned difficulty in
developing an isoform-specific inhibitor for GSK-3α and the absence of an approved drug
for lipotoxic cardiomyopathy in the clinical setting, interventions directly and selectively
suppressing PPARα-phosphorylation at Ser280 may be more effective as a treatment for
lipotoxic cardiomyopathy than either GSK-3 inhibitors or fenofibrate. PPARα has cell-type
specific roles. For example, enhanced PPARα activity in muscle or liver is protective against
diet-induced obesity or diabetes (Finck et al., 2005; Kersten et al., 1999). Furthermore,
transcription may be regulated in a cell-type specific manner (Gosselin et al., 2014; Heinz et
al., 2015). Thus, whether PPARα-Ser280 phosphorylation also contributes to fatty acid
metabolism in other cell types remains to be elucidated.
Nakamura et al. Page 13
Cell Metab. Author manuscript; available in PMC 2020 May 07.
Author M
anuscriptA
uthor Manuscript
Author M
anuscriptA
uthor Manuscript
Increasing evidence suggests that the fatty acid composition of fats, including
monounsaturated or polyunsaturated fatty acids and even-chain or odd-chain saturated fatty
acids, the total and individual concentrations of fatty acids, and the ratio of saturated to
unsaturated fatty acids all have distinct effects on cellular metabolism, thereby either
promoting or preventing metabolic syndrome and cardiovascular diseases. Thus, it is
challenging to conduct an in vitro study that faithfully mimics the fatty acid composition
observed in HFD models in vivo. The palmitic acid concentration in human plasma ranges
from 25 to 2500 μM, and the level of PPARα phosphorylation at Ser280 in CMs in vitro in
response to the fatty acid concentrations we used is comparable to those in the hearts of
mice fed either a HFD or a control diet in vivo. Therefore, the experiments conducted using
a range of 0 to 500 μM of BSA-conjugated fatty acids in CMs in vitro closely resemble
human lipotoxic cardiomyopathy in terms of lipid accumulation and altered cellular
metabolism. It would be interesting to investigate the impact of additional single fatty acids
or multiple fatty acids in combination with different ratios on the Ser280-phosphorylation
level in the future.
Limitations of the study
The HFD we used for the in vivo study contained lard-based fats. It would be important to
identify the key components of the fat or the ratio of each fatty acid in the blood that is
critical for the induction of PPARα phosphorylation and the development of lipotoxic
cardiomyopathy in vivo. In addition, the specific combination of fatty acids that would
faithfully replicate in vivo conditions of HFD consumption for in vitro studies remains to be
established. Although our results suggest that the PPRE/DR1 sequence plays a critical role
in mediating the effect of Ser280 PPARα phosphorylation on the biased control of fatty acid
metabolism, the possibility remains that the effect of Ser280 PPARα phosphorylation is
mediated through either a DNA binding motif-independent mechanism or indirect regulation
of fatty acid metabolism.
In summary, we demonstrate that GSK-3α acts as a central regulator of cardiac fatty acid
metabolism by stimulating a biased PPARα transcriptional response through Ser280
phosphorylation and consequent changes in the structure of PPARα. Activation of GSK-3α under conditions similar to metabolic syndrome contributes to the development of lipotoxic
cardiomyopathy by inducing an imbalance between fatty acid uptake/storage and catabolism
in CMs. We show that a reversal of Ser280 phosphorylation of PPARα normalizes
lipotoxicity and cardiac dysfunction, representing a promising therapeutic intervention to
combat lipotoxic cardiomyopathy in patients with metabolic syndrome.
STAR Methods
• Contact for Reagent and Resource Sharing
Further information and requests for resources and reagents should be directed to and will be
fulfilled by the Lead Contact, Junichi Sadoshima ([email protected]).
Nakamura et al. Page 14
Cell Metab. Author manuscript; available in PMC 2020 May 07.
Author M
anuscriptA
uthor Manuscript
Author M
anuscriptA
uthor Manuscript
• Experimental Model and Subject Details
Mice—GSK-3α heterozygous floxed mice (C57BL/6 background) were a kind gift from Dr.
P.S. Klein (University of Pennsylvania). GSK-3β floxed mice (C57BL/6 background) were a
kind gift from Dr. C.J. Phiel (He et al., 2010). GSK-3α and β knock-in mice were a kind gift
from Dr. D.R. Alessi (University of Dundee). Cardiomyocyte-specific deletion of GSK-3α or GSK-3β was obtained by crossing the mice with α-myosin heavy chain promoter-driven
heterozygous Cre mice (a kind gift from Dr. M.D. Schneider). Cardiomyocyte-specific Tg-
FLAG-PPARα (α-myosin heavy chain promoter) mice were a kind gift from Dr. D. Kelly.
Male C57BL/6J ob/ob mice and male C57BL/6J wild-type mice were purchased from
Jackson Labs at 5–6 weeks of age. For diet-induced obesity, male 5 to 6-week-old animals
were fed a high-fat (60%) diet (Research Diets, D12492). The PPARα ligand, fenofibrate
(Sigma-Aldrich), was provided via ad libitum feeding with a high-fat diet containing 0.2%
(wt/wt) fenofibrate (custom diet purchased from Research Diets) for the indicated periods
(Haemmerle et al., 2011). For cardiac insulin resistance tests, mice were fasted for 4 hours,
followed by intraperitoneal injection of 0.75 U/kg body weight insulin. Fifteen minutes after
insulin injection, the hearts were harvested to evaluate phosphorylation of Akt by
immunoblot. For intraperitoneal glucose tolerance tests in HFD-fed mice, mice were fasted
for six hours and body weight and fasting glucose level from a small tail clip were measured.
Glucose (1 mg/g body weight) was injected intraperitoneally and blood glucose values were
obtained at 15, 30, 45, 60, 90, and 120 mins. Mice were housed in a temperature-controlled
environment within a range of 21–23 °C with 12-hour light/dark cycles and were fed an
indicated diet. We used age-matched male mice in all animal experiments. All protocols
concerning the use of animals were approved by the Institutional Animal Care and Use
Committee at New Jersey Medical School, Rutgers University.
Gene targeting mouse—PPARα genomic DNA was isolated from BAC clone (RP24–
545F24) to construct the PPARα S280A KI targeting vector. PCR-based site-directed
mutagenesis was performed to introduce a single mutation of T to G in codon 280 in exon 8
of PPARα to change codon 280 from Ser to Ala. A pGK neo cassette flanked by two FRT
sites (a kind gift from Dr. Takeda, Osaka University) was inserted into intron 8 for selection
of the targeted allele. Diphtheria Toxin A fragment was used for negative selection. The
DNA sequences used for constructing the targeting vector, including introns 7 and 8 and
exon 8, were confirmed by DNA sequencing. The targeting vectors were linearized with
PmeI and subsequently electroporated into ES cells. G418-resistant ES clones were screened
for homologous recombination by long range PCR using the primers listed in Table S5 with
the Expand Long Template PCR system (Roche #11681842001). Three positive clones were
identified out of 288 clones. Homologous recombinant ES clones were microinjected into
blastocysts from C57BL/6J mice and transferred into pseudo-pregnant recipients to generate
male chimeras. The chimeric male mice resulting from the microinjection were bred with
C57BL/6J female mice to generate germline-transmitted heterozygous S280A KI mice. PCR
analysis was performed on tail DNA from offspring. Sequence analysis was performed on
PCR products to verify the presence of the mutations using standard procedures. The mutant
offspring were backcrossed into the C57BL/6J background.
Nakamura et al. Page 15
Cell Metab. Author manuscript; available in PMC 2020 May 07.
Author M
anuscriptA
uthor Manuscript
Author M
anuscriptA
uthor Manuscript
GSK-3α flox/flox mice were generated in Dr. Peter S. Klein’s laboratory (University of
Pennsylvania, Philadelphia). Briefly, a conventional targeting vector with neomycin
resistance and TK was generated to insert loxP sites on either side of exon 2 in the Gsk3a
gene. The neomycin resistance cassette, inserted downstream of exon 2, was also flanked by
FRT sites. The construct was electroporated into ES cells derived from C57BL/6 mice and
positive and negative selection was used to isolate positive clones, which were then screened
by PCR for the correct insertion and confirmed by Southern blot. Cre-mediated excision
removes exon 2, which encodes an essential portion of the catalytic domain, to generate a
null allele.
Human samples from explanted hearts—The samples from explanted hearts used in
this study were obtained from 14 non-diabetic (mean age 52.0 ± 11.8 years; 13 males) and 7
diabetic (mean age 50.4 ± 11.6 years; 6 males) patients who had received heart transplants at
the Taipei Veterans General Hospital. The study was approved by the Ethics Committee of
Taipei Veterans General Hospital, and all patients or their families expressed their
willingness to participate through an informed consent form. Myocardial samples from near
the mitral annulus were obtained at the time of therapeutic transplantation. Immediately after
tissue procurement, the samples for biochemical studies were stored in liquid nitrogen and
kept at −80°C.
Cell line—H9C2 cells were maintained at 37°C with 5% CO2 in Dulbecco’s modified
Eagle’s medium/Nutrient Mixture F-12 supplemented with 10% fetal bovine serum.
Information on the sex is not available.
Primary Rat Neonatal Cardiomyocytes—Primary cultures of ventricular CMs were
prepared from 1-day-old Crl:(WI)BR-Wistar rats (both sexes) (Harlan Laboratories,
Somerville) and maintained in culture. A cardiomyocyte-rich fraction was obtained by
centrifugation through a discontinuous Percoll gradient. CMs were cultured in complete
medium containing Dulbecco’s modified Eagle’s medium/F-12 supplemented with 5% horse
serum, 4 μg/ml transferrin, 0.7 ng/ml sodium selenite, 2 g/l bovine serum albumin (fraction
V), 3 mM pyruvate, 15 mM Hepes pH 7.1, 100 μM ascorbate, 100 mg/l ampicillin, 5 mg/l
linoleic acid, and 100 μM 5-bromo-2’-deoxyuridine (Sigma). Culture dishes were coated
with 0.3% gelatin or 2% gelatin for immunofluorescence staining on chamber slides.
• Method Details
Antibodies and reagents—The following commercial antibodies were used at the
indicated dilutions: phospho-GSK-3α (Ser21) (36E9) (1:1,000), total GSK-3α (D80E6, for
WB) (1:2,000), total GSK-3α (D80D1, for IF) (1:100), total GSK-3α/β (D75D3) (1:4,000),
phospho-GSK-3α/β (1:2,000), histone H3 (1:5,000), GAPDH (14C10) (1:5,000), GFP
(D5.1, for IF) (1:500), and secondary antibodies (anti-mouse or rabbit IgG) conjugated with
horseradish peroxidase (1:4,000) (Cell Signaling); secondary antibodies (anti-mouse or
rabbit IgG) conjugated with Alexa Fluor 488 or 555 (1:100) (Life Technologies); GFP-
magnetic beads (Fisher/MBL); total PPARα (1:3,000) (Cayman Chemical); RXRα (D-20)
(1:4,000) (Santa Cruz); α-actinin (1:4,000) (sarcomeric) (Sigma-Aldrich). For detection of
phosphorylation of PPARα at Ser280, a polyclonal phosphorylation-specific antibody was
Nakamura et al. Page 16
Cell Metab. Author manuscript; available in PMC 2020 May 07.
Author M
anuscriptA
uthor Manuscript
Author M
anuscriptA
uthor Manuscript

generated by immunizing rabbits with a phospho-peptide corresponding to residues
surrounding Ser280 of PPARα (1:1,000). Antibodies were diluted in either 5% (w/v) BSA
or 5% (w/v) non-fat dry milk in 1xTBS/0.5%Tween 20, depending on the level of
background intensity. The following reagents were used: WY-14643 and fenofibrate (R & D
Systems, Tocris for in vitro experiments); Palmitic acid, Duolink In Situ PLA, and Etomoxir
(Sigma-Aldrich).
Adenovirus constructs—Recombinant adenovirus vectors for overexpression and short
hairpin RNA-mediated gene silencing were constructed, propagated and titered as previously
described (Oka et al., 2011). pBHGloxΔE1,3Cre plasmid was co-transfected with the
pDC316 shuttle vector (Microbix) or pDCSilencer (Microbix) containing YFP-PPARα-WT,
YFP-PPARα-mutants, or GSK-3α targeting sequences into HEK293 cells using
Lipofectamine 2000 (Life Technologies). The cDNA of mouse PPARα was amplified using
pDC316-PPARα (Oka et al., 2011) as a template and ligated into pDC316-YFP-N terminal
vector (Maejima et al., 2013). The shuttle vector for the short hairpin sequence of rat
GSK-3α was generated by insertion of a complementary hairpin sequence of rat GSK-3α (see key resources table) into pDCSilencer (Microbix). The luciferase reporter plasmid
(pPPRE-tk-luc) was a kind gift from Dr. Ronald Evans at the Salk Institute. Mutations were
performed by site directed mutagenesis. Adenovirus vectors harboring LacZ (Ad-LacZ) and
sh-Scramble (Ad-shScr) were used as controls. The total MOI of adenovirus was kept
constant using LacZ or Scramble virus.
Adeno-associated virus—The recombinant adeno-associated virus (AAV) vectors used
to generate AAV-DJ/8-PPARα-WT or S280D were constructed by cloning the cDNA of
PPARα-WT or S280D (mouse) from the pDC316-YFP-PPARα-WT or S280D vector into
the pAAV-MCS expression vector (Cell Biolabs, Inc, #VPK-410) downstream of the CMV
promoter with BamHI and SalI. 293AAVcells (Cell Biolabs, Inc.) were co-transfected with
the recombinant AAV vectors, pAAV-DJ/8 vector, and helper plasmid in a 1:1:1 ratio using
polyethylenimine (PEI) at the AAV core, Department of Cell Biology and Molecular
Medicine, New Jersey Medical School, Rutgers University, Newark, NJ (Grimm et al.,
2008). The recombinant AAV produced was purified by the iodixanol gradient/ultra-
centrifugation method, and the AAV fraction was concentrated using a VIVASPIN 20
concentrator (100 kDa cut-off, Sartorius, Germany). The virus titer was determined using the
Cell Biolabs AAV quantitation kit (Cat. # VPK-145). To administer recombinant AAVs,
doses of 2×10¹¹ vector genome per mouse were injected intravenously via the jugular vein
of C57BL/6J wild-type mice.
Recombinant proteins—The bacterial expression vectors for GST-fused PPARα-full
length and -truncates (T1–5) were generated by insertion of mouse PPARα cDNA amplified
by PCR into the pCold-GST-vector. The BL21 E. coli strain was transformed with pCold-
GST-PPARα-full length or truncates. The E. coli was grown in 3 ml LB medium containing
ampicillin overnight at 37°C, and then transferred to 250 ml LB medium containing
ampicillin. Protein expression was induced by addition of 1 mM isopropylthio-β-
galactoside. After overnight culture at 15°C, the E. coli were lysed in lysis buffer (1% Triton
X-100 and 1 mM DTT in PBS) with sonication. The lysate was incubated with 0.5 ml
Nakamura et al. Page 17
Cell Metab. Author manuscript; available in PMC 2020 May 07.
Author M
anuscriptA
uthor Manuscript
Author M
anuscriptA
uthor Manuscript
Glutathione-sepharose 4B (GE Healthcare) for 1 hour at 4°C. The sepharose was washed 3
times with 5 ml lysis buffer, and then suspended with 1 ml cleavage buffer (20 mM Tris pH
7, 150 mM NaCl, 1 mM DTT).
In vitro kinase assay—Recombinant active GSK-3α was purchased from Millipore.
Recombinant PPARα-LBD (human) was purchased from Cayman Chemical. GST-tagged
full-length PPARα protein was generated using the pCold-GST-vector. Recombinant active
GSK-3α (10 ng) was incubated with recombinant GST-full length-PPARα (1 μg) or
PPARα-LBD (1 μg) in a kinase buffer (50 mM HEPES (pH 7.4), 15 mM MgCl2 and 200 μM
sodium vanadate containing 100 μM ATP in the presence or absence of 10 μCi [γ−32P]ATP
per reaction) at 30°C for 15 minutes. Phosphorylated proteins were separated by SDS-PAGE
and analyzed by autoradiography or immunoblot.
Mass spectrometry—A kinase reaction was performed using recombinant GST-tagged
PPARα and GSK-3α proteins. Phosphorylated proteins were separated by SDS-PAGE and
stained with Coomassie Brilliant Blue. The gel band of interest was excised for in-gel
trypsin digestion. The resulting peptides were subjected to LC-MS/MS analysis on an
Ultimate 3000 (Dionex, Sunnyvale, CA, USA) LC system coupled with an Orbitrap Velos
tandem mass spectrometry instrument (Thermo Fisher Scientific). The MS spectra were
acquired in positive mode with a spray voltage of 2 kV and a capillary temperature of 275ºC.
The Lock Mass feature was used for accurate mass measurement. The automatic gain
control (AGC) target was set to 1.0E+6 for full scan in the Orbitrap mass analyzer and 3.0E
+4 for MS/MS scans in the ion trap mass analyzer. The precursor was selected within a 2
m/z isolation window and fragmented using collision-induced dissociation (CID)
fragmentation. The MS/MS spectra were searched against the Swissprot mouse database
with an MS error tolerance of 10 ppm and an MS/MS error tolerance of 0.5 Da. Methionine
oxidation, cysteine carbamidomethylation (IAM) and serine/threonine phosphorylation were
set as variable modifications. One % false discovery rate (FDR) was used for both protein
and peptide identification.
RNA-Seq library preparation, sequencing and data analysis—Total RNA was
isolated from H9C2 cells transduced with the indicated plasmid using TRIzol (Invitrogen).
Isolated RNA was first checked for integrity on an Agilent Bioanalyzer 2100; samples with
RNA integrity number (RIN) >7.0 were used for subsequent processing. Total RNA was
subjected to two rounds of poly(A) selection using oligo-d(T)25 magnetic beads (New
England Biolabs). A paired-end (strand specific) cDNA library was prepared using the NEB
Next Ultra-directional RNA-Seq protocol. Briefly, poly(A)+ RNA was fragmented by
heating at 94°C for 10 minutes followed by reverse transcription and second strand cDNA
synthesis using the reagents provided in the NEB Next kit. End-repaired cDNA was then
ligated with double stranded DNA adapters, followed by purification of ligated DNA with
AmpureXP beads. cDNA was then amplified by PCR for 15 cycles with a universal forward
primer and a reverse primer with bar code. The sequencing of the cDNA libraries was
performed on the Illumina HiSeq 2500 platform (Illumina, San Diego, CA) using the single-
read 1×50 cycles configuration. The raw reads files have been deposited in the NCBI Gene
Expression Omnibus.
Nakamura et al. Page 18
Cell Metab. Author manuscript; available in PMC 2020 May 07.
Author M
anuscriptA
uthor Manuscript
Author M
anuscriptA
uthor Manuscript
CLC Genomics Workbench version 8.5 (http://www.clcbio.com/products/clc-genomics-
workbench/; Qiagen) was used for RNA-seq analysis. De-multiplexed fastq files from RNA-
Seq libraries were imported into the CLC software. Adaptor sequences and bases with low
quality were trimmed and reads were mapped to a reference genome, Rattus norvegicus (assembly Rnor_6.0). Read mapping was carried out with the RNA-Seq Analysis Tool of
CLC Genomics Workbench. RPKM values were calculated for each gene to quantify
absolute expression. Statistical analysis of differentially expressed genes was carried out
with the Empirical analysis of Digital Gene Expression data tool in CLC Genomic
Workbench. Functional Pathway analysis of PPARα-Ser280 phosphorylation-regulated
genes (SD vs SA) was performed using IPA pathway analysis software (QIAGEN).
Expression patterns of regulated genes were graphically represented in a heat map.
Hierarchical clustering was performed to group genes with similar features in the expression
prolife. The clustering and visualization were carried out using the MultiExperiment Viewer
(MeV).
The following publicly available microarray datasets were used: OB/OB (GSE16790),
DB/DB (GSE36875), and streptozotocin-induced type I diabetic model (GSE5606). Raw
intensity values were normalized using the Robust Multi-array Average (RMA) method on
R. A p value less than 0.05 in the empirical analysis was considered statistically significant.
Normalized expression data were also analyzed with GSEA v2.0.13 software using the JAVA
program (Broad Institute, Cambridge, MA). All gene sets were obtained from the Molecular
Signatures Database v4.0 distributed on the GSEA Web site.
Quantitative RT-PCR—Total RNA was prepared from mouse hearts and CMs using
TRIzol (Invitrogen). cDNA was generated using 300 ng total RNA and SuperScript III
Reverse Transcriptase (ThermoFisher). Using Maxima SYBR Green qPCR master mix
(Fermentas), real-time RT-PCR was performed under the following conditions: 94°C for 10
minutes; 40 cycles of 94°C for 15 seconds, 58°C for 30 seconds, 72°C for 30 seconds; and a
final elongation at 72°C for 15 minutes. Relative mRNA expression was determined by the
ΔΔ-Ct method normalized to the ribosomal RNA (18S) level. Primer sequences are shown in
Table S5.
Metabolomics analysis—Myocardial tissue samples were harvested from heterozygous
PPARα-S280A KI and littermate control mice at the age of 18 to 20 weeks (n=5).
Untargeted screening of the metabolome in ventricular tissue was performed using GC/MS
at the University of Utah Metabolomics Core Facility. The freeze-clamped tissue samples
(~15 mg) were homogenized in the extraction solution (methanol/water (8:1) with amino-
acid standards and D4 succinate) using a ceramic bead tube kit (MO BIO Laboratories, Inc.,
Carlsbad, CA) and Bead Ruptor (Omni International, Kennesaw, GA). After incubation for 2
hours at −20°C followed by centrifugation at 13,000g at 4°C for 10 minutes, the extraction
samples were dried using a Speed-vac (MiVac Duo, Barnstead/Genevac Inc., Gardiner, NY)
overnight and suspended in 40 μl of 40 mg/ml O-methoxylamine hydrochloride (MOX) in
pyridine. GC/MS analysis was performed with a Waters GCT Premier mass spectrometer
fitted with an Agilent 6890 gas chromatograph and a Gerstel MPS2 autosampler. A 30 m
Phenomenex ZB5–5 MSi column with a 5 m long guard column was employed for
Nakamura et al. Page 19
Cell Metab. Author manuscript; available in PMC 2020 May 07.
Author M
anuscriptA
uthor Manuscript
Author M
anuscriptA
uthor Manuscript
chromatographic separation. Data were collected by MassLynx 4.1. Initial analysis of known
metabolites was performed using QuanLynx with data transfer to Excel. Peak picking was
performed using MarkerLynx with data mining performed using SIMCA-P ver. 12.0.1. The
values were normalized by wet tissue weight. Bioinformatic analysis of the metabolomic
data was carried out using Metaboanalyst 3.0 software, including the generation of heat
maps. Differences in the abundance of individual metabolites were determined using a
Student’s t-test (2 tails, unpaired comparison). A value of p<0.05 was considered
statistically significant. Data are given as mean ± s.e.m.
Immunoblotting—CM lysates and heart homogenates were prepared in RIPA buffer
containing protease and phosphatase inhibitors (Sigma-Aldrich). Lysates were centrifuged at
13,200 r.p.m. at 4°C for 15 minutes. Total protein lysates (10–30 μg) were incubated with
SDS sample buffer (final concentration: 100 mM Tris pH 6.8, 2% SDS, 5% glycerol, 2.5%
2-mercaptoethanol, and 0.05% bromophenol blue) at 95°C for 5 minutes. The denatured
protein samples were separated by SDS-PAGE, transferred to polyvinylidene difluoride
membranes by wet electrotransfer, and probed with primary antibodies.
Subcellular fractionation—Cultured neonatal rat CMs were washed with PBS and
collected with ice-cold PBS, followed by centrifugation at 600g for 5 minutes. CMs were
then resuspended in hypotonic lysis buffer (10 mM K-HEPES pH 7.9, 1.5 mM MgCl2, 10
mM KCl, 0.1 mM EGTA, 0.1 mM EDTA, 1% IGEPAL, 1% Phosphatase Inhibitor Cocktail,
and 1% Protease Inhibitor Cocktail) and were incubated for 15 minutes on ice with
intermittent pipetting. Whole-cell lysates were centrifuged at 1200g for 5 minutes. The
supernatant was collected for the cytosolic fraction, and the pellets were resuspended in lysis
buffer (20 mM K-HEPES, 25% Glycerol, 0.45 M NaCl, 1.5 mM MgCl2, 1 mM EGTA, 1
mM EDTA, 1% Phosphatase Inhibitor Cocktail, and 1% Protease Inhibitor Cocktail) and
were incubated for 15 minutes on ice with intermittent pipetting. The total homogenate was
centrifuged at 13,000rpm for 10 minutes to collect the nuclear fraction. The pelleted nuclei
were resuspended in lysis buffer and protein content was determined for all fractions. The
nuclear fraction from mouse hearts was prepared with NE-PER Extraction Reagent (Thermo
Scientific).
Immunoprecipitation—CMs or heart samples were lysed with lysis buffer containing 50
mM Tris-HCl pH 7.4, 150 mM NaCl, 1% Triton-X 100, 1% Sodium Deoxycholate, Protease
Inhibitor Cocktail (Sigma), and Phosphatase Inhibitor Cocktail (Sigma). Primary antibody
was covalently immobilized on protein A/G agarose using the Pierce Crosslink
Immunoprecipitation Kit according to the manufacturer’s instructions (Thermo Scientific).
Samples were incubated with immobilized antibody beads for at least 2 hours at 4°C. After
immunoprecipitation, the samples were washed with TBS five times. They were then eluted
with glycine-HCl (0.1 M, pH 3.5) and the immunoprecipitates were subjected to
immunoblotting using specific primary antibodies and a conformation-specific secondary
antibody that recognizes only native IgG (Cell Signaling).
Immune complex in vitro kinase assay—The nuclear fraction was obtained as
described in the section on subcellular fractionation. GSK-3α was immunoprecipitated as
Nakamura et al. Page 20
Cell Metab. Author manuscript; available in PMC 2020 May 07.
Author M
anuscriptA
uthor Manuscript
Author M
anuscriptA
uthor Manuscript

described in the section on immunoprecipitation. Immunoprecipitated endogenous GSK-3α protein or recombinant GSK-3α protein was incubated with recombinant GST-β-catenin or
GST alone as a control in kinase buffer as described in the section on in vitro kinase assays,
then incubated with 5xSDS sample buffer at 95°C for 5 minutes, followed by SDS-PAGE.
Proteins were detected by immunoblot using pβ-catenin antibody.
In vitro binding assays—Recombinant GST-fused proteins in a slurry of glutathione
sepharose were incubated with CM lysates, recombinant GSK-3α, or recombinant GSK-3β in lysis buffer containing 50 mM Tris-HCl pH 7.4, 150 mM NaCl, 1% Triton-X 100, 1%
Sodium Deoxycholate, Protease Inhibitor Cocktail (Sigma), and Phosphatase Inhibitor
Cocktail (Sigma) with rotation for 1 hour at 4°C, followed by pull-down with glutathione-
sepharose. After washing five times with PBS, proteins were eluted with 5xSDS sample
buffer, followed by SDS-PAGE and immunoblots.
Reporter gene assay—PPRE reporter gene activity in rat neonatal CMs was measured
with a luciferase assay system (Promega). Cardiomyocytes were transfected with 3xPPRE
luciferase reporter plasmids (0.2 μg) overnight (24 well plate) using LipofectAmine 2000
(Invitrogen). The PPRE reporter gene assay was performed after 9 hours of palmitic acid
treatment. CMs were lysed with 50 μl Reporter lysis buffer (24 wells each). The
luminescence reaction was started by adding 5 μl lysate to 50 μl Reaction buffer, and
luminescence was measured for 10 seconds using an OPTOCOMP I luminometer (MGM
Instruments, Inc.). The luminescence was normalized by protein content measured by
protein assay kit (BioRad). H9C2 cells were transfected in bulk with 7 μg of total DNA
consisting of 6.4 μg of 3xPPRE-luciferase reporter and 0.6 μg of PPARα in a pDC316 vector
using FuGene 6 (Roche) at a lipid to DNA ratio of 3:1. Following 18 hours of transfection,
cells were trypsinized and replated into 96 well plates (Perkin Elmer) and incubated for 4
hours at 37°C and 5% CO2. Palmitic acid and PPARα ligands were added and the cells were
further incubated for 9 hours. Luciferase levels were assayed using BriteLite Plus (Perkin
Elmer) and read using a multi-label plate reader (Perkin Elmer).
Chromatin immunoprecipitation (ChIP) assay—CMs were transduced with Ad-YFP-
PPARα-WT or -mutants or Ad-YFP as a control (10 cm dish). Two days after transduction,
CMs were fixed to cross-link protein-DNA complexes for 10 minutes with 1% formaldehyde
in complete medium containing Dulbecco’s modified Eagle’s medium/F-12 supplemented
with 5% horse serum, 4 μg/ml transferrin, 0.7 ng/ml sodium selenite, 2 g/l bovine serum
albumin (fraction V), 3 mM pyruvate, 15 mM Hepes pH 7.1, 100 μM ascorbate, 100 mg/l
ampicillin, 5 mg/l linoleic acid, and 100 μM 5-bromo-2’-deoxyuridine (Sigma) at room
temperature. Cross-linking was stopped by addition of 1 M Glycine to a final concentration
of 125 mM for 5 minutes. CMs were washed twice with ice-cold PBS and the nuclear
fraction was collected as described in the section on subcellular fractionation. The nuclear
fractions were subjected to ultrasonic treatment with a Diagenode Bioruptor to generate 200-
to 1000-bp DNA fragments and were then diluted 10-fold with dilution buffer [16.7 mM
Tris-HCl pH 8.1, 1.2 mM EDTA, 0.01% SDS, 1.1% Triton X-100, protease inhibitor
cocktail]. After the addition of EDTA to a final concentration of 0.1 mM, the digested
sample was centrifuged at 15,000g for 10 min at 4°C and the resulting supernatant was
Nakamura et al. Page 21
Cell Metab. Author manuscript; available in PMC 2020 May 07.
Author M
anuscriptA
uthor Manuscript
Author M
anuscriptA
uthor Manuscript
incubated with rotation at 4°C overnight with anti-GFP-YFP conjugated magnetic beads.
The immunoprecipitated chromatin was washed five times with low salt buffer [20 mM Tris-
HCl, 150 mM NaCl, 2 mM EDTA, 1% Triton X, and 0.1% SDS] and high salt buffer [20
mM Tris-HCl, 500 mM NaCl, 2 mM EDTA, 1% Triton X, and 0.1% SDS], followed by
elution with elution buffer [0.1 M NaHCO3 and 1% SDS]. Protein-DNA cross-links were
reversed by incubation overnight at 65°C with 1% SDS in Tris-EDTA buffer, followed by
incubation at 45°C for 1 hour with proteinase K and RNase A. DNA fragments were purified
with a Qiaquick PCR Purification kit (QIAGEN). The DNA was then used as a template for
RT-PCR analysis. The PCR primer sequences are listed in Table S5.
In vitro oligo pull-down assay—Recombinant Glutathione S-transferase (GST)-fused
PPARα-WT or PPARα-S280A proteins were purified from the BL21 E. coli strain
transformed with pCold-GST backbone plasmids. The recombinant proteins were subjected
to in vitro kinase assays using recombinant GSK-3α protein, followed by purification with
Glutathione-sepharose 4B (GE Healthcare), washing with binding buffer 3 times and
resuspension with 150 μl binding buffer [10 mM Hepes pH 7.9, 2.5 mM MgCl2, 50 mM
KCl, 150 mM NaCl, 5% glycerol, 1 mM DTT, 0.1% IGEPAL CA-630]. The recombinant
proteins were incubated with biotin-labeled double-stranded DNAs with streptavidin-beads
at 4°C for 2 hours. The recovered proteins were washed 3 times and resolved by SDS-PAGE.
The sequences of the double-stranded DNAs are listed in Table 5.
Generation of the PPRE/DR1 sequence logos—We searched the PPRE/DR1
sequences in the promoters of genes upregulated in PPARα-S280D- or-S280A-transduced
H9C2 cells (SD vs SA, fold change > 1.5 using the RNAseq data) and in the promoters of
fatty acid uptake- or oxidation-related genes using the MEME software (Multiple EM for
Motif Elicitation Version 5.0.2, The MEME SUITE). The sequence of the PPRE element
containing direct repeats of the AGGTCA half-site separated by one base pair (canonical
PPRE/DR1) together with the upstream and downstream three base pairs
(nnnAGGTCAnAGGTCAnnn) was used as an input motif for matches to the DR1 sequences
in the promoters with a threshold of p < 1.0E-4. Based on previously published reports, the
following genes were assigned for fatty acid uptake/transport or oxidation-related genes in
the heart: Slc27a1, Lpl, Acsl1, Cd36, Fabp3, and Fabp4 for uptake/transport; Acadvl, Acadm, Acadl, Acads, Acadsb, Hadha, Hadhb, Echs1, and Hadh for oxidation. Using the
identified sequences, we generated the PPRE/DR1 sequence logos with the MEME
software. Finally, we identified rat genes containing each PPRE/DR1 motif in their
promoters with a threshold of p < 1.0E-5 using MEME. The 5000 bp promoter sequences in
the rat genome were obtained using the UCSC Genome Browser (RGSC 6.0/m6). Genes
containing both fatty acid uptake- and oxidation-related motifs were excluded. Genes
containing both PPARα-S280D- and -S280A-related motif were excluded as well. The
remaining genes were plotted in a Venn Diagram using Bioinformatics & Evolutionary
Genomics website.
Echocardiography—Mice were anesthetized using 12 μl/g body weight of 2.5% avertin
(Sigma-Aldrich), and echocardiography was performed using ultrasound (Vivid 7, GE
Healthcare). A 13-MHz linear ultrasound transducer was used. Mice were subjected to 2-
Nakamura et al. Page 22
Cell Metab. Author manuscript; available in PMC 2020 May 07.
Author M
anuscriptA
uthor Manuscript
Author M
anuscriptA
uthor Manuscript
dimension guided M-mode measurements of LV internal diameter to measure systolic
function and wall thickness, and transmitral inflow Doppler echocardiography in apical 4-
chamber view to measure deceleration time of early filling of mitral inflow. Both were taken
from at least three beats and averaged. LV ejection fraction was calculated as follows:
Ejection fraction = [(LVEDD)3 – (LVESD)3]/(LVEDD)3 × 100. For all mouse experiments,
data analysis was conducted in a blinded manner.
Pressure-volume (PV) loop analysis—Mice were anesthetized with pentobarbital (60
mg/kg, intraperitoneal injection) and subjected to PV loop analyses to measure diastolic and
systolic cardiac function. The right common carotid artery was surgically isolated and
clamped proximally and distally. A small incision (5–10 mm) was made on the carotid
artery, and a 1.4-French pressure-conductance catheter (Millar Instruments) was inserted in
the vessel and introduced into the left ventricle. The PV relation and hemodynamics were
continuously recorded. After stabilization, the end-systolic PV relation and its slope and the
end-diastolic PV relation and its slope were obtained by intermittent occlusion of the inferior
vena cava.
Metabolic assay—The oxygen consumption rate (OCR, pmol/min) in cultured CMs was
determined using a Seahorse XF24 or XF96 Extracellular Flux Analyzer (Seahorse
Bioscience) according to the Installation and Operation Manual from Seahorse Bioscience.
CMs were plated at a density of 200,000 cells/well in 24-well Seahorse assay plates or at a
density of 50,000 cells/well in 96-well Seahorse assay plates, followed by transduction with
Ad-PPARα-WT or Ad-PPARα-mutants for 34 hours and additional incubation with 500 μM
BSA-conjugated fatty acids for 14 hours prior to measurement. One hour prior to the
beginning of measurements, the medium was replaced with XF assay medium containing
unbuffered DMEM, 5.5 mM glucose, and 0.5 mM carnitine, and CMs were incubated for 1
hour in a 37°C incubator without CO2. Etomoxir (100 μM), a specific Cpt-1 inhibitor, was
added to assess the degree of FAO (Kim et al., 2013).
Adult CMs isolation and metabolic assay—Adult CMs were isolated as described
previously with a modification (Ackers-Johnson et al., 2016). Briefly, the heart of a male
mouse was perfused with 12 ml EDTA buffer [130 mM NaCl, 5 mM KCl, 0.5 mM
NaH2PO4, 10 mM HEPES, 10 mM Glucose, 10 mM BDM, 10 mM Taurine, 5 mM EDTA]
to stop the beating of the heart. Digestion was achieved using 30 ml perfusion buffer [130
mM NaCl, 5 mM KCl, 0.5 mM NaH2PO4, 10 mM HEPES, 10 mM Glucose, 10 mM BDM,
10 mM Taurine, 1 mM MgCl2] containing Collagenase type II (0.5mg/ml) and Protease XIV
(0.05mg/ml). Cellular dissociation was stopped by addition of 5 ml Perfusion buffer
containing 5% FBS and 500 μM BSA-conjugated fatty acid cocktail (palmitic acid: oleic
acid: linoleic acid = 2:1:1 and BSA: fatty acid = 1:5). CMs and non-CMs were separated by
4 sequential rounds of gravity settling with calcium reintroduction medium containing 500
μM BSA-conjugated fatty acid cocktail. Adult CMs were plated at a density of 200 cells/
well in 96-well Seahorse assay plates with XF assay medium, containing 5.5 mM glucose,
500 μM BSA-conjugated fatty acid cocktail, 10 mM BDM and 0.5 mM carnitine. Adult
CMs were incubated in a 37°C incubator with CO2 for 30 minutes and without CO2 for 30
Nakamura et al. Page 23
Cell Metab. Author manuscript; available in PMC 2020 May 07.
Author M
anuscriptA
uthor Manuscript
Author M
anuscriptA
uthor Manuscript
minutes prior to measurement. The FAO rate was determined by Etomoxir (250 μM)-
inhibitable OCR using a Seahorse XF96 Extracellular Flux Analyzer (Seahorse Bioscience).
Fatty acid oxidation—Fatty acid β-oxidation was measured using heart homogenates as
described previously (Watanabe et al., 2000). The left ventricle (LV) of a fresh heart was
washed with PBS, weighed and homogenized in four volumes of homogenate buffer [0.25 M
Sucrose, 1 mM EDTA] per LV weight (mg). Forty μl of the heart homogenate was dispensed
per tube and centrifuged at 800g for 1.5 minutes and the precipitates were incubated with
200 μl of Reaction buffer [10 mM Hepes pH 7.4, 150 mM KCl, 0.1 mM EDTA, 1 mM
K2HPO4, 10 mM MgCl2, 1 mM Malate, 10 mM Glucose, 1 μCi [9,10-3H] palmitic acid and
50 μM of unlabeled palmitic acid, both bound to BSA at the molecular ratio of 1:3.7 (BSA :
fatty acid)] at 37°C for 10 minutes. The reaction was stopped by the addition of 1 ml
chloroform/methanol (2:1) and the samples were mixed well. The samples were kept at
−20°C for 4 hours and centrifuged at 12,000g at room temperature for 10 minutes. The
supernatants containing 3H2O were mixed with 4 ml scintillation fluid and the radioactivity
was measured with a scintillation counter.
Fatty acid uptake in vitro—Rat neonatal CMs were transduced with adenovirus
harboring PPARα-WT, PPARα-S280A, PPARα-S280D or YFP alone. Two days after
transduction, CMs were incubated in CM culture medium containing 500 μM unlabeled
BSA-conjugated palmitic acid or 500 μM unlabeled BSA-conjugated fatty acid cocktail
(palmitic acid, oleic acid, and linoleic acid (2:1:1 ratio)) with 1 μCi/ml of [9,10-3H(N)]-
palmitic acid alone or 1 μCi/ml of combined [9,10-3H(N)]-palmitic acid and [9,10-3H(N)]-
oleic acid and 1.25% BSA for 10 minutes (Liu et al., 2011). After washing CMs with ice-
cold PBS four times, CMs were harvested with trypsin-EDTA and centrifuged at 800g at
room temperature for 3 minutes. The pellet was resuspended with 1 ml PBS and centrifuged
at 800g at room temperature for 3 minutes again. CMs were lysed with 1 ml of 0.5 M NaOH
and neutralized with 6 M HCl. The radioactivity was measured with a scintillation counter.
Palmitate uptake into the heart in vivo—In vivo palmitic acid uptake was measured as
previously described with modifications (Khan et al., 2013). Palmitic acid [9, 10-3H(N)]- 5
mCi (PerkinElmer, NET043005MC) was complexed with 6% BSA at 37°C. Male GSK-3α S21A KI and control mice were fasted for 2 hours and were intravenously administered the
labeled BSA-conjugated palmitic acid and 400 μM of unlabeled BSA-conjugated palmitic
acid via the femoral vein with ~106 counts and euthanized 5 minutes post-injection. Blood
samples collected 2 minutes after the injection were used for normalization. The heart was
quickly washed with PBS to remove the blood from the ventricles and weighed. The heart
was lysed with 1 ml of 0.5 M NaOH and neutralized with 6 M HCl. Radioactivity was
determined in 20 μl of blood and a whole heart on an LS 6500 multipurpose scintillation
counter (Beckman-Coulter). Palmitic acid uptake into the heart was normalized by the
radioactivity of the blood and the heart weight.
Oil Red O staining—Neonatal CMs were cultured on coverslips and fixed in 4%
paraformaldehyde. The left ventricle of the heart was frozen with O.C.T. compound and
Cryomold Biopsy (Tissue-Tek). The heart tissue was cut into 10 μm thick sections on a glass
Nakamura et al. Page 24
Cell Metab. Author manuscript; available in PMC 2020 May 07.
Author M
anuscriptA
uthor Manuscript
Author M
anuscriptA
uthor Manuscript
slide. Frozen sections were air-dried for 10 minutes at room temperature and fixed with 10%
formalin for 5 minutes. After washing with PBS, the sections were dipped into 60%
isopropyl alcohol three times and then put into Oil Red O working solution [0.5% Oil Red O
(Sigma) dissolved in isopropyl alcohol (W/V)] for 15 minutes. The sections were washed
with 60% isopropyl alcohol three times and then water for 30 minutes. Cover glasses were
mounted with mounting medium. Images were obtained in a blinded manner and analyzed
with ImageJ software (NIH).
Immunohistochemistry—The heart tissue was washed with PBS, fixed in 4%
paraformaldehyde overnight, embedded in paraffin, and sectioned at 10-μm thickness onto a
glass slide. After de-paraffinization, sections were stained with Picric acid sirius red (PASR)
or Periodic acid-Schiff for evaluation of fibrosis or glycogen accumulation, respectively.
Images were obtained in a blinded manner. The cross-sectional area of CMs was measured
after wheat germ agglutinin (WGA) staining using ImageJ software (NIH).
Immunofluorescence staining—Rat neonatal CMs were cultured on coverslips,
transduced with adenoviruses for 2 to 4 days, washed with PBS, and fixed in 4%
paraformaldehyde for 10 minutes. Samples were permeabilized with PBST (0.5% Triton-X
in PBS) for 15 minutes and blocked in 5% BSA, 5% goat serum in PBST for 30 minutes at
37°C. Samples were incubated with specific antibodies at 4°C overnight, washed, and
incubated with secondary antibody conjugated with Alexa Fluor 488, 555, or 594 dye (Life
Technologies). Samples were washed with PBS and mounted on glass slides with mounting
medium containing DAPI to stain nuclei (VECTASHIELD, Vector Laboratories). Cells were
observed under a fluorescence microscope. Images were obtained in an unblinded manner.
Proximity Ligation Assay—The interaction between GSK-3α and PPARα was
examined in situ using Duolink. Rat neonatal CMs were transduced with adenovirus
harboring YFP-PPARα, followed by incubation with 100 μM or 500 μM of BSA-conjugated
palmitic acid in the presence or absence of fenofibrate. After fixation, slides were incubated
for 10 min at 95°C in antigen retrieval buffer (100 mM Tris, 5% urea, pH 9.5). Slides were
then blocked for 4 hours at 4°C with PBS containing 5% normal goat serum. Anti-GSK-3α and anti-GFP-YFP primary antibodies were added (diluted 1:100 in blocking buffer) and
slides were incubated in a humidity chamber overnight at 4°C. Slides were further blocked
at 37°C in Duolink blocking buffer for 1 hour in a humidity chamber. Slides were then
washed in Duolink Wash Buffer A twice at room temperature. PLA PLUS Anti-mouse and
PLA MINUS Anti-rabbit probes were then incubated with slides in a preheated humidity
chamber for 1 hour at 37°C. After washing in Wash Buffer A twice for 5 minutes, slides
were incubated with Duolink Ligation Stock for 30 minutes at 37°C. After that, slides were
washed in Wash Buffer A and incubated with Duolink Polymerase in Duolink Amplification
Stock for 100 minutes at 37°C. After two washes with Wash Buffer B, slides were mounted
with Duolink Mounting Medium with DAPI. Images were obtained in an unblinded manner.
• Quantification and Statistical Analysis
All values for continuous data are expressed as mean ± s.e.m. Statistical analyses were
carried out by 2-tailed unpaired Student t test for 2 groups or 1-way ANOVA followed by
Nakamura et al. Page 25
Cell Metab. Author manuscript; available in PMC 2020 May 07.
Author M
anuscriptA
uthor Manuscript
Author M
anuscriptA
uthor Manuscript
the Newman-Keuls post-hoc analysis for 3 groups or more, assuming independent variables,
normal distribution, and equal variance of samples. Categorical variables were compared
using Fisher’s exact test. A p value of less than 0.05 was considered significant. Statistical
parameters can be found in the figure legends. Statistical analyses were performed using
GraphPad Prism (GraphPad Software).
• Data and Software Availability
The RNA sequencing data on H9C2 cell lines transduced with PPARα mutants have been
deposited in NCBI’s Gene Expression Omnibus and are accessible through GEO Series
accession number GSE112309. The microarray data on the hearts of GSK-3α and GSK-3β knock-in mice have been deposited in NCBI’s Gene Expression Omnibus and are accessible
through GEO Series accession number GSE112160.
Supplementary Material
Refer to Web version on PubMed Central for supplementary material.
Acknowledgments
We thank Dr. Peter S. Klein for providing us with GSK-3α heterozygous floxed mice. We thank Daniela Zablocki for critical reading of the manuscript and Mayumi Nakamura for the graphics. We thank Dr. Richard Kitsis for his help in generating PPARα-S280A KI mice. The authors thank Dr. Shinichi Oka for technical suggestions. This work was supported in part by U.S. Public Health Service grants HL67724, HL91469, HL102738, HL112330 and AG23039 (to J.S.). This work was also supported by the Leducq Foundation Transatlantic Network of Excellence (to J.S.), American Heart Association Founders Affiliate Postdoctoral Fellowship (14POST18870094) and Scientist Development Grant (17SDG33660358) (to M.N.), and DRC at Washington University Grant (No. 5 P30 DK020579) (to J.S.W.). The mass spectrometry data were obtained from an Orbitrap instrument funded in part by an NIH grant (NS046593) for the support of the Rutgers University Neuroproteomics Core Facility.
References
Ackers-Johnson M, Li PY, Holmes AP, O’Brien SM, Pavlovic D, and Foo RS (2016). A Simplified, Langendorff-Free Method for Concomitant Isolation of Viable Cardiac Myocytes and Nonmyocytes From the Adult Mouse Heart. Circulation research 119, 909–920. [PubMed: 27502479]
Azoulay-Alfaguter I, Yaffe Y, Licht-Murava A, Urbanska M, Jaworski J, Pietrokovski S, Hirschberg K, and Eldar-Finkelman H (2011). Distinct molecular regulation of glycogen synthase kinase-3alpha isozyme controlled by its N-terminal region: functional role in calcium/calpain signaling. The Journal of biological chemistry 286, 13470–13480. [PubMed: 21266584]
Banks AS, McAllister FE, Camporez JP, Zushin PJ, Jurczak MJ, Laznik-Bogoslavski D, Shulman GI, Gygi SP, and Spiegelman BM (2015). An ERK/Cdk5 axis controls the diabetogenic actions of PPARgamma. Nature 517, 391–395. [PubMed: 25409143]
Bugger H, and Abel ED (2009). Rodent models of diabetic cardiomyopathy. Disease models & mechanisms 2, 454–466. [PubMed: 19726805]
Choi JH, Banks AS, Estall JL, Kajimura S, Bostrom P, Laznik D, Ruas JL, Chalmers MJ, Kamenecka TM, Bluher M, et al. (2010). Anti-diabetic drugs inhibit obesity-linked phosphorylation of PPARgamma by Cdk5. Nature 466, 451–456. [PubMed: 20651683]
Evans RM, and Mangelsdorf DJ (2014). Nuclear Receptors, RXR, and the Big Bang. Cell 157, 255–266. [PubMed: 24679540]
Finck BN, Bernal-Mizrachi C, Han DH, Coleman T, Sambandam N, LaRiviere LL, Holloszy JO, Semenkovich CF, and Kelly DP (2005). A potential link between muscle peroxisome proliferator-activated receptor-alpha signaling and obesity-related diabetes. Cell metabolism 1, 133–144. [PubMed: 16054054]
Nakamura et al. Page 26
Cell Metab. Author manuscript; available in PMC 2020 May 07.
Author M
anuscriptA
uthor Manuscript
Author M
anuscriptA
uthor Manuscript
Finck BN, Han X, Courtois M, Aimond F, Nerbonne JM, Kovacs A, Gross RW, and Kelly DP (2003). A critical role for PPARalpha-mediated lipotoxicity in the pathogenesis of diabetic cardiomyopathy: modulation by dietary fat content. Proc Natl Acad Sci U S A 100, 1226–1231. [PubMed: 12552126]
Finck BN, Lehman JJ, Leone TC, Welch MJ, Bennett MJ, Kovacs A, Han X, Gross RW, Kozak R, Lopaschuk GD, et al. (2002). The cardiac phenotype induced by PPARalpha overexpression mimics that caused by diabetes mellitus. J Clin Invest 109, 121–130. [PubMed: 11781357]
Goldberg IJ, Trent CM, and Schulze PC (2012). Lipid metabolism and toxicity in the heart. Cell metabolism 15, 805–812. [PubMed: 22682221]
Gosselin D, Link VM, Romanoski CE, Fonseca GJ, Eichenfield DZ, Spann NJ, Stender JD, Chun HB, Garner H, Geissmann F, et al. (2014). Environment drives selection and function of enhancers controlling tissue-specific macrophage identities. Cell 159, 1327–1340. [PubMed: 25480297]
Grimm D, Lee JS, Wang L, Desai T, Akache B, Storm TA, and Kay MA (2008). In vitro and in vivo gene therapy vector evolution via multispecies interbreeding and retargeting of adeno-associated viruses. Journal of virology 82, 5887–5911. [PubMed: 18400866]
Group AS, Ginsberg HN, Elam MB, Lovato LC, Crouse JR 3rd, Leiter LA, Linz P, Friedewald WT, Buse JB, Gerstein HC, et al. (2010). Effects of combination lipid therapy in type 2 diabetes mellitus. The New England journal of medicine 362, 1563–1574. [PubMed: 20228404]
Haemmerle G, Moustafa T, Woelkart G, Buttner S, Schmidt A, van de Weijer T, Hesselink M, Jaeger D, Kienesberger PC, Zierler K, et al. (2011). ATGL-mediated fat catabolism regulates cardiac mitochondrial function via PPAR-alpha and PGC-1. Nat Med 17, 1076–1085. [PubMed: 21857651]
He F, Popkie AP, Xiong W, Li L, Wang Y, Phiel CJ, and Chen Y (2010). Gsk3beta is required in the epithelium for palatal elevation in mice. Developmental dynamics : an official publication of the American Association of Anatomists 239, 3235–3246. [PubMed: 20981831]
Heinz S, Romanoski CE, Benner C, and Glass CK (2015). The selection and function of cell type-specific enhancers. Nature reviews Molecular cell biology 16, 144–154. [PubMed: 25650801]
Hoeflich KP, Luo J, Rubie EA, Tsao MS, Jin O, and Woodgett JR (2000). Requirement for glycogen synthase kinase-3beta in cell survival and NF-kappaB activation. Nature 406, 86–90. [PubMed: 10894547]
Jellusova J, Cato MH, Apgar JR, Ramezani-Rad P, Leung CR, Chen C, Richardson AD, Conner EM, Benschop RJ, Woodgett JR, et al. (2017). Gsk3 is a metabolic checkpoint regulator in B cells. Nature immunology 18, 303–312. [PubMed: 28114292]
Kersten S, Seydoux J, Peters JM, Gonzalez FJ, Desvergne B, and Wahli W (1999). Peroxisome proliferator-activated receptor alpha mediates the adaptive response to fasting. The Journal of clinical investigation 103, 1489–1498. [PubMed: 10359558]
Khan RS, Lin Y, Hu Y, Son NH, Bharadwaj KG, Palacios C, Chokshi A, Ji R, Yu S, Homma S, et al. (2013). Rescue of heart lipoprotein lipase-knockout mice confirms a role for triglyceride in optimal heart metabolism and function. American journal of physiology Endocrinology and metabolism 305, E1339–1347. [PubMed: 24085031]
Kim C, Wong J, Wen J, Wang S, Wang C, Spiering S, Kan NG, Forcales S, Puri PL, Leone TC, et al. (2013). Studying arrhythmogenic right ventricular dysplasia with patient-specific iPSCs. Nature 494, 105–110. [PubMed: 23354045]
Liu L, Yu S, Khan RS, Ables GP, Bharadwaj KG, Hu Y, Huggins LA, Eriksson JW, Buckett LK, Turnbull AV, et al. (2011). DGAT1 deficiency decreases PPAR expression and does not lead to lipotoxicity in cardiac and skeletal muscle. Journal of lipid research 52, 732–744. [PubMed: 21205704]
Lopaschuk GD, Ussher JR, Folmes CD, Jaswal JS, and Stanley WC (2010). Myocardial fatty acid metabolism in health and disease. Physiological reviews 90, 207–258. [PubMed: 20086077]
Maejima Y, Kyoi S, Zhai P, Liu T, Li H, Ivessa A, Sciarretta S, Del Re DP, Zablocki DK, Hsu CP, et al. (2013). Mst1 inhibits autophagy by promoting the interaction between Beclin1 and Bcl-2. Nat Med 19, 1478–1488. [PubMed: 24141421]
Matsuda T, Zhai P, Maejima Y, Hong C, Gao S, Tian B, Goto K, Takagi H, Tamamori-Adachi M, Kitajima S, et al. (2008). Distinct roles of GSK-3alpha and GSK-3beta phosphorylation in the
Nakamura et al. Page 27
Cell Metab. Author manuscript; available in PMC 2020 May 07.
Author M
anuscriptA
uthor Manuscript
Author M
anuscriptA
uthor Manuscript
heart under pressure overload. Proceedings of the National Academy of Sciences of the United States of America 105, 20900–20905. [PubMed: 19106302]
Neubauer S (2007). The failing heart--an engine out of fuel. N Engl J Med 356, 1140–1151. [PubMed: 17360992]
Oka S, Alcendor R, Zhai P, Park JY, Shao D, Cho J, Yamamoto T, Tian B, and Sadoshima J (2011). PPARalpha-Sirt1 complex mediates cardiac hypertrophy and failure through suppression of the ERR transcriptional pathway. Cell metabolism 14, 598–611. [PubMed: 22055503]
Pacher P, Nagayama T, Mukhopadhyay P, Batkai S, and Kass DA (2008). Measurement of cardiac function using pressure-volume conductance catheter technique in mice and rats. Nature protocols 3, 1422–1434. [PubMed: 18772869]
Randle PJ, Garland PB, Hales CN, and Newsholme EA (1963). The glucose fatty-acid cycle. Its role in insulin sensitivity and the metabolic disturbances of diabetes mellitus. Lancet 1, 785–789. [PubMed: 13990765]
Roberts LD, Koulman A, and Griffin JL (2014). Towards metabolic biomarkers of insulin resistance and type 2 diabetes: progress from the metabolome. The lancet Diabetes & endocrinology 2, 65–75. [PubMed: 24622670]
Samuel VT, and Shulman GI (2012). Mechanisms for insulin resistance: common threads and missing links. Cell 148, 852–871. [PubMed: 22385956]
Sarma S, Ardehali H, and Gheorghiade M (2012). Enhancing the metabolic substrate: PPAR-alpha agonists in heart failure. Heart Fail Rev 17, 35–43. [PubMed: 21104312]
Schilling JD, and Mann DL (2012). Diabetic cardiomyopathy: bench to bedside. Heart Fail Clin 8, 619–631. [PubMed: 22999244]
Shulman GI (2014). Ectopic fat in insulin resistance, dyslipidemia, and cardiometabolic disease. The New England journal of medicine 371, 1131–1141. [PubMed: 25229917]
Silverman MG, Ference BA, Im K, Wiviott SD, Giugliano RP, Grundy SM, Braunwald E, and Sabatine MS (2016). Association Between Lowering LDL-C and Cardiovascular Risk Reduction Among Different Therapeutic Interventions: A Systematic Review and Meta-analysis. Jama 316, 1289–1297. [PubMed: 27673306]
Vega RB, and Kelly DP (2017). Cardiac nuclear receptors: architects of mitochondrial structure and function. The Journal of clinical investigation 127, 1155–1164. [PubMed: 28192373]
Watanabe K, Fujii H, Takahashi T, Kodama M, Aizawa Y, Ohta Y, Ono T, Hasegawa G, Naito M, Nakajima T, et al. (2000). Constitutive regulation of cardiac fatty acid metabolism through peroxisome proliferator-activated receptor alpha associated with age-dependent cardiac toxicity. The Journal of biological chemistry 275, 22293–22299. [PubMed: 10801788]
Xu HE, Stanley TB, Montana VG, Lambert MH, Shearer BG, Cobb JE, McKee DD, Galardi CM, Plunket KD, Nolte RT, et al. (2002). Structural basis for antagonist-mediated recruitment of nuclear co-repressors by PPARalpha. Nature 415, 813–817. [PubMed: 11845213]
Zoete V, Grosdidier A, and Michielin O (2007). Peroxisome proliferator-activated receptor structures: ligand specificity, molecular switch and interactions with regulators. Biochimica et biophysica acta 1771, 915–925. [PubMed: 17317294]
Nakamura et al. Page 28
Cell Metab. Author manuscript; available in PMC 2020 May 07.
Author M
anuscriptA
uthor Manuscript
Author M
anuscriptA
uthor Manuscript
Highlights
Fatty acids upregulate GSK-3α, which, in turn, phosphorylates PPARα at Ser280.
Ser280-phosphorylation stimulates biased gene expression favoring fatty acid uptake.
PPARα-Ser280 phosphorylation promotes the development of lipotoxic cardiomyopathy.
Fibrates inhibit Ser280-phosphorylation, thereby reversing cardiac lipotoxicity.
Nakamura et al. Page 29
Cell Metab. Author manuscript; available in PMC 2020 May 07.
Author M
anuscriptA
uthor Manuscript
Author M
anuscriptA
uthor Manuscript
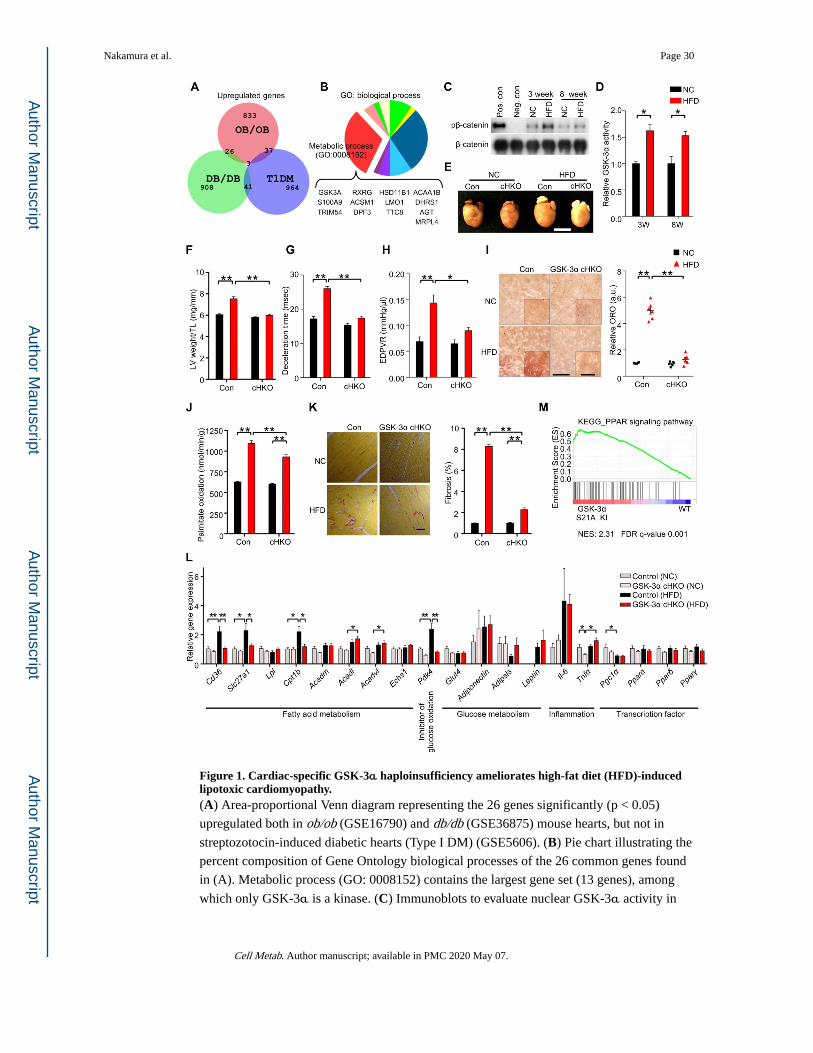
Figure 1. Cardiac-specific GSK-3α haploinsufficiency ameliorates high-fat diet (HFD)-induced lipotoxic cardiomyopathy.(A) Area-proportional Venn diagram representing the 26 genes significantly (p < 0.05)
upregulated both in ob/ob (GSE16790) and db/db (GSE36875) mouse hearts, but not in
streptozotocin-induced diabetic hearts (Type I DM) (GSE5606). (B) Pie chart illustrating the
percent composition of Gene Ontology biological processes of the 26 common genes found
in (A). Metabolic process (GO: 0008152) contains the largest gene set (13 genes), among
which only GSK-3α is a kinase. (C) Immunoblots to evaluate nuclear GSK-3α activity in
Nakamura et al. Page 30
Cell Metab. Author manuscript; available in PMC 2020 May 07.
Author M
anuscriptA
uthor Manuscript
Author M
anuscriptA
uthor Manuscript

the hearts of wild-type (WT) mice fed a HFD or normal chow (NC) for the indicated
periods. GSK-3α was immunoprecipitated from the nuclear fraction of heart lysates,
followed by in vitro kinase assays with recombinant β-catenin. Recombinant GSK-3α protein was used as a positive control and immunoprecipitation with IgG was used as a
negative control. (D) Quantification of the nuclear GSK-3α activity in (C) (n = 3). (E to L)
GSK-3α cardiac-specific heterozygous knockout (GSK-3α cHKO) mice and heterozygous
floxed (control) mice were fed a HFD or NC for 14 weeks. (E) Photograph of the hearts of
control and GSK-3α cHKO mice fed a HFD or NC. (F) Left ventricular (LV) weight
normalized by tibia length, a marker of cardiac hypertrophy (n = 8 (NC) and 22–24 (HFD)).
(G and H) Diastolic function, as indicated by deceleration time (n = 8–15) (G), and the slope
of the end-diastolic pressure-volume (PV) relation (EDPVR) (n = 5 (NC) and 9 (HFD)) (H).
(I) Lipid accumulation in the hearts (Oil Red O staining, left). Scale bar, 100 μm. Inset scale
bar, 20 μm. Quantification of myocardial lipid accumulation (right) (n = 6). (J) Palmitate
oxidation in the hearts (n = 8–9 (NC) and 17 (HFD)). (K) Picric acid sirius red (PASR)
staining, indicating cardiac fibrosis (left). Scale bar, 100 μm. Percentage of PASR positive
areas (right) (n = 4). (L) mRNA expression related to cardiac metabolism, inflammation, and
transcription factors in the hearts (n = 6). (M) Gene set enrichment analysis plot of Kyoto
encyclopedia of genes and genomes (KEGG). PPAR signaling signatures in GSK-3α S21A
knock-in (KI) and WT mice fed NC. NES denotes normalized enrichment score. FDR
denotes false discovery rate. Error bars indicate s.e.m. * p<0.05, ** p<0.001. See also
Figures S1 and S2 and Table S1.
Nakamura et al. Page 31
Cell Metab. Author manuscript; available in PMC 2020 May 07.
Author M
anuscriptA
uthor Manuscript
Author M
anuscriptA
uthor Manuscript

Figure 2. GSK-3α physically interacts with and phosphorylates PPARα at Ser280 in cardiomyocytes (CMs) and in the heart.(A and B) Immunoprecipitation assays to test the interaction between endogenous GSK-3α and exogenously expressed PPARα. YFP-tagged PPARα or FLAG-tagged PPARα was
overexpressed in CMs using adenovirus (A) or in transgenic mouse hearts under the control
of the αMHC-promoter (B), respectively. (C) Co-immunoprecipitation assays testing the
interaction between endogenous GSK-3α and endogenous PPARα in CMs. (D) In vitro binding assays testing the direct interaction between recombinant (r) GSK-3α and rPPARα.
(E to G) Immunoprecipitation assays to identify the amino acids in PPARα responsible for
the interaction with endogenous GSK-3α. (E) Schematic representation of rGST-fused
PPARα fragments. (F) Schema of the immunoprecipitation assays. rGST-fused-PPARα-full
Nakamura et al. Page 32
Cell Metab. Author manuscript; available in PMC 2020 May 07.
Author M
anuscriptA
uthor Manuscript
Author M
anuscriptA
uthor Manuscript
length (FL) or truncated PPARα (T1 to 5) was incubated with lysates extracted from
cultured CMs, followed by pull-down with glutathione-sepharose and immunoblotting with
anti-GSK-3α antibody. (G) Coomassie Brilliant Blue staining of rGST-PPARα-FL or
truncated rGST-PPARα (T1 to T5) (left). Immunoblots testing the binding of endogenous
GSK-3α to rGST-PPARα-FL or T1 to T5 (right). (H) Mass spectrometry analysis of the
rGST-PPARα protein phosphorylated by GSK-3α in a kinase reaction. The MS/MS
spectrum of the PPARα residue corresponding to Ser280 was increased at 80 Da, indicating
phosphorylation. (I) Immunoblots showing Ser280 phosphorylation of endogenous PPARα in the hearts of WT mice fed a high-fat diet (HFD) or normal chow (NC) for 3 weeks. α-
sarcomeric actinin was used as a loading control. (J) Immunoblots showing pPPARα (S280)
in the hearts of control or GSK-3α cHKO mice fed a HFD for the indicated period. See also
Figure S3.
Nakamura et al. Page 33
Cell Metab. Author manuscript; available in PMC 2020 May 07.
Author M
anuscriptA
uthor Manuscript
Author M
anuscriptA
uthor Manuscript

Figure 3. Ser280 phosphorylation stimulates a subset of PPARα targets and promotes fatty acid uptake in cardiomyocytes.(A) Immunoblots showing subcellular localization and expression of p-PPARα (Ser280) in
cultured cardiomyocytes (CMs) treated with BSA-palmitic acid (PA) (0–500 μM) for 9
hours. (B) Immunoblots examining the involvement of GSK-3α in the BSA-PA-induced
increase in PPARα phosphorylation at Ser280 in CMs. CMs transduced with adenovirus
harboring shRNA-GSK-3α or scramble were treated with the indicated concentrations of
PA, followed by nuclear extraction and immunoblotting. (C) Immunoblots showing the
Nakamura et al. Page 34
Cell Metab. Author manuscript; available in PMC 2020 May 07.
Author M
anuscriptA
uthor Manuscript
Author M
anuscriptA
uthor Manuscript
expression of p-PPARα (Ser280) in the nucleus of CMs treated with BSA-fatty acid cocktail
for 9 hours. (D) Clustergram heat map of RNA-sequencing data. H9C2 cells were
transduced with PPARα-wild type (WT), -S280A (SA) or -S280D (SD) mutant, or YFP
alone as a control. Gene sets having 1) a fold difference of 1.5 or more between SA and SD
and 2) a WT expression level located between SD and SA are shown in the heat map. (E)
Gene set enrichment analysis plots of PPARα-SD (vs WT) showing upregulated signatures
related to energy metabolism. Gene expression was determined by RNA-seq data. (F) qRT-
PCR validation of expression of genes related to lipid metabolism and oxidative
phosphorylation in CMs transduced with adenovirus harboring a YFP-PPARα-S280A or -
S280D mutant or YFP alone as a control (n = 8–10). (G) Fatty acid uptake into CMs
transduced with the indicated adenovirus. 3H-palmitate (left) and combined 3H-palmitate
and 3H-oleate (right) incorporation into CMs was measured by scintillation counting (n = 4–
5). (H) Relative oxygen consumption rate (OCR) of CMs transduced with the indicated
adenovirus was measured in a 24-well Seahorse experiment in the presence of 500 μM of
BSA-PA. Mitochondrial fatty acid oxidation (FAO) was evaluated by etomoxir-inhibitable
OCR. Histograms show FAO rate (the ratio of FAO versus total OCR) (n = 5). (I) FAO rate
in CMs transduced with the indicated adenovirus, measured in a 96-well Seahorse
experiment in the presence of 500 μM of BSA-fatty acid cocktail (n = 8). (J and K) Oil Red
O staining of CMs transduced with the indicated adenovirus in the presence or absence of
BSA-PA (500 μM) (n = 5) (J) or in the presence of BSA-fatty acid cocktail (500 μM) (n = 6)
(K). BSA alone was used as a control (PA 0 μM). Scale bars, 100 μm (upper panel) and 20
μm (lower panel). Error bars indicate s.e.m. * p < 0.05, ** p < 0.001. See also Figure S4 and
Table S2.
Nakamura et al. Page 35
Cell Metab. Author manuscript; available in PMC 2020 May 07.
Author M
anuscriptA
uthor Manuscript
Author M
anuscriptA
uthor Manuscript

Figure 4. PPARα-Ser280 phosphorylation enhances both interaction with RXRα and PPRE binding.(A) Representative immunoblots showing the interaction between YFP-PPARα-wild type
(WT), -S280D (SD) or -S280A (SA) mutant and RXRα in cardiomyocytes (CMs) in vitro.
YFP alone was used as a control. (B) PPRE-luciferase reporter assay using a series of
alanine mutations to evaluate the effect of the indicated basic residues on the activity of
PPARα-S280D (n = 12). ## p<0.001 compared to PPARα-S280D. (C) Chromatin
immunoprecipitation (ChIP) assays using CMs transduced with adenovirus (Ad)-YFP-
PPARα-WT, -SD, -SA, or YFP alone as a control. DNA was amplified by PCR with specific
primers flanking the promoter of the indicated genes containing the PPARα-binding motif.
PCR using input DNA as template served as an internal control. The data shown are
representative of three independent experiments. (D) ChIP assays using specific primers
flanking the promoter of the indicated genes containing the PPARα-binding motif. The data
shown are representative of three independent experiments. (E) Double-stranded oligo pull-
down assays, using biotinylated oligos containing the specific PPRE sequences in the
indicated gene promoters. Recombinant GST-PPARα-WT or -SA was subjected to in vitro kinase assays using recombinant GSK-3α prior to the oligo pull-down assays. An oligo
containing a PPRE with mutations in four base pairs was used as a negative control. (F)
Venn diagram showing the number of genes in the rat genome containing the specific
Nakamura et al. Page 36
Cell Metab. Author manuscript; available in PMC 2020 May 07.
Author M
anuscriptA
uthor Manuscript
Author M
anuscriptA
uthor Manuscript
PPRE/DR1 motif (shown in Figure S5F) in their promoters. The numbers of overlapping
genes in the Venn diagram (red circle) were significantly different (p=0.0002, Fisher’s exact
test). See also Figure S5.
Nakamura et al. Page 37
Cell Metab. Author manuscript; available in PMC 2020 May 07.
Author M
anuscriptA
uthor Manuscript
Author M
anuscriptA
uthor Manuscript
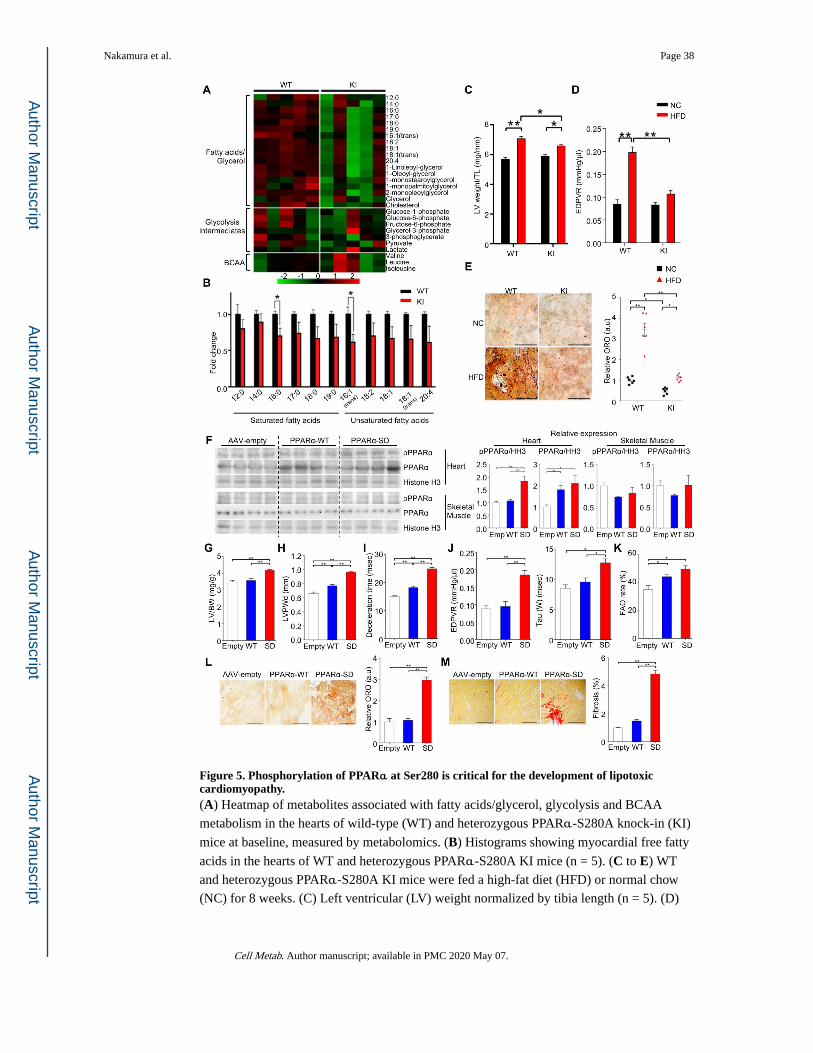
Figure 5. Phosphorylation of PPARα at Ser280 is critical for the development of lipotoxic cardiomyopathy.(A) Heatmap of metabolites associated with fatty acids/glycerol, glycolysis and BCAA
metabolism in the hearts of wild-type (WT) and heterozygous PPARα-S280A knock-in (KI)
mice at baseline, measured by metabolomics. (B) Histograms showing myocardial free fatty
acids in the hearts of WT and heterozygous PPARα-S280A KI mice (n = 5). (C to E) WT
and heterozygous PPARα-S280A KI mice were fed a high-fat diet (HFD) or normal chow
(NC) for 8 weeks. (C) Left ventricular (LV) weight normalized by tibia length (n = 5). (D)
Nakamura et al. Page 38
Cell Metab. Author manuscript; available in PMC 2020 May 07.
Author M
anuscriptA
uthor Manuscript
Author M
anuscriptA
uthor Manuscript
The slope of the end-diastolic pressure-volume (PV) relation (EDPVR), a marker of
diastolic function (n = 5–8). (E) Oil Red O staining of the heart sections (left). Scale bar, 50
μm. Quantification of myocardial lipid accumulation (right) (n = 6). (F to M) Either
PPARα-WT or PPARα-S280D (SD) mutant was expressed in the hearts of WT mice
(C57BL/6J background) fed NC for 8 weeks via adeno-associated virus (AAV)-mediated
gene delivery. AAV-empty injection (Emp or Empty) was performed as a control. (F)
Representative immunoblots showing the expressions of p-PPARα (Ser280), PPARα-
S280D and total PPARα in the heart and skeletal muscle. Histogram indicates the expression
levels relative to Histone H3 (n = 8). (G) LV weight normalized by tibia length (n = 5–7).
(H) LV posterior wall thickness on diastole (LVPWd), a marker of hypertrophy (n = 5–6). (I)
Deceleration time, a marker of diastolic function (n = 5–6). (J) The slopes of EDPVR (left)
and Tau (right), both markers of diastolic function (n = 4–6). (K) Fatty acid oxidation (FAO)
rate in CMs isolated from the hearts of mice transduced with the indicated AAV (n = 5). (L)
Oil Red O staining of the heart sections (left). Scale bars, 50 μm. Quantification of
myocardial lipid accumulation (right) (n = 4–6). (M) Picric acid sirius red (PASR) staining
indicating cardiac fibrosis in the heart sections (left) and the percentage of PASR positive
areas (right). Scale bars, 200 μm (n = 4–7). Error bars indicate s.e.m. * p<0.05, ** p<0.001.
See also Figure S6 and Table S3.
Nakamura et al. Page 39
Cell Metab. Author manuscript; available in PMC 2020 May 07.
Author M
anuscriptA
uthor Manuscript
Author M
anuscriptA
uthor Manuscript
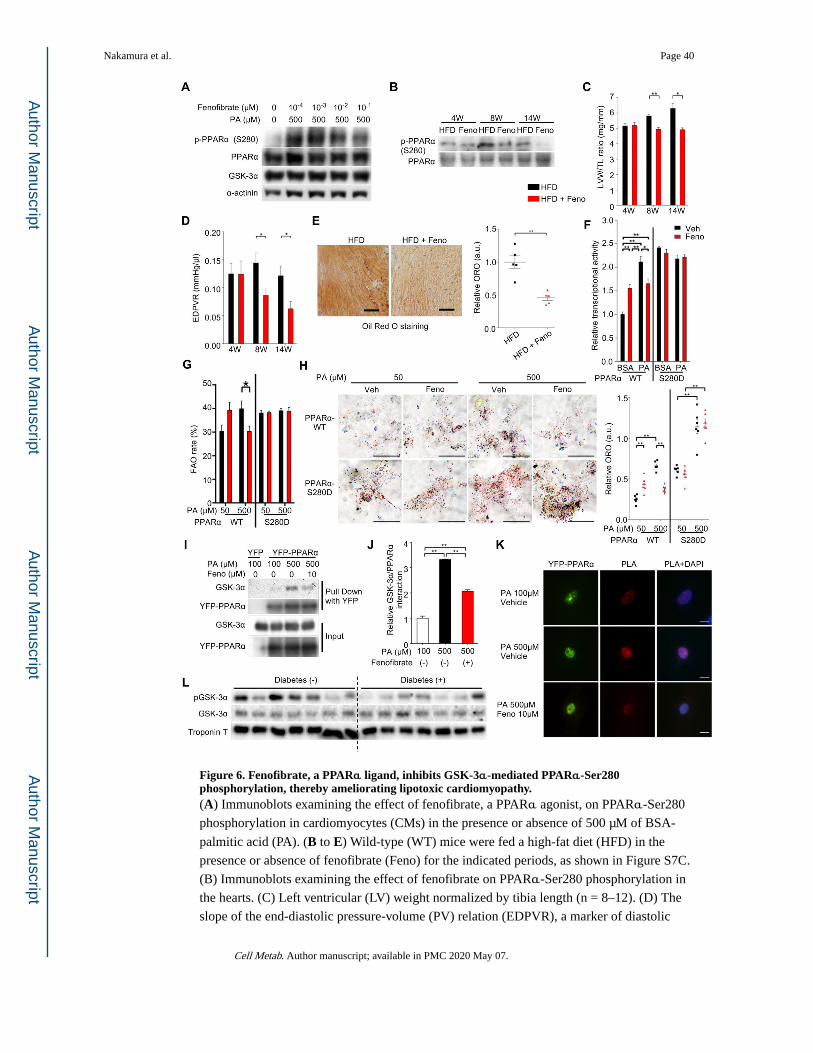
Figure 6. Fenofibrate, a PPARα ligand, inhibits GSK-3α-mediated PPARα-Ser280 phosphorylation, thereby ameliorating lipotoxic cardiomyopathy.(A) Immunoblots examining the effect of fenofibrate, a PPARα agonist, on PPARα-Ser280
phosphorylation in cardiomyocytes (CMs) in the presence or absence of 500 μM of BSA-
palmitic acid (PA). (B to E) Wild-type (WT) mice were fed a high-fat diet (HFD) in the
presence or absence of fenofibrate (Feno) for the indicated periods, as shown in Figure S7C.
(B) Immunoblots examining the effect of fenofibrate on PPARα-Ser280 phosphorylation in
the hearts. (C) Left ventricular (LV) weight normalized by tibia length (n = 8–12). (D) The
slope of the end-diastolic pressure-volume (PV) relation (EDPVR), a marker of diastolic
Nakamura et al. Page 40
Cell Metab. Author manuscript; available in PMC 2020 May 07.
Author M
anuscriptA
uthor Manuscript
Author M
anuscriptA
uthor Manuscript

function (n = 5–11). (E) Oil Red O staining of heart sections after 14 weeks of HFD in the
presence or absence of fenofibrate (left). Scale bar, 100 μm. Quantification of myocardial
lipid accumulation (right) (n = 5). (F) The differential effect of fenofibrate on PPRE-
luciferase reporter activity in H9C2 cells transduced with PPARα-WT or PPARα-S280D
mutant in the presence of a high concentration of fatty acid (500 μM of PA) or BSA control.
YFP alone was used for background extraction (n = 6). (G) Fatty acid oxidation (FAO) rate
in CMs in the presence of 50 μM or 500 μM of PA. Total oxygen consumption rate (OCR) in
CMs transduced with the indicated adenoviruses was measured by 96-well Seahorse
experiment and mitochondrial FAO was evaluated by etomoxir-inhibitable OCR (n = 18–23
(WT) and 6–7 (S280D)). (H) Oil Red O staining of rat neonatal CMs transduced with the
indicated adenovirus in the presence or absence of fenofibrate with 50 μM or 500 μM of
BSA-PA (left). Scale bar, 50 μm. Quantification of myocardial lipid accumulation (right) (n
= 6). (I and J) Immunoprecipitation assays showing the interaction between endogenous
GSK-3α and YFP-PPARα or YFP alone as a control in CMs treated with 100 μM or 500
μM of BSA-PA in the presence or absence of 10 μM of fenofibrate (I) and quantification of
the data (n = 4) (J). (K) Proximity Ligation Assay (PLA) showing the in situ interaction
between endogenous GSK-3α and YFP-PPARα in CMs treated with 100 μM or 500 μM of
PA in the presence or absence of 10 μM of fenofibrate. PLA was performed using anti-
GSK-3α and anti-GFP-YFP antibodies. Red color indicates localization in close proximity.
Scale bar, 10 μm. (L) Immunoblots examining GSK-3α activity in failing human hearts in
the presence (n = 7) or absence (n = 14) of diabetes. See also Figure S7 and Table S4.
Nakamura et al. Page 41
Cell Metab. Author manuscript; available in PMC 2020 May 07.
Author M
anuscriptA
uthor Manuscript
Author M
anuscriptA
uthor Manuscript
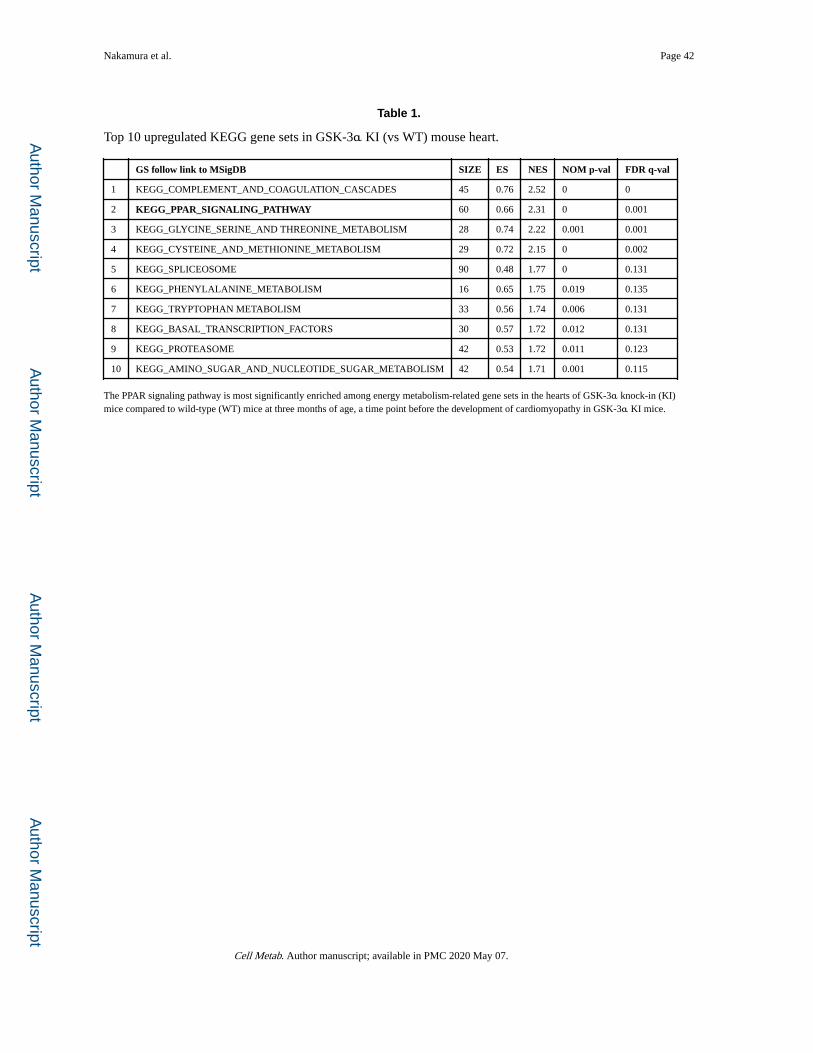
Author M
anuscriptA
uthor Manuscript
Author M
anuscriptA
uthor Manuscript
Nakamura et al. Page 42
Table 1.
Top 10 upregulated KEGG gene sets in GSK-3α KI (vs WT) mouse heart.
GS follow link to MSigDB SIZE ES NES NOM p-val FDR q-val
1 KEGG_COMPLEMENT_AND_COAGULATION_CASCADES 45 0.76 2.52 0 0
2 KEGG_PPAR_SIGNALING_PATHWAY 60 0.66 2.31 0 0.001
3 KEGG_GLYCINE_SERINE_AND THREONINE_METABOLISM 28 0.74 2.22 0.001 0.001
4 KEGG_CYSTEINE_AND_METHIONINE_METABOLISM 29 0.72 2.15 0 0.002
5 KEGG_SPLICEOSOME 90 0.48 1.77 0 0.131
6 KEGG_PHENYLALANINE_METABOLISM 16 0.65 1.75 0.019 0.135
7 KEGG_TRYPTOPHAN METABOLISM 33 0.56 1.74 0.006 0.131
8 KEGG_BASAL_TRANSCRIPTION_FACTORS 30 0.57 1.72 0.012 0.131
9 KEGG_PROTEASOME 42 0.53 1.72 0.011 0.123
10 KEGG_AMINO_SUGAR_AND_NUCLEOTIDE_SUGAR_METABOLISM 42 0.54 1.71 0.001 0.115
The PPAR signaling pathway is most significantly enriched among energy metabolism-related gene sets in the hearts of GSK-3α knock-in (KI) mice compared to wild-type (WT) mice at three months of age, a time point before the development of cardiomyopathy in GSK-3α KI mice.
Cell Metab. Author manuscript; available in PMC 2020 May 07.
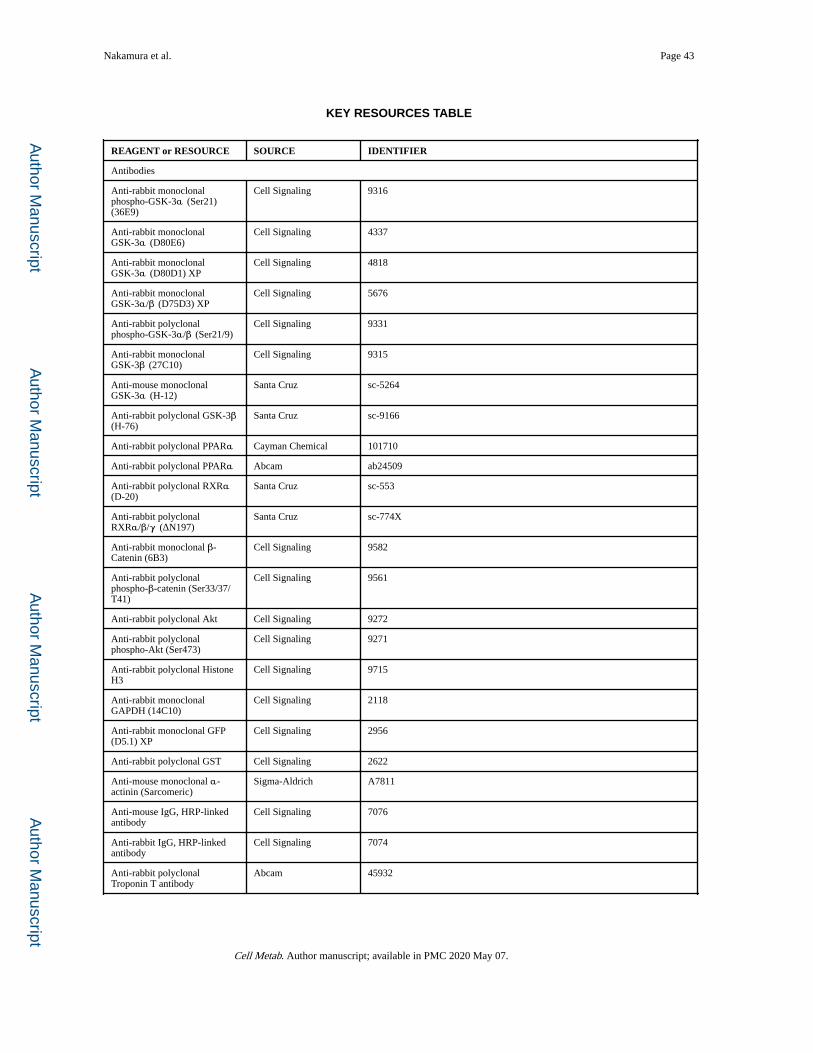
Author M
anuscriptA
uthor Manuscript
Author M
anuscriptA
uthor Manuscript
Nakamura et al. Page 43
KEY RESOURCES TABLE
REAGENT or RESOURCE SOURCE IDENTIFIER
Antibodies
Anti-rabbit monoclonal phospho-GSK-3α (Ser21) (36E9)
Cell Signaling 9316
Anti-rabbit monoclonal GSK-3α (D80E6)
Cell Signaling 4337
Anti-rabbit monoclonal GSK-3α (D80D1) XP
Cell Signaling 4818
Anti-rabbit monoclonal GSK-3α/β (D75D3) XP
Cell Signaling 5676
Anti-rabbit polyclonal phospho-GSK-3α/β (Ser21/9)
Cell Signaling 9331
Anti-rabbit monoclonal GSK-3β (27C10)
Cell Signaling 9315
Anti-mouse monoclonal GSK-3α (H-12)
Santa Cruz sc-5264
Anti-rabbit polyclonal GSK-3β (H-76)
Santa Cruz sc-9166
Anti-rabbit polyclonal PPARα Cayman Chemical 101710
Anti-rabbit polyclonal PPARα Abcam ab24509
Anti-rabbit polyclonal RXRα (D-20)
Santa Cruz sc-553
Anti-rabbit polyclonal RXRα/β/γ (ΔN197)
Santa Cruz sc-774X
Anti-rabbit monoclonal β-Catenin (6B3)
Cell Signaling 9582
Anti-rabbit polyclonal phospho-β-catenin (Ser33/37/T41)
Cell Signaling 9561
Anti-rabbit polyclonal Akt Cell Signaling 9272
Anti-rabbit polyclonal phospho-Akt (Ser473)
Cell Signaling 9271
Anti-rabbit polyclonal Histone H3
Cell Signaling 9715
Anti-rabbit monoclonal GAPDH (14C10)
Cell Signaling 2118
Anti-rabbit monoclonal GFP (D5.1) XP
Cell Signaling 2956
Anti-rabbit polyclonal GST Cell Signaling 2622
Anti-mouse monoclonal α-actinin (Sarcomeric)
Sigma-Aldrich A7811
Anti-mouse IgG, HRP-linked antibody
Cell Signaling 7076
Anti-rabbit IgG, HRP-linked antibody
Cell Signaling 7074
Anti-rabbit polyclonal Troponin T antibody
Abcam 45932
Cell Metab. Author manuscript; available in PMC 2020 May 07.
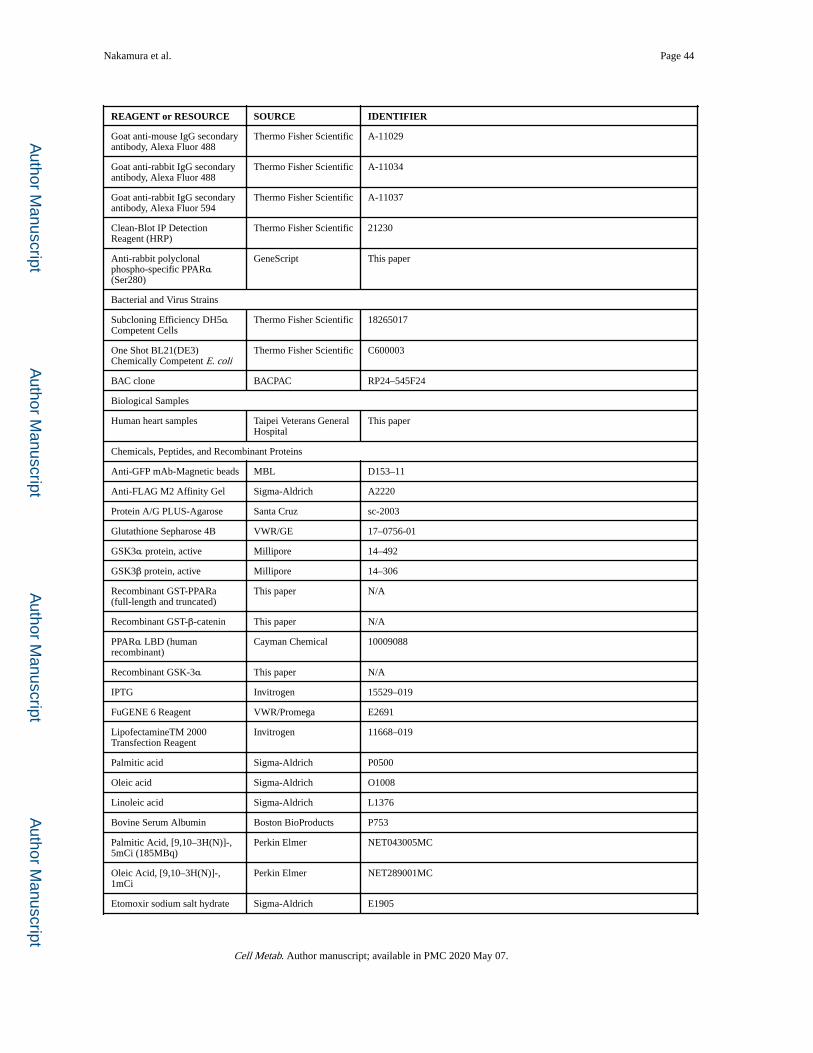
Author M
anuscriptA
uthor Manuscript
Author M
anuscriptA
uthor Manuscript
Nakamura et al. Page 44
REAGENT or RESOURCE SOURCE IDENTIFIER
Goat anti-mouse IgG secondary antibody, Alexa Fluor 488
Thermo Fisher Scientific A-11029
Goat anti-rabbit IgG secondary antibody, Alexa Fluor 488
Thermo Fisher Scientific A-11034
Goat anti-rabbit IgG secondary antibody, Alexa Fluor 594
Thermo Fisher Scientific A-11037
Clean-Blot IP Detection Reagent (HRP)
Thermo Fisher Scientific 21230
Anti-rabbit polyclonal phospho-specific PPARα (Ser280)
GeneScript This paper
Bacterial and Virus Strains
Subcloning Efficiency DH5α Competent Cells
Thermo Fisher Scientific 18265017
One Shot BL21(DE3) Chemically Competent E. coli
Thermo Fisher Scientific C600003
BAC clone BACPAC RP24–545F24
Biological Samples
Human heart samples Taipei Veterans General Hospital
This paper
Chemicals, Peptides, and Recombinant Proteins
Anti-GFP mAb-Magnetic beads MBL D153–11
Anti-FLAG M2 Affinity Gel Sigma-Aldrich A2220
Protein A/G PLUS-Agarose Santa Cruz sc-2003
Glutathione Sepharose 4B VWR/GE 17–0756-01
GSK3α protein, active Millipore 14–492
GSK3β protein, active Millipore 14–306
Recombinant GST-PPARa (full-length and truncated)
This paper N/A
Recombinant GST-β-catenin This paper N/A
PPARα LBD (human recombinant)
Cayman Chemical 10009088
Recombinant GSK-3α This paper N/A
IPTG Invitrogen 15529–019
FuGENE 6 Reagent VWR/Promega E2691
LipofectamineTM 2000 Transfection Reagent
Invitrogen 11668–019
Palmitic acid Sigma-Aldrich P0500
Oleic acid Sigma-Aldrich O1008
Linoleic acid Sigma-Aldrich L1376
Bovine Serum Albumin Boston BioProducts P753
Palmitic Acid, [9,10–3H(N)]-, 5mCi (185MBq)
Perkin Elmer NET043005MC
Oleic Acid, [9,10–3H(N)]-, 1mCi
Perkin Elmer NET289001MC
Etomoxir sodium salt hydrate Sigma-Aldrich E1905
Cell Metab. Author manuscript; available in PMC 2020 May 07.
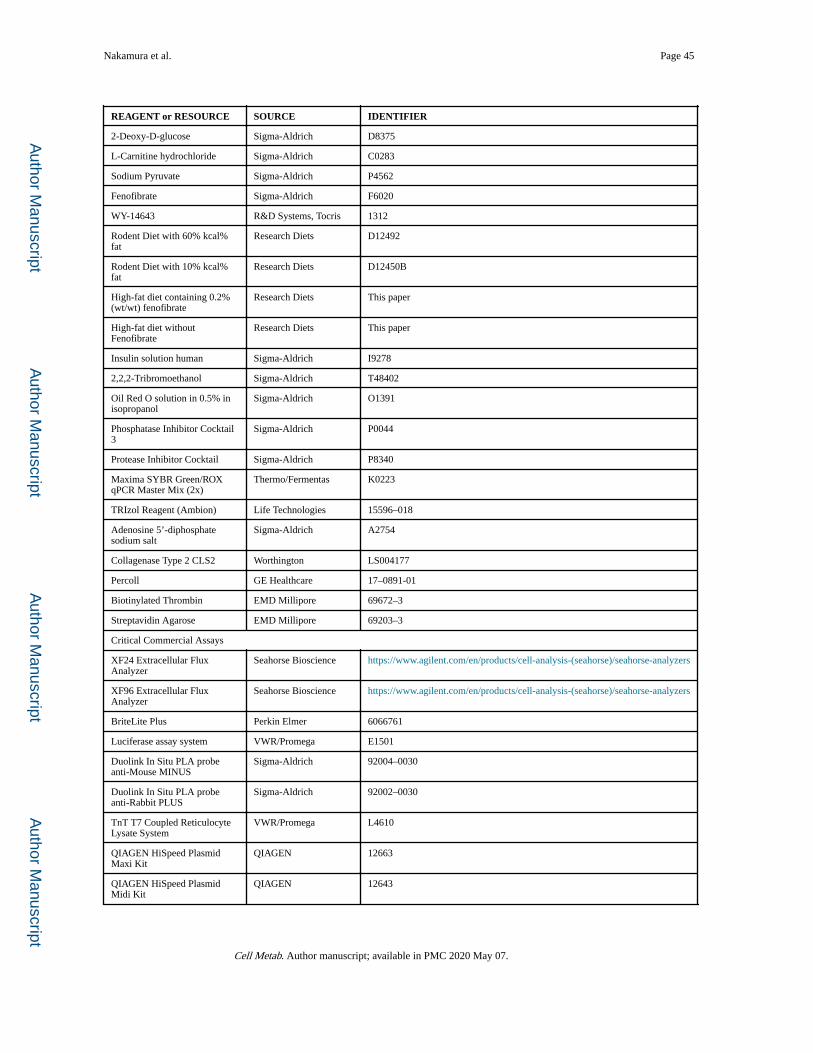
Author M
anuscriptA
uthor Manuscript
Author M
anuscriptA
uthor Manuscript
Nakamura et al. Page 45
REAGENT or RESOURCE SOURCE IDENTIFIER
2-Deoxy-D-glucose Sigma-Aldrich D8375
L-Carnitine hydrochloride Sigma-Aldrich C0283
Sodium Pyruvate Sigma-Aldrich P4562
Fenofibrate Sigma-Aldrich F6020
WY-14643 R&D Systems, Tocris 1312
Rodent Diet with 60% kcal% fat
Research Diets D12492
Rodent Diet with 10% kcal% fat
Research Diets D12450B
High-fat diet containing 0.2% (wt/wt) fenofibrate
Research Diets This paper
High-fat diet without Fenofibrate
Research Diets This paper
Insulin solution human Sigma-Aldrich I9278
2,2,2-Tribromoethanol Sigma-Aldrich T48402
Oil Red O solution in 0.5% in isopropanol
Sigma-Aldrich O1391
Phosphatase Inhibitor Cocktail 3
Sigma-Aldrich P0044
Protease Inhibitor Cocktail Sigma-Aldrich P8340
Maxima SYBR Green/ROX qPCR Master Mix (2x)
Thermo/Fermentas K0223
TRIzol Reagent (Ambion) Life Technologies 15596–018
Adenosine 5’-diphosphate sodium salt
Sigma-Aldrich A2754
Collagenase Type 2 CLS2 Worthington LS004177
Percoll GE Healthcare 17–0891-01
Biotinylated Thrombin EMD Millipore 69672–3
Streptavidin Agarose EMD Millipore 69203–3
Critical Commercial Assays
XF24 Extracellular Flux Analyzer
Seahorse Bioscience https://www.agilent.com/en/products/cell-analysis-(seahorse)/seahorse-analyzers
XF96 Extracellular Flux Analyzer
Seahorse Bioscience https://www.agilent.com/en/products/cell-analysis-(seahorse)/seahorse-analyzers
BriteLite Plus Perkin Elmer 6066761
Luciferase assay system VWR/Promega E1501
Duolink In Situ PLA probe anti-Mouse MINUS
Sigma-Aldrich 92004–0030
Duolink In Situ PLA probe anti-Rabbit PLUS
Sigma-Aldrich 92002–0030
TnT T7 Coupled Reticulocyte Lysate System
VWR/Promega L4610
QIAGEN HiSpeed Plasmid Maxi Kit
QIAGEN 12663
QIAGEN HiSpeed Plasmid Midi Kit
QIAGEN 12643
Cell Metab. Author manuscript; available in PMC 2020 May 07.
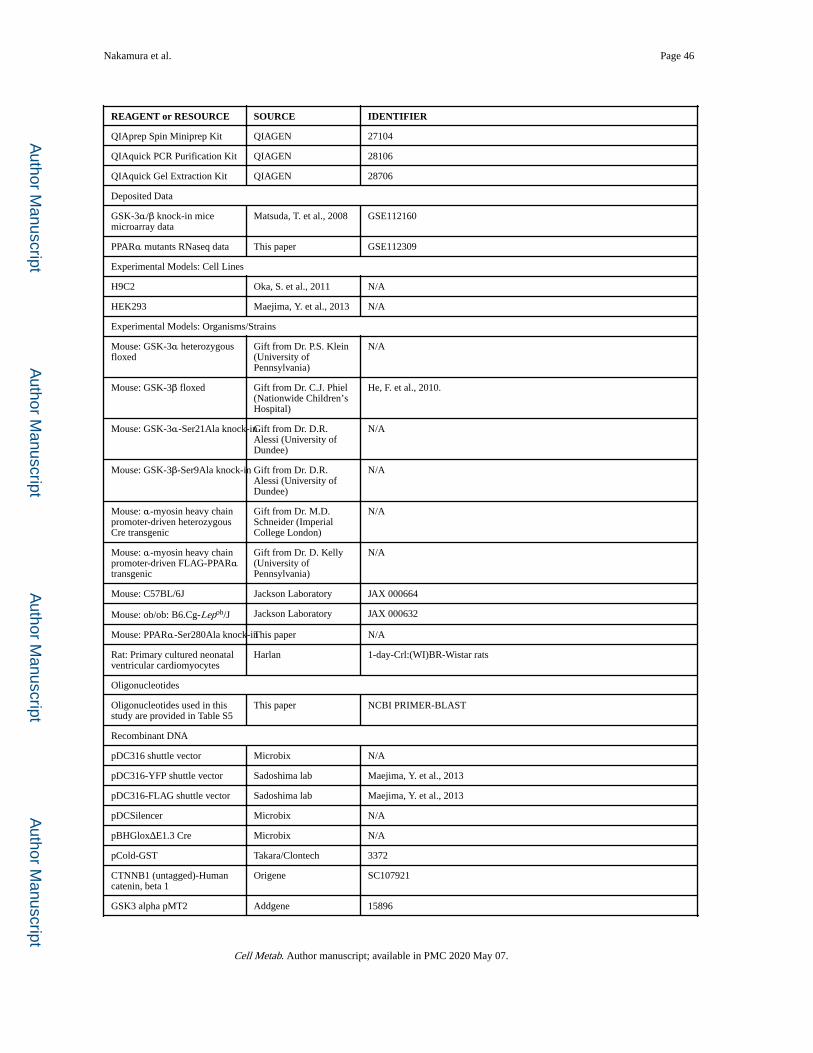
Author M
anuscriptA
uthor Manuscript
Author M
anuscriptA
uthor Manuscript
Nakamura et al. Page 46
REAGENT or RESOURCE SOURCE IDENTIFIER
QIAprep Spin Miniprep Kit QIAGEN 27104
QIAquick PCR Purification Kit QIAGEN 28106
QIAquick Gel Extraction Kit QIAGEN 28706
Deposited Data
GSK-3α/β knock-in mice microarray data
Matsuda, T. et al., 2008 GSE112160
PPARα mutants RNaseq data This paper GSE112309
Experimental Models: Cell Lines
H9C2 Oka, S. et al., 2011 N/A
HEK293 Maejima, Y. et al., 2013 N/A
Experimental Models: Organisms/Strains
Mouse: GSK-3α heterozygous floxed
Gift from Dr. P.S. Klein (University of Pennsylvania)
N/A
Mouse: GSK-3β floxed Gift from Dr. C.J. Phiel (Nationwide Children’s Hospital)
He, F. et al., 2010.
Mouse: GSK-3α-Ser21Ala knock-inGift from Dr. D.R. Alessi (University of Dundee)
N/A
Mouse: GSK-3β-Ser9Ala knock-in Gift from Dr. D.R. Alessi (University of Dundee)
N/A
Mouse: α-myosin heavy chain promoter-driven heterozygous Cre transgenic
Gift from Dr. M.D. Schneider (Imperial College London)
N/A
Mouse: α-myosin heavy chain promoter-driven FLAG-PPARα transgenic
Gift from Dr. D. Kelly (University of Pennsylvania)
N/A
Mouse: C57BL/6J Jackson Laboratory JAX 000664
Mouse: ob/ob: B6.Cg-Lepob/J Jackson Laboratory JAX 000632
Mouse: PPARα-Ser280Ala knock-inThis paper N/A
Rat: Primary cultured neonatal ventricular cardiomyocytes
Harlan 1-day-Crl:(WI)BR-Wistar rats
Oligonucleotides
Oligonucleotides used in this study are provided in Table S5
This paper NCBI PRIMER-BLAST
Recombinant DNA
pDC316 shuttle vector Microbix N/A
pDC316-YFP shuttle vector Sadoshima lab Maejima, Y. et al., 2013
pDC316-FLAG shuttle vector Sadoshima lab Maejima, Y. et al., 2013
pDCSilencer Microbix N/A
pBHGloxΔE1.3 Cre Microbix N/A
pCold-GST Takara/Clontech 3372
CTNNB1 (untagged)-Human catenin, beta 1
Origene SC107921
GSK3 alpha pMT2 Addgene 15896
Cell Metab. Author manuscript; available in PMC 2020 May 07.

Author M
anuscriptA
uthor Manuscript
Author M
anuscriptA
uthor Manuscript
Nakamura et al. Page 47
REAGENT or RESOURCE SOURCE IDENTIFIER
pPPRE-tk-luciferase reporter Gift from Dr. Ronald Evans (Salk Institute)
N/A
pCITE-GSK-3α This paper N/A
pL451 Gift from Dr. Takeda (Osaka University)
N/A
pMCS-DTA Gift from Dr. Takeda (Osaka University)
N/A
pMCS-Neo-PPARα-S280A-DTA This paper N/A
pCold-GST-PPARα-full length This paper N/A
pCold-GST-PPARα-truncate 1 This paper N/A
pCold-GST-PPARα-truncate 2 This paper N/A
pCold-GST-PPARα-truncate 3 This paper N/A
pCold-GST-PPARα-truncate 4 This paper N/A
pCold-GST-PPARα-truncate 5 This paper N/A
pDC316-YFP-PPARα-wild type This paper N/A
pDC316-YFP-PPARα-S280A This paper N/A
pDC316-YFP-PPARα-S280D This paper N/A
pDC316-YFP-PPARα-S280E This paper N/A
pDC316-YFP-PPARα-WT-H440A This paper N/A
pDC316-YFP-PPARα-WT-H440Q This paper N/A
pDC316-YFP-PPARα-WT-K448A This paper N/A
pDC316-YFP-PPARα-WT-K448N This paper N/A
pDC316-YFP-PPARα-WT-K449A This paper N/A
pDC316-YFP-PPARα-WT-K449N This paper N/A
pDC316-YFP-PPARα-WT-K448A/K449AThis paper N/A
pDC316-YFP-PPARα-WT-K448N/K449NThis paper N/A
pDC316-YFP-PPARα-WT-H440A/K448A/K449AThis paper N/A
pDC316-YFP-PPARα-WT-H440Q/K448N/K449NThis paper N/A
pDC316-YFP-PPARα-WT-H440A This paper N/A
pDC316-YFP-PPARα-S280D-H440QThis paper N/A
pDC316-YFP-PPARα-S280D-K448AThis paper N/A
pDC316-YFP-PPARα-S280D-K448NThis paper N/A
pDC316-YFP-PPARα-S280D-K449AThis paper N/A
pDC316-YFP-PPARα-S280D-K449NThis paper N/A
pDC316-YFP-PPARα-S280D-K448A/K449AThis paper N/A
pDC316-YFP-PPARα-S280D-K448N/K449NThis paper N/A
pDC316-YFP-PPARα-S280D-H440A/K448A/K449AThis paper N/A
pDC316-YFP-PPARα-S280D-H440Q/K448N/K449NThis paper N/A
pDC316-GSK-3α This paper N/A
shRNA-GSK-3α #1 This paper N/A
shRNA-GSK-3α #2 This paper N/A
Cell Metab. Author manuscript; available in PMC 2020 May 07.
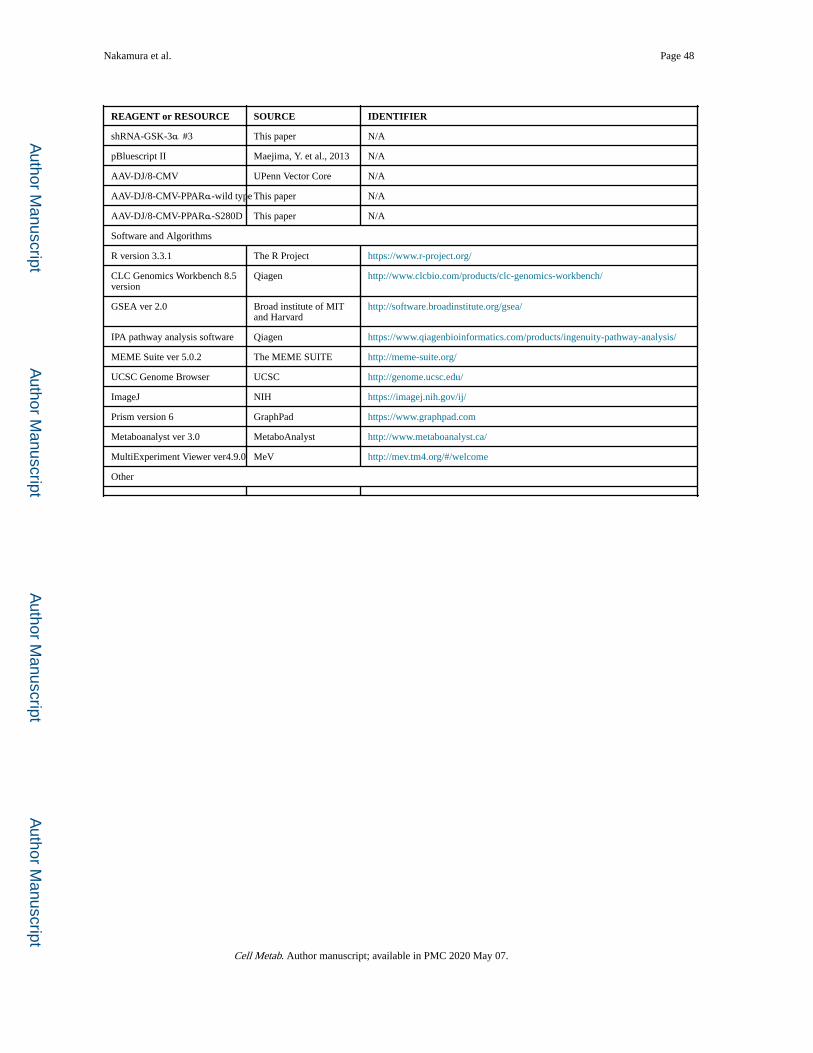
Author M
anuscriptA
uthor Manuscript
Author M
anuscriptA
uthor Manuscript
Nakamura et al. Page 48
REAGENT or RESOURCE SOURCE IDENTIFIER
shRNA-GSK-3α #3 This paper N/A
pBluescript II Maejima, Y. et al., 2013 N/A
AAV-DJ/8-CMV UPenn Vector Core N/A
AAV-DJ/8-CMV-PPARα-wild type This paper N/A
AAV-DJ/8-CMV-PPARα-S280D This paper N/A
Software and Algorithms
R version 3.3.1 The R Project https://www.r-project.org/
CLC Genomics Workbench 8.5 version
Qiagen http://www.clcbio.com/products/clc-genomics-workbench/
GSEA ver 2.0 Broad institute of MIT and Harvard
http://software.broadinstitute.org/gsea/
IPA pathway analysis software Qiagen https://www.qiagenbioinformatics.com/products/ingenuity-pathway-analysis/
MEME Suite ver 5.0.2 The MEME SUITE http://meme-suite.org/
UCSC Genome Browser UCSC http://genome.ucsc.edu/
ImageJ NIH https://imagej.nih.gov/ij/
Prism version 6 GraphPad https://www.graphpad.com
Metaboanalyst ver 3.0 MetaboAnalyst http://www.metaboanalyst.ca/
MultiExperiment Viewer ver4.9.0 MeV http://mev.tm4.org/#/welcome
Other
Cell Metab. Author manuscript; available in PMC 2020 May 07.