Embed Size (px)
Citation preview

EARSeL eProceedings 3, 1/2004 118
HIGH RESOLUTION MAPS OF SUSPENDED PARTICULATE MATTER CONCENTRATION IN THE GERMAN BIGHT
Susanne Lehner1, Ivonne Anders2 and Gerhard Gayer3
1. Deutsches Zentrum für Luft- und Raumfahrt (DLR – Oberpfaffenhofen), Institut für Methodik der Fernerkundung, 82230 Wessling, Germany; Susanne.Lehner(at)dlr.de
2. Technische Universität Dresden, Institut für Kartographie, 01062 Dresden, Germany; Ivonne.Anders(at)web.de
3. GKSS-Forschungszentrum Geesthacht, Institut für Küstenforschung, 21502 Geesthacht, Germany; Gerhard.Gayer(at)gkss.de
ABSTRACT Concentration of suspended particulate matter (SPM) is one of the major parameters that regulate the penetration of light into the water and hence the primary production. In this paper an algorithm for retrieving the SPM concentration from satellite borne SPOT imagery of the North Sea is intro-duced. For the derivation the synergy of satellite borne Modular Optoelectronic Scanner (MOS) data and SPOT imagery is used. In a first step the SPM concentrations are retrieved from the rather coarsely gridded MOS data using existing SPM algorithms for MOS data. The resulting MOS-derived SPM concentrations are used to tune an algorithm for retrieving SPM concentrations from SPOT data. Thus the tuning of this SPOT SPM algorithm is based on a synoptic and highly accurate set of satellite-derived SPM connecting the high spectral resolution of the MOS data to the high spatial resolution of the SPOT images. The high spatial resolution of SPOT images is ideally suited to measure SPM concentrations in coastal areas like the Wadden Sea in the Ger-man Bight of the North Sea, yielding the opportunity to retrieve SPM concentrations in the small water inlets of the Wadden Sea, which are needed to validate and fine tune numerical SPM mod-els for this area. In the inlets the concentrations vary considerably between 6 and 60 mg/l as measured by SPOT. These data are compared to in situ measurements and transport models and explained by the local current and sea state situation.
Keywords: Suspended particulate matter, German Bight, SPOT, SPM transport model, SPM con-centration
INTRODUCTION Several algorithms were derived to measure suspended particulate matter (SPM) from space. Be-ing a major reason for water turbidity, SPM has a substantial influence on temperature, stratifica-tion, and biology. Furthermore, SPM carries chemical substances and pathogenic agents. Several numerical models have been set up to describe the horizontal and vertical transport of SPM in es-tuaries and coastal waters, which are applied to simulate the impact of planned constructions, e.g. excavations and dike modifications. For model validation, there is a need for synoptic measure-ment data over large areas, which are hard to acquire by conventional ship campaigns. For the upper water layers, SPM concentrations can, however, be provided by remote sensing sensors operated on board of satellites and airplanes. Examples are MOS, MODIS, and MERIS. These instruments have a high spectral but poor spatial resolution, e.g. MOS 520 m and MERIS at high-est resolution about 300 m. Consequently, SPM can be derived with high accuracy, but there are limitations of these instruments resolving complicated areas such as the Wadden Sea topography in the German Bight.
The main objective of the current study was to increase the spatial resolution of the remotely sensed SPM distribution by the use of SPOT data in combination with results provided by the MOS
EARSeL eProceedings 3, 1/2004 119
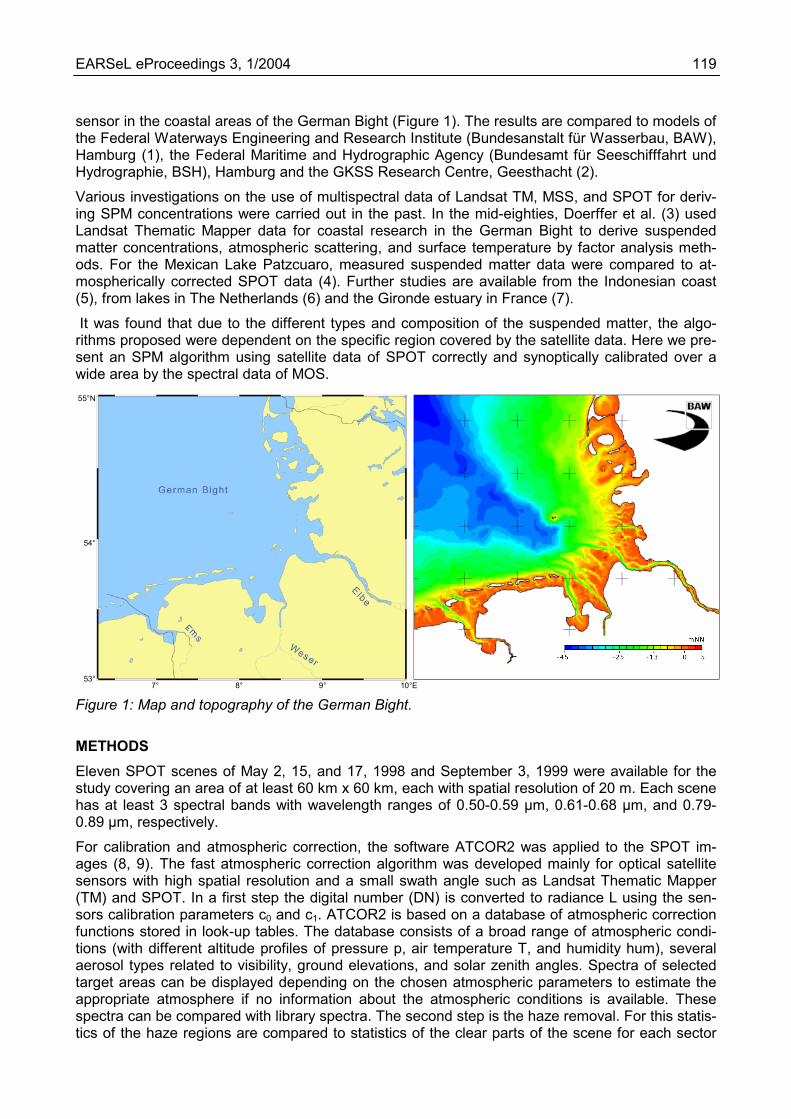
sensor in the coastal areas of the German Bight (Figure 1). The results are compared to models of the Federal Waterways Engineering and Research Institute (Bundesanstalt für Wasserbau, BAW), Hamburg (1), the Federal Maritime and Hydrographic Agency (Bundesamt für Seeschifffahrt und Hydrographie, BSH), Hamburg and the GKSS Research Centre, Geesthacht (2).
Various investigations on the use of multispectral data of Landsat TM, MSS, and SPOT for deriv-ing SPM concentrations were carried out in the past. In the mid-eighties, Doerffer et al. (3) used Landsat Thematic Mapper data for coastal research in the German Bight to derive suspended matter concentrations, atmospheric scattering, and surface temperature by factor analysis meth-ods. For the Mexican Lake Patzcuaro, measured suspended matter data were compared to at-mospherically corrected SPOT data (4). Further studies are available from the Indonesian coast (5), from lakes in The Netherlands (6) and the Gironde estuary in France (7).
It was found that due to the different types and composition of the suspended matter, the algo-rithms proposed were dependent on the specific region covered by the satellite data. Here we pre-sent an SPM algorithm using satellite data of SPOT correctly and synoptically calibrated over a wide area by the spectral data of MOS.
55°N
54°
53°7° 8° 9° 10°E
Figure 1: Map and topography of the German Bight.
METHODS Eleven SPOT scenes of May 2, 15, and 17, 1998 and September 3, 1999 were available for the study covering an area of at least 60 km x 60 km, each with spatial resolution of 20 m. Each scene has at least 3 spectral bands with wavelength ranges of 0.50-0.59 µm, 0.61-0.68 µm, and 0.79-0.89 µm, respectively.
For calibration and atmospheric correction, the software ATCOR2 was applied to the SPOT im-ages (8, 9). The fast atmospheric correction algorithm was developed mainly for optical satellite sensors with high spatial resolution and a small swath angle such as Landsat Thematic Mapper (TM) and SPOT. In a first step the digital number (DN) is converted to radiance L using the sen-sors calibration parameters c0 and c1. ATCOR2 is based on a database of atmospheric correction functions stored in look-up tables. The database consists of a broad range of atmospheric condi-tions (with different altitude profiles of pressure p, air temperature T, and humidity hum), several aerosol types related to visibility, ground elevations, and solar zenith angles. Spectra of selected target areas can be displayed depending on the chosen atmospheric parameters to estimate the appropriate atmosphere if no information about the atmospheric conditions is available. These spectra can be compared with library spectra. The second step is the haze removal. For this statis-tics of the haze regions are compared to statistics of the clear parts of the scene for each sector

EARSeL eProceedings 3, 1/2004 120
and each channel. In a last step a ground reflectance image ρ, R is calculated in each spectral band. The complete scheme is presented in Figure 2. The result of ATCOR2 is a ground reflec-tance image in each spectral band with a relative error of approximately 10 %.
Figure 2: ATCOR2 atmospheric correction scheme for the conversion of digital numbers to surface reflectance, applicable to SPOT and LANDSAT imagery, from Richter (8).
From MOS data of May 1, 1998, the scattering coefficient bS of the inorganic suspended matter at a wavelength of 0.55 µm is computed according to the PCI algorithm, described in Neumann et al. (10). The scattering coefficient is converted to the SPM concentration CS with
CS = 8 g / m2 · cS
where cS is the extinction coefficient (11,12). Since absorption of inorganic suspended matter in this area can be ignored, cS = bS.

EARSeL eProceedings 3, 1/2004 121
Additionally, the following in situ data were available:
• turbidity measurements in the Ems estuary near Knock,
• SPM measurements from the river Elbe at several positions collected in the scope of the wa-ter probing project ARGE-Elbe and
• SPM shipboard measurements from May 16, 1998.
RESULTS If was found that band 2 (0.61-0.68 µm) of the SPOT data was best suited for SPM retrieval, as the influence of chlorophyll and yellow substance is low and the range of gray values is sufficient to describe the full range of concentrations. In band 3 (0.79-0.89 µm), the gray value range is too low due to the higher absorption of the water body. Figure 3 shows a comparison of the SPM con-centration given by MOS and the surface reflectance of SPOT band 2. Although the MOS data have a lower spatial resolution of 520 m, it is possible to identify the same distributions of SPM concentrations. The quantitative relation of the two sensors was determined in homogeneous ar-eas with a size of at least 100 SPOT pixel, not close to the coast and not in rivers and estuaries, as the time difference of SPOT and MOS measurements is approximately one day (Figure 4).
Figure 3: SPM concentration derived from MOS data on May 1, 1998 (right) and Surface Reflec-tion of SPOT Band 2 (0.61-0.68 µm) on May 2, 1998 (left). Concentrations in the MOS image range from 5 mg/l (black) to 40 mg/l white. Red arrows show areas of same SPM concentrations chosen for algorithm calibration.
Adding the in situ data introduces calibration values of up to 130 mg/l SPM concentration. An ex-ponential curve of type
R2 = a (1 – exp(-b CS))
with R2 the surface reflectance (%) in SPOT band 2 and a, b free coefficients is fitted to the data. This type of function implies that a zero surface reflectance should mean no SPM is available in the upper layer and there is a limited surface reflectance a that cannot be exceeded even for very high SPM concentrations.
The best fit was found to be a = 8.93 and b = 0.0214. Figure 5 (left) shows the resulting SPM dia-gram to be used as the SPOT SPM algorithm for the Wadden Sea. This algorithm is applied to all SPOT scenes.
EARSeL eProceedings 3, 1/2004 122
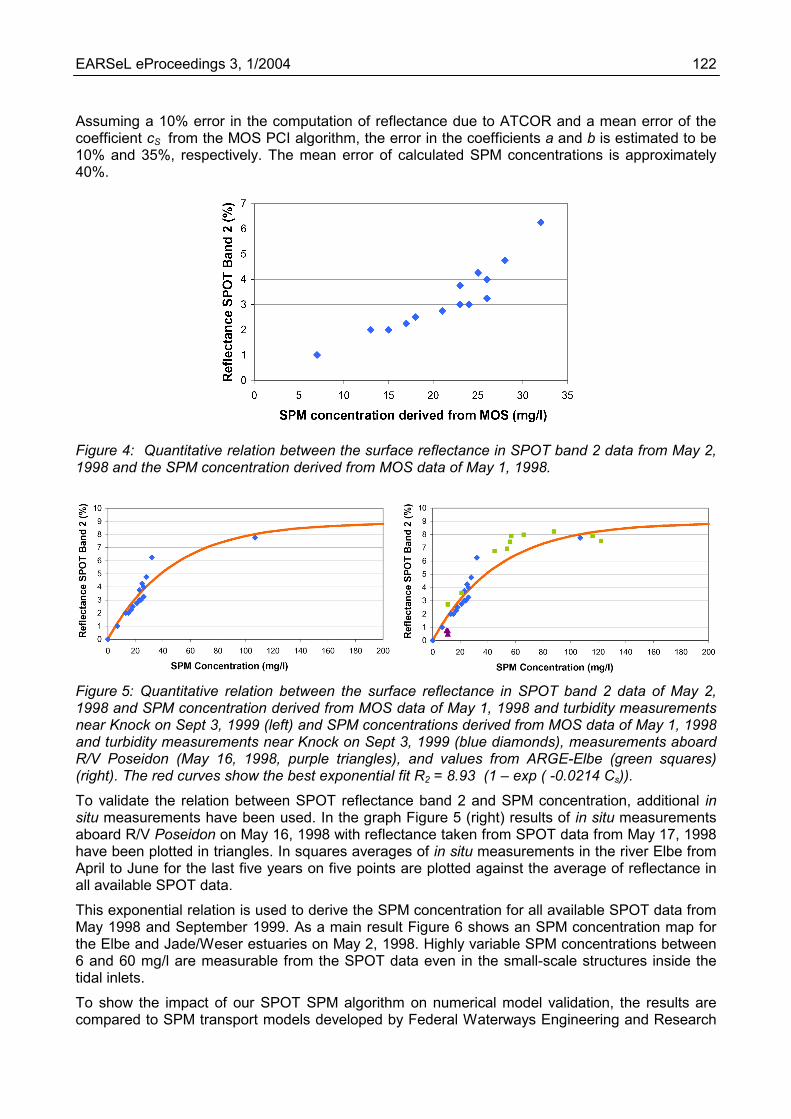
Assuming a 10% error in the computation of reflectance due to ATCOR and a mean error of the coefficient cS from the MOS PCI algorithm, the error in the coefficients a and b is estimated to be 10% and 35%, respectively. The mean error of calculated SPM concentrations is approximately 40%.
Figure 4: Quantitative relation between the surface reflectance in SPOT band 2 data from May 2, 1998 and the SPM concentration derived from MOS data of May 1, 1998.
Figure 5: Quantitative relation between the surface reflectance in SPOT band 2 data of May 2, 1998 and SPM concentration derived from MOS data of May 1, 1998 and turbidity measurements near Knock on Sept 3, 1999 (left) and SPM concentrations derived from MOS data of May 1, 1998 and turbidity measurements near Knock on Sept 3, 1999 (blue diamonds), measurements aboard R/V Poseidon (May 16, 1998, purple triangles), and values from ARGE-Elbe (green squares) (right). The red curves show the best exponential fit R2 = 8.93 (1 – exp ( -0.0214 Cs)).
To validate the relation between SPOT reflectance band 2 and SPM concentration, additional in situ measurements have been used. In the graph Figure 5 (right) results of in situ measurements aboard R/V Poseidon on May 16, 1998 with reflectance taken from SPOT data from May 17, 1998 have been plotted in triangles. In squares averages of in situ measurements in the river Elbe from April to June for the last five years on five points are plotted against the average of reflectance in all available SPOT data.
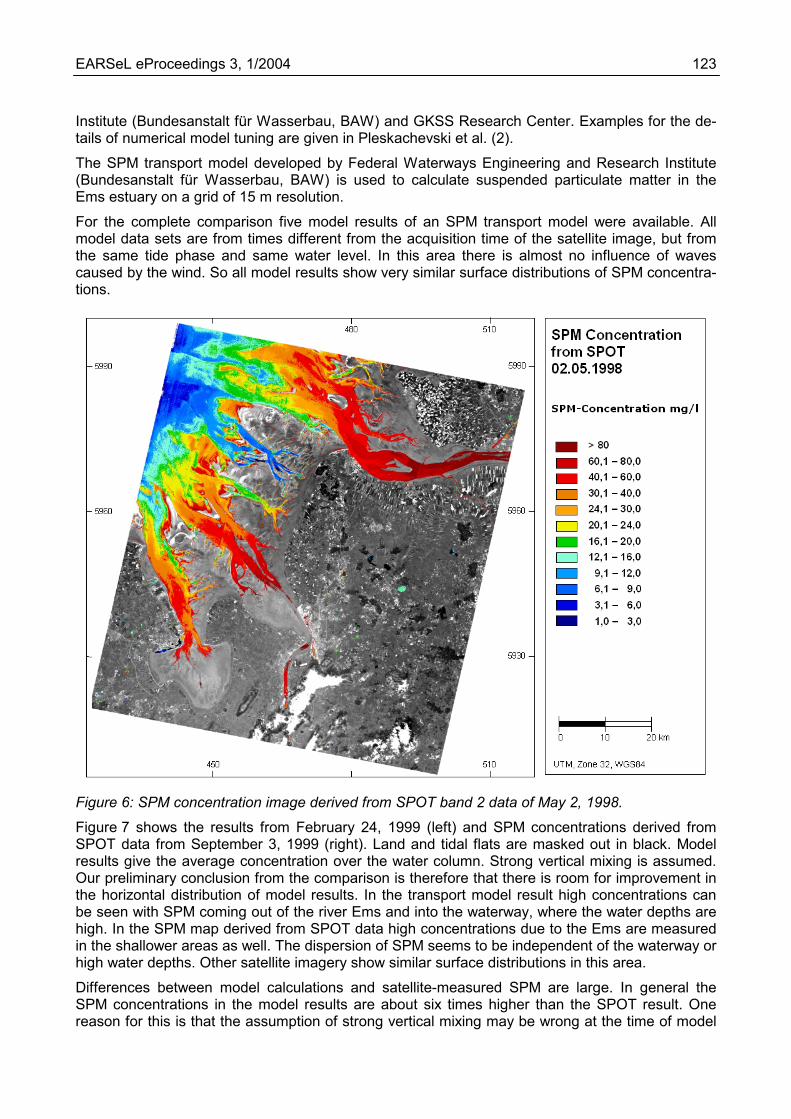
This exponential relation is used to derive the SPM concentration for all available SPOT data from May 1998 and September 1999. As a main result Figure 6 shows an SPM concentration map for the Elbe and Jade/Weser estuaries on May 2, 1998. Highly variable SPM concentrations between 6 and 60 mg/l are measurable from the SPOT data even in the small-scale structures inside the tidal inlets.
To show the impact of our SPOT SPM algorithm on numerical model validation, the results are compared to SPM transport models developed by Federal Waterways Engineering and Research
EARSeL eProceedings 3, 1/2004 123
Institute (Bundesanstalt für Wasserbau, BAW) and GKSS Research Center. Examples for the de-tails of numerical model tuning are given in Pleskachevski et al. (2).
The SPM transport model developed by Federal Waterways Engineering and Research Institute (Bundesanstalt für Wasserbau, BAW) is used to calculate suspended particulate matter in the Ems estuary on a grid of 15 m resolution.
For the complete comparison five model results of an SPM transport model were available. All model data sets are from times different from the acquisition time of the satellite image, but from the same tide phase and same water level. In this area there is almost no influence of waves caused by the wind. So all model results show very similar surface distributions of SPM concentra-tions.
Figure 6: SPM concentration image derived from SPOT band 2 data of May 2, 1998.
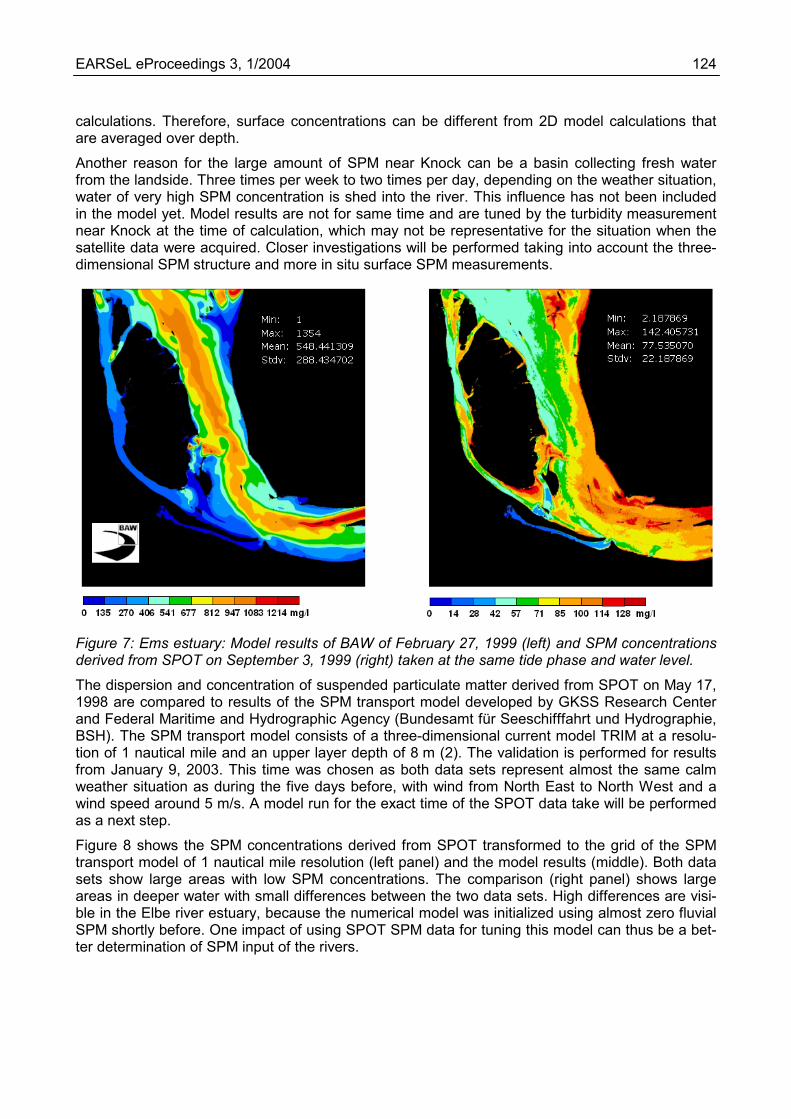
Figure 7 shows the results from February 24, 1999 (left) and SPM concentrations derived from SPOT data from September 3, 1999 (right). Land and tidal flats are masked out in black. Model results give the average concentration over the water column. Strong vertical mixing is assumed. Our preliminary conclusion from the comparison is therefore that there is room for improvement in the horizontal distribution of model results. In the transport model result high concentrations can be seen with SPM coming out of the river Ems and into the waterway, where the water depths are high. In the SPM map derived from SPOT data high concentrations due to the Ems are measured in the shallower areas as well. The dispersion of SPM seems to be independent of the waterway or high water depths. Other satellite imagery show similar surface distributions in this area.
Differences between model calculations and satellite-measured SPM are large. In general the SPM concentrations in the model results are about six times higher than the SPOT result. One reason for this is that the assumption of strong vertical mixing may be wrong at the time of model
EARSeL eProceedings 3, 1/2004 124
calculations. Therefore, surface concentrations can be different from 2D model calculations that are averaged over depth.
Another reason for the large amount of SPM near Knock can be a basin collecting fresh water from the landside. Three times per week to two times per day, depending on the weather situation, water of very high SPM concentration is shed into the river. This influence has not been included in the model yet. Model results are not for same time and are tuned by the turbidity measurement near Knock at the time of calculation, which may not be representative for the situation when the satellite data were acquired. Closer investigations will be performed taking into account the three-dimensional SPM structure and more in situ surface SPM measurements.
Figure 7: Ems estuary: Model results of BAW of February 27, 1999 (left) and SPM concentrations derived from SPOT on September 3, 1999 (right) taken at the same tide phase and water level.
The dispersion and concentration of suspended particulate matter derived from SPOT on May 17, 1998 are compared to results of the SPM transport model developed by GKSS Research Center and Federal Maritime and Hydrographic Agency (Bundesamt für Seeschifffahrt und Hydrographie, BSH). The SPM transport model consists of a three-dimensional current model TRIM at a resolu-tion of 1 nautical mile and an upper layer depth of 8 m (2). The validation is performed for results from January 9, 2003. This time was chosen as both data sets represent almost the same calm weather situation as during the five days before, with wind from North East to North West and a wind speed around 5 m/s. A model run for the exact time of the SPOT data take will be performed as a next step.
Figure 8 shows the SPM concentrations derived from SPOT transformed to the grid of the SPM transport model of 1 nautical mile resolution (left panel) and the model results (middle). Both data sets show large areas with low SPM concentrations. The comparison (right panel) shows large areas in deeper water with small differences between the two data sets. High differences are visi-ble in the Elbe river estuary, because the numerical model was initialized using almost zero fluvial SPM shortly before. One impact of using SPOT SPM data for tuning this model can thus be a bet-ter determination of SPM input of the rivers.
EARSeL eProceedings 3, 1/2004 125
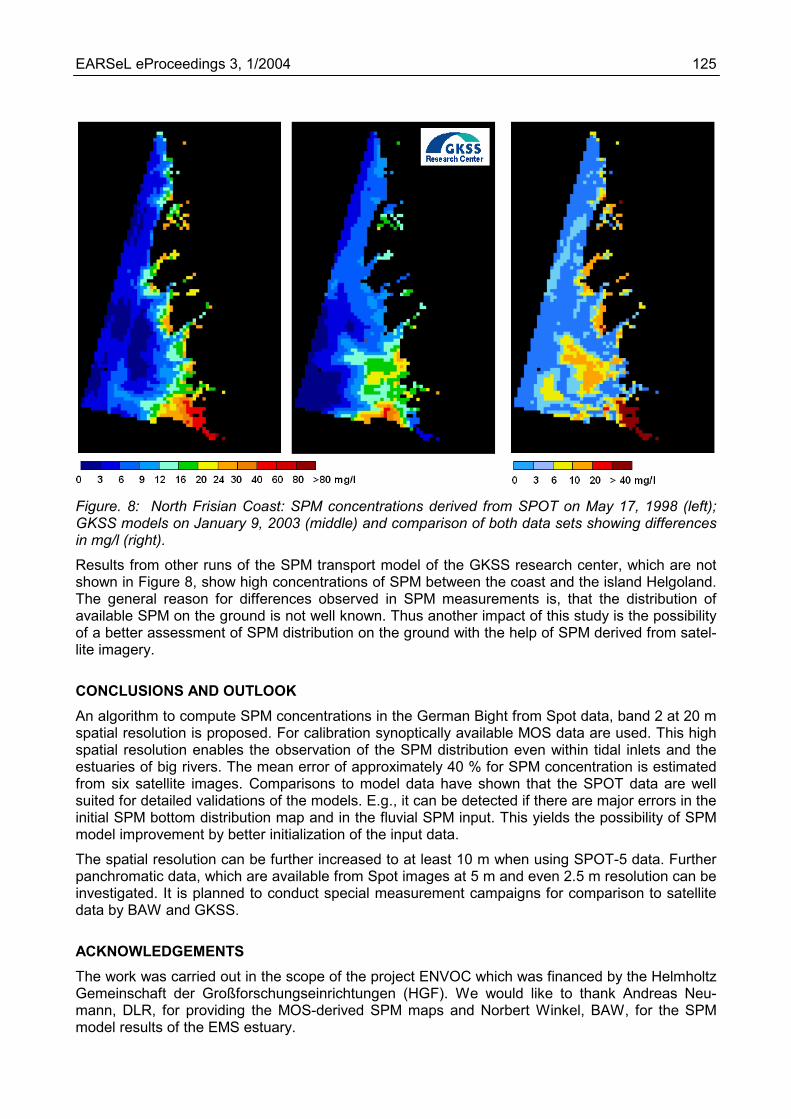
Figure. 8: North Frisian Coast: SPM concentrations derived from SPOT on May 17, 1998 (left); GKSS models on January 9, 2003 (middle) and comparison of both data sets showing differences in mg/l (right).
Results from other runs of the SPM transport model of the GKSS research center, which are not shown in Figure 8, show high concentrations of SPM between the coast and the island Helgoland. The general reason for differences observed in SPM measurements is, that the distribution of available SPM on the ground is not well known. Thus another impact of this study is the possibility of a better assessment of SPM distribution on the ground with the help of SPM derived from satel-lite imagery.
CONCLUSIONS AND OUTLOOK An algorithm to compute SPM concentrations in the German Bight from Spot data, band 2 at 20 m spatial resolution is proposed. For calibration synoptically available MOS data are used. This high spatial resolution enables the observation of the SPM distribution even within tidal inlets and the estuaries of big rivers. The mean error of approximately 40 % for SPM concentration is estimated from six satellite images. Comparisons to model data have shown that the SPOT data are well suited for detailed validations of the models. E.g., it can be detected if there are major errors in the initial SPM bottom distribution map and in the fluvial SPM input. This yields the possibility of SPM model improvement by better initialization of the input data.
The spatial resolution can be further increased to at least 10 m when using SPOT-5 data. Further panchromatic data, which are available from Spot images at 5 m and even 2.5 m resolution can be investigated. It is planned to conduct special measurement campaigns for comparison to satellite data by BAW and GKSS.
ACKNOWLEDGEMENTS The work was carried out in the scope of the project ENVOC which was financed by the Helmholtz Gemeinschaft der Großforschungseinrichtungen (HGF). We would like to thank Andreas Neu-mann, DLR, for providing the MOS-derived SPM maps and Norbert Winkel, BAW, for the SPM model results of the EMS estuary.
EARSeL eProceedings 3, 1/2004 126
REFERENCES
1 Bundesanstalt für Wasserbau, 1998. HN-Verfahren TRIM2D Validierungsdokument Version 2.0, Hamburg
2 Pleskachevski A, J Horstmann & W Rosenthal, 2001. Modelling of sediment transport in syn-ergy with ocean colour data. In: Proc. 4th Berlin Workshop on Ocean Remote Sensing, Berlin, 177-181
3 Doerffer R, J Fischer, M Stössel, C Brockmann & H Grassl, 1989. Analysis of Thematic Map-per Data for Studying the Suspended Matter Distribution in the Coastal Area of the German Bight (North Sea). Remote Sensing of Environment, 28: 61-73
4 Chacon-Torres A, L Ross & A Watson, 1992. The application of SPOT Multispectral Imagery for the Assessment of Water Quality in Lake Patzcuaro, Mexico. International Journal of Re-mote Sensing, 13(4): 587-603
5 Dekker A, S Peters, M Rijkeboer & H Berghuis, 2002. Analytical processing of multitemporal SPOT and Landsat images for estuarine management in Kalimantan Indonesia. International Journal of Remote Sensing, 23(1): 15-35
6 Dekker A, R Vos & S Peters, 2001. Comparision of remote sensing data, model results and in situ data for total suspended matter (TSM) in the Southern Frisian Lakes. The Sience of the Total Environment, 268: 197-214
7 Doxaran D; J-M Froidefond; S Lavender & P Castaing, 2002. Spectral signature of highly tur-bid waters. Application with SPOT data to quantify suspended particulate matter concentra-tions. Remote Sensing of Environment, 81: 149-161
8 Richter R, 1997. Correction of atmospheric and topographic effects for high spatial resolution satellite imagery. International Journal of Remote Sensing, 18: 1099-1111
9 Richter R, 2001. Atmospheric correction algorithm for Fflat Terrain: Model ATCOR2. Version 5.4, Report of Institute IMF, DLR-IB 564-02/01, Wessling
10 Neumann A, H Krawczyk, H Hetscher, T Walzel & G Zimmermann, 1997. Retrieval of water constituents from spaceborne imaging spectrometer data. Seventh Int. Symposium Physical Measurements and Signatures in Remote Sensing, April 7-11, 1997, Courchevel, France
11 Fischer J, R Doerffer & H Grassl, 1988. Remote Sensing of Suspended Matter, Phytoplankton and Yellow Substance Over Coastal Waters Part 2: Satellite Measurements. Mitteilungen des Geologisch-Paläonthologischen Instituts der Univ. Hamburg, SCOPE/UNEP Special Volume 66: 31-41
12 Fischer J & P Schlüssel, 1990. Sun-Simulated Chlorophyll Fluorescence Part 2: Impact of Atmospheric Properties. International Journal of Remote Sensing, 11: 2149-2162