Embed Size (px)
Citation preview
Edelweiss Research is also available on www.edelresearch.com,
Bloomberg EDEL <GO>, Thomson First Call, Reuters and Factset.
Edelweiss Securities Limited
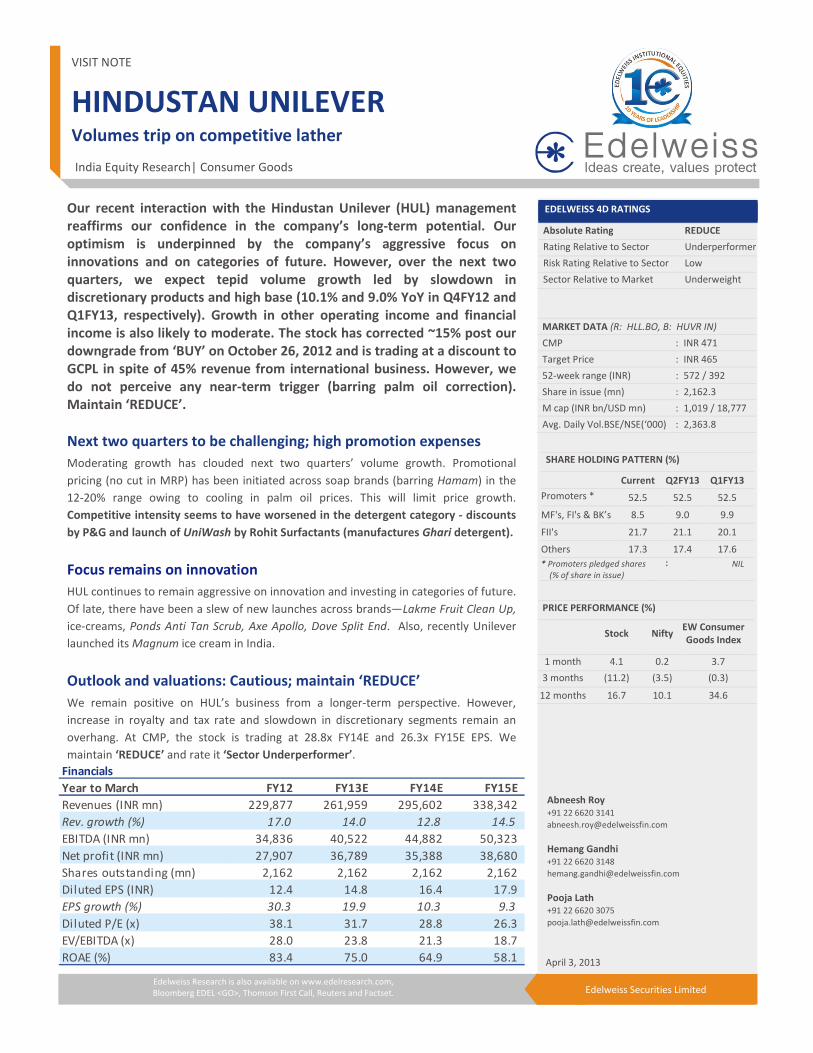
Our recent interaction with the Hindustan Unilever (HUL) management
reaffirms our confidence in the company’s long-term potential. Our
optimism is underpinned by the company’s aggressive focus on
innovations and on categories of future. However, over the next two
quarters, we expect tepid volume growth led by slowdown in
discretionary products and high base (10.1% and 9.0% YoY in Q4FY12 and
Q1FY13, respectively). Growth in other operating income and financial
income is also likely to moderate. The stock has corrected ~15% post our
downgrade from ‘BUY’ on October 26, 2012 and is trading at a discount to
GCPL in spite of 45% revenue from international business. However, we
do not perceive any near-term trigger (barring palm oil correction).
Maintain ‘REDUCE’.
Next two quarters to be challenging; high promotion expenses
Moderating growth has clouded next two quarters’ volume growth. Promotional
pricing (no cut in MRP) has been initiated across soap brands (barring Hamam) in the
12-20% range owing to cooling in palm oil prices. This will limit price growth.
Competitive intensity seems to have worsened in the detergent category - discounts
by P&G and launch of UniWash by Rohit Surfactants (manufactures Ghari detergent).
Focus remains on innovation
HUL continues to remain aggressive on innovation and investing in categories of future.
Of late, there have been a slew of new launches across brands—Lakme Fruit Clean Up,
ice-creams, Ponds Anti Tan Scrub, Axe Apollo, Dove Split End. Also, recently Unilever
launched its Magnum ice cream in India.
Outlook and valuations: Cautious; maintain ‘REDUCE’
We remain positive on HUL’s business from a longer-term perspective. However,
increase in royalty and tax rate and slowdown in discretionary segments remain an
overhang. At CMP, the stock is trading at 28.8x FY14E and 26.3x FY15E EPS. We
maintain ‘REDUCE’ and rate it ‘Sector Underperformer’.
VISIT NOTE
HINDUSTAN UNILEVER Volumes trip on competitive lather
EDELWEISS 4D RATINGS
Absolute Rating REDUCE
Rating Relative to Sector Underperformer
Risk Rating Relative to Sector Low
Sector Relative to Market Underweight
MARKET DATA (R: HLL.BO, B: HUVR IN)
CMP : INR 471
Target Price : INR 465
52-week range (INR) : 572 / 392
Share in issue (mn) : 2,162.3
M cap (INR bn/USD mn) : 1,019 / 18,777
Avg. Daily Vol.BSE/NSE(‘000) : 2,363.8
SHARE HOLDING PATTERN (%)
Current Q2FY13 Q1FY13
Promoters *
52.5 52.5 52.5
MF's, FI's & BK’s 8.5 9.0 9.9
FII's 21.7 21.1 20.1
Others 17.3 17.4 17.6
* Promoters pledged shares
(% of share in issue)
: NIL
PRICE PERFORMANCE (%)
Stock Nifty
EW Consumer
Goods Index
1 month 4.1 0.2 3.7
3 months (11.2) (3.5) (0.3)
12 months 16.7 10.1 34.6
Abneesh Roy
+91 22 6620 3141
Hemang Gandhi
+91 22 6620 3148
Pooja Lath
+91 22 6620 3075
India Equity Research| Consumer Goods
April 3, 2013
Financials
Year to March FY12 FY13E FY14E FY15E
Revenues (INR mn) 229,877 261,959 295,602 338,342
Rev. growth (%) 17.0 14.0 12.8 14.5
EBITDA (INR mn) 34,836 40,522 44,882 50,323
Net profit (INR mn) 27,907 36,789 35,388 38,680
Shares outstanding (mn) 2,162 2,162 2,162 2,162
Diluted EPS (INR) 12.4 14.8 16.4 17.9
EPS growth (%) 30.3 19.9 10.3 9.3
Diluted P/E (x) 38.1 31.7 28.8 26.3
EV/EBITDA (x) 28.0 23.8 21.3 18.7
ROAE (%) 83.4 75.0 64.9 58.1
Consumer Goods
2 Edelweiss Securities Limited
Key management meet takeaways
Soaps & detergents: Major margin surge not likely; high competitive intensity
HUL, over the past few months, has initiated promotional price cuts across soap brands
(except Hamam) in the 12-20% range across different SKUs owing to cooling in PFAD prices
(down 28% YoY). Thus, even though margin may improve a tad, any major jump looks
unlikely as gross margin benefit is routed to pricing action. The company had lost some
market share in FY10 due to not passing on the benefit of cooling PFAD prices to end
consumers; learning from this experience, it has been proactive this time.
Competitive intensity in detergents remains high through advertisements and promotions.
Wheel (faced a little slowdown in Q3FY13) has done better.
Chart 1: S&D YoY revenue growth Chart 2: S&D margin dip YoY
Source: Company, Edelweiss research
Personal products: Moderate growth
The company earns ~58% of its profit from personal products on back of strong volume
growth. HUL offers a variety of products in the skin care segment—premium skin lightening
creams, hand and body creams, male grooming products, anti-ageing products and Vaseline
lip care—where it envisages huge growth potential.
However, growth rate continues to be progressively moderate in some discretionary
categories like skin care and hair care, while oral care continues to do comparatively better.
While growth of Dove shampoo continues to be moderate on a high base and partially due
to increase in sachet price from INR1 to INR1.5, Clear still remains soft.
(5.0)
2.0
9.0
16.0
23.0
30.0
De
c-0
9
Ma
r-1
0
Jun
-10
Se
p-1
0
De
c-1
0
Ma
r-1
1
Jun
-11
Se
p-1
1
De
c-1
1
Ma
r-1
2
Jun
-12
Se
p-1
2
De
c-1
2
(S&
D s
ale
s g
row
th %
)
0.0
3.0
6.0
9.0
12.0
15.0
De
c-0
9
Ma
r-1
0
Jun
-10
Se
p-1
0
De
c-1
0
Ma
r-1
1
Jun
-11
Se
p-1
1
De
c-1
1
Ma
r-1
2
Jun
-12
Se
p-1
2
De
c-1
2
(S&
D m
arg
ins
%)
Hindustan Unilever
3 Edelweiss Securities Limited
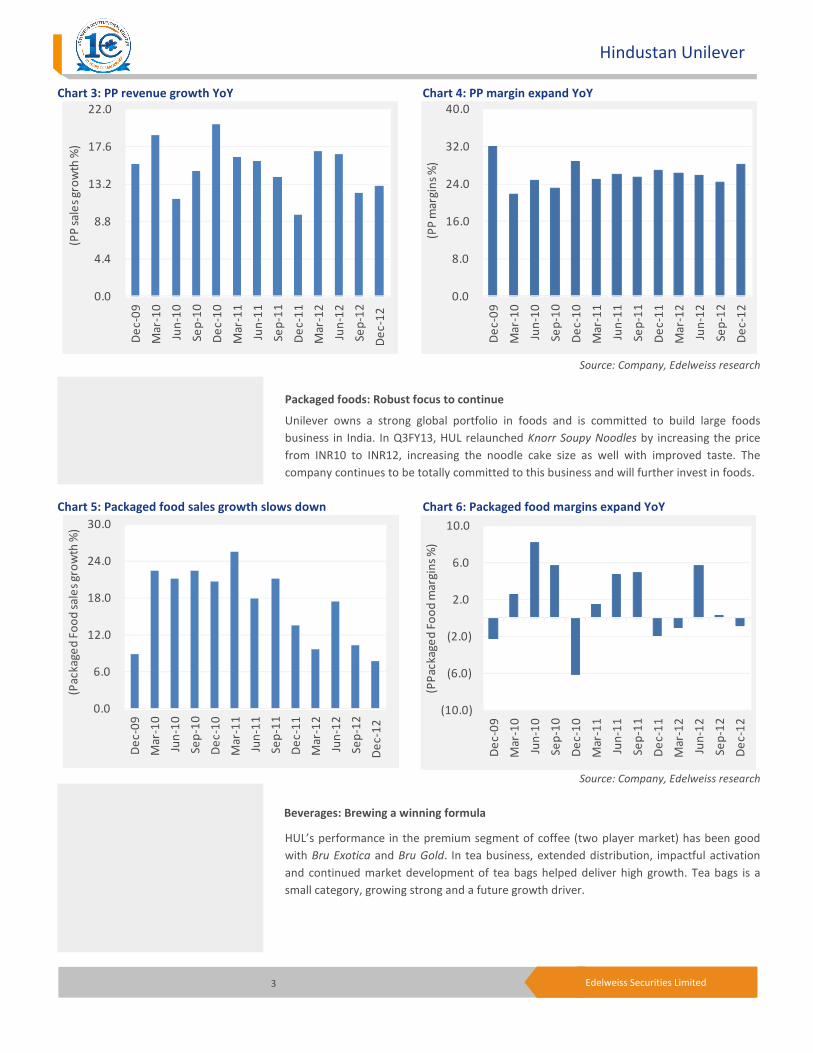
Chart 3: PP revenue growth YoY Chart 4: PP margin expand YoY
Source: Company, Edelweiss research
Packaged foods: Robust focus to continue
Unilever owns a strong global portfolio in foods and is committed to build large foods
business in India. In Q3FY13, HUL relaunched Knorr Soupy Noodles by increasing the price
from INR10 to INR12, increasing the noodle cake size as well with improved taste. The
company continues to be totally committed to this business and will further invest in foods.
Chart 5: Packaged food sales growth slows down Chart 6: Packaged food margins expand YoY
Source: Company, Edelweiss research
Beverages: Brewing a winning formula
HUL’s performance in the premium segment of coffee (two player market) has been good
with Bru Exotica and Bru Gold. In tea business, extended distribution, impactful activation
and continued market development of tea bags helped deliver high growth. Tea bags is a
small category, growing strong and a future growth driver.
0.0
4.4
8.8
13.2
17.6
22.0
De
c-0
9
Ma
r-1
0
Jun
-10
Se
p-1
0
De
c-1
0
Ma
r-1
1
Jun
-11
Se
p-1
1
De
c-1
1
Ma
r-1
2
Jun
-12
Se
p-1
2
De
c-1
2
(PP
sa
les
gro
wth
%)
0.0
6.0
12.0
18.0
24.0
30.0
De
c-0
9
Ma
r-1
0
Jun
-10
Se
p-1
0
De
c-1
0
Ma
r-1
1
Jun
-11
Se
p-1
1
De
c-1
1
Ma
r-1
2
Jun
-12
Se
p-1
2
De
c-1
2
(Pa
ck
ag
ed
Fo
od
sa
les
gro
wth
%)
0.0
8.0
16.0
24.0
32.0
40.0
De
c-0
9
Ma
r-1
0
Jun
-10
Se
p-1
0
De
c-1
0
Ma
r-1
1
Jun
-11
Se
p-1
1
De
c-1
1
Ma
r-1
2
Jun
-12
Se
p-1
2
De
c-1
2
(PP
ma
rgin
s %
)
(10.0)
(6.0)
(2.0)
2.0
6.0
10.0
De
c-0
9
Ma
r-1
0
Jun
-10
Se
p-1
0
De
c-1
0
Ma
r-1
1
Jun
-11
Se
p-1
1
De
c-1
1
Ma
r-1
2
Jun
-12
Se
p-1
2
De
c-1
2
(PP
ac
ka
ge
d F
oo
d m
arg
ins
%)
Consumer Goods
4 Edelweiss Securities Limited
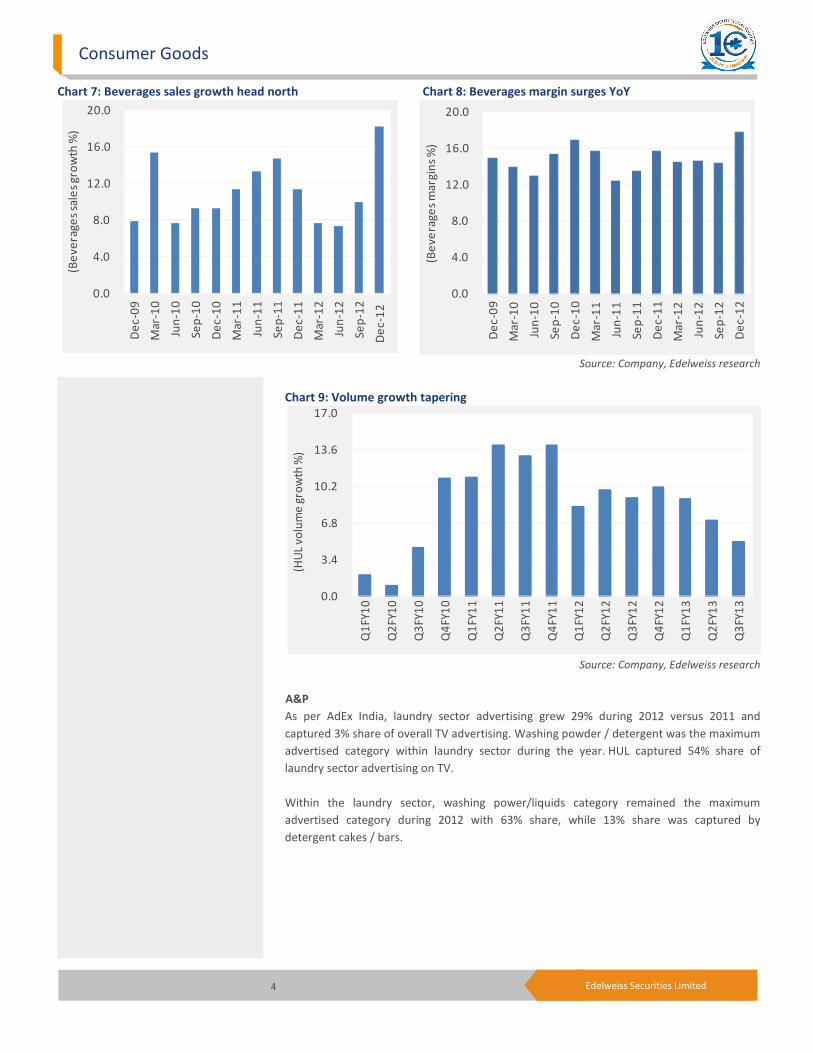
Chart 7: Beverages sales growth head north Chart 8: Beverages margin surges YoY
Source: Company, Edelweiss research
Chart 9: Volume growth tapering
Source: Company, Edelweiss research
A&P
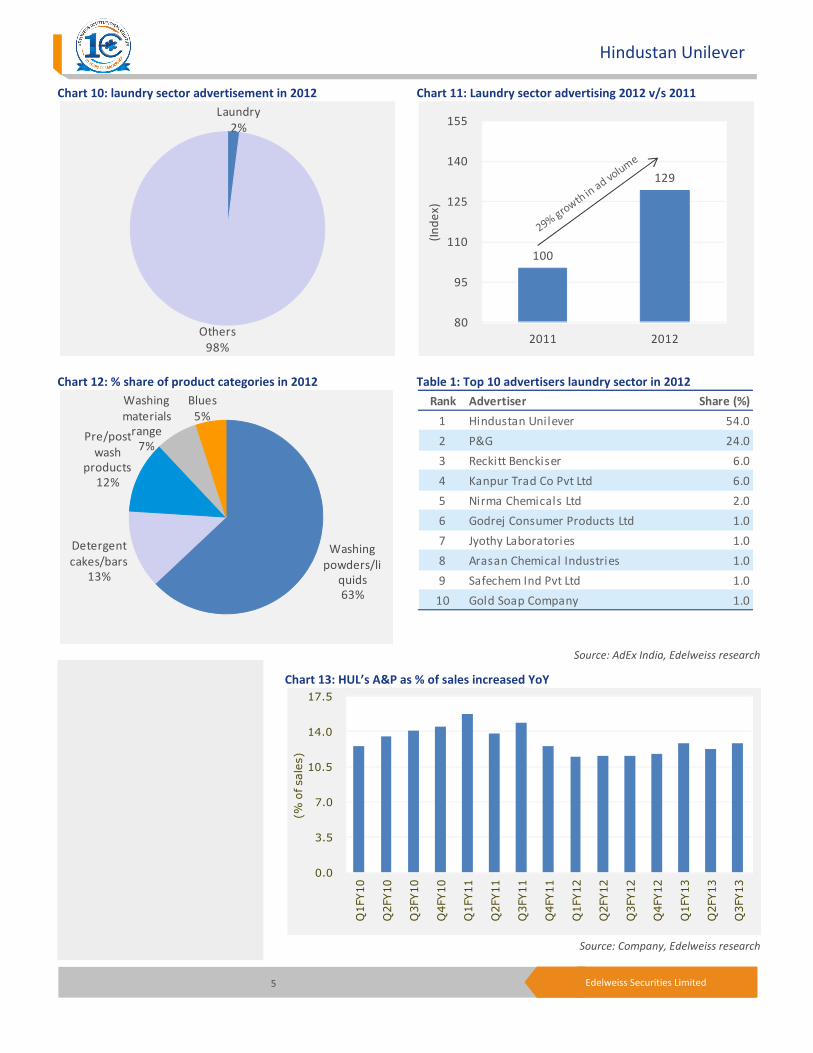
As per AdEx India, laundry sector advertising grew 29% during 2012 versus 2011 and
captured 3% share of overall TV advertising. Washing powder / detergent was the maximum
advertised category within laundry sector during the year. HUL captured 54% share of
laundry sector advertising on TV.
Within the laundry sector, washing power/liquids category remained the maximum
advertised category during 2012 with 63% share, while 13% share was captured by
detergent cakes / bars.
0.0
4.0
8.0
12.0
16.0
20.0
De
c-0
9
Ma
r-1
0
Jun
-10
Se
p-1
0
De
c-1
0
Ma
r-1
1
Jun
-11
Se
p-1
1
De
c-1
1
Ma
r-1
2
Jun
-12
Se
p-1
2
De
c-1
2
(Be
ve
rag
es
sale
s g
row
th %
)
0.0
3.4
6.8
10.2
13.6
17.0
Q1
FY1
0
Q2
FY1
0
Q3
FY1
0
Q4
FY1
0
Q1
FY1
1
Q2
FY1
1
Q3
FY1
1
Q4
FY1
1
Q1
FY1
2
Q2
FY1
2
Q3
FY1
2
Q4
FY1
2
Q1
FY1
3
Q2
FY1
3
Q3
FY1
3
(HU
L v
olu
me
gro
wth
%)
0.0
4.0
8.0
12.0
16.0
20.0
De
c-0
9
Ma
r-1
0
Jun
-10
Se
p-1
0
De
c-1
0
Ma
r-1
1
Jun
-11
Se
p-1
1
De
c-1
1
Ma
r-1
2
Jun
-12
Se
p-1
2
De
c-1
2
(Be
ve
rag
es
ma
rgin
s %
)
Hindustan Unilever
5 Edelweiss Securities Limited
Chart 10: laundry sector advertisement in 2012 Chart 11: Laundry sector advertising 2012 v/s 2011
Chart 12: % share of product categories in 2012 Table 1: Top 10 advertisers laundry sector in 2012
Source: AdEx India, Edelweiss research
Chart 13: HUL’s A&P as % of sales increased YoY
Source: Company, Edelweiss research
Laundry
2%
Others
98%
Washing
powders/li
quids
63%
Detergent
cakes/bars
13%
Pre/post
wash
products
12%
Washing
materials
range
7%
Blues
5%
0.0
3.5
7.0
10.5
14.0
17.5
Q1FY10
Q2FY10
Q3FY10
Q4FY10
Q1FY11
Q2FY11
Q3FY11
Q4FY11
Q1FY12
Q2FY12
Q3FY12
Q4FY12
Q1FY13
Q2FY13
Q3FY13
(% of sales)
100
129
80
95
110
125
140
155
2011 2012
(In
de
x)
Rank Advertiser Share (%)
1 Hindustan Unilever 54.0
2 P&G 24.0
3 Reckitt Benckiser 6.0
4 Kanpur Trad Co Pvt Ltd 6.0
5 Nirma Chemicals Ltd 2.0
6 Godrej Consumer Products Ltd 1.0
7 Jyothy Laboratories 1.0
8 Arasan Chemical Industries 1.0
9 Safechem Ind Pvt Ltd 1.0
10 Gold Soap Company 1.0
Consumer Goods
6
Other operating income and other income:
moderate as outsourcing business has been transferred out of HUL’s books. Also, growth in
other income would moderate as HUL paid a
would lower cash on books.
Margins:
affect margin. However in our view, over the long term, HUL will be able to improve EBITD
margin by:
operating leverage
Modern trade
capital
In Q3FY13, growth through this channel had slowed down due to a slowdown in pace of
store expansion and net store closure.
Strong f
Recent
Apollo, Dove Split End
differentiated products and
Other key developments
Launched Magnum ice creams in India
Unilever
specialty super premium’ launch in the impulse buy segment
point
strategy to accomplish price laddering in the ice
well for HUL though have seen recent slowdown (like in other discretionary categories)
Sale of idle assets
HUL is planning to sell a number of its properties to free up idle capital. However, it is part
of the normal business process to revi
value from idle assets. In June 2012, the company sold its Worli property
INR4,520mn.
Plans pacts with BIMARU states to build
HUL is looking to ink MoUs
Rajasthan and Uttar Pradesh) to build a franchise for its largest selling soap
completing a pilot programmme for hand wash segment in Madhya Pradesh, it intends
taking it to more ru
Rohit Surfactants launches 'UniWash'
Rohit Surfactants Pvt Ltd (manufactures
‘UniWash’
The product has a tagline 'Ab safedi khud bolegi'.
UniWash launch might be a new
head ache for HUL.
Edelweiss Securities Limited
Other operating income and other income: Growth in other operating income is likely to
moderate as outsourcing business has been transferred out of HUL’s books. Also, growth in
other income would moderate as HUL paid a special dividend of INR4 per share, which
would lower cash on books.
Margins: The impact of royalty hike will be felt for two months in Q4FY13, which will slightly
affect margin. However in our view, over the long term, HUL will be able to improve EBITD
margin by: (1) improving sales mix; (2) cost effectiveness
operating leverage; and (4) pricing actions.
Modern trade: Sales to modern trade requires the company to work on positive working
capital, but renders better margins on account of richer sales mix compared to Kirana trade.
In Q3FY13, growth through this channel had slowed down due to a slowdown in pace of
store expansion and net store closure. This trend largely continues in Q4FY13 as well.
Strong focus on innovation: HUL continues to remain upbeat on innovative launches.
Recent new launches across brands include Lakme Fruit Clean Up
Apollo, Dove Split End, innovations in ice-creams, etc. The company will
differentiated products and will steer clear of introducing “me too” products
Other key developments
Launched Magnum ice creams in India
Unilever launched their ice cream brand Magnum in Chennai recently.
specialty super premium’ launch in the impulse buy segment
point. Ice creams contribute ~19% to Unilever’s total revenues
strategy to accomplish price laddering in the ice-cream space.
well for HUL though have seen recent slowdown (like in other discretionary categories)
Sale of idle assets
HUL is planning to sell a number of its properties to free up idle capital. However, it is part
of the normal business process to review assets including real estate to unlock business
value from idle assets. In June 2012, the company sold its Worli property
INR4,520mn.
Plans pacts with BIMARU states to build Lifebuoy franchise
HUL is looking to ink MoUs with governments of BIMARU states (Bihar, Madhya Pradesh,
Rajasthan and Uttar Pradesh) to build a franchise for its largest selling soap
completing a pilot programmme for hand wash segment in Madhya Pradesh, it intends
taking it to more rural markets in Bihar, Rajasthan and Uttar Pradesh.
Rohit Surfactants launches 'UniWash'
Rohit Surfactants Pvt Ltd (manufactures ‘Ghari’ detergent) has launched a new detergent
‘UniWash’ priced at INR95/kg which is at a ~10% premium to Rin and Tide's basic variants.
The product has a tagline 'Ab safedi khud bolegi'.
Edelweiss Securities Limited
Growth in other operating income is likely to
moderate as outsourcing business has been transferred out of HUL’s books. Also, growth in
special dividend of INR4 per share, which
The impact of royalty hike will be felt for two months in Q4FY13, which will slightly
affect margin. However in our view, over the long term, HUL will be able to improve EBITDA
programme; (3) benefit of
Sales to modern trade requires the company to work on positive working
, but renders better margins on account of richer sales mix compared to Kirana trade.
In Q3FY13, growth through this channel had slowed down due to a slowdown in pace of
This trend largely continues in Q4FY13 as well.
continues to remain upbeat on innovative launches.
Fruit Clean Up, Ponds Anti Tan Scrub, Axe
, etc. The company will continue to invest in
“me too” products.
in Chennai recently. Magnum is a ‘Super
and is priced at INR75 price
total revenues. We believe this is a smart
. Ice-creams have been doing
well for HUL though have seen recent slowdown (like in other discretionary categories).
HUL is planning to sell a number of its properties to free up idle capital. However, it is part
ew assets including real estate to unlock business
value from idle assets. In June 2012, the company sold its Worli property Gulita for
with governments of BIMARU states (Bihar, Madhya Pradesh,
Rajasthan and Uttar Pradesh) to build a franchise for its largest selling soap Lifebuoy. After
completing a pilot programmme for hand wash segment in Madhya Pradesh, it intends
ral markets in Bihar, Rajasthan and Uttar Pradesh.
) has launched a new detergent
priced at INR95/kg which is at a ~10% premium to Rin and Tide's basic variants.
Hindustan Unilever
7 Edelweiss Securities Limited
Unilever to commission aerosol unit in Maharashtra soon
Unilever will shortly commence operations of its aerosol deodorant manufacturing unit
located at Khamgaon in Maharashtra once it gets certain approvals to commission the plant.
This unit will help meet requirements in India and several other markets in the region. This
should address concern of investors partially on royalty as the cost of this capex is on the
books of Unilever.
Palm oil outlook
As per Dorab Mistry, Director, Godrej International, Palm oil prices may increase 10% in May
as Malaysia’s currency weakens before elections and inventories drop in Indonesia and
Malaysia. Since palm oil is a key raw material for manufacturing soaps, this may put some
pressure on S&D margins.
Chart 14: Palm oil price trend
Source: Edelweiss research
Outlook and valuations: Cautious; maintain ‘REDUCE’ We laud HUL’s strategy of investing in categories that will pay rich dividends from a three-
five year perspective and focus on new product launches and market share gains in existing
categories. We continue to be positive on HUL’s revenue growth from a medium to long
term perspective. Also, the stock has corrected ~15% post our downgrade from ‘BUY’ and is
trading at a discount to GCPL (27.5x FY15 EPS). However, increase in royalty, steep hike in
tax rate (up 200bps and 250bps YoY for FY14E and FY15E, respectively) and slowdown in
discretionary segments remains an overhang. We value the stock at 26x to get a target price
of INR465 as we roll over to FY15 estimates. At CMP, the stock is trading at 28.8x FY14E and
26.3x FY15E EPS. We maintain ‘REDUCE’ and rate it ‘Sector Underperformer’.
800
1,440
2,080
2,720
3,360
4,000M
ar-
08
Se
p-0
8
Ma
r-0
9
Se
p-0
9
Ma
r-1
0
Se
p-1
0
Ma
r-1
1
Se
p-1
1
Ma
r-1
2
Se
p-1
2
Ma
r-1
3
(MY
R/M
T)
“I am expecting a strong recovery
in CPO production in both
countries in the second half of
2013 and particularly in the last
quarter.” Dorab Mistry, Director,
Godrej International.

Consumer Goods
8 Edelweiss Securities Limited
Chart 15: 1 year forward PE chart
Source: Company, Edelweiss research
100
200
300
400
500
600
Ma
r-0
7
Se
p-0
7
Ma
r-0
8
Se
p-0
8
Ma
r-0
9
Se
p-0
9
Ma
r-1
0
Se
p-1
0
Ma
r-1
1
Se
p-1
1
Ma
r-1
2
Se
p-1
2
Ma
r-1
3
(IN
R)
HUL
15x
20x
25x
30x
35x
Hindustan Unilever
9 Edelweiss Securities Limited
Company Description
HUL, the largest FMCG Company in India, was formed by merging three subsidiaries of
Unilever in 1956. At present, Unilever Plc holds a 52.5% stake in the company. HUL’s
portfolio of products covers a wide spectrum including soaps, detergents, skin creams,
shampoos, toothpastes, tea, coffee, packaged foods and branded atta.
Powerful brands and an envious distribution network are HUL’s primary strengths. The
company operates through segments—soaps & detergents, personal products, beverages,
foods, exports, and other operations.
Investment Theme
HUL is a play on consumption growth in India. The company has displayed its ability to effect
price hikes and avoid impact of inflation in vegetable oils, which, combined with improved
outlook for fabric wash and strong growth in processed foods and beverages, boosts our
positive outlook on the stock. The recent moves by the company to dispose of its non-core
assets including few properties give it a near term upside. We believe the price war in
shampoos with rival P&G has weakened (just like in S&D). We like its revenue growth from a
medium to long term perspective, however increase in royalty, steep hike in tax rate (up
200bps and 250bps YoY for FY14E and FY15E respectively) and slowdown in discretionary
segments remains an overhang.
Key Risks
Further correction in palm oil prices may lead to gross margin expansion.
Also, upside risk arise from the company’s continuous efforts through innovations to deal
with the discretionary slowdown.
10 Edelweiss Securities Limited
Consumer Goods
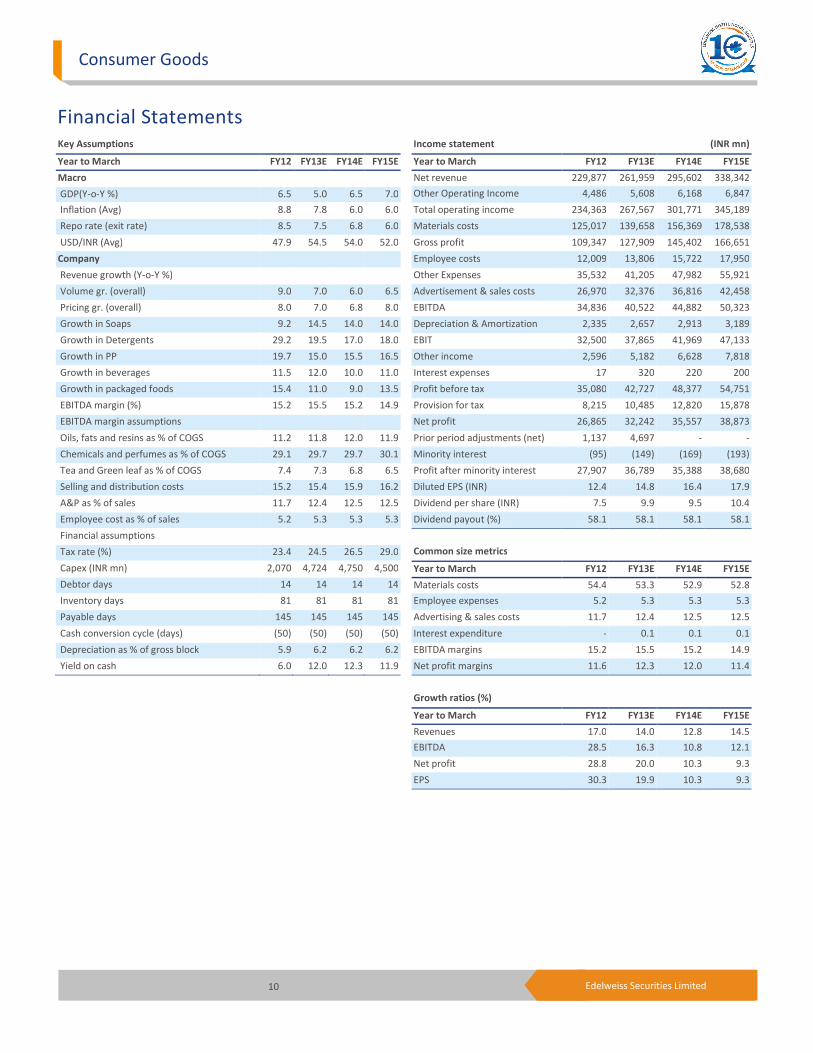
Financial Statements
Income statement (INR mn)
Year to March FY12 FY13E FY14E FY15E
Net revenue 229,877 261,959 295,602 338,342
Other Operating Income 4,486 5,608 6,168 6,847
Total operating income 234,363 267,567 301,771 345,189
Materials costs 125,017 139,658 156,369 178,538
Gross profit 109,347 127,909 145,402 166,651
Employee costs 12,009 13,806 15,722 17,950
Other Expenses 35,532 41,205 47,982 55,921
Advertisement & sales costs 26,970 32,376 36,816 42,458
EBITDA 34,836 40,522 44,882 50,323
Depreciation & Amortization 2,335 2,657 2,913 3,189
EBIT 32,500 37,865 41,969 47,133
Other income 2,596 5,182 6,628 7,818
Interest expenses 17 320 220 200
Profit before tax 35,080 42,727 48,377 54,751
Provision for tax 8,215 10,485 12,820 15,878
Net profit 26,865 32,242 35,557 38,873
Prior period adjustments (net) 1,137 4,697 - -
Minority interest (95) (149) (169) (193)
Profit after minority interest 27,907 36,789 35,388 38,680
Diluted EPS (INR) 12.4 14.8 16.4 17.9
Dividend per share (INR) 7.5 9.9 9.5 10.4
Dividend payout (%) 58.1 58.1 58.1 58.1
Common size metrics
Year to March FY12 FY13E FY14E FY15E
Materials costs 54.4 53.3 52.9 52.8
Employee expenses 5.2 5.3 5.3 5.3
Advertising & sales costs 11.7 12.4 12.5 12.5
Interest expenditure - 0.1 0.1 0.1
EBITDA margins 15.2 15.5 15.2 14.9
Net profit margins 11.6 12.3 12.0 11.4
Growth ratios (%)
Year to March FY12 FY13E FY14E FY15E
Revenues 17.0 14.0 12.8 14.5
EBITDA 28.5 16.3 10.8 12.1
Net profit 28.8 20.0 10.3 9.3
EPS 30.3 19.9 10.3 9.3
Key Assumptions
Year to March FY12 FY13E FY14E FY15E
Macro
GDP(Y-o-Y %) 6.5 5.0 6.5 7.0
Inflation (Avg) 8.8 7.8 6.0 6.0
Repo rate (exit rate) 8.5 7.5 6.8 6.0
USD/INR (Avg) 47.9 54.5 54.0 52.0
Company
Revenue growth (Y-o-Y %)
Volume gr. (overall) 9.0 7.0 6.0 6.5
Pricing gr. (overall) 8.0 7.0 6.8 8.0
Growth in Soaps 9.2 14.5 14.0 14.0
Growth in Detergents 29.2 19.5 17.0 18.0
Growth in PP 19.7 15.0 15.5 16.5
Growth in beverages 11.5 12.0 10.0 11.0
Growth in packaged foods 15.4 11.0 9.0 13.5
EBITDA margin (%) 15.2 15.5 15.2 14.9
EBITDA margin assumptions
Oils, fats and resins as % of COGS 11.2 11.8 12.0 11.9
Chemicals and perfumes as % of COGS 29.1 29.7 29.7 30.1
Tea and Green leaf as % of COGS 7.4 7.3 6.8 6.5
Selling and distribution costs 15.2 15.4 15.9 16.2
A&P as % of sales 11.7 12.4 12.5 12.5
Employee cost as % of sales 5.2 5.3 5.3 5.3
Financial assumptions
Tax rate (%) 23.4 24.5 26.5 29.0
Capex (INR mn) 2,070 4,724 4,750 4,500
Debtor days 14 14 14 14
Inventory days 81 81 81 81
Payable days 145 145 145 145
Cash conversion cycle (days) (50) (50) (50) (50)
Depreciation as % of gross block 5.9 6.2 6.2 6.2
Yield on cash 6.0 12.0 12.3 11.9
11 Edelweiss Securities Limited
Hindustan Unilever
Source: Edelweiss research
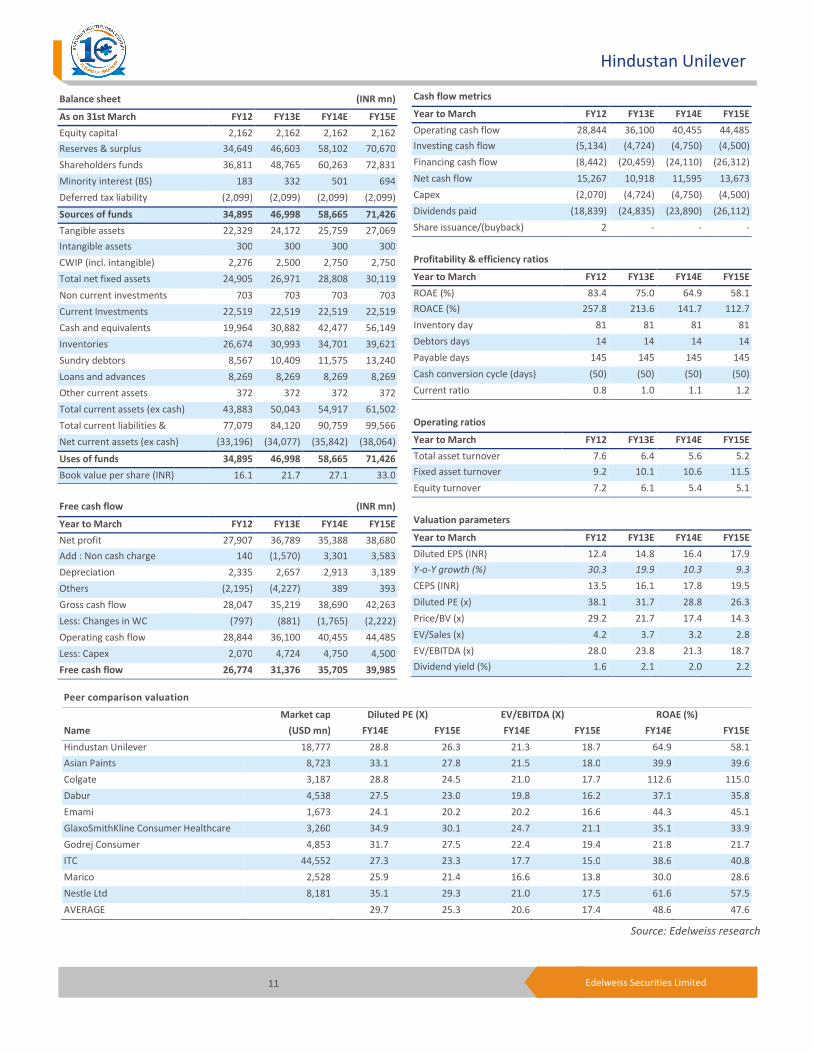
Peer comparison valuation
Market cap Diluted PE (X) EV/EBITDA (X) ROAE (%)
Name (USD mn) FY14E FY15E FY14E FY15E FY14E FY15E
Hindustan Unilever 18,777 28.8 26.3 21.3 18.7 64.9 58.1
Asian Paints 8,723 33.1 27.8 21.5 18.0 39.9 39.6
Colgate 3,187 28.8 24.5 21.0 17.7 112.6 115.0
Dabur 4,538 27.5 23.0 19.8 16.2 37.1 35.8
Emami 1,673 24.1 20.2 20.2 16.6 44.3 45.1
GlaxoSmithKline Consumer Healthcare 3,260 34.9 30.1 24.7 21.1 35.1 33.9
Godrej Consumer 4,853 31.7 27.5 22.4 19.4 21.8 21.7
ITC 44,552 27.3 23.3 17.7 15.0 38.6 40.8
Marico 2,528 25.9 21.4 16.6 13.8 30.0 28.6
Nestle Ltd 8,181 35.1 29.3 21.0 17.5 61.6 57.5
AVERAGE 29.7 25.3 20.6 17.4 48.6 47.6
Cash flow metrics
Year to March FY12 FY13E FY14E FY15E
Operating cash flow 28,844 36,100 40,455 44,485
Investing cash flow (5,134) (4,724) (4,750) (4,500)
Financing cash flow (8,442) (20,459) (24,110) (26,312)
Net cash flow 15,267 10,918 11,595 13,673
Capex (2,070) (4,724) (4,750) (4,500)
Dividends paid (18,839) (24,835) (23,890) (26,112)
Share issuance/(buyback) 2 - - -
Profitability & efficiency ratios
Year to March FY12 FY13E FY14E FY15E
ROAE (%) 83.4 75.0 64.9 58.1
ROACE (%) 257.8 213.6 141.7 112.7
Inventory day 81 81 81 81
Debtors days 14 14 14 14
Payable days 145 145 145 145
Cash conversion cycle (days) (50) (50) (50) (50)
Current ratio 0.8 1.0 1.1 1.2
Operating ratios
Year to March FY12 FY13E FY14E FY15E
Total asset turnover 7.6 6.4 5.6 5.2
Fixed asset turnover 9.2 10.1 10.6 11.5
Equity turnover 7.2 6.1 5.4 5.1
Valuation parameters
Year to March FY12 FY13E FY14E FY15E
Diluted EPS (INR) 12.4 14.8 16.4 17.9
Y-o-Y growth (%) 30.3 19.9 10.3 9.3
CEPS (INR) 13.5 16.1 17.8 19.5
Diluted PE (x) 38.1 31.7 28.8 26.3
Price/BV (x) 29.2 21.7 17.4 14.3
EV/Sales (x) 4.2 3.7 3.2 2.8
EV/EBITDA (x) 28.0 23.8 21.3 18.7
Dividend yield (%) 1.6 2.1 2.0 2.2
Balance sheet (INR mn)
As on 31st March FY12 FY13E FY14E FY15E
Equity capital 2,162 2,162 2,162 2,162
Reserves & surplus 34,649 46,603 58,102 70,670
Shareholders funds 36,811 48,765 60,263 72,831
Minority interest (BS) 183 332 501 694
Deferred tax liability (2,099) (2,099) (2,099) (2,099)
Sources of funds 34,895 46,998 58,665 71,426
Tangible assets 22,329 24,172 25,759 27,069
Intangible assets 300 300 300 300
CWIP (incl. intangible) 2,276 2,500 2,750 2,750
Total net fixed assets 24,905 26,971 28,808 30,119
Non current investments 703 703 703 703
Current Investments 22,519 22,519 22,519 22,519
Cash and equivalents 19,964 30,882 42,477 56,149
Inventories 26,674 30,993 34,701 39,621
Sundry debtors 8,567 10,409 11,575 13,240
Loans and advances 8,269 8,269 8,269 8,269
Other current assets 372 372 372 372
Total current assets (ex cash) 43,883 50,043 54,917 61,502
Total current liabilities & 77,079 84,120 90,759 99,566
Net current assets (ex cash) (33,196) (34,077) (35,842) (38,064)
Uses of funds 34,895 46,998 58,665 71,426
Book value per share (INR) 16.1 21.7 27.1 33.0
Free cash flow (INR mn)
Year to March FY12 FY13E FY14E FY15E
Net profit 27,907 36,789 35,388 38,680
Add : Non cash charge 140 (1,570) 3,301 3,583
Depreciation 2,335 2,657 2,913 3,189
Others (2,195) (4,227) 389 393
Gross cash flow 28,047 35,219 38,690 42,263
Less: Changes in WC (797) (881) (1,765) (2,222)
Operating cash flow 28,844 36,100 40,455 44,485
Less: Capex 2,070 4,724 4,750 4,500
Free cash flow 26,774 31,376 35,705 39,985
12 Edelweiss Securities Limited
Consumer Goods
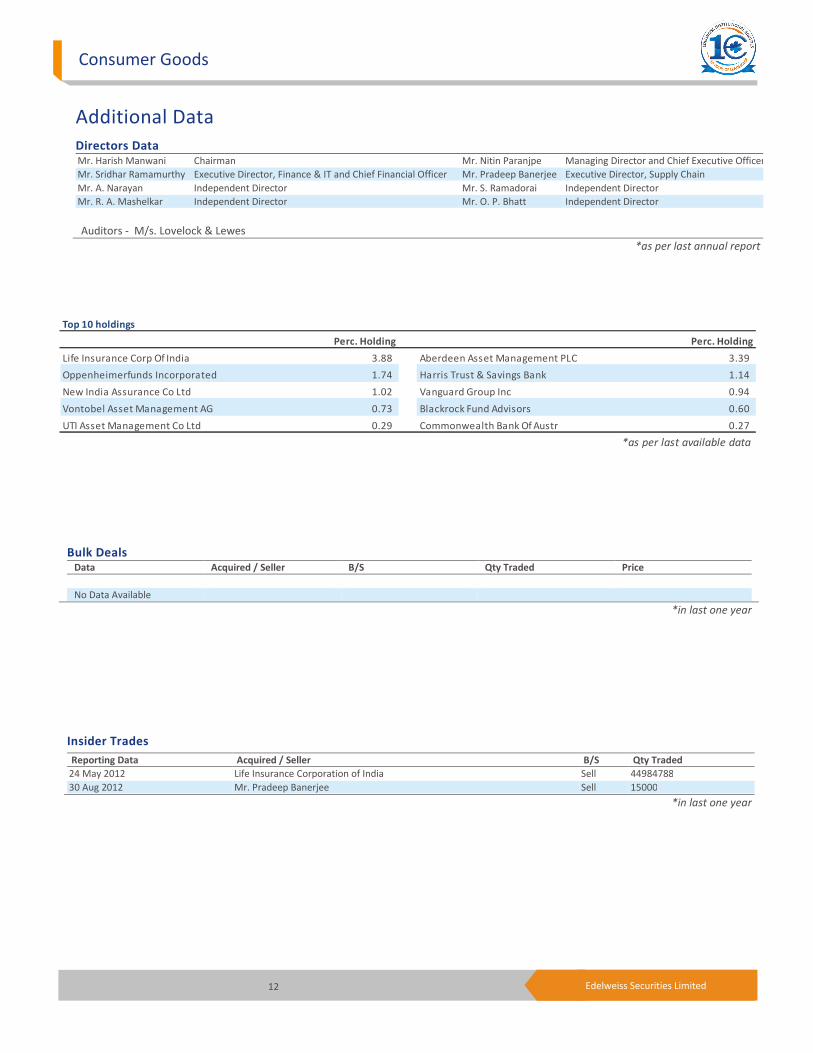
Top 10 holdings
Perc. Holding Perc. Holding
Life Insurance Corp Of India 3.88 Aberdeen Asset Management PLC 3.39
Oppenheimerfunds Incorporated 1.74 Harris Trust & Savings Bank 1.14
New India Assurance Co Ltd 1.02 Vanguard Group Inc 0.94
Vontobel Asset Management AG 0.73 Blackrock Fund Advisors 0.60
UTI Asset Management Co Ltd 0.29 Commonwealth Bank Of Austr 0.27
*as per last available data
Insider Trades Reporting Data Acquired / Seller B/S Qty Traded
24 May 2012 Life Insurance Corporation of India Sell 44984788
30 Aug 2012 Mr. Pradeep Banerjee Sell 15000
*in last one year
Bulk Deals Data Acquired / Seller B/S Qty Traded Price
No Data Available
*in last one year
Additional Data
Directors Data
Mr. Harish Manwani Chairman Mr. Nitin Paranjpe Managing Director and Chief Executive Officer
Mr. Sridhar Ramamurthy Executive Director, Finance & IT and Chief Financial Officer Mr. Pradeep Banerjee Executive Director, Supply Chain
Mr. A. Narayan Independent Director Mr. S. Ramadorai Independent Director
Mr. R. A. Mashelkar Independent Director Mr. O. P. Bhatt Independent Director
Auditors - M/s. Lovelock & Lewes
*as per last annual report
13 Edelweiss Securities Limited
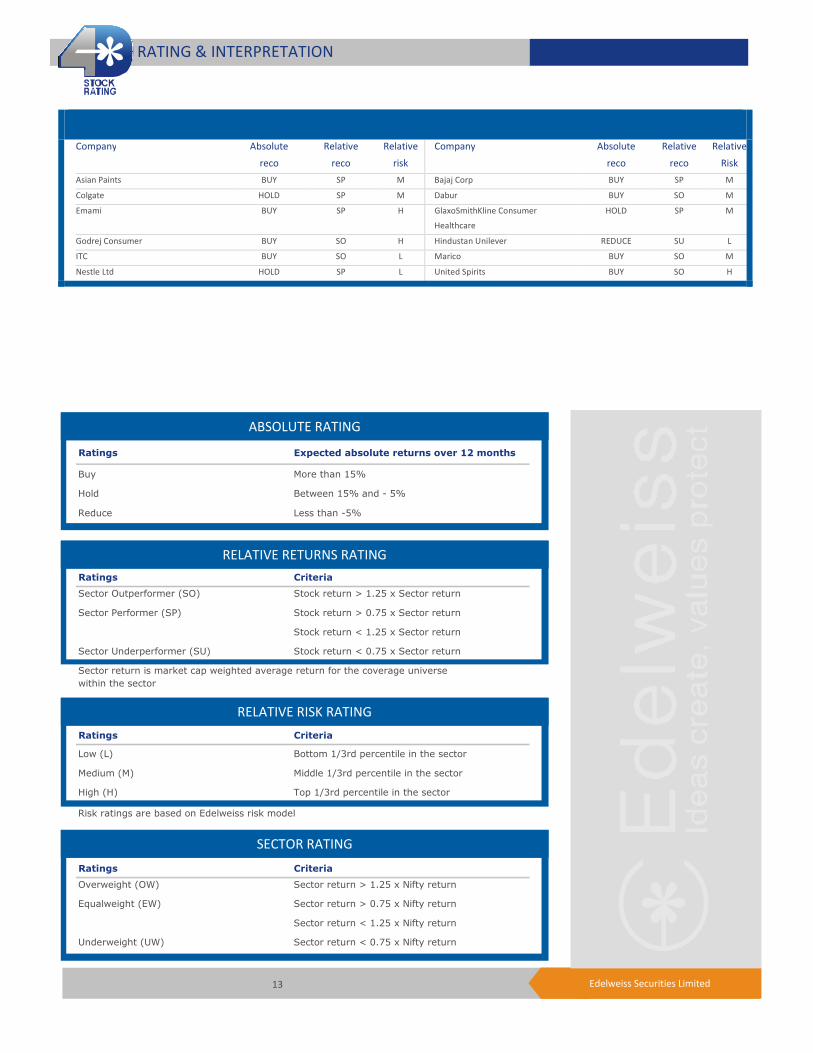
Company Absolute
reco
Relative
reco
Relative
risk
Company Absolute
reco
Relative
reco
Relative
Risk
Asian Paints BUY SP M Bajaj Corp BUY SP M
Colgate HOLD SP M Dabur BUY SO M
Emami BUY SP H GlaxoSmithKline Consumer
Healthcare
HOLD SP M
Godrej Consumer BUY SO H Hindustan Unilever REDUCE SU L
ITC BUY SO L Marico BUY SO M
Nestle Ltd HOLD SP L United Spirits BUY SO H
RATING & INTERPRETATION
ABSOLUTE RATING
Ratings Expected absolute returns over 12 months
Buy More than 15%
Hold Between 15% and - 5%
Reduce Less than -5%
RELATIVE RETURNS RATING
Ratings Criteria
Sector Outperformer (SO) Stock return > 1.25 x Sector return
Sector Performer (SP) Stock return > 0.75 x Sector return
Stock return < 1.25 x Sector return
Sector Underperformer (SU) Stock return < 0.75 x Sector return
Sector return is market cap weighted average return for the coverage universe
within the sector
RELATIVE RISK RATING
Ratings Criteria
Low (L) Bottom 1/3rd percentile in the sector
Medium (M) Middle 1/3rd percentile in the sector
High (H) Top 1/3rd percentile in the sector
Risk ratings are based on Edelweiss risk model
SECTOR RATING
Ratings Criteria
Overweight (OW) Sector return > 1.25 x Nifty return
Equalweight (EW) Sector return > 0.75 x Nifty return
Sector return < 1.25 x Nifty return
Underweight (UW) Sector return < 0.75 x Nifty return
14 Edelweiss Securities Limited
Consumer Goods
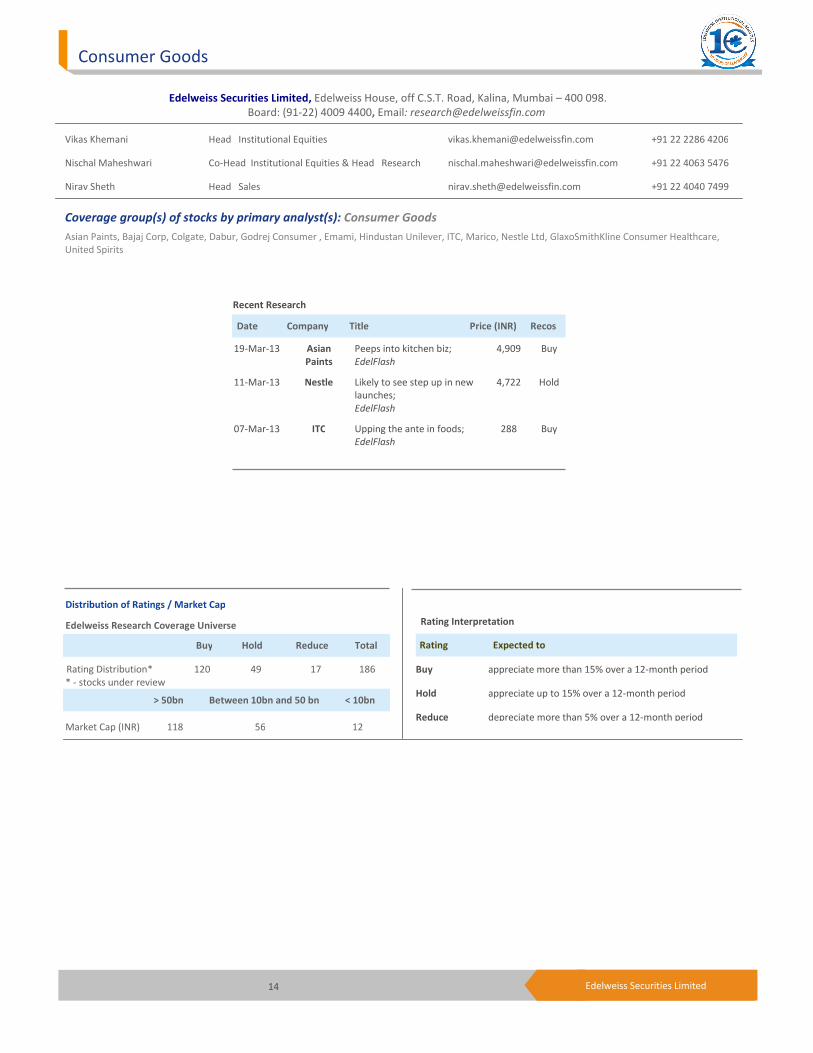
Edelweiss Securities Limited, Edelweiss House, off C.S.T. Road, Kalina, Mumbai – 400 098.
Board: (91-22) 4009 4400, Email: [email protected]
Vikas Khemani Head Institutional Equities [email protected] +91 22 2286 4206
Nischal Maheshwari Co-Head Institutional Equities & Head Research [email protected] +91 22 4063 5476
Nirav Sheth Head Sales [email protected] +91 22 4040 7499
Coverage group(s) of stocks by primary analyst(s): Consumer Goods
Asian Paints, Bajaj Corp, Colgate, Dabur, Godrej Consumer , Emami, Hindustan Unilever, ITC, Marico, Nestle Ltd, GlaxoSmithKline Consumer Healthcare,
United Spirits
Distribution of Ratings / Market Cap
Edelweiss Research Coverage Universe
Rating Distribution* 120 49 17 186
* - stocks under review
Market Cap (INR) 118 56 12
Date Company Title Price (INR) Recos
Recent Research
19-Mar-13 Asian
Paints
Peeps into kitchen biz;
EdelFlash
4,909 Buy
11-Mar-13 Nestle Likely to see step up in new
launches;
EdelFlash
4,722 Hold
07-Mar-13 ITC Upping the ante in foods;
EdelFlash
288 Buy
> 50bn Between 10bn and 50 bn < 10bn
Buy Hold Reduce Total
Rating Interpretation
Buy appreciate more than 15% over a 12-month period
Hold appreciate up to 15% over a 12-month period
Reduce depreciate more than 5% over a 12-month period
Rating Expected to
15 Edelweiss Securities Limited
Hindustan Unilever
Access the entire repository of Edelweiss Research on www.edelresearch.com
DISCLAIMER
General Disclaimer:
This document has been prepared by Edelweiss Securities Limited (Edelweiss). Edelweiss, its holding company and associate companies are a full service, integrated investment banking, portfolio
management and brokerage group. Our research analysts and sales persons provide important input into our investment banking activities. This document does not constitute an offer or solicitation for the
purchase or sale of any financial instrument or as an official confirmation of any transaction. The information contained herein is from publicly available data or other sources believed to be reliable, but we
do not represent that it is accurate or complete and it should not be relied on as such. Edelweiss or any of its affiliates/ group companies shall not be in any way responsible for any loss or damage that may
arise to any person from any inadvertent error in the information contained in this report. This document is provided for assistance only and is not intended to be and must not alone be taken as the basis
for an investment decision. The user assumes the entire risk of any use made of this information. Each recipient of this document should make such investigation as it deems necessary to arrive at an
independent evaluation of an investment in the securities of companies referred to in this document (including the merits and risks involved), and should consult his own advisors to determine the merits
and risks of such investment. The investment discussed or views expressed may not be suitable for all investors. We and our affiliates, group companies, officers, directors, and employees may: (a) from time
to time, have long or short positions in, and buy or sell the securities thereof, of company (ies) mentioned herein or (b) be engaged in any other transaction involving such securities and earn brokerage or
other compensation or act as advisor or lender/borrower to such company (ies) or have other potential conflict of interest with respect to any recommendation and related information and opinions. This
information is strictly confidential and is being furnished to you solely for your information. This information should not be reproduced or redistributed or passed on directly or indirectly in any form to any
other person or published, copied, in whole or in part, for any purpose. This report is not directed or intended for distribution to, or use by, any person or entity who is a citizen or resident of or located in
any locality, state, country or other jurisdiction, where such distribution, publication, availability or use would be contrary to law, regulation or which would subject Edelweiss and affiliates/ group companies
to any registration or licensing requirements within such jurisdiction. The distribution of this document in certain jurisdictions may be restricted by law, and persons in whose possession this document
comes, should inform themselves about and observe, any such restrictions. The information given in this document is as of the date of this report and there can be no assurance that future results or events
will be consistent with this information. This information is subject to change without any prior notice. Edelweiss reserves the right to make modifications and alterations to this statement as may be
required from time to time. However, Edelweiss is under no obligation to update or keep the information current. Nevertheless, Edelweiss is committed to providing independent and transparent
recommendation to its client and would be happy to provide any information in response to specific client queries. Neither Edelweiss nor any of its affiliates, group companies, directors, employees, agents
or representatives shall be liable for any damages whether direct, indirect, special or consequential including lost revenue or lost profits that may arise from or in connection with the use of the information.
Past performance is not necessarily a guide to future performance. The disclosures of interest statements incorporated in this document are provided solely to enhance the transparency and should not be
treated as endorsement of the views expressed in the report. Edelweiss Securities Limited generally prohibits its analysts, persons reporting to analysts and their dependents from maintaining a financial
interest in the securities or derivatives of any companies that the analysts cover. The information provided in these reports remains, unless otherwise stated, the copyright of Edelweiss. All layout, design,
original artwork, concepts and other Intellectual Properties, remains the property and copyright Edelweiss and may not be used in any form or for any purpose whatsoever by any party without the express
written permission of the copyright holders.
Analyst Certification:
The analyst for this report certifies that all of the views expressed in this report accurately reflect his or her personal views about the subject company or companies and its or their securities, and no part of
his or her compensation was, is or will be, directly or indirectly related to specific recommendations or views expressed in this report.
Analyst holding in the stock: No.
Additional Disclaimer for U.S. Persons
This research report is a product of Edelweiss Securities Limited, which is the employer of the research analyst(s) who has prepared the research report. The research analyst(s) preparing the research report
is/are resident outside the United States (U.S.) and are not associated persons of any U.S. regulated broker-dealer and therefore the analyst(s) is/are not subject to supervision by a U.S. broker-dealer, and
is/are not required to satisfy the regulatory licensing requirements of FINRA or required to otherwise comply with U.S. rules or regulations regarding, among other things, communications with a subject
company, public appearances and trading securities held by a research analyst account.
This report is intended for distribution by Edelweiss Securities Limited only to "Major Institutional Investors" as defined by Rule 15a-6(b)(4) of the U.S. Securities and Exchange Act, 1934 (the Exchange Act)
and interpretations thereof by U.S. Securities and Exchange Commission (SEC) in reliance on Rule 15a 6(a)(2). If the recipient of this report is not a Major Institutional Investor as specified above, then it
should not act upon this report and return the same to the sender. Further, this report may not be copied, duplicated and/or transmitted onward to any U.S. person, which is not the Major Institutional
Investor.
In reliance on the exemption from registration provided by Rule 15a-6 of the Exchange Act and interpretations thereof by the SEC in order to conduct certain business with Major Institutional Investors,
Edelweiss Securities Limited has entered into an agreement with a U.S. registered broker-dealer, Enclave Capital, LLC ("Enclave").
Transactions in securities discussed in this research report should be effected through Enclave or another U.S. registered broker dealer.
Additional Disclaimer for U.K. Persons
The contents of this research report have not been approved by an authorised person within the meaning of the Financial Services and Markets Act 2000 ("FSMA").
In the United Kingdom, this research report is being distributed only to and is directed only at (a) persons who have professional experience in matters relating to investments falling within Article 19(5) of
the FSMA (Financial Promotion) Order 2005 (the “Order”); (b) persons falling within Article 49(2)(a) to (d) of the Order (including high net worth companies and unincorporated associations); and (c) any
other persons to whom it may otherwise lawfully be communicated (all such persons together being referred to as “relevant persons”).
This research report must not be acted on or relied on by persons who are not relevant persons. Any investment or investment activity to which this research report relates is available only to relevant
persons and will be engaged in only with relevant persons. Any person who is not a relevant person should not act or rely on this research report nor any of its contents. This research report must not be
distributed, published, reproduced or disclosed (in whole or in part) by recipients to any other person.
Edelweiss shall not be liable for any delay or any other interruption which may occur in presenting the data due to any reason including network (Internet) reasons or snags in the system, break down of the
system or any other equipment, server breakdown, maintenance shutdown, breakdown of communication services or inability of the Edelweiss to present the data. In no event shall the Edelweiss be liable
for any damages, including without limitation direct or indirect, special, incidental, or consequential damages, losses or expenses arising in connection with the data presented by the Edelweiss through this
report.
Copyright 2009 Edelweiss Research (Edelweiss Securities Ltd). All rights reserved