Embed Size (px)
Citation preview
Hindustan Unilever
Levered to play recovery in demand; “Accumulate”
May 09, 2016
Prabhudas Lilladher Pvt. Ltd. and/or its associates (the 'Firm') does and/or seeks to do business with companies covered in its research reports. As a result investors should be aware that the Firm may have a conflict of interest that could affect the objectivity of the report. Investors should consider this report as only a single factor in making their investment decision.
Please refer to important disclosures and disclaimers at the end of the report
Q4FY16 Result Update
Amnish Aggarwal [email protected] +91‐22‐66322233
Gaurav Jogani [email protected] +91‐22‐66322238
Rating Accumulate
Price Rs846
Target Price Rs873
Implied Upside 3.2%
Sensex 25,689
Nifty 7,866
(Prices as on May 09, 2016)
Trading data
Market Cap. (Rs bn) 1,828.4
Shares o/s (m) 2,162.5
3M Avg. Daily value (Rs m) 1154.6
Major shareholders
Promoters 67.21%
Foreign 13.91%
Domestic Inst. 4.81%
Public & Other 14.07%
Stock Performance
(%) 1M 6M 12M
Absolute (0.6) 5.3 (5.6)
Relative (4.7) 7.0 (0.3)
How we differ from Consensus
EPS (Rs) PL Cons. % Diff.
2017 21.8 22.1 ‐1.5
2018 24.6 25.6 ‐3.9
Price Performance (RIC: HLL.BO, BB: HUVR IN)
Source: Bloomberg
0
200
400
600
800
1,000
May‐15
Jul‐15
Sep‐15
Nov‐15
Jan‐16
Mar‐16
May‐16
(Rs)
HUVR posted 4% volume growth and 17.7% EBITDA growth in a scenario of benign
commodity costs, S&D price deflation, slowing rural sales and channel
rationalisation in personnel care. HUVR seems well‐placed to gain from potential
increase in rural demand due to significant investments in 1) product innovations
2) marketing and distribution revamp and 3) market development in premium
segments across categories. Although HUVR is increasing presence in herbal space
with brands like Indulekha, Ayush, FAL Ayurvedic etc., we remain vary of rising
presence of Patanjali in key categories of Toilet Soaps, Shampoos and Toothpaste.
We estimate 15% PAT CAGR over FY16‐18; however, distribution of one‐time
dividend and removal of general reserves provision can reduce other income. We
value the stock at 35xFY18 and arrive on price target of Rs873. Retain
“Accumulate”.
Concall Takeaways: 1) Rural demand has remained subdued; regions like
Maharashtra, AP and Karnataka have seen further impact, although Central
India is robust. 2) Recent initiatives by GOI and monsoons hold key to
improvement in rural demand in FY17 3) Input costs have bottomed‐out,
however, HUVR hopes to drive small margin expansion led by cost control and
efficiencies 4) Tax rate is unlikely to change as HUVR has very much hit the peak
rate 5) Impact of channel rationalisation is over 6) Volume growth is the key
focus area 7) Impact of Modern, Indulekha and rice brands will be reflected in
the coming quarters 8) HUVR is growing ahead of market across segments
except, oral care 9) HUVR has gained market share in Detergents, led by double‐
digit growth in Surf.
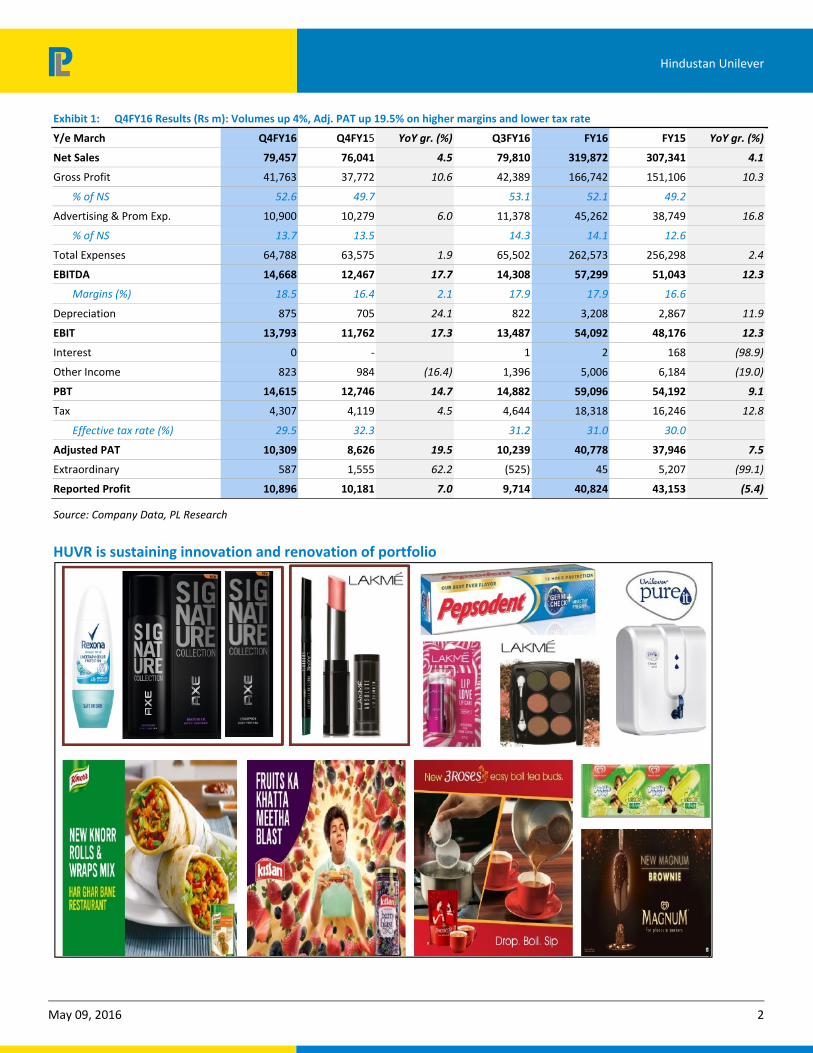
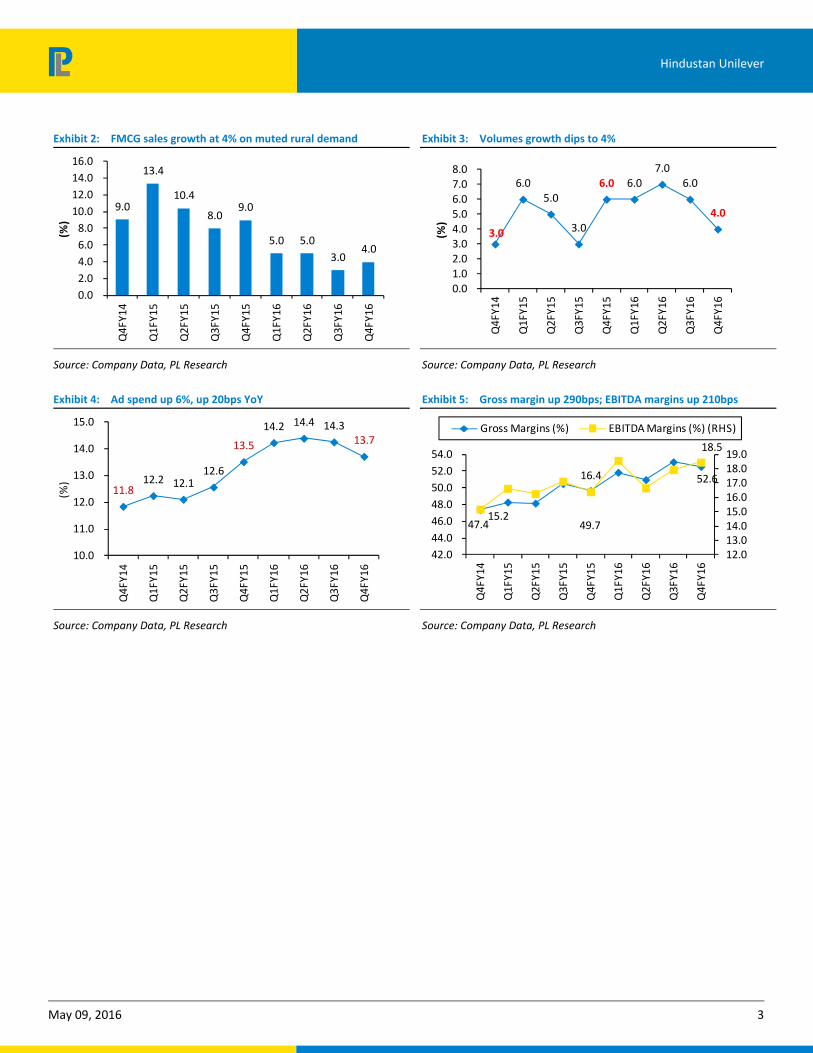
Gross margins at recent high, Volumes up 4%: Q4 net sales increased by 2.7%
on 6% volume growth (7% in Q2). Gross profit grew 8% as margins expanded by
260bps; EBITDA margins expanded by 210bps as 50bps higher staff cost and
20bps higher adpro neutralised gains. Other income declined by 16%. 280bps
lower tax rate at 29.5% resulted in 19.5% growth in adjusted PAT at Rs10.3bn.
Key financials (Y/e March) 2015 2016 2017E 2018E
Revenues (Rs m) 308,056 319,872 353,728 401,739
Growth (%) 9.9 3.8 10.6 13.6
EBITDA (Rs m) 52,082 57,299 67,846 77,073
PAT (Rs m) 37,946 40,824 47,179 53,216
EPS (Rs) 17.5 18.9 21.8 24.6
Growth (%) 6.7 7.6 15.6 12.8
Net DPS (Rs) 15.0 16.0 17.5 19.0
Profitability & Valuation 2015 2016 2017E 2018E
EBITDA margin (%) 16.9 17.9 19.2 19.2
RoE (%) 108.4 110.2 125.1 131.6
RoCE (%) 83.3 94.1 105.8 101.3
EV / sales (x) 5.8 5.6 5.0 4.4
EV / EBITDA (x) 34.1 31.0 26.2 23.0
PE (x) 48.2 44.8 38.8 34.4
P / BV (x) 49.1 49.6 47.4 43.3
Net dividend yield (%) 1.8 1.9 2.1 2.2
Source: Company Data; PL Research
May 09, 2016 2
Hindustan Unilever
Exhibit 1: Q4FY16 Results (Rs m): Volumes up 4%, Adj. PAT up 19.5% on higher margins and lower tax rate
Y/e March Q4FY16 Q4FY15 YoY gr. (%) Q3FY16 FY16 FY15 YoY gr. (%)
Net Sales 79,457 76,041 4.5 79,810 319,872 307,341 4.1
Gross Profit 41,763 37,772 10.6 42,389 166,742 151,106 10.3
% of NS 52.6 49.7 53.1 52.1 49.2
Advertising & Prom Exp. 10,900 10,279 6.0 11,378 45,262 38,749 16.8
% of NS 13.7 13.5 14.3 14.1 12.6
Total Expenses 64,788 63,575 1.9 65,502 262,573 256,298 2.4
EBITDA 14,668 12,467 17.7 14,308 57,299 51,043 12.3
Margins (%) 18.5 16.4 2.1 17.9 17.9 16.6
Depreciation 875 705 24.1 822 3,208 2,867 11.9
EBIT 13,793 11,762 17.3 13,487 54,092 48,176 12.3
Interest 0 ‐ 1 2 168 (98.9)
Other Income 823 984 (16.4) 1,396 5,006 6,184 (19.0)
PBT 14,615 12,746 14.7 14,882 59,096 54,192 9.1
Tax 4,307 4,119 4.5 4,644 18,318 16,246 12.8
Effective tax rate (%) 29.5 32.3 31.2 31.0 30.0
Adjusted PAT 10,309 8,626 19.5 10,239 40,778 37,946 7.5
Extraordinary 587 1,555 62.2 (525) 45 5,207 (99.1)
Reported Profit 10,896 10,181 7.0 9,714 40,824 43,153 (5.4)
Source: Company Data, PL Research
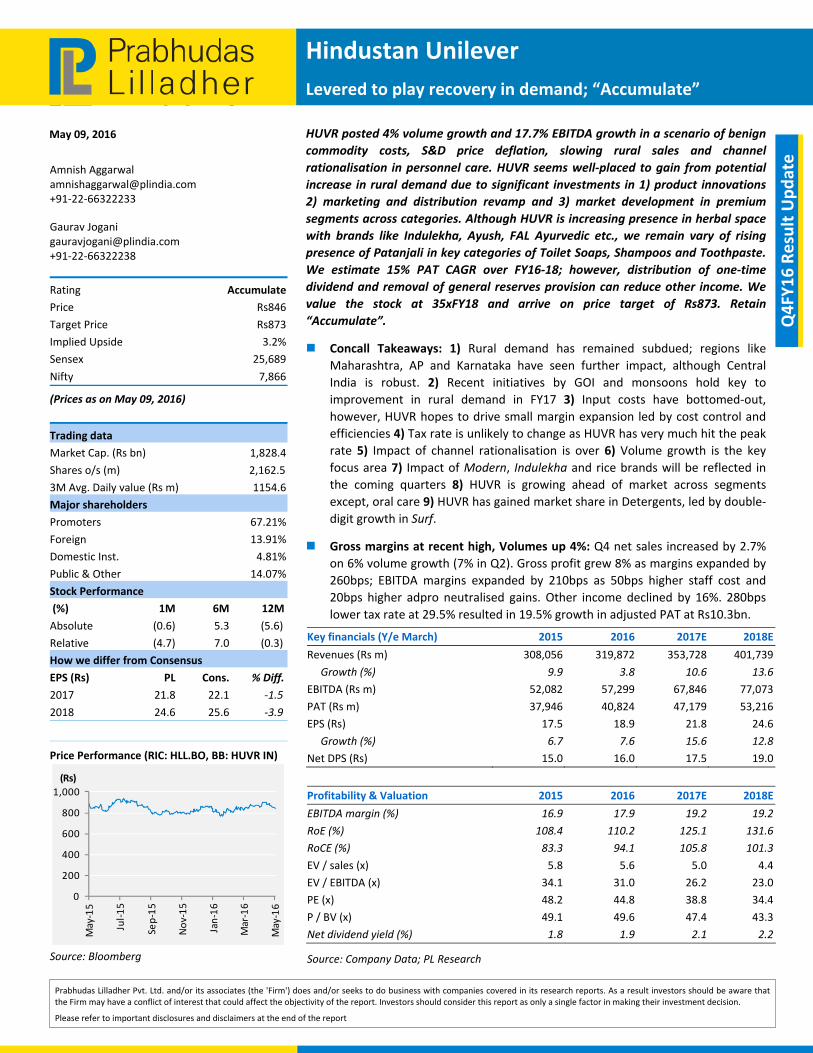
HUVR is sustaining innovation and renovation of portfolio
May 09, 2016 3
Hindustan Unilever
Exhibit 2: FMCG sales growth at 4% on muted rural demand
9.0
13.4
10.4
8.0 9.0
5.0 5.0
3.0 4.0
0.0
2.0
4.0
6.0
8.0
10.0
12.0
14.0
16.0
Q4FY14
Q1FY15
Q2FY15
Q3FY15
Q4FY15
Q1FY16
Q2FY16
Q3FY16
Q4FY16
(%)
Source: Company Data, PL Research
Exhibit 3: Volumes growth dips to 4%
3.0
6.0 5.0
3.0
6.0 6.0 7.0
6.0
4.0
0.0 1.0 2.0 3.0 4.0 5.0 6.0 7.0 8.0
Q4FY14
Q1FY15
Q2FY15
Q3FY15
Q4FY15
Q1FY16
Q2FY16
Q3FY16
Q4FY16
(%)
Source: Company Data, PL Research
Exhibit 4: Ad spend up 6%, up 20bps YoY
11.8 12.2 12.1
12.6
13.5
14.2 14.4 14.3 13.7
10.0
11.0
12.0
13.0
14.0
15.0
Q4FY14
Q1FY15
Q2FY15
Q3FY15
Q4FY15
Q1FY16
Q2FY16
Q3FY16
Q4FY16
(%)
Source: Company Data, PL Research
Exhibit 5: Gross margin up 290bps; EBITDA margins up 210bps
47.4 49.7
52.6
15.2
16.4
18.5
12.0 13.0 14.0 15.0 16.0 17.0 18.0 19.0
42.0
44.0
46.0
48.0
50.0
52.0
54.0
Q4FY14
Q1FY15
Q2FY15
Q3FY15
Q4FY15
Q1FY16
Q2FY16
Q3FY16
Q4FY16
Gross Margins (%) EBITDA Margins (%) (RHS)
Source: Company Data, PL Research
May 09, 2016 4
Hindustan Unilever
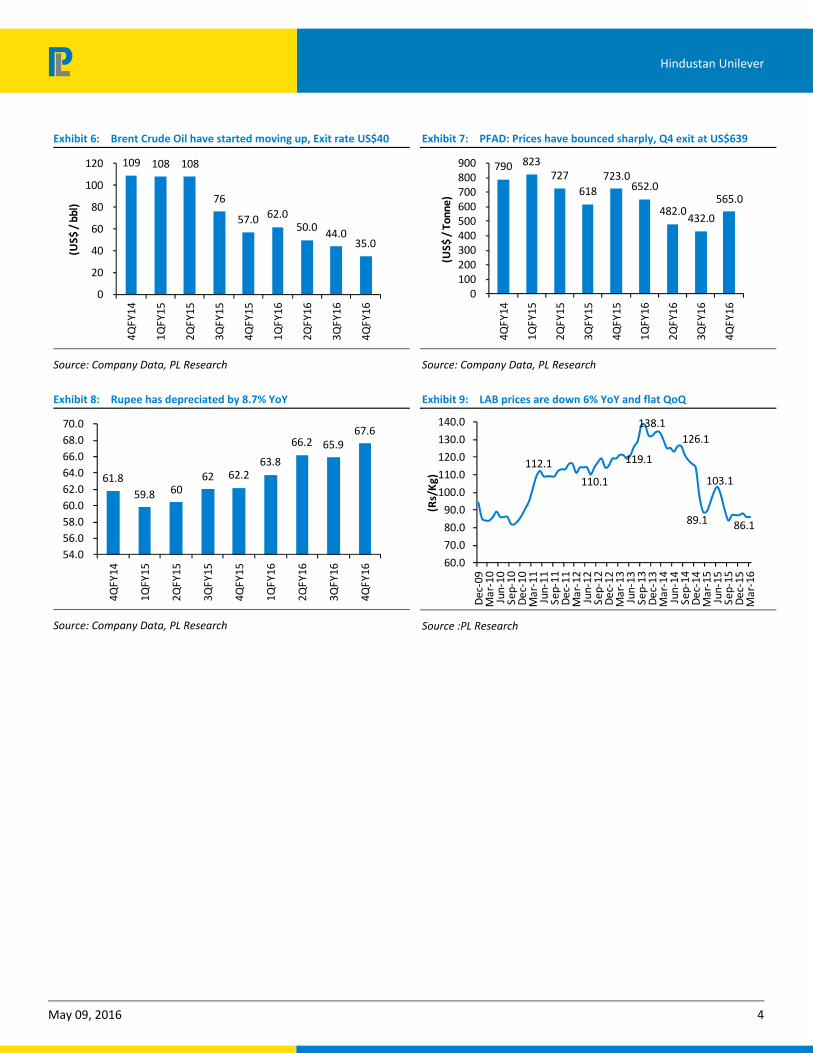
Exhibit 6: Brent Crude Oil have started moving up, Exit rate US$40
109 108 108
76
57.0 62.0 50.0
44.0 35.0
0
20
40
60
80
100
120
4QFY14
1QFY15
2QFY15
3QFY15
4QFY15
1QFY16
2QFY16
3QFY16
4QFY16
(US$ / bbl)
Source: Company Data, PL Research
Exhibit 7: PFAD: Prices have bounced sharply, Q4 exit at US$639
790 823 727
618
723.0 652.0
482.0 432.0
565.0
0 100 200 300 400 500 600 700 800 900
4QFY14
1QFY15
2QFY15
3QFY15
4QFY15
1QFY16
2QFY16
3QFY16
4QFY16
(US$
/ Tonne)
Source: Company Data, PL Research
Exhibit 8: Rupee has depreciated by 8.7% YoY
61.8
59.8 60 62 62.2
63.8
66.2 65.9 67.6
54.0
56.0
58.0
60.0
62.0
64.0
66.0
68.0
70.0
4QFY14
1QFY15
2QFY15
3QFY15
4QFY15
1QFY16
2QFY16
3QFY16
4QFY16
Source: Company Data, PL Research
Exhibit 9: LAB prices are down 6% YoY and flat QoQ
112.1
110.1
119.1
138.1
126.1
89.1
103.1
86.1
60.0
70.0
80.0
90.0
100.0
110.0
120.0
130.0
140.0
Dec‐09
Mar‐10
Jun‐10
Sep‐10
Dec‐10
Mar‐11
Jun‐11
Sep‐11
Dec‐11
Mar‐12
Jun‐12
Sep‐12
Dec‐12
Mar‐13
Jun‐13
Sep‐13
Dec‐13
Mar‐14
Jun‐14
Sep‐14
Dec‐14
Mar‐15
Jun‐15
Sep‐15
Dec‐15
Mar‐16
(Rs/Kg)
Source :PL Research
May 09, 2016 5
Hindustan Unilever
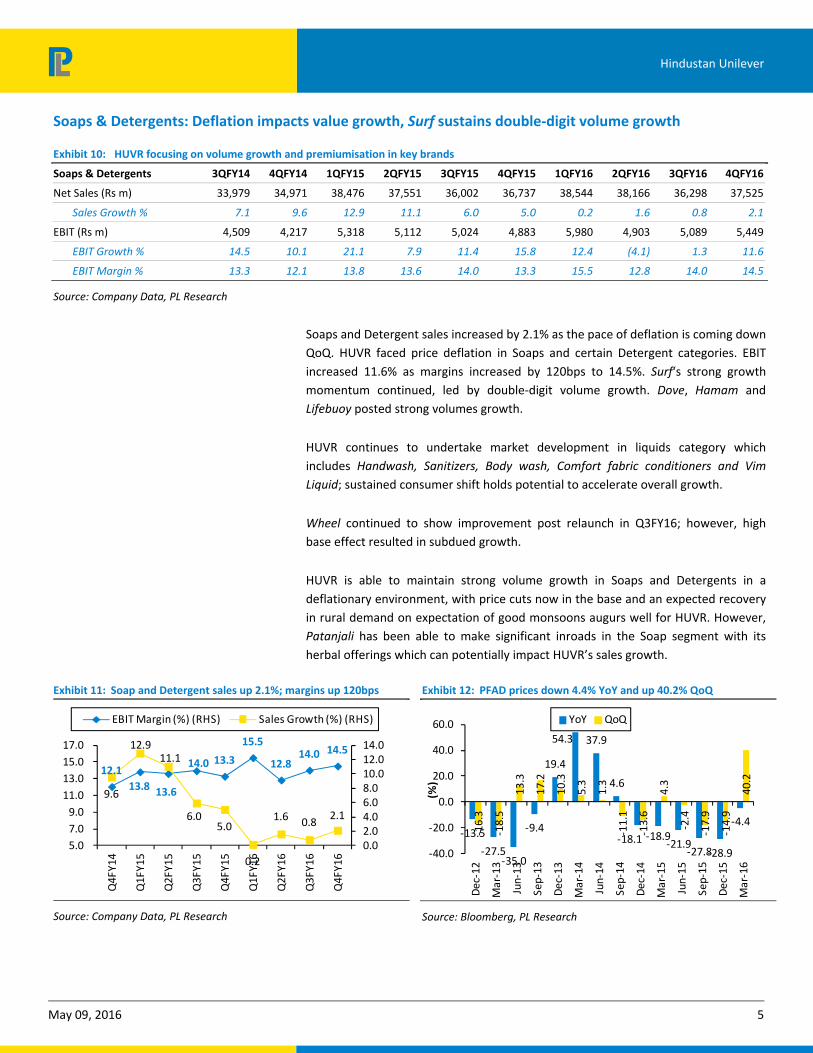
Soaps & Detergents: Deflation impacts value growth, Surf sustains double‐digit volume growth
Exhibit 10: HUVR focusing on volume growth and premiumisation in key brands
Soaps & Detergents 3QFY14 4QFY14 1QFY15 2QFY15 3QFY15 4QFY15 1QFY16 2QFY16 3QFY16 4QFY16
Net Sales (Rs m) 33,979 34,971 38,476 37,551 36,002 36,737 38,544 38,166 36,298 37,525
Sales Growth % 7.1 9.6 12.9 11.1 6.0 5.0 0.2 1.6 0.8 2.1
EBIT (Rs m) 4,509 4,217 5,318 5,112 5,024 4,883 5,980 4,903 5,089 5,449
EBIT Growth % 14.5 10.1 21.1 7.9 11.4 15.8 12.4 (4.1) 1.3 11.6
EBIT Margin % 13.3 12.1 13.8 13.6 14.0 13.3 15.5 12.8 14.0 14.5
Source: Company Data, PL Research
Soaps and Detergent sales increased by 2.1% as the pace of deflation is coming down
QoQ. HUVR faced price deflation in Soaps and certain Detergent categories. EBIT
increased 11.6% as margins increased by 120bps to 14.5%. Surf‘s strong growth
momentum continued, led by double‐digit volume growth. Dove, Hamam and
Lifebuoy posted strong volumes growth.
HUVR continues to undertake market development in liquids category which
includes Handwash, Sanitizers, Body wash, Comfort fabric conditioners and Vim
Liquid; sustained consumer shift holds potential to accelerate overall growth.
Wheel continued to show improvement post relaunch in Q3FY16; however, high
base effect resulted in subdued growth.
HUVR is able to maintain strong volume growth in Soaps and Detergents in a
deflationary environment, with price cuts now in the base and an expected recovery
in rural demand on expectation of good monsoons augurs well for HUVR. However,
Patanjali has been able to make significant inroads in the Soap segment with its
herbal offerings which can potentially impact HUVR’s sales growth.
Exhibit 11: Soap and Detergent sales up 2.1%; margins up 120bps
12.1
13.8 13.6
14.0 13.3
15.5
12.8 14.0 14.5
9.6
12.9 11.1
6.0 5.0
0.2
1.6 0.8 2.1
0.0 2.0 4.0 6.0 8.0 10.0 12.0 14.0
5.0
7.0
9.0
11.0
13.0
15.0
17.0
Q4FY14
Q1FY15
Q2FY15
Q3FY15
Q4FY15
Q1FY16
Q2FY16
Q3FY16
Q4FY16
EBIT Margin (%) (RHS) Sales Growth (%) (RHS)
Source: Company Data, PL Research
Exhibit 12: PFAD prices down 4.4% YoY and up 40.2% QoQ
‐13.5
‐27.5‐35.0
‐9.4
19.4
54.3 37.9
4.6
‐18.1 ‐18.9‐21.9
‐27.8‐28.9
‐4.4
‐16.3
‐18.5
13.3
17.2
10.3
5.3
1.3
‐11.1
‐13.6
4.3
‐2.4
‐17.9
‐14.9
40.2
‐40.0
‐20.0
0.0
20.0
40.0
60.0
Dec‐12
Mar‐13
Jun‐13
Sep‐13
Dec‐13
Mar‐14
Jun‐14
Sep‐14
Dec‐14
Mar‐15
Jun‐15
Sep‐15
Dec‐15
Mar‐16
(%)
YoY QoQ
Source: Bloomberg, PL Research
May 09, 2016 6
Hindustan Unilever
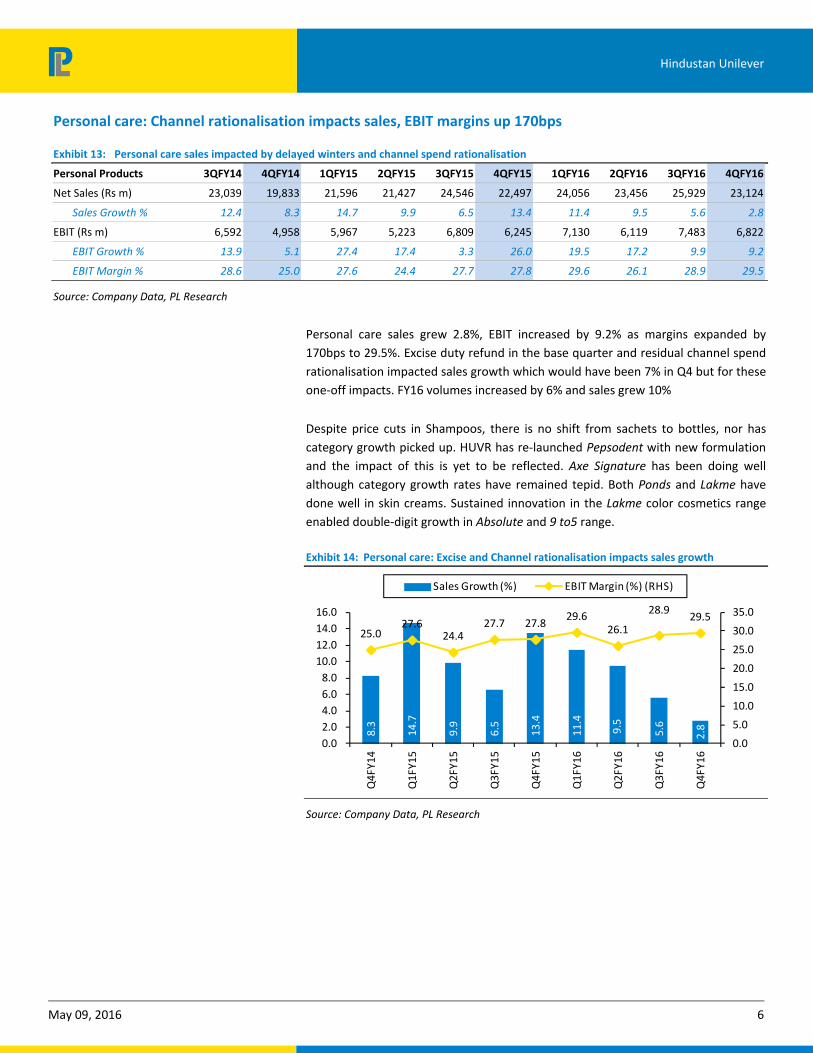
Personal care: Channel rationalisation impacts sales, EBIT margins up 170bps
Exhibit 13: Personal care sales impacted by delayed winters and channel spend rationalisation
Personal Products 3QFY14 4QFY14 1QFY15 2QFY15 3QFY15 4QFY15 1QFY16 2QFY16 3QFY16 4QFY16
Net Sales (Rs m) 23,039 19,833 21,596 21,427 24,546 22,497 24,056 23,456 25,929 23,124
Sales Growth % 12.4 8.3 14.7 9.9 6.5 13.4 11.4 9.5 5.6 2.8
EBIT (Rs m) 6,592 4,958 5,967 5,223 6,809 6,245 7,130 6,119 7,483 6,822
EBIT Growth % 13.9 5.1 27.4 17.4 3.3 26.0 19.5 17.2 9.9 9.2
EBIT Margin % 28.6 25.0 27.6 24.4 27.7 27.8 29.6 26.1 28.9 29.5
Source: Company Data, PL Research
Personal care sales grew 2.8%, EBIT increased by 9.2% as margins expanded by
170bps to 29.5%. Excise duty refund in the base quarter and residual channel spend
rationalisation impacted sales growth which would have been 7% in Q4 but for these
one‐off impacts. FY16 volumes increased by 6% and sales grew 10%
Despite price cuts in Shampoos, there is no shift from sachets to bottles, nor has
category growth picked up. HUVR has re‐launched Pepsodent with new formulation
and the impact of this is yet to be reflected. Axe Signature has been doing well
although category growth rates have remained tepid. Both Ponds and Lakme have
done well in skin creams. Sustained innovation in the Lakme color cosmetics range
enabled double‐digit growth in Absolute and 9 to5 range.
Exhibit 14: Personal care: Excise and Channel rationalisation impacts sales growth
8.3
14.7
9.9
6.5
13.4
11.4
9.5
5.6
2.8
25.0 27.6
24.4 27.7 27.8
29.6 26.1
28.9 29.5
0.0
5.0
10.0
15.0
20.0
25.0
30.0
35.0
0.0
2.0
4.0
6.0
8.0
10.0
12.0
14.0
16.0
Q4FY14
Q1FY15
Q2FY15
Q3FY15
Q4FY15
Q1FY16
Q2FY16
Q3FY16
Q4FY16
Sales Growth (%) EBIT Margin (%) (RHS)
Source: Company Data, PL Research
May 09, 2016 7
Hindustan Unilever
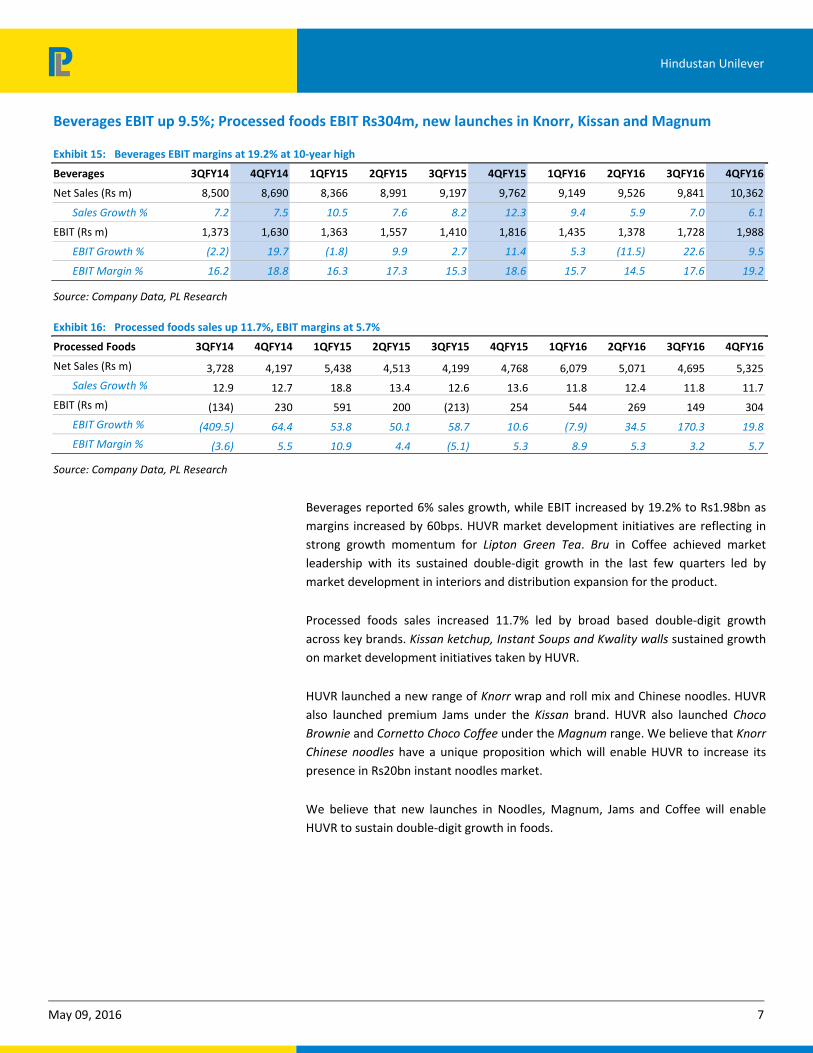
Beverages EBIT up 9.5%; Processed foods EBIT Rs304m, new launches in Knorr, Kissan and Magnum
Exhibit 15: Beverages EBIT margins at 19.2% at 10‐year high
Beverages 3QFY14 4QFY14 1QFY15 2QFY15 3QFY15 4QFY15 1QFY16 2QFY16 3QFY16 4QFY16
Net Sales (Rs m) 8,500 8,690 8,366 8,991 9,197 9,762 9,149 9,526 9,841 10,362
Sales Growth % 7.2 7.5 10.5 7.6 8.2 12.3 9.4 5.9 7.0 6.1
EBIT (Rs m) 1,373 1,630 1,363 1,557 1,410 1,816 1,435 1,378 1,728 1,988
EBIT Growth % (2.2) 19.7 (1.8) 9.9 2.7 11.4 5.3 (11.5) 22.6 9.5
EBIT Margin % 16.2 18.8 16.3 17.3 15.3 18.6 15.7 14.5 17.6 19.2
Source: Company Data, PL Research
Exhibit 16: Processed foods sales up 11.7%, EBIT margins at 5.7%
Processed Foods 3QFY14 4QFY14 1QFY15 2QFY15 3QFY15 4QFY15 1QFY16 2QFY16 3QFY16 4QFY16
Net Sales (Rs m) 3,728 4,197 5,438 4,513 4,199 4,768 6,079 5,071 4,695 5,325
Sales Growth % 12.9 12.7 18.8 13.4 12.6 13.6 11.8 12.4 11.8 11.7
EBIT (Rs m) (134) 230 591 200 (213) 254 544 269 149 304
EBIT Growth % (409.5) 64.4 53.8 50.1 58.7 10.6 (7.9) 34.5 170.3 19.8
EBIT Margin % (3.6) 5.5 10.9 4.4 (5.1) 5.3 8.9 5.3 3.2 5.7
Source: Company Data, PL Research
Beverages reported 6% sales growth, while EBIT increased by 19.2% to Rs1.98bn as
margins increased by 60bps. HUVR market development initiatives are reflecting in
strong growth momentum for Lipton Green Tea. Bru in Coffee achieved market
leadership with its sustained double‐digit growth in the last few quarters led by
market development in interiors and distribution expansion for the product.
Processed foods sales increased 11.7% led by broad based double‐digit growth
across key brands. Kissan ketchup, Instant Soups and Kwality walls sustained growth
on market development initiatives taken by HUVR.
HUVR launched a new range of Knorr wrap and roll mix and Chinese noodles. HUVR
also launched premium Jams under the Kissan brand. HUVR also launched Choco
Brownie and Cornetto Choco Coffee under the Magnum range. We believe that Knorr
Chinese noodles have a unique proposition which will enable HUVR to increase its
presence in Rs20bn instant noodles market.
We believe that new launches in Noodles, Magnum, Jams and Coffee will enable
HUVR to sustain double‐digit growth in foods.
May 09, 2016 8
Hindustan Unilever
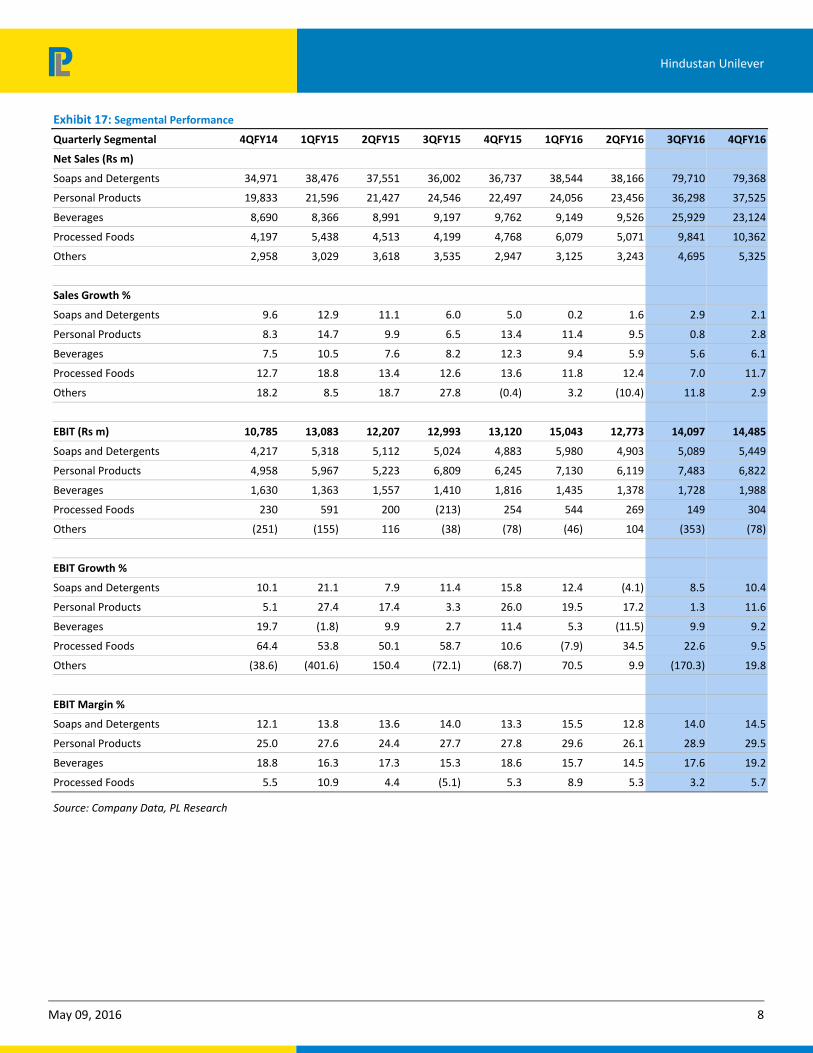
Exhibit 17: Segmental Performance
Quarterly Segmental 4QFY14 1QFY15 2QFY15 3QFY15 4QFY15 1QFY16 2QFY16 3QFY16 4QFY16
Net Sales (Rs m)
Soaps and Detergents 34,971 38,476 37,551 36,002 36,737 38,544 38,166 79,710 79,368
Personal Products 19,833 21,596 21,427 24,546 22,497 24,056 23,456 36,298 37,525
Beverages 8,690 8,366 8,991 9,197 9,762 9,149 9,526 25,929 23,124
Processed Foods 4,197 5,438 4,513 4,199 4,768 6,079 5,071 9,841 10,362
Others 2,958 3,029 3,618 3,535 2,947 3,125 3,243 4,695 5,325
Sales Growth %
Soaps and Detergents 9.6 12.9 11.1 6.0 5.0 0.2 1.6 2.9 2.1
Personal Products 8.3 14.7 9.9 6.5 13.4 11.4 9.5 0.8 2.8
Beverages 7.5 10.5 7.6 8.2 12.3 9.4 5.9 5.6 6.1
Processed Foods 12.7 18.8 13.4 12.6 13.6 11.8 12.4 7.0 11.7
Others 18.2 8.5 18.7 27.8 (0.4) 3.2 (10.4) 11.8 2.9
EBIT (Rs m) 10,785 13,083 12,207 12,993 13,120 15,043 12,773 14,097 14,485
Soaps and Detergents 4,217 5,318 5,112 5,024 4,883 5,980 4,903 5,089 5,449
Personal Products 4,958 5,967 5,223 6,809 6,245 7,130 6,119 7,483 6,822
Beverages 1,630 1,363 1,557 1,410 1,816 1,435 1,378 1,728 1,988
Processed Foods 230 591 200 (213) 254 544 269 149 304
Others (251) (155) 116 (38) (78) (46) 104 (353) (78)
EBIT Growth %
Soaps and Detergents 10.1 21.1 7.9 11.4 15.8 12.4 (4.1) 8.5 10.4
Personal Products 5.1 27.4 17.4 3.3 26.0 19.5 17.2 1.3 11.6
Beverages 19.7 (1.8) 9.9 2.7 11.4 5.3 (11.5) 9.9 9.2
Processed Foods 64.4 53.8 50.1 58.7 10.6 (7.9) 34.5 22.6 9.5
Others (38.6) (401.6) 150.4 (72.1) (68.7) 70.5 9.9 (170.3) 19.8
EBIT Margin %
Soaps and Detergents 12.1 13.8 13.6 14.0 13.3 15.5 12.8 14.0 14.5
Personal Products 25.0 27.6 24.4 27.7 27.8 29.6 26.1 28.9 29.5
Beverages 18.8 16.3 17.3 15.3 18.6 15.7 14.5 17.6 19.2
Processed Foods 5.5 10.9 4.4 (5.1) 5.3 8.9 5.3 3.2 5.7
Source: Company Data, PL Research
May 09, 2016 9
Hindustan Unilever
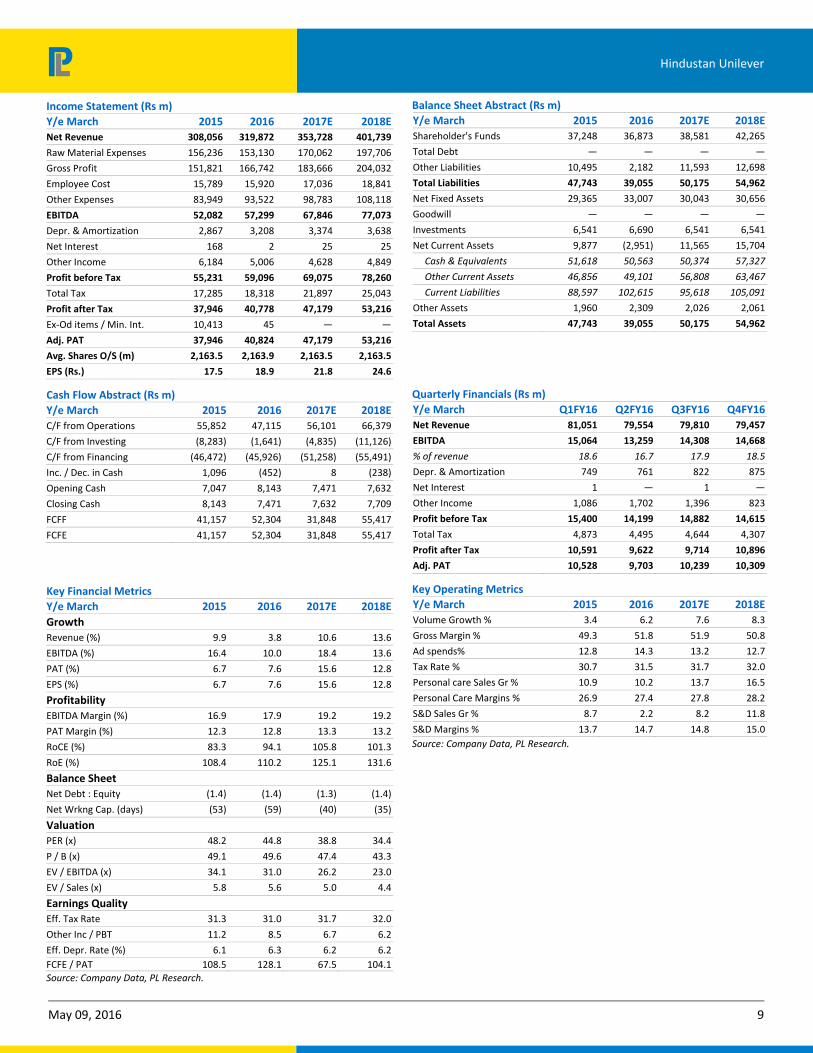
Income Statement (Rs m)
Y/e March 2015 2016 2017E 2018E
Net Revenue 308,056 319,872 353,728 401,739
Raw Material Expenses 156,236 153,130 170,062 197,706
Gross Profit 151,821 166,742 183,666 204,032
Employee Cost 15,789 15,920 17,036 18,841
Other Expenses 83,949 93,522 98,783 108,118
EBITDA 52,082 57,299 67,846 77,073
Depr. & Amortization 2,867 3,208 3,374 3,638
Net Interest 168 2 25 25
Other Income 6,184 5,006 4,628 4,849
Profit before Tax 55,231 59,096 69,075 78,260
Total Tax 17,285 18,318 21,897 25,043
Profit after Tax 37,946 40,778 47,179 53,216
Ex‐Od items / Min. Int. 10,413 45 — —
Adj. PAT 37,946 40,824 47,179 53,216
Avg. Shares O/S (m) 2,163.5 2,163.9 2,163.5 2,163.5
EPS (Rs.) 17.5 18.9 21.8 24.6
Cash Flow Abstract (Rs m)
Y/e March 2015 2016 2017E 2018E
C/F from Operations 55,852 47,115 56,101 66,379
C/F from Investing (8,283) (1,641) (4,835) (11,126)
C/F from Financing (46,472) (45,926) (51,258) (55,491)
Inc. / Dec. in Cash 1,096 (452) 8 (238)
Opening Cash 7,047 8,143 7,471 7,632
Closing Cash 8,143 7,471 7,632 7,709
FCFF 41,157 52,304 31,848 55,417
FCFE 41,157 52,304 31,848 55,417
Key Financial Metrics
Y/e March 2015 2016 2017E 2018E
Growth
Revenue (%) 9.9 3.8 10.6 13.6
EBITDA (%) 16.4 10.0 18.4 13.6
PAT (%) 6.7 7.6 15.6 12.8
EPS (%) 6.7 7.6 15.6 12.8
Profitability
EBITDA Margin (%) 16.9 17.9 19.2 19.2
PAT Margin (%) 12.3 12.8 13.3 13.2
RoCE (%) 83.3 94.1 105.8 101.3
RoE (%) 108.4 110.2 125.1 131.6
Balance Sheet
Net Debt : Equity (1.4) (1.4) (1.3) (1.4)
Net Wrkng Cap. (days) (53) (59) (40) (35)
Valuation
PER (x) 48.2 44.8 38.8 34.4
P / B (x) 49.1 49.6 47.4 43.3
EV / EBITDA (x) 34.1 31.0 26.2 23.0
EV / Sales (x) 5.8 5.6 5.0 4.4
Earnings Quality
Eff. Tax Rate 31.3 31.0 31.7 32.0
Other Inc / PBT 11.2 8.5 6.7 6.2
Eff. Depr. Rate (%) 6.1 6.3 6.2 6.2
FCFE / PAT 108.5 128.1 67.5 104.1
Source: Company Data, PL Research.
Balance Sheet Abstract (Rs m)
Y/e March 2015 2016 2017E 2018E
Shareholder's Funds 37,248 36,873 38,581 42,265
Total Debt — — — —
Other Liabilities 10,495 2,182 11,593 12,698
Total Liabilities 47,743 39,055 50,175 54,962
Net Fixed Assets 29,365 33,007 30,043 30,656
Goodwill — — — —
Investments 6,541 6,690 6,541 6,541
Net Current Assets 9,877 (2,951) 11,565 15,704
Cash & Equivalents 51,618 50,563 50,374 57,327
Other Current Assets 46,856 49,101 56,808 63,467
Current Liabilities 88,597 102,615 95,618 105,091
Other Assets 1,960 2,309 2,026 2,061
Total Assets 47,743 39,055 50,175 54,962
Quarterly Financials (Rs m)
Y/e March Q1FY16 Q2FY16 Q3FY16 Q4FY16
Net Revenue 81,051 79,554 79,810 79,457
EBITDA 15,064 13,259 14,308 14,668
% of revenue 18.6 16.7 17.9 18.5
Depr. & Amortization 749 761 822 875
Net Interest 1 — 1 —
Other Income 1,086 1,702 1,396 823
Profit before Tax 15,400 14,199 14,882 14,615
Total Tax 4,873 4,495 4,644 4,307
Profit after Tax 10,591 9,622 9,714 10,896
Adj. PAT 10,528 9,703 10,239 10,309
Key Operating Metrics
Y/e March 2015 2016 2017E 2018E
Volume Growth % 3.4 6.2 7.6 8.3
Gross Margin % 49.3 51.8 51.9 50.8
Ad spends% 12.8 14.3 13.2 12.7
Tax Rate % 30.7 31.5 31.7 32.0
Personal care Sales Gr % 10.9 10.2 13.7 16.5
Personal Care Margins % 26.9 27.4 27.8 28.2
S&D Sales Gr % 8.7 2.2 8.2 11.8
S&D Margins % 13.7 14.7 14.8 15.0
Source: Company Data, PL Research.
May 09, 2016 10
Hindustan Unilever
Prabhudas Lilladher Pvt. Ltd.
3rd Floor, Sadhana House, 570, P. B. Marg, Worli, Mumbai‐400 018, India
Tel: (91 22) 6632 2222 Fax: (91 22) 6632 2209
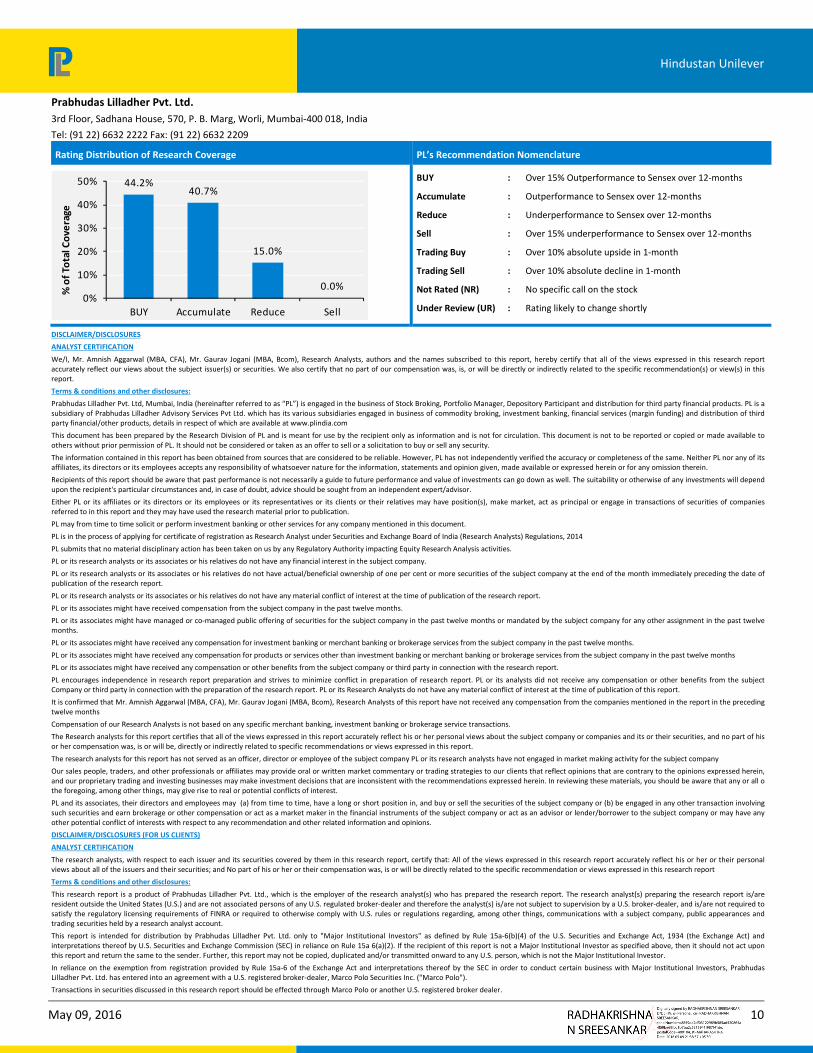
Rating Distribution of Research Coverage PL’s Recommendation Nomenclature
44.2%40.7%
15.0%
0.0%0%
10%
20%
30%
40%
50%
BUY Accumulate Reduce Sell
% of Total Coverage
BUY : Over 15% Outperformance to Sensex over 12‐months
Accumulate : Outperformance to Sensex over 12‐months
Reduce : Underperformance to Sensex over 12‐months
Sell : Over 15% underperformance to Sensex over 12‐months
Trading Buy : Over 10% absolute upside in 1‐month
Trading Sell : Over 10% absolute decline in 1‐month
Not Rated (NR) : No specific call on the stock
Under Review (UR) : Rating likely to change shortly
DISCLAIMER/DISCLOSURES
ANALYST CERTIFICATION
We/I, Mr. Amnish Aggarwal (MBA, CFA), Mr. Gaurav Jogani (MBA, Bcom), Research Analysts, authors and the names subscribed to this report, hereby certify that all of the views expressed in this research report accurately reflect our views about the subject issuer(s) or securities. We also certify that no part of our compensation was, is, or will be directly or indirectly related to the specific recommendation(s) or view(s) in this report.
Terms & conditions and other disclosures:
Prabhudas Lilladher Pvt. Ltd, Mumbai, India (hereinafter referred to as “PL”) is engaged in the business of Stock Broking, Portfolio Manager, Depository Participant and distribution for third party financial products. PL is a subsidiary of Prabhudas Lilladher Advisory Services Pvt Ltd. which has its various subsidiaries engaged in business of commodity broking, investment banking, financial services (margin funding) and distribution of third party financial/other products, details in respect of which are available at www.plindia.com
This document has been prepared by the Research Division of PL and is meant for use by the recipient only as information and is not for circulation. This document is not to be reported or copied or made available to others without prior permission of PL. It should not be considered or taken as an offer to sell or a solicitation to buy or sell any security.
The information contained in this report has been obtained from sources that are considered to be reliable. However, PL has not independently verified the accuracy or completeness of the same. Neither PL nor any of its affiliates, its directors or its employees accepts any responsibility of whatsoever nature for the information, statements and opinion given, made available or expressed herein or for any omission therein.
Recipients of this report should be aware that past performance is not necessarily a guide to future performance and value of investments can go down as well. The suitability or otherwise of any investments will depend upon the recipient's particular circumstances and, in case of doubt, advice should be sought from an independent expert/advisor.
Either PL or its affiliates or its directors or its employees or its representatives or its clients or their relatives may have position(s), make market, act as principal or engage in transactions of securities of companies referred to in this report and they may have used the research material prior to publication.
PL may from time to time solicit or perform investment banking or other services for any company mentioned in this document.
PL is in the process of applying for certificate of registration as Research Analyst under Securities and Exchange Board of India (Research Analysts) Regulations, 2014
PL submits that no material disciplinary action has been taken on us by any Regulatory Authority impacting Equity Research Analysis activities.
PL or its research analysts or its associates or his relatives do not have any financial interest in the subject company.
PL or its research analysts or its associates or his relatives do not have actual/beneficial ownership of one per cent or more securities of the subject company at the end of the month immediately preceding the date of publication of the research report.
PL or its research analysts or its associates or his relatives do not have any material conflict of interest at the time of publication of the research report.
PL or its associates might have received compensation from the subject company in the past twelve months.
PL or its associates might have managed or co‐managed public offering of securities for the subject company in the past twelve months or mandated by the subject company for any other assignment in the past twelve months.
PL or its associates might have received any compensation for investment banking or merchant banking or brokerage services from the subject company in the past twelve months.
PL or its associates might have received any compensation for products or services other than investment banking or merchant banking or brokerage services from the subject company in the past twelve months
PL or its associates might have received any compensation or other benefits from the subject company or third party in connection with the research report.
PL encourages independence in research report preparation and strives to minimize conflict in preparation of research report. PL or its analysts did not receive any compensation or other benefits from the subject Company or third party in connection with the preparation of the research report. PL or its Research Analysts do not have any material conflict of interest at the time of publication of this report.
It is confirmed that Mr. Amnish Aggarwal (MBA, CFA), Mr. Gaurav Jogani (MBA, Bcom), Research Analysts of this report have not received any compensation from the companies mentioned in the report in the preceding twelve months
Compensation of our Research Analysts is not based on any specific merchant banking, investment banking or brokerage service transactions.
The Research analysts for this report certifies that all of the views expressed in this report accurately reflect his or her personal views about the subject company or companies and its or their securities, and no part of his or her compensation was, is or will be, directly or indirectly related to specific recommendations or views expressed in this report.
The research analysts for this report has not served as an officer, director or employee of the subject company PL or its research analysts have not engaged in market making activity for the subject company
Our sales people, traders, and other professionals or affiliates may provide oral or written market commentary or trading strategies to our clients that reflect opinions that are contrary to the opinions expressed herein, and our proprietary trading and investing businesses may make investment decisions that are inconsistent with the recommendations expressed herein. In reviewing these materials, you should be aware that any or all o the foregoing, among other things, may give rise to real or potential conflicts of interest.
PL and its associates, their directors and employees may (a) from time to time, have a long or short position in, and buy or sell the securities of the subject company or (b) be engaged in any other transaction involving such securities and earn brokerage or other compensation or act as a market maker in the financial instruments of the subject company or act as an advisor or lender/borrower to the subject company or may have any other potential conflict of interests with respect to any recommendation and other related information and opinions.
DISCLAIMER/DISCLOSURES (FOR US CLIENTS)
ANALYST CERTIFICATION
The research analysts, with respect to each issuer and its securities covered by them in this research report, certify that: All of the views expressed in this research report accurately reflect his or her or their personal views about all of the issuers and their securities; and No part of his or her or their compensation was, is or will be directly related to the specific recommendation or views expressed in this research report
Terms & conditions and other disclosures:
This research report is a product of Prabhudas Lilladher Pvt. Ltd., which is the employer of the research analyst(s) who has prepared the research report. The research analyst(s) preparing the research report is/are resident outside the United States (U.S.) and are not associated persons of any U.S. regulated broker‐dealer and therefore the analyst(s) is/are not subject to supervision by a U.S. broker‐dealer, and is/are not required to satisfy the regulatory licensing requirements of FINRA or required to otherwise comply with U.S. rules or regulations regarding, among other things, communications with a subject company, public appearances and trading securities held by a research analyst account.
This report is intended for distribution by Prabhudas Lilladher Pvt. Ltd. only to "Major Institutional Investors" as defined by Rule 15a‐6(b)(4) of the U.S. Securities and Exchange Act, 1934 (the Exchange Act) and interpretations thereof by U.S. Securities and Exchange Commission (SEC) in reliance on Rule 15a 6(a)(2). If the recipient of this report is not a Major Institutional Investor as specified above, then it should not act upon this report and return the same to the sender. Further, this report may not be copied, duplicated and/or transmitted onward to any U.S. person, which is not the Major Institutional Investor.
In reliance on the exemption from registration provided by Rule 15a‐6 of the Exchange Act and interpretations thereof by the SEC in order to conduct certain business with Major Institutional Investors, Prabhudas Lilladher Pvt. Ltd. has entered into an agreement with a U.S. registered broker‐dealer, Marco Polo Securities Inc. ("Marco Polo").
Transactions in securities discussed in this research report should be effected through Marco Polo or another U.S. registered broker dealer.