Embed Size (px)
Citation preview
慈恵ICU勉強会 22/07/2014 阿部 まり子
Copyright 2014 American Medical Association. All rights reserved.
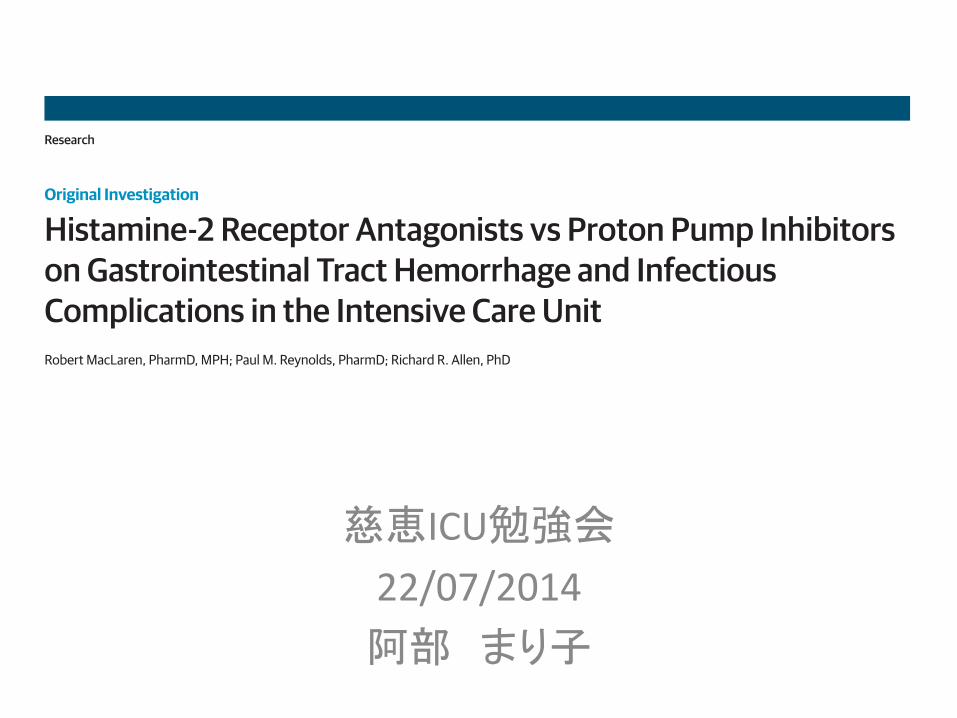
Histamine-2 Receptor Antagonists vs Proton Pump Inhibitorson Gastrointestinal Tract Hemorrhage and InfectiousComplications in the Intensive Care UnitRobert MacLaren, PharmD, MPH; Paul M. Reynolds, PharmD; Richard R. Allen, PhD
IMPORTANCE Histamine-2 receptor antagonists (H2RAs) and proton pump inhibitors (PPIs)are commonly used to prevent gastrointestinal tract (GI) hemorrhage in critically ill patients.The stronger acid suppression of PPIs may reduce the rate of bleeding but enhance infectiouscomplications, specifically pneumonia and Clostridium difficile infection (CDI).
OBJECTIVE To evaluate the occurrence and risk factors for GI hemorrhage, pneumonia, andCDI in critically ill patients.
DESIGN, SETTING, AND PARTICIPANTS A pharmacoepidemiological cohort study wasconducted of adult patients requiring mechanical ventilation for 24 hours or more andadministered either an H2RA or PPI for 48 hours or more while intubated across 71 hospitalsbetween January 1, 2003, and December 31, 2008. Propensity score–adjusted andpropensity-matched multivariate regression models were used to control for confounders.
MAIN OUTCOMES AND MEASURES Primary outcomes were secondary diagnoses ofInternational Classification of Diseases, Ninth Revision (ICD-9)–coded GI hemorrhage,pneumonia, and CDI occurring 48 hours or more after initiating invasive ventilation.
RESULTS Of 35 312 patients, 13 439 (38.1%) received H2RAs and 21 873 (61.9%) receivedPPIs. Gastrointestinal hemorrhage (2.1% vs 5.9%; P < .001), pneumonia (27% vs 38.6%;P < .001), and CDI (2.2% vs 3.8%; P < .001) occurred less frequently in the H2RA group. Afteradjusting for propensity score and covariates, odds ratios of GI hemorrhage (2.24; 95% CI,1.81-2.76), pneumonia (1.2; 95% CI, 1.03-1.41), and CDI (1.29; 95% CI, 1.04-1.64) were greaterwith PPIs. Similar results were obtained in the propensity-matched models of 8799 patientsin each cohort.
CONCLUSIONS AND RELEVANCE Proton pump inhibitors are associated with greater risks of GIhemorrhage, pneumonia, and CDI than H2RAs in mechanically ventilated patients. Numerousother risk factors are apparent. These data warrant confirmation in comparative prospectivestudies.
JAMA Intern Med. 2014;174(4):564-574. doi:10.1001/jamainternmed.2013.14673Published online February 17, 2014.
Invited Commentary page 574
Supplemental content atjamainternalmedicine.com
Author Affiliations: Department ofClinical Pharmacy, University ofColorado Skaggs School of Pharmacyand Pharmaceutical Sciences, Aurora(MacLaren); Department ofPharmacy, University of ColoradoHospital, Aurora (Reynolds); PeakStatistical Services, Evergreen,Colorado (Allen).
Corresponding Author: RobertMacLaren, PharmD, MPH,Department of Clinical Pharmacy,University of Colorado Skaggs Schoolof Pharmacy and PharmaceuticalSciences, 12850 E Montview Blvd,Campus Box C238, Pharmacy andPharmaceutical Sciences Bldg,Aurora, CO 80045 ([email protected]).
Research
Original Investigation
564 jamainternalmedicine.com
Copyright 2014 American Medical Association. All rights reserved.
Downloaded From: http://archinte.jamanetwork.com/ by a Gakko Hojin Jikei Daigaku User on 06/09/2014
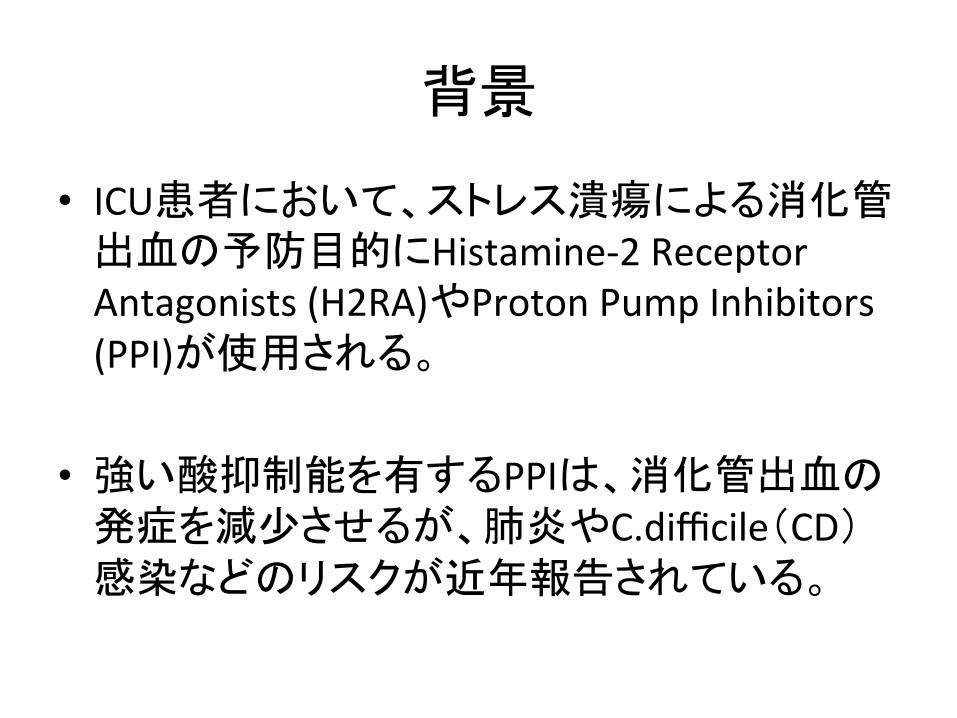
背景
• ICU患者において、ストレス潰瘍による消化管出血の予防目的にHistamine-‐2 Receptor Antagonists (H2RA)やProton Pump Inhibitors (PPI)が使用される。
• 強い酸抑制能を有するPPIは、消化管出血の
発症を減少させるが、肺炎やC.difficile(CD)感染などのリスクが近年報告されている。

Randomized, double-‐blind comparison of immediate-‐release omeprazole oral suspension versus intravenous cime7dine for the preven7on of upper gastrointes7nal bleeding in cri7cally ill pa7ents
Crit Care Med 2005 ; 33 : 760-‐765
PPIとH2RAとで,上部消化管出血予防効果と胃内pHを比較検討
Design: prospecMve, randomized, double-‐blinded trial
SeQng: アメリカのICU 47施設
PaMents: 48時間以上の人工呼吸管理を必要とするICU患者359人
IntervenMon: omeprazole; 初回40mgx2, 翌日40mg x1 (oral or N-‐G) cimeMdine; 300 mg bolus, 50 mg/hr 14日間治療
PPI vs. H2RA
2011年7月12日勉強会「 ストレス潰瘍予防」参照

Randomized, double-‐blind comparison of immediate-‐release omeprazole oral suspension versus intravenous cime7dine for the preven7on of upper gastrointes7nal bleeding in cri7cally ill pa7ents
Crit Care Med 2005 ; 33 : 760-‐765
PPI vs. H2RA
消化管出血発生率 Omeprazole vs. Cimetidine : 34/178 (19.1%) vs. 58/181 ( 32.0%) (p=0.005) → Omeprazoleで有意に減少
胃内pH>6 Omeprazole vs. Cimetidine : 1 – 2.5 hr; 99.4% vs. 84.6% (p<0.001), 6hr; 92.0% vs. 87.0% (p<0.001) → Omeprazoleは胃内pHを有意に上げる
肺炎 Omeprazole vs. Cimetidine : 11.2% vs. 9.4% (p=0.61) 有意差なし 2011年7月12日勉強会「 ストレス潰瘍予防」参照
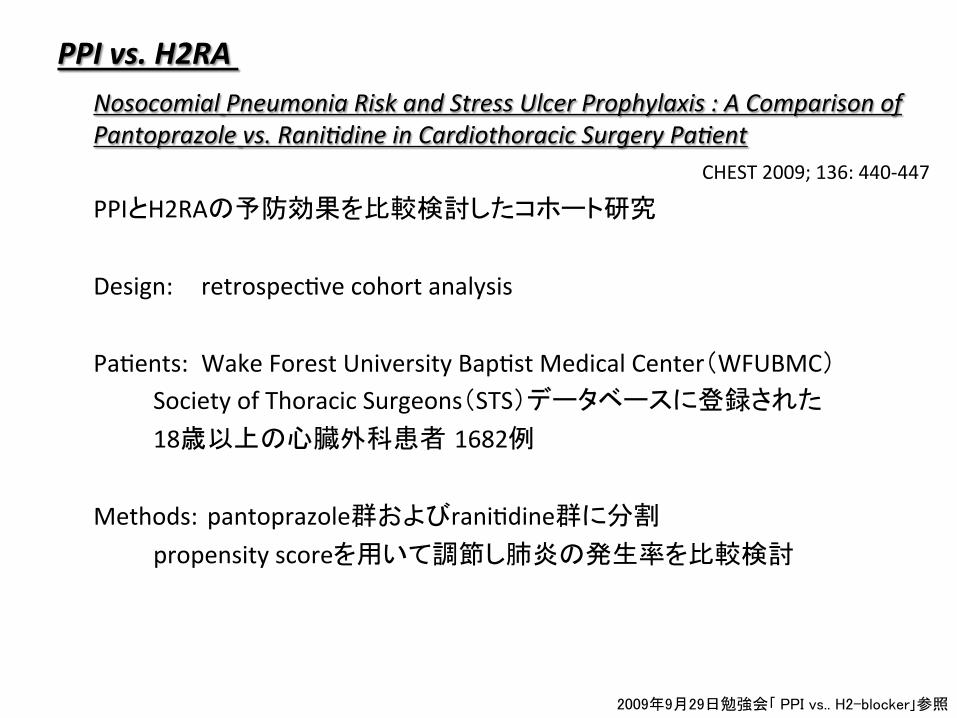
Nosocomial Pneumonia Risk and Stress Ulcer Prophylaxis : A Comparison of Pantoprazole vs. Rani7dine in Cardiothoracic Surgery Pa7ent
CHEST 2009; 136: 440-‐447 PPIとH2RAの予防効果を比較検討したコホート研究
Design: retrospecMve cohort analysis
PaMents: Wake Forest University BapMst Medical Center(WFUBMC) Society of Thoracic Surgeons(STS)データベースに登録された 18歳以上の心臓外科患者 1682例 Methods: pantoprazole群およびraniMdine群に分割
propensity scoreを用いて調節し肺炎の発生率を比較検討
PPI vs. H2RA
2009年9月29日勉強会「 PPI vs.. H2-blocker」参照
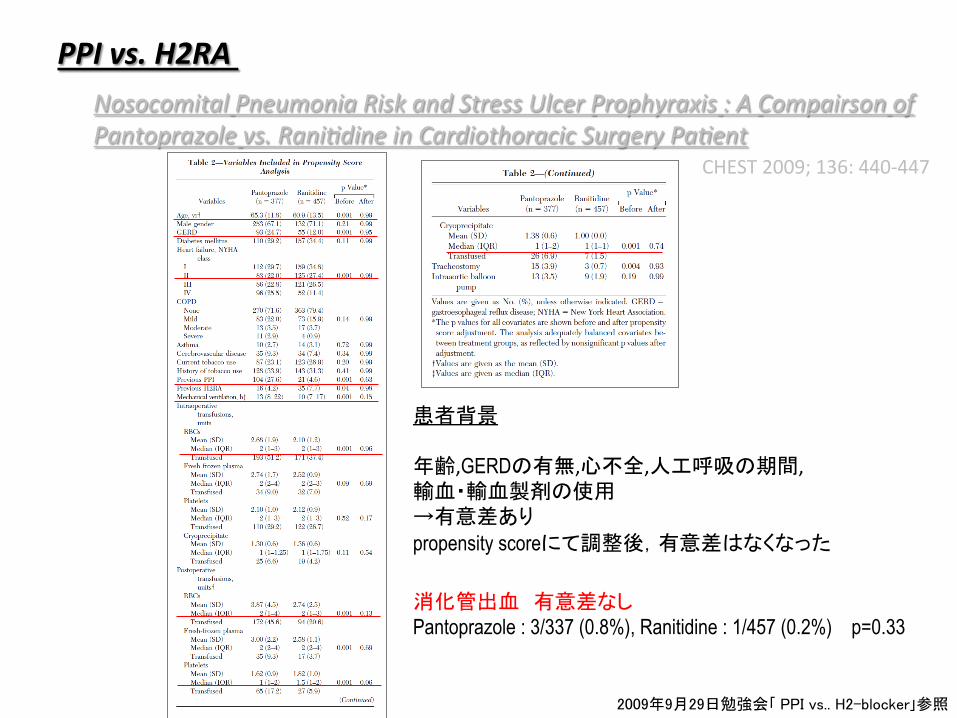
Nosocomital Pneumonia Risk and Stress Ulcer Prophyraxis : A Compairson of Pantoprazole vs. Rani7dine in Cardiothoracic Surgery Pa7ent
CHEST 2009; 136: 440-‐447
PPI vs. H2RA
患者背景 年齢,GERDの有無,心不全,人工呼吸の期間, 輸血・輸血製剤の使用 →有意差あり propensity scoreにて調整後,有意差はなくなった
消化管出血 有意差なし Pantoprazole : 3/337 (0.8%), Ranitidine : 1/457 (0.2%) p=0.33
2009年9月29日勉強会「 PPI vs.. H2-blocker」参照
Nosocomital Pneumonia Risk and Stress Ulcer Prophyraxis : A Compairson of Pantoprazole vs. Rani7dine in Cardiothoracic Surgery Pa7ent
CHEST 2009; 136: 440-‐447
PPI vs. H2RA
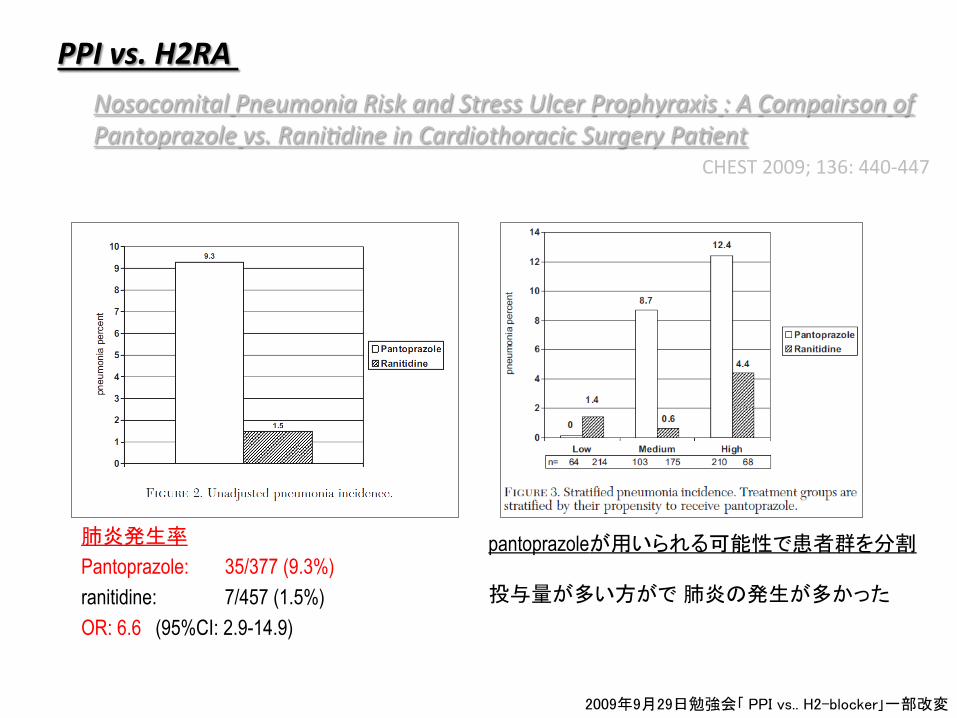
2009年9月29日勉強会「 PPI vs.. H2-blocker」一部改変
肺炎発生率 Pantoprazole: 35/377 (9.3%) ranitidine: 7/457 (1.5%) OR: 6.6 (95%CI: 2.9-14.9)
pantoprazoleが用いられる可能性で患者群を分割 投与量が多い方がで 肺炎の発生が多かった
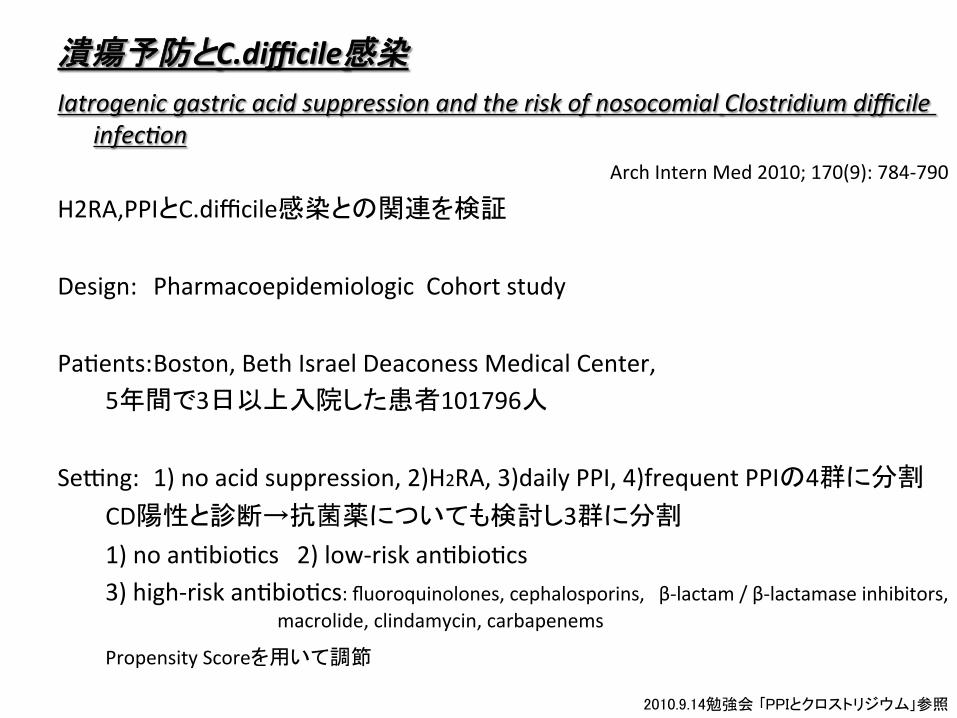
Iatrogenic gastric acid suppression and the risk of nosocomial Clostridium difficile infec7on
Arch Intern Med 2010; 170(9): 784-‐790 H2RA,PPIとC.difficile感染との関連を検証
Design: Pharmacoepidemiologic Cohort study PaMents: Boston, Beth Israel Deaconess Medical Center,
5年間で3日以上入院した患者101796人 SeQng: 1) no acid suppression, 2)H2RA, 3)daily PPI, 4)frequent PPIの4群に分割
CD陽性と診断→抗菌薬についても検討し3群に分割 1) no anMbioMcs 2) low-‐risk anMbioMcs 3) high-‐risk anMbioMcs: fluoroquinolones, cephalosporins, β-‐lactam / β-‐lactamase inhibitors, macrolide, clindamycin, carbapenems
Propensity Scoreを用いて調節
潰瘍予防とC.difficile感染
2010.9.14勉強会 「PPIとクロストリジウム」参照
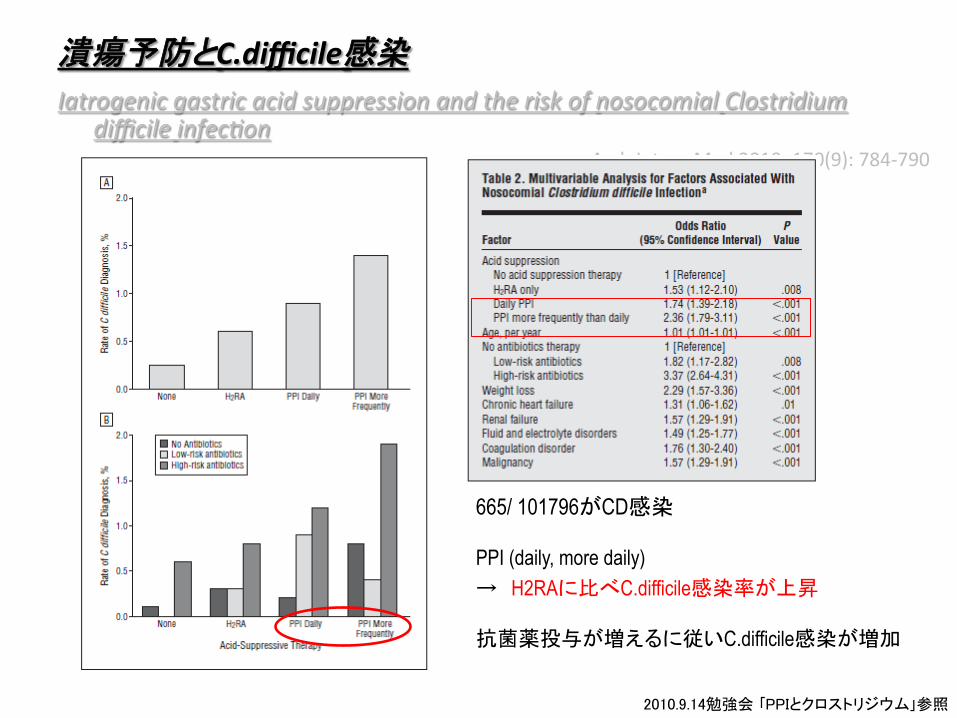
Iatrogenic gastric acid suppression and the risk of nosocomial Clostridium difficile infec7on
Arch Intern Med 2010; 170(9): 784-‐790
潰瘍予防とC.difficile感染
665/ 101796がCD感染
PPI (daily, more daily) → H2RAに比べC.difficile感染率が上昇
抗菌薬投与が増えるに従いC.difficile感染が増加
2010.9.14勉強会 「PPIとクロストリジウム」参照
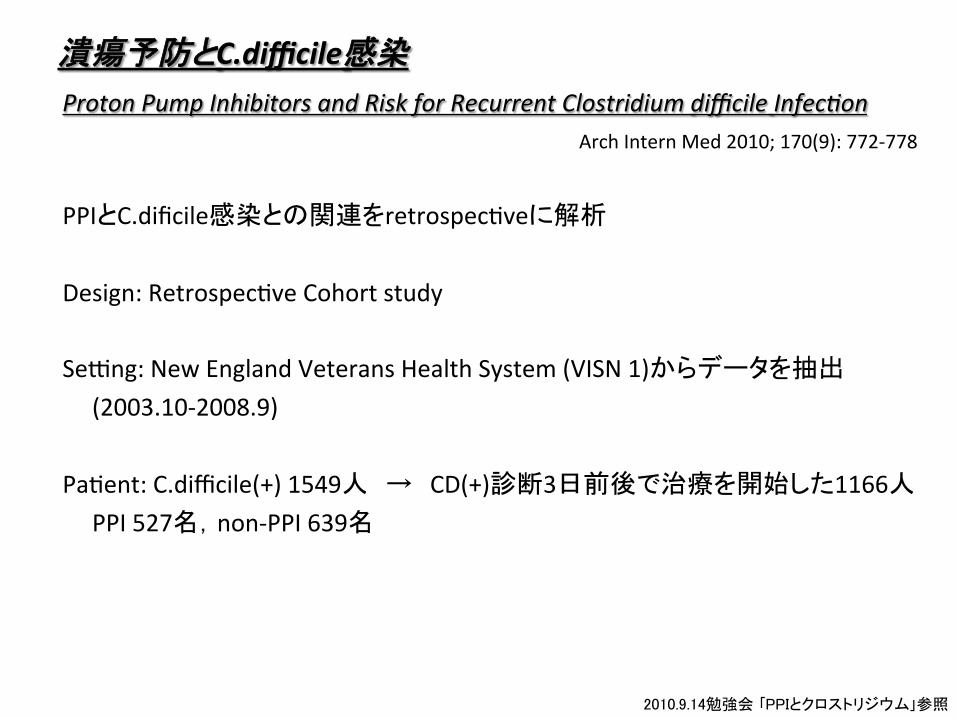
Proton Pump Inhibitors and Risk for Recurrent Clostridium difficile Infec7on Arch Intern Med 2010; 170(9): 772-‐778
PPIとC.dificile感染との関連をretrospecMveに解析 Design: RetrospecMve Cohort study
SeQng: New England Veterans Health System (VISN 1)からデータを抽出 (2003.10-‐2008.9) PaMent: C.difficile(+) 1549人 → CD(+)診断3日前後で治療を開始した1166人 PPI 527名,non-‐PPI 639名
潰瘍予防とC.difficile感染
2010.9.14勉強会 「PPIとクロストリジウム」参照
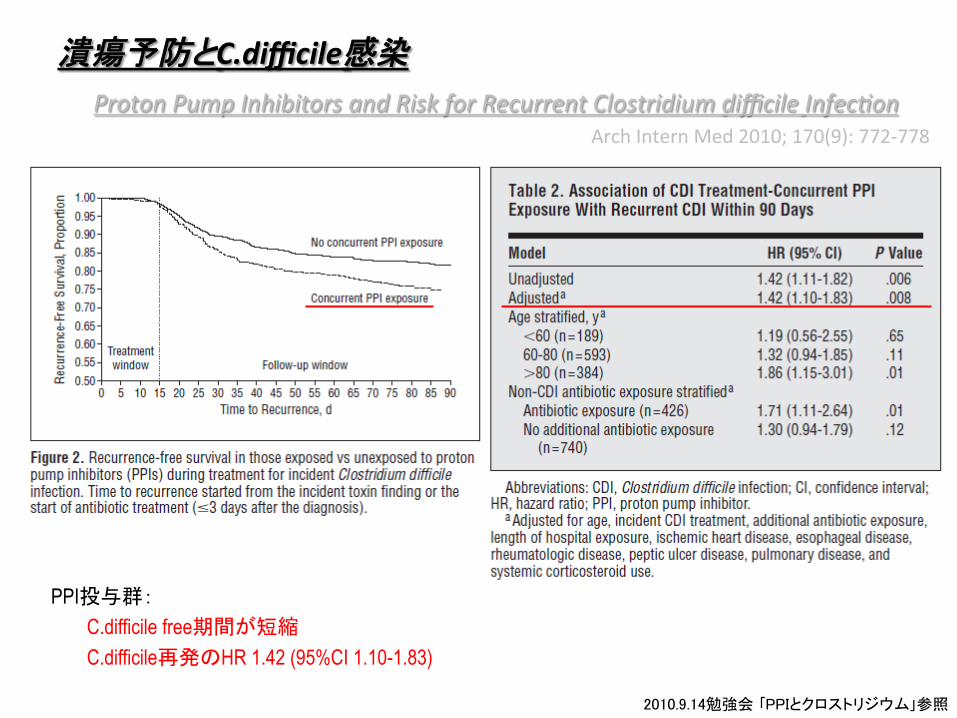
Proton Pump Inhibitors and Risk for Recurrent Clostridium difficile Infec7on Arch Intern Med 2010; 170(9): 772-‐778
seQng/paMent
method
潰瘍予防とC.difficile感染
PPI投与群: C.difficile free期間が短縮 C.difficile再発のHR 1.42 (95%CI 1.10-1.83)
2010.9.14勉強会 「PPIとクロストリジウム」参照
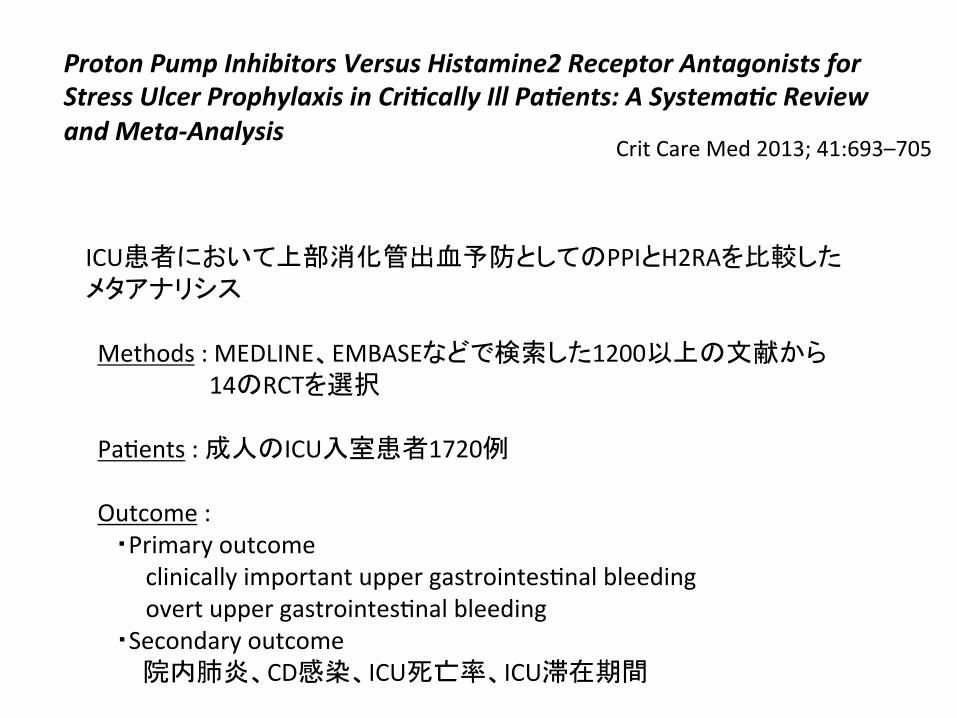
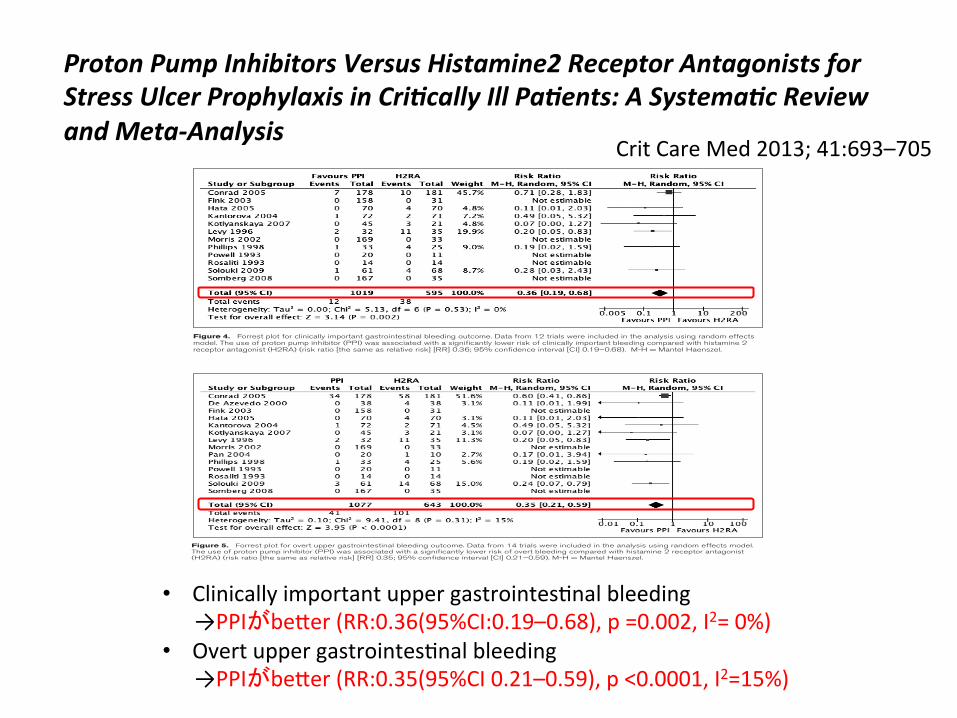
Proton Pump Inhibitors Versus Histamine2 Receptor Antagonists for Stress Ulcer Prophylaxis in CriCcally Ill PaCents: A SystemaCc Review and Meta-‐Analysis Crit Care Med 2013; 41:693–705
ICU患者において上部消化管出血予防としてのPPIとH2RAを比較した メタアナリシス Methods : MEDLINE、EMBASEなどで検索した1200以上の文献から 14のRCTを選択 PaMents : 成人のICU入室患者1720例 Outcome : ・Primary outcome clinically important upper gastrointesMnal bleeding overt upper gastrointesMnal bleeding ・Secondary outcome 院内肺炎、CD感染、ICU死亡率、ICU滞在期間
Alhazzani et al
700 www.ccmjournal.org
Sensitivity AnalysisSensitivity analysis was conducted examining the effect of using risk difference as an estimate of effect for clinically im-portant bleeding (risk difference −0.03; 95% CI −0.05 to 0.00, p = 0.06, I 2 = 52%) and overt bleeding (risk difference −0.06; 95% CI −0.11 to −0.02, p = 0.009, I 2 = 80%), although signifi-cant heterogeneity was present. The second sensitivity analysis excluded trials pub lished in abstract form (22–25). Clinically important bleed ing (RR 0.42; 95% CI 0.21–0.84; p = 0.01;
I 2 = 0%) and overt bleeding (RR 0.40; 95% CI 0.25–0.67; p = 0.0004; I 2 = 12%) were significantly reduced, consistent with the main analysis.
DISCUSSIONIn this meta-analysis, we found that PPIs were more effective than H2RAs at preventing clinically important bleeding and overt gastrointestinal bleeding. The main reservation about using PPIs
Figure 4. Forrest plot for clinically important gastrointestinal bleeding outcome. Data from 12 trials were included in the analysis using random effects model. The use of proton pump inhibitor (PPI) was associated with a significantly lower risk of clinically important bleeding compared with histamine 2 receptor antagonist (H2RA) (risk ratio [the same as relative risk] [RR] 0.36; 95% confidence interval [CI] 0.19–0.68). M-H = Mantel Haenszel.
TABLE 3. Evidence Profile Using GRADE Approach
Quality Assessment No. of Patients Effect
QualityImpor-tance
No. of Stud-ies Design Risk of Bias Inconsistency Indirectness Imprecision
Proton Pump Inhibitor
Histamine 2 Receptor Antagonist
Relative (95% Confidence Interval) Absolute
Clinically important bleeding
12 Randomized trials
Seriousa No serious inconsistency
No serious indirectness
Serious imprecisionb
12/1019 (1.2%) 38/595 (6.4%) RR 0.36 (0.19–0.68) 46 fewer per 1000 (from 23 fewer to 58 fewer)
Low Critical
Overt upper gastrointestinal bleeding
14 Randomized trials
Seriousa No serious inconsistency
No serious indirectness
No serious imprecision
41/1077 (3.8%) 101/643 (15.7%) RR 0.35 (0.21–0.59) 113 fewer per 1000 (from 72 fewer to 138 fewer)
Moderate Important
Mortality
8 Randomized trials
Serious No serious inconsistency
No serious indirectness
No serious imprecision
127/726 (17.5%) 100/470 (21.2%) RR 1.01 (0.83–1.24) 0 fewer per 1000 (from 42 fewer to 51 more)
Moderate Critical
Nosocomial pneumonia
8
Randomized trials
Seriousa
No serious inconsistency
No serious indirectness
No serious imprecision
66/626 (10.5%) 50/474 (10.5%) RR 1.06 (0.73–1.52) 6 more per 1000 (from 28 fewer to 55 more)
Moderate Critical
This table is generated using the GRADEprofiler software that summarizes the quality of evidence for individual outcomes based on five main domains: risk of bias, inconsistency, indirectness, imprecision, and publication bias. For each outcome, the quality of evidence is presented along with the clinical importance of the outcome.aDowngraded for risk of bias mainly due to lack of or incomplete blinding.bDowngraded for low number of events rather than confidence interval. Feature Article
Critical Care Medicine www.ccmjournal.org 701
in the critical care setting rather than H2RAs is the potential to increase the incidence of nosocomial pneumonia (38, 39); how-ever, trials do not suggest such a difference. Mortality and length of ICU stay were not affected. None of the trials reported C. dif-ficile infection, although a systematic review of 12 observational studies evaluating 2,948 patients with C. difficile found an asso-ciation with antisecretory therapy (OR 1.94; 95% CI 1.37–2.75).
The association was present for PPI use (OR 2.05; 95% CI 1.47–2.85) and for H2RA use (OR 1.47; 95% CI 1.06–2.05), with no difference between PPIs and H2RAs (p = 0.17) (40).
There was no heterogeneity of results in this meta-analysis. Subgroup analyses examining dosing and frequency of PPI administration, and specific populations (medical vs. surgical ICU patients, and Asian vs. non-Asian patients) showed no sig-
Figure 5. Forrest plot for overt upper gastrointestinal bleeding outcome. Data from 14 trials were included in the analysis using random effects model. The use of proton pump inhibitor (PPI) was associated with a significantly lower risk of overt bleeding compared with histamine 2 receptor antagonist (H2RA) (risk ratio [the same as relative risk] [RR] 0.35; 95% confidence interval [CI] 0.21–0.59). M-H = Mantel Haenszel.
TABLE 3. Evidence Profile Using GRADE Approach
Quality Assessment No. of Patients Effect
QualityImpor-tance
No. of Stud-ies Design Risk of Bias Inconsistency Indirectness Imprecision
Proton Pump Inhibitor
Histamine 2 Receptor Antagonist
Relative (95% Confidence Interval) Absolute
Clinically important bleeding
12 Randomized trials
Seriousa No serious inconsistency
No serious indirectness
Serious imprecisionb
12/1019 (1.2%) 38/595 (6.4%) RR 0.36 (0.19–0.68) 46 fewer per 1000 (from 23 fewer to 58 fewer)
Low Critical
Overt upper gastrointestinal bleeding
14 Randomized trials
Seriousa No serious inconsistency
No serious indirectness
No serious imprecision
41/1077 (3.8%) 101/643 (15.7%) RR 0.35 (0.21–0.59) 113 fewer per 1000 (from 72 fewer to 138 fewer)
Moderate Important
Mortality
8 Randomized trials
Serious No serious inconsistency
No serious indirectness
No serious imprecision
127/726 (17.5%) 100/470 (21.2%) RR 1.01 (0.83–1.24) 0 fewer per 1000 (from 42 fewer to 51 more)
Moderate Critical
Nosocomial pneumonia
8
Randomized trials
Seriousa
No serious inconsistency
No serious indirectness
No serious imprecision
66/626 (10.5%) 50/474 (10.5%) RR 1.06 (0.73–1.52) 6 more per 1000 (from 28 fewer to 55 more)
Moderate Critical
This table is generated using the GRADEprofiler software that summarizes the quality of evidence for individual outcomes based on five main domains: risk of bias, inconsistency, indirectness, imprecision, and publication bias. For each outcome, the quality of evidence is presented along with the clinical importance of the outcome.aDowngraded for risk of bias mainly due to lack of or incomplete blinding.bDowngraded for low number of events rather than confidence interval.
• Clinically important upper gastrointesMnal bleeding →PPIがbejer (RR:0.36(95%CI:0.19–0.68), p =0.002, I2= 0%) • Overt upper gastrointesMnal bleeding →PPIがbejer (RR:0.35(95%CI 0.21–0.59), p <0.0001, I2=15%)
Proton Pump Inhibitors Versus Histamine2 Receptor Antagonists for Stress Ulcer Prophylaxis in CriCcally Ill PaCents: A SystemaCc Review and Meta-‐Analysis Crit Care Med 2013; 41:693–705
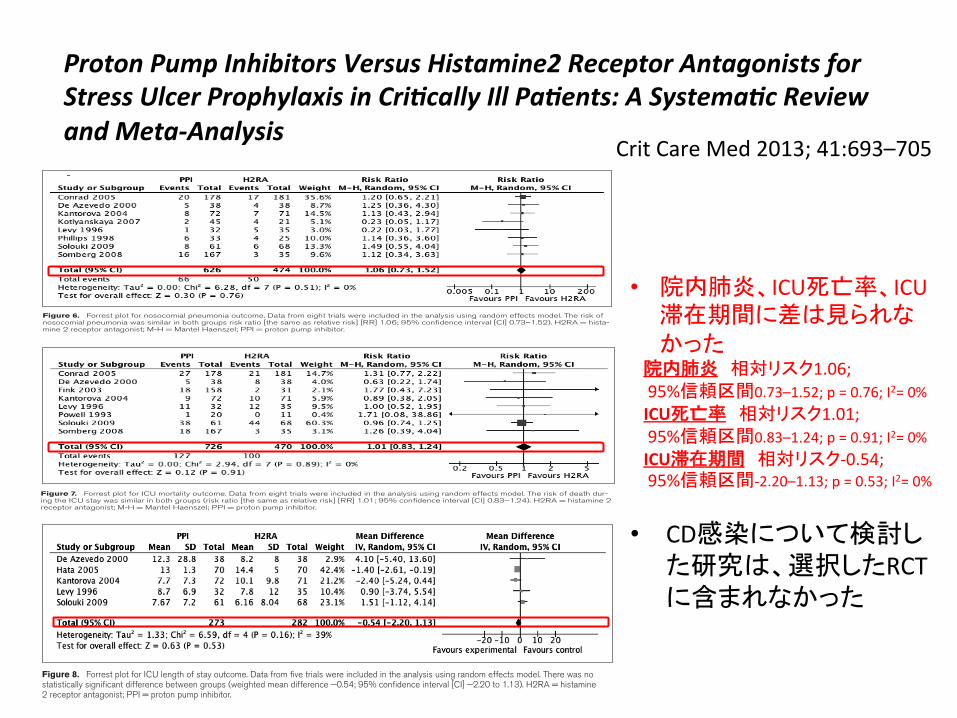
• CD感染について検討した研究は、選択したRCTに含まれなかった
Proton Pump Inhibitors Versus Histamine2 Receptor Antagonists for Stress Ulcer Prophylaxis in CriCcally Ill PaCents: A SystemaCc Review and Meta-‐Analysis Crit Care Med 2013; 41:693–705 Alhazzani et al
702 www.ccmjournal.org
Figure 6. Forrest plot for nosocomial pneumonia outcome. Data from eight trials were included in the analysis using random effects model. The risk of nosocomial pneumonia was similar in both groups risk ratio [the same as relative risk] [RR] 1.06; 95% confidence interval [CI] 0.73–1.52). H2RA = hista-mine 2 receptor antagonist; M-H = Mantel Haenszel; PPI = proton pump inhibitor.
Figure 7. Forrest plot for ICU mortality outcome. Data from eight trials were included in the analysis using random effects model. The risk of death dur-ing the ICU stay was similar in both groups (risk ratio [the same as relative risk] [RR] 1.01; 95% confidence interval [CI] 0.83–1.24). H2RA = histamine 2 receptor antagonist; M-H = Mantel Haenszel; PPI = proton pump inhibitor.
Figure 8. Forrest plot for ICU length of stay outcome. Data from five trials were included in the analysis using random effects model. There was no statistically significant difference between groups (weighted mean difference −0.54; 95% confidence interval [CI] −2.20 to 1.13). H2RA = histamine 2 receptor antagonist; PPI = proton pump inhibitor.
Alhazzani et al
702 www.ccmjournal.org
Figure 6. Forrest plot for nosocomial pneumonia outcome. Data from eight trials were included in the analysis using random effects model. The risk of nosocomial pneumonia was similar in both groups risk ratio [the same as relative risk] [RR] 1.06; 95% confidence interval [CI] 0.73–1.52). H2RA = hista-mine 2 receptor antagonist; M-H = Mantel Haenszel; PPI = proton pump inhibitor.
Figure 7. Forrest plot for ICU mortality outcome. Data from eight trials were included in the analysis using random effects model. The risk of death dur-ing the ICU stay was similar in both groups (risk ratio [the same as relative risk] [RR] 1.01; 95% confidence interval [CI] 0.83–1.24). H2RA = histamine 2 receptor antagonist; M-H = Mantel Haenszel; PPI = proton pump inhibitor.
Figure 8. Forrest plot for ICU length of stay outcome. Data from five trials were included in the analysis using random effects model. There was no statistically significant difference between groups (weighted mean difference −0.54; 95% confidence interval [CI] −2.20 to 1.13). H2RA = histamine 2 receptor antagonist; PPI = proton pump inhibitor.
• 院内肺炎、ICU死亡率、ICU滞在期間に差は見られなかった
院内肺炎 相対リスク1.06; 95%信頼区間0.73–1.52; p = 0.76; I2= 0% ICU死亡率 相対リスク1.01; 95%信頼区間0.83–1.24; p = 0.91; I2= 0% ICU滞在期間 相対リスク-‐0.54; 95%信頼区間-‐2.20–1.13; p = 0.53; I2= 0%
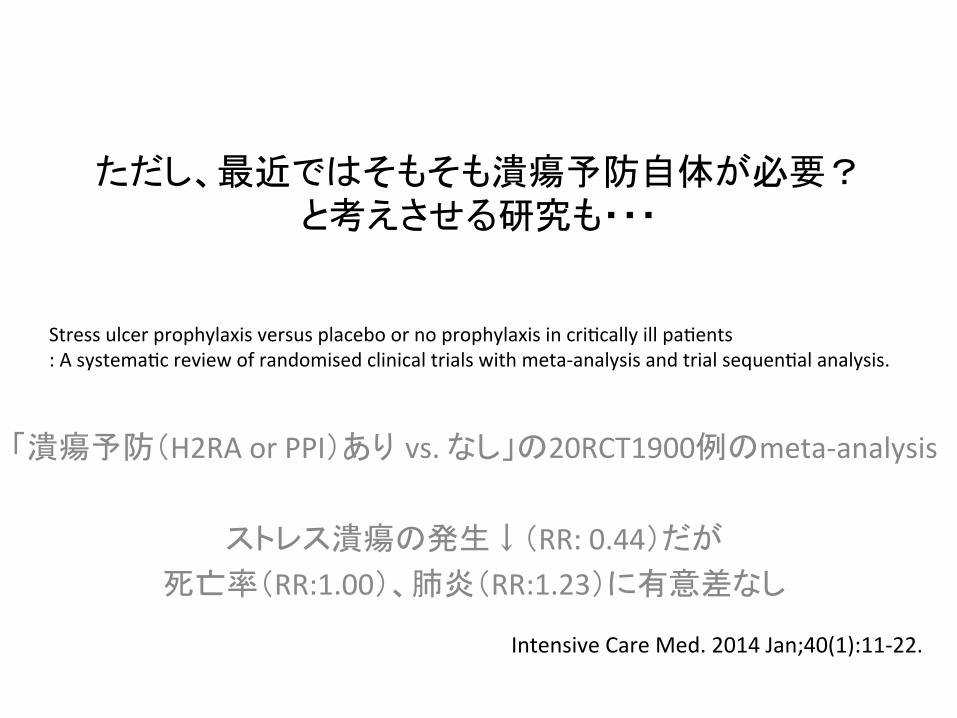
ただし、最近ではそもそも潰瘍予防自体が必要?と考えさせる研究も・・・
「潰瘍予防(H2RA or PPI)あり vs. なし」の20RCT1900例のmeta-‐analysis
ストレス潰瘍の発生↓(RR: 0.44)だが 死亡率(RR:1.00)、肺炎(RR:1.23)に有意差なし
Intensive Care Med. 2014 Jan;40(1):11-‐22.
Stress ulcer prophylaxis versus placebo or no prophylaxis in criMcally ill paMents : A systemaMc review of randomised clinical trials with meta-‐analysis and trial sequenMal analysis.
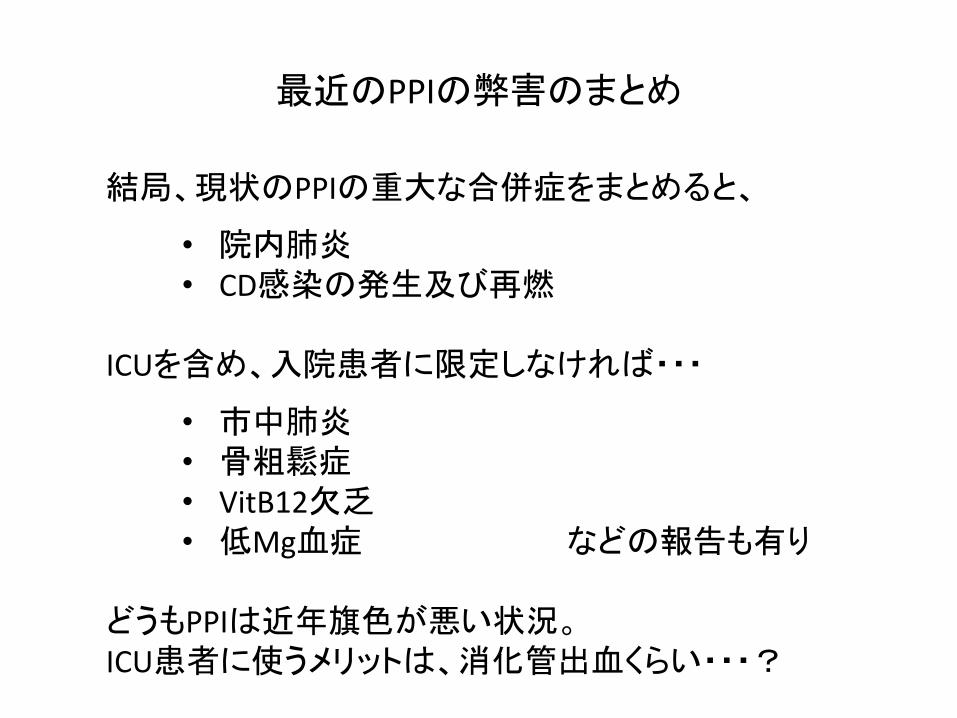
最近のPPIの弊害のまとめ
結局、現状のPPIの重大な合併症をまとめると、
• 院内肺炎 • CD感染の発生及び再燃
ICUを含め、入院患者に限定しなければ・・・
• 市中肺炎 • 骨粗鬆症 • VitB12欠乏 • 低Mg血症 などの報告も有り
どうもPPIは近年旗色が悪い状況。 ICU患者に使うメリットは、消化管出血くらい・・・?
Copyright 2014 American Medical Association. All rights reserved.
Histamine-2 Receptor Antagonists vs Proton Pump Inhibitorson Gastrointestinal Tract Hemorrhage and InfectiousComplications in the Intensive Care UnitRobert MacLaren, PharmD, MPH; Paul M. Reynolds, PharmD; Richard R. Allen, PhD
IMPORTANCE Histamine-2 receptor antagonists (H2RAs) and proton pump inhibitors (PPIs)are commonly used to prevent gastrointestinal tract (GI) hemorrhage in critically ill patients.The stronger acid suppression of PPIs may reduce the rate of bleeding but enhance infectiouscomplications, specifically pneumonia and Clostridium difficile infection (CDI).
OBJECTIVE To evaluate the occurrence and risk factors for GI hemorrhage, pneumonia, andCDI in critically ill patients.
DESIGN, SETTING, AND PARTICIPANTS A pharmacoepidemiological cohort study wasconducted of adult patients requiring mechanical ventilation for 24 hours or more andadministered either an H2RA or PPI for 48 hours or more while intubated across 71 hospitalsbetween January 1, 2003, and December 31, 2008. Propensity score–adjusted andpropensity-matched multivariate regression models were used to control for confounders.
MAIN OUTCOMES AND MEASURES Primary outcomes were secondary diagnoses ofInternational Classification of Diseases, Ninth Revision (ICD-9)–coded GI hemorrhage,pneumonia, and CDI occurring 48 hours or more after initiating invasive ventilation.
RESULTS Of 35 312 patients, 13 439 (38.1%) received H2RAs and 21 873 (61.9%) receivedPPIs. Gastrointestinal hemorrhage (2.1% vs 5.9%; P < .001), pneumonia (27% vs 38.6%;P < .001), and CDI (2.2% vs 3.8%; P < .001) occurred less frequently in the H2RA group. Afteradjusting for propensity score and covariates, odds ratios of GI hemorrhage (2.24; 95% CI,1.81-2.76), pneumonia (1.2; 95% CI, 1.03-1.41), and CDI (1.29; 95% CI, 1.04-1.64) were greaterwith PPIs. Similar results were obtained in the propensity-matched models of 8799 patientsin each cohort.
CONCLUSIONS AND RELEVANCE Proton pump inhibitors are associated with greater risks of GIhemorrhage, pneumonia, and CDI than H2RAs in mechanically ventilated patients. Numerousother risk factors are apparent. These data warrant confirmation in comparative prospectivestudies.
JAMA Intern Med. 2014;174(4):564-574. doi:10.1001/jamainternmed.2013.14673Published online February 17, 2014.
Invited Commentary page 574
Supplemental content atjamainternalmedicine.com
Author Affiliations: Department ofClinical Pharmacy, University ofColorado Skaggs School of Pharmacyand Pharmaceutical Sciences, Aurora(MacLaren); Department ofPharmacy, University of ColoradoHospital, Aurora (Reynolds); PeakStatistical Services, Evergreen,Colorado (Allen).
Corresponding Author: RobertMacLaren, PharmD, MPH,Department of Clinical Pharmacy,University of Colorado Skaggs Schoolof Pharmacy and PharmaceuticalSciences, 12850 E Montview Blvd,Campus Box C238, Pharmacy andPharmaceutical Sciences Bldg,Aurora, CO 80045 ([email protected]).
Research
Original Investigation
564 jamainternalmedicine.com
Copyright 2014 American Medical Association. All rights reserved.
Downloaded From: http://archinte.jamanetwork.com/ by a Gakko Hojin Jikei Daigaku User on 06/09/2014
目的
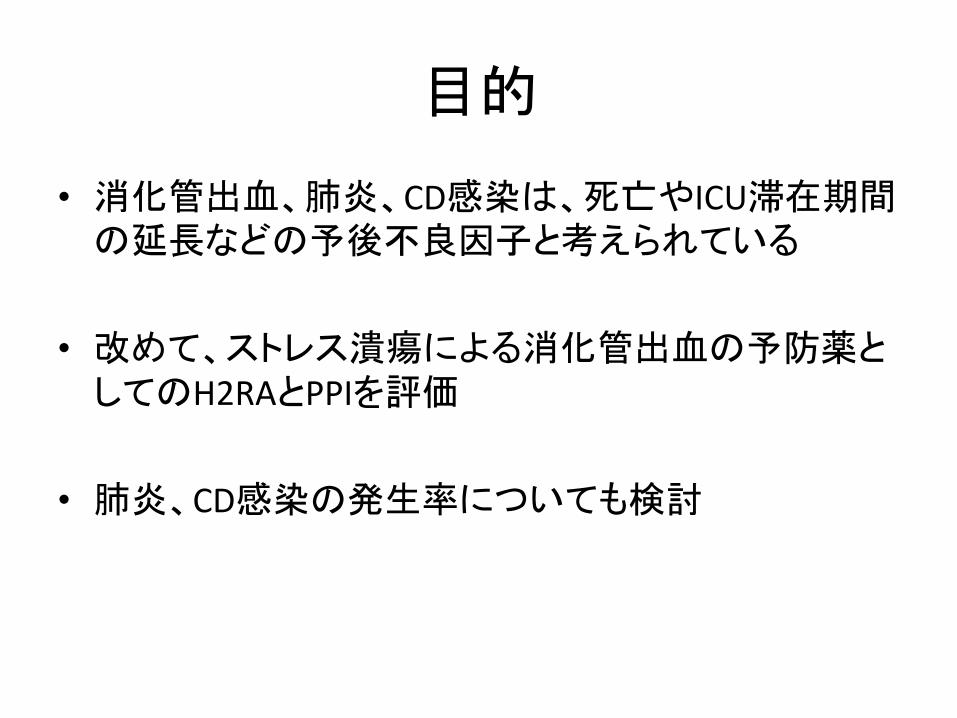
• 消化管出血、肺炎、CD感染は、死亡やICU滞在期間の延長などの予後不良因子と考えられている
• 改めて、ストレス潰瘍による消化管出血の予防薬としてのH2RAとPPIを評価
• 肺炎、CD感染の発生率についても検討
方法
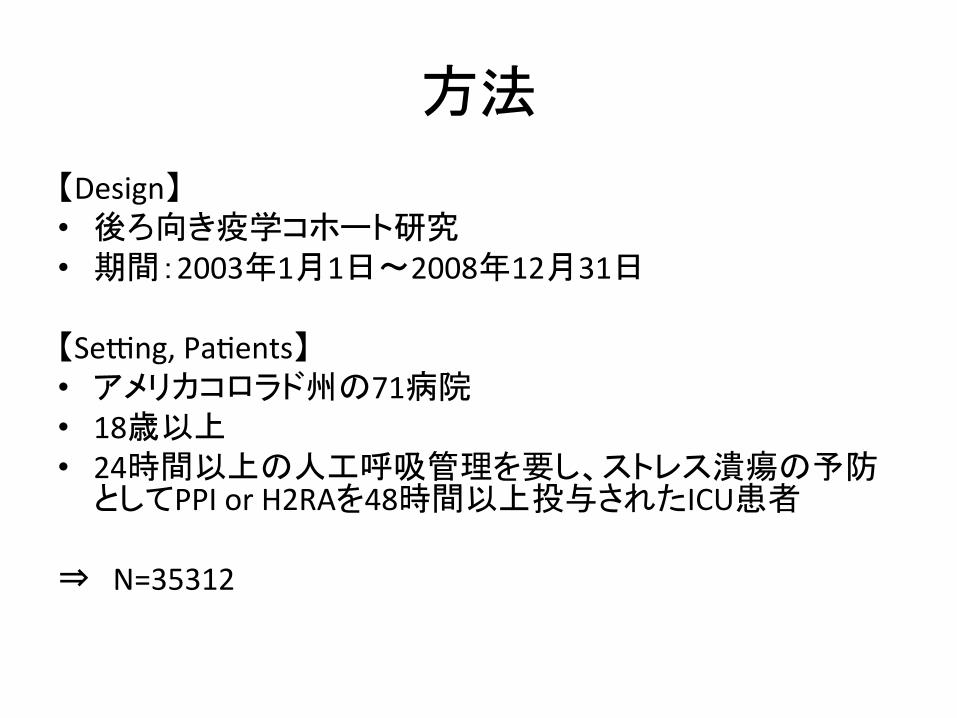
【Design】 • 後ろ向き疫学コホート研究 • 期間:2003年1月1日〜2008年12月31日
【SeQng, PaMents】 • アメリカコロラド州の71病院 • 18歳以上 • 24時間以上の人工呼吸管理を要し、ストレス潰瘍の予防
としてPPI or H2RAを48時間以上投与されたICU患者 ⇒ N=35312
方法
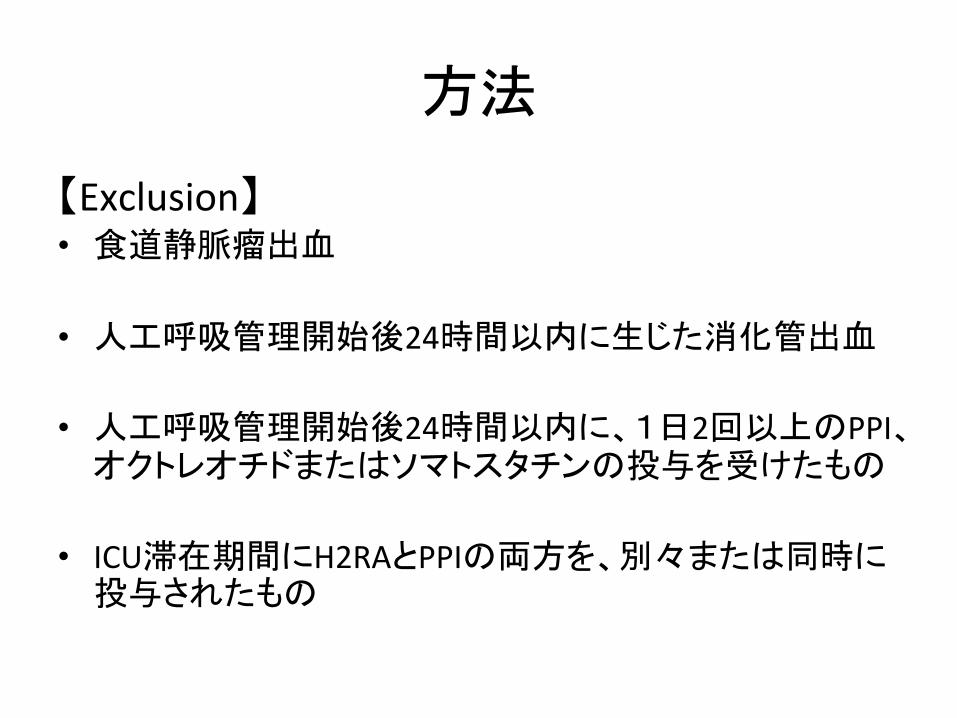
【Exclusion】 • 食道静脈瘤出血
• 人工呼吸管理開始後24時間以内に生じた消化管出血
• 人工呼吸管理開始後24時間以内に、1日2回以上のPPI、オクトレオチドまたはソマトスタチンの投与を受けたもの
• ICU滞在期間にH2RAとPPIの両方を、別々または同時に投与されたもの
方法
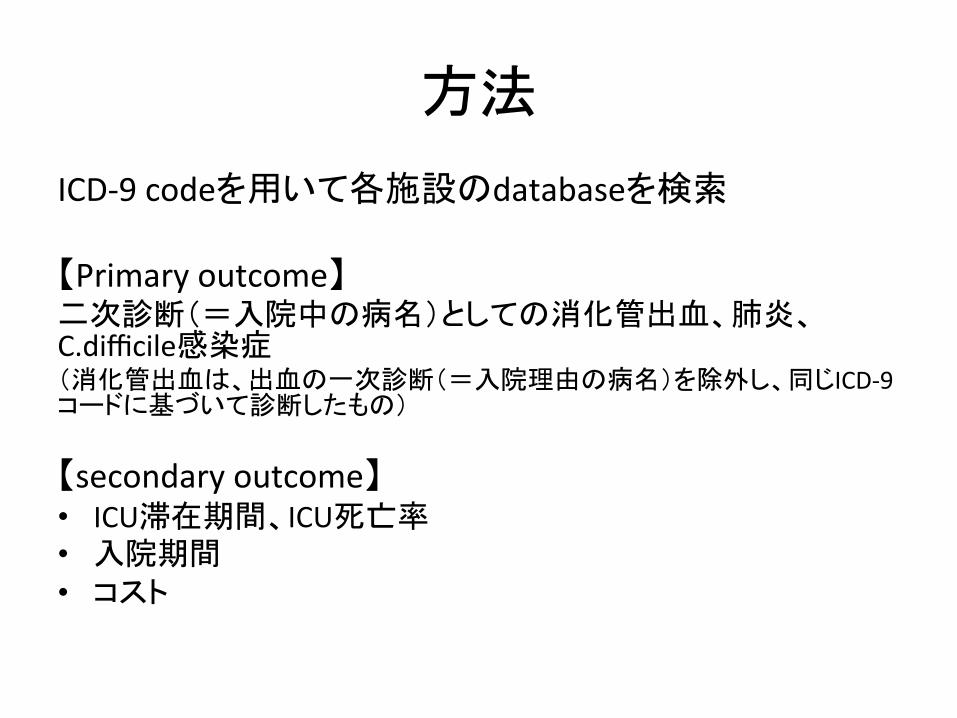
ICD-‐9 codeを用いて各施設のdatabaseを検索 【Primary outcome】 二次診断(=入院中の病名)としての消化管出血、肺炎、C.difficile感染症 (消化管出血は、出血の一次診断(=入院理由の病名)を除外し、同じICD-‐9コードに基づいて診断したもの) 【secondary outcome】 • ICU滞在期間、ICU死亡率 • 入院期間 • コスト
方法
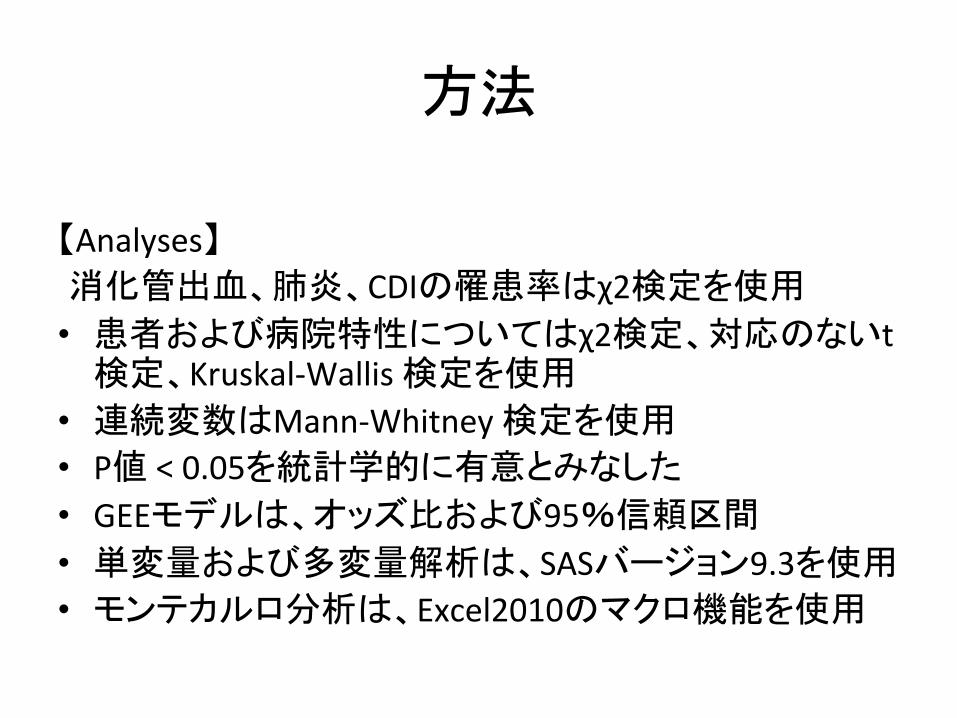
【Analyses】 消化管出血、肺炎、CDIの罹患率はχ2検定を使用 • 患者および病院特性についてはχ2検定、対応のないt
検定、Kruskal-‐Wallis 検定を使用 • 連続変数はMann-‐Whitney 検定を使用 • P値 < 0.05を統計学的に有意とみなした
• GEEモデルは、オッズ比および95%信頼区間
• 単変量および多変量解析は、SASバージョン9.3を使用 • モンテカルロ分析は、Excel2010のマクロ機能を使用
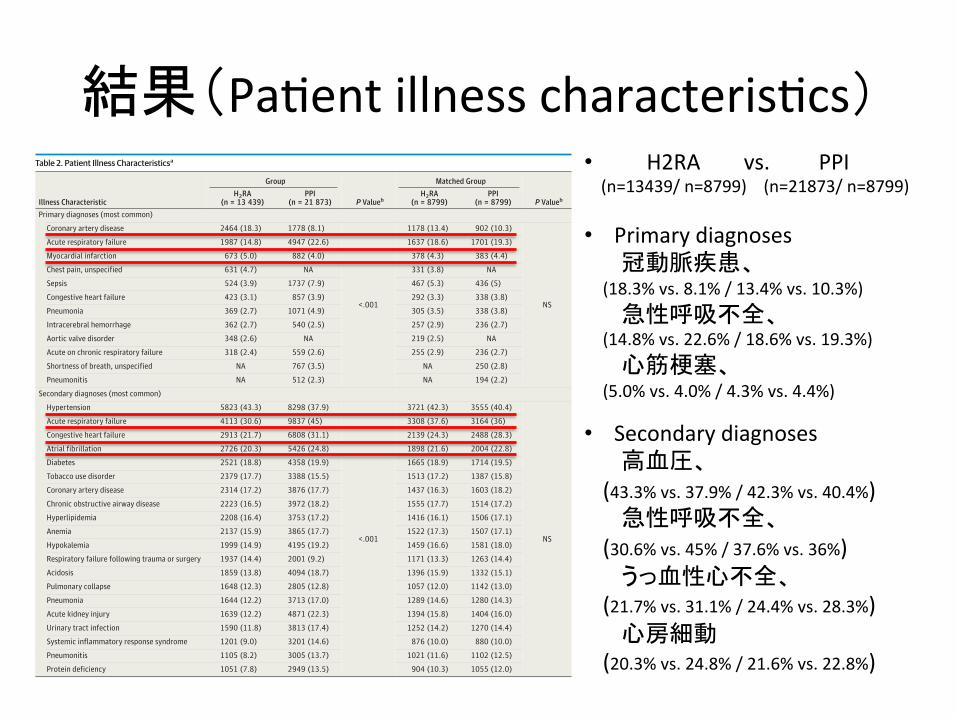
結果(PaMent illness characterisMcs) • H2RA vs. PPI (n=13439/ n=8799) (n=21873/ n=8799) • Primary diagnoses
冠動脈疾患、 (18.3% vs. 8.1% / 13.4% vs. 10.3%)
急性呼吸不全、 (14.8% vs. 22.6% / 18.6% vs. 19.3%)
心筋梗塞、 (5.0% vs. 4.0% / 4.3% vs. 4.4%)
• Secondary diagnoses 高血圧、
(43.3% vs. 37.9% / 42.3% vs. 40.4%) 急性呼吸不全、
(30.6% vs. 45% / 37.6% vs. 36%) うっ血性心不全、
(21.7% vs. 31.1% / 24.4% vs. 28.3%) 心房細動
(20.3% vs. 24.8% / 21.6% vs. 22.8%)
Copyright 2014 American Medical Association. All rights reserved.
come to display a difference was ICU mortality favoring H2RAs(Table 5). Multivariate analyses of the matched groups showedGI hemorrhage, pneumonia, and CDI were greater in the PPIgroup compared with the H2RA group (Table 6). Other covar-iates associated with the development of GI hemorrhage weresimilar to the previous model except for male sex, acute he-patic injury, sepsis, and platelet inhibitors, which lost a sig-nificant association, and congestive heart failure and paren-teral nutrition, which gained a significant relationship. Forpneumonia, only chronic kidney injury lost a significant as-sociation, whereas burn injury and shock gained a significantrelationship (Table 6). For CDI, acute hepatic injury, chronickidney injury, trauma, hypertension, acute respiratory fail-ure, and congestive heart failure lost a significant associa-tion, whereas shock, sepsis, coronary artery disease, and theuse of ampicillin gained a significant relationship (Table 6).
Discussion
This large cohort study demonstrates that the use of PPIs in aheterogeneous population of adult mechanically ventilated pa-tients increases the risks of GI hemorrhage, pneumonia, andCDI compared with the use of H2RAs. Another key finding ofthis study indicates that risk factors for GI hemorrhage, pneu-monia, and CDI are numerous and occur frequently in this pa-tient population.
The finding that PPIs were more likely to be associated withGIhemorrhagethanH2RAscontradictsourhypothesisthatstron-ger acid suppression reduces GI bleeding. Mechanistically, bothdrug classes inhibit acid production, but H2RAs also limit reper-fusioninjuryinanimalmodels,possiblyreducingoxidativestressafter mucosal injury.1 The results of recent systematic reviews
Table 2. Patient Illness Characteristicsa
Illness Characteristic
Group
P Valueb
Matched Group
P ValuebH2RA
(n = 13 439)PPI
(n = 21 873)H2RA
(n = 8799)PPI
(n = 8799)Primary diagnoses (most common)
Coronary artery disease 2464 (18.3) 1778 (8.1)
<.001
1178 (13.4) 902 (10.3)
NS
Acute respiratory failure 1987 (14.8) 4947 (22.6) 1637 (18.6) 1701 (19.3)
Myocardial infarction 673 (5.0) 882 (4.0) 378 (4.3) 383 (4.4)
Chest pain, unspecified 631 (4.7) NA 331 (3.8) NA
Sepsis 524 (3.9) 1737 (7.9) 467 (5.3) 436 (5)
Congestive heart failure 423 (3.1) 857 (3.9) 292 (3.3) 338 (3.8)
Pneumonia 369 (2.7) 1071 (4.9) 305 (3.5) 338 (3.8)
Intracerebral hemorrhage 362 (2.7) 540 (2.5) 257 (2.9) 236 (2.7)
Aortic valve disorder 348 (2.6) NA 219 (2.5) NA
Acute on chronic respiratory failure 318 (2.4) 559 (2.6) 255 (2.9) 236 (2.7)
Shortness of breath, unspecified NA 767 (3.5) NA 250 (2.8)
Pneumonitis NA 512 (2.3) NA 194 (2.2)
Secondary diagnoses (most common)
Hypertension 5823 (43.3) 8298 (37.9)
<.001
3721 (42.3) 3555 (40.4)
NS
Acute respiratory failure 4113 (30.6) 9837 (45) 3308 (37.6) 3164 (36)
Congestive heart failure 2913 (21.7) 6808 (31.1) 2139 (24.3) 2488 (28.3)
Atrial fibrillation 2726 (20.3) 5426 (24.8) 1898 (21.6) 2004 (22.8)
Diabetes 2521 (18.8) 4358 (19.9) 1665 (18.9) 1714 (19.5)
Tobacco use disorder 2379 (17.7) 3388 (15.5) 1513 (17.2) 1387 (15.8)
Coronary artery disease 2314 (17.2) 3876 (17.7) 1437 (16.3) 1603 (18.2)
Chronic obstructive airway disease 2223 (16.5) 3972 (18.2) 1555 (17.7) 1514 (17.2)
Hyperlipidemia 2208 (16.4) 3753 (17.2) 1416 (16.1) 1506 (17.1)
Anemia 2137 (15.9) 3865 (17.7) 1522 (17.3) 1507 (17.1)
Hypokalemia 1999 (14.9) 4195 (19.2) 1459 (16.6) 1581 (18.0)
Respiratory failure following trauma or surgery 1937 (14.4) 2001 (9.2) 1171 (13.3) 1263 (14.4)
Acidosis 1859 (13.8) 4094 (18.7) 1396 (15.9) 1332 (15.1)
Pulmonary collapse 1648 (12.3) 2805 (12.8) 1057 (12.0) 1142 (13.0)
Pneumonia 1644 (12.2) 3713 (17.0) 1289 (14.6) 1280 (14.3)
Acute kidney injury 1639 (12.2) 4871 (22.3) 1394 (15.8) 1404 (16.0)
Urinary tract infection 1590 (11.8) 3813 (17.4) 1252 (14.2) 1270 (14.4)
Systemic inflammatory response syndrome 1201 (9.0) 3201 (14.6) 876 (10.0) 880 (10.0)
Pneumonitis 1105 (8.2) 3005 (13.7) 1021 (11.6) 1102 (12.5)
Protein deficiency 1051 (7.8) 2949 (13.5) 904 (10.3) 1055 (12.0)
(continued)
Research Original Investigation H2 Receptor Antagonists vs Proton Pump Inhibitors
568 JAMA Internal Medicine April 2014 Volume 174, Number 4 jamainternalmedicine.com
Copyright 2014 American Medical Association. All rights reserved.
Downloaded From: http://archinte.jamanetwork.com/ by a Gakko Hojin Jikei Daigaku User on 06/09/2014
結果(Univariate Analyses)
Copyright 2014 American Medical Association. All rights reserved.
somestudiessuggestingthattheriskisgreatestshortlyafterstart-ing therapy, as is frequently the case in many critically illpatients.11-13,16,17 The plausible explanation for this associationis that the increased gastric pH generated by acid suppressantsmay facilitate microbial progression in the GI tract leading toinfection.1-3 Few studies have evaluated the association betweenacid suppressants and these infectious complications in the in-patient setting. Herzig et al15 evaluated nearly 64 000 non-ICUhospital admissions and found that acid suppressants were as-sociated with hospital-acquired pneumonia as defined by ICD-9codes.TwosystematicreviewsfoundH2RAstobeassociatedwithpneumonia compared with sucralfate when used in critically illpatientstopreventGIhemorrhage.36,37 Ofnote,manyofthestud-ies included in these systematic reviews targeted 24-hour pH val-ues of 4 or greater with H2RA therapy and/or administered H2RAsby continuous infusion, which may predispose patients to pneu-monia. The largest study conducted to date on stress-related mu-cosal damage included 1200 patients and did not find an in-creased rate of pneumonia with intermittent dosing of ranitidinecompared with sucralfate.7 For CDI, a recent systematic reviewof 42 studies and 313 000 patients found that H2RA therapy wasnot associated with CDI, but the risk was evident with PPI useand 71% greater compared with H2RAs.16 In contrast, the resultsof a propensity score analysis of more than 100 000 hospital dis-charges found both PPIs and H2RAs were associated with CDItoxin-positive infection.17 To our knowledge, our study is the firstto demonstrate that acid suppression, especially with PPIs, is as-sociated with an increased likelihood of pneumonia and CDIwhenusedinmechanicallyventilatedpatients.Therisksfortheseinfections were also related to the length of mechanical venti-lation. Many of the other risk factors we found for these infec-tions validate what has been described in the literature and likelyrelate to the overall severity of illness, immunosuppression, pre-vious exposure to and/or colonization with these microbes, ordisruption of normal GI flora.
Our overall rates of GI hemorrhage (4.4%), pneumonia(34.2%), and CDI (3.2%) deviate to the high end of other re-ports. The use of ICD-9 codes may present questions of valid-ity with respect to disease classification.38 We extracted theICD-9 codes for the outcomes of GI hemorrhage, pneumonia,and CDI from other epidemiologic studies that used similardesigns.15,17,27 In addition, we used multiple codes or combi-nations of codes for each parameter to enhance sensitivity. Weapplied numerous exclusion criteria and time restrictions to pre-vent misclassification (eg, variceal bleed, use of high-dose PPIsat baseline) and improve specificity. We conducted probabilis-tic sensitivity analyses that demonstrated the robustness of theresults to misclassification. Despite these precautions, the ob-servational study design precludes the definitive assignmentof outcomes (eg, a GI hemorrhage unrelated to stress-relatedmucosal damage) or the delineation of the severity of these out-comes (eg, overt vs clinically significant GI hemorrhage).
Several additional limitations are evident when interpret-ing the results of our study. We speculated that more patientswould receive PPI therapy, but we are unable to ascertain whycertain regimens were chosen. The univariate analyses showedthat baseline demographics and disease state parameters are dif-ferent between therapies. Our results, however, changed mini-mally when a propensity matching technique was applied to themodels.25,26 Similarly, we cannot speculate about different in-stitutional practices and the extent they may affect diagnosesand therapies. The most common acid suppressants were fam-otidine and pantoprazole. While each agent within the drugclasses possesses slightly different pharmacodynamics prop-erties, we assumed outcomes were representative of each classof agents. At the time we procured the database, data was onlyavailable through December 2008, so any practice or databasechanges occurring between then and the present have notbeen captured. For example, an ICD-9 code for ventilator-associated pneumonia was made available in 2009. The type of
Table 5. Primary and Secondary Outcomesa
Outcome
Group
P Valueb
Matched Group
P ValuebH2RA
(n = 13 439)PPI
(n = 21 873)H2RA
(n = 8799)PPI
(n = 8799)Primary outcomes
GI hemorrhage 276 (2.1) 1287 (5.9) <.001 209 (2.4) 415 (4.7) <.001
Pneumonia 3630 (27) 8435 (38.6) <.001 2705 (30.7) 2992 (34) <.001
Clostridium difficileinfection
294 (2.2) 835 (3.8) <.001 227 (2.6) 300 (3.4) .002
Secondary outcomes
ICU length of stay, median(IQR), d
4 (2-9) 5 (1-11) .002 4 (2-9) 5 (2-10) .01
Hospital length of stay,median (IQR), d
6 (3-10) 6 (3-11) NS 6 (3-10) 6 (3-11) NS
ICU mortality, No. (%) 1449 (10.8) 3901 (17.8) <.001 1081 (12.3) 1345 (15.3) <.001
Hospital mortality afterICU, No. (%)
684 (5.1) 1705 (7.8) <.001 526 (6) 582 (6.6) .09
ICU costs, median (IQR), $ 17 076(10 747-29 215)
18 946(10 753-35 769)
.001 17 723(10 477-31 180)
17 692(10 379-32 504)
NS
Hospital costs after ICU,median (IQR), $
5952(2451-12 392)
6282 (2376-14 043) .02 6120 (2385-13 296) 6112 (2373-13 066) NS
Abbreviations: GI, gastrointestinal tract; H2RA, histamine-2 receptor antagonist;ICU, intensive care unit; IQR, interquartile range; NS, not significant; PPI, protonpump inhibitor.
a Data are presented as number (percentage) of patients or median (IQRs).b P values compare H2RA and PPI groups via the χ2 test or Mann-Whitney test.
H2 Receptor Antagonists vs Proton Pump Inhibitors Original Investigation Research
jamainternalmedicine.com JAMA Internal Medicine April 2014 Volume 174, Number 4 571
Copyright 2014 American Medical Association. All rights reserved.
Downloaded From: http://archinte.jamanetwork.com/ by a Gakko Hojin Jikei Daigaku User on 06/09/2014
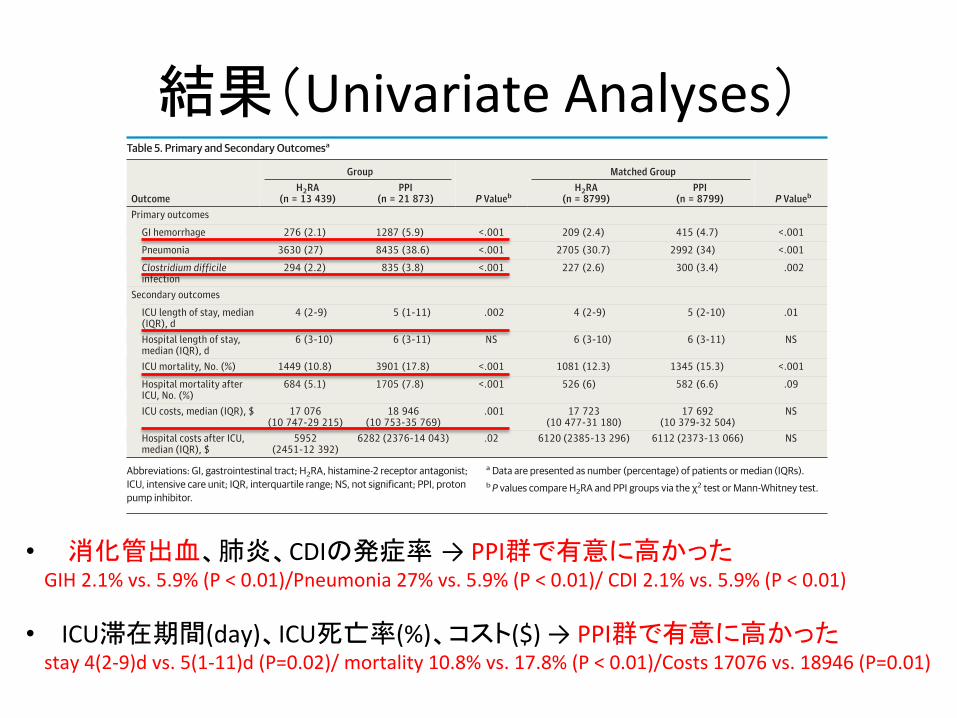
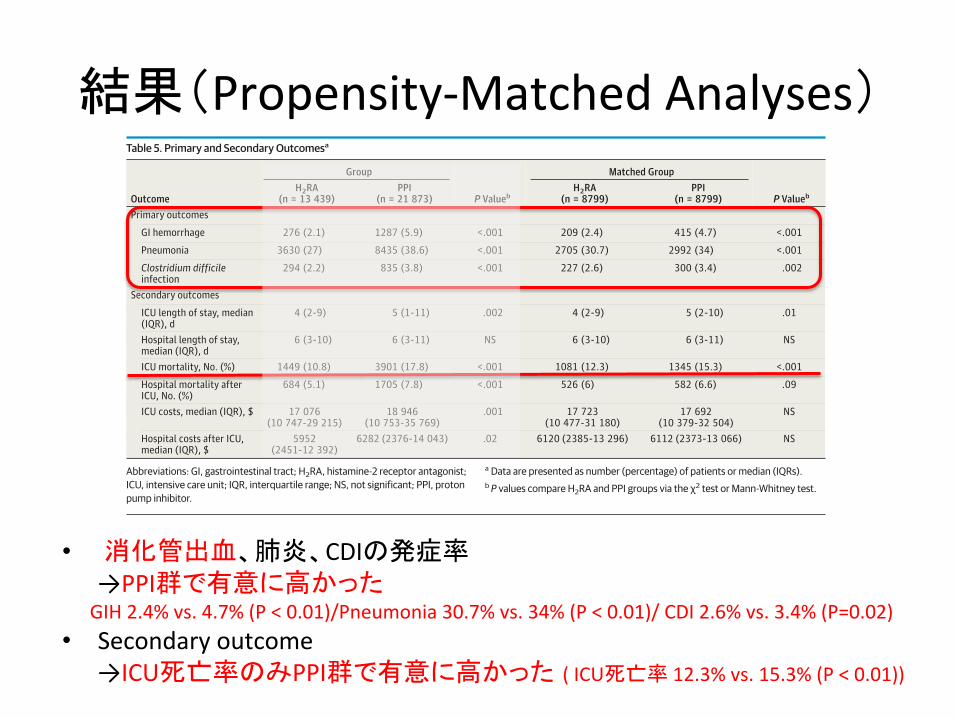
• 消化管出血、肺炎、CDIの発症率 → PPI群で有意に高かった GIH 2.1% vs. 5.9% (P < 0.01)/Pneumonia 27% vs. 5.9% (P < 0.01)/ CDI 2.1% vs. 5.9% (P < 0.01)
• ICU滞在期間(day)、ICU死亡率(%)、コスト($) → PPI群で有意に高かった stay 4(2-‐9)d vs. 5(1-‐11)d (P=0.02)/ mortality 10.8% vs. 17.8% (P < 0.01)/Costs 17076 vs. 18946 (P=0.01)
結果(Propensity-‐Matched Analyses)
Copyright 2014 American Medical Association. All rights reserved.
somestudiessuggestingthattheriskisgreatestshortlyafterstart-ing therapy, as is frequently the case in many critically illpatients.11-13,16,17 The plausible explanation for this associationis that the increased gastric pH generated by acid suppressantsmay facilitate microbial progression in the GI tract leading toinfection.1-3 Few studies have evaluated the association betweenacid suppressants and these infectious complications in the in-patient setting. Herzig et al15 evaluated nearly 64 000 non-ICUhospital admissions and found that acid suppressants were as-sociated with hospital-acquired pneumonia as defined by ICD-9codes.TwosystematicreviewsfoundH2RAstobeassociatedwithpneumonia compared with sucralfate when used in critically illpatientstopreventGIhemorrhage.36,37 Ofnote,manyofthestud-ies included in these systematic reviews targeted 24-hour pH val-ues of 4 or greater with H2RA therapy and/or administered H2RAsby continuous infusion, which may predispose patients to pneu-monia. The largest study conducted to date on stress-related mu-cosal damage included 1200 patients and did not find an in-creased rate of pneumonia with intermittent dosing of ranitidinecompared with sucralfate.7 For CDI, a recent systematic reviewof 42 studies and 313 000 patients found that H2RA therapy wasnot associated with CDI, but the risk was evident with PPI useand 71% greater compared with H2RAs.16 In contrast, the resultsof a propensity score analysis of more than 100 000 hospital dis-charges found both PPIs and H2RAs were associated with CDItoxin-positive infection.17 To our knowledge, our study is the firstto demonstrate that acid suppression, especially with PPIs, is as-sociated with an increased likelihood of pneumonia and CDIwhenusedinmechanicallyventilatedpatients.Therisksfortheseinfections were also related to the length of mechanical venti-lation. Many of the other risk factors we found for these infec-tions validate what has been described in the literature and likelyrelate to the overall severity of illness, immunosuppression, pre-vious exposure to and/or colonization with these microbes, ordisruption of normal GI flora.
Our overall rates of GI hemorrhage (4.4%), pneumonia(34.2%), and CDI (3.2%) deviate to the high end of other re-ports. The use of ICD-9 codes may present questions of valid-ity with respect to disease classification.38 We extracted theICD-9 codes for the outcomes of GI hemorrhage, pneumonia,and CDI from other epidemiologic studies that used similardesigns.15,17,27 In addition, we used multiple codes or combi-nations of codes for each parameter to enhance sensitivity. Weapplied numerous exclusion criteria and time restrictions to pre-vent misclassification (eg, variceal bleed, use of high-dose PPIsat baseline) and improve specificity. We conducted probabilis-tic sensitivity analyses that demonstrated the robustness of theresults to misclassification. Despite these precautions, the ob-servational study design precludes the definitive assignmentof outcomes (eg, a GI hemorrhage unrelated to stress-relatedmucosal damage) or the delineation of the severity of these out-comes (eg, overt vs clinically significant GI hemorrhage).
Several additional limitations are evident when interpret-ing the results of our study. We speculated that more patientswould receive PPI therapy, but we are unable to ascertain whycertain regimens were chosen. The univariate analyses showedthat baseline demographics and disease state parameters are dif-ferent between therapies. Our results, however, changed mini-mally when a propensity matching technique was applied to themodels.25,26 Similarly, we cannot speculate about different in-stitutional practices and the extent they may affect diagnosesand therapies. The most common acid suppressants were fam-otidine and pantoprazole. While each agent within the drugclasses possesses slightly different pharmacodynamics prop-erties, we assumed outcomes were representative of each classof agents. At the time we procured the database, data was onlyavailable through December 2008, so any practice or databasechanges occurring between then and the present have notbeen captured. For example, an ICD-9 code for ventilator-associated pneumonia was made available in 2009. The type of
Table 5. Primary and Secondary Outcomesa
Outcome
Group
P Valueb
Matched Group
P ValuebH2RA
(n = 13 439)PPI
(n = 21 873)H2RA
(n = 8799)PPI
(n = 8799)Primary outcomes
GI hemorrhage 276 (2.1) 1287 (5.9) <.001 209 (2.4) 415 (4.7) <.001
Pneumonia 3630 (27) 8435 (38.6) <.001 2705 (30.7) 2992 (34) <.001
Clostridium difficileinfection
294 (2.2) 835 (3.8) <.001 227 (2.6) 300 (3.4) .002
Secondary outcomes
ICU length of stay, median(IQR), d
4 (2-9) 5 (1-11) .002 4 (2-9) 5 (2-10) .01
Hospital length of stay,median (IQR), d
6 (3-10) 6 (3-11) NS 6 (3-10) 6 (3-11) NS
ICU mortality, No. (%) 1449 (10.8) 3901 (17.8) <.001 1081 (12.3) 1345 (15.3) <.001
Hospital mortality afterICU, No. (%)
684 (5.1) 1705 (7.8) <.001 526 (6) 582 (6.6) .09
ICU costs, median (IQR), $ 17 076(10 747-29 215)
18 946(10 753-35 769)
.001 17 723(10 477-31 180)
17 692(10 379-32 504)
NS
Hospital costs after ICU,median (IQR), $
5952(2451-12 392)
6282 (2376-14 043) .02 6120 (2385-13 296) 6112 (2373-13 066) NS
Abbreviations: GI, gastrointestinal tract; H2RA, histamine-2 receptor antagonist;ICU, intensive care unit; IQR, interquartile range; NS, not significant; PPI, protonpump inhibitor.
a Data are presented as number (percentage) of patients or median (IQRs).b P values compare H2RA and PPI groups via the χ2 test or Mann-Whitney test.
H2 Receptor Antagonists vs Proton Pump Inhibitors Original Investigation Research
jamainternalmedicine.com JAMA Internal Medicine April 2014 Volume 174, Number 4 571
Copyright 2014 American Medical Association. All rights reserved.
Downloaded From: http://archinte.jamanetwork.com/ by a Gakko Hojin Jikei Daigaku User on 06/09/2014
• 消化管出血、肺炎、CDIの発症率 →PPI群で有意に高かった
GIH 2.4% vs. 4.7% (P < 0.01)/Pneumonia 30.7% vs. 34% (P < 0.01)/ CDI 2.6% vs. 3.4% (P=0.02) • Secondary outcome →ICU死亡率のみPPI群で有意に高かった ( ICU死亡率 12.3% vs. 15.3% (P < 0.01))

結果(MulMvariate Analyses)
• プロペンシティスコアで修正後、PPIの消化管出血のオッズ比 : OR 2.24 (95% CI,1.81-‐2.76) プロペンシティマッチングで修正後オッズ比 : OR 1.95 (95% CI,1.44-‐2.65)
→ともにPPI群で高かった。 • 投与量および期間は、これらの結果に影響を及ぼさなかった。 • 肺炎とCDIは、人工呼吸期間に関連する。
Copyright 2014 American Medical Association. All rights reserved.
Table 6. Multivariable Regression Models of Adjusted ORs for Secondary GI Hemorrhage, Pneumonia, and CDI With Propensity Scoreas a Covariate and After Matchinga
Parameter
OR (95% CI)
GI Hemorrhage Pneumonia CDIPropensity Score
(n = 1563)Matching(n = 624)
Propensity Score(n = 12 065)
Matching(n = 5697)
Propensity Score(n = 1129)
Matching(n = 527)
PPI vs H2RA, all years 2.24 (1.81-2.76) 1.95 (1.44-2.65) 1.2 (1.03-1.41) 1.23 (1.07-1.43) 1.29 (1.04-1.59) 1.31 (1.04-1.64)
2003 1.82 (1.41-2.36) 1.79 (1.27-2.53) 1.05 (0.83-1.33) 1.11 (0.89-1.40) 1.13 (0.88-1.48) 1.38 (0.90-2.13)
2004 1.81 (1.30-2.52) 1.60 (1.04-2.47) 1.09 (0.83-1.43) 1.09 (0.83-1.43) 1.08 (0.78-1.51) 1.24 (0.80-1.93)
2005 3.71 (2.67-5.16) 3.58 (2.24-5.71) 1.22 (1.00-1.48) 1.29 (1.06-1.58) 1.31 (0.95-1.81) 1.32 (0.91-1.91)
2006 2.20 (1.41-3.44) 1.51 (0.95-2.39) 1.28 (1.05-1.56) 1.36 (1.07-1.72) 1.51 (1.08-2.13) 1.53 (1.02-2.31)
2007 2.71 (1.73-4.23) 2.31 (1.31-4.07) 1.30 (1.00-1.70) 1.26 (0.93-1.69) 1.30 (0.92-1.84) 1.23 (0.82-1.85)
2008 1.71 (1.29-2.28) 1.54 (0.80-2.97) 1.32 (1.07-1.63) 1.33 (1.00-1.75) 1.43 (0.87-2.35) 1.16 (0.74-1.82)
Dose vs low-dose H2RA
High-dose H2RA 0.96 (0.67-1.37) 0.95 (0.61-1.47) 1.05 (0.84-1.32) 1.00 (0.85-1.19) 0.95 (0.75-1.20) 0.92 (0.63-1.34)
Low-dose PPI 2.21 (1.98-2.44) 1.28 (1.03-1.59) 1.27 (1.12-1.44) 1.33 (1.15-1.54) 1.29 (1.06-1.55) 1.28 (1.02-1.61)
High-dose PPI 2.29 (1.76-2.82) 2.81 (2.23-3.54) 1.20 (1.07-1.35) 1.15 (1.00-1.31) 1.22 (0.95-1.56) 1.23 (0.92-1.63)
Duration of acid suppressingtherapy vs <72 h
3-7 d 1.13 (0.88-1.45) 1.12 (0.81-1.51) 1.22 (1.08-1.38) 1.17 (0.94-1.44) 0.90 (0.73-1.11) 1.08 (0.79-1.46)
8-14 d 1.30 (0.93-1.82) 1.04 (0.68-1.61) 1.34 (0.97-1.86) 1.26 (0.94-1.69) 0.77 (0.53-1.12) 0.70 (0.44-1.10)
>14 d 1.10 (0.74-1.63) 0.83 (0.43-1.59) 1.08 (0.70-1.68) 1.04 (0.80-1.36) 1.12 (0.67-1.88) 1.21 (0.77-1.89)
Age vs <40 y
40-49 1.20 (0.88-1.62) 1.20 (0.80-1.81) 0.91 (0.80-1.04) 0.95 (0.76-1.18) 0.81 (0.54-1.21) 1.13 (0.75-1.72)
50-59 1.46 (1.18-1.83) 1.47 (1.08-1.99) 0.78 (0.66-0.92) 0.88 (0.74-1.05) 0.85 (0.62-1.16) 1.31 (0.82-2.09)
60-69 1.66 (1.26-2.19) 1.84 (1.32-2.56) 0.70 (0.58-0.84) 0.86 (0.68-1.09) 0.81 (0.56-1.17) 1.49 (0.93-2.39)
70-79 1.72 (1.27-2.34) 1.54 (0.97-2.43) 0.78 (0.65-0.94) 1.03 (0.83-1.27) 0.91 (0.61-1.36) 1.88 (1.12-3.18)
≥80 2.04 (1.48-2.83) 1.81 (1.01-3.26) 0.87 (0.71-1.06) 1.12 (0.89-1.41) 0.85 (0.56-1.28) 1.90 (1.20-2.99)
Male 1.17 (1.03-1.33) 1.04 (0.87-1.23) 1.40 (1.29-1.51) 1.33 (1.22-1.46) 1.08 (0.98-1.20) 1.06 (0.91-1.22)
Race vs white
Black 1.14 (0.98-1.32) 1.09 (0.86-1.39) 0.81 (0.73-0.89) 0.78 (0.69-0.87) 0.85 (0.71-1.02) 0.93 (0.73-1.18)
Hispanic 1.07 (0.76-1.51) 1.20 (0.74-1.97) 1.03 (0.83-1.28) 1.07 (0.83-1.38) 0.90 (0.52-1.57) 1.18 (0.62-2.26)
Other 0.34 (0.10-1.15) 0.72 (0.43-1.22) 1.14 (0.86-1.53) 0.90 (0.71-1.12) 1.32 (0.55-3.18) 1.28 (0.76-2.16)
Mechanical ventilation daysvs <72 h
3-7 d 0.99 (0.80-1.24) 1.12 (0.80-1.57) 1.69 (1.40-2.04) 1.83 (1.43-2.33) 1.39 (1.01-1.90) 1.32 (0.88-1.98)
8-14 d 0.81 (0.61-1.07) 1.06 (0.74-1.51) 2.72 (1.87-3.94) 3.35 (2.45-4.58) 1.99 (1.20-3.29) 2.48 (1.36-4.53)
>14 d 1.06 (0.74-1.51) 1.66 (0.94-2.94) 4.17 (2.61-6.66) 5.00 (3.73-6.72) 2.07 (1.08-3.98) 1.95 (1.06-3.58)
ICD-9 coded disease state
Acute hepatic injury 1.56 (1.29-1.88) 1.42 (0.88-2.28) 1.47 (1.23-1.73) 1.32 (1.00-1.63) 1.76 (1.25-2.49) 0.73 (0.41-1.30)
Chronic hepatic injury 1.85 (1.47-2.33) 2.36 (1.59-3.48) 0.97 (0.80-1.17) 0.92 (0.72-1.18) 0.78 (0.58-1.06) 0.98 (0.57-1.66)
Acute kidney injury 1.21 (1.02-1.43) 1.53 (1.13-2.09) 1.47 (1.30-1.66) 1.20 (1.05-1.38) 1.36 (1.04-1.77) 1.28 (1.00-1.65)
Chronic kidney injury 0.96 (0.80-1.14) 0.96 (0.70-1.31) 1.14 (1.00-1.29) 0.89 (0.74-1.06) 1.29 (1.08-1.53) 1.19 (0.88-1.62)
Burn injury 1.11 (0.80-1.41) 1.22 (0.85-1.59) 0.89 (0.41-1.93) 1.85 (1.36-2.49) 1.08 (0.81-1.33) 1.03 (0.62-1.49)
Neurologic injury 1.15 (1.00-1.32) 1.25 (1.06-1.48) 1.50 (1.35-1.67) 1.48 (1.32-1.66) 0.98 (0.84-1.14) 0.82 (0.65-1.04)
Trauma/major surgery 1.12 (0.71-1.75) 1.01 (0.63-1.73) 1.47 (1.19-1.82) 1.21 (1.04-1.41) 1.76 (1.18-2.60) 0.86 (0.54-1.37)
Transplant 1.74 (0.63-4.79) 1.18 (0.78-1.74) 2.24 (1.11-4.52) 3.96 (1.69-9.28) 5.41 (1.76-16.62) 5.26 (1.27-21.76)
Pancreatitis 1.28 (0.96-1.72) 1.42 (0.95-2.13) 1.05 (0.84-1.31) 0.94 (0.73-1.21) 1.44 (0.99-2.08) 1.29 (0.74-2.25)
Inflammatory bowel disease 1.24 (0.68-2.25) 1.29 (0.51-3.26) Not included Not included 3.14 (2.23-4.40) 3.57 (2.12-5.79)
Previous ulcer 0.87 (0.60-1.26) 1.14 (0.66-1.96) Not included Not included 0.72 (0.48-1.10) 0.80 (0.38-1.68)
Sepsis 1.00 (0.79-1.25) 1.12 (0.91-1.38) 1.28 (1.05-1.51) 1.39 (1.16-1.61) 1.43 (1.07-1.87) 1.55 (1.30-1.85)
Shock or hypotension 1.17 (1.04-1.33) 1.17 (1.00-1.34) 1.28 (1.18-1.37) 1.15 (1.02-1.30) 1.09 (0.93-1.27) 1.24 (1.04-1.49)
Coagulopathy 1.7 (1.35-2.14) 2.15 (1.51-3.05) Not included Not included Not included Not included
Neutropenia 0.68 (0.40-1.15) 0.61 (0.20-1.89) 0.77 (0.52-1.14) 1.31 (0.74-2.32) 1.08 (0.48-2.43) 1.67 (0.62-4.47)
Thrombocytopenia 0.70 (0.56-0.87) 0.65 (0.42-1.00) Not included Not included Not included Not included
(continued)
Research Original Investigation H2 Receptor Antagonists vs Proton Pump Inhibitors
572 JAMA Internal Medicine April 2014 Volume 174, Number 4 jamainternalmedicine.com
Copyright 2014 American Medical Association. All rights reserved.
Downloaded From: http://archinte.jamanetwork.com/ by a Gakko Hojin Jikei Daigaku User on 06/09/2014
Copyright 2014 American Medical Association. All rights reserved.
Table 6. Multivariable Regression Models of Adjusted ORs for Secondary GI Hemorrhage, Pneumonia, and CDI With Propensity Scoreas a Covariate and After Matchinga
Parameter
OR (95% CI)
GI Hemorrhage Pneumonia CDIPropensity Score
(n = 1563)Matching(n = 624)
Propensity Score(n = 12 065)
Matching(n = 5697)
Propensity Score(n = 1129)
Matching(n = 527)
PPI vs H2RA, all years 2.24 (1.81-2.76) 1.95 (1.44-2.65) 1.2 (1.03-1.41) 1.23 (1.07-1.43) 1.29 (1.04-1.59) 1.31 (1.04-1.64)
2003 1.82 (1.41-2.36) 1.79 (1.27-2.53) 1.05 (0.83-1.33) 1.11 (0.89-1.40) 1.13 (0.88-1.48) 1.38 (0.90-2.13)
2004 1.81 (1.30-2.52) 1.60 (1.04-2.47) 1.09 (0.83-1.43) 1.09 (0.83-1.43) 1.08 (0.78-1.51) 1.24 (0.80-1.93)
2005 3.71 (2.67-5.16) 3.58 (2.24-5.71) 1.22 (1.00-1.48) 1.29 (1.06-1.58) 1.31 (0.95-1.81) 1.32 (0.91-1.91)
2006 2.20 (1.41-3.44) 1.51 (0.95-2.39) 1.28 (1.05-1.56) 1.36 (1.07-1.72) 1.51 (1.08-2.13) 1.53 (1.02-2.31)
2007 2.71 (1.73-4.23) 2.31 (1.31-4.07) 1.30 (1.00-1.70) 1.26 (0.93-1.69) 1.30 (0.92-1.84) 1.23 (0.82-1.85)
2008 1.71 (1.29-2.28) 1.54 (0.80-2.97) 1.32 (1.07-1.63) 1.33 (1.00-1.75) 1.43 (0.87-2.35) 1.16 (0.74-1.82)
Dose vs low-dose H2RA
High-dose H2RA 0.96 (0.67-1.37) 0.95 (0.61-1.47) 1.05 (0.84-1.32) 1.00 (0.85-1.19) 0.95 (0.75-1.20) 0.92 (0.63-1.34)
Low-dose PPI 2.21 (1.98-2.44) 1.28 (1.03-1.59) 1.27 (1.12-1.44) 1.33 (1.15-1.54) 1.29 (1.06-1.55) 1.28 (1.02-1.61)
High-dose PPI 2.29 (1.76-2.82) 2.81 (2.23-3.54) 1.20 (1.07-1.35) 1.15 (1.00-1.31) 1.22 (0.95-1.56) 1.23 (0.92-1.63)
Duration of acid suppressingtherapy vs <72 h
3-7 d 1.13 (0.88-1.45) 1.12 (0.81-1.51) 1.22 (1.08-1.38) 1.17 (0.94-1.44) 0.90 (0.73-1.11) 1.08 (0.79-1.46)
8-14 d 1.30 (0.93-1.82) 1.04 (0.68-1.61) 1.34 (0.97-1.86) 1.26 (0.94-1.69) 0.77 (0.53-1.12) 0.70 (0.44-1.10)
>14 d 1.10 (0.74-1.63) 0.83 (0.43-1.59) 1.08 (0.70-1.68) 1.04 (0.80-1.36) 1.12 (0.67-1.88) 1.21 (0.77-1.89)
Age vs <40 y
40-49 1.20 (0.88-1.62) 1.20 (0.80-1.81) 0.91 (0.80-1.04) 0.95 (0.76-1.18) 0.81 (0.54-1.21) 1.13 (0.75-1.72)
50-59 1.46 (1.18-1.83) 1.47 (1.08-1.99) 0.78 (0.66-0.92) 0.88 (0.74-1.05) 0.85 (0.62-1.16) 1.31 (0.82-2.09)
60-69 1.66 (1.26-2.19) 1.84 (1.32-2.56) 0.70 (0.58-0.84) 0.86 (0.68-1.09) 0.81 (0.56-1.17) 1.49 (0.93-2.39)
70-79 1.72 (1.27-2.34) 1.54 (0.97-2.43) 0.78 (0.65-0.94) 1.03 (0.83-1.27) 0.91 (0.61-1.36) 1.88 (1.12-3.18)
≥80 2.04 (1.48-2.83) 1.81 (1.01-3.26) 0.87 (0.71-1.06) 1.12 (0.89-1.41) 0.85 (0.56-1.28) 1.90 (1.20-2.99)
Male 1.17 (1.03-1.33) 1.04 (0.87-1.23) 1.40 (1.29-1.51) 1.33 (1.22-1.46) 1.08 (0.98-1.20) 1.06 (0.91-1.22)
Race vs white
Black 1.14 (0.98-1.32) 1.09 (0.86-1.39) 0.81 (0.73-0.89) 0.78 (0.69-0.87) 0.85 (0.71-1.02) 0.93 (0.73-1.18)
Hispanic 1.07 (0.76-1.51) 1.20 (0.74-1.97) 1.03 (0.83-1.28) 1.07 (0.83-1.38) 0.90 (0.52-1.57) 1.18 (0.62-2.26)
Other 0.34 (0.10-1.15) 0.72 (0.43-1.22) 1.14 (0.86-1.53) 0.90 (0.71-1.12) 1.32 (0.55-3.18) 1.28 (0.76-2.16)
Mechanical ventilation daysvs <72 h
3-7 d 0.99 (0.80-1.24) 1.12 (0.80-1.57) 1.69 (1.40-2.04) 1.83 (1.43-2.33) 1.39 (1.01-1.90) 1.32 (0.88-1.98)
8-14 d 0.81 (0.61-1.07) 1.06 (0.74-1.51) 2.72 (1.87-3.94) 3.35 (2.45-4.58) 1.99 (1.20-3.29) 2.48 (1.36-4.53)
>14 d 1.06 (0.74-1.51) 1.66 (0.94-2.94) 4.17 (2.61-6.66) 5.00 (3.73-6.72) 2.07 (1.08-3.98) 1.95 (1.06-3.58)
ICD-9 coded disease state
Acute hepatic injury 1.56 (1.29-1.88) 1.42 (0.88-2.28) 1.47 (1.23-1.73) 1.32 (1.00-1.63) 1.76 (1.25-2.49) 0.73 (0.41-1.30)
Chronic hepatic injury 1.85 (1.47-2.33) 2.36 (1.59-3.48) 0.97 (0.80-1.17) 0.92 (0.72-1.18) 0.78 (0.58-1.06) 0.98 (0.57-1.66)
Acute kidney injury 1.21 (1.02-1.43) 1.53 (1.13-2.09) 1.47 (1.30-1.66) 1.20 (1.05-1.38) 1.36 (1.04-1.77) 1.28 (1.00-1.65)
Chronic kidney injury 0.96 (0.80-1.14) 0.96 (0.70-1.31) 1.14 (1.00-1.29) 0.89 (0.74-1.06) 1.29 (1.08-1.53) 1.19 (0.88-1.62)
Burn injury 1.11 (0.80-1.41) 1.22 (0.85-1.59) 0.89 (0.41-1.93) 1.85 (1.36-2.49) 1.08 (0.81-1.33) 1.03 (0.62-1.49)
Neurologic injury 1.15 (1.00-1.32) 1.25 (1.06-1.48) 1.50 (1.35-1.67) 1.48 (1.32-1.66) 0.98 (0.84-1.14) 0.82 (0.65-1.04)
Trauma/major surgery 1.12 (0.71-1.75) 1.01 (0.63-1.73) 1.47 (1.19-1.82) 1.21 (1.04-1.41) 1.76 (1.18-2.60) 0.86 (0.54-1.37)
Transplant 1.74 (0.63-4.79) 1.18 (0.78-1.74) 2.24 (1.11-4.52) 3.96 (1.69-9.28) 5.41 (1.76-16.62) 5.26 (1.27-21.76)
Pancreatitis 1.28 (0.96-1.72) 1.42 (0.95-2.13) 1.05 (0.84-1.31) 0.94 (0.73-1.21) 1.44 (0.99-2.08) 1.29 (0.74-2.25)
Inflammatory bowel disease 1.24 (0.68-2.25) 1.29 (0.51-3.26) Not included Not included 3.14 (2.23-4.40) 3.57 (2.12-5.79)
Previous ulcer 0.87 (0.60-1.26) 1.14 (0.66-1.96) Not included Not included 0.72 (0.48-1.10) 0.80 (0.38-1.68)
Sepsis 1.00 (0.79-1.25) 1.12 (0.91-1.38) 1.28 (1.05-1.51) 1.39 (1.16-1.61) 1.43 (1.07-1.87) 1.55 (1.30-1.85)
Shock or hypotension 1.17 (1.04-1.33) 1.17 (1.00-1.34) 1.28 (1.18-1.37) 1.15 (1.02-1.30) 1.09 (0.93-1.27) 1.24 (1.04-1.49)
Coagulopathy 1.7 (1.35-2.14) 2.15 (1.51-3.05) Not included Not included Not included Not included
Neutropenia 0.68 (0.40-1.15) 0.61 (0.20-1.89) 0.77 (0.52-1.14) 1.31 (0.74-2.32) 1.08 (0.48-2.43) 1.67 (0.62-4.47)
Thrombocytopenia 0.70 (0.56-0.87) 0.65 (0.42-1.00) Not included Not included Not included Not included
(continued)
Research Original Investigation H2 Receptor Antagonists vs Proton Pump Inhibitors
572 JAMA Internal Medicine April 2014 Volume 174, Number 4 jamainternalmedicine.com
Copyright 2014 American Medical Association. All rights reserved.
Downloaded From: http://archinte.jamanetwork.com/ by a Gakko Hojin Jikei Daigaku User on 06/09/2014
結果(MulMvariate Analyses) 危険因子の検討 ①消化管出血
Copyright 2014 American Medical Association. All rights reserved.
Table 6. Multivariable Regression Models of Adjusted ORs for Secondary GI Hemorrhage, Pneumonia, and CDI With Propensity Scoreas a Covariate and After Matchinga
Parameter
OR (95% CI)
GI Hemorrhage Pneumonia CDIPropensity Score
(n = 1563)Matching(n = 624)
Propensity Score(n = 12 065)
Matching(n = 5697)
Propensity Score(n = 1129)
Matching(n = 527)
PPI vs H2RA, all years 2.24 (1.81-2.76) 1.95 (1.44-2.65) 1.2 (1.03-1.41) 1.23 (1.07-1.43) 1.29 (1.04-1.59) 1.31 (1.04-1.64)
2003 1.82 (1.41-2.36) 1.79 (1.27-2.53) 1.05 (0.83-1.33) 1.11 (0.89-1.40) 1.13 (0.88-1.48) 1.38 (0.90-2.13)
2004 1.81 (1.30-2.52) 1.60 (1.04-2.47) 1.09 (0.83-1.43) 1.09 (0.83-1.43) 1.08 (0.78-1.51) 1.24 (0.80-1.93)
2005 3.71 (2.67-5.16) 3.58 (2.24-5.71) 1.22 (1.00-1.48) 1.29 (1.06-1.58) 1.31 (0.95-1.81) 1.32 (0.91-1.91)
2006 2.20 (1.41-3.44) 1.51 (0.95-2.39) 1.28 (1.05-1.56) 1.36 (1.07-1.72) 1.51 (1.08-2.13) 1.53 (1.02-2.31)
2007 2.71 (1.73-4.23) 2.31 (1.31-4.07) 1.30 (1.00-1.70) 1.26 (0.93-1.69) 1.30 (0.92-1.84) 1.23 (0.82-1.85)
2008 1.71 (1.29-2.28) 1.54 (0.80-2.97) 1.32 (1.07-1.63) 1.33 (1.00-1.75) 1.43 (0.87-2.35) 1.16 (0.74-1.82)
Dose vs low-dose H2RA
High-dose H2RA 0.96 (0.67-1.37) 0.95 (0.61-1.47) 1.05 (0.84-1.32) 1.00 (0.85-1.19) 0.95 (0.75-1.20) 0.92 (0.63-1.34)
Low-dose PPI 2.21 (1.98-2.44) 1.28 (1.03-1.59) 1.27 (1.12-1.44) 1.33 (1.15-1.54) 1.29 (1.06-1.55) 1.28 (1.02-1.61)
High-dose PPI 2.29 (1.76-2.82) 2.81 (2.23-3.54) 1.20 (1.07-1.35) 1.15 (1.00-1.31) 1.22 (0.95-1.56) 1.23 (0.92-1.63)
Duration of acid suppressingtherapy vs <72 h
3-7 d 1.13 (0.88-1.45) 1.12 (0.81-1.51) 1.22 (1.08-1.38) 1.17 (0.94-1.44) 0.90 (0.73-1.11) 1.08 (0.79-1.46)
8-14 d 1.30 (0.93-1.82) 1.04 (0.68-1.61) 1.34 (0.97-1.86) 1.26 (0.94-1.69) 0.77 (0.53-1.12) 0.70 (0.44-1.10)
>14 d 1.10 (0.74-1.63) 0.83 (0.43-1.59) 1.08 (0.70-1.68) 1.04 (0.80-1.36) 1.12 (0.67-1.88) 1.21 (0.77-1.89)
Age vs <40 y
40-49 1.20 (0.88-1.62) 1.20 (0.80-1.81) 0.91 (0.80-1.04) 0.95 (0.76-1.18) 0.81 (0.54-1.21) 1.13 (0.75-1.72)
50-59 1.46 (1.18-1.83) 1.47 (1.08-1.99) 0.78 (0.66-0.92) 0.88 (0.74-1.05) 0.85 (0.62-1.16) 1.31 (0.82-2.09)
60-69 1.66 (1.26-2.19) 1.84 (1.32-2.56) 0.70 (0.58-0.84) 0.86 (0.68-1.09) 0.81 (0.56-1.17) 1.49 (0.93-2.39)
70-79 1.72 (1.27-2.34) 1.54 (0.97-2.43) 0.78 (0.65-0.94) 1.03 (0.83-1.27) 0.91 (0.61-1.36) 1.88 (1.12-3.18)
≥80 2.04 (1.48-2.83) 1.81 (1.01-3.26) 0.87 (0.71-1.06) 1.12 (0.89-1.41) 0.85 (0.56-1.28) 1.90 (1.20-2.99)
Male 1.17 (1.03-1.33) 1.04 (0.87-1.23) 1.40 (1.29-1.51) 1.33 (1.22-1.46) 1.08 (0.98-1.20) 1.06 (0.91-1.22)
Race vs white
Black 1.14 (0.98-1.32) 1.09 (0.86-1.39) 0.81 (0.73-0.89) 0.78 (0.69-0.87) 0.85 (0.71-1.02) 0.93 (0.73-1.18)
Hispanic 1.07 (0.76-1.51) 1.20 (0.74-1.97) 1.03 (0.83-1.28) 1.07 (0.83-1.38) 0.90 (0.52-1.57) 1.18 (0.62-2.26)
Other 0.34 (0.10-1.15) 0.72 (0.43-1.22) 1.14 (0.86-1.53) 0.90 (0.71-1.12) 1.32 (0.55-3.18) 1.28 (0.76-2.16)
Mechanical ventilation daysvs <72 h
3-7 d 0.99 (0.80-1.24) 1.12 (0.80-1.57) 1.69 (1.40-2.04) 1.83 (1.43-2.33) 1.39 (1.01-1.90) 1.32 (0.88-1.98)
8-14 d 0.81 (0.61-1.07) 1.06 (0.74-1.51) 2.72 (1.87-3.94) 3.35 (2.45-4.58) 1.99 (1.20-3.29) 2.48 (1.36-4.53)
>14 d 1.06 (0.74-1.51) 1.66 (0.94-2.94) 4.17 (2.61-6.66) 5.00 (3.73-6.72) 2.07 (1.08-3.98) 1.95 (1.06-3.58)
ICD-9 coded disease state
Acute hepatic injury 1.56 (1.29-1.88) 1.42 (0.88-2.28) 1.47 (1.23-1.73) 1.32 (1.00-1.63) 1.76 (1.25-2.49) 0.73 (0.41-1.30)
Chronic hepatic injury 1.85 (1.47-2.33) 2.36 (1.59-3.48) 0.97 (0.80-1.17) 0.92 (0.72-1.18) 0.78 (0.58-1.06) 0.98 (0.57-1.66)
Acute kidney injury 1.21 (1.02-1.43) 1.53 (1.13-2.09) 1.47 (1.30-1.66) 1.20 (1.05-1.38) 1.36 (1.04-1.77) 1.28 (1.00-1.65)
Chronic kidney injury 0.96 (0.80-1.14) 0.96 (0.70-1.31) 1.14 (1.00-1.29) 0.89 (0.74-1.06) 1.29 (1.08-1.53) 1.19 (0.88-1.62)
Burn injury 1.11 (0.80-1.41) 1.22 (0.85-1.59) 0.89 (0.41-1.93) 1.85 (1.36-2.49) 1.08 (0.81-1.33) 1.03 (0.62-1.49)
Neurologic injury 1.15 (1.00-1.32) 1.25 (1.06-1.48) 1.50 (1.35-1.67) 1.48 (1.32-1.66) 0.98 (0.84-1.14) 0.82 (0.65-1.04)
Trauma/major surgery 1.12 (0.71-1.75) 1.01 (0.63-1.73) 1.47 (1.19-1.82) 1.21 (1.04-1.41) 1.76 (1.18-2.60) 0.86 (0.54-1.37)
Transplant 1.74 (0.63-4.79) 1.18 (0.78-1.74) 2.24 (1.11-4.52) 3.96 (1.69-9.28) 5.41 (1.76-16.62) 5.26 (1.27-21.76)
Pancreatitis 1.28 (0.96-1.72) 1.42 (0.95-2.13) 1.05 (0.84-1.31) 0.94 (0.73-1.21) 1.44 (0.99-2.08) 1.29 (0.74-2.25)
Inflammatory bowel disease 1.24 (0.68-2.25) 1.29 (0.51-3.26) Not included Not included 3.14 (2.23-4.40) 3.57 (2.12-5.79)
Previous ulcer 0.87 (0.60-1.26) 1.14 (0.66-1.96) Not included Not included 0.72 (0.48-1.10) 0.80 (0.38-1.68)
Sepsis 1.00 (0.79-1.25) 1.12 (0.91-1.38) 1.28 (1.05-1.51) 1.39 (1.16-1.61) 1.43 (1.07-1.87) 1.55 (1.30-1.85)
Shock or hypotension 1.17 (1.04-1.33) 1.17 (1.00-1.34) 1.28 (1.18-1.37) 1.15 (1.02-1.30) 1.09 (0.93-1.27) 1.24 (1.04-1.49)
Coagulopathy 1.7 (1.35-2.14) 2.15 (1.51-3.05) Not included Not included Not included Not included
Neutropenia 0.68 (0.40-1.15) 0.61 (0.20-1.89) 0.77 (0.52-1.14) 1.31 (0.74-2.32) 1.08 (0.48-2.43) 1.67 (0.62-4.47)
Thrombocytopenia 0.70 (0.56-0.87) 0.65 (0.42-1.00) Not included Not included Not included Not included
(continued)
Research Original Investigation H2 Receptor Antagonists vs Proton Pump Inhibitors
572 JAMA Internal Medicine April 2014 Volume 174, Number 4 jamainternalmedicine.com
Copyright 2014 American Medical Association. All rights reserved.
Downloaded From: http://archinte.jamanetwork.com/ by a Gakko Hojin Jikei Daigaku User on 06/09/2014
Copyright 2014 American Medical Association. All rights reserved.
data that is available within this database is limited, and whileextensive, the database may not apply to all critically ill pa-tients. Clinical data (eg, endoscopy or bronchoscopy) and ac-tual laboratory results are unavailable. We are unable to vali-date associations between ICU and hospital lengths of stay,mortality, and ICU and hospital costs and GI hemorrhage, pneu-monia, or CDI. Lastly, most of the mechanically ventilated pa-tients received an acid suppressant, so we are unable to makecomparisons between H2RAs, PPIs, and no acid suppression.
Conclusions
Proton pump inhibitor therapy is associated with greaterrisks of GI hemorrhage, pneumonia, and CDI compared withH2RA therapy in mechanically ventilated patients. Numer-ous other risk factors have been identified for each of theseoutcomes. Additional studies are needed to confirm theseresults.
ARTICLE INFORMATION
Accepted for Publication: November 18, 2013.
Published Online: February 17, 2014.doi:10.1001/jamainternmed.2013.14673.
Author Contributions: Dr MacLaren had full accessto all of the data in the study and takesresponsibility for the integrity of the data and theaccuracy of the data analysis.Study concept and design: Reynolds.Acquisition of data: MacLaren.Analysis and interpretation of data: MacLaren,Reynolds, Allen.Drafting of the manuscript: MacLaren.Critical revision of the manuscript for importantintellectual content: MacLaren, Reynolds, Allen.Statistical analysis: MacLaren, Allen.Administrative, technical, and material support:Reynolds.Study supervision: Reynolds.
Conflict of Interest Disclosures: None reported.
Previous Presentation: An abstract of this studywas presented as a poster at the Society of CriticalCare Medicine Congress; January 10-13, 2014; SanFrancisco, California.
Additional Contributions: The Premier PerspectiveDatabase was provided in kind by Kavita Nair, PhD,Center for Pharmaceutical Outcomes Research,University of Colorado Skaggs School of Pharmacyand Pharmaceutical Sciences.
REFERENCES
1. MacLaren R. A review of stress ulcer prophylaxis.J Pharm Pract. 2002;15(2):147-157.
2. Ali T, Harty RF. Stress-induced ulcer bleeding incritically ill patients. Gastroenterol Clin North Am.2009;38(2):245-265.
3. ASHP Commission on Therapeutics. ASHPtherapeutics guidelines on stress ulcer prophylaxis.Am J Health Syst Pharm. 1999;56:347-379.
4. Cook DJ, Griffith LE, Walter SD, et al; CanadianCritical Care Trials Group. The attributable mortalityand length of intensive care unit stay of clinicallyimportant gastrointestinal bleeding in critically illpatients. Crit Care. 2001;5(6):368-375.
5. Wunsch H, Linde-Zwirble WT, Angus DC,Hartman ME, Milbrandt EB, Kahn JM. The
epidemiology of mechanical ventilation use in theUnited States. Crit Care Med. 2010;38(10):1947-1953.
6. Cook DJ, Reeve BK, Guyatt GH, et al. Stress ulcerprophylaxis in critically ill patients: resolvingdiscordant meta-analyses. JAMA.1996;275(4):308-314.
7. Cook D, Guyatt G, Marshall J, et al; CanadianCritical Care Trials Group. A comparison ofsucralfate and ranitidine for the prevention of uppergastrointestinal bleeding in patients requiringmechanical ventilation. N Engl J Med.1998;338(12):791-797.
8. Alhazzani W, Alenezi F, Jaeschke RZ, Moayyedi P,Cook DJ. Proton pump inhibitors versus histamine 2receptor antagonists for stress ulcer prophylaxis incritically ill patients: a systematic review andmeta-analysis. Crit Care Med. 2013;41(3):693-705.
9. Lin PC, Chang CH, Hsu PI, Tseng PL, Huang YB.The efficacy and safety of proton pump inhibitorsvs histamine-2 receptor antagonists for stress ulcerbleeding prophylaxis among critical care patients:a meta-analysis. Crit Care Med. 2010;38(4):1197-1205.
Table 6. Multivariable Regression Models of Adjusted ORs for Secondary GI Hemorrhage, Pneumonia, and CDI With Propensity Scoreas a Covariate and After Matchinga (continued)
Parameter
OR (95% CI)
GI Hemorrhage Pneumonia CDIPropensity Score
(n = 1563)Matching(n = 624)
Propensity Score(n = 12 065)
Matching(n = 5697)
Propensity Score(n = 1129)
Matching(n = 527)
Primary or secondary diagnosis
Hypertension 0.77 (0.67-0.87) 0.75 (0.62-0.91) 0.79 (0.72-0.87) 0.77 (0.69-0.86) 0.87 (0.75-1.00) 0.91 (0.78-1.07)
Sepsis 1.19 (1.06-1.34) 1.12 (0.90-1.39) 1.33 (1.25-1.45) 1.44 (1.25-1.65) 1.05 (0.89-1.23) 1.55 (1.30-1.85)
Acute respiratory failure 1.24 (1.08-1.41) 1.33 (1.13-1.57) 1.50 (1.33-1.70) 2 (1.72-2.34) 2.10 (1.52-2.89) 1.14 (0.95-1.36)
Congestive heart failure 1.09 (0.96-1.25) 1.31 (1.10-1.56) 1.11 (1.02-1.20) 1.13 (1.02-1.24) 1.16 (1.04-1.29) 1.13 (0.93-1.26)
Acute kidney injury 1.19 (1.04-1.36) 0.98 (0.78-1.23) 1.24 (1.09-1.41) 1.24 (1.05-1.46) 1.09 (0.90-1.31) 1.13 (0.93-1.26)
Coronary artery disease 0.89 (0.73-1.10) 0.7 (0.51-1.16) 0.78 (0.69-0.87) 0.72 (0.62-0.85) 1.04 (0.91-1.18) 0.77 (0.61-0.99)
Myocardial infarction 1.67 (1.42-1.96) 1.68 (1.29-2.17) 1.12 (1.00-1.25) 1.21 (1.02-1.43) 0.89 (0.68-1.16) 0.94 (0.69-1.29)
Anticoagulant use 0.93 (0.79-1.10) 0.93 (0.77-1.13) Not included Not included Not included Not included
Platelet inhibitor use 0.76 (0.68-0.85) 1.04 (0.85-1.29) Not included Not included Not included Not included
Ampicillin use Not included Not included Not included Not included 1.11 (0.90-1.35) 1.26 (1.01-1.57)
Carbapenem use Not included Not included Not included Not included 1.66 (1.42-1.95) 1.56 (1.17-2.09)
Piperacillin use Not included Not included Not included Not included 1.29 (1.11-1.50) 1.27 (1.04-1.56)
Total parenteral nutrition 1.63 (0.97-2.74) 3.29 (1.93-5.60) 1.70 (1.08-2.69) 2.12 (1.41-3.20) 4.26 (1.92-9.49) 4.82 (3.09-7.53)
Abbreviations: CDI, Clostridium difficile infection; GI, gastrointestinal tract;H2RA, histamine-2 receptor antagonist; ICD-9, International Classification ofDiseases, Ninth Revision; OR, odds ratios; PPI, proton pump inhibitor.a Data are presented as OR (95% CI) from multivariable regression models using
generalized estimating equation with a logit-link (SAS PROC GENMOD).Propensity score and subsequent matching included the following variables:
age; sex; admission year; primary diagnosis; ICD-9–coded disease statesoccurring within 48 hours of admission to the intensive care unit; and use ofcorticosteroids, anticoagulants, platelet inhibitors, or total parenteral nutritionwithin 48 hours of admission to the intensive care unit. Definitions of diseasestates and drug therapies are provided in the supplementary information.
H2 Receptor Antagonists vs Proton Pump Inhibitors Original Investigation Research
jamainternalmedicine.com JAMA Internal Medicine April 2014 Volume 174, Number 4 573
Copyright 2014 American Medical Association. All rights reserved.
Downloaded From: http://archinte.jamanetwork.com/ by a Gakko Hojin Jikei Daigaku User on 06/09/2014
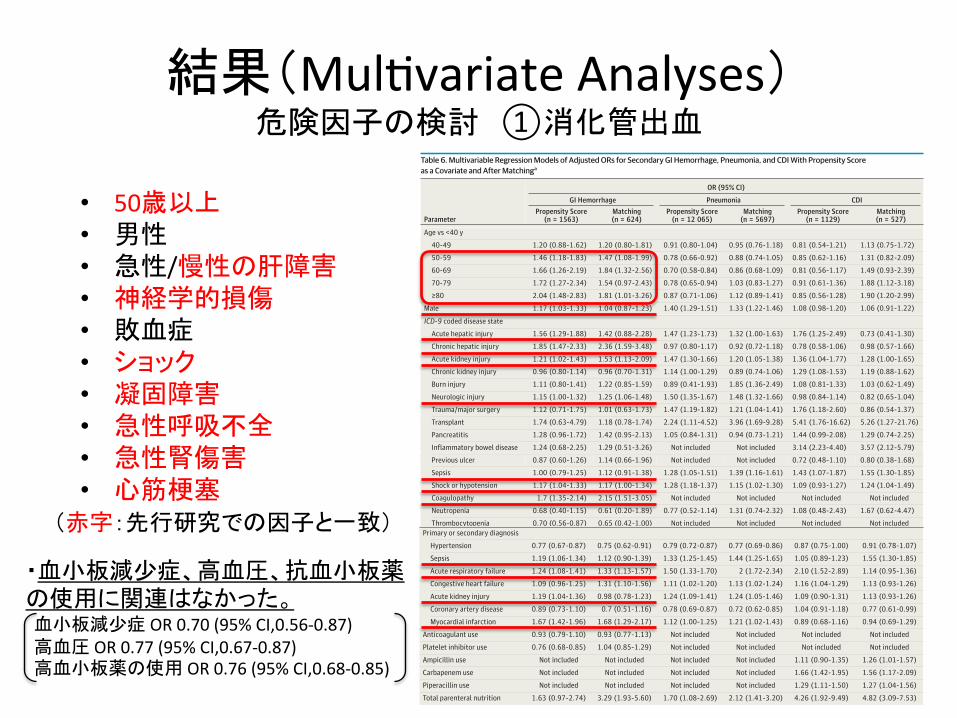
• 50歳以上 • 男性 • 急性/慢性の肝障害 • 神経学的損傷 • 敗血症 • ショック • 凝固障害 • 急性呼吸不全 • 急性腎傷害 • 心筋梗塞
・血小板減少症、高血圧、抗血小板薬の使用に関連はなかった。 血小板減少症 OR 0.70 (95% CI,0.56-‐0.87) 高血圧 OR 0.77 (95% CI,0.67-‐0.87) 高血小板薬の使用 OR 0.76 (95% CI,0.68-‐0.85)
(赤字:先行研究での因子と一致)
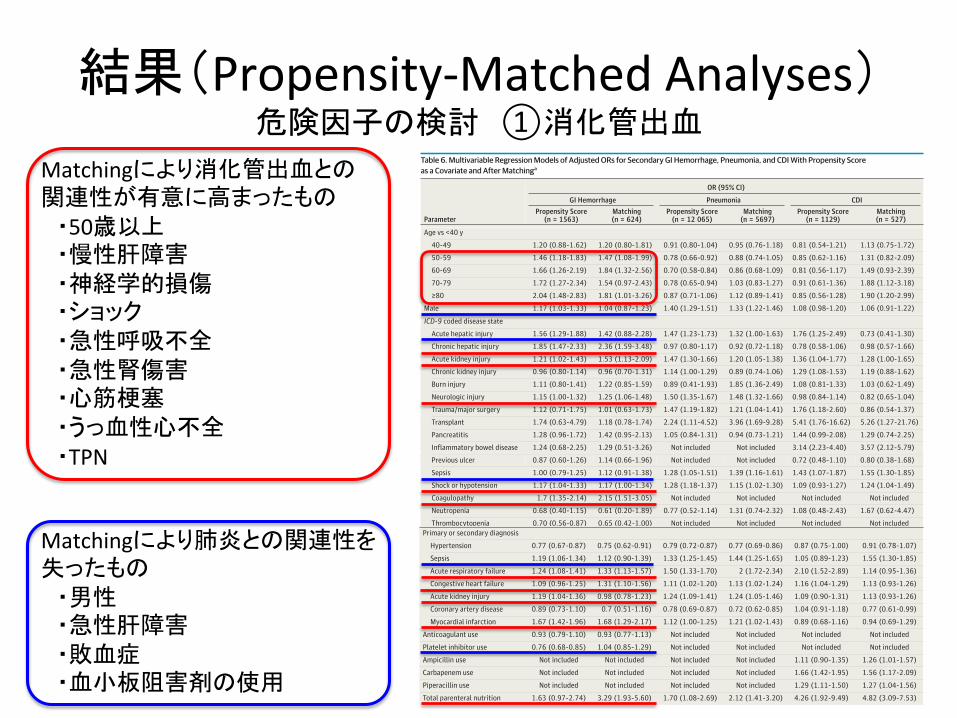
結果(Propensity-‐Matched Analyses) 危険因子の検討 ①消化管出血
Matchingにより消化管出血との関連性が有意に高まったもの
・50歳以上 ・慢性肝障害 ・神経学的損傷 ・ショック ・急性呼吸不全 ・急性腎傷害 ・心筋梗塞 ・うっ血性心不全 ・TPN
Copyright 2014 American Medical Association. All rights reserved.
Table 6. Multivariable Regression Models of Adjusted ORs for Secondary GI Hemorrhage, Pneumonia, and CDI With Propensity Scoreas a Covariate and After Matchinga
Parameter
OR (95% CI)
GI Hemorrhage Pneumonia CDIPropensity Score
(n = 1563)Matching(n = 624)
Propensity Score(n = 12 065)
Matching(n = 5697)
Propensity Score(n = 1129)
Matching(n = 527)
PPI vs H2RA, all years 2.24 (1.81-2.76) 1.95 (1.44-2.65) 1.2 (1.03-1.41) 1.23 (1.07-1.43) 1.29 (1.04-1.59) 1.31 (1.04-1.64)
2003 1.82 (1.41-2.36) 1.79 (1.27-2.53) 1.05 (0.83-1.33) 1.11 (0.89-1.40) 1.13 (0.88-1.48) 1.38 (0.90-2.13)
2004 1.81 (1.30-2.52) 1.60 (1.04-2.47) 1.09 (0.83-1.43) 1.09 (0.83-1.43) 1.08 (0.78-1.51) 1.24 (0.80-1.93)
2005 3.71 (2.67-5.16) 3.58 (2.24-5.71) 1.22 (1.00-1.48) 1.29 (1.06-1.58) 1.31 (0.95-1.81) 1.32 (0.91-1.91)
2006 2.20 (1.41-3.44) 1.51 (0.95-2.39) 1.28 (1.05-1.56) 1.36 (1.07-1.72) 1.51 (1.08-2.13) 1.53 (1.02-2.31)
2007 2.71 (1.73-4.23) 2.31 (1.31-4.07) 1.30 (1.00-1.70) 1.26 (0.93-1.69) 1.30 (0.92-1.84) 1.23 (0.82-1.85)
2008 1.71 (1.29-2.28) 1.54 (0.80-2.97) 1.32 (1.07-1.63) 1.33 (1.00-1.75) 1.43 (0.87-2.35) 1.16 (0.74-1.82)
Dose vs low-dose H2RA
High-dose H2RA 0.96 (0.67-1.37) 0.95 (0.61-1.47) 1.05 (0.84-1.32) 1.00 (0.85-1.19) 0.95 (0.75-1.20) 0.92 (0.63-1.34)
Low-dose PPI 2.21 (1.98-2.44) 1.28 (1.03-1.59) 1.27 (1.12-1.44) 1.33 (1.15-1.54) 1.29 (1.06-1.55) 1.28 (1.02-1.61)
High-dose PPI 2.29 (1.76-2.82) 2.81 (2.23-3.54) 1.20 (1.07-1.35) 1.15 (1.00-1.31) 1.22 (0.95-1.56) 1.23 (0.92-1.63)
Duration of acid suppressingtherapy vs <72 h
3-7 d 1.13 (0.88-1.45) 1.12 (0.81-1.51) 1.22 (1.08-1.38) 1.17 (0.94-1.44) 0.90 (0.73-1.11) 1.08 (0.79-1.46)
8-14 d 1.30 (0.93-1.82) 1.04 (0.68-1.61) 1.34 (0.97-1.86) 1.26 (0.94-1.69) 0.77 (0.53-1.12) 0.70 (0.44-1.10)
>14 d 1.10 (0.74-1.63) 0.83 (0.43-1.59) 1.08 (0.70-1.68) 1.04 (0.80-1.36) 1.12 (0.67-1.88) 1.21 (0.77-1.89)
Age vs <40 y
40-49 1.20 (0.88-1.62) 1.20 (0.80-1.81) 0.91 (0.80-1.04) 0.95 (0.76-1.18) 0.81 (0.54-1.21) 1.13 (0.75-1.72)
50-59 1.46 (1.18-1.83) 1.47 (1.08-1.99) 0.78 (0.66-0.92) 0.88 (0.74-1.05) 0.85 (0.62-1.16) 1.31 (0.82-2.09)
60-69 1.66 (1.26-2.19) 1.84 (1.32-2.56) 0.70 (0.58-0.84) 0.86 (0.68-1.09) 0.81 (0.56-1.17) 1.49 (0.93-2.39)
70-79 1.72 (1.27-2.34) 1.54 (0.97-2.43) 0.78 (0.65-0.94) 1.03 (0.83-1.27) 0.91 (0.61-1.36) 1.88 (1.12-3.18)
≥80 2.04 (1.48-2.83) 1.81 (1.01-3.26) 0.87 (0.71-1.06) 1.12 (0.89-1.41) 0.85 (0.56-1.28) 1.90 (1.20-2.99)
Male 1.17 (1.03-1.33) 1.04 (0.87-1.23) 1.40 (1.29-1.51) 1.33 (1.22-1.46) 1.08 (0.98-1.20) 1.06 (0.91-1.22)
Race vs white
Black 1.14 (0.98-1.32) 1.09 (0.86-1.39) 0.81 (0.73-0.89) 0.78 (0.69-0.87) 0.85 (0.71-1.02) 0.93 (0.73-1.18)
Hispanic 1.07 (0.76-1.51) 1.20 (0.74-1.97) 1.03 (0.83-1.28) 1.07 (0.83-1.38) 0.90 (0.52-1.57) 1.18 (0.62-2.26)
Other 0.34 (0.10-1.15) 0.72 (0.43-1.22) 1.14 (0.86-1.53) 0.90 (0.71-1.12) 1.32 (0.55-3.18) 1.28 (0.76-2.16)
Mechanical ventilation daysvs <72 h
3-7 d 0.99 (0.80-1.24) 1.12 (0.80-1.57) 1.69 (1.40-2.04) 1.83 (1.43-2.33) 1.39 (1.01-1.90) 1.32 (0.88-1.98)
8-14 d 0.81 (0.61-1.07) 1.06 (0.74-1.51) 2.72 (1.87-3.94) 3.35 (2.45-4.58) 1.99 (1.20-3.29) 2.48 (1.36-4.53)
>14 d 1.06 (0.74-1.51) 1.66 (0.94-2.94) 4.17 (2.61-6.66) 5.00 (3.73-6.72) 2.07 (1.08-3.98) 1.95 (1.06-3.58)
ICD-9 coded disease state
Acute hepatic injury 1.56 (1.29-1.88) 1.42 (0.88-2.28) 1.47 (1.23-1.73) 1.32 (1.00-1.63) 1.76 (1.25-2.49) 0.73 (0.41-1.30)
Chronic hepatic injury 1.85 (1.47-2.33) 2.36 (1.59-3.48) 0.97 (0.80-1.17) 0.92 (0.72-1.18) 0.78 (0.58-1.06) 0.98 (0.57-1.66)
Acute kidney injury 1.21 (1.02-1.43) 1.53 (1.13-2.09) 1.47 (1.30-1.66) 1.20 (1.05-1.38) 1.36 (1.04-1.77) 1.28 (1.00-1.65)
Chronic kidney injury 0.96 (0.80-1.14) 0.96 (0.70-1.31) 1.14 (1.00-1.29) 0.89 (0.74-1.06) 1.29 (1.08-1.53) 1.19 (0.88-1.62)
Burn injury 1.11 (0.80-1.41) 1.22 (0.85-1.59) 0.89 (0.41-1.93) 1.85 (1.36-2.49) 1.08 (0.81-1.33) 1.03 (0.62-1.49)
Neurologic injury 1.15 (1.00-1.32) 1.25 (1.06-1.48) 1.50 (1.35-1.67) 1.48 (1.32-1.66) 0.98 (0.84-1.14) 0.82 (0.65-1.04)
Trauma/major surgery 1.12 (0.71-1.75) 1.01 (0.63-1.73) 1.47 (1.19-1.82) 1.21 (1.04-1.41) 1.76 (1.18-2.60) 0.86 (0.54-1.37)
Transplant 1.74 (0.63-4.79) 1.18 (0.78-1.74) 2.24 (1.11-4.52) 3.96 (1.69-9.28) 5.41 (1.76-16.62) 5.26 (1.27-21.76)
Pancreatitis 1.28 (0.96-1.72) 1.42 (0.95-2.13) 1.05 (0.84-1.31) 0.94 (0.73-1.21) 1.44 (0.99-2.08) 1.29 (0.74-2.25)
Inflammatory bowel disease 1.24 (0.68-2.25) 1.29 (0.51-3.26) Not included Not included 3.14 (2.23-4.40) 3.57 (2.12-5.79)
Previous ulcer 0.87 (0.60-1.26) 1.14 (0.66-1.96) Not included Not included 0.72 (0.48-1.10) 0.80 (0.38-1.68)
Sepsis 1.00 (0.79-1.25) 1.12 (0.91-1.38) 1.28 (1.05-1.51) 1.39 (1.16-1.61) 1.43 (1.07-1.87) 1.55 (1.30-1.85)
Shock or hypotension 1.17 (1.04-1.33) 1.17 (1.00-1.34) 1.28 (1.18-1.37) 1.15 (1.02-1.30) 1.09 (0.93-1.27) 1.24 (1.04-1.49)
Coagulopathy 1.7 (1.35-2.14) 2.15 (1.51-3.05) Not included Not included Not included Not included
Neutropenia 0.68 (0.40-1.15) 0.61 (0.20-1.89) 0.77 (0.52-1.14) 1.31 (0.74-2.32) 1.08 (0.48-2.43) 1.67 (0.62-4.47)
Thrombocytopenia 0.70 (0.56-0.87) 0.65 (0.42-1.00) Not included Not included Not included Not included
(continued)
Research Original Investigation H2 Receptor Antagonists vs Proton Pump Inhibitors
572 JAMA Internal Medicine April 2014 Volume 174, Number 4 jamainternalmedicine.com
Copyright 2014 American Medical Association. All rights reserved.
Downloaded From: http://archinte.jamanetwork.com/ by a Gakko Hojin Jikei Daigaku User on 06/09/2014
Copyright 2014 American Medical Association. All rights reserved.
data that is available within this database is limited, and whileextensive, the database may not apply to all critically ill pa-tients. Clinical data (eg, endoscopy or bronchoscopy) and ac-tual laboratory results are unavailable. We are unable to vali-date associations between ICU and hospital lengths of stay,mortality, and ICU and hospital costs and GI hemorrhage, pneu-monia, or CDI. Lastly, most of the mechanically ventilated pa-tients received an acid suppressant, so we are unable to makecomparisons between H2RAs, PPIs, and no acid suppression.
Conclusions
Proton pump inhibitor therapy is associated with greaterrisks of GI hemorrhage, pneumonia, and CDI compared withH2RA therapy in mechanically ventilated patients. Numer-ous other risk factors have been identified for each of theseoutcomes. Additional studies are needed to confirm theseresults.
ARTICLE INFORMATION
Accepted for Publication: November 18, 2013.
Published Online: February 17, 2014.doi:10.1001/jamainternmed.2013.14673.
Author Contributions: Dr MacLaren had full accessto all of the data in the study and takesresponsibility for the integrity of the data and theaccuracy of the data analysis.Study concept and design: Reynolds.Acquisition of data: MacLaren.Analysis and interpretation of data: MacLaren,Reynolds, Allen.Drafting of the manuscript: MacLaren.Critical revision of the manuscript for importantintellectual content: MacLaren, Reynolds, Allen.Statistical analysis: MacLaren, Allen.Administrative, technical, and material support:Reynolds.Study supervision: Reynolds.
Conflict of Interest Disclosures: None reported.
Previous Presentation: An abstract of this studywas presented as a poster at the Society of CriticalCare Medicine Congress; January 10-13, 2014; SanFrancisco, California.
Additional Contributions: The Premier PerspectiveDatabase was provided in kind by Kavita Nair, PhD,Center for Pharmaceutical Outcomes Research,University of Colorado Skaggs School of Pharmacyand Pharmaceutical Sciences.
REFERENCES
1. MacLaren R. A review of stress ulcer prophylaxis.J Pharm Pract. 2002;15(2):147-157.
2. Ali T, Harty RF. Stress-induced ulcer bleeding incritically ill patients. Gastroenterol Clin North Am.2009;38(2):245-265.
3. ASHP Commission on Therapeutics. ASHPtherapeutics guidelines on stress ulcer prophylaxis.Am J Health Syst Pharm. 1999;56:347-379.
4. Cook DJ, Griffith LE, Walter SD, et al; CanadianCritical Care Trials Group. The attributable mortalityand length of intensive care unit stay of clinicallyimportant gastrointestinal bleeding in critically illpatients. Crit Care. 2001;5(6):368-375.
5. Wunsch H, Linde-Zwirble WT, Angus DC,Hartman ME, Milbrandt EB, Kahn JM. The
epidemiology of mechanical ventilation use in theUnited States. Crit Care Med. 2010;38(10):1947-1953.
6. Cook DJ, Reeve BK, Guyatt GH, et al. Stress ulcerprophylaxis in critically ill patients: resolvingdiscordant meta-analyses. JAMA.1996;275(4):308-314.
7. Cook D, Guyatt G, Marshall J, et al; CanadianCritical Care Trials Group. A comparison ofsucralfate and ranitidine for the prevention of uppergastrointestinal bleeding in patients requiringmechanical ventilation. N Engl J Med.1998;338(12):791-797.
8. Alhazzani W, Alenezi F, Jaeschke RZ, Moayyedi P,Cook DJ. Proton pump inhibitors versus histamine 2receptor antagonists for stress ulcer prophylaxis incritically ill patients: a systematic review andmeta-analysis. Crit Care Med. 2013;41(3):693-705.
9. Lin PC, Chang CH, Hsu PI, Tseng PL, Huang YB.The efficacy and safety of proton pump inhibitorsvs histamine-2 receptor antagonists for stress ulcerbleeding prophylaxis among critical care patients:a meta-analysis. Crit Care Med. 2010;38(4):1197-1205.
Table 6. Multivariable Regression Models of Adjusted ORs for Secondary GI Hemorrhage, Pneumonia, and CDI With Propensity Scoreas a Covariate and After Matchinga (continued)
Parameter
OR (95% CI)
GI Hemorrhage Pneumonia CDIPropensity Score
(n = 1563)Matching(n = 624)
Propensity Score(n = 12 065)
Matching(n = 5697)
Propensity Score(n = 1129)
Matching(n = 527)
Primary or secondary diagnosis
Hypertension 0.77 (0.67-0.87) 0.75 (0.62-0.91) 0.79 (0.72-0.87) 0.77 (0.69-0.86) 0.87 (0.75-1.00) 0.91 (0.78-1.07)
Sepsis 1.19 (1.06-1.34) 1.12 (0.90-1.39) 1.33 (1.25-1.45) 1.44 (1.25-1.65) 1.05 (0.89-1.23) 1.55 (1.30-1.85)
Acute respiratory failure 1.24 (1.08-1.41) 1.33 (1.13-1.57) 1.50 (1.33-1.70) 2 (1.72-2.34) 2.10 (1.52-2.89) 1.14 (0.95-1.36)
Congestive heart failure 1.09 (0.96-1.25) 1.31 (1.10-1.56) 1.11 (1.02-1.20) 1.13 (1.02-1.24) 1.16 (1.04-1.29) 1.13 (0.93-1.26)
Acute kidney injury 1.19 (1.04-1.36) 0.98 (0.78-1.23) 1.24 (1.09-1.41) 1.24 (1.05-1.46) 1.09 (0.90-1.31) 1.13 (0.93-1.26)
Coronary artery disease 0.89 (0.73-1.10) 0.7 (0.51-1.16) 0.78 (0.69-0.87) 0.72 (0.62-0.85) 1.04 (0.91-1.18) 0.77 (0.61-0.99)
Myocardial infarction 1.67 (1.42-1.96) 1.68 (1.29-2.17) 1.12 (1.00-1.25) 1.21 (1.02-1.43) 0.89 (0.68-1.16) 0.94 (0.69-1.29)
Anticoagulant use 0.93 (0.79-1.10) 0.93 (0.77-1.13) Not included Not included Not included Not included
Platelet inhibitor use 0.76 (0.68-0.85) 1.04 (0.85-1.29) Not included Not included Not included Not included
Ampicillin use Not included Not included Not included Not included 1.11 (0.90-1.35) 1.26 (1.01-1.57)
Carbapenem use Not included Not included Not included Not included 1.66 (1.42-1.95) 1.56 (1.17-2.09)
Piperacillin use Not included Not included Not included Not included 1.29 (1.11-1.50) 1.27 (1.04-1.56)
Total parenteral nutrition 1.63 (0.97-2.74) 3.29 (1.93-5.60) 1.70 (1.08-2.69) 2.12 (1.41-3.20) 4.26 (1.92-9.49) 4.82 (3.09-7.53)
Abbreviations: CDI, Clostridium difficile infection; GI, gastrointestinal tract;H2RA, histamine-2 receptor antagonist; ICD-9, International Classification ofDiseases, Ninth Revision; OR, odds ratios; PPI, proton pump inhibitor.a Data are presented as OR (95% CI) from multivariable regression models using
generalized estimating equation with a logit-link (SAS PROC GENMOD).Propensity score and subsequent matching included the following variables:
age; sex; admission year; primary diagnosis; ICD-9–coded disease statesoccurring within 48 hours of admission to the intensive care unit; and use ofcorticosteroids, anticoagulants, platelet inhibitors, or total parenteral nutritionwithin 48 hours of admission to the intensive care unit. Definitions of diseasestates and drug therapies are provided in the supplementary information.
H2 Receptor Antagonists vs Proton Pump Inhibitors Original Investigation Research
jamainternalmedicine.com JAMA Internal Medicine April 2014 Volume 174, Number 4 573
Copyright 2014 American Medical Association. All rights reserved.
Downloaded From: http://archinte.jamanetwork.com/ by a Gakko Hojin Jikei Daigaku User on 06/09/2014
Matchingにより肺炎との関連性を失ったもの ・男性 ・急性肝障害 ・敗血症 ・血小板阻害剤の使用

結果(MulMvariate Analyses) 危険因子の検討 ②肺炎
Copyright 2014 American Medical Association. All rights reserved.
Table 6. Multivariable Regression Models of Adjusted ORs for Secondary GI Hemorrhage, Pneumonia, and CDI With Propensity Scoreas a Covariate and After Matchinga
Parameter
OR (95% CI)
GI Hemorrhage Pneumonia CDIPropensity Score
(n = 1563)Matching(n = 624)
Propensity Score(n = 12 065)
Matching(n = 5697)
Propensity Score(n = 1129)
Matching(n = 527)
PPI vs H2RA, all years 2.24 (1.81-2.76) 1.95 (1.44-2.65) 1.2 (1.03-1.41) 1.23 (1.07-1.43) 1.29 (1.04-1.59) 1.31 (1.04-1.64)
2003 1.82 (1.41-2.36) 1.79 (1.27-2.53) 1.05 (0.83-1.33) 1.11 (0.89-1.40) 1.13 (0.88-1.48) 1.38 (0.90-2.13)
2004 1.81 (1.30-2.52) 1.60 (1.04-2.47) 1.09 (0.83-1.43) 1.09 (0.83-1.43) 1.08 (0.78-1.51) 1.24 (0.80-1.93)
2005 3.71 (2.67-5.16) 3.58 (2.24-5.71) 1.22 (1.00-1.48) 1.29 (1.06-1.58) 1.31 (0.95-1.81) 1.32 (0.91-1.91)
2006 2.20 (1.41-3.44) 1.51 (0.95-2.39) 1.28 (1.05-1.56) 1.36 (1.07-1.72) 1.51 (1.08-2.13) 1.53 (1.02-2.31)
2007 2.71 (1.73-4.23) 2.31 (1.31-4.07) 1.30 (1.00-1.70) 1.26 (0.93-1.69) 1.30 (0.92-1.84) 1.23 (0.82-1.85)
2008 1.71 (1.29-2.28) 1.54 (0.80-2.97) 1.32 (1.07-1.63) 1.33 (1.00-1.75) 1.43 (0.87-2.35) 1.16 (0.74-1.82)
Dose vs low-dose H2RA
High-dose H2RA 0.96 (0.67-1.37) 0.95 (0.61-1.47) 1.05 (0.84-1.32) 1.00 (0.85-1.19) 0.95 (0.75-1.20) 0.92 (0.63-1.34)
Low-dose PPI 2.21 (1.98-2.44) 1.28 (1.03-1.59) 1.27 (1.12-1.44) 1.33 (1.15-1.54) 1.29 (1.06-1.55) 1.28 (1.02-1.61)
High-dose PPI 2.29 (1.76-2.82) 2.81 (2.23-3.54) 1.20 (1.07-1.35) 1.15 (1.00-1.31) 1.22 (0.95-1.56) 1.23 (0.92-1.63)
Duration of acid suppressingtherapy vs <72 h
3-7 d 1.13 (0.88-1.45) 1.12 (0.81-1.51) 1.22 (1.08-1.38) 1.17 (0.94-1.44) 0.90 (0.73-1.11) 1.08 (0.79-1.46)
8-14 d 1.30 (0.93-1.82) 1.04 (0.68-1.61) 1.34 (0.97-1.86) 1.26 (0.94-1.69) 0.77 (0.53-1.12) 0.70 (0.44-1.10)
>14 d 1.10 (0.74-1.63) 0.83 (0.43-1.59) 1.08 (0.70-1.68) 1.04 (0.80-1.36) 1.12 (0.67-1.88) 1.21 (0.77-1.89)
Age vs <40 y
40-49 1.20 (0.88-1.62) 1.20 (0.80-1.81) 0.91 (0.80-1.04) 0.95 (0.76-1.18) 0.81 (0.54-1.21) 1.13 (0.75-1.72)
50-59 1.46 (1.18-1.83) 1.47 (1.08-1.99) 0.78 (0.66-0.92) 0.88 (0.74-1.05) 0.85 (0.62-1.16) 1.31 (0.82-2.09)
60-69 1.66 (1.26-2.19) 1.84 (1.32-2.56) 0.70 (0.58-0.84) 0.86 (0.68-1.09) 0.81 (0.56-1.17) 1.49 (0.93-2.39)
70-79 1.72 (1.27-2.34) 1.54 (0.97-2.43) 0.78 (0.65-0.94) 1.03 (0.83-1.27) 0.91 (0.61-1.36) 1.88 (1.12-3.18)
≥80 2.04 (1.48-2.83) 1.81 (1.01-3.26) 0.87 (0.71-1.06) 1.12 (0.89-1.41) 0.85 (0.56-1.28) 1.90 (1.20-2.99)
Male 1.17 (1.03-1.33) 1.04 (0.87-1.23) 1.40 (1.29-1.51) 1.33 (1.22-1.46) 1.08 (0.98-1.20) 1.06 (0.91-1.22)
Race vs white
Black 1.14 (0.98-1.32) 1.09 (0.86-1.39) 0.81 (0.73-0.89) 0.78 (0.69-0.87) 0.85 (0.71-1.02) 0.93 (0.73-1.18)
Hispanic 1.07 (0.76-1.51) 1.20 (0.74-1.97) 1.03 (0.83-1.28) 1.07 (0.83-1.38) 0.90 (0.52-1.57) 1.18 (0.62-2.26)
Other 0.34 (0.10-1.15) 0.72 (0.43-1.22) 1.14 (0.86-1.53) 0.90 (0.71-1.12) 1.32 (0.55-3.18) 1.28 (0.76-2.16)
Mechanical ventilation daysvs <72 h
3-7 d 0.99 (0.80-1.24) 1.12 (0.80-1.57) 1.69 (1.40-2.04) 1.83 (1.43-2.33) 1.39 (1.01-1.90) 1.32 (0.88-1.98)
8-14 d 0.81 (0.61-1.07) 1.06 (0.74-1.51) 2.72 (1.87-3.94) 3.35 (2.45-4.58) 1.99 (1.20-3.29) 2.48 (1.36-4.53)
>14 d 1.06 (0.74-1.51) 1.66 (0.94-2.94) 4.17 (2.61-6.66) 5.00 (3.73-6.72) 2.07 (1.08-3.98) 1.95 (1.06-3.58)
ICD-9 coded disease state
Acute hepatic injury 1.56 (1.29-1.88) 1.42 (0.88-2.28) 1.47 (1.23-1.73) 1.32 (1.00-1.63) 1.76 (1.25-2.49) 0.73 (0.41-1.30)
Chronic hepatic injury 1.85 (1.47-2.33) 2.36 (1.59-3.48) 0.97 (0.80-1.17) 0.92 (0.72-1.18) 0.78 (0.58-1.06) 0.98 (0.57-1.66)
Acute kidney injury 1.21 (1.02-1.43) 1.53 (1.13-2.09) 1.47 (1.30-1.66) 1.20 (1.05-1.38) 1.36 (1.04-1.77) 1.28 (1.00-1.65)
Chronic kidney injury 0.96 (0.80-1.14) 0.96 (0.70-1.31) 1.14 (1.00-1.29) 0.89 (0.74-1.06) 1.29 (1.08-1.53) 1.19 (0.88-1.62)
Burn injury 1.11 (0.80-1.41) 1.22 (0.85-1.59) 0.89 (0.41-1.93) 1.85 (1.36-2.49) 1.08 (0.81-1.33) 1.03 (0.62-1.49)
Neurologic injury 1.15 (1.00-1.32) 1.25 (1.06-1.48) 1.50 (1.35-1.67) 1.48 (1.32-1.66) 0.98 (0.84-1.14) 0.82 (0.65-1.04)
Trauma/major surgery 1.12 (0.71-1.75) 1.01 (0.63-1.73) 1.47 (1.19-1.82) 1.21 (1.04-1.41) 1.76 (1.18-2.60) 0.86 (0.54-1.37)
Transplant 1.74 (0.63-4.79) 1.18 (0.78-1.74) 2.24 (1.11-4.52) 3.96 (1.69-9.28) 5.41 (1.76-16.62) 5.26 (1.27-21.76)
Pancreatitis 1.28 (0.96-1.72) 1.42 (0.95-2.13) 1.05 (0.84-1.31) 0.94 (0.73-1.21) 1.44 (0.99-2.08) 1.29 (0.74-2.25)
Inflammatory bowel disease 1.24 (0.68-2.25) 1.29 (0.51-3.26) Not included Not included 3.14 (2.23-4.40) 3.57 (2.12-5.79)
Previous ulcer 0.87 (0.60-1.26) 1.14 (0.66-1.96) Not included Not included 0.72 (0.48-1.10) 0.80 (0.38-1.68)
Sepsis 1.00 (0.79-1.25) 1.12 (0.91-1.38) 1.28 (1.05-1.51) 1.39 (1.16-1.61) 1.43 (1.07-1.87) 1.55 (1.30-1.85)
Shock or hypotension 1.17 (1.04-1.33) 1.17 (1.00-1.34) 1.28 (1.18-1.37) 1.15 (1.02-1.30) 1.09 (0.93-1.27) 1.24 (1.04-1.49)
Coagulopathy 1.7 (1.35-2.14) 2.15 (1.51-3.05) Not included Not included Not included Not included
Neutropenia 0.68 (0.40-1.15) 0.61 (0.20-1.89) 0.77 (0.52-1.14) 1.31 (0.74-2.32) 1.08 (0.48-2.43) 1.67 (0.62-4.47)
Thrombocytopenia 0.70 (0.56-0.87) 0.65 (0.42-1.00) Not included Not included Not included Not included
(continued)
Research Original Investigation H2 Receptor Antagonists vs Proton Pump Inhibitors
572 JAMA Internal Medicine April 2014 Volume 174, Number 4 jamainternalmedicine.com
Copyright 2014 American Medical Association. All rights reserved.
Downloaded From: http://archinte.jamanetwork.com/ by a Gakko Hojin Jikei Daigaku User on 06/09/2014
Copyright 2014 American Medical Association. All rights reserved.
data that is available within this database is limited, and whileextensive, the database may not apply to all critically ill pa-tients. Clinical data (eg, endoscopy or bronchoscopy) and ac-tual laboratory results are unavailable. We are unable to vali-date associations between ICU and hospital lengths of stay,mortality, and ICU and hospital costs and GI hemorrhage, pneu-monia, or CDI. Lastly, most of the mechanically ventilated pa-tients received an acid suppressant, so we are unable to makecomparisons between H2RAs, PPIs, and no acid suppression.
Conclusions
Proton pump inhibitor therapy is associated with greaterrisks of GI hemorrhage, pneumonia, and CDI compared withH2RA therapy in mechanically ventilated patients. Numer-ous other risk factors have been identified for each of theseoutcomes. Additional studies are needed to confirm theseresults.
ARTICLE INFORMATION
Accepted for Publication: November 18, 2013.
Published Online: February 17, 2014.doi:10.1001/jamainternmed.2013.14673.
Author Contributions: Dr MacLaren had full accessto all of the data in the study and takesresponsibility for the integrity of the data and theaccuracy of the data analysis.Study concept and design: Reynolds.Acquisition of data: MacLaren.Analysis and interpretation of data: MacLaren,Reynolds, Allen.Drafting of the manuscript: MacLaren.Critical revision of the manuscript for importantintellectual content: MacLaren, Reynolds, Allen.Statistical analysis: MacLaren, Allen.Administrative, technical, and material support:Reynolds.Study supervision: Reynolds.
Conflict of Interest Disclosures: None reported.
Previous Presentation: An abstract of this studywas presented as a poster at the Society of CriticalCare Medicine Congress; January 10-13, 2014; SanFrancisco, California.
Additional Contributions: The Premier PerspectiveDatabase was provided in kind by Kavita Nair, PhD,Center for Pharmaceutical Outcomes Research,University of Colorado Skaggs School of Pharmacyand Pharmaceutical Sciences.
REFERENCES
1. MacLaren R. A review of stress ulcer prophylaxis.J Pharm Pract. 2002;15(2):147-157.
2. Ali T, Harty RF. Stress-induced ulcer bleeding incritically ill patients. Gastroenterol Clin North Am.2009;38(2):245-265.
3. ASHP Commission on Therapeutics. ASHPtherapeutics guidelines on stress ulcer prophylaxis.Am J Health Syst Pharm. 1999;56:347-379.
4. Cook DJ, Griffith LE, Walter SD, et al; CanadianCritical Care Trials Group. The attributable mortalityand length of intensive care unit stay of clinicallyimportant gastrointestinal bleeding in critically illpatients. Crit Care. 2001;5(6):368-375.
5. Wunsch H, Linde-Zwirble WT, Angus DC,Hartman ME, Milbrandt EB, Kahn JM. The
epidemiology of mechanical ventilation use in theUnited States. Crit Care Med. 2010;38(10):1947-1953.
6. Cook DJ, Reeve BK, Guyatt GH, et al. Stress ulcerprophylaxis in critically ill patients: resolvingdiscordant meta-analyses. JAMA.1996;275(4):308-314.
7. Cook D, Guyatt G, Marshall J, et al; CanadianCritical Care Trials Group. A comparison ofsucralfate and ranitidine for the prevention of uppergastrointestinal bleeding in patients requiringmechanical ventilation. N Engl J Med.1998;338(12):791-797.
8. Alhazzani W, Alenezi F, Jaeschke RZ, Moayyedi P,Cook DJ. Proton pump inhibitors versus histamine 2receptor antagonists for stress ulcer prophylaxis incritically ill patients: a systematic review andmeta-analysis. Crit Care Med. 2013;41(3):693-705.
9. Lin PC, Chang CH, Hsu PI, Tseng PL, Huang YB.The efficacy and safety of proton pump inhibitorsvs histamine-2 receptor antagonists for stress ulcerbleeding prophylaxis among critical care patients:a meta-analysis. Crit Care Med. 2010;38(4):1197-1205.
Table 6. Multivariable Regression Models of Adjusted ORs for Secondary GI Hemorrhage, Pneumonia, and CDI With Propensity Scoreas a Covariate and After Matchinga (continued)
Parameter
OR (95% CI)
GI Hemorrhage Pneumonia CDIPropensity Score
(n = 1563)Matching(n = 624)
Propensity Score(n = 12 065)
Matching(n = 5697)
Propensity Score(n = 1129)
Matching(n = 527)
Primary or secondary diagnosis
Hypertension 0.77 (0.67-0.87) 0.75 (0.62-0.91) 0.79 (0.72-0.87) 0.77 (0.69-0.86) 0.87 (0.75-1.00) 0.91 (0.78-1.07)
Sepsis 1.19 (1.06-1.34) 1.12 (0.90-1.39) 1.33 (1.25-1.45) 1.44 (1.25-1.65) 1.05 (0.89-1.23) 1.55 (1.30-1.85)
Acute respiratory failure 1.24 (1.08-1.41) 1.33 (1.13-1.57) 1.50 (1.33-1.70) 2 (1.72-2.34) 2.10 (1.52-2.89) 1.14 (0.95-1.36)
Congestive heart failure 1.09 (0.96-1.25) 1.31 (1.10-1.56) 1.11 (1.02-1.20) 1.13 (1.02-1.24) 1.16 (1.04-1.29) 1.13 (0.93-1.26)
Acute kidney injury 1.19 (1.04-1.36) 0.98 (0.78-1.23) 1.24 (1.09-1.41) 1.24 (1.05-1.46) 1.09 (0.90-1.31) 1.13 (0.93-1.26)
Coronary artery disease 0.89 (0.73-1.10) 0.7 (0.51-1.16) 0.78 (0.69-0.87) 0.72 (0.62-0.85) 1.04 (0.91-1.18) 0.77 (0.61-0.99)
Myocardial infarction 1.67 (1.42-1.96) 1.68 (1.29-2.17) 1.12 (1.00-1.25) 1.21 (1.02-1.43) 0.89 (0.68-1.16) 0.94 (0.69-1.29)
Anticoagulant use 0.93 (0.79-1.10) 0.93 (0.77-1.13) Not included Not included Not included Not included
Platelet inhibitor use 0.76 (0.68-0.85) 1.04 (0.85-1.29) Not included Not included Not included Not included
Ampicillin use Not included Not included Not included Not included 1.11 (0.90-1.35) 1.26 (1.01-1.57)
Carbapenem use Not included Not included Not included Not included 1.66 (1.42-1.95) 1.56 (1.17-2.09)
Piperacillin use Not included Not included Not included Not included 1.29 (1.11-1.50) 1.27 (1.04-1.56)
Total parenteral nutrition 1.63 (0.97-2.74) 3.29 (1.93-5.60) 1.70 (1.08-2.69) 2.12 (1.41-3.20) 4.26 (1.92-9.49) 4.82 (3.09-7.53)
Abbreviations: CDI, Clostridium difficile infection; GI, gastrointestinal tract;H2RA, histamine-2 receptor antagonist; ICD-9, International Classification ofDiseases, Ninth Revision; OR, odds ratios; PPI, proton pump inhibitor.a Data are presented as OR (95% CI) from multivariable regression models using
generalized estimating equation with a logit-link (SAS PROC GENMOD).Propensity score and subsequent matching included the following variables:
age; sex; admission year; primary diagnosis; ICD-9–coded disease statesoccurring within 48 hours of admission to the intensive care unit; and use ofcorticosteroids, anticoagulants, platelet inhibitors, or total parenteral nutritionwithin 48 hours of admission to the intensive care unit. Definitions of diseasestates and drug therapies are provided in the supplementary information.
H2 Receptor Antagonists vs Proton Pump Inhibitors Original Investigation Research
jamainternalmedicine.com JAMA Internal Medicine April 2014 Volume 174, Number 4 573
Copyright 2014 American Medical Association. All rights reserved.
Downloaded From: http://archinte.jamanetwork.com/ by a Gakko Hojin Jikei Daigaku User on 06/09/2014
• 男性 • 急性呼吸不全 • 敗血症 • 急性および慢性腎障害 • 急性肝障害 • 神経学的損傷 • 外傷 • 移植 • うっ血性心不全 • 心筋梗塞 • TPN
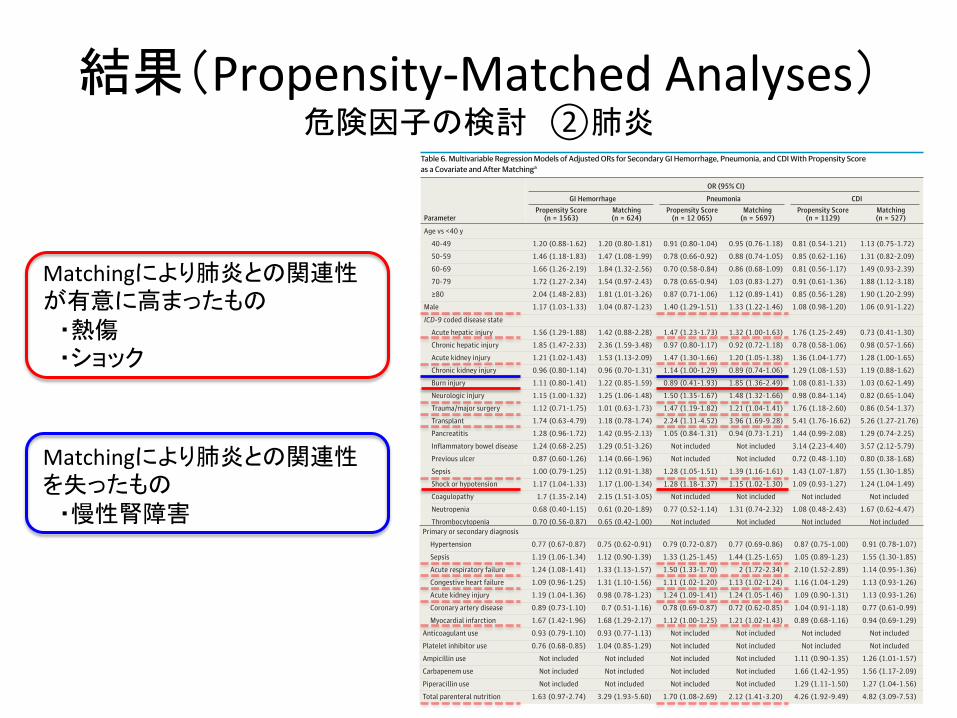
結果(Propensity-‐Matched Analyses) 危険因子の検討 ②肺炎
Matchingにより肺炎との関連性を失ったもの ・慢性腎障害
Matchingにより肺炎との関連性が有意に高まったもの ・熱傷 ・ショック
Copyright 2014 American Medical Association. All rights reserved.
Table 6. Multivariable Regression Models of Adjusted ORs for Secondary GI Hemorrhage, Pneumonia, and CDI With Propensity Scoreas a Covariate and After Matchinga
Parameter
OR (95% CI)
GI Hemorrhage Pneumonia CDIPropensity Score
(n = 1563)Matching(n = 624)
Propensity Score(n = 12 065)
Matching(n = 5697)
Propensity Score(n = 1129)
Matching(n = 527)
PPI vs H2RA, all years 2.24 (1.81-2.76) 1.95 (1.44-2.65) 1.2 (1.03-1.41) 1.23 (1.07-1.43) 1.29 (1.04-1.59) 1.31 (1.04-1.64)
2003 1.82 (1.41-2.36) 1.79 (1.27-2.53) 1.05 (0.83-1.33) 1.11 (0.89-1.40) 1.13 (0.88-1.48) 1.38 (0.90-2.13)
2004 1.81 (1.30-2.52) 1.60 (1.04-2.47) 1.09 (0.83-1.43) 1.09 (0.83-1.43) 1.08 (0.78-1.51) 1.24 (0.80-1.93)
2005 3.71 (2.67-5.16) 3.58 (2.24-5.71) 1.22 (1.00-1.48) 1.29 (1.06-1.58) 1.31 (0.95-1.81) 1.32 (0.91-1.91)
2006 2.20 (1.41-3.44) 1.51 (0.95-2.39) 1.28 (1.05-1.56) 1.36 (1.07-1.72) 1.51 (1.08-2.13) 1.53 (1.02-2.31)
2007 2.71 (1.73-4.23) 2.31 (1.31-4.07) 1.30 (1.00-1.70) 1.26 (0.93-1.69) 1.30 (0.92-1.84) 1.23 (0.82-1.85)
2008 1.71 (1.29-2.28) 1.54 (0.80-2.97) 1.32 (1.07-1.63) 1.33 (1.00-1.75) 1.43 (0.87-2.35) 1.16 (0.74-1.82)
Dose vs low-dose H2RA
High-dose H2RA 0.96 (0.67-1.37) 0.95 (0.61-1.47) 1.05 (0.84-1.32) 1.00 (0.85-1.19) 0.95 (0.75-1.20) 0.92 (0.63-1.34)
Low-dose PPI 2.21 (1.98-2.44) 1.28 (1.03-1.59) 1.27 (1.12-1.44) 1.33 (1.15-1.54) 1.29 (1.06-1.55) 1.28 (1.02-1.61)
High-dose PPI 2.29 (1.76-2.82) 2.81 (2.23-3.54) 1.20 (1.07-1.35) 1.15 (1.00-1.31) 1.22 (0.95-1.56) 1.23 (0.92-1.63)
Duration of acid suppressingtherapy vs <72 h
3-7 d 1.13 (0.88-1.45) 1.12 (0.81-1.51) 1.22 (1.08-1.38) 1.17 (0.94-1.44) 0.90 (0.73-1.11) 1.08 (0.79-1.46)
8-14 d 1.30 (0.93-1.82) 1.04 (0.68-1.61) 1.34 (0.97-1.86) 1.26 (0.94-1.69) 0.77 (0.53-1.12) 0.70 (0.44-1.10)
>14 d 1.10 (0.74-1.63) 0.83 (0.43-1.59) 1.08 (0.70-1.68) 1.04 (0.80-1.36) 1.12 (0.67-1.88) 1.21 (0.77-1.89)
Age vs <40 y
40-49 1.20 (0.88-1.62) 1.20 (0.80-1.81) 0.91 (0.80-1.04) 0.95 (0.76-1.18) 0.81 (0.54-1.21) 1.13 (0.75-1.72)
50-59 1.46 (1.18-1.83) 1.47 (1.08-1.99) 0.78 (0.66-0.92) 0.88 (0.74-1.05) 0.85 (0.62-1.16) 1.31 (0.82-2.09)
60-69 1.66 (1.26-2.19) 1.84 (1.32-2.56) 0.70 (0.58-0.84) 0.86 (0.68-1.09) 0.81 (0.56-1.17) 1.49 (0.93-2.39)
70-79 1.72 (1.27-2.34) 1.54 (0.97-2.43) 0.78 (0.65-0.94) 1.03 (0.83-1.27) 0.91 (0.61-1.36) 1.88 (1.12-3.18)
≥80 2.04 (1.48-2.83) 1.81 (1.01-3.26) 0.87 (0.71-1.06) 1.12 (0.89-1.41) 0.85 (0.56-1.28) 1.90 (1.20-2.99)
Male 1.17 (1.03-1.33) 1.04 (0.87-1.23) 1.40 (1.29-1.51) 1.33 (1.22-1.46) 1.08 (0.98-1.20) 1.06 (0.91-1.22)
Race vs white
Black 1.14 (0.98-1.32) 1.09 (0.86-1.39) 0.81 (0.73-0.89) 0.78 (0.69-0.87) 0.85 (0.71-1.02) 0.93 (0.73-1.18)
Hispanic 1.07 (0.76-1.51) 1.20 (0.74-1.97) 1.03 (0.83-1.28) 1.07 (0.83-1.38) 0.90 (0.52-1.57) 1.18 (0.62-2.26)
Other 0.34 (0.10-1.15) 0.72 (0.43-1.22) 1.14 (0.86-1.53) 0.90 (0.71-1.12) 1.32 (0.55-3.18) 1.28 (0.76-2.16)
Mechanical ventilation daysvs <72 h
3-7 d 0.99 (0.80-1.24) 1.12 (0.80-1.57) 1.69 (1.40-2.04) 1.83 (1.43-2.33) 1.39 (1.01-1.90) 1.32 (0.88-1.98)
8-14 d 0.81 (0.61-1.07) 1.06 (0.74-1.51) 2.72 (1.87-3.94) 3.35 (2.45-4.58) 1.99 (1.20-3.29) 2.48 (1.36-4.53)
>14 d 1.06 (0.74-1.51) 1.66 (0.94-2.94) 4.17 (2.61-6.66) 5.00 (3.73-6.72) 2.07 (1.08-3.98) 1.95 (1.06-3.58)
ICD-9 coded disease state
Acute hepatic injury 1.56 (1.29-1.88) 1.42 (0.88-2.28) 1.47 (1.23-1.73) 1.32 (1.00-1.63) 1.76 (1.25-2.49) 0.73 (0.41-1.30)
Chronic hepatic injury 1.85 (1.47-2.33) 2.36 (1.59-3.48) 0.97 (0.80-1.17) 0.92 (0.72-1.18) 0.78 (0.58-1.06) 0.98 (0.57-1.66)
Acute kidney injury 1.21 (1.02-1.43) 1.53 (1.13-2.09) 1.47 (1.30-1.66) 1.20 (1.05-1.38) 1.36 (1.04-1.77) 1.28 (1.00-1.65)
Chronic kidney injury 0.96 (0.80-1.14) 0.96 (0.70-1.31) 1.14 (1.00-1.29) 0.89 (0.74-1.06) 1.29 (1.08-1.53) 1.19 (0.88-1.62)
Burn injury 1.11 (0.80-1.41) 1.22 (0.85-1.59) 0.89 (0.41-1.93) 1.85 (1.36-2.49) 1.08 (0.81-1.33) 1.03 (0.62-1.49)
Neurologic injury 1.15 (1.00-1.32) 1.25 (1.06-1.48) 1.50 (1.35-1.67) 1.48 (1.32-1.66) 0.98 (0.84-1.14) 0.82 (0.65-1.04)
Trauma/major surgery 1.12 (0.71-1.75) 1.01 (0.63-1.73) 1.47 (1.19-1.82) 1.21 (1.04-1.41) 1.76 (1.18-2.60) 0.86 (0.54-1.37)
Transplant 1.74 (0.63-4.79) 1.18 (0.78-1.74) 2.24 (1.11-4.52) 3.96 (1.69-9.28) 5.41 (1.76-16.62) 5.26 (1.27-21.76)
Pancreatitis 1.28 (0.96-1.72) 1.42 (0.95-2.13) 1.05 (0.84-1.31) 0.94 (0.73-1.21) 1.44 (0.99-2.08) 1.29 (0.74-2.25)
Inflammatory bowel disease 1.24 (0.68-2.25) 1.29 (0.51-3.26) Not included Not included 3.14 (2.23-4.40) 3.57 (2.12-5.79)
Previous ulcer 0.87 (0.60-1.26) 1.14 (0.66-1.96) Not included Not included 0.72 (0.48-1.10) 0.80 (0.38-1.68)
Sepsis 1.00 (0.79-1.25) 1.12 (0.91-1.38) 1.28 (1.05-1.51) 1.39 (1.16-1.61) 1.43 (1.07-1.87) 1.55 (1.30-1.85)
Shock or hypotension 1.17 (1.04-1.33) 1.17 (1.00-1.34) 1.28 (1.18-1.37) 1.15 (1.02-1.30) 1.09 (0.93-1.27) 1.24 (1.04-1.49)
Coagulopathy 1.7 (1.35-2.14) 2.15 (1.51-3.05) Not included Not included Not included Not included
Neutropenia 0.68 (0.40-1.15) 0.61 (0.20-1.89) 0.77 (0.52-1.14) 1.31 (0.74-2.32) 1.08 (0.48-2.43) 1.67 (0.62-4.47)
Thrombocytopenia 0.70 (0.56-0.87) 0.65 (0.42-1.00) Not included Not included Not included Not included
(continued)
Research Original Investigation H2 Receptor Antagonists vs Proton Pump Inhibitors
572 JAMA Internal Medicine April 2014 Volume 174, Number 4 jamainternalmedicine.com
Copyright 2014 American Medical Association. All rights reserved.
Downloaded From: http://archinte.jamanetwork.com/ by a Gakko Hojin Jikei Daigaku User on 06/09/2014
Copyright 2014 American Medical Association. All rights reserved.
data that is available within this database is limited, and whileextensive, the database may not apply to all critically ill pa-tients. Clinical data (eg, endoscopy or bronchoscopy) and ac-tual laboratory results are unavailable. We are unable to vali-date associations between ICU and hospital lengths of stay,mortality, and ICU and hospital costs and GI hemorrhage, pneu-monia, or CDI. Lastly, most of the mechanically ventilated pa-tients received an acid suppressant, so we are unable to makecomparisons between H2RAs, PPIs, and no acid suppression.
Conclusions
Proton pump inhibitor therapy is associated with greaterrisks of GI hemorrhage, pneumonia, and CDI compared withH2RA therapy in mechanically ventilated patients. Numer-ous other risk factors have been identified for each of theseoutcomes. Additional studies are needed to confirm theseresults.
ARTICLE INFORMATION
Accepted for Publication: November 18, 2013.
Published Online: February 17, 2014.doi:10.1001/jamainternmed.2013.14673.
Author Contributions: Dr MacLaren had full accessto all of the data in the study and takesresponsibility for the integrity of the data and theaccuracy of the data analysis.Study concept and design: Reynolds.Acquisition of data: MacLaren.Analysis and interpretation of data: MacLaren,Reynolds, Allen.Drafting of the manuscript: MacLaren.Critical revision of the manuscript for importantintellectual content: MacLaren, Reynolds, Allen.Statistical analysis: MacLaren, Allen.Administrative, technical, and material support:Reynolds.Study supervision: Reynolds.
Conflict of Interest Disclosures: None reported.
Previous Presentation: An abstract of this studywas presented as a poster at the Society of CriticalCare Medicine Congress; January 10-13, 2014; SanFrancisco, California.
Additional Contributions: The Premier PerspectiveDatabase was provided in kind by Kavita Nair, PhD,Center for Pharmaceutical Outcomes Research,University of Colorado Skaggs School of Pharmacyand Pharmaceutical Sciences.
REFERENCES
1. MacLaren R. A review of stress ulcer prophylaxis.J Pharm Pract. 2002;15(2):147-157.
2. Ali T, Harty RF. Stress-induced ulcer bleeding incritically ill patients. Gastroenterol Clin North Am.2009;38(2):245-265.
3. ASHP Commission on Therapeutics. ASHPtherapeutics guidelines on stress ulcer prophylaxis.Am J Health Syst Pharm. 1999;56:347-379.
4. Cook DJ, Griffith LE, Walter SD, et al; CanadianCritical Care Trials Group. The attributable mortalityand length of intensive care unit stay of clinicallyimportant gastrointestinal bleeding in critically illpatients. Crit Care. 2001;5(6):368-375.
5. Wunsch H, Linde-Zwirble WT, Angus DC,Hartman ME, Milbrandt EB, Kahn JM. The
epidemiology of mechanical ventilation use in theUnited States. Crit Care Med. 2010;38(10):1947-1953.
6. Cook DJ, Reeve BK, Guyatt GH, et al. Stress ulcerprophylaxis in critically ill patients: resolvingdiscordant meta-analyses. JAMA.1996;275(4):308-314.
7. Cook D, Guyatt G, Marshall J, et al; CanadianCritical Care Trials Group. A comparison ofsucralfate and ranitidine for the prevention of uppergastrointestinal bleeding in patients requiringmechanical ventilation. N Engl J Med.1998;338(12):791-797.
8. Alhazzani W, Alenezi F, Jaeschke RZ, Moayyedi P,Cook DJ. Proton pump inhibitors versus histamine 2receptor antagonists for stress ulcer prophylaxis incritically ill patients: a systematic review andmeta-analysis. Crit Care Med. 2013;41(3):693-705.
9. Lin PC, Chang CH, Hsu PI, Tseng PL, Huang YB.The efficacy and safety of proton pump inhibitorsvs histamine-2 receptor antagonists for stress ulcerbleeding prophylaxis among critical care patients:a meta-analysis. Crit Care Med. 2010;38(4):1197-1205.
Table 6. Multivariable Regression Models of Adjusted ORs for Secondary GI Hemorrhage, Pneumonia, and CDI With Propensity Scoreas a Covariate and After Matchinga (continued)
Parameter
OR (95% CI)
GI Hemorrhage Pneumonia CDIPropensity Score
(n = 1563)Matching(n = 624)
Propensity Score(n = 12 065)
Matching(n = 5697)
Propensity Score(n = 1129)
Matching(n = 527)
Primary or secondary diagnosis
Hypertension 0.77 (0.67-0.87) 0.75 (0.62-0.91) 0.79 (0.72-0.87) 0.77 (0.69-0.86) 0.87 (0.75-1.00) 0.91 (0.78-1.07)
Sepsis 1.19 (1.06-1.34) 1.12 (0.90-1.39) 1.33 (1.25-1.45) 1.44 (1.25-1.65) 1.05 (0.89-1.23) 1.55 (1.30-1.85)
Acute respiratory failure 1.24 (1.08-1.41) 1.33 (1.13-1.57) 1.50 (1.33-1.70) 2 (1.72-2.34) 2.10 (1.52-2.89) 1.14 (0.95-1.36)
Congestive heart failure 1.09 (0.96-1.25) 1.31 (1.10-1.56) 1.11 (1.02-1.20) 1.13 (1.02-1.24) 1.16 (1.04-1.29) 1.13 (0.93-1.26)
Acute kidney injury 1.19 (1.04-1.36) 0.98 (0.78-1.23) 1.24 (1.09-1.41) 1.24 (1.05-1.46) 1.09 (0.90-1.31) 1.13 (0.93-1.26)
Coronary artery disease 0.89 (0.73-1.10) 0.7 (0.51-1.16) 0.78 (0.69-0.87) 0.72 (0.62-0.85) 1.04 (0.91-1.18) 0.77 (0.61-0.99)
Myocardial infarction 1.67 (1.42-1.96) 1.68 (1.29-2.17) 1.12 (1.00-1.25) 1.21 (1.02-1.43) 0.89 (0.68-1.16) 0.94 (0.69-1.29)
Anticoagulant use 0.93 (0.79-1.10) 0.93 (0.77-1.13) Not included Not included Not included Not included
Platelet inhibitor use 0.76 (0.68-0.85) 1.04 (0.85-1.29) Not included Not included Not included Not included
Ampicillin use Not included Not included Not included Not included 1.11 (0.90-1.35) 1.26 (1.01-1.57)
Carbapenem use Not included Not included Not included Not included 1.66 (1.42-1.95) 1.56 (1.17-2.09)
Piperacillin use Not included Not included Not included Not included 1.29 (1.11-1.50) 1.27 (1.04-1.56)
Total parenteral nutrition 1.63 (0.97-2.74) 3.29 (1.93-5.60) 1.70 (1.08-2.69) 2.12 (1.41-3.20) 4.26 (1.92-9.49) 4.82 (3.09-7.53)
Abbreviations: CDI, Clostridium difficile infection; GI, gastrointestinal tract;H2RA, histamine-2 receptor antagonist; ICD-9, International Classification ofDiseases, Ninth Revision; OR, odds ratios; PPI, proton pump inhibitor.a Data are presented as OR (95% CI) from multivariable regression models using
generalized estimating equation with a logit-link (SAS PROC GENMOD).Propensity score and subsequent matching included the following variables:
age; sex; admission year; primary diagnosis; ICD-9–coded disease statesoccurring within 48 hours of admission to the intensive care unit; and use ofcorticosteroids, anticoagulants, platelet inhibitors, or total parenteral nutritionwithin 48 hours of admission to the intensive care unit. Definitions of diseasestates and drug therapies are provided in the supplementary information.
H2 Receptor Antagonists vs Proton Pump Inhibitors Original Investigation Research
jamainternalmedicine.com JAMA Internal Medicine April 2014 Volume 174, Number 4 573
Copyright 2014 American Medical Association. All rights reserved.
Downloaded From: http://archinte.jamanetwork.com/ by a Gakko Hojin Jikei Daigaku User on 06/09/2014
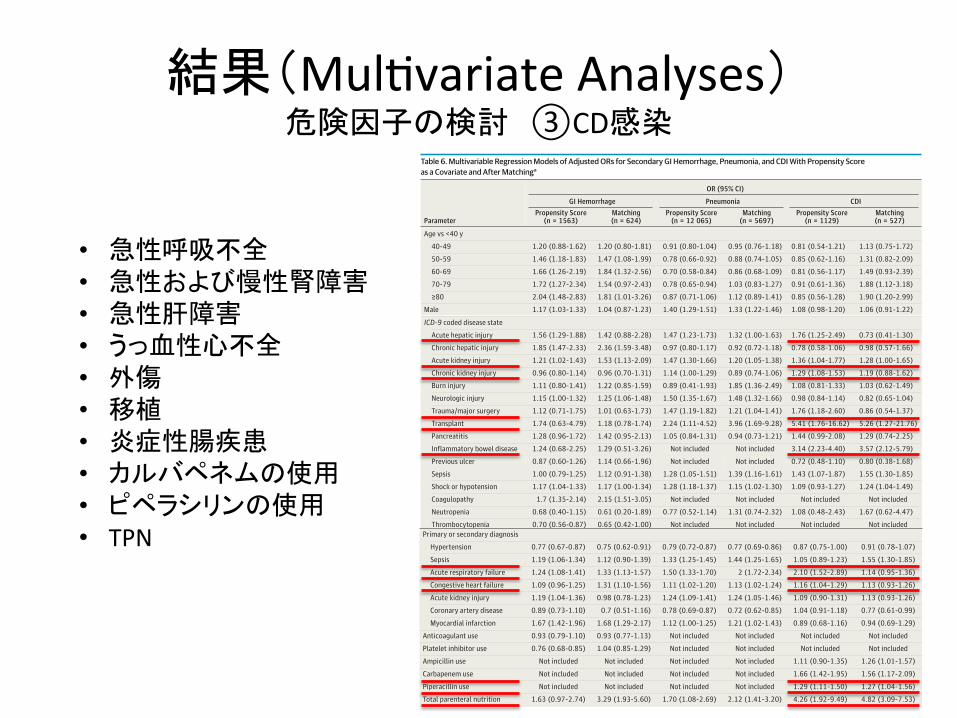
結果(MulMvariate Analyses) 危険因子の検討 ③CD感染
Copyright 2014 American Medical Association. All rights reserved.
Table 6. Multivariable Regression Models of Adjusted ORs for Secondary GI Hemorrhage, Pneumonia, and CDI With Propensity Scoreas a Covariate and After Matchinga
Parameter
OR (95% CI)
GI Hemorrhage Pneumonia CDIPropensity Score
(n = 1563)Matching(n = 624)
Propensity Score(n = 12 065)
Matching(n = 5697)
Propensity Score(n = 1129)
Matching(n = 527)
PPI vs H2RA, all years 2.24 (1.81-2.76) 1.95 (1.44-2.65) 1.2 (1.03-1.41) 1.23 (1.07-1.43) 1.29 (1.04-1.59) 1.31 (1.04-1.64)
2003 1.82 (1.41-2.36) 1.79 (1.27-2.53) 1.05 (0.83-1.33) 1.11 (0.89-1.40) 1.13 (0.88-1.48) 1.38 (0.90-2.13)
2004 1.81 (1.30-2.52) 1.60 (1.04-2.47) 1.09 (0.83-1.43) 1.09 (0.83-1.43) 1.08 (0.78-1.51) 1.24 (0.80-1.93)
2005 3.71 (2.67-5.16) 3.58 (2.24-5.71) 1.22 (1.00-1.48) 1.29 (1.06-1.58) 1.31 (0.95-1.81) 1.32 (0.91-1.91)
2006 2.20 (1.41-3.44) 1.51 (0.95-2.39) 1.28 (1.05-1.56) 1.36 (1.07-1.72) 1.51 (1.08-2.13) 1.53 (1.02-2.31)
2007 2.71 (1.73-4.23) 2.31 (1.31-4.07) 1.30 (1.00-1.70) 1.26 (0.93-1.69) 1.30 (0.92-1.84) 1.23 (0.82-1.85)
2008 1.71 (1.29-2.28) 1.54 (0.80-2.97) 1.32 (1.07-1.63) 1.33 (1.00-1.75) 1.43 (0.87-2.35) 1.16 (0.74-1.82)
Dose vs low-dose H2RA
High-dose H2RA 0.96 (0.67-1.37) 0.95 (0.61-1.47) 1.05 (0.84-1.32) 1.00 (0.85-1.19) 0.95 (0.75-1.20) 0.92 (0.63-1.34)
Low-dose PPI 2.21 (1.98-2.44) 1.28 (1.03-1.59) 1.27 (1.12-1.44) 1.33 (1.15-1.54) 1.29 (1.06-1.55) 1.28 (1.02-1.61)
High-dose PPI 2.29 (1.76-2.82) 2.81 (2.23-3.54) 1.20 (1.07-1.35) 1.15 (1.00-1.31) 1.22 (0.95-1.56) 1.23 (0.92-1.63)
Duration of acid suppressingtherapy vs <72 h
3-7 d 1.13 (0.88-1.45) 1.12 (0.81-1.51) 1.22 (1.08-1.38) 1.17 (0.94-1.44) 0.90 (0.73-1.11) 1.08 (0.79-1.46)
8-14 d 1.30 (0.93-1.82) 1.04 (0.68-1.61) 1.34 (0.97-1.86) 1.26 (0.94-1.69) 0.77 (0.53-1.12) 0.70 (0.44-1.10)
>14 d 1.10 (0.74-1.63) 0.83 (0.43-1.59) 1.08 (0.70-1.68) 1.04 (0.80-1.36) 1.12 (0.67-1.88) 1.21 (0.77-1.89)
Age vs <40 y
40-49 1.20 (0.88-1.62) 1.20 (0.80-1.81) 0.91 (0.80-1.04) 0.95 (0.76-1.18) 0.81 (0.54-1.21) 1.13 (0.75-1.72)
50-59 1.46 (1.18-1.83) 1.47 (1.08-1.99) 0.78 (0.66-0.92) 0.88 (0.74-1.05) 0.85 (0.62-1.16) 1.31 (0.82-2.09)
60-69 1.66 (1.26-2.19) 1.84 (1.32-2.56) 0.70 (0.58-0.84) 0.86 (0.68-1.09) 0.81 (0.56-1.17) 1.49 (0.93-2.39)
70-79 1.72 (1.27-2.34) 1.54 (0.97-2.43) 0.78 (0.65-0.94) 1.03 (0.83-1.27) 0.91 (0.61-1.36) 1.88 (1.12-3.18)
≥80 2.04 (1.48-2.83) 1.81 (1.01-3.26) 0.87 (0.71-1.06) 1.12 (0.89-1.41) 0.85 (0.56-1.28) 1.90 (1.20-2.99)
Male 1.17 (1.03-1.33) 1.04 (0.87-1.23) 1.40 (1.29-1.51) 1.33 (1.22-1.46) 1.08 (0.98-1.20) 1.06 (0.91-1.22)
Race vs white
Black 1.14 (0.98-1.32) 1.09 (0.86-1.39) 0.81 (0.73-0.89) 0.78 (0.69-0.87) 0.85 (0.71-1.02) 0.93 (0.73-1.18)
Hispanic 1.07 (0.76-1.51) 1.20 (0.74-1.97) 1.03 (0.83-1.28) 1.07 (0.83-1.38) 0.90 (0.52-1.57) 1.18 (0.62-2.26)
Other 0.34 (0.10-1.15) 0.72 (0.43-1.22) 1.14 (0.86-1.53) 0.90 (0.71-1.12) 1.32 (0.55-3.18) 1.28 (0.76-2.16)
Mechanical ventilation daysvs <72 h
3-7 d 0.99 (0.80-1.24) 1.12 (0.80-1.57) 1.69 (1.40-2.04) 1.83 (1.43-2.33) 1.39 (1.01-1.90) 1.32 (0.88-1.98)
8-14 d 0.81 (0.61-1.07) 1.06 (0.74-1.51) 2.72 (1.87-3.94) 3.35 (2.45-4.58) 1.99 (1.20-3.29) 2.48 (1.36-4.53)
>14 d 1.06 (0.74-1.51) 1.66 (0.94-2.94) 4.17 (2.61-6.66) 5.00 (3.73-6.72) 2.07 (1.08-3.98) 1.95 (1.06-3.58)
ICD-9 coded disease state
Acute hepatic injury 1.56 (1.29-1.88) 1.42 (0.88-2.28) 1.47 (1.23-1.73) 1.32 (1.00-1.63) 1.76 (1.25-2.49) 0.73 (0.41-1.30)
Chronic hepatic injury 1.85 (1.47-2.33) 2.36 (1.59-3.48) 0.97 (0.80-1.17) 0.92 (0.72-1.18) 0.78 (0.58-1.06) 0.98 (0.57-1.66)
Acute kidney injury 1.21 (1.02-1.43) 1.53 (1.13-2.09) 1.47 (1.30-1.66) 1.20 (1.05-1.38) 1.36 (1.04-1.77) 1.28 (1.00-1.65)
Chronic kidney injury 0.96 (0.80-1.14) 0.96 (0.70-1.31) 1.14 (1.00-1.29) 0.89 (0.74-1.06) 1.29 (1.08-1.53) 1.19 (0.88-1.62)
Burn injury 1.11 (0.80-1.41) 1.22 (0.85-1.59) 0.89 (0.41-1.93) 1.85 (1.36-2.49) 1.08 (0.81-1.33) 1.03 (0.62-1.49)
Neurologic injury 1.15 (1.00-1.32) 1.25 (1.06-1.48) 1.50 (1.35-1.67) 1.48 (1.32-1.66) 0.98 (0.84-1.14) 0.82 (0.65-1.04)
Trauma/major surgery 1.12 (0.71-1.75) 1.01 (0.63-1.73) 1.47 (1.19-1.82) 1.21 (1.04-1.41) 1.76 (1.18-2.60) 0.86 (0.54-1.37)
Transplant 1.74 (0.63-4.79) 1.18 (0.78-1.74) 2.24 (1.11-4.52) 3.96 (1.69-9.28) 5.41 (1.76-16.62) 5.26 (1.27-21.76)
Pancreatitis 1.28 (0.96-1.72) 1.42 (0.95-2.13) 1.05 (0.84-1.31) 0.94 (0.73-1.21) 1.44 (0.99-2.08) 1.29 (0.74-2.25)
Inflammatory bowel disease 1.24 (0.68-2.25) 1.29 (0.51-3.26) Not included Not included 3.14 (2.23-4.40) 3.57 (2.12-5.79)
Previous ulcer 0.87 (0.60-1.26) 1.14 (0.66-1.96) Not included Not included 0.72 (0.48-1.10) 0.80 (0.38-1.68)
Sepsis 1.00 (0.79-1.25) 1.12 (0.91-1.38) 1.28 (1.05-1.51) 1.39 (1.16-1.61) 1.43 (1.07-1.87) 1.55 (1.30-1.85)
Shock or hypotension 1.17 (1.04-1.33) 1.17 (1.00-1.34) 1.28 (1.18-1.37) 1.15 (1.02-1.30) 1.09 (0.93-1.27) 1.24 (1.04-1.49)
Coagulopathy 1.7 (1.35-2.14) 2.15 (1.51-3.05) Not included Not included Not included Not included
Neutropenia 0.68 (0.40-1.15) 0.61 (0.20-1.89) 0.77 (0.52-1.14) 1.31 (0.74-2.32) 1.08 (0.48-2.43) 1.67 (0.62-4.47)
Thrombocytopenia 0.70 (0.56-0.87) 0.65 (0.42-1.00) Not included Not included Not included Not included
(continued)
Research Original Investigation H2 Receptor Antagonists vs Proton Pump Inhibitors
572 JAMA Internal Medicine April 2014 Volume 174, Number 4 jamainternalmedicine.com
Copyright 2014 American Medical Association. All rights reserved.
Downloaded From: http://archinte.jamanetwork.com/ by a Gakko Hojin Jikei Daigaku User on 06/09/2014
Copyright 2014 American Medical Association. All rights reserved.
data that is available within this database is limited, and whileextensive, the database may not apply to all critically ill pa-tients. Clinical data (eg, endoscopy or bronchoscopy) and ac-tual laboratory results are unavailable. We are unable to vali-date associations between ICU and hospital lengths of stay,mortality, and ICU and hospital costs and GI hemorrhage, pneu-monia, or CDI. Lastly, most of the mechanically ventilated pa-tients received an acid suppressant, so we are unable to makecomparisons between H2RAs, PPIs, and no acid suppression.
Conclusions
Proton pump inhibitor therapy is associated with greaterrisks of GI hemorrhage, pneumonia, and CDI compared withH2RA therapy in mechanically ventilated patients. Numer-ous other risk factors have been identified for each of theseoutcomes. Additional studies are needed to confirm theseresults.
ARTICLE INFORMATION
Accepted for Publication: November 18, 2013.
Published Online: February 17, 2014.doi:10.1001/jamainternmed.2013.14673.
Author Contributions: Dr MacLaren had full accessto all of the data in the study and takesresponsibility for the integrity of the data and theaccuracy of the data analysis.Study concept and design: Reynolds.Acquisition of data: MacLaren.Analysis and interpretation of data: MacLaren,Reynolds, Allen.Drafting of the manuscript: MacLaren.Critical revision of the manuscript for importantintellectual content: MacLaren, Reynolds, Allen.Statistical analysis: MacLaren, Allen.Administrative, technical, and material support:Reynolds.Study supervision: Reynolds.
Conflict of Interest Disclosures: None reported.
Previous Presentation: An abstract of this studywas presented as a poster at the Society of CriticalCare Medicine Congress; January 10-13, 2014; SanFrancisco, California.
Additional Contributions: The Premier PerspectiveDatabase was provided in kind by Kavita Nair, PhD,Center for Pharmaceutical Outcomes Research,University of Colorado Skaggs School of Pharmacyand Pharmaceutical Sciences.
REFERENCES
1. MacLaren R. A review of stress ulcer prophylaxis.J Pharm Pract. 2002;15(2):147-157.
2. Ali T, Harty RF. Stress-induced ulcer bleeding incritically ill patients. Gastroenterol Clin North Am.2009;38(2):245-265.
3. ASHP Commission on Therapeutics. ASHPtherapeutics guidelines on stress ulcer prophylaxis.Am J Health Syst Pharm. 1999;56:347-379.
4. Cook DJ, Griffith LE, Walter SD, et al; CanadianCritical Care Trials Group. The attributable mortalityand length of intensive care unit stay of clinicallyimportant gastrointestinal bleeding in critically illpatients. Crit Care. 2001;5(6):368-375.
5. Wunsch H, Linde-Zwirble WT, Angus DC,Hartman ME, Milbrandt EB, Kahn JM. The
epidemiology of mechanical ventilation use in theUnited States. Crit Care Med. 2010;38(10):1947-1953.
6. Cook DJ, Reeve BK, Guyatt GH, et al. Stress ulcerprophylaxis in critically ill patients: resolvingdiscordant meta-analyses. JAMA.1996;275(4):308-314.
7. Cook D, Guyatt G, Marshall J, et al; CanadianCritical Care Trials Group. A comparison ofsucralfate and ranitidine for the prevention of uppergastrointestinal bleeding in patients requiringmechanical ventilation. N Engl J Med.1998;338(12):791-797.
8. Alhazzani W, Alenezi F, Jaeschke RZ, Moayyedi P,Cook DJ. Proton pump inhibitors versus histamine 2receptor antagonists for stress ulcer prophylaxis incritically ill patients: a systematic review andmeta-analysis. Crit Care Med. 2013;41(3):693-705.
9. Lin PC, Chang CH, Hsu PI, Tseng PL, Huang YB.The efficacy and safety of proton pump inhibitorsvs histamine-2 receptor antagonists for stress ulcerbleeding prophylaxis among critical care patients:a meta-analysis. Crit Care Med. 2010;38(4):1197-1205.
Table 6. Multivariable Regression Models of Adjusted ORs for Secondary GI Hemorrhage, Pneumonia, and CDI With Propensity Scoreas a Covariate and After Matchinga (continued)
Parameter
OR (95% CI)
GI Hemorrhage Pneumonia CDIPropensity Score
(n = 1563)Matching(n = 624)
Propensity Score(n = 12 065)
Matching(n = 5697)
Propensity Score(n = 1129)
Matching(n = 527)
Primary or secondary diagnosis
Hypertension 0.77 (0.67-0.87) 0.75 (0.62-0.91) 0.79 (0.72-0.87) 0.77 (0.69-0.86) 0.87 (0.75-1.00) 0.91 (0.78-1.07)
Sepsis 1.19 (1.06-1.34) 1.12 (0.90-1.39) 1.33 (1.25-1.45) 1.44 (1.25-1.65) 1.05 (0.89-1.23) 1.55 (1.30-1.85)
Acute respiratory failure 1.24 (1.08-1.41) 1.33 (1.13-1.57) 1.50 (1.33-1.70) 2 (1.72-2.34) 2.10 (1.52-2.89) 1.14 (0.95-1.36)
Congestive heart failure 1.09 (0.96-1.25) 1.31 (1.10-1.56) 1.11 (1.02-1.20) 1.13 (1.02-1.24) 1.16 (1.04-1.29) 1.13 (0.93-1.26)
Acute kidney injury 1.19 (1.04-1.36) 0.98 (0.78-1.23) 1.24 (1.09-1.41) 1.24 (1.05-1.46) 1.09 (0.90-1.31) 1.13 (0.93-1.26)
Coronary artery disease 0.89 (0.73-1.10) 0.7 (0.51-1.16) 0.78 (0.69-0.87) 0.72 (0.62-0.85) 1.04 (0.91-1.18) 0.77 (0.61-0.99)
Myocardial infarction 1.67 (1.42-1.96) 1.68 (1.29-2.17) 1.12 (1.00-1.25) 1.21 (1.02-1.43) 0.89 (0.68-1.16) 0.94 (0.69-1.29)
Anticoagulant use 0.93 (0.79-1.10) 0.93 (0.77-1.13) Not included Not included Not included Not included
Platelet inhibitor use 0.76 (0.68-0.85) 1.04 (0.85-1.29) Not included Not included Not included Not included
Ampicillin use Not included Not included Not included Not included 1.11 (0.90-1.35) 1.26 (1.01-1.57)
Carbapenem use Not included Not included Not included Not included 1.66 (1.42-1.95) 1.56 (1.17-2.09)
Piperacillin use Not included Not included Not included Not included 1.29 (1.11-1.50) 1.27 (1.04-1.56)
Total parenteral nutrition 1.63 (0.97-2.74) 3.29 (1.93-5.60) 1.70 (1.08-2.69) 2.12 (1.41-3.20) 4.26 (1.92-9.49) 4.82 (3.09-7.53)
Abbreviations: CDI, Clostridium difficile infection; GI, gastrointestinal tract;H2RA, histamine-2 receptor antagonist; ICD-9, International Classification ofDiseases, Ninth Revision; OR, odds ratios; PPI, proton pump inhibitor.a Data are presented as OR (95% CI) from multivariable regression models using
generalized estimating equation with a logit-link (SAS PROC GENMOD).Propensity score and subsequent matching included the following variables:
age; sex; admission year; primary diagnosis; ICD-9–coded disease statesoccurring within 48 hours of admission to the intensive care unit; and use ofcorticosteroids, anticoagulants, platelet inhibitors, or total parenteral nutritionwithin 48 hours of admission to the intensive care unit. Definitions of diseasestates and drug therapies are provided in the supplementary information.
H2 Receptor Antagonists vs Proton Pump Inhibitors Original Investigation Research
jamainternalmedicine.com JAMA Internal Medicine April 2014 Volume 174, Number 4 573
Copyright 2014 American Medical Association. All rights reserved.
Downloaded From: http://archinte.jamanetwork.com/ by a Gakko Hojin Jikei Daigaku User on 06/09/2014
• 急性呼吸不全 • 急性および慢性腎障害 • 急性肝障害 • うっ血性心不全 • 外傷 • 移植 • 炎症性腸疾患 • カルバペネムの使用 • ピペラシリンの使用 • TPN
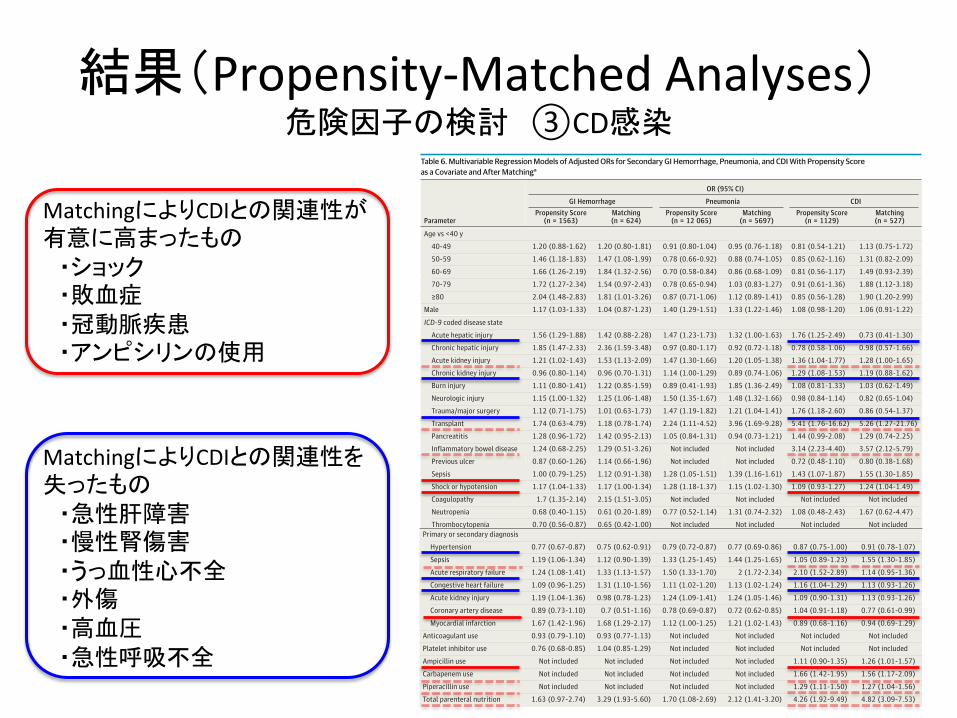
結果(Propensity-‐Matched Analyses) 危険因子の検討 ③CD感染
MatchingによりCDIとの関連性が有意に高まったもの ・ショック ・敗血症 ・冠動脈疾患 ・アンピシリンの使用
MatchingによりCDIとの関連性を失ったもの ・急性肝障害 ・慢性腎傷害 ・うっ血性心不全 ・外傷 ・高血圧 ・急性呼吸不全
Copyright 2014 American Medical Association. All rights reserved.
Table 6. Multivariable Regression Models of Adjusted ORs for Secondary GI Hemorrhage, Pneumonia, and CDI With Propensity Scoreas a Covariate and After Matchinga
Parameter
OR (95% CI)
GI Hemorrhage Pneumonia CDIPropensity Score
(n = 1563)Matching(n = 624)
Propensity Score(n = 12 065)
Matching(n = 5697)
Propensity Score(n = 1129)
Matching(n = 527)
PPI vs H2RA, all years 2.24 (1.81-2.76) 1.95 (1.44-2.65) 1.2 (1.03-1.41) 1.23 (1.07-1.43) 1.29 (1.04-1.59) 1.31 (1.04-1.64)
2003 1.82 (1.41-2.36) 1.79 (1.27-2.53) 1.05 (0.83-1.33) 1.11 (0.89-1.40) 1.13 (0.88-1.48) 1.38 (0.90-2.13)
2004 1.81 (1.30-2.52) 1.60 (1.04-2.47) 1.09 (0.83-1.43) 1.09 (0.83-1.43) 1.08 (0.78-1.51) 1.24 (0.80-1.93)
2005 3.71 (2.67-5.16) 3.58 (2.24-5.71) 1.22 (1.00-1.48) 1.29 (1.06-1.58) 1.31 (0.95-1.81) 1.32 (0.91-1.91)
2006 2.20 (1.41-3.44) 1.51 (0.95-2.39) 1.28 (1.05-1.56) 1.36 (1.07-1.72) 1.51 (1.08-2.13) 1.53 (1.02-2.31)
2007 2.71 (1.73-4.23) 2.31 (1.31-4.07) 1.30 (1.00-1.70) 1.26 (0.93-1.69) 1.30 (0.92-1.84) 1.23 (0.82-1.85)
2008 1.71 (1.29-2.28) 1.54 (0.80-2.97) 1.32 (1.07-1.63) 1.33 (1.00-1.75) 1.43 (0.87-2.35) 1.16 (0.74-1.82)
Dose vs low-dose H2RA
High-dose H2RA 0.96 (0.67-1.37) 0.95 (0.61-1.47) 1.05 (0.84-1.32) 1.00 (0.85-1.19) 0.95 (0.75-1.20) 0.92 (0.63-1.34)
Low-dose PPI 2.21 (1.98-2.44) 1.28 (1.03-1.59) 1.27 (1.12-1.44) 1.33 (1.15-1.54) 1.29 (1.06-1.55) 1.28 (1.02-1.61)
High-dose PPI 2.29 (1.76-2.82) 2.81 (2.23-3.54) 1.20 (1.07-1.35) 1.15 (1.00-1.31) 1.22 (0.95-1.56) 1.23 (0.92-1.63)
Duration of acid suppressingtherapy vs <72 h
3-7 d 1.13 (0.88-1.45) 1.12 (0.81-1.51) 1.22 (1.08-1.38) 1.17 (0.94-1.44) 0.90 (0.73-1.11) 1.08 (0.79-1.46)
8-14 d 1.30 (0.93-1.82) 1.04 (0.68-1.61) 1.34 (0.97-1.86) 1.26 (0.94-1.69) 0.77 (0.53-1.12) 0.70 (0.44-1.10)
>14 d 1.10 (0.74-1.63) 0.83 (0.43-1.59) 1.08 (0.70-1.68) 1.04 (0.80-1.36) 1.12 (0.67-1.88) 1.21 (0.77-1.89)
Age vs <40 y
40-49 1.20 (0.88-1.62) 1.20 (0.80-1.81) 0.91 (0.80-1.04) 0.95 (0.76-1.18) 0.81 (0.54-1.21) 1.13 (0.75-1.72)
50-59 1.46 (1.18-1.83) 1.47 (1.08-1.99) 0.78 (0.66-0.92) 0.88 (0.74-1.05) 0.85 (0.62-1.16) 1.31 (0.82-2.09)
60-69 1.66 (1.26-2.19) 1.84 (1.32-2.56) 0.70 (0.58-0.84) 0.86 (0.68-1.09) 0.81 (0.56-1.17) 1.49 (0.93-2.39)
70-79 1.72 (1.27-2.34) 1.54 (0.97-2.43) 0.78 (0.65-0.94) 1.03 (0.83-1.27) 0.91 (0.61-1.36) 1.88 (1.12-3.18)
≥80 2.04 (1.48-2.83) 1.81 (1.01-3.26) 0.87 (0.71-1.06) 1.12 (0.89-1.41) 0.85 (0.56-1.28) 1.90 (1.20-2.99)
Male 1.17 (1.03-1.33) 1.04 (0.87-1.23) 1.40 (1.29-1.51) 1.33 (1.22-1.46) 1.08 (0.98-1.20) 1.06 (0.91-1.22)
Race vs white
Black 1.14 (0.98-1.32) 1.09 (0.86-1.39) 0.81 (0.73-0.89) 0.78 (0.69-0.87) 0.85 (0.71-1.02) 0.93 (0.73-1.18)
Hispanic 1.07 (0.76-1.51) 1.20 (0.74-1.97) 1.03 (0.83-1.28) 1.07 (0.83-1.38) 0.90 (0.52-1.57) 1.18 (0.62-2.26)
Other 0.34 (0.10-1.15) 0.72 (0.43-1.22) 1.14 (0.86-1.53) 0.90 (0.71-1.12) 1.32 (0.55-3.18) 1.28 (0.76-2.16)
Mechanical ventilation daysvs <72 h
3-7 d 0.99 (0.80-1.24) 1.12 (0.80-1.57) 1.69 (1.40-2.04) 1.83 (1.43-2.33) 1.39 (1.01-1.90) 1.32 (0.88-1.98)
8-14 d 0.81 (0.61-1.07) 1.06 (0.74-1.51) 2.72 (1.87-3.94) 3.35 (2.45-4.58) 1.99 (1.20-3.29) 2.48 (1.36-4.53)
>14 d 1.06 (0.74-1.51) 1.66 (0.94-2.94) 4.17 (2.61-6.66) 5.00 (3.73-6.72) 2.07 (1.08-3.98) 1.95 (1.06-3.58)
ICD-9 coded disease state
Acute hepatic injury 1.56 (1.29-1.88) 1.42 (0.88-2.28) 1.47 (1.23-1.73) 1.32 (1.00-1.63) 1.76 (1.25-2.49) 0.73 (0.41-1.30)
Chronic hepatic injury 1.85 (1.47-2.33) 2.36 (1.59-3.48) 0.97 (0.80-1.17) 0.92 (0.72-1.18) 0.78 (0.58-1.06) 0.98 (0.57-1.66)
Acute kidney injury 1.21 (1.02-1.43) 1.53 (1.13-2.09) 1.47 (1.30-1.66) 1.20 (1.05-1.38) 1.36 (1.04-1.77) 1.28 (1.00-1.65)
Chronic kidney injury 0.96 (0.80-1.14) 0.96 (0.70-1.31) 1.14 (1.00-1.29) 0.89 (0.74-1.06) 1.29 (1.08-1.53) 1.19 (0.88-1.62)
Burn injury 1.11 (0.80-1.41) 1.22 (0.85-1.59) 0.89 (0.41-1.93) 1.85 (1.36-2.49) 1.08 (0.81-1.33) 1.03 (0.62-1.49)
Neurologic injury 1.15 (1.00-1.32) 1.25 (1.06-1.48) 1.50 (1.35-1.67) 1.48 (1.32-1.66) 0.98 (0.84-1.14) 0.82 (0.65-1.04)
Trauma/major surgery 1.12 (0.71-1.75) 1.01 (0.63-1.73) 1.47 (1.19-1.82) 1.21 (1.04-1.41) 1.76 (1.18-2.60) 0.86 (0.54-1.37)
Transplant 1.74 (0.63-4.79) 1.18 (0.78-1.74) 2.24 (1.11-4.52) 3.96 (1.69-9.28) 5.41 (1.76-16.62) 5.26 (1.27-21.76)
Pancreatitis 1.28 (0.96-1.72) 1.42 (0.95-2.13) 1.05 (0.84-1.31) 0.94 (0.73-1.21) 1.44 (0.99-2.08) 1.29 (0.74-2.25)
Inflammatory bowel disease 1.24 (0.68-2.25) 1.29 (0.51-3.26) Not included Not included 3.14 (2.23-4.40) 3.57 (2.12-5.79)
Previous ulcer 0.87 (0.60-1.26) 1.14 (0.66-1.96) Not included Not included 0.72 (0.48-1.10) 0.80 (0.38-1.68)
Sepsis 1.00 (0.79-1.25) 1.12 (0.91-1.38) 1.28 (1.05-1.51) 1.39 (1.16-1.61) 1.43 (1.07-1.87) 1.55 (1.30-1.85)
Shock or hypotension 1.17 (1.04-1.33) 1.17 (1.00-1.34) 1.28 (1.18-1.37) 1.15 (1.02-1.30) 1.09 (0.93-1.27) 1.24 (1.04-1.49)
Coagulopathy 1.7 (1.35-2.14) 2.15 (1.51-3.05) Not included Not included Not included Not included
Neutropenia 0.68 (0.40-1.15) 0.61 (0.20-1.89) 0.77 (0.52-1.14) 1.31 (0.74-2.32) 1.08 (0.48-2.43) 1.67 (0.62-4.47)
Thrombocytopenia 0.70 (0.56-0.87) 0.65 (0.42-1.00) Not included Not included Not included Not included
(continued)
Research Original Investigation H2 Receptor Antagonists vs Proton Pump Inhibitors
572 JAMA Internal Medicine April 2014 Volume 174, Number 4 jamainternalmedicine.com
Copyright 2014 American Medical Association. All rights reserved.
Downloaded From: http://archinte.jamanetwork.com/ by a Gakko Hojin Jikei Daigaku User on 06/09/2014
Copyright 2014 American Medical Association. All rights reserved.
data that is available within this database is limited, and whileextensive, the database may not apply to all critically ill pa-tients. Clinical data (eg, endoscopy or bronchoscopy) and ac-tual laboratory results are unavailable. We are unable to vali-date associations between ICU and hospital lengths of stay,mortality, and ICU and hospital costs and GI hemorrhage, pneu-monia, or CDI. Lastly, most of the mechanically ventilated pa-tients received an acid suppressant, so we are unable to makecomparisons between H2RAs, PPIs, and no acid suppression.
Conclusions
Proton pump inhibitor therapy is associated with greaterrisks of GI hemorrhage, pneumonia, and CDI compared withH2RA therapy in mechanically ventilated patients. Numer-ous other risk factors have been identified for each of theseoutcomes. Additional studies are needed to confirm theseresults.
ARTICLE INFORMATION
Accepted for Publication: November 18, 2013.
Published Online: February 17, 2014.doi:10.1001/jamainternmed.2013.14673.
Author Contributions: Dr MacLaren had full accessto all of the data in the study and takesresponsibility for the integrity of the data and theaccuracy of the data analysis.Study concept and design: Reynolds.Acquisition of data: MacLaren.Analysis and interpretation of data: MacLaren,Reynolds, Allen.Drafting of the manuscript: MacLaren.Critical revision of the manuscript for importantintellectual content: MacLaren, Reynolds, Allen.Statistical analysis: MacLaren, Allen.Administrative, technical, and material support:Reynolds.Study supervision: Reynolds.
Conflict of Interest Disclosures: None reported.
Previous Presentation: An abstract of this studywas presented as a poster at the Society of CriticalCare Medicine Congress; January 10-13, 2014; SanFrancisco, California.
Additional Contributions: The Premier PerspectiveDatabase was provided in kind by Kavita Nair, PhD,Center for Pharmaceutical Outcomes Research,University of Colorado Skaggs School of Pharmacyand Pharmaceutical Sciences.
REFERENCES
1. MacLaren R. A review of stress ulcer prophylaxis.J Pharm Pract. 2002;15(2):147-157.
2. Ali T, Harty RF. Stress-induced ulcer bleeding incritically ill patients. Gastroenterol Clin North Am.2009;38(2):245-265.
3. ASHP Commission on Therapeutics. ASHPtherapeutics guidelines on stress ulcer prophylaxis.Am J Health Syst Pharm. 1999;56:347-379.
4. Cook DJ, Griffith LE, Walter SD, et al; CanadianCritical Care Trials Group. The attributable mortalityand length of intensive care unit stay of clinicallyimportant gastrointestinal bleeding in critically illpatients. Crit Care. 2001;5(6):368-375.
5. Wunsch H, Linde-Zwirble WT, Angus DC,Hartman ME, Milbrandt EB, Kahn JM. The
epidemiology of mechanical ventilation use in theUnited States. Crit Care Med. 2010;38(10):1947-1953.
6. Cook DJ, Reeve BK, Guyatt GH, et al. Stress ulcerprophylaxis in critically ill patients: resolvingdiscordant meta-analyses. JAMA.1996;275(4):308-314.
7. Cook D, Guyatt G, Marshall J, et al; CanadianCritical Care Trials Group. A comparison ofsucralfate and ranitidine for the prevention of uppergastrointestinal bleeding in patients requiringmechanical ventilation. N Engl J Med.1998;338(12):791-797.
8. Alhazzani W, Alenezi F, Jaeschke RZ, Moayyedi P,Cook DJ. Proton pump inhibitors versus histamine 2receptor antagonists for stress ulcer prophylaxis incritically ill patients: a systematic review andmeta-analysis. Crit Care Med. 2013;41(3):693-705.
9. Lin PC, Chang CH, Hsu PI, Tseng PL, Huang YB.The efficacy and safety of proton pump inhibitorsvs histamine-2 receptor antagonists for stress ulcerbleeding prophylaxis among critical care patients:a meta-analysis. Crit Care Med. 2010;38(4):1197-1205.
Table 6. Multivariable Regression Models of Adjusted ORs for Secondary GI Hemorrhage, Pneumonia, and CDI With Propensity Scoreas a Covariate and After Matchinga (continued)
Parameter
OR (95% CI)
GI Hemorrhage Pneumonia CDIPropensity Score
(n = 1563)Matching(n = 624)
Propensity Score(n = 12 065)
Matching(n = 5697)
Propensity Score(n = 1129)
Matching(n = 527)
Primary or secondary diagnosis
Hypertension 0.77 (0.67-0.87) 0.75 (0.62-0.91) 0.79 (0.72-0.87) 0.77 (0.69-0.86) 0.87 (0.75-1.00) 0.91 (0.78-1.07)
Sepsis 1.19 (1.06-1.34) 1.12 (0.90-1.39) 1.33 (1.25-1.45) 1.44 (1.25-1.65) 1.05 (0.89-1.23) 1.55 (1.30-1.85)
Acute respiratory failure 1.24 (1.08-1.41) 1.33 (1.13-1.57) 1.50 (1.33-1.70) 2 (1.72-2.34) 2.10 (1.52-2.89) 1.14 (0.95-1.36)
Congestive heart failure 1.09 (0.96-1.25) 1.31 (1.10-1.56) 1.11 (1.02-1.20) 1.13 (1.02-1.24) 1.16 (1.04-1.29) 1.13 (0.93-1.26)
Acute kidney injury 1.19 (1.04-1.36) 0.98 (0.78-1.23) 1.24 (1.09-1.41) 1.24 (1.05-1.46) 1.09 (0.90-1.31) 1.13 (0.93-1.26)
Coronary artery disease 0.89 (0.73-1.10) 0.7 (0.51-1.16) 0.78 (0.69-0.87) 0.72 (0.62-0.85) 1.04 (0.91-1.18) 0.77 (0.61-0.99)
Myocardial infarction 1.67 (1.42-1.96) 1.68 (1.29-2.17) 1.12 (1.00-1.25) 1.21 (1.02-1.43) 0.89 (0.68-1.16) 0.94 (0.69-1.29)
Anticoagulant use 0.93 (0.79-1.10) 0.93 (0.77-1.13) Not included Not included Not included Not included
Platelet inhibitor use 0.76 (0.68-0.85) 1.04 (0.85-1.29) Not included Not included Not included Not included
Ampicillin use Not included Not included Not included Not included 1.11 (0.90-1.35) 1.26 (1.01-1.57)
Carbapenem use Not included Not included Not included Not included 1.66 (1.42-1.95) 1.56 (1.17-2.09)
Piperacillin use Not included Not included Not included Not included 1.29 (1.11-1.50) 1.27 (1.04-1.56)
Total parenteral nutrition 1.63 (0.97-2.74) 3.29 (1.93-5.60) 1.70 (1.08-2.69) 2.12 (1.41-3.20) 4.26 (1.92-9.49) 4.82 (3.09-7.53)
Abbreviations: CDI, Clostridium difficile infection; GI, gastrointestinal tract;H2RA, histamine-2 receptor antagonist; ICD-9, International Classification ofDiseases, Ninth Revision; OR, odds ratios; PPI, proton pump inhibitor.a Data are presented as OR (95% CI) from multivariable regression models using
generalized estimating equation with a logit-link (SAS PROC GENMOD).Propensity score and subsequent matching included the following variables:
age; sex; admission year; primary diagnosis; ICD-9–coded disease statesoccurring within 48 hours of admission to the intensive care unit; and use ofcorticosteroids, anticoagulants, platelet inhibitors, or total parenteral nutritionwithin 48 hours of admission to the intensive care unit. Definitions of diseasestates and drug therapies are provided in the supplementary information.
H2 Receptor Antagonists vs Proton Pump Inhibitors Original Investigation Research
jamainternalmedicine.com JAMA Internal Medicine April 2014 Volume 174, Number 4 573
Copyright 2014 American Medical Association. All rights reserved.
Downloaded From: http://archinte.jamanetwork.com/ by a Gakko Hojin Jikei Daigaku User on 06/09/2014
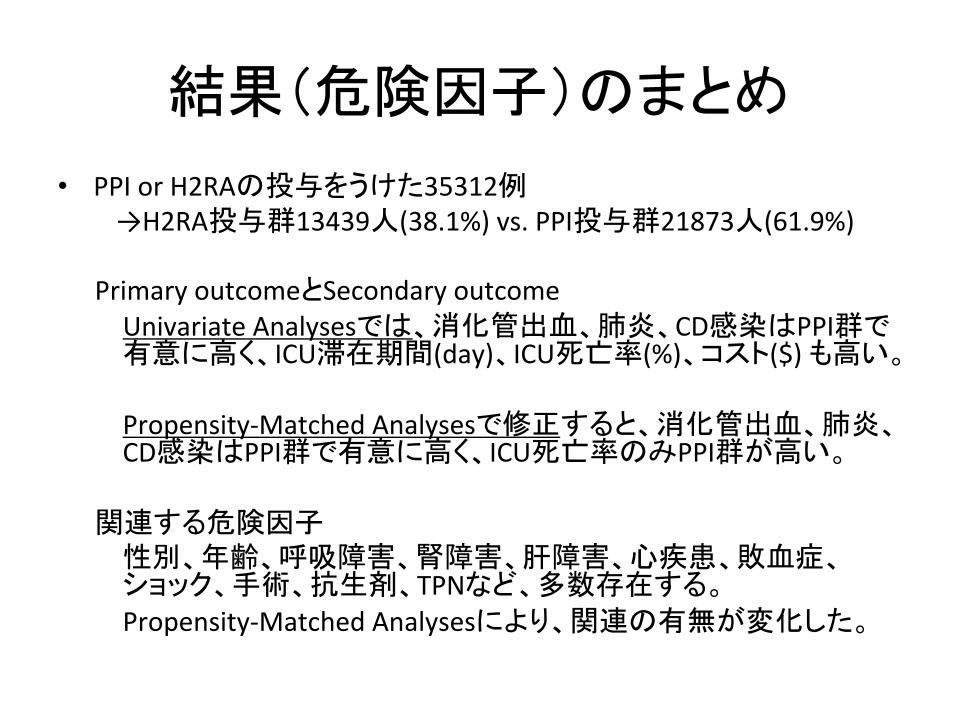
結果(危険因子)のまとめ
• PPI or H2RAの投与をうけた35312例 →H2RA投与群13439人(38.1%) vs. PPI投与群21873人(61.9%)
Primary outcomeとSecondary outcome Univariate Analysesでは、消化管出血、肺炎、CD感染はPPI群で有意に高く、ICU滞在期間(day)、ICU死亡率(%)、コスト($) も高い。 Propensity-‐Matched Analysesで修正すると、消化管出血、肺炎、CD感染はPPI群で有意に高く、ICU死亡率のみPPI群が高い。
関連する危険因子 性別、年齢、呼吸障害、腎障害、肝障害、心疾患、敗血症、ショック、手術、抗生剤、TPNなど、多数存在する。 Propensity-‐Matched Analysesにより、関連の有無が変化した。
Discussion
• ICUの成人の人工呼吸管理患者では、PPIの使用は肺炎、CD感染だけでなく、仮説に反して消化管出血までも増大させた結果であった。
→消化管出血、肺炎、CD感染いずれでも他の 関連危険因子が多数あり、いずれもICU患者 での頻度は高い。
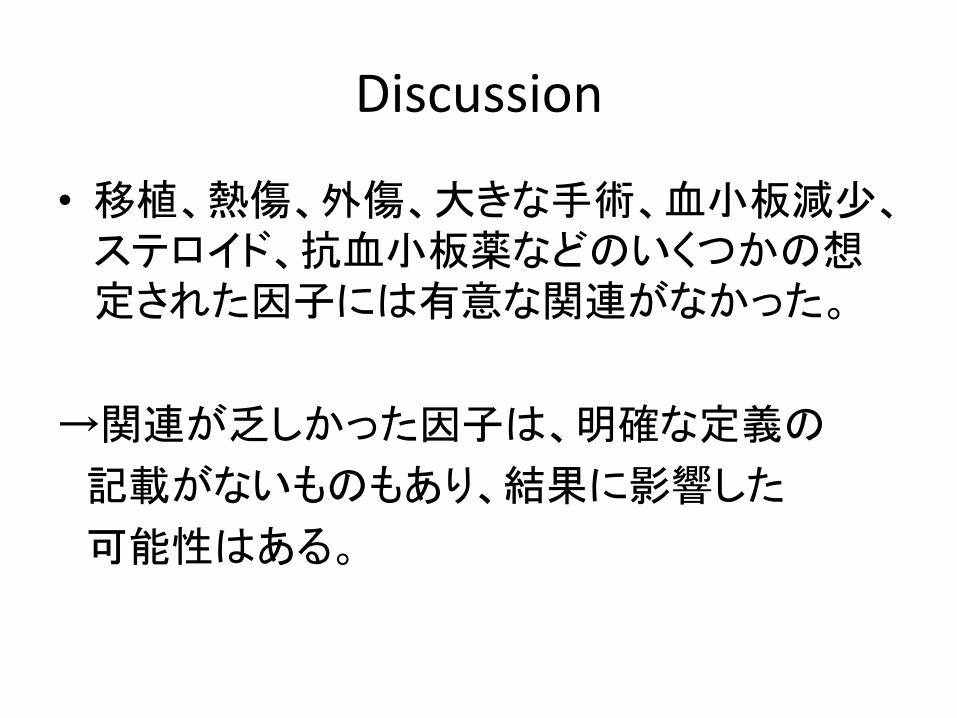
Discussion
• 移植、熱傷、外傷、大きな手術、血小板減少、ステロイド、抗血小板薬などのいくつかの想定された因子には有意な関連がなかった。
→関連が乏しかった因子は、明確な定義の 記載がないものもあり、結果に影響した 可能性はある。
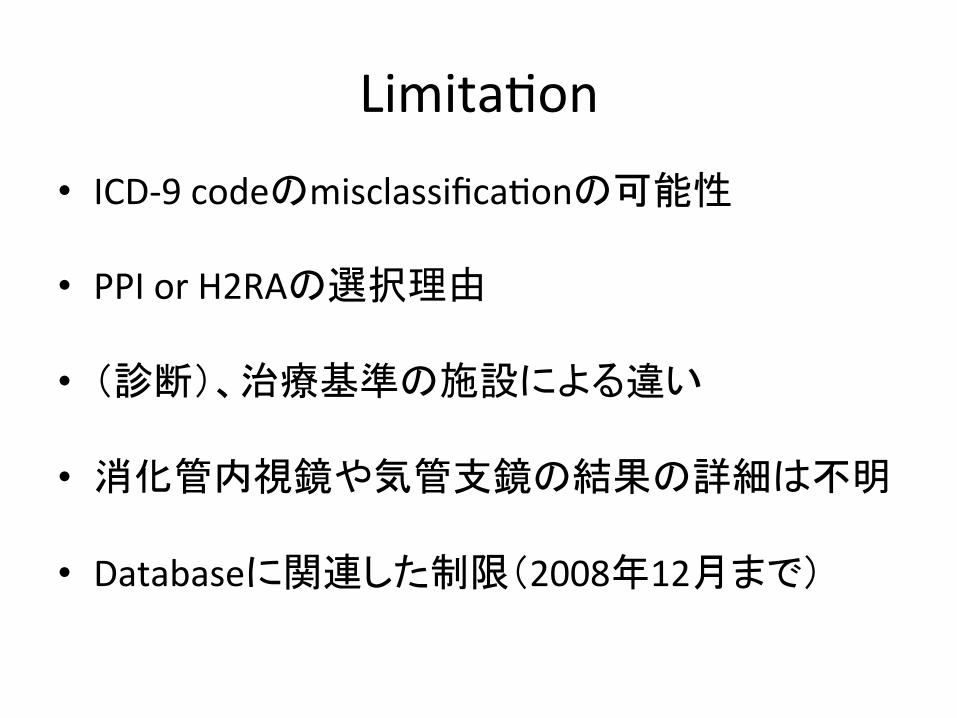
LimitaMon • ICD-‐9 codeのmisclassificaMonの可能性 • PPI or H2RAの選択理由
• (診断)、治療基準の施設による違い
• 消化管内視鏡や気管支鏡の結果の詳細は不明
• Databaseに関連した制限(2008年12月まで)
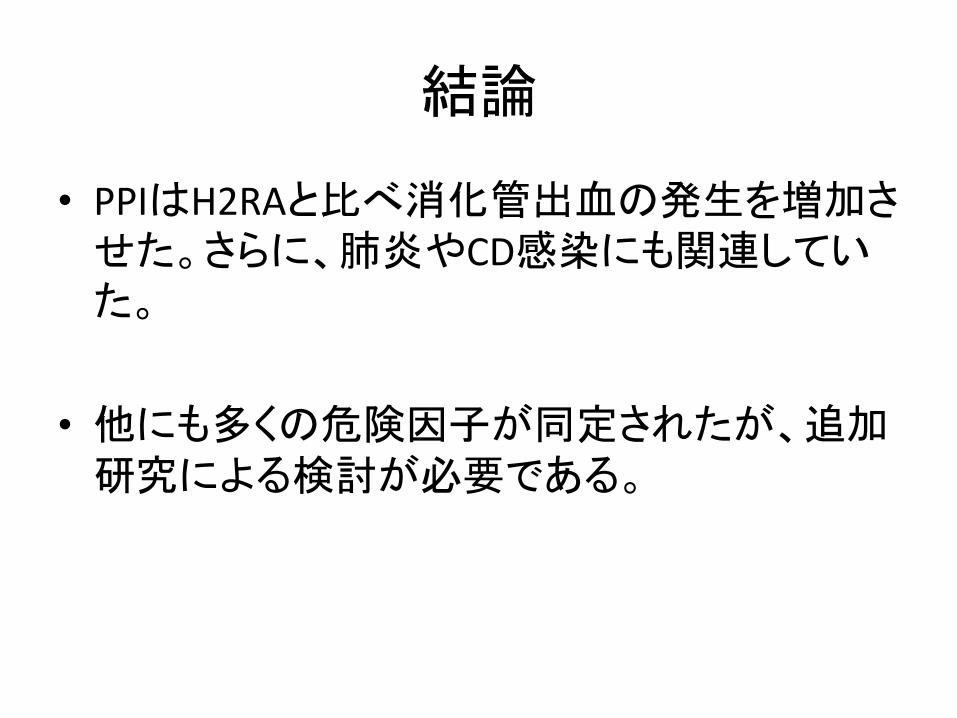
結論
• PPIはH2RAと比べ消化管出血の発生を増加させた。さらに、肺炎やCD感染にも関連していた。
• 他にも多くの危険因子が同定されたが、追加研究による検討が必要である。
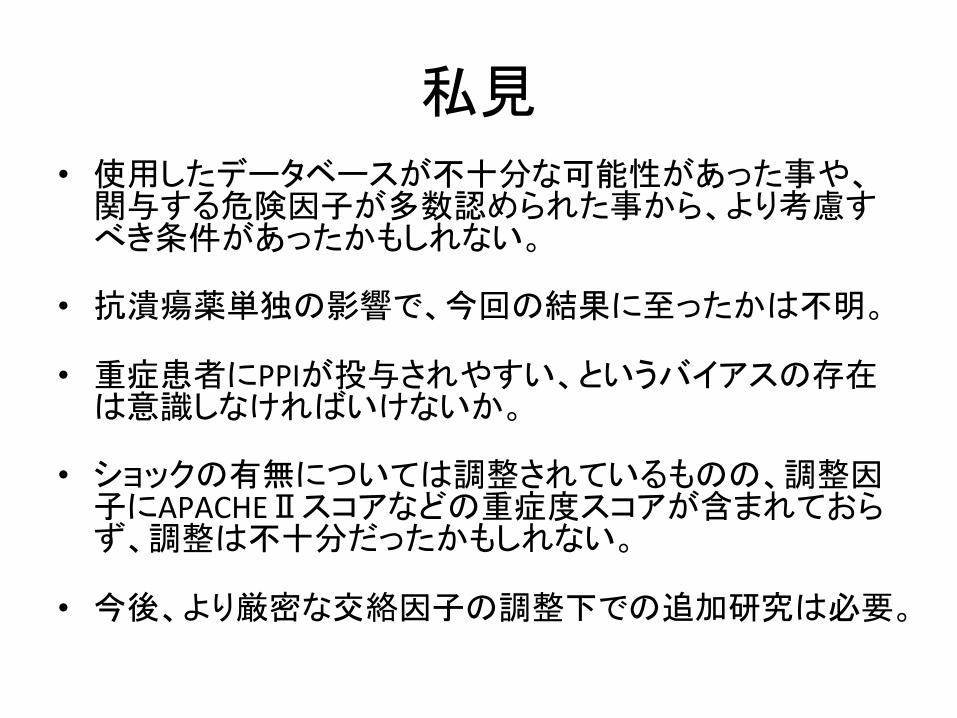
私見
• 使用したデータベースが不十分な可能性があった事や、関与する危険因子が多数認められた事から、より考慮すべき条件があったかもしれない。
• 抗潰瘍薬単独の影響で、今回の結果に至ったかは不明。
• 重症患者にPPIが投与されやすい、というバイアスの存在は意識しなければいけないか。
• ショックの有無については調整されているものの、調整因子にAPACHEⅡスコアなどの重症度スコアが含まれておらず、調整は不十分だったかもしれない。
• 今後、より厳密な交絡因子の調整下での追加研究は必要。

![0123456789 - swu.edu.cnxbbjb.swu.edu.cn/viscms/u/cms/xbbjb/201310/29083835f81m/2009-3-058.pdf]-−B˜•"fÌ(Ÿó(…ô-#ƒœ@i r#ýbflqŠ^*Aÿrœ@Ÿ#Eir⁄s› Û#£‡r€fi#,t#š_#œsuvw1](https://img.pdfslide.tips/doc/110x75/5e84081dde21e25a9c48bda4/0123456789-swuedu-aboeafoe-i-rbiqareirasa.jpg)
![9:;?@ABCDEFGH · ó4€ %’ ô/ b ıı\ö RhT÷] łø˜œ&_˜˙ßüý þULE] 0 .˜Z IC)Š Ý b t HÕ-ŸÜ ŽÕ-ŸßŸ ˆ å 6 ƒ“ƒŒ#ıƒıł œÜÕ-ıƒ÷]ß](https://img.pdfslide.tips/doc/110x75/5ff7e5dd38c1a83a48462759/9abcdefgh-4a-a-b-rht-oeoe-ule-0.jpg)