Embed Size (px)
Citation preview

HSR: SYSTEM INTEGRATION FOR HIGH LEVEL PERFORMANCE
Eduardo Romo

I. HSR, AN INTEGRATED SYSTEM
I
§ Different transportation modes
§ Different performance level
single unit system
multicomponent complex system
Pedestrian HS Train
I.1
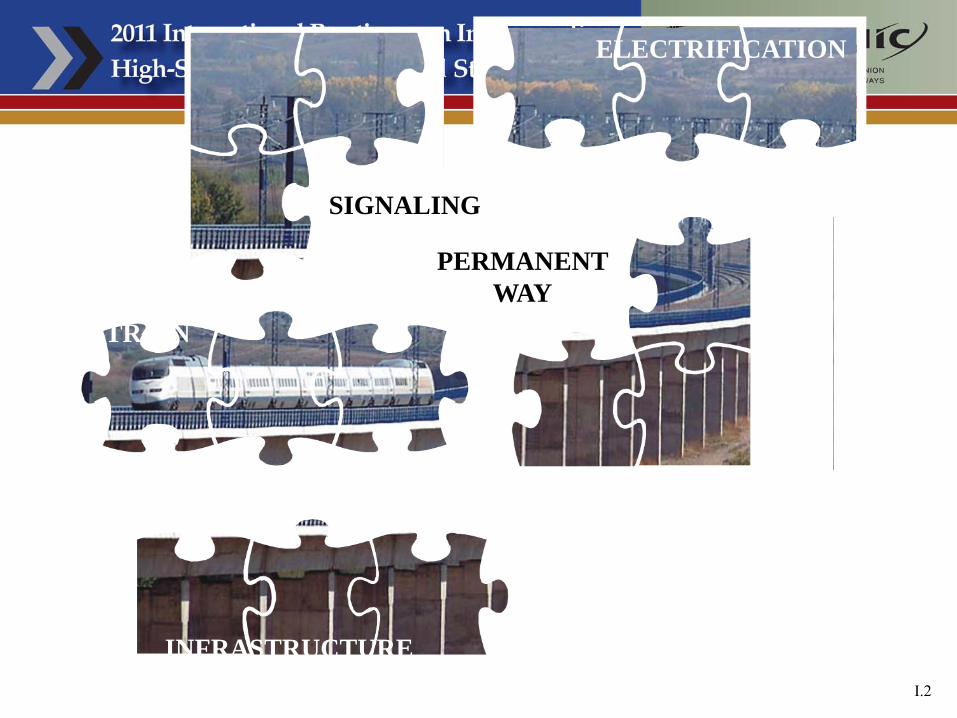
ELECTRIFICATION
TRAIN
INFRASTRUCTURE
SIGNALING
PERMANENT WAY
I.2
I.2

§ Different transportation modes
• Single, closed, system• Component by component
§ Different strategies and results
• Purchase strategy• Suppliers selection process• Industrial development strategy• System management options
I.3

• The great integration level of the railroad system
• Different level of integration / different performance level
I.4

II. JOURNEY TIME AS THE MAIN GOAL
II
I.16
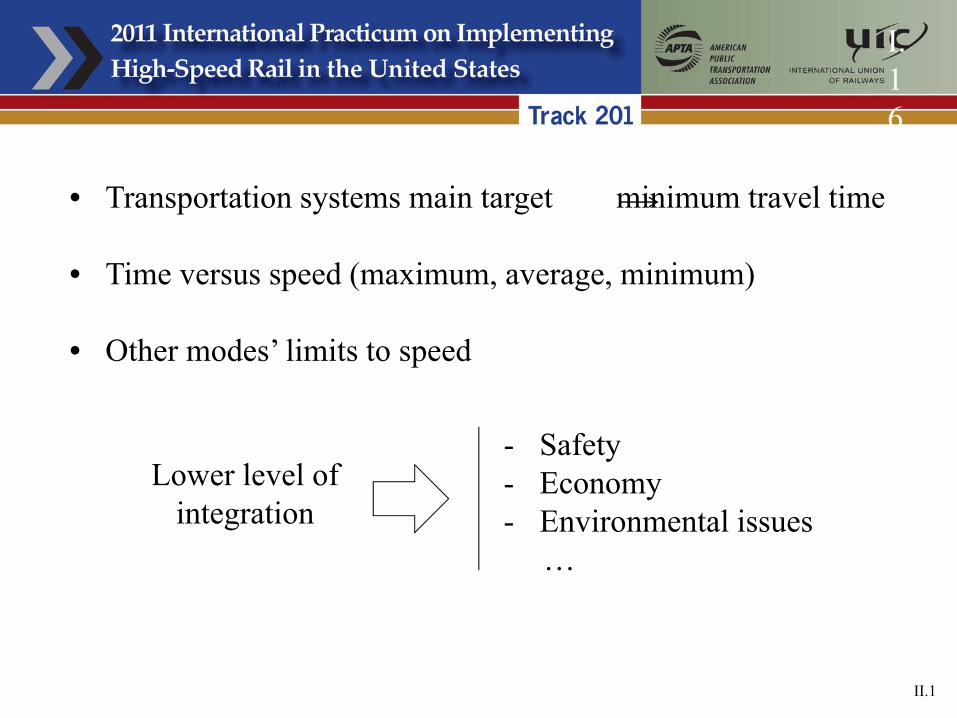
- Safety- Economy- Environmental issues
…
Lower level of integration
• Transportation systems main target minimum travel time
• Time versus speed (maximum, average, minimum)
• Other modes’ limits to speed
II.1

I.
COMPARISON WITH OTHER MODELS
Maximum speed test
Maximum operating speed
Km/h
700
600
500
400
300
200
100
01950 1960 1970 1980 1990 2000 2010 2020 2030
350
II.2

- Long term- Mid term- Short term
Efficient management
• Journey time is the main driverof the HSR system
• Capacity improvement is alsoat the origin of this technology(Japan, Paris-Lyon)
• Main components involved(infrastructure, rolling stock)
• Different time scale to beconsidered
- Infrastructure
- Permanent way
- Electrification
- Safety /signaling/communications
- Rolling stock
II.3

III. THE WAY, THE ALIGNMENT, THE INFRASTRUCTURE
III

llllllllllllllllllll
llllllllllllllllllllllllllllllllllllllllllllllllllllllllllllllllllllllllllllllllllllll
III.1

III.2
• Comparison with other modes- Road- Air- Shipping
…• Self guidance as key factor for journey time performance
• Advantages of a self guided system- Safety- Comfort level- Centralized traffic control
…
Reliability, cost effectiveness, high speed…

III.3
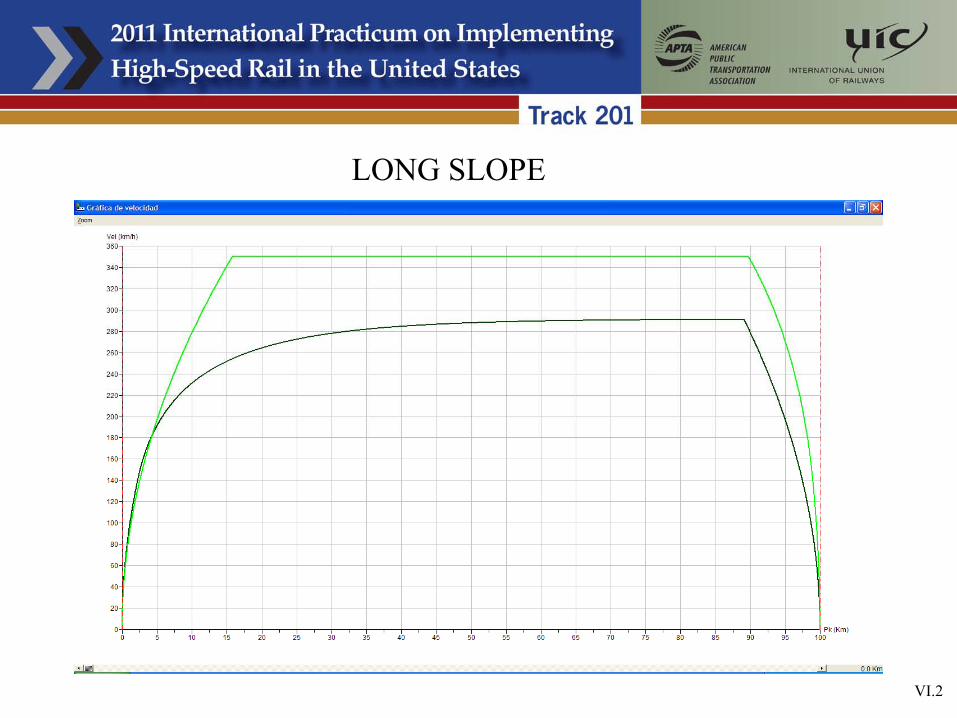
• Plan alignment and long profile play a main role in the speed / journey time definition
• Main parameter involved on the speed definition- Curve radius- Transversal acceleration- Cant- Slope (value and length)
• External factors to be considered- Environmental- Row availability- Costs
• Corridor study- Straight alignment- Intermediate cities- Final decision
options multicriteria analysis

16/17III.4

III.6
HS line curvature diagram

III.5
Existing line curvature diagram

III.7
• Main factors to take into account- Territory structure- Environmental condition- Orography- Urban areas- Hydrological and geotechnical conditions
…• Sequential development- Corridor analysis functionality/intermodality/connectivity- Route selection and predesign journey time/performance cost analysis- Detailed design detailed alignment geometry

§ International standards
§ Interpretation
• Limiting values
• Maximum speed
• Complex parameters
• Tilting trains
III.8

IV. THE ROLLING STOCK
IV

• Main role in journey time• Technology under continuous evolution• Compatibility / interoperability• Key factors- Adherence- Power- Traction effort- Mass
IV.1
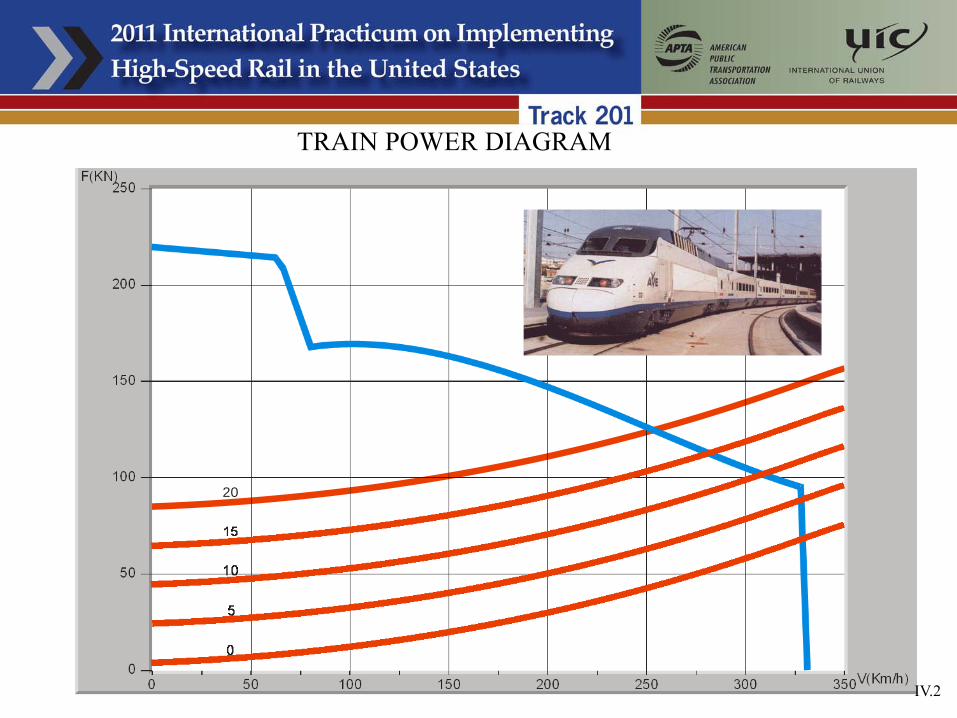
20
TRAIN POWER DIAGRAM
IV.2

IV.3
• Technology trends- Acceleration capacity- Braking process- Tilting bodies
• Associated costs- Purchasing- Maintenance- Operational- Energy efficiency
…

V. TOOLS FOR ANALYSIS INTERACTION. SIMULATING TRAIN´S RUNS
V

V.1
• Multiple trains capacity analysis / timetable production• Single train speed / journey time
SIMULATORS

V.2
INPUTS / OUTPUTS
• Inputs
‒ Alignment geometry
‒ Rolling stock features
‒ Operation mode
‒ Main running parameters
• Outputs
‒ Speed/acceleration/journey time
‒ Value/diagrams
‒ Other results (energy consumption…)

V.3

V.3

V.4

V.5

V.6

V.6

VI. ALIGNMENT, ROLLING STOCK AND OPERATION MODE
INTEGRATED PERFORMANCE
VI

6.2
VI.1
ACCELERATION / BRAKING PROCESS
VI.2
LONG SLOPE

0
20
40
60
80
100
120
140
160
180
200
0+000 10+000 20+000 30+000 40+000 50+000 60+000
P.K.
VE
LO
CID
AD
(km
/h)
Velocidadmáxima: 160 km/h
Tiempo de recorrido: 27min36s
Velocidadmedia: 130,42 km/h
Velocidadmáxima: 190 km/h
Tiempo de recorrido: 23min16s
Velocidadmedia: 154,74 km/h
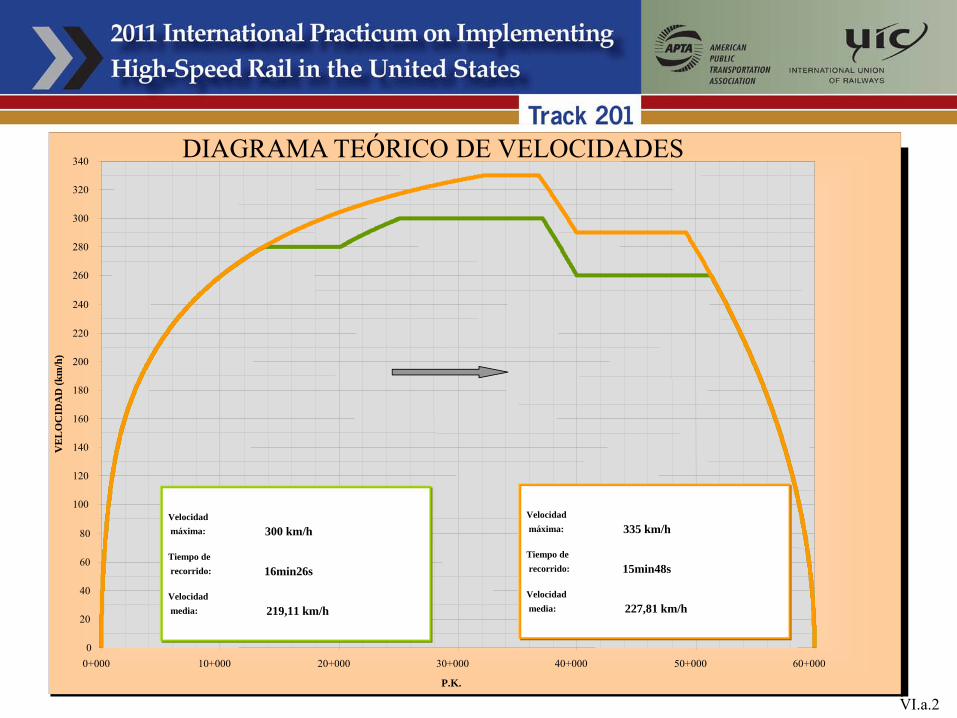
DIAGRAMA TEÓRICO DE VELOCIDADES
VI.a.1
20
40
60
80
100
120
140
160
180
200
220
240
260
280
300
320
340
00+000 10+000 20+000 30+000 40+000 50+000 60+000
P.K.
VE
LO
CID
AD
(km
/h)
Velocidadmáxima: 300 km/h
Tiempo de recorrido: 16min26s
Velocidadmedia: 219,11 km/h
DIAGRAMA TEÓRICO DE VELOCIDADES
VI.a.2
Velocidadmáxima: 335 km/h
Tiempo de recorrido: 15min48s
Velocidadmedia: 227,81 km/h

0
20
40
60
80
100
120
140
160
180
200
220
240
260
280
300
320
340
0+000 40+000 80+000 120+000 160+000 200+000
P.K.
VE
LO
CID
AD
(km
/h)
Velocidadmáxima: 300 km/h
Tiempo de
recorrido: 43 min59s
Velocidadmedia: 272,79 km/h
Velocidadmáxima: 335 km/h
Tiempo de recorrido: 40min38s
Velocidadmedia: 295,38 km/h
DIAGRAMA TEÓRICO DE VELOCIDADES
VI.a.3

20
40
60
80
100
120
140
160
180
200
220
240
260
280
300
320
00+000 40+000 80+000 120+000 160+000 200+000
P.K.
VE
LO
CID
AD
(km
/h)
Velocidadmáxima: 250 km/h
Tiempo de
recorrido: 1h07 min29s
Velocidadmedia: 177,82 km/h
Velocidadmáxima: 300 km/h
Tiempo de
recorrido: 1h03 min57s
Velocidadmedia:
187,64 km/h
VI.a.4
DIAGRAMA TEÓRICO DE VELOCIDADES

16%
4%
8%5%
VI.a.5
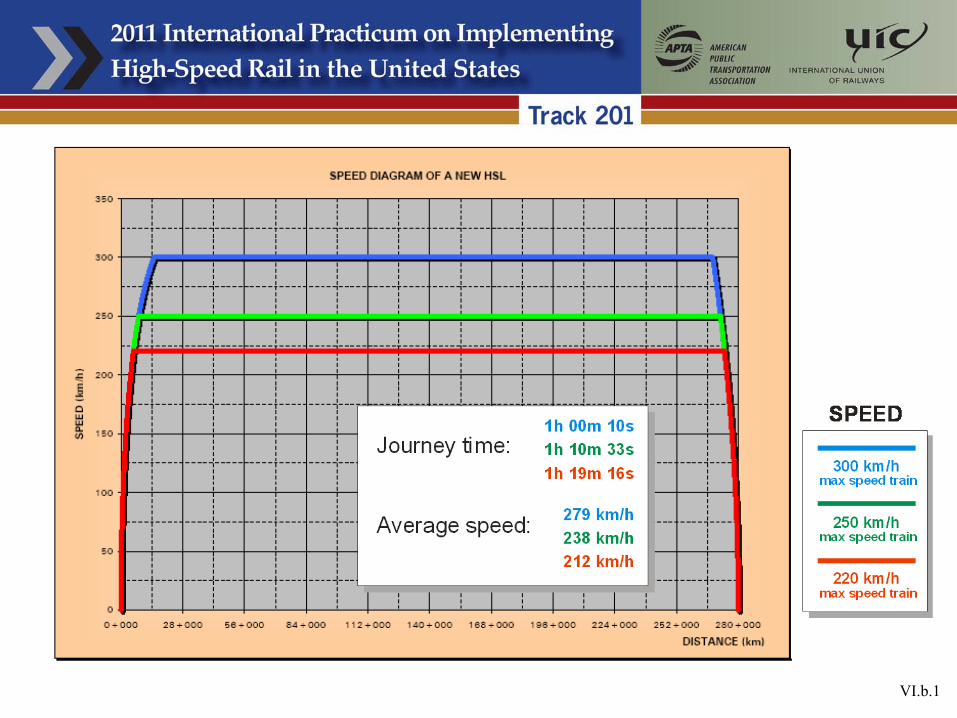
VI.b.1

VI.b.2
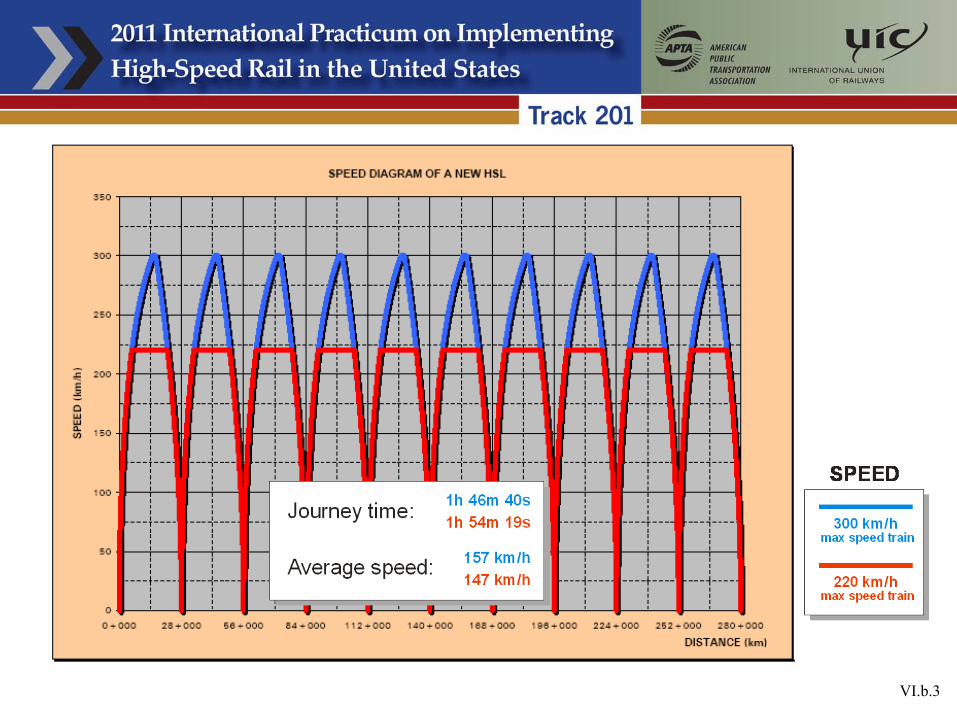
VI.b.3

VI.b.4
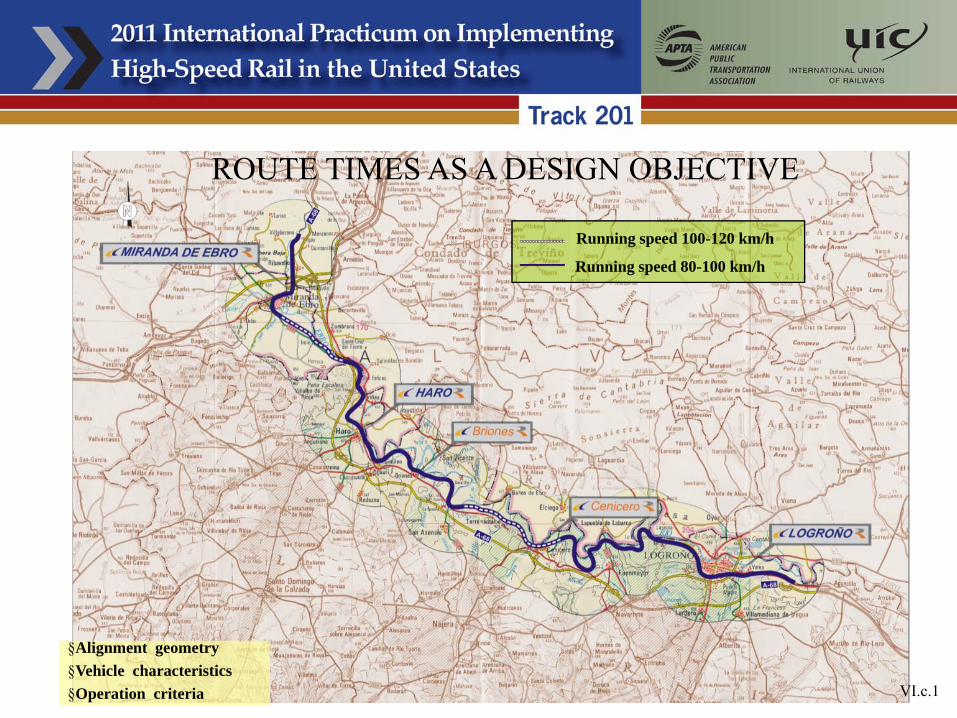
ROUTE TIMES AS A DESIGN OBJECTIVE
§Alignment geometry§Vehicle characteristics§Operation criteria
Running speed 100-120 km/h
Running speed 80-100 km/h
VI.c.1

§R
adiu
s of c
urva
ture
s (m
)
DIAGRAM OF CURVATURES. PRESENT CONDITION
VI.c.2

Tipe of train: TILTING
Maximum speed:220km/h
Tipe of train: INTERCITY
Maximum speed:220km/h
§Sp
eed
(km
/h)
SPEED DIAGRAM. PRESENT CONDITION
VI.c.3
39 min. 27s 38 min. 54s 34 min. 37s40 min. 35s

LOCAL INTERVENTIONS ON AN EXISTING LINE
VI.c.4
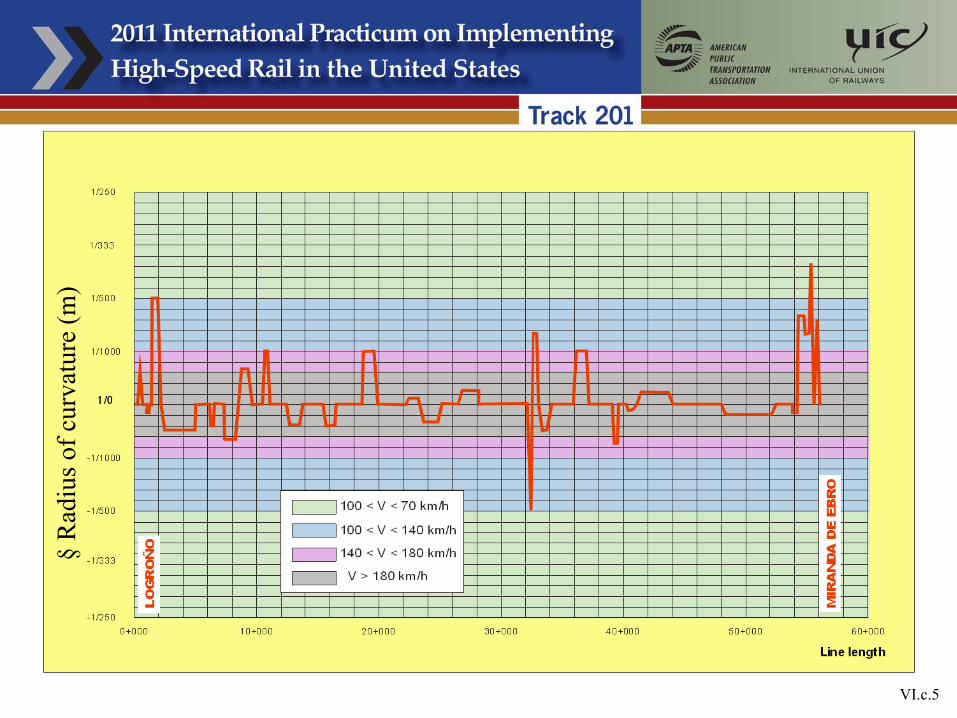
§R
adiu
s of c
urva
ture
(m)
VI.c.5
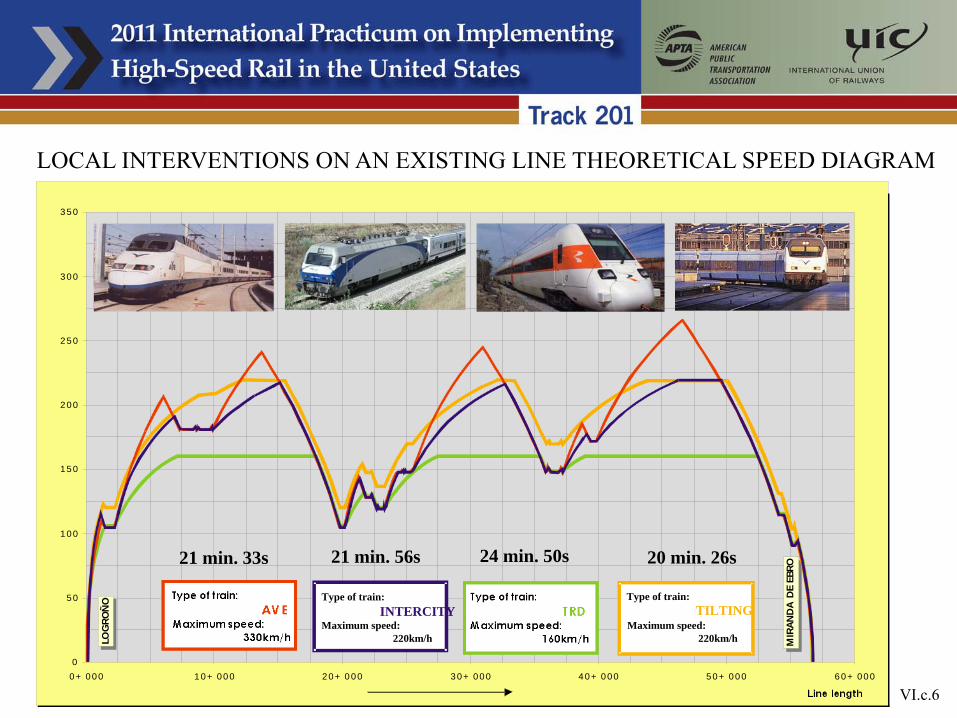
0+ 000 1 0+ 000 20+ 0 00 30+ 000 40+ 000 50+ 000 60 + 000P.K.
0
50
100
150
200
250
300
350
LOG
ROÑ
O
MIR
AND
AD
EEB
RO
Type of train:INTERCITY
Maximum speed:220km/h
LOCAL INTERVENTIONS ON AN EXISTING LINE THEORETICAL SPEED DIAGRAM
VI.c.6
Type of train: TILTING
Maximum speed:220km/h
21 min. 33s 21 min. 56s 24 min. 50s 20 min. 26s

Type of train:INTERCITY
Maximum speed:220km/h
§Sp
eed
(km
/h)
VI.c.7
LOCAL INTERVENTIONS ON AN EXISTING LINE THEORETICAL SPEED DIAGRAM. INCLUDING INTERMEDIATE STOPS
Type of train:
TILTINGMaximum speed:
220km/h
29 min. 48s 29 min. 51s 32 min. 45s 28 min. 43s

§R
adiu
s of c
urva
ture
(m)
CURVATURES DIAGRAM OF THE ALTERNATIVES
VI.c.8

§Sp
eed
(km
/h)
SPEED DIAGRAM OF THE ALTERNATIVES
VI.c.9
Tipo de tren: INTERCITY
Velocidad máxima:220km/h
Tipo de tren: TILTING
Velocidad máxima:220km/h
15 min. 31s 18 min. 03s 22 min. 34s 17 min. 54s

§Sp
eed
(km
/h)
SPEED DIAGRAM OF THE ALTERNATIVES INCLUDING INTERMEDIATE STOPS
VI.c.10
Type of train:INTERCITY
Maximum speed:220km/h
27 min. 42s 28 min. 06s 31 min. 39s
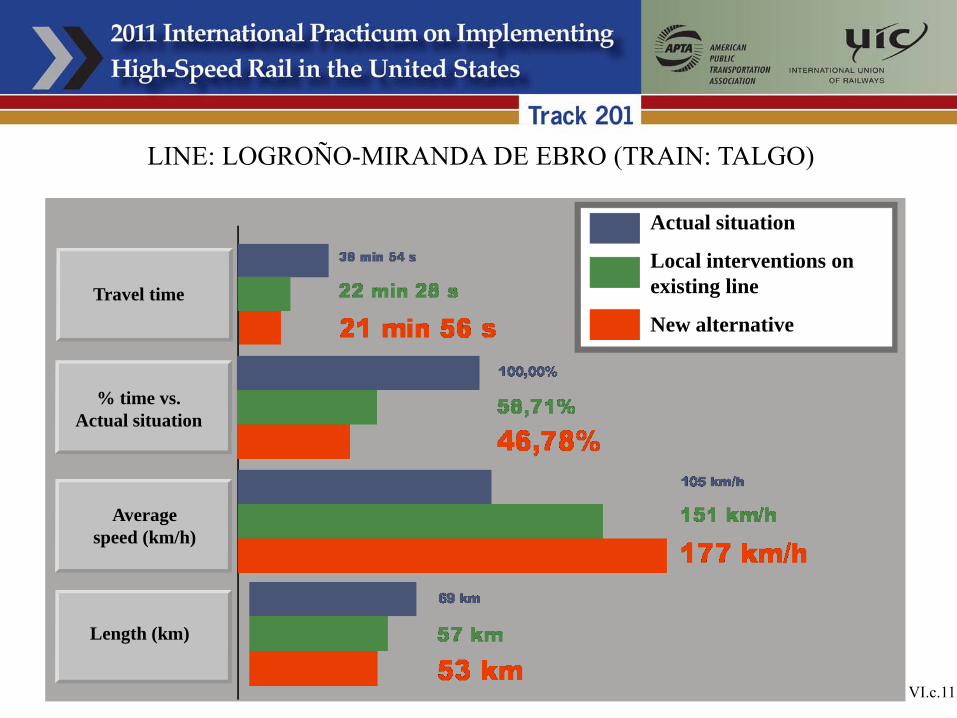
Actual situation
Local interventions on existing line
New alternativeTravel time
Average speed (km/h)
Length (km)
% time vs. Actual situation
LINE: LOGROÑO-MIRANDA DE EBRO (TRAIN: TALGO)
VI.c.11

Actualsituation
Interventionswithout stops
Local interventions
with stops
Alternative alignmentwith stops
Alternative alignment
without stops
COMPARISON OF TRAVEL TIME IN VARIOUS SITUATIONS
VI.c.12
AVEINTERCITYTRDTILTING TRAIN
Journey time

VII. FINAL COMMENTS
VII

VII.1
Final comments
• Integration in the origin of the high levelperformance
• Journey time versus maximum speed as maintarget
• Alignment, rolling stock and operation modedetermine the travel time
• Methodology to study a complex process