Embed Size (px)
Citation preview

Human Mobility Analysis based on Social Media and Fuzzy CLustering
Geneva, Switzerland, 6-9 June 2017 GIoTS
Jesús Cuenca JaraDr. Fernando Terroso-SaenzDr. Mercedes Valdes-Vela
Dr. Aurora Gonzalez-VidalDr. Antonio F. Skarmeta-Gómez
University of Murcia
Faculty of Computer ScienceDeparment of Communications and Information Engineering
Horizon 2020

Agenda
1)Introduction2)Proposed system3)Evaluation4)Conclusions
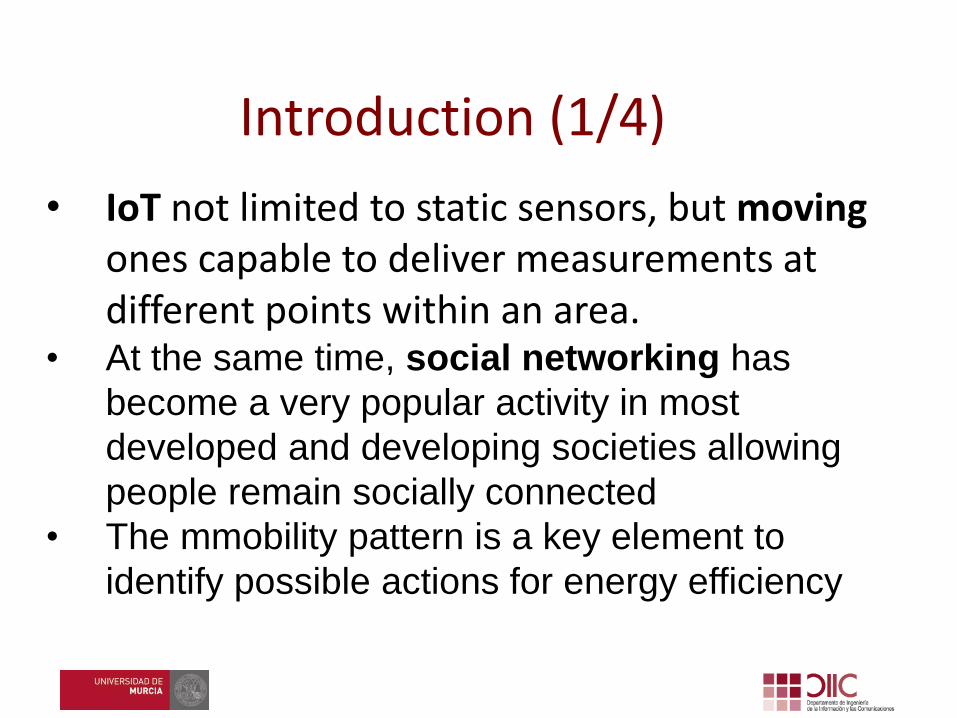
• IoT not limited to static sensors, but movingones capable to deliver measurements at different points within an area.
• At the same time, social networking has
become a very popular activity in most
developed and developing societies allowing
people remain socially connected
• The mmobility pattern is a key element to
identify possible actions for energy efficiency
Introduction (1/4)
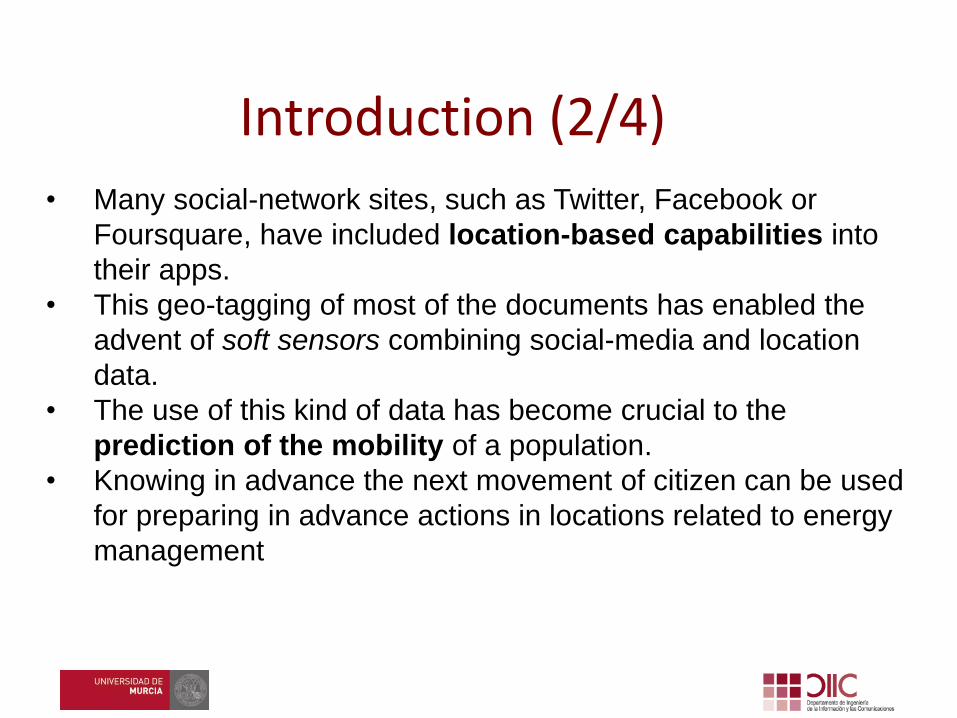
• Many social-network sites, such as Twitter, Facebook or
Foursquare, have included location-based capabilities into
their apps.
• This geo-tagging of most of the documents has enabled the
advent of soft sensors combining social-media and location
data.
• The use of this kind of data has become crucial to the
prediction of the mobility of a population.
• Knowing in advance the next movement of citizen can be used
for preparing in advance actions in locations related to energy
management
Introduction (2/4)
• Several solutions to give insight into these new social-media
data have been proposed, coming up with novel human-
mobility models and patterns. Nonetheless, previous studies
frequently suffer from some of the following drawbacks:
• They focus on extracting general mobility information
without distinguishing the time of the day in which the
information was generated (time slots)
• Most of the employed algorithms do not consider the fuzzy
and noisy nature of the kind of data generated by humans.
• Most works do not take into account the activity level of
the users within each detected region.
Introduction (3/4)
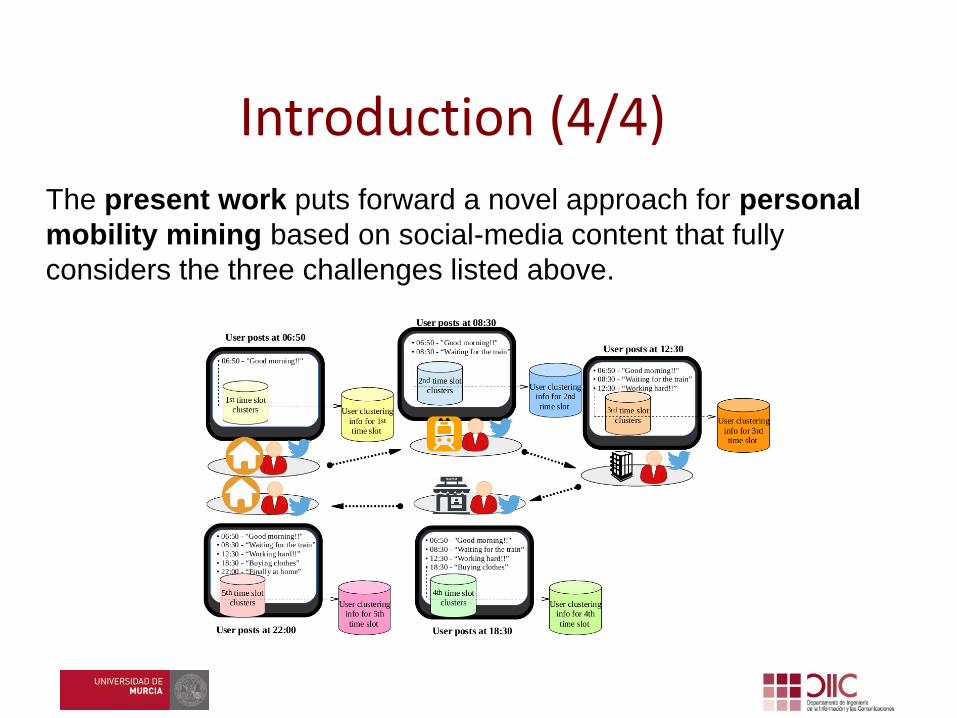
The present work puts forward a novel approach for personal
mobility mining based on social-media content that fully
considers the three challenges listed above.
Introduction (4/4)

Agenda
1)Introduction2)Proposed system3)Evaluation4)Conclusions
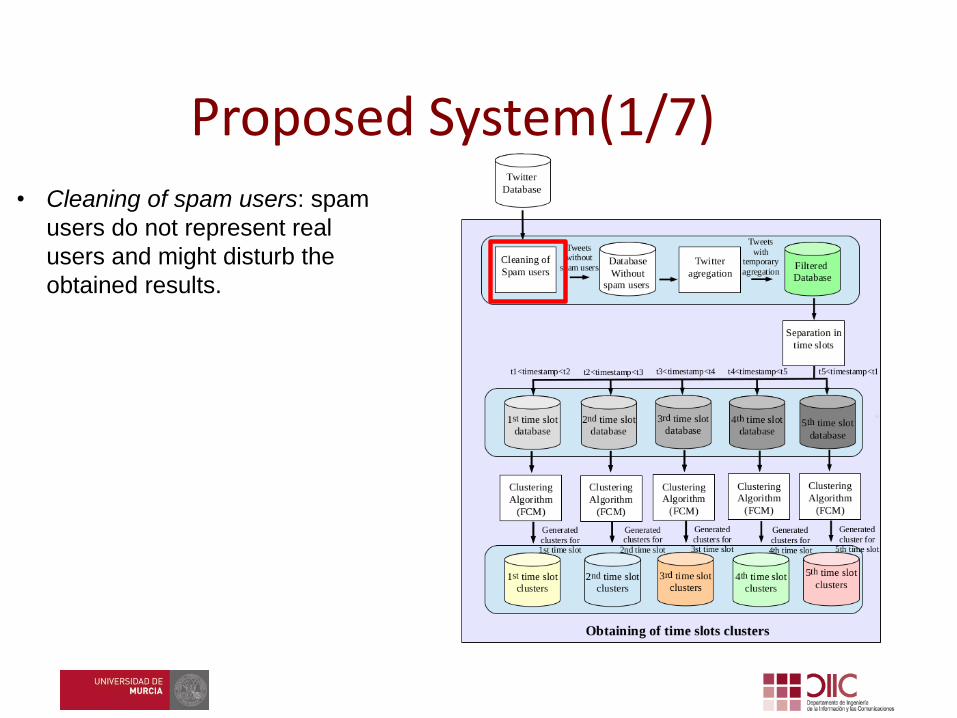
• Cleaning of spam users: spam
users do not represent real
users and might disturb the
obtained results.
Proposed System(1/7)
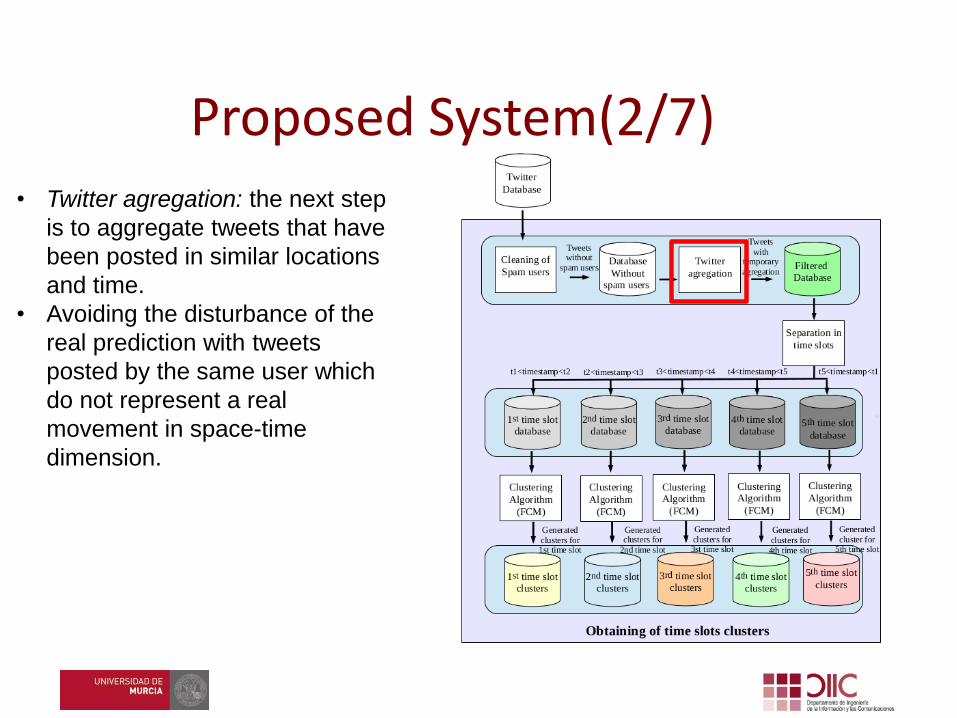
• Twitter agregation: the next step
is to aggregate tweets that have
been posted in similar locations
and time.
• Avoiding the disturbance of the
real prediction with tweets
posted by the same user which
do not represent a real
movement in space-time
dimension.
Proposed System(2/7)
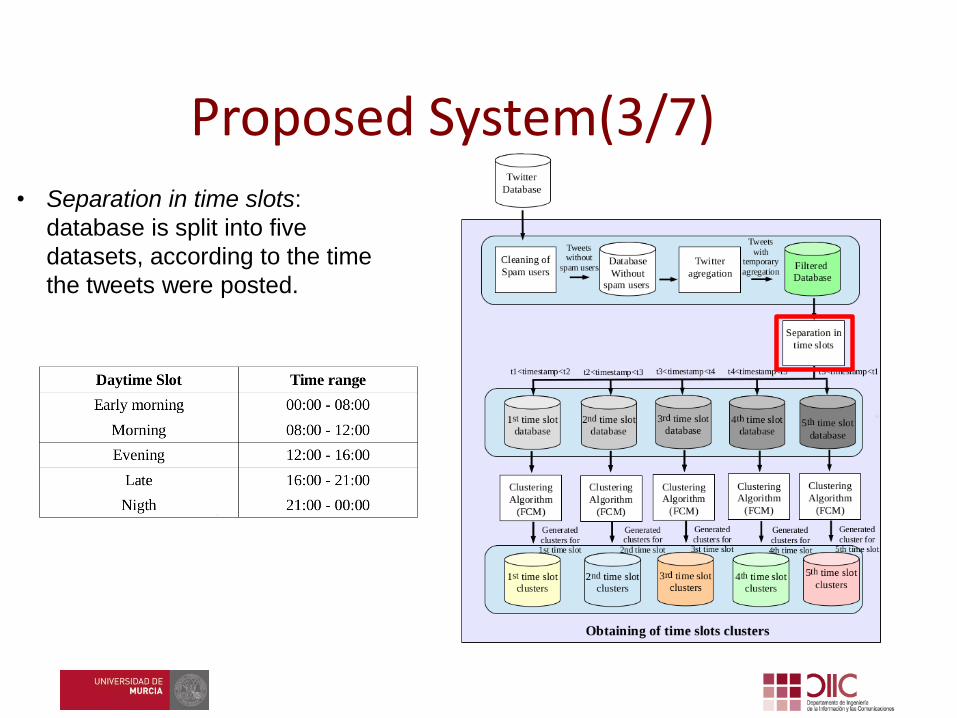
• Separation in time slots:
database is split into five
datasets, according to the time
the tweets were posted.
Proposed System(3/7)
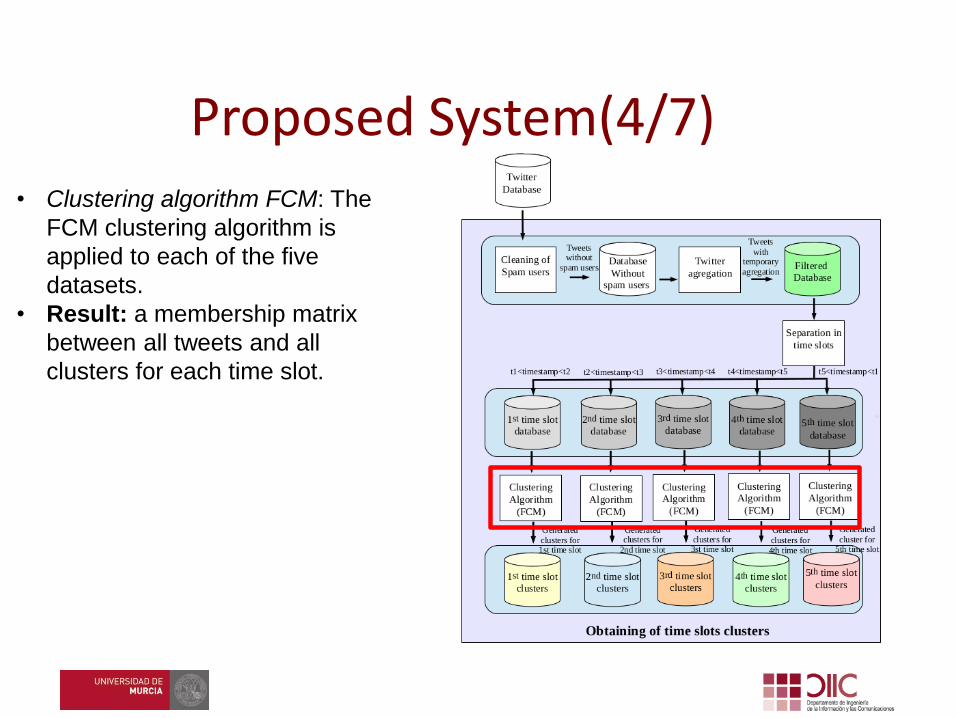
• Clustering algorithm FCM: The
FCM clustering algorithm is
applied to each of the five
datasets.
• Result: a membership matrix
between all tweets and all
clusters for each time slot.
Proposed System(4/7)
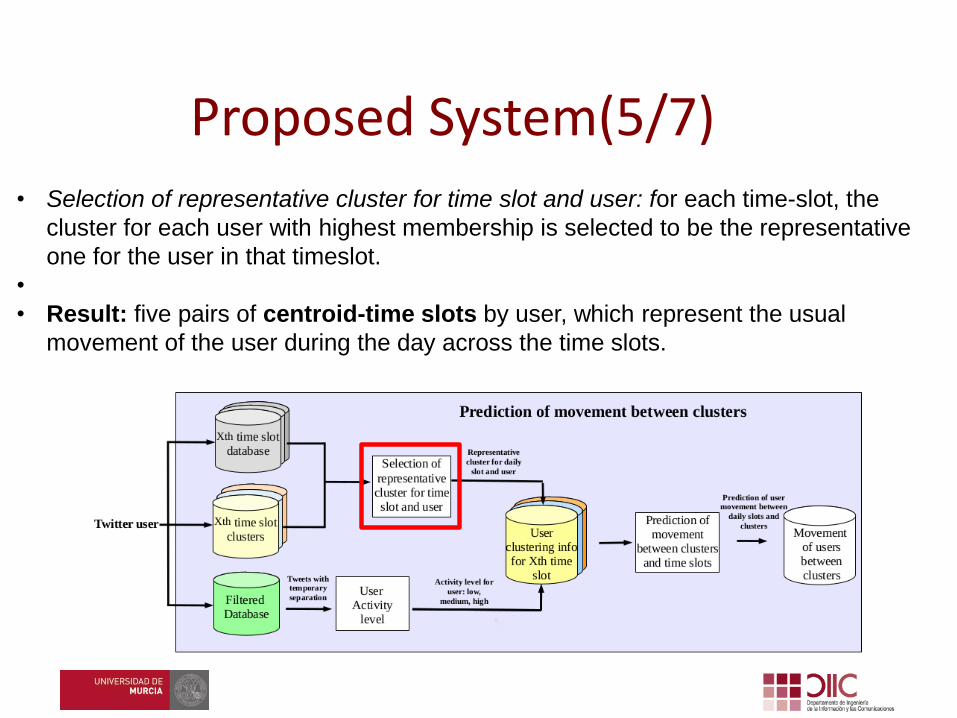
• Selection of representative cluster for time slot and user: for each time-slot, the
cluster for each user with highest membership is selected to be the representative
one for the user in that timeslot.
•
• Result: five pairs of centroid-time slots by user, which represent the usual
movement of the user during the day across the time slots.
Proposed System(5/7)
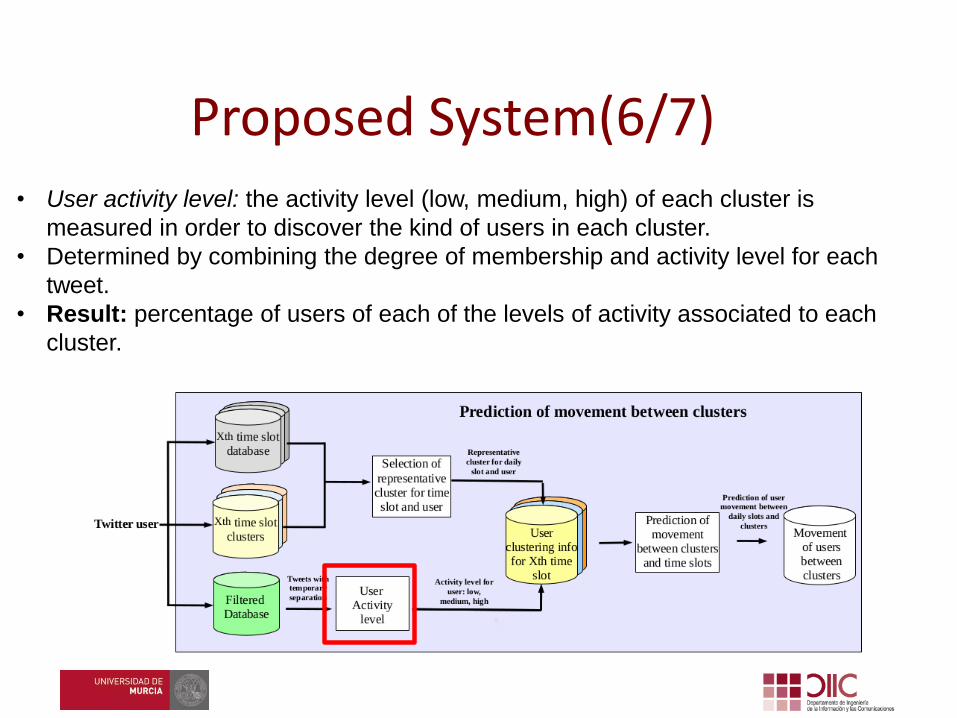
• User activity level: the activity level (low, medium, high) of each cluster is
measured in order to discover the kind of users in each cluster.
• Determined by combining the degree of membership and activity level for each
tweet.
• Result: percentage of users of each of the levels of activity associated to each
cluster.
Proposed System(6/7)
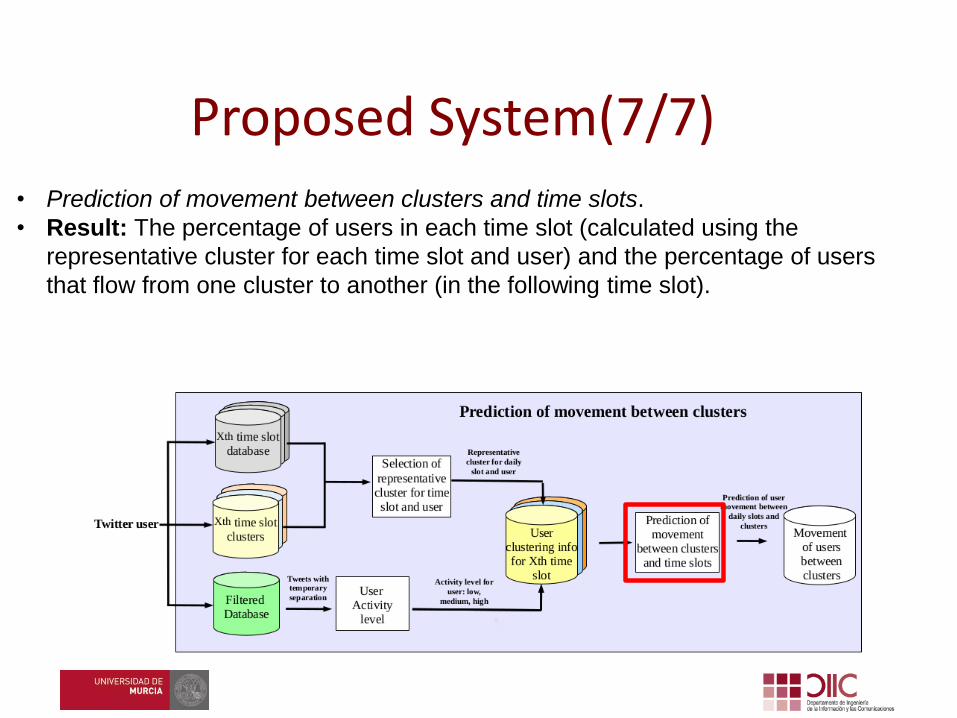
• Prediction of movement between clusters and time slots.
• Result: The percentage of users in each time slot (calculated using the
representative cluster for each time slot and user) and the percentage of users
that flow from one cluster to another (in the following time slot).
Proposed System(7/7)

Agenda
1)Introduction2)Proposed system3)Evaluation4)Conclusions
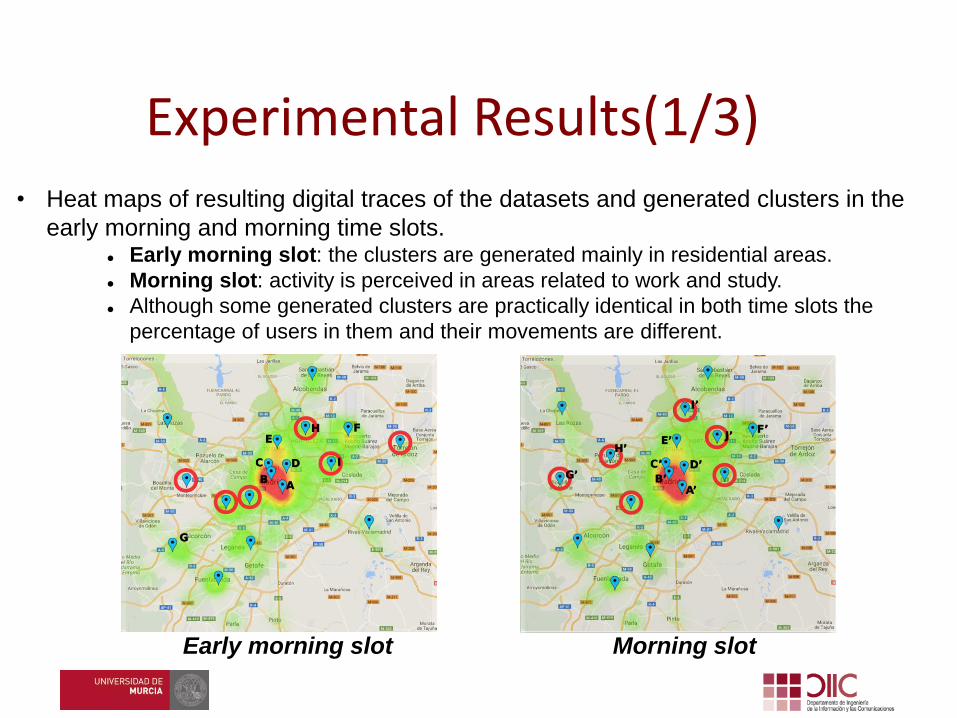
Experimental Results(1/3)• Heat maps of resulting digital traces of the datasets and generated clusters in the
early morning and morning time slots. Early morning slot: the clusters are generated mainly in residential areas.
Morning slot: activity is perceived in areas related to work and study.
Although some generated clusters are practically identical in both time slots the
percentage of users in them and their movements are different.
Early morning slot Morning slot
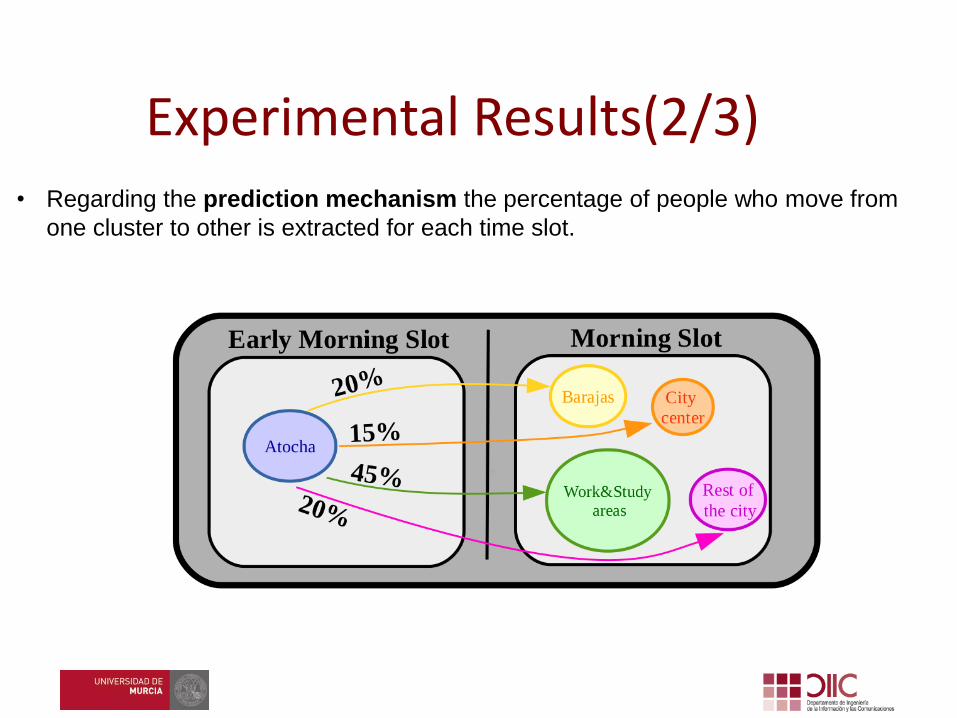
Experimental Results(2/3)• Regarding the prediction mechanism the percentage of people who move from
one cluster to other is extracted for each time slot.
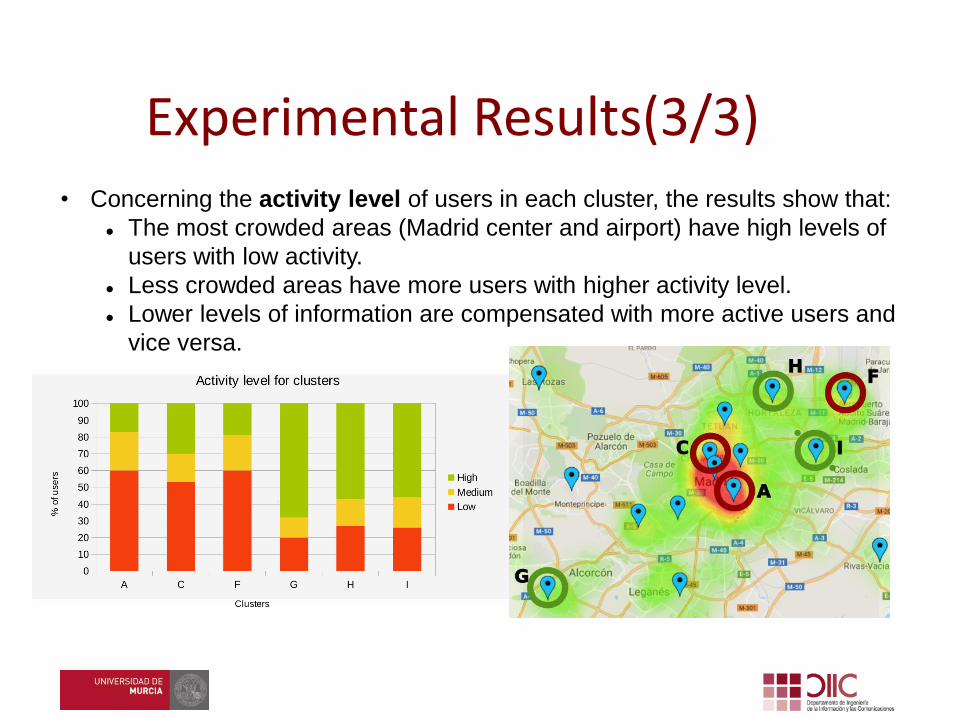
Experimental Results(3/3)• Concerning the activity level of users in each cluster, the results show that:
The most crowded areas (Madrid center and airport) have high levels of
users with low activity.
Less crowded areas have more users with higher activity level.
Lower levels of information are compensated with more active users and
vice versa.

Agenda
1)Introduction2)Proposed system3)Evaluation4)Conclusions
• At the dawn of the IoT era, the advent of soft sensors provides a huge
amount of novel semantically-rich location data.
• The prediction of movement that can be obtained with such a data allows
urban areas to adapt its transport and energy efforts to the real needs of
its population. In turn, this will aid the development of economically, socially
and environmentally sustainable means of transport.
• The present work has taken full advantage of new forms of data through the
fuzzy c-means algorithm, in order to understand the movement of cities.
• Future work will be twofold.
We will fuzzyfy certain crisp parameters of the proposal like the time
slots and the users’ activity level
We will work on the enrichment of the obtained results with the use of
semantic and textual information included in social-media documents.
Conclusion