Embed Size (px)
Citation preview

Zhang et al. BMC Infectious Diseases (2020) 20:649 https://doi.org/10.1186/s12879-020-05369-w
RESEARCH ARTICLE Open Access
Modeling the relative role of human
mobility, land-use and climate factors ondengue outbreak emergence in Sri Lanka Ying Zhang1,2, Jefferson Riera3, Kayla Ostrow1, Sauleh Siddiqui4, Harendra de Silva5, Sahotra Sarkar6,Lakkumar Fernando7 and Lauren Gardner1*Abstract
Background: More than 80,000 dengue cases including 215 deaths were reported nationally in less than 7 monthsbetween 2016 and 2017, a fourfold increase in the number of reported cases compared to the average numberover 2010–2016. The region of Negombo, located in the Western province, experienced the greatest number ofdengue cases in the country and is the focus area of our study, where we aim to capture the spatial-temporaldynamics of dengue transmission.
Methods: We present a statistical modeling framework to evaluate the spatial-temporal dynamics of the 2016–2017dengue outbreak in the Negombo region of Sri Lanka as a function of human mobility, land-use, and climatepatterns. The analysis was conducted at a 1 km × 1 km spatial resolution and a weekly temporal resolution.
Results: Our results indicate human mobility to be a stronger indicator for local outbreak clusters than land-use orclimate variables. The minimum daily temperature was identified as the most influential climate variable on denguecases in the region; while among the set of land-use patterns considered, urban areas were found to be mostprone to dengue outbreak, followed by areas with stagnant water and then coastal areas. The results are shown tobe robust across spatial resolutions.
Conclusions: Our study highlights the potential value of using travel data to target vector control within a region.In addition to illustrating the relative relationship between various potential risk factors for dengue outbreaks, theresults of our study can be used to inform where and when new cases of dengue are likely to occur within aregion, and thus help more effectively and innovatively, plan for disease surveillance and vector control.
Keywords: Dengue, Outbreaks, Risk factors, Human mobility, Climate, Land-use, Spatial-temporal dynamics,Statistical modeling, Sri Lanka
BackgroundDengue is a mosquito-borne viral disease that infects ap-proximately 390 million people globally every year, par-ticularly in tropical and subtropical countries [1, 2]. InSoutheast Asia, dengue has become the leading cause of
© The Author(s). 2020 Open Access This articwhich permits use, sharing, adaptation, distribappropriate credit to the original author(s) andchanges were made. The images or other thirlicence, unless indicated otherwise in a creditlicence and your intended use is not permittepermission directly from the copyright holderThe Creative Commons Public Domain Dedicadata made available in this article, unless othe
* Correspondence: [email protected] of Civil and Systems Engineering, Johns Hopkins University,Baltimore, MD 21218, USAFull list of author information is available at the end of the article
febrile illness for travelers [3]. The high number of infec-tions combined with the lack, as yet, of a routinely usedeffective vaccine has made dengue a notorious publichealth problem [2, 4].Dengue spreads through the bite of infected Ades mos-
quitoes, especially Aedes aegypti– the primary vector,with an estimated 15 to 17-day delay between the pri-mary and secondary human infections [5]. Dengue out-break control is a challenge for policy makers because
le is licensed under a Creative Commons Attribution 4.0 International License,ution and reproduction in any medium or format, as long as you givethe source, provide a link to the Creative Commons licence, and indicate if
d party material in this article are included in the article's Creative Commonsline to the material. If material is not included in the article's Creative Commonsd by statutory regulation or exceeds the permitted use, you will need to obtain. To view a copy of this licence, visit http://creativecommons.org/licenses/by/4.0/.tion waiver (http://creativecommons.org/publicdomain/zero/1.0/) applies to therwise stated in a credit line to the data.

Zhang et al. BMC Infectious Diseases (2020) 20:649 Page 2 of 14
Aedes aegypti mosquitoes are well adapted to high dens-ity urban environments and actively feed during the day[6–8], thus presenting an elevated risk to humans. Urbansettings provide an ideal habitat for Aedes aegypti breed-ing due to an abundance of discarded trash bags, plasticbottles, tires, and other containers that enable the for-mation of stagnant shallow water surfaces after precipi-tation [9]. Urban regions in developing countries areparticularly vulnerable due to a lack of indoor plumbinginfrastructure that, in conjunction with a lack of air-conditioning, results in higher human-mosquito expos-ure rates during the day. Additionally, because of thedaytime feeding behaviors of Aedes aegypti, commonvector control measures that work for night-biting mos-quitoes, such as bed nets, fail to effectively control den-gue transmission. Given these challenges, there is a needto better understand and predict dengue outbreaks andtransmission risk within urban regions in developingcountries so that vector control and surveillance re-sources can be optimally allocated.The majority of dengue risk maps that identify dengue
hotspots are static. Although they help reveal overall po-tential high-risk areas, challenges remain in their limitedability to provide temporally evolved risk maps and tosupport dengue early warning systems [10]. Therefore,explorations of both spatially and temporally varying fac-tors in dengue risk dynamics are needed. Previous stud-ies highlighted human mobility as a critical factor fordengue transmission [11–17], which contrasts the moreminor role travel plays in the spread of vector-borne dis-eases transmitted by night-biting mosquitoes [17]. WhileAedes aegypti mosquitoes have a hard time dispersinggeographically across large areas because they rarelytravel more than 400 m from where they emerge asadults [18–21], humans regularly travel much longer dis-tances on a daily basis. As new dengue cases and clustersare regularly reported kilometers apart, it is likely thathuman mobility play a critical role in the spread of den-gue outbreaks, i.e., infected humans introduce dengueinto new mosquito populations at their trip ends. As anexample, Vazquez-Prokopec, Montgomery [14] studiedthe pattern of dengue transmission using location-basedcontact tracing on infected dengue patients during adengue outbreak centered at Cairns, Australia. They col-lected locations that the patients frequently traveled toduring the daytime and 2–4 weeks prior to the onset ofsymptoms through phone interviews. The contact loca-tions with a proximity of 100 m and a separation of 20days were spatial-temporally linked into pairs and thenchains to identify the plausible sites of dengue virustransmission. They showed that the complex pattern ofdengue transmission was primarily driven by humanmobility, and that targeted residual spaying could poten-tially reduce the probability of dengue transmission up
to 96%. Their study highlights the importance of under-standing dengue transmission patterns to optimize theallocation of dengue prevention and vector-controlmeasures.In addition to human mobility, recent studies have
pointed to a strong association between climate condi-tions and dengue outbreaks at various locations andacross different temporal resolutions [9, 22–26]. Precipi-tation, mean temperature and temperature fluctuationwere revealed to affect the population dynamics of Aedesaegypti mosquitoes and the dengue virus extrinsic incu-bation period [27–31]. Specifically, a suitable averagetemperature and moderate temperature fluctuations areoften favorable for dengue transmission [27], while anincrease in precipitation is strongly associated with theonset of a dengue outbreak [24]. Humidity, a combinedeffect of precipitation and temperature, is also a com-mon climate index to evaluate the environmental cap-acity for dengue emergence [22, 23, 32, 33]. Wesolowski,Qureshi [15] accounted for both climate and mobility ina study of dengue virus transmission over a large dengueoutbreak period in Pakistan. They developed an epi-demiological model that included temperature and rela-tive humidity as input parameters for mosquitodynamics, as well as biting rate to capture the interac-tions between human and mosquito hosts. Human mo-bility was captured using mobile phone data of ~ 40million subscribers to estimate the spatially explicittravel volume, albeit not differentiating infected andnon-infected people. They showed that the emergence ofdengue epidemics in a new region could be predictedusing aggregated travel patterns from endemic areas incombination with the developed epidemiological model.While climatic factors were found to be significant forprediction, this was in part due to the large study region,i.e., country level, which has variable climatic suitabilityfor the mosquito vector. The study region considered inour work is much smaller and has minimal climacticvariability, thus alternative methods are required to dis-tinguish site-specific risk.Land-use patterns — indicators of human activities
and potential breeding habitats — have also been linkedto dengue outbreaks [34–39]. Previous studies investi-gated the effect of land-use patterns on the spread ofdengue and found that human settlements, water bodies,and mixed horticulture are the top three associatedland-use patterns for dengue emergence in Malaysia[37]. In another study [38], areas surrounded by ricepaddies and marshes/swamps were associated with a sig-nificantly higher population of dengue vectors duringthe rainy season in Thailand. Orchards (which oftencontain artificial water containers) and irrigation fieldshave also been shown to play an important role in den-gue infections; however, their role varies given different
Zhang et al. BMC Infectious Diseases (2020) 20:649 Page 3 of 14
local conditions. Sometimes, land-use type can be aproxy for other features, such as socio-economic factors,which may have a contradictory effect on dengue infec-tions [39].In this study, we present a statistical modeling frame-
work to evaluate the relative role of human travel pat-terns, climate conditions, and land-use patterns ondengue outbreak dynamics in Negombo, Sri Lanka(Fig. 1), where dengue outbreaks are increasing in scaleand prevalence. Dengue has been endemic in Sri Lankasince 1960s, and all four serotypes circulate in the region[41]. Dengue hemorrhagic fever (DHF) cases were rareuntil 1989, when the first major dengue outbreak oc-curred with approximately 200 cases and 20 deaths;DHF has since become endemic in the country [41–43].The 2017 outbreak involved many severe DHF cases,with evidence showing a dengue virus type 2 (DENV-2)
Fig. 1 Land-use groups and the climate station in the study region of Negdistrict level in Sri Lanka [40] during the months from October 2016 to Jun
being the causative serotype [44, 45]. DENV-2 had onlybe detected infrequently over the recent decades of den-gue epidemics and is therefore associated with low im-munity in the region [41]. As a result, more than 80,000dengue cases including 215 deaths were reported nation-ally in less than 7 months between 2016 and 2017, afourfold increase in the number of reported cases com-pared to the average number over 2010–2016 [46]. Theregion of Negombo, located in the Western province,experienced the greatest number of dengue cases in thecountry; approximately 45% of the cases nationwide byJuly 2017 (Fig. 1), and is the focus area of our study.We applied a mixed-effects model, where the mobility
data bridges the time-varying, spatially-invariant climatevariables and the rasterized spatially explicit, time-invariant population and land-use variables, to capturethe spatial-temporal dynamics of dengue transmission.
ombo, Sri Lanka (left), and the total number of dengue cases at thee 2017 that cover our study period (right)
Zhang et al. BMC Infectious Diseases (2020) 20:649 Page 4 of 14
Our model framework differs from previous studies thatsimulated the transmission process [14, 15, 47], and in-stead focuses on estimating the timing and location ofnew case introductions though a non-process based stat-istical model. Specifically, we focus on modeling thehome locations of (newly infected) dengue patients, andassume dengue risk is increased in areas by infected in-dividuals who travel to the area, providing the opportun-ity for vector transmission to result in new human cases.This assumption is consistent with previous studies thathave shown visits to a household by infected people de-termines the infection risk in that household [13]. Inaddition, the study was conducted at a fine-grainedspatial and temporal resolution — 1 km × 1 km spatiallyand 1 week temporally — providing an improved under-standing of the role of mobility in the spread of dengue.While previous work studied the impact of mobility [14,15], climate [9, 22, 24, 27], and land-use [37–39] separ-ately on dengue, the authors are unaware of any existingstudy that considers these factors within a single inte-grated framework. Thus, previous studies have been un-able to quantify the relative contribution of each factoron the spatial-temporal patterns of dengue transmissionas we do. The results from our study indicate that mo-bility is a more significant indicator of new dengue caseclusters compared with land-use and climate factors.Furthermore, the case study in Sri Lanka provides
Table 1 Summary of potential explanatory variables
Variables Description
f il occupation fraction of land-use group l in cel
BuiltUp urban area
Coconut coconut cultivation land
Homesteads homesteads and garden
Paddy rice cultivation land
Sea ocean
StWtr standing water
FlwWtr flowing water
ct;dc weekly value of climate variable in week t wit
Tavg weekly averaged daily mean temperature
Tmax weekly averaged maximum daily temperature
Tmin weekly averaged minimum daily temperature
DTR weekly averaged diurnal temperature range
Pre weekly total precipitation
RD weekly number of raining days
RH weekly averaged daily relative humidity
Pi population in cell i
V it − u number of trips made to cell i in week t-u
Nit − w number of patients admitted to hospital who
Note: t, u, and w in weeks, dc in days. For notation, variable superscripts in Table 1 d
critical insights into effective application of dengue pre-vention and vector control measures in developingregions.
MethodsA statistical model is applied to investigate the spatial-temporal dynamics of dengue outbreak with respect to arange of potential explanatory variables. The completeset of potential explanatory variables is listed in Table 1.Detailed descriptions of the data followed by a descrip-tion of the methodology are provided below.
Case and mobility dataA patient travel survey was conducted among denguepatients in the Negombo region of Sri Lanka over an ap-proximately 8-month period during a major outbreakspanning from end of October 2016 to early July 2017.Geolocation data were collected from all patients admit-ted to the special High Dependency Unit (HDU) for crit-ically ill dengue patients within the Clinical Centre forManaging Dengue and Dengue Haemorrhagic Fever(CCMDDHF) at the Negombo Hospital in Negombo, SriLanka. Specifically, the date of admission, home address,the complete set of locations visited, and correspondingtrips made between all locations during the 10-daysprior to hospital admission were collected from all HDUCCMDDHF admitted patients for the entire study
Properties
l i (%) spatially-explicit, time-invariant
h a lag of dc time-varying, spatially -invariant
spatially -explicit, time-invariant
spatially -explicit, time-varying
live in cell i in week t-w spatially -explicit, time-varying
enote spatial indices and subscripts denote time indices
Zhang et al. BMC Infectious Diseases (2020) 20:649 Page 5 of 14
period. Other personal information such as the age ofthe patients is not available to us, but the survey doesnot exclude any age groups specifically. The case dataprovide spatial-temporal information on the outbreakpatterns, while the mobility data collected captures dailytravel activity of the admitted dengue patients. The datawere collected by trained students and supervised by aSenior House Officer on site. For weekday admissionsthe patients were surveyed upon admittance, for nightadmissions data were collected the following day, andfor weekend admissions on the following Monday. Themajority of admissions were 48 to 72 h following the on-set of fever. Dengue infection was confirmed for the pa-tient set using either NS1 antigen or IgM antibodydiagnostic test.
Climate dataWe used the Global Surface Summary of the Day(GSOD) daily weather data [48] from a station in Ne-gombo (Fig. 1) to explore the impact of climate factorson the dengue outbreak. The location of the weather sta-tion (7.18°N, 79.87°E) is approximately in the center ofthe study region and it is the only station that falls intoour study region with a comprehensive set of climatedata available during the study period. There are severalglobal reanalysis products that provide spatial-explicitclimate data during the study period; however, uponevaluation against the station observations, these globallygridded data sets did not provide accurate representa-tions of the local climate variables, particularly at a dailytime-step (Figure S1). Hence, the weather data are as-sumed to be representative for the region which hasrelatively homogeneous weather patterns [49]. We se-lected a range of potential climate variables based onprevious studies [9, 22–24, 27–33], including daily meantemperature (Tavg), daily maximum temperature(Tmax), daily minimum temperature (Tmin), diurnaltemperature range (DTR), precipitation (Pre), the num-ber of raining days (RD), and relative humidity (RH) toanalyze climatic influence for the weeks before and dur-ing the same period of analysis that the mobility datawas collected.
Population and land-use dataWe used a global population data layer based onLandscan 2016 [50], that is available at an approxi-mately 1 km × 1 km resolution to represent the popu-lation distribution spatially. We aggregated the datato 5 km × 5 km grid for additional analysis with acoarser spatial resolution. Land-use data [51] wereobtained from the Sri Lanka Survey Departmentwhich performed an initial survey in 2000 and hassince continuously updated the maps. The map wasextracted for our region of interest and reclassified
into several groups (Fig. 1): Sea, Standing Water(StWtr), Flowing Water (FlwWtr), Coconut, Marsh,Paddy, Built-up (BuiltUp), Scrubland, Homesteads,Forest, Rubber, Rock/Sand (RockS), Other Agriculture(OthAg), and Other. Water bodies were categorizeddepending on the potential effect on dengue transmis-sion dynamics. Additional details on land-use classifi-cation groupings and processing is available in thesupplementary material.
Data processing and statistical modelWe divided the study region (Fig. 1) into a grid at a 1km × 1 km resolution and aggregated daily data into a 1-weekly resolution. The number of patients who were ad-mitted to the hospital during each week of the recordedtime period was used to generate the weekly number ofnewly admitted dengue patients in each cell based ontheir home locations. This becomes our ‘case’ variable.To incorporate the role of mobility into the model we
used the travel itineraries provided by the patients togenerate a time-dependent connectivity matrix, whichrepresented the total number of trips made by dengueinfected patients between each pair of cells for eachweek of the study period. The travel data included all or-igins and destinations visited each day during the 10 dayspreceding hospital admittance (the time interval that thepatient is assumed to be able to spread the disease) foreach patient. The number of daily trips between eachpair of cells was summed over all patients, to provide bi-directional daily trip volumes between cells, and then ag-gregated to the weekly level. For each cell the totalincoming weekly trips was summed to define our ‘trip’variable as the trips were made by surveyed dengue pa-tients who are assumed to be infectious. Similarly, theoutgoing trips of this cell would also be counted at theirrespective trip destinations. Critically, we exclude alltrips with a destination of ‘home’ when computing ourtrip variable, in order to remove the inherent depend-ence between the ‘case’ variable, i.e., the home locationof infected individuals, and the ‘trip’ variable (explana-tory variable). Thus, the total number of trips (excludingtrips home) made by infected dengue patients entering agiven cell i in a given week t, V i
t , was used as a spatial-temporal explanatory variable in the model. The samemethod was used for the 5 km × 5 km analysis.Climate variables were averaged or aggregated tempor-
ally to a weekly resolution, including weekly averageTavg, Tmin, Tmax, DTR, RH, weekly total Pre, and RD.Land-use data were aggregated spatially to match thetargeted spatial grid resolution. The population datawere in an original resolution that matched the 1 km × 1km grid. For land-use, the percentage of occupied landof each type was determined for each 1 km × 1 km grid

Zhang et al. BMC Infectious Diseases (2020) 20:649 Page 6 of 14
cell. Both were subsequently aggregated to a 5 km × 5km grid.A linear mixed-effects model combined with backward
elimination of insignificant fixed effects (p-value > 0.05,two-tail test) was applied to investigate the spatial-temporal dynamics of dengue outbreak with the poten-tial explanatory variables at a weekly time step and 1km × 1 km spatial resolution. In building the model wefirst conducted sensitivity analysis to identify the optimalset of climatic variables to include in the model, and cor-responding time lag for each of them.Along with the chosen climate variable, the remaining
set of potential explanatory variables (Table 1) was nor-malized and then taken into the mixed-effects model ini-tially, with population included in the spatial randomeffects. Population density was incorporated using ran-dom effects in the model because population is likely tohave spatially heterogeneous effects on dengue outbreaks[47, 52]. For example, high population areas may implyaccess to tap water and better living conditions whichcould restrict dengue transmission [53], while the higherdensity of population facilitates disease spread. Further-more, there could be spatial variance in the distributionof people living in a particular area. In addition to mo-bility, climate, and land-use variables; the number ofnew cases in a given cell in the weeks prior were addedas explanatory variables to account for autocorrelationsin the case data. Subsequently, the variable with themost insignificant fixed-effects coefficient was eliminatedeach iteration, until only variables with significant coeffi-cients (at 95% significance level) remained in the model.A range of lead time for V i
t prior to the admitted weekwas also tested. A separate analogous process was con-ducted using a 5 km × 5 km resolution, to test the sensi-tivity of model results across spatial resolutions, and therobustness of the modeling framework and findings.Thus, the mathematical representation of the model is
given by:
Nti ¼
X
l∈L
αl f li þ
X
c∈C
βcct;dc þX
u
γuVit − u
þX
w
δwNit − w þ ai þ biPi þ εit
Where.i is the cell index; i = 1, 2, … .l is the land-use variable, which belongs to the land-
use group set L, where L includes Sea, StWtr, FlwWtr,Coconut, Marsh, Paddy, BuiltUp, Scrubland, Home-steads, Forest, Rubber, RockS, OthAg, and Other.f il is the occupation fraction of land-use group l in cell
i, time-invariant.Pi is the population in cell i, time-invariant.t is the time index at weekly resolution; t = 1, 2, … .
Nit is the number of patients who are admitted to the
hospital during week t, whose home locations are in celli.Ni
t − w is the number of patients who are admitted tothe hospital during week t-w, whose home locations arein cell i, where w is measured in weeks; w = 1, 2, …V i
t − u is the number of total number of trips made intocell i during the week t-u, where u is measured in weeks;u = 1, 2, …c is the climate variable which belongs to the climate
variable set C . C includes Tavg, Tmax, Tmin, DTR, Pre,RD, and RH.ct;dc is the climate variable during the week that be-
gins dc days prior to the start of week t. dc ranges from 7to 17 days and can be different for different climate vari-ables (Figure S2). Multiple climate variables can be in-cluded in the model.εit is the model residual associated with cell i and week
t.αl is the estimated fixed-effects coefficient for l.βc is the estimated fixed-effects coefficient for c.γu is the estimated fixed-effects coefficient for V i
t − u.δw is the estimated fixed-effects coefficient for Ni
t − w.ai is the intercept associated with cell i.bi is the estimated spatial random-effects coefficient
for Pi.The data processing and modeling were performed
using MATLAB R2017a.
Sensitivity analysisWe performed sensitivity analysis to evaluate the robust-ness of our model results. Firstly, a Jackknife analysis wasconducted, specifically the statistical model was fit to allbut 1 week of data, iteratively excluding 1 week at a time,over the entire time period modeled. The variability in es-timated parameters and their corresponding significanceare presented in Supplementary Table S1. Second, weevaluated the sensitivity of the model to fluctuations ofthe ‘trip’ variable. The motivation behind this sensitivityanalysis was the uncertainty resulting from potential hu-man error in the ‘trip’ variable, which is based on the pa-tients’ recollection of their travel in the 10-day prior tohospital admittance. To assess the robustness of the modelto error in the trip variable, we implemented Monte Carlosampling, assuming an error of 10% uniformly distributedaround the original observations V i
t . We performed 1000random simulations, and the results are presented in Sup-plementary Table S2.
ResultsData analysisThe number of admitted dengue patients aggregatedover the study region peaks during December and June
Zhang et al. BMC Infectious Diseases (2020) 20:649 Page 7 of 14
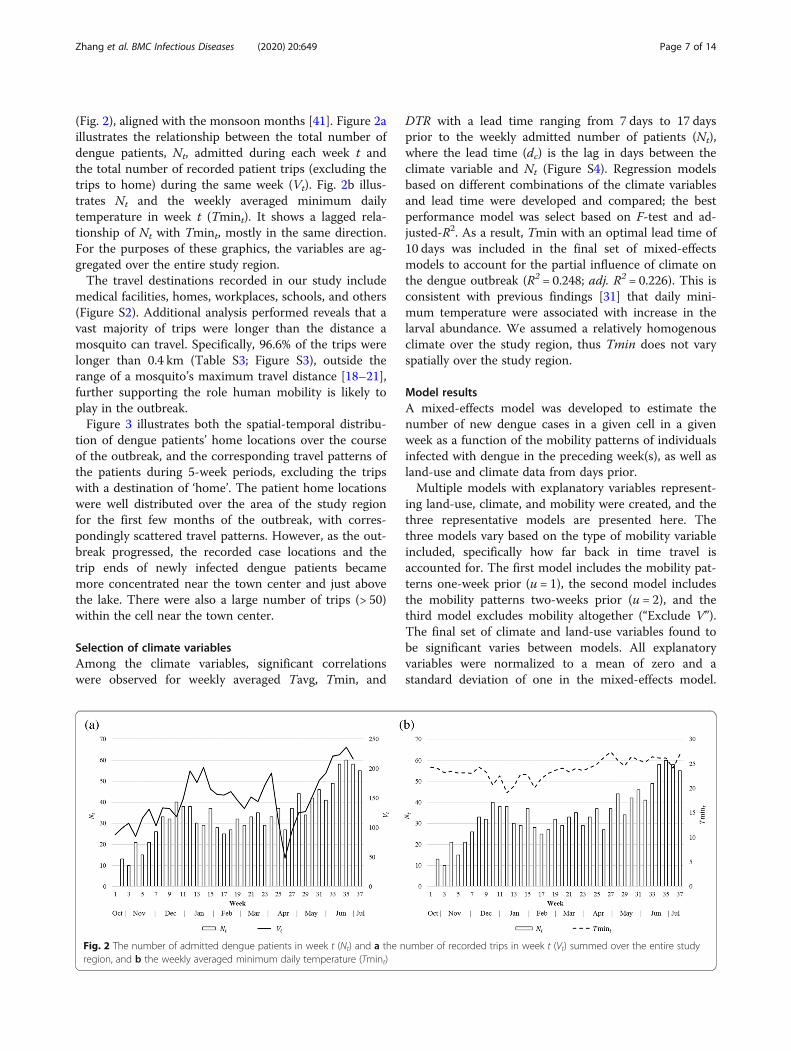
(Fig. 2), aligned with the monsoon months [41]. Figure 2aillustrates the relationship between the total number ofdengue patients, Nt, admitted during each week t andthe total number of recorded patient trips (excluding thetrips to home) during the same week (Vt). Fig. 2b illus-trates Nt and the weekly averaged minimum dailytemperature in week t (Tmint). It shows a lagged rela-tionship of Nt with Tmint, mostly in the same direction.For the purposes of these graphics, the variables are ag-gregated over the entire study region.The travel destinations recorded in our study include
medical facilities, homes, workplaces, schools, and others(Figure S2). Additional analysis performed reveals that avast majority of trips were longer than the distance amosquito can travel. Specifically, 96.6% of the trips werelonger than 0.4 km (Table S3; Figure S3), outside therange of a mosquito’s maximum travel distance [18–21],further supporting the role human mobility is likely toplay in the outbreak.Figure 3 illustrates both the spatial-temporal distribu-
tion of dengue patients’ home locations over the courseof the outbreak, and the corresponding travel patterns ofthe patients during 5-week periods, excluding the tripswith a destination of ‘home’. The patient home locationswere well distributed over the area of the study regionfor the first few months of the outbreak, with corres-pondingly scattered travel patterns. However, as the out-break progressed, the recorded case locations and thetrip ends of newly infected dengue patients becamemore concentrated near the town center and just abovethe lake. There were also a large number of trips (> 50)within the cell near the town center.
Selection of climate variablesAmong the climate variables, significant correlationswere observed for weekly averaged Tavg, Tmin, and
Fig. 2 The number of admitted dengue patients in week t (Nt) and a the nregion, and b the weekly averaged minimum daily temperature (Tmint)
DTR with a lead time ranging from 7 days to 17 daysprior to the weekly admitted number of patients (Nt),where the lead time (dc) is the lag in days between theclimate variable and Nt (Figure S4). Regression modelsbased on different combinations of the climate variablesand lead time were developed and compared; the bestperformance model was select based on F-test and ad-justed-R2. As a result, Tmin with an optimal lead time of10 days was included in the final set of mixed-effectsmodels to account for the partial influence of climate onthe dengue outbreak (R2 = 0.248; adj. R2 = 0.226). This isconsistent with previous findings [31] that daily mini-mum temperature were associated with increase in thelarval abundance. We assumed a relatively homogenousclimate over the study region, thus Tmin does not varyspatially over the study region.
Model resultsA mixed-effects model was developed to estimate thenumber of new dengue cases in a given cell in a givenweek as a function of the mobility patterns of individualsinfected with dengue in the preceding week(s), as well asland-use and climate data from days prior.Multiple models with explanatory variables represent-
ing land-use, climate, and mobility were created, and thethree representative models are presented here. Thethree models vary based on the type of mobility variableincluded, specifically how far back in time travel isaccounted for. The first model includes the mobility pat-terns one-week prior (u = 1), the second model includesthe mobility patterns two-weeks prior (u = 2), and thethird model excludes mobility altogether (“Exclude V”).The final set of climate and land-use variables found tobe significant varies between models. All explanatoryvariables were normalized to a mean of zero and astandard deviation of one in the mixed-effects model.
umber of recorded trips in week t (Vt) summed over the entire study

Fig. 3 (See legend on next page.)
Zhang et al. BMC Infectious Diseases (2020) 20:649 Page 8 of 14
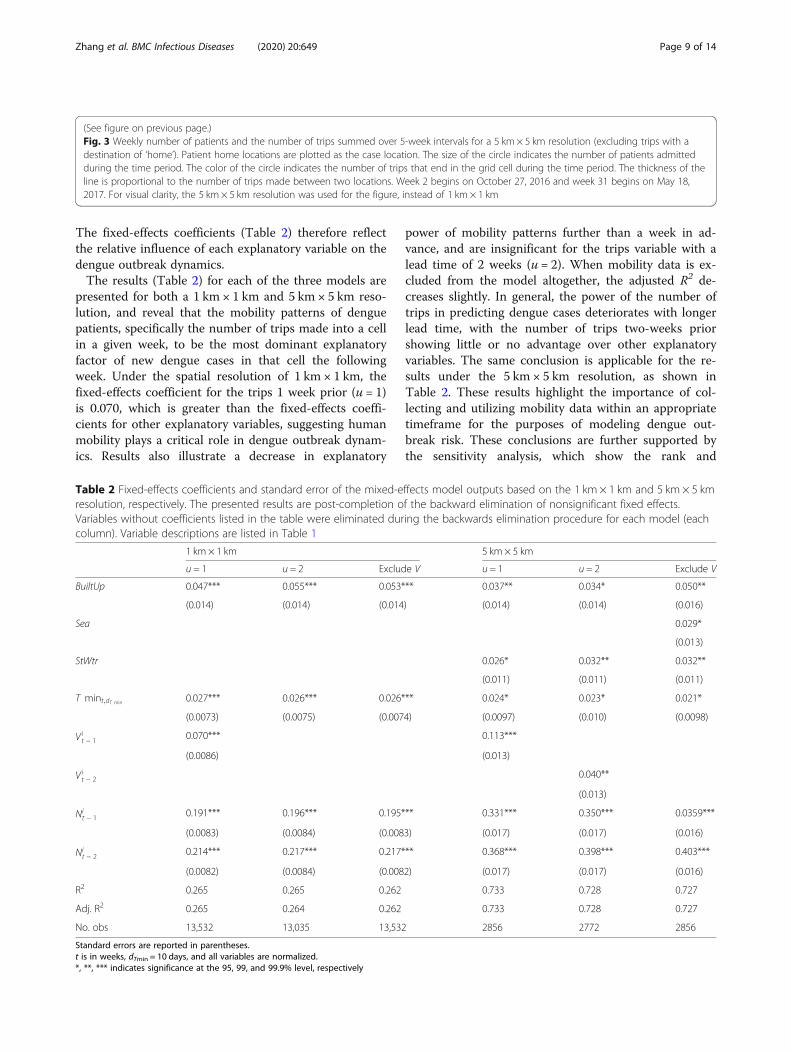
(See figure on previous page.)Fig. 3 Weekly number of patients and the number of trips summed over 5-week intervals for a 5 km × 5 km resolution (excluding trips with adestination of ‘home’). Patient home locations are plotted as the case location. The size of the circle indicates the number of patients admittedduring the time period. The color of the circle indicates the number of trips that end in the grid cell during the time period. The thickness of theline is proportional to the number of trips made between two locations. Week 2 begins on October 27, 2016 and week 31 begins on May 18,2017. For visual clarity, the 5 km × 5 km resolution was used for the figure, instead of 1 km × 1 km
Zhang et al. BMC Infectious Diseases (2020) 20:649 Page 9 of 14
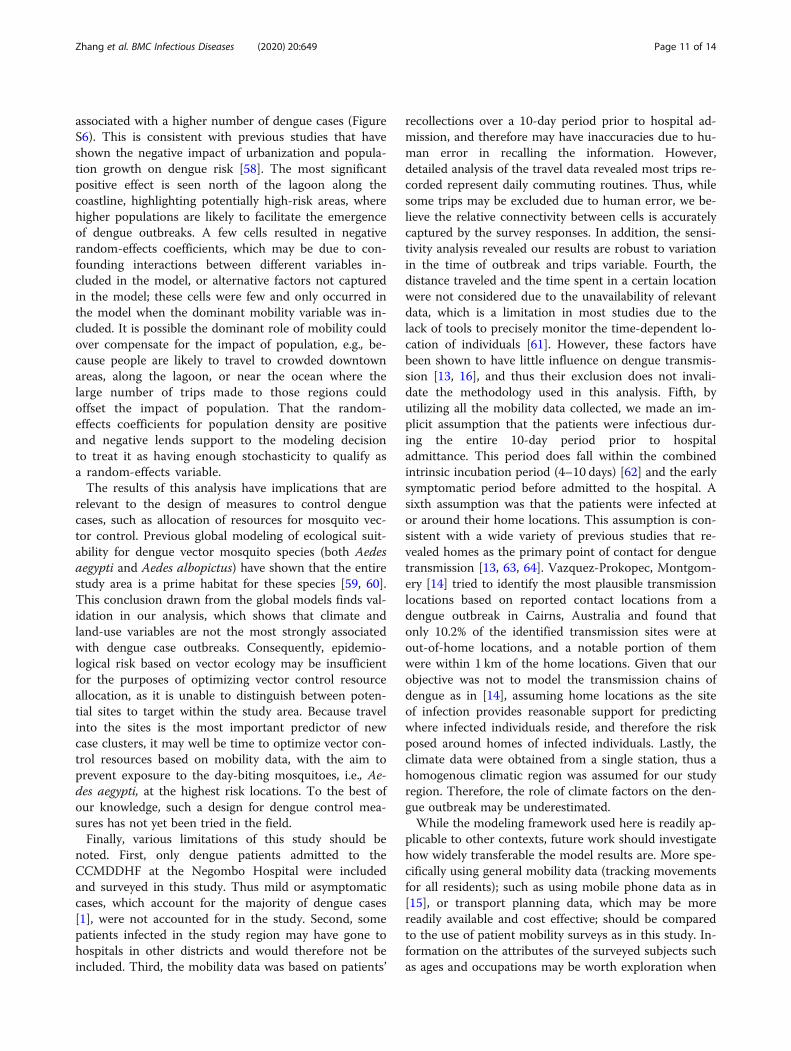
The fixed-effects coefficients (Table 2) therefore reflectthe relative influence of each explanatory variable on thedengue outbreak dynamics.The results (Table 2) for each of the three models are
presented for both a 1 km × 1 km and 5 km × 5 km reso-lution, and reveal that the mobility patterns of denguepatients, specifically the number of trips made into a cellin a given week, to be the most dominant explanatoryfactor of new dengue cases in that cell the followingweek. Under the spatial resolution of 1 km × 1 km, thefixed-effects coefficient for the trips 1 week prior (u = 1)is 0.070, which is greater than the fixed-effects coeffi-cients for other explanatory variables, suggesting humanmobility plays a critical role in dengue outbreak dynam-ics. Results also illustrate a decrease in explanatory
Table 2 Fixed-effects coefficients and standard error of the mixed-eresolution, respectively. The presented results are post-completion oVariables without coefficients listed in the table were eliminated durcolumn). Variable descriptions are listed in Table 1
1 km × 1 km
u = 1 u = 2 Exclud
BuiltUp 0.047*** 0.055*** 0.053*
(0.014) (0.014) (0.014
Sea
StWtr
T mint;dT min 0.027*** 0.026*** 0.026*
(0.0073) (0.0075) (0.007
Vit − 1 0.070***
(0.0086)
Vit − 2
Nit − 1 0.191*** 0.196*** 0.195*
(0.0083) (0.0084) (0.008
Nit − 2 0.214*** 0.217*** 0.217*
(0.0082) (0.0084) (0.008
R2 0.265 0.265 0.262
Adj. R2 0.265 0.264 0.262
No. obs 13,532 13,035 13,532
Standard errors are reported in parentheses.t is in weeks, dTmin = 10 days, and all variables are normalized.*, **, *** indicates significance at the 95, 99, and 99.9% level, respectively
power of mobility patterns further than a week in ad-vance, and are insignificant for the trips variable with alead time of 2 weeks (u = 2). When mobility data is ex-cluded from the model altogether, the adjusted R2 de-creases slightly. In general, the power of the number oftrips in predicting dengue cases deteriorates with longerlead time, with the number of trips two-weeks priorshowing little or no advantage over other explanatoryvariables. The same conclusion is applicable for the re-sults under the 5 km × 5 km resolution, as shown inTable 2. These results highlight the importance of col-lecting and utilizing mobility data within an appropriatetimeframe for the purposes of modeling dengue out-break risk. These conclusions are further supported bythe sensitivity analysis, which show the rank and
ffects model outputs based on the 1 km × 1 km and 5 km × 5 kmf the backward elimination of nonsignificant fixed effects.ing the backwards elimination procedure for each model (each
5 km × 5 km
e V u = 1 u = 2 Exclude V
** 0.037** 0.034* 0.050**
) (0.014) (0.014) (0.016)
0.029*
(0.013)
0.026* 0.032** 0.032**
(0.011) (0.011) (0.011)
** 0.024* 0.023* 0.021*
4) (0.0097) (0.010) (0.0098)
0.113***
(0.013)
0.040**
(0.013)
** 0.331*** 0.350*** 0.0359***
3) (0.017) (0.017) (0.016)
** 0.368*** 0.398*** 0.403***
2) (0.017) (0.017) (0.016)
0.733 0.728 0.727
0.733 0.728 0.727
2856 2772 2856
Zhang et al. BMC Infectious Diseases (2020) 20:649 Page 10 of 14
magnitude of the estimated model parameters (andsignificance) are robust to changes in both the out-break period and also variability in the trips variable(Figure S5).Among the seven land-use groups (see variable de-
scriptions in Table 1) under the 1 km × 1 km resolution,only BuiltUp shows significant positive fixed effects ondengue cases (Table 2). Under the coarser spatialrasterization of 5 km × 5 km, StWtr and Sea also showsignificant positive fixed effects, in addition to BuiltUp.Whereas BuiltUp and StWtr show significant fixed ef-fects in all three models with the coefficients rangingfrom 0.034 to 0.050 for BuiltUp and 0.026 to 0.032 forStWtr, Sea shows the significant coefficient of 0.029 onlyin the model with the trip variable excluded. It indicatesthat urban areas, areas with standing water, and areasnear the coastline are associated with a higher risk ofdengue infections; the effect of StWtr and Sea is strongerunder the 5 km × 5 km spatial resolution. In contrast, hu-man mobility and BuiltUp are shown to be significantand robust indicators of dengue dynamics for bothspatial resolutions. The same conclusions hold under thesensitivity analysis performed (Table S1 and S2).Results from the sensitivity analysis are presented in
Supplementary Table S1 for jackknife, and Table S2 andFigure S5 for trip variable error. Both sets of analysis re-veal minimal fluctuation in the estimated model coeffi-cients and set of significant variables, which illustratesthe robustness of the model results. Specifically, for bothspatial resolutions, travel volumes into a given cell 1week prior is always a significant indicator of newly re-ported cases in the cell, while travel two-weeks prior is aless reliable factor, and negligent at smaller spatial scales,i.e., 1 km × 1 km. Further, travel patterns one-week prioris consistently identified as a more significant indicatorof new dengue cases than climate and land use.
DiscussionThe results from this study illustrate the critical contri-bution of human mobility on the location and timing ofnew dengue cases, relative to land-use and climate vari-ables. The results are sensitive to the patterns of travelduring the week immediately preceding the appearanceof new case reports. This was the variable with the great-est predictive power. Although, travel patterns 2 weeksprior were found to have an insignificant effect on den-gue outbreak dynamics. Our results are consistent withStoddard, Forshey [13], who concluded that visits tohouseholds by dengue infected individuals determinesthe infection risk, further validating our use of patienthome locations in the model. Furthermore, the signifi-cance of mobility in outbreak prediction was found to berobust under both spatial resolutions of 1 km × 1 km and5 km × 5 km.
In contrast to the role of mobility, which we found tobe a consistently significant indicator of new denguecases, the effect of land-use patterns on the number ofnew cases is sensitive to the spatial resolution of themodels. Land-use variables played a larger explanatoryrole at the coarser spatial resolution of 5 km × 5 km(compared to the finer 1 km × 1 km resolution), particu-larly for smaller spatially-dominant land-use patternssuch as Sea and StWtr. BuiltUp showed the strongestpositive effect overall, indicating urbanization is associ-ated with an increased risk of dengue outbreak (which isconsistent with multiple previous findings [54, 55]).StWtr also showed significant positive effect, which is tobe expected because standing water provides suitablemosquito breeding habitat [21]. The positive effect ofSea only appeared significant when human mobility wasexcluded from the model. Given the significant positivecorrelation between Sea and the number of trips (TableS4), it is likely that the large travel volume towards thearea near the coastline makes the study region prone todengue outbreaks. Previous studies have also found evi-dence that dengue mosquitoes can breed in brackishwater [56], further supporting our finding of the distanceto the sea as significant in some of the models. If thispattern holds in other regions, as seems likely, thatfact can be used for the spatial prioritization of re-source allocation for disease case and vector surveil-lance and control.Among the climate factors, temperature-related vari-
ables including Tavg, Tmin, and DTR, were morestrongly associated with the outbreak emergence thanprecipitation-related variables including Pre and RD, orRH, which is related to both. This finding is in accord-ance with [24], which concluded that “rainfall stronglymodulates the timing of dengue (e.g., epidemics occurredearlier during rainy years) while temperature modulatesthe annual number of dengue fever cases.” Based on re-gression analysis, we found Tmin with a 10-day leadtime to be the best climate-based predictor of newweekly dengue cases. The conclusions on climate influ-ences may be different for other regions, for example,with longer lead time for the best climate predictor ormore significant effects of precipitation on dengue risks[57]. However, given that our model is readily applicable,the model results on climate factors can be used for thetemporal prioritization of resources in broader regions.In addition to human mobility, climate, and land-use
variables, which were included as fixed effects, popula-tion density was incorporated using random effects inthe model because population is likely to have spatiallyheterogeneous effects on dengue outbreaks, as noted inthe Methods. Based on the model results, the random-effects coefficients for population are mostly positive, asexpected, indicating that higher population density is
Zhang et al. BMC Infectious Diseases (2020) 20:649 Page 11 of 14
associated with a higher number of dengue cases (FigureS6). This is consistent with previous studies that haveshown the negative impact of urbanization and popula-tion growth on dengue risk [58]. The most significantpositive effect is seen north of the lagoon along thecoastline, highlighting potentially high-risk areas, wherehigher populations are likely to facilitate the emergenceof dengue outbreaks. A few cells resulted in negativerandom-effects coefficients, which may be due to con-founding interactions between different variables in-cluded in the model, or alternative factors not capturedin the model; these cells were few and only occurred inthe model when the dominant mobility variable was in-cluded. It is possible the dominant role of mobility couldover compensate for the impact of population, e.g., be-cause people are likely to travel to crowded downtownareas, along the lagoon, or near the ocean where thelarge number of trips made to those regions couldoffset the impact of population. That the random-effects coefficients for population density are positiveand negative lends support to the modeling decisionto treat it as having enough stochasticity to qualify asa random-effects variable.The results of this analysis have implications that are
relevant to the design of measures to control denguecases, such as allocation of resources for mosquito vec-tor control. Previous global modeling of ecological suit-ability for dengue vector mosquito species (both Aedesaegypti and Aedes albopictus) have shown that the entirestudy area is a prime habitat for these species [59, 60].This conclusion drawn from the global models finds val-idation in our analysis, which shows that climate andland-use variables are not the most strongly associatedwith dengue case outbreaks. Consequently, epidemio-logical risk based on vector ecology may be insufficientfor the purposes of optimizing vector control resourceallocation, as it is unable to distinguish between poten-tial sites to target within the study area. Because travelinto the sites is the most important predictor of newcase clusters, it may well be time to optimize vector con-trol resources based on mobility data, with the aim toprevent exposure to the day-biting mosquitoes, i.e., Ae-des aegypti, at the highest risk locations. To the best ofour knowledge, such a design for dengue control mea-sures has not yet been tried in the field.Finally, various limitations of this study should be
noted. First, only dengue patients admitted to theCCMDDHF at the Negombo Hospital were includedand surveyed in this study. Thus mild or asymptomaticcases, which account for the majority of dengue cases[1], were not accounted for in the study. Second, somepatients infected in the study region may have gone tohospitals in other districts and would therefore not beincluded. Third, the mobility data was based on patients’
recollections over a 10-day period prior to hospital ad-mission, and therefore may have inaccuracies due to hu-man error in recalling the information. However,detailed analysis of the travel data revealed most trips re-corded represent daily commuting routines. Thus, whilesome trips may be excluded due to human error, we be-lieve the relative connectivity between cells is accuratelycaptured by the survey responses. In addition, the sensi-tivity analysis revealed our results are robust to variationin the time of outbreak and trips variable. Fourth, thedistance traveled and the time spent in a certain locationwere not considered due to the unavailability of relevantdata, which is a limitation in most studies due to thelack of tools to precisely monitor the time-dependent lo-cation of individuals [61]. However, these factors havebeen shown to have little influence on dengue transmis-sion [13, 16], and thus their exclusion does not invali-date the methodology used in this analysis. Fifth, byutilizing all the mobility data collected, we made an im-plicit assumption that the patients were infectious dur-ing the entire 10-day period prior to hospitaladmittance. This period does fall within the combinedintrinsic incubation period (4–10 days) [62] and the earlysymptomatic period before admitted to the hospital. Asixth assumption was that the patients were infected ator around their home locations. This assumption is con-sistent with a wide variety of previous studies that re-vealed homes as the primary point of contact for denguetransmission [13, 63, 64]. Vazquez-Prokopec, Montgom-ery [14] tried to identify the most plausible transmissionlocations based on reported contact locations from adengue outbreak in Cairns, Australia and found thatonly 10.2% of the identified transmission sites were atout-of-home locations, and a notable portion of themwere within 1 km of the home locations. Given that ourobjective was not to model the transmission chains ofdengue as in [14], assuming home locations as the siteof infection provides reasonable support for predictingwhere infected individuals reside, and therefore the riskposed around homes of infected individuals. Lastly, theclimate data were obtained from a single station, thus ahomogenous climatic region was assumed for our studyregion. Therefore, the role of climate factors on the den-gue outbreak may be underestimated.While the modeling framework used here is readily ap-
plicable to other contexts, future work should investigatehow widely transferable the model results are. More spe-cifically using general mobility data (tracking movementsfor all residents); such as using mobile phone data as in[15], or transport planning data, which may be morereadily available and cost effective; should be comparedto the use of patient mobility surveys as in this study. In-formation on the attributes of the surveyed subjects suchas ages and occupations may be worth exploration when
Zhang et al. BMC Infectious Diseases (2020) 20:649 Page 12 of 14
available, as people in different age groups or occupa-tions may report different movement patterns, such asthe frequency of contacts per trip, which could thereforeaffect their associated risk of dengue transmission. Con-trol measures that target specific sites within a cell or aland use type should be considered based on a combin-ation of our study and other site-specific studies such as[65, 66]. For example, previous studies show that schoolswere associated with the highest ratio of positive larvaebreeding sites over potential breeding sites, in contrastto residential premises at the lower end, based on an en-tomological survey in a subdistrict of the city of Col-ombo within our study region [66]. Such sites at higherrisk should be specifically targeted after spatial and tem-poral prioritization of resources in vector controlprograms.
ConclusionsOur study highlights the potential value of using traveldata to target vector control within a region. In additionto illustrating the relative relationship between variouspotential risk factors for dengue outbreaks, the results ofour study can be used to inform where and when newcases of dengue are likely to occur within a region, andthus help more effectively and innovatively, plan for dis-ease surveillance and vector control.
Supplementary informationSupplementary information accompanies this paper at https://doi.org/10.1186/s12879-020-05369-w.
Additional file 1.
AbbreviationsDENV-2: Dengue virus type 2; HDU: High Dependency Unit; CCMDDHF: Clinical Centre for Managing Dengue and Dengue Haemorrhagic Fever;GSOD: Global Surface Summary of the Day; Tavg: Daily mean temperature;Tmax: Daily maximum temperature; Tmin: Daily minimum temperature;DTR: Diurnal temperature range; Pre: Precipitation; RD: The number of rainingdays; RH: Relative humidity; StWtr: Standing Water; FlwWtr: Flowing Water;BuiltUp: Built-up; RockS: Rock/Sand; OthAg: Other Agriculture
AcknowledgementsWe thank Dhammika Silva from the Centre for Clinical Management ofDengue and Dengue Haemorrhagic Fever who supervised the datacollection and Benjamin Zaitchik at Johns Hopkins University for advice onthe climate data extraction.
Concent for publicationNot applicable.
Authors’ contributionsLG conceived the study. YZ, SSi and LG designed the experiments. YZ, HS.,LF and JR collected the data. YZ developed the model and performed thecomputational analysis. All authors analyzed the data and model results. YZ,SSi, SSa, JR, KO, and LG, contributed to the writing of the manuscript. Theauthor(s) read and approved the final manuscript.
FundingWe receieved no funding for this work.
Availability of data and materialsPatient case reports and travel diaries can not be shared due to privacyrestrictions. The remaining data used in this study is provided as asupplementary file, along with the code used to generate the results.
Ethics approval and consent to participateThe protocol was reviewed and approved by the Johns Hopkins BloombergSchool of Public Health Institutional Review Board (JHSPH IRB), #IRB00009485,as well as approved by the Negombo Hospital. Patient consent wasobtained in writing from all participants for the purposes of this study.
Competing interestsWe have no competing interests.
Author details1Department of Civil and Systems Engineering, Johns Hopkins University,Baltimore, MD 21218, USA. 2Department of Earth and Planetary Sciences,Johns Hopkins University, Baltimore, MD 21218, USA. 3Department ofEnvironmental Health and Engineering, Johns Hopkins University, Baltimore,MD 21205, USA. 4Department of Environmental Science, American University,Washington, DC 20016, USA. 5Department of Pediatrics, University ofColombo, Colombo 00900, Sri Lanka. 6Department of Philosophy,Department of Integrative Biology, University of Texas at Austin, Austin, TX78712, USA. 7Centre for Clinical Management of Dengue and DengueHaemorrhagic Fever, Negombo 11500, Sri Lanka.
Received: 26 June 2019 Accepted: 25 August 2020
References1. Bhatt S, Gething PW, Brady OJ, Messina JP, Farlow AW, Moyes CL, et al. The
global distribution and burden of dengue. Nature. 2013;496:504.2. Simmons CP, Farrar JJ, van Vinh CN, Wills B. Dengue. N Engl J Med. 2012;
366(15):1423–32.3. Halstead S, Wilder-Smith A. Severe dengue in travellers: pathogenesis, risk
and clinical management. J Travel Med. 2019;26:7.4. Vannice KS, Roehrig JT, Hombach J. Next generation dengue vaccines: a
review of the preclinical development pipeline. Vaccine. 2015;33(50):7091–9.5. Aldstadt J, Yoon I-K, Tannitisupawong D, Jarman RG, Thomas SJ, Gibbons
RV, et al. Space-time analysis of hospitalised dengue patients in ruralThailand reveals important temporal intervals in the pattern of dengue virustransmission. Tropical Med Int Health. 2012;17(9):1076–85.
6. Chadee DD. Landing periodicity of the mosquito Aedes aegypti in Trinidadin relation to the timing of insecticidal space-spraying. Med Vet Entomol.1988;2(2):189–92.
7. Yasuno M, Tonn RJ. A study of biting habits of Aedes aegypti in Bangkok,Thailand. Bull World Health Organ. 1970;43(2):319–25.
8. Wong J, Astete H, Morrison AC, Scott TW. Sampling considerations fordesigning Aedes aegypti (Diptera: Culicidae) Oviposition studies in Iquitos,Peru: substrate preference, diurnal periodicity, and Gonotrophic cyclelength. J Med Entomol. 2011;48(1):45–52.
9. Pathirana S, Kawabata M, Goonatilake R. Study of potential risk of denguedisease outbreak in Sri Lanka using GIS and statistical modelling. J RuralTrop Public Health. 2009;8:8–17.
10. Louis VR, Phalkey R, Horstick O, Ratanawong P, Wilder-Smith A, Tozan Y,et al. Modeling tools for dengue risk mapping - a systematic review. Int JHealth Geogr. 2014;13:50.
11. Lana RM, MFdC G, TFMd L, Honório NA, Codeço CT. The introduction ofdengue follows transportation infrastructure changes in the state of acre,Brazil: a network-based analysis. PLoS Negl Trop Dis. 2017;11(11):e0006070.
12. Reiner RC, Stoddard ST, Scott TW. Socially structured human movementshapes dengue transmission despite the diffusive effect of mosquitodispersal. Epidemics. 2014;6:30–6.
13. Stoddard ST, Forshey BM, Morrison AC, Paz-Soldan VA, Vazquez-ProkopecGM, Astete H, et al. House-to-house human movement drives dengue virustransmission. Proc Natl Acad Sci. 2013;110(3):994–9.
14. Vazquez-Prokopec GM, Montgomery BL, Horne P, Clennon JA, Ritchie SA.Combining contact tracing with targeted indoor residual sprayingsignificantly reduces dengue transmission. Sci Adv. 2017;3:2.
Zhang et al. BMC Infectious Diseases (2020) 20:649 Page 13 of 14
15. Wesolowski A, Qureshi T, Boni MF, Sundsøy PR, Johansson MA, Rasheed SB,et al. Impact of human mobility on the emergence of dengue epidemics inPakistan. Proc Natl Acad Sci. 2015;112(38):11887–92.
16. Adams B, Kapan DD. Man bites mosquito: understanding the contributionof human movement to vector-borne disease dynamics. PLoS One. 2009;4(8):e6763.
17. Stoddard ST, Morrison AC, Vazquez-Prokopec GM, Paz Soldan V, Kochel TJ,Kitron U, et al. The role of human movement in the transmission of vector-borne pathogens. PLoS Negl Trop Dis. 2009;3(7):e481.
18. Harrington LC, Scott TW, Lerdthusnee K, Coleman RC, Costero A, Clark GG,et al. Dispersal of the dengue vector Aedes aegypti within and betweenrural communities. Am J Trop Med Hyg. 2005;72(2):209–20.
19. Hemme RR, Thomas CL, Chadee DD, Severson DW. Influence of Urbanlandscapes on population dynamics in a short-distance migrant mosquito:evidence for the dengue vector Aedes aegypti. PLoS Negl Trop Dis. 2010;4(3):e634.
20. Getis A, Morrison AC, Gray K, Scott TW. Characteristics of the spatial patternof the dengue vector, Aedes aegypti, in Iquitos, Peru. Am J Trop Med Hyg.2003;69(5):494–505.
21. World Health Organization, Special Programme for Research, Training inTropical Diseases, World Health Organization. Department of Control ofNeglected Tropical Diseases, World Health Organization. Epidemic &Pandemic Alert. Dengue: guidelines for diagnosis, treatment, preventionand control: World Health Organization; 2009.
22. Xu L, Stige LC, Chan K-S, Zhou J, Yang J, Sang S, et al. Climate variationdrives dengue dynamics. Proc Natl Acad Sci. 2017;114(1):113–8.
23. Sirisena P, Noordeen F, Kurukulasuriya H, Romesh TA, Fernando L. Effect ofclimatic factors and population density on the distribution of dengue in SriLanka: a GIS based evaluation for prediction of outbreaks. PLoS One. 2017;12(1):e0166806.
24. Morin CW, Monaghan AJ, Hayden MH, Barrera R, Ernst K. Meteorologicallydriven simulations of dengue epidemics in San Juan, PR. PLOS NeglectedTropical Diseases. 2015;9(8):e0004002.
25. Metcalf CJE, Walter KS, Wesolowski A, Buckee CO, Shevliakova E, Tatem AJ,et al. Identifying climate drivers of infectious disease dynamics: recentadvances and challenges ahead. Proc Royal Soc B Biological Sci. 2017;284:1860.
26. Gloria-Soria A, Armstrong PM, Powell JR, Turner PE. Infection rate of <em>Aedes aegypti</em> mosquitoes with dengue virus depends on theinteraction between temperature and mosquito genotype. Proc Royal Soc BBiological Sci. 2017;284:1864.
27. Lambrechts L, Paaijmans KP, Fansiri T, Carrington LB, Kramer LD, ThomasMB, et al. Impact of daily temperature fluctuations on dengue virustransmission by <em>Aedes aegypti</em>. Proc Natl Acad Sci. 2011;108(18):7460–5.
28. Bar-Zeev M. The effect of temperature on the growth rate and survival of theimmature stages of Aëdes aegypti (L.). Bull Entomol Res. 2009;49(1):157–63.
29. Rueda LM, Patel KJ, Axtell RC, Stinner RE. Temperature-dependentdevelopment and survival rates of Culex quinquefasciatus and Aedesaegypti (Diptera: Culicidae). J Med Entomol. 1990;27(5):892–8.
30. Tun-Lin W, Burkot TR, Kay BH. Effects of temperature and larval diet ondevelopment rates and survival of the dengue vector Aedes aegypti inNorth Queensland, Australia. Med Vet Entomology. 2000;14(1):31–7.
31. Nagao Y, Thavara U, Chitnumsup P, Tawatsin A, Chansang C, Campbell-Lendrum D. Climatic and social risk factors for Aedes infestation in ruralThailand. Tropical Med Int Health. 2003;8(7):650–9.
32. Naish S, Dale P, Mackenzie JS, McBride J, Mengersen K, Tong S. Climatechange and dengue: a critical and systematic review of quantitativemodelling approaches. BMC Infect Dis. 2014;14(1):167.
33. Chakravarti A, Kumaria R. Eco-epidemiological analysis of dengue infectionduring an outbreak of dengue fever, India. Virology J. 2005;2(1):32.
34. Vanwambeke SO, Lambin EF, Eichhorn MP, Flasse SP, Harbach RE, Oskam L,et al. Impact of land-use change on dengue and malaria in northernThailand. EcoHealth. 2007;4(1):37–51.
35. Patz JA, Daszak P, Tabor GM, Aguirre AA, Pearl M, Epstein J, et al. Unhealthylandscapes: policy recommendations on land use change and infectiousdisease emergence. Environ Health Perspect. 2004;112(10):1092–8.
36. Norris DE. Mosquito-borne diseases as a consequence of land use change.EcoHealth. 2004;1(1):19–24.
37. Cheong YL, Leitão PJ, Lakes T. Assessment of land use factors associatedwith dengue cases in Malaysia using boosted regression trees. Spatial andSpatio-temporal Epidemiology. 2014;10:75–84.
38. Sarfraz MS, Tripathi NK, Tipdecho T, Thongbu T, Kerdthong P, Souris M.Analyzing the spatio-temporal relationship between dengue vector larvaldensity and land-use using factor analysis and spatial ring mapping. BMCPublic Health. 2012;12(1):853.
39. Vanwambeke SO, van Benthem BHB, Khantikul N, Burghoorn-Maas C, PanartK, Oskam L, et al. Multi-level analyses of spatial and temporal determinantsfor dengue infection. Int J Health Geogr. 2006;5(1):5.
40. Epidemiology Unit in Ministry of Health of Sri Lanka. Distribution ofNotification(H399) Dengue Cases by Month 2017 [Available from: http://www.epid.gov.lk/web/index.php?option=com_casesanddeaths&Itemid=448&lang=en.
41. Sirisena PDNN, Noordeen F. Evolution of dengue in Sri Lanka—changes inthe virus, vector, and climate. Int J Infect Dis. 2014;19:6–12.
42. Vitarana T, Jayakuru W, Withane N. Historical account of DengueHaemorrhagic Fever in Sri Lanka: WHO Regional Office for South-East Asia. ;1997 [Available from: http://www.who.int/iris/handle/10665/148517.
43. Messer WB, Vitarana UT, Sivananthan K, Elvtigala J, Preethimala LD, RameshR, et al. Epidemiology of dengue in Sri Lanka before and after theemergence of epidemic dengue hemorrhagic fever. Am J Trop MedHygiene. 2002;66(6):765–73.
44. Ali S, Khan AW, Taylor-Robinson AW, Adnan M, Malik S, Gul S. Theunprecedented magnitude of the 2017 dengue outbreak in Sri Lankaprovides lessons for future mosquito-borne infection control andprevention. Infect Dis Health. 2018;23(2):114–20.
45. World Health Organization. Situation Report #01, Sri Lanka dengue outbreak2017 [Available from: http://www.searo.who.int/srilanka/areas/dengue/dengue_outbreak_2017_sit_rep_1.pdf.
46. World Health Organization. Dengue fever - Sri Lanka: World HealthOrganization; 2017 [Available from: http://www.who.int/csr/don/19-july-2017-dengue-sri-lanka/en/.
47. Favier C, Schmit D, Müller-Graf CDM, Cazelles B, Degallier N, Mondet B, et al.Influence of spatial heterogeneity on an emerging infectious disease: thecase of dengue epidemics. Proc R Soc B Biol Sci. 2005;272(1568):1171–7.
48. National Centers for Environmental Information (NCEI). Global SurfaceSummary of the Day (GSOD) U.S.: NOAA/NESDIS/NCEI; 2015 [updatedFebruary 8, 2018. Available from: https://catalog.data.gov/dataset/global-surface-summary-of-the-day-gsod.
49. Wickramagamage P. Seasonality and spatial pattern of rainfall of Sri Lanka:exploratory factor analysis. Int J Climatol. 2010;30(8):1235–45.
50. Bright EA, Rose AN, Urban ML, McKee JJ. LandScan 2016. 2016th ed. OakRidge, Oak Ridge National Laboratory; 2017.
51. Survey Department of Sri Lanka. Spatial Data Infrastructure 2018 [Availablefrom: https://www.survey.gov.lk/nsdi/lis/index_cad.php.
52. Romeo-Aznar V, Paul R, Telle O, Pascual M. Mosquito-borne transmission inurban landscapes: the missing link between vector abundance and humandensity. Proc Royal Soc B Biological Sci. 2018;285:1884.
53. Schmidt W-P, Suzuki M, Dinh Thiem V, White RG, Tsuzuki A, Yoshida L-M,et al. Population density, water supply, and the risk of dengue fever inVietnam: cohort study and spatial analysis. PLoS Med. 2011;8(8):e1001082.
54. Gubler DJ. Dengue and dengue hemorrhagic fever. Clin Microbiol Rev.1998;11(3):480–96.
55. Gubler DJ. Epidemic dengue/dengue hemorrhagic fever as a public health,social and economic problem in the 21st century. Trends Microbiol. 2002;10(2):100–3.
56. Ramasamy R, Surendran SN, Jude PJ, Dharshini S, Vinobaba M. Larvaldevelopment of Aedes aegypti and Aedes albopictus in Peri-Urban brackishwater and its implications for transmission of Arboviral diseases. PLoS NeglTrop Dis. 2011;5(11):e1369.
57. Liyanage P, Tissera H, Sewe M, Quam M, Amarasinghe A, Palihawadana P,et al. A Spatial Hierarchical Analysis of the Temporal Influences of the ElNiño-Southern Oscillation and Weather on Dengue in Kalutara District, SriLanka. Int J Environ Res Public Health. 2016;13:11.
58. Struchiner CJ, Rocklöv J, Wilder-Smith A, Massad E. Increasing dengueincidence in Singapore over the past 40 years: population growth, Climateand Mobility. PLoS One. 2015;10(8):e0136286.
59. Gardner L, Sarkar S. A global airport-based risk model for the spread ofdengue infection via the air transport network. PLoS One. 2013;8(8):e72129.
60. Gardner LM, Fajardo D, Waller ST, Wang O, Sarkar S. A predictive spatialmodel to quantify the risk of air-travel-associated dengue importation intothe United States and Europe. J Trop Med. 2012;2012.
Zhang et al. BMC Infectious Diseases (2020) 20:649 Page 14 of 14
61. Vazquez-Prokopec GM, Stoddard ST, Paz-Soldan V, Morrison AC, Elder JP,Kochel TJ, et al. Usefulness of commercially available GPS data-loggers fortracking human movement and exposure to dengue virus. Int J HealthGeogr. 2009;8(1):68.
62. World Health Organization. Dengue and severe dengue 2018 [Availablefrom: http://www.who.int/news-room/fact-sheets/detail/dengue-and-severe-dengue.
63. Mammen MP Jr, Pimgate C, Koenraadt CJM, Rothman AL, Aldstadt J, NisalakA, et al. Spatial and temporal clustering of dengue virus transmission in Thaivillages. PLoS Med. 2008;5(11):e205.
64. Yoon I-K, Getis A, Aldstadt J, Rothman AL, Tannitisupawong D, KoenraadtCJM, et al. Fine scale spatiotemporal clustering of dengue virus transmissionin children and Aedes aegypti in rural Thai villages. PLoS Negl Trop Dis.2012;6(7):e1730.
65. Ratanawong P, Kittayapong P, Olanratmanee P, Wilder-Smith A, Byass P,Tozan Y, et al. Spatial variations in dengue transmission in schools inThailand. PLoS One. 2016;11(9):e0161895.
66. Louis VR, Montenegro Quiñonez CA, Kusumawathie P, Palihawadana P,Janaki S, Tozan Y, et al. Characteristics of and factors associated withdengue vector breeding sites in the City of Colombo, Sri Lanka. PathogGlob Health. 2016;110(2):79–86.
Publisher’s NoteSpringer Nature remains neutral with regard to jurisdictional claims inpublished maps and institutional affiliations.