Embed Size (px)
Citation preview
�������������
������� ������������
����

�������������
������� ������������
����������������������������� �����������
����������������������� �������������� ���������� � !�������"�#� �����$� %��&
���'��������(�)*(+!,!!
-. /0��* +).((-,!!0�).*+!�!*
��12�-. /0��* +/�/.3+���2�4# ���(5���6�����6��6��
���6�����6��6��7�88&
����������������� ������� ��������������������������������������������������������� ����������������� �������������������������������������

Unmet Needs 2001 A Tennessee KIDS COUNT/Tennessee Commission on Children and Youth Report i
PrefaceLast summer, a friend told me a story that played a significant role in spurring the creation of thispublication. The story goes like this:
A group of stereotypical “soccer moms,” gathered for a match, were celebrating thefailure of the state legislature to reform and pass a state income tax.
Talk then turned to another subject: the state of the county’s schools. The mothers,who live in the richest county in Tennessee, began to bemoan the sorry state of theircounty’s school system, considered one of the better in Tennessee. The moms weredismayed by the poor selection of foreign language, art, music, drama, etc., classesavailable in the middle schools. Well-traveled and not Tennessee natives, they saidthat the selection was more limited than any place they had ever lived.
This story typifies the lack of understanding that many Tennesseans have about the impact of thestate tax structure and its chronic revenue shortages on the programs and services provided in thisstate. As a result, the Tennessee Commission on Children and Youth began preparation of this reportto try to help others understand how we are failing our children.
As a native Tennessean, it is heartbreaking year after year to report that outcomes and other measuresrelated to Tennessee children often rank at or near the bottom nationally. As we have explored someof the reasons for this, too frequently they come back to the issue of funding. Education and otherservices for children in Tennessee simply have a legacy of underfunding.
As I listened to the outcry against tax reform, I often thought about a quote that is generallyattributed to former Representative John Bragg from Murfreesboro, who chaired the House FinanceWays and Means Committee for many years until his retirement. Representative Bragg was anadvocate for a state income tax, and observed, “Show me a Tennessean who thinks he is over-taxed,and I will show you a native.”
People who have lived in other states know that an income tax is not the end of the world and, inmany instances, has provided the revenue needed for basic programs and services, like foreignlanguages, to prepare children to compete in a global economy.
Study after study comes to the same conclusion: the tax structure in Tennessee is inadequate andproduces chronic problems. Likewise, study after study concludes that Tennessee needs an incometax to provide a balanced approach to revenue that grows with the economy.
As a child advocate, for many years my focus had exclusively been on programs and services forchildren in Tennessee. However, as a parent of a high school senior, the past year talk of colleges hasoccupied a significant amount of time at our house. As we considered college options and reviewednational rankings, I was dismayed with many of our findings.
When I went to college, attendance at the “best” public university in the state was the course for meand for my siblings, since my parents could not see any reason to pay out-of-state tuition for other
ii Unmet Needs 2001 A Tennessee KIDS COUNT/Tennessee Commission on Children and Youth Report
states’ schools that were not ranked significantly better than those in Tennessee. I espoused the sameattitude to my daughter. Then I experienced horror when I realized that virtually every flagshipuniversity in the Southeast is ranked higher than the top-ranked university in this state, my almamater, the University of Tennessee.
At a presentation to a group of non-profit organizations last summer, Tennessee State Treasurer SteveAdams observed that the public university academic ranking of the University of Tennessee was 44th ,and that if the ranking of the University of Tennessee football team were that bad, “There would beblood in the streets.” Unfortunately, Tennesseans are not sufficiently concerned about the academicranking. As a U.T. football fan, I am certainly glad the team is better than others in the SoutheasternConference, but as a parent I am now deeply troubled by how far the reputation of higher educationin Tennessee has fallen below other public universities in the South.
And as someone concerned about and committed to the future of Tennessee, I am distressed aboutthe general state of higher education. Even those who do not have children, grandchildren, nieces,nephews, or neighbors whose college education is important to them should be concerned abouthigher education. A strong higher education system is crucial for future economic development.Perhaps more important, especially if you do not have family or friends to care for you when you areold and infirm, you will rely on the products of Tennessee’s high schools, colleges, and universitiesto meet your needs when you can no longer meet them yourself.
Some people wonder if the fact that only four other Southern states have lower percentages of adultsolder than age 25 with at least a high school diploma or with a college degree adversely influencesour emphasis on education, and especially higher education. However, my personal experience, and Ibelieve the experience of countless other Tennesseans, is that many parents who did not go to collegestill want their children to have the opportunity to attend.
Discussions in a Senate committee meeting in late January 2001 highlighted the lack of affordabilityof college for many families in the 47 poorest counties in the state where annual college costs wouldbe about 10 percent of median household income. In response to a suggestion that education issimply not a priority in the family budget, Senator Bob Rochelle responded: “That’s like saying folksin these counties don’t like filet mignon. They’re not going (to college) because they can’t afford it.”
A bright future for Tennessee truly depends on improving the quality of life for our children today.Are we failing our children in Tennessee? Perhaps “failing” is too harsh, but certainly we are noteven remotely doing all that we should or could to ensure that they have the best opportunitiespossible to become productive citizens who can compete in the global economy. A state that ranks33rd in per capita income is far too wealthy to rank in the lower 40s on spending measures foreducation and other services.
We Tennesseans may live in a low tax state, but, since we get what we pay for, we give our childrensubstantially less than they deserve. Inadequate services have the potential to cause Tennesseechildren to be left behind, not only left behind other children in the nation, but other children in thesouth. That is simply too high a price to pay. We must do more for the children of Tennessee, for theytruly are our future.
Linda O’NealExecutive Director
July 27, 2001

Unmet Needs 2001 A Tennessee KIDS COUNT/Tennessee Commission on Children and Youth Report iii
AcknowledgmentsTennessee KIDS COUNT Director – Pam Brown
TCCY Executive Director and Executive Editor – Linda O’NealTennessee KIDS COUNT Research Analysts – Isaac Nwaise, Brian Grove, and Edwina Chappell
Writers – Pam Brown, Fay L. Delk, Steve Petty, Debbie Wynn, and Linda O’NealLayout – Fay L. Delk
Special thanks to:Steve Adams, Tennessee State Treasurer
John Morgan, Comptroller of the Treasury, State of TennesseeWilliam F. Fox, University of Tennessee, Knoxville, Center for Business and Economic Research
Ronnie Steinberg, Women’s Institute for Policy Studies, Vanderbilt UniversityTennessee Advisory Commission on Intergovernmental Relations
Tennessee Higher Education CommissionPrinting funded by the Annie E. Casey Foundation.
Tennessee Commission On Children and YouthThe Tennessee Commission on Children and Youth (TCCY) is an independent state agency advocatingfor improvement in the quality of life of children and families. To fulfill this mission, TCCY collectsand disseminates information on children and families for the planning and coordination of policies,programs, and services; administers and distributes funding for teen pregnancy prevention programsand for improvements in juvenile justice; and evaluates the delivery of services to children in statecustody.
Members of the Tennessee Commission on Children and Youth
Betty Cannon, Chair, Nashville
Angi Agle, Oak Ridge
Betty Anderson, Covington
Kimalishea Anderson, Knoxville
Shirlene Booker, Gray
P. Larry Boyd, Rogersville
Rebecca G. Dove, Springfield
Jim Ford, Franklin
Kandenna Greene, Goodlettsville
Johnny W. Horne, Chattanooga
Drew Johnson, Nashville
Jim Kidd, Fayetteville
Mary Lee, Dickson
Christy Little, Jackson
Alisa Malone, Franklin
Jerry Maness, Memphis
Sharon T. Massey, Clarksville
Linda Miller, Memphis
Suzan Mitchell, Johnson City
John Rambo, Johnson City
Mary Kate Ridgeway, Paris
James Stewart, Jackson
iv Unmet Needs 2001 A Tennessee KIDS COUNT/Tennessee Commission on Children and Youth Report
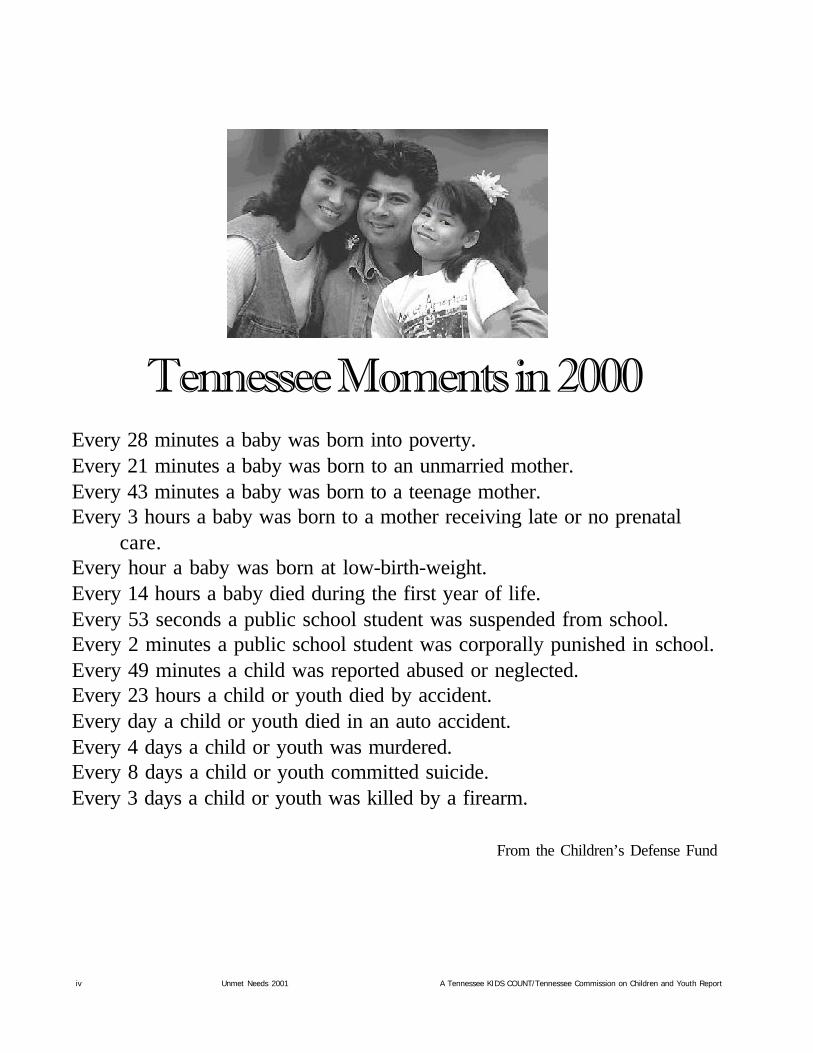
Tennessee Moments in 2000Every 28 minutes a baby was born into poverty.Every 21 minutes a baby was born to an unmarried mother.Every 43 minutes a baby was born to a teenage mother.Every 3 hours a baby was born to a mother receiving late or no prenatal
care.Every hour a baby was born at low-birth-weight.Every 14 hours a baby died during the first year of life.Every 53 seconds a public school student was suspended from school.Every 2 minutes a public school student was corporally punished in school.Every 49 minutes a child was reported abused or neglected.Every 23 hours a child or youth died by accident.Every day a child or youth died in an auto accident.Every 4 days a child or youth was murdered.Every 8 days a child or youth committed suicide.Every 3 days a child or youth was killed by a firearm.
From the Children’s Defense Fund
Unmet Needs 2001 A Tennessee KIDS COUNT/Tennessee Commission on Children and Youth Report v
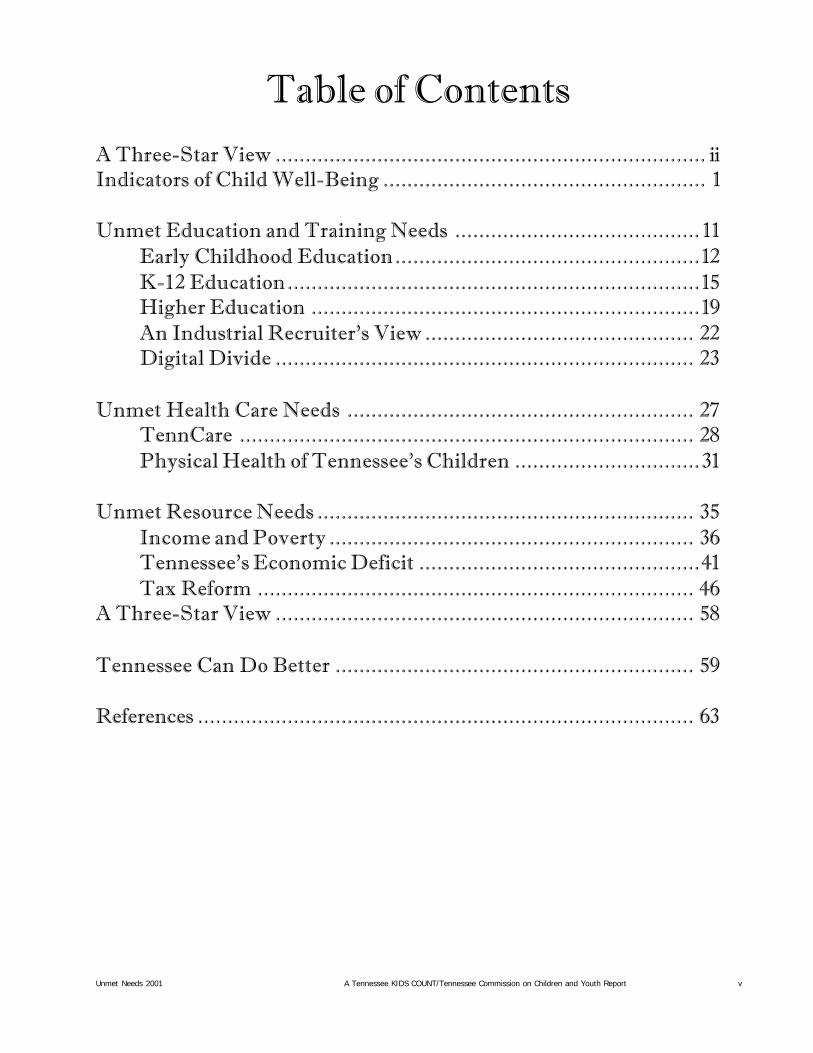
Table of ContentsA Three-Star View ........................................................................ iiIndicators of Child Well-Being ...................................................... 1
Unmet Education and Training Needs ......................................... 11Early Childhood Education ...................................................12K-12 Education .....................................................................15Higher Education .................................................................19An Industrial Recruiter’s View ............................................. 22Digital Divide ...................................................................... 23
Unmet Health Care Needs .......................................................... 27TennCare ............................................................................ 28Physical Health of Tennessee’s Children ...............................31
Unmet Resource Needs ............................................................... 35Income and Poverty ............................................................. 36Tennessee’s Economic Deficit ...............................................41Tax Reform ......................................................................... 46
A Three-Star View ...................................................................... 58
Tennessee Can Do Better ............................................................ 59
References ................................................................................... 63
vi Unmet Needs 2001 A Tennessee KIDS COUNT/Tennessee Commission on Children and Youth Report
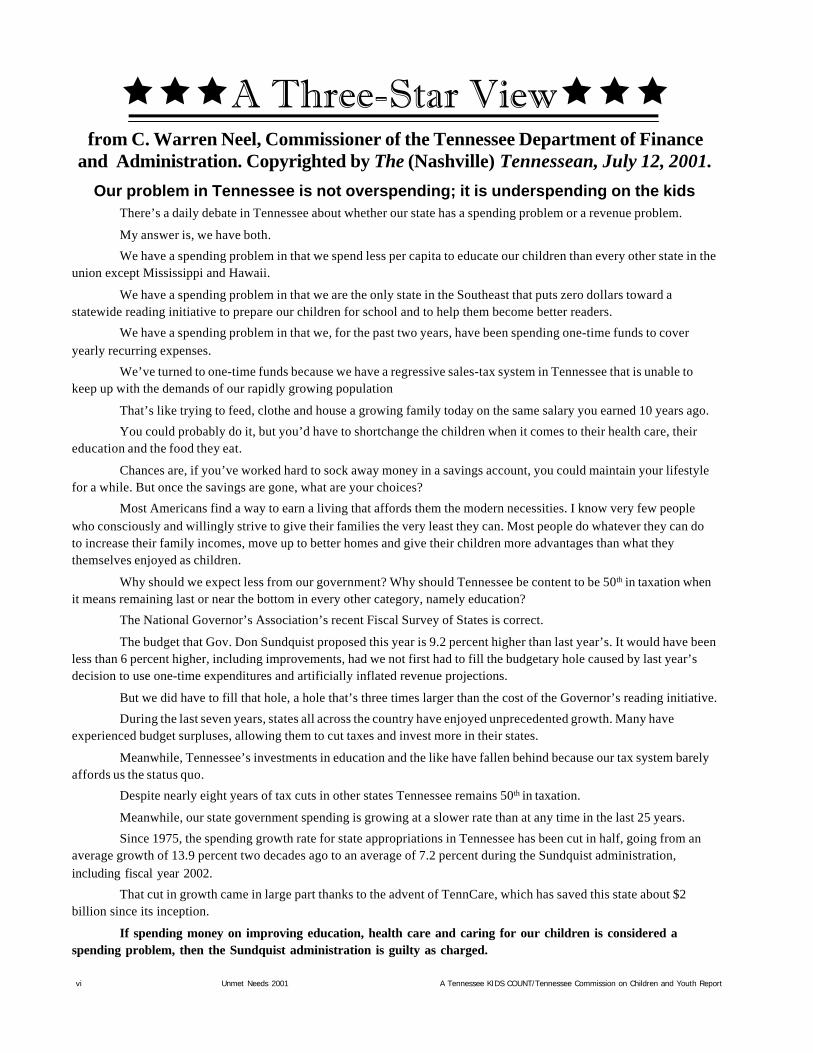
êêêA Three-Star Viewêêêfrom C. Warren Neel, Commissioner of the Tennessee Department of Finance
and Administration. Copyrighted by The (Nashville) Tennessean, July 12, 2001.
Our problem in Tennessee is not overspending; it is underspending on the kidsThere’s a daily debate in Tennessee about whether our state has a spending problem or a revenue problem.
My answer is, we have both.
We have a spending problem in that we spend less per capita to educate our children than every other state in theunion except Mississippi and Hawaii.
We have a spending problem in that we are the only state in the Southeast that puts zero dollars toward astatewide reading initiative to prepare our children for school and to help them become better readers.
We have a spending problem in that we, for the past two years, have been spending one-time funds to coveryearly recurring expenses.
We’ve turned to one-time funds because we have a regressive sales-tax system in Tennessee that is unable tokeep up with the demands of our rapidly growing population
That’s like trying to feed, clothe and house a growing family today on the same salary you earned 10 years ago.
You could probably do it, but you’d have to shortchange the children when it comes to their health care, theireducation and the food they eat.
Chances are, if you’ve worked hard to sock away money in a savings account, you could maintain your lifestylefor a while. But once the savings are gone, what are your choices?
Most Americans find a way to earn a living that affords them the modern necessities. I know very few peoplewho consciously and willingly strive to give their families the very least they can. Most people do whatever they can doto increase their family incomes, move up to better homes and give their children more advantages than what theythemselves enjoyed as children.
Why should we expect less from our government? Why should Tennessee be content to be 50th in taxation whenit means remaining last or near the bottom in every other category, namely education?
The National Governor’s Association’s recent Fiscal Survey of States is correct.
The budget that Gov. Don Sundquist proposed this year is 9.2 percent higher than last year’s. It would have beenless than 6 percent higher, including improvements, had we not first had to fill the budgetary hole caused by last year’sdecision to use one-time expenditures and artificially inflated revenue projections.
But we did have to fill that hole, a hole that’s three times larger than the cost of the Governor’s reading initiative.
During the last seven years, states all across the country have enjoyed unprecedented growth. Many haveexperienced budget surpluses, allowing them to cut taxes and invest more in their states.
Meanwhile, Tennessee’s investments in education and the like have fallen behind because our tax system barelyaffords us the status quo.
Despite nearly eight years of tax cuts in other states Tennessee remains 50th in taxation.
Meanwhile, our state government spending is growing at a slower rate than at any time in the last 25 years.
Since 1975, the spending growth rate for state appropriations in Tennessee has been cut in half, going from anaverage growth of 13.9 percent two decades ago to an average of 7.2 percent during the Sundquist administration,including fiscal year 2002.
That cut in growth came in large part thanks to the advent of TennCare, which has saved this state about $2billion since its inception.
If spending money on improving education, health care and caring for our children is considered aspending problem, then the Sundquist administration is guilty as charged.

�������������� ����������������������������������������������������������������� �
����������� ����
�������������������������
������������������

�������������� �����������������������������������������������������������������
������������������ �� ��������������������� ���� �������� ���������������������������������������������������������������������� �����������!���������"������� ���������#���$%%�&��� ��������������������� ���������������'� ����(���������������������� � �������������� ����� ������������� ����)������������������*��� ����� �������������������������������� ����������*��������� ���+���������������� �����������
,�� ��� �� ���������������������� ��������������������� ������������������������������������������ ������������ � ���"�������������� ��������������������������������������������������� ������������ ���������� ������������ � ������ ��������� ����������
� ������ ��� �������������� ��� ��������������������������������������� ��� �������� ������� �����������������������"���������������������� �������������� ����� ����������� � �-��)�������������������������������������� ��
��������� �������������������������������������������� �����., /�0123� �� ���������� ����������������� �������4��� ��$%%��������������� ����������������������������� ����������������� �������������� ����55%��,���������� ��������������������� ������������������������������� ���������� ����� ��������� �����)����� ����������������� ����� ��������� �������������� �����������������������*� ���
)�� � ����������� ���� ����� ������������ ���������� ������������� �������������������� ���� ������ ������������������ ����������6�� �� � ����� �� ���������� ��������$��������������� ������������������*� ���������������*�������� ���������������������� ����$%%������ ���������4���������������� ������������ �������� ��������� ��������������'��'���������� ��
�������������� �����*� ������*�������������� ����������������� ��������������� �������������������������������"������������������������� ������������������ �������� ��� ���������������������������� ������� ���������������� ���� ������������(������������� ������������������������������ ������������� � ��������� ����������������� �� ����������������������������
0���*��������������������������� ������������������*� ������������������������� �������������� �� � �����., /�0123� �� ����������������7����������������� ��������������'��'���������� ��
������� �����*� ������*���������� �������������� �� � �����., /�0123� �� ������������������������� ���������������� ����������������� �� ���������������������� �����������������������������"����� ��������������� ��������������., /�0123� �� ������������������������� ������ ������������������������������������
8������������ ������� ��������� ����3����&9��������������������������������� ����� ������������������������������������������������ ��� ������� ���������
������������ ���������������
�������������� �����������������������������������������������������������������
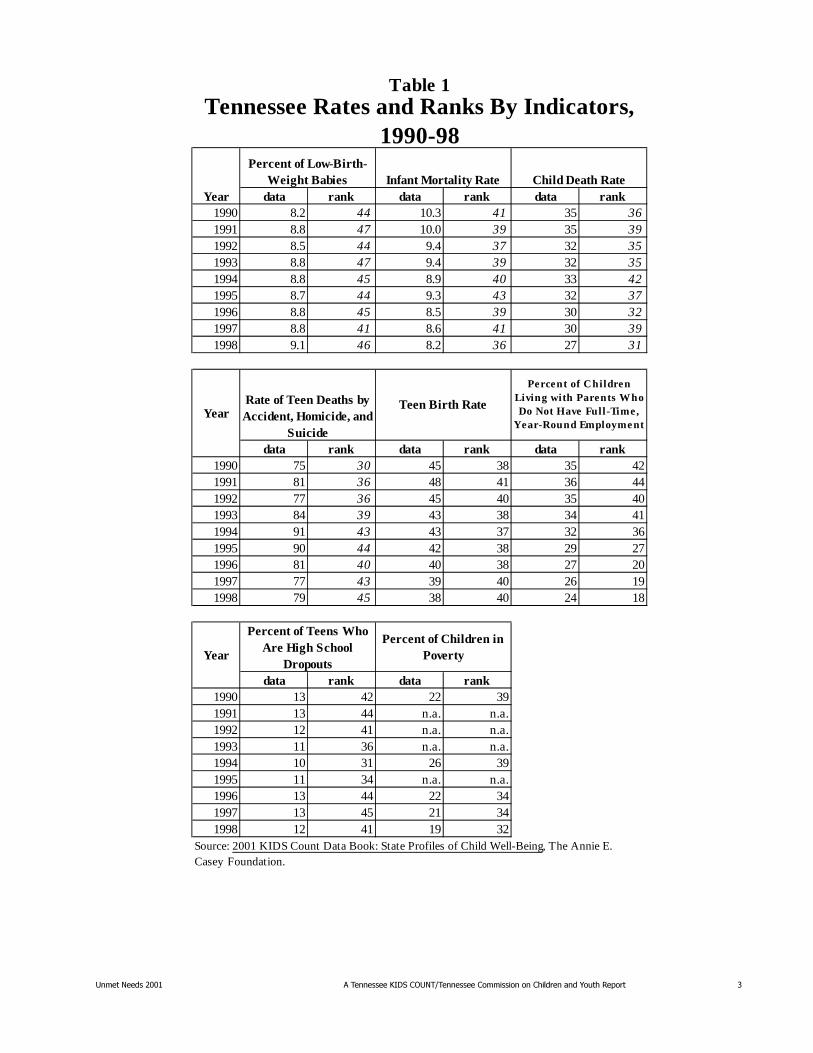
data rank data rank data rank1990 8.2 44 10.3 41 35 361991 8.8 47 10.0 39 35 391992 8.5 44 9.4 37 32 351993 8.8 47 9.4 39 32 351994 8.8 45 8.9 40 33 421995 8.7 44 9.3 43 32 371996 8.8 45 8.5 39 30 321997 8.8 41 8.6 41 30 391998 9.1 46 8.2 36 27 31
data rank data rank data rank1990 75 30 45 38 35 421991 81 36 48 41 36 441992 77 36 45 40 35 401993 84 39 43 38 34 411994 91 43 43 37 32 361995 90 44 42 38 29 271996 81 40 40 38 27 201997 77 43 39 40 26 191998 79 45 38 40 24 18
data rank data rank1990 13 42 22 391991 13 44 n.a. n.a.1992 12 41 n.a. n.a.1993 11 36 n.a. n.a.1994 10 31 26 391995 11 34 n.a. n.a.1996 13 44 22 341997 13 45 21 341998 12 41 19 32
Source: 2001 KIDS Count Data Book: State Profiles of Child Well-Being, The Annie E. Casey Foundation.
Percent of Children in Poverty
YearRate of Teen Deaths by Accident, Homicide, and
Suicide
Teen Birth Rate
Percent of Children Living with Parents Who Do Not Have Full-Time,
Year-Round Employment
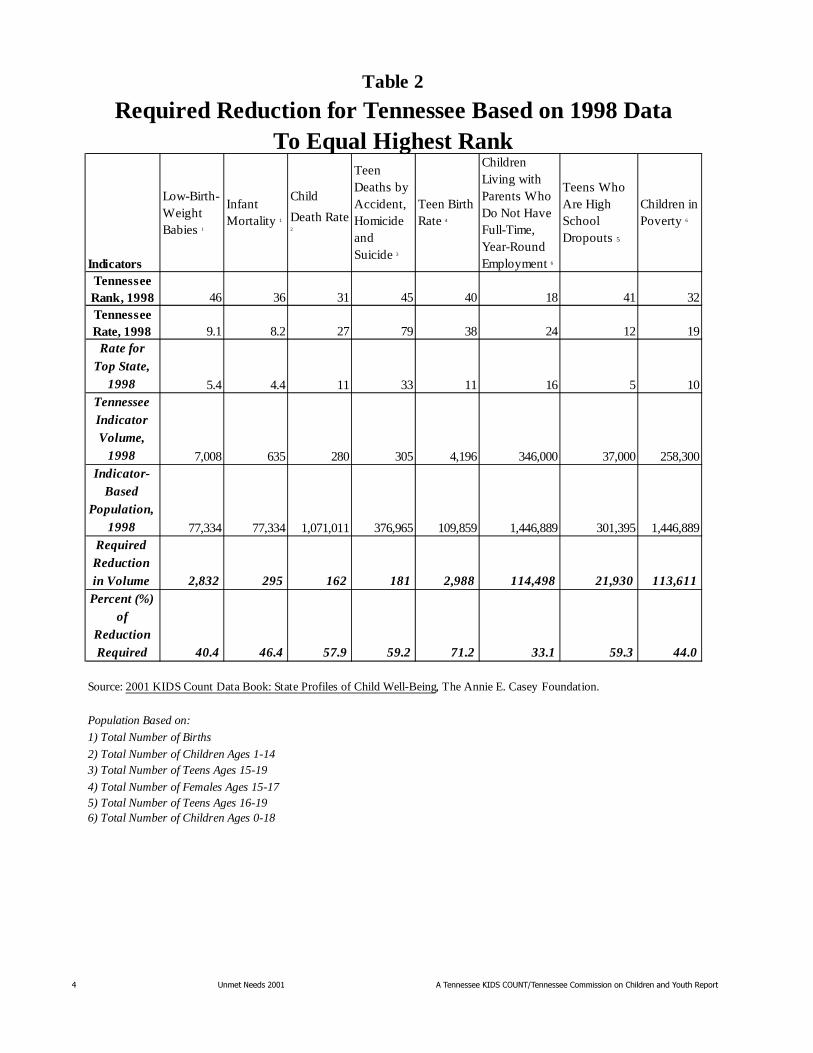
Table 1Tennessee Rates and Ranks By Indicators,
1990-98
Year
Percent of Low-Birth-Weight Babies Infant Mortality Rate Child Death Rate
Year
Percent of Teens Who Are High School
Dropouts
! �������������� �����������������������������������������������������������������
Indicators
Low-Birth-Weight Babies 1
Infant Mortality 1
Child
Death Rate 2
Teen Deaths by Accident, Homicide and Suicide 3
Teen Birth Rate 4
Children Living with Parents Who Do Not Have Full-Time, Year-Round Employment 6
Teens Who Are High School Dropouts 5
Children in Poverty 6
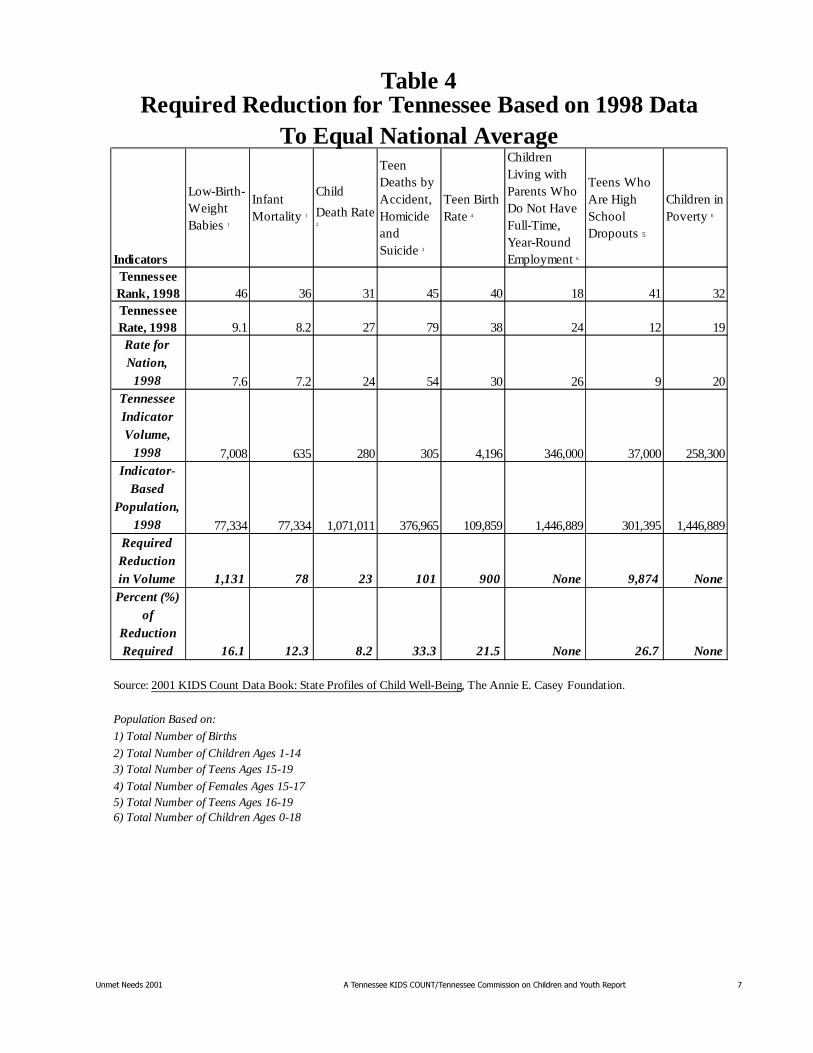
Tennessee Rank, 1998 46 36 31 45 40 18 41 32Tennessee Rate, 1998 9.1 8.2 27 79 38 24 12 19
Rate for Top State,
1998 5.4 4.4 11 33 11 16 5 10Tennessee Indicator Volume,
1998 7,008 635 280 305 4,196 346,000 37,000 258,300Indicator-
Based Population,
1998 77,334 77,334 1,071,011 376,965 109,859 1,446,889 301,395 1,446,889Required Reduction in Volume 2,832 295 162 181 2,988 114,498 21,930 113,611Percent (%)
of Reduction Required 40.4 46.4 57.9 59.2 71.2 33.1 59.3 44.0
Population Based on:
1) Total Number of Births
2) Total Number of Children Ages 1-143) Total Number of Teens Ages 15-19
4) Total Number of Females Ages 15-175) Total Number of Teens Ages 16-196) Total Number of Children Ages 0-18
Required Reduction for Tennessee Based on 1998 DataTo Equal Highest Rank
Table 2
Source: 2001 KIDS Count Data Book: State Profiles of Child Well-Being, The Annie E. Casey Foundation.
�������������� ����������������������������������������������������������������� "
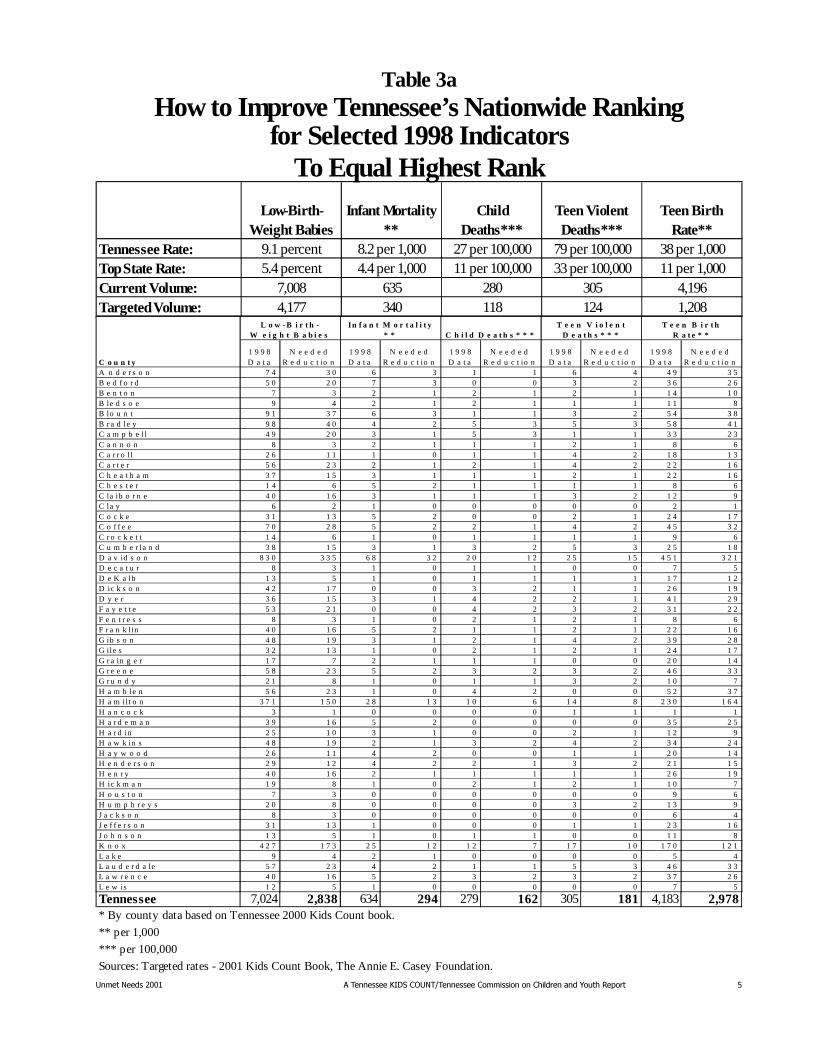
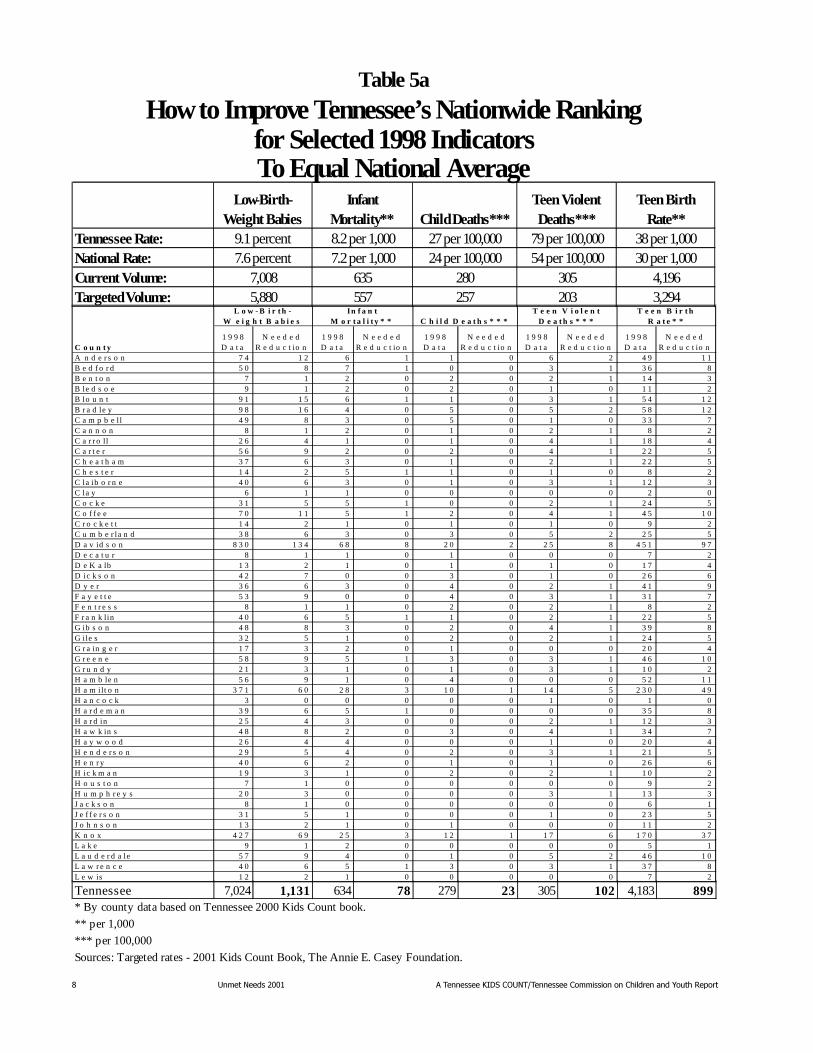
Tennessee 7,024 2,838 634 294 279 162 305 181 4,183 2,978* By county data based on Tennessee 2000 Kids Count book.
** per 1,000
*** per 100,000
Sources: Targeted rates - 2001 Kids Count Book, The Annie E. Casey Foundation.
1 9 9 8 D a t a
N e e d e d R e d u c t io n
1 9 9 8 D a t a
N e e d e d R e d u c t io n
1 9 9 8 D a t a
N e e d e d R e d u c t io n
1 9 9 8 D a t a
N e e d e d R e d u c t io n
1 9 9 8 D a t a
N e e d e d R e d u c t io n
A n d e r s o n 7 4 3 0 6 3 1 1 6 4 4 9 3 5B e d f o r d 5 0 2 0 7 3 0 0 3 2 3 6 2 6B e n t o n 7 3 2 1 2 1 2 1 1 4 1 0B le d s o e 9 4 2 1 2 1 1 1 1 1 8B lo u n t 9 1 3 7 6 3 1 1 3 2 5 4 3 8B r a d le y 9 8 4 0 4 2 5 3 5 3 5 8 4 1C a m p b e l l 4 9 2 0 3 1 5 3 1 1 3 3 2 3C a n n o n 8 3 2 1 1 1 2 1 8 6C a r r o l l 2 6 1 1 1 0 1 1 4 2 1 8 1 3C a r t e r 5 6 2 3 2 1 2 1 4 2 2 2 1 6C h e a t h a m 3 7 1 5 3 1 1 1 2 1 2 2 1 6C h e s t e r 1 4 6 5 2 1 1 1 1 8 6C la ib o r n e 4 0 1 6 3 1 1 1 3 2 1 2 9C la y 6 2 1 0 0 0 0 0 2 1C o c k e 3 1 1 3 5 2 0 0 2 1 2 4 1 7C o f f e e 7 0 2 8 5 2 2 1 4 2 4 5 3 2C r o c k e t t 1 4 6 1 0 1 1 1 1 9 6C u m b e r la n d 3 8 1 5 3 1 3 2 5 3 2 5 1 8D a v id s o n 8 3 0 3 3 5 6 8 3 2 2 0 1 2 2 5 1 5 4 5 1 3 2 1D e c a t u r 8 3 1 0 1 1 0 0 7 5D e K a lb 1 3 5 1 0 1 1 1 1 1 7 1 2D ic k s o n 4 2 1 7 0 0 3 2 1 1 2 6 1 9D y e r 3 6 1 5 3 1 4 2 2 1 4 1 2 9F a y e t t e 5 3 2 1 0 0 4 2 3 2 3 1 2 2F e n t r e s s 8 3 1 0 2 1 2 1 8 6F r a n k l in 4 0 1 6 5 2 1 1 2 1 2 2 1 6G ib s o n 4 8 1 9 3 1 2 1 4 2 3 9 2 8G ile s 3 2 1 3 1 0 2 1 2 1 2 4 1 7G r a in g e r 1 7 7 2 1 1 1 0 0 2 0 1 4G r e e n e 5 8 2 3 5 2 3 2 3 2 4 6 3 3G r u n d y 2 1 8 1 0 1 1 3 2 1 0 7H a m b le n 5 6 2 3 1 0 4 2 0 0 5 2 3 7H a m ilt o n 3 7 1 1 5 0 2 8 1 3 1 0 6 1 4 8 2 3 0 1 6 4H a n c o c k 3 1 0 0 0 0 1 1 1 1H a r d e m a n 3 9 1 6 5 2 0 0 0 0 3 5 2 5H a r d in 2 5 1 0 3 1 0 0 2 1 1 2 9H a w k in s 4 8 1 9 2 1 3 2 4 2 3 4 2 4H a y w o o d 2 6 1 1 4 2 0 0 1 1 2 0 1 4H e n d e r s o n 2 9 1 2 4 2 2 1 3 2 2 1 1 5H e n r y 4 0 1 6 2 1 1 1 1 1 2 6 1 9H ic k m a n 1 9 8 1 0 2 1 2 1 1 0 7H o u s t o n 7 3 0 0 0 0 0 0 9 6H u m p h r e y s 2 0 8 0 0 0 0 3 2 1 3 9J a c k s o n 8 3 0 0 0 0 0 0 6 4J e f f e r s o n 3 1 1 3 1 0 0 0 1 1 2 3 1 6J o h n s o n 1 3 5 1 0 1 1 0 0 1 1 8K n o x 4 2 7 1 7 3 2 5 1 2 1 2 7 1 7 1 0 1 7 0 1 2 1L a k e 9 4 2 1 0 0 0 0 5 4L a u d e r d a le 5 7 2 3 4 2 1 1 5 3 4 6 3 3L a w r e n c e 4 0 1 6 5 2 3 2 3 2 3 7 2 6L e w is 1 2 5 1 0 0 0 0 0 7 5
T e e n V i o l e n t D e a t h s * * *
T e e n B i r t h R a t e * *
L o w - B i r t h -W e i g h t B a b i e s
C o u n t y
In f a n t M o r t a l i t y * * C h i l d D e a t h s * * *
Low-Birth-Weight Babies
Infant Mortality **
Child Deaths***
Teen Violent Deaths***
Teen Birth Rate**
Tennessee Rate: 9.1 percent 8.2 per 1,000 27 per 100,000 79 per 100,000 38 per 1,000Top State Rate: 5.4 percent 4.4 per 1,000 11 per 100,000 33 per 100,000 11 per 1,000Current Volume: 7,008 635 280 305 4,196Targeted Volume: 4,177 340 118 124 1,208
Table 3aHow to Improve Tennessee’s Nationwide Ranking
To Equal Highest Rankfor Selected 1998 Indicators
# �������������� �����������������������������������������������������������������
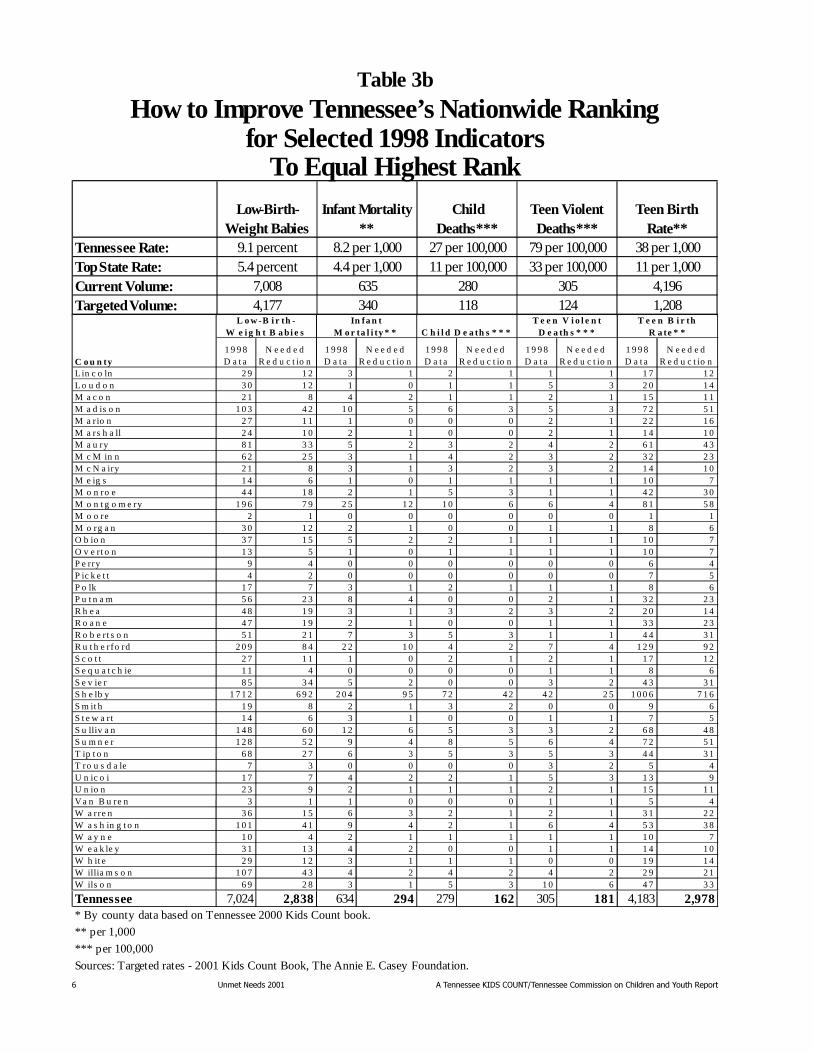
Tennessee 7,024 2,838 634 294 279 162 305 181 4,183 2,978* By county data based on Tennessee 2000 Kids Count book.
** per 1,000
*** per 100,000
Sources: Targeted rates - 2001 Kids Count Book, The Annie E. Casey Foundation.
1 9 9 8 D a t a
N e e d e d R e d u c t io n
1 9 9 8 D a t a
N e e d e d R e d u c t io n
1 9 9 8 D a t a
N e e d e d R e d u c t io n
1 9 9 8 D a t a
N e e d e d R e d u c t io n
1 9 9 8 D a t a
N e e d e d R e d u c t io n
L in c o ln 2 9 1 2 3 1 2 1 1 1 1 7 1 2L o u d o n 3 0 1 2 1 0 1 1 5 3 2 0 1 4M a c o n 2 1 8 4 2 1 1 2 1 1 5 1 1M a d is o n 1 0 3 4 2 1 0 5 6 3 5 3 7 2 5 1M a rio n 2 7 1 1 1 0 0 0 2 1 2 2 1 6M a rs h a ll 2 4 1 0 2 1 0 0 2 1 1 4 1 0M a u ry 8 1 3 3 5 2 3 2 4 2 6 1 4 3M c M in n 6 2 2 5 3 1 4 2 3 2 3 2 2 3M c N a iry 2 1 8 3 1 3 2 3 2 1 4 1 0M e ig s 1 4 6 1 0 1 1 1 1 1 0 7M o n ro e 4 4 1 8 2 1 5 3 1 1 4 2 3 0M o n t g o m e ry 1 9 6 7 9 2 5 1 2 1 0 6 6 4 8 1 5 8M o o re 2 1 0 0 0 0 0 0 1 1M o rg a n 3 0 1 2 2 1 0 0 1 1 8 6O b io n 3 7 1 5 5 2 2 1 1 1 1 0 7O v e rt o n 1 3 5 1 0 1 1 1 1 1 0 7P e rry 9 4 0 0 0 0 0 0 6 4P ic k e t t 4 2 0 0 0 0 0 0 7 5P o lk 1 7 7 3 1 2 1 1 1 8 6P u t n a m 5 6 2 3 8 4 0 0 2 1 3 2 2 3R h e a 4 8 1 9 3 1 3 2 3 2 2 0 1 4R o a n e 4 7 1 9 2 1 0 0 1 1 3 3 2 3R o b e r t s o n 5 1 2 1 7 3 5 3 1 1 4 4 3 1R u t h e rfo rd 2 0 9 8 4 2 2 1 0 4 2 7 4 1 2 9 9 2S c o t t 2 7 1 1 1 0 2 1 2 1 1 7 1 2S e q u a t c h ie 1 1 4 0 0 0 0 1 1 8 6S e v ie r 8 5 3 4 5 2 0 0 3 2 4 3 3 1S h e lb y 1 7 1 2 6 9 2 2 0 4 9 5 7 2 4 2 4 2 2 5 1 0 0 6 7 1 6S m it h 1 9 8 2 1 3 2 0 0 9 6S t e w a r t 1 4 6 3 1 0 0 1 1 7 5S u lliv a n 1 4 8 6 0 1 2 6 5 3 3 2 6 8 4 8S u m n e r 1 2 8 5 2 9 4 8 5 6 4 7 2 5 1T ip t o n 6 8 2 7 6 3 5 3 5 3 4 4 3 1T ro u s d a le 7 3 0 0 0 0 3 2 5 4U n ic o i 1 7 7 4 2 2 1 5 3 1 3 9U n io n 2 3 9 2 1 1 1 2 1 1 5 1 1V a n B u re n 3 1 1 0 0 0 1 1 5 4W a rre n 3 6 1 5 6 3 2 1 2 1 3 1 2 2W a s h in g t o n 1 0 1 4 1 9 4 2 1 6 4 5 3 3 8W a y n e 1 0 4 2 1 1 1 1 1 1 0 7W e a k le y 3 1 1 3 4 2 0 0 1 1 1 4 1 0W h it e 2 9 1 2 3 1 1 1 0 0 1 9 1 4W illia m s o n 1 0 7 4 3 4 2 4 2 4 2 2 9 2 1W ils o n 6 9 2 8 3 1 5 3 1 0 6 4 7 3 3
T e e n V i o l e n t D e a th s * * *
T e e n B i r th R a te * *
C o u n ty
L o w -B i r th -W e i g h t B a bi e s
In fa n t M o r ta l i ty * * C h i l d D e a th s * * *
Low-Birth-Weight Babies
Infant Mortality **
Child Deaths***
Teen Violent Deaths***
Teen Birth Rate**
Tennessee Rate: 9.1 percent 8.2 per 1,000 27 per 100,000 79 per 100,000 38 per 1,000Top State Rate: 5.4 percent 4.4 per 1,000 11 per 100,000 33 per 100,000 11 per 1,000Current Volume: 7,008 635 280 305 4,196Targeted Volume: 4,177 340 118 124 1,208
Table 3b
How to Improve Tennessee’s Nationwide Ranking
To Equal Highest Rankfor Selected 1998 Indicators
�������������� ����������������������������������������������������������������� $
Indicators
Low-Birth-Weight Babies 1
Infant Mortality 1
Child
Death Rate 2
Teen Deaths by Accident, Homicide and Suicide 3
Teen Birth Rate 4
Children Living with Parents Who Do Not Have Full-Time, Year-Round Employment 6
Teens Who Are High School Dropouts 5
Children in Poverty 6
Tennessee Rank, 1998 46 36 31 45 40 18 41 32Tennessee Rate, 1998 9.1 8.2 27 79 38 24 12 19Rate for Nation,
1998 7.6 7.2 24 54 30 26 9 20Tennessee Indicator Volume,
1998 7,008 635 280 305 4,196 346,000 37,000 258,300Indicator-
Based Population,
1998 77,334 77,334 1,071,011 376,965 109,859 1,446,889 301,395 1,446,889Required Reduction in Volume 1,131 78 23 101 900 None 9,874 NonePercent (%)
of Reduction Required 16.1 12.3 8.2 33.3 21.5 None 26.7 None
Population Based on:
1) Total Number of Births
2) Total Number of Children Ages 1-143) Total Number of Teens Ages 15-19
4) Total Number of Females Ages 15-175) Total Number of Teens Ages 16-196) Total Number of Children Ages 0-18
Required Reduction for Tennessee Based on 1998 DataTo Equal National Average
Table 4
Source: 2001 KIDS Count Data Book: State Profiles of Child Well-Being, The Annie E. Casey Foundation.
% �������������� �����������������������������������������������������������������
Tennessee Rate:National Rate:Current Volume:Targeted Volume:
Child Deaths***
30 per 1,000
Table 5a
How to Improve Tennessee’s Nationwide Ranking
Infant Mortality** 8.2 per 1,000
Teen Violent Deaths***
Teen Birth Rate**
38 per 1,000
To Equal National AverageLow-Birth-
Weight Babies9.1 percent 27 per 100,000 79 per 100,000
7.2 per 1,0007.6 percent 24 per 100,000 54 per 100,000
3,2947,008 280 305
557635
for Selected 1998 Indicators
4,1965,880 257 203
Tennessee 7,024 1,131 634 78 279 23 305 102 4,183 899* By county data based on Tennessee 2000 Kids Count book.
** per 1,000
*** per 100,000
Sources: Targeted rates - 2001 Kids Count Book, The Annie E. Casey Foundation.
1 9 9 8 D a t a
N e e d e d R e d u c t io n
1 9 9 8 D a t a
N e e d e d R e d u c t io n
1 9 9 8 D a t a
N e e d e d R e d u c t io n
1 9 9 8 D a t a
N e e d e d R e d u c t io n
1 9 9 8 D a t a
N e e d e d R e d u c t io n
A n d e r s o n 7 4 1 2 6 1 1 0 6 2 4 9 1 1B e d f o r d 5 0 8 7 1 0 0 3 1 3 6 8B e n t o n 7 1 2 0 2 0 2 1 1 4 3B le d s o e 9 1 2 0 2 0 1 0 1 1 2B lo u n t 9 1 1 5 6 1 1 0 3 1 5 4 1 2B r a d le y 9 8 1 6 4 0 5 0 5 2 5 8 1 2C a m p b e l l 4 9 8 3 0 5 0 1 0 3 3 7C a n n o n 8 1 2 0 1 0 2 1 8 2C a r r o ll 2 6 4 1 0 1 0 4 1 1 8 4C a r t e r 5 6 9 2 0 2 0 4 1 2 2 5C h e a t h a m 3 7 6 3 0 1 0 2 1 2 2 5C h e s t e r 1 4 2 5 1 1 0 1 0 8 2C la ib o r n e 4 0 6 3 0 1 0 3 1 1 2 3C la y 6 1 1 0 0 0 0 0 2 0C o c k e 3 1 5 5 1 0 0 2 1 2 4 5C o f f e e 7 0 1 1 5 1 2 0 4 1 4 5 1 0C r o c k e t t 1 4 2 1 0 1 0 1 0 9 2C u m b e r la n d 3 8 6 3 0 3 0 5 2 2 5 5D a v id s o n 8 3 0 1 3 4 6 8 8 2 0 2 2 5 8 4 5 1 9 7D e c a t u r 8 1 1 0 1 0 0 0 7 2D e K a lb 1 3 2 1 0 1 0 1 0 1 7 4D ic k s o n 4 2 7 0 0 3 0 1 0 2 6 6D y e r 3 6 6 3 0 4 0 2 1 4 1 9F a y e t t e 5 3 9 0 0 4 0 3 1 3 1 7F e n t r e s s 8 1 1 0 2 0 2 1 8 2F r a n k lin 4 0 6 5 1 1 0 2 1 2 2 5G ib s o n 4 8 8 3 0 2 0 4 1 3 9 8G ile s 3 2 5 1 0 2 0 2 1 2 4 5G r a in g e r 1 7 3 2 0 1 0 0 0 2 0 4G r e e n e 5 8 9 5 1 3 0 3 1 4 6 1 0G r u n d y 2 1 3 1 0 1 0 3 1 1 0 2H a m b le n 5 6 9 1 0 4 0 0 0 5 2 1 1H a m ilt o n 3 7 1 6 0 2 8 3 1 0 1 1 4 5 2 3 0 4 9H a n c o c k 3 0 0 0 0 0 1 0 1 0H a r d e m a n 3 9 6 5 1 0 0 0 0 3 5 8H a r d in 2 5 4 3 0 0 0 2 1 1 2 3H a w k in s 4 8 8 2 0 3 0 4 1 3 4 7H a y w o o d 2 6 4 4 0 0 0 1 0 2 0 4H e n d e r s o n 2 9 5 4 0 2 0 3 1 2 1 5H e n r y 4 0 6 2 0 1 0 1 0 2 6 6H ic k m a n 1 9 3 1 0 2 0 2 1 1 0 2H o u s t o n 7 1 0 0 0 0 0 0 9 2H u m p h r e y s 2 0 3 0 0 0 0 3 1 1 3 3J a c k s o n 8 1 0 0 0 0 0 0 6 1J e f f e r s o n 3 1 5 1 0 0 0 1 0 2 3 5J o h n s o n 1 3 2 1 0 1 0 0 0 1 1 2K n o x 4 2 7 6 9 2 5 3 1 2 1 1 7 6 1 7 0 3 7L a k e 9 1 2 0 0 0 0 0 5 1L a u d e r d a le 5 7 9 4 0 1 0 5 2 4 6 1 0L a w r e n c e 4 0 6 5 1 3 0 3 1 3 7 8L e w is 1 2 2 1 0 0 0 0 0 7 2
T e e n V i o l e n t D e a t h s * * *
T e e n B i r t h R a t e * *
L o w - B i r t h -W e i g h t B a b i e s
C o u n t y
In f a n t M o r t a l i t y * * C h i l d D e a t h s * * *
�������������� ����������������������������������������������������������������� &
Tennessee Rate:National Rate:Current Volume:Targeted Volume:
30 per 1,000
Table 5b
How to Improve Tennessee’s Nationwide Ranking
Infant Mortality** 8.2 per 1,000
Teen Violent Deaths***
Teen Birth Rate**
38 per 1,000
To Equal National AverageLow-Birth-
Weight Babies9.1 percent 27 per 100,000 79 per 100,000
Child Deaths***
7.2 per 1,0007.6 percent 24 per 100,000 54 per 100,000
3,2947,008 280 305
557635
for Selected 1998 Indicators
4,1965,880 257 203
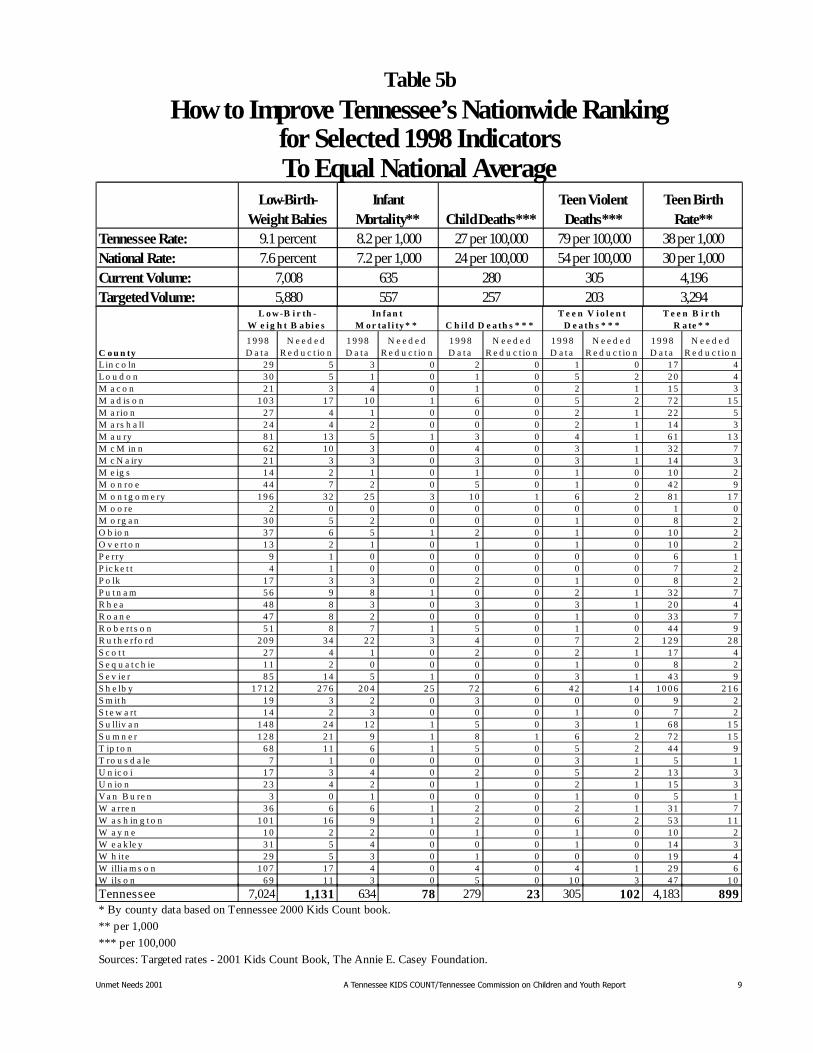
Tennessee 7,024 1,131 634 78 279 23 305 102 4,183 899* By county data based on Tennessee 2000 Kids Count book.
** per 1,000
*** per 100,000
Sources: Targeted rates - 2001 Kids Count Book, The Annie E. Casey Foundation.
1 9 9 8 D a t a
N e e d e d R e d u c t io n
1 9 9 8 D a t a
N e e d e d R e d u c t io n
1 9 9 8 D a t a
N e e d e d R e d u c t io n
1 9 9 8 D a t a
N e e d e d R e d u c t io n
1 9 9 8 D a t a
N e e d e d R e d u c t io n
L in c o ln 2 9 5 3 0 2 0 1 0 1 7 4L o u d o n 3 0 5 1 0 1 0 5 2 2 0 4M a c o n 2 1 3 4 0 1 0 2 1 1 5 3M a d is o n 1 0 3 1 7 1 0 1 6 0 5 2 7 2 1 5M a rio n 2 7 4 1 0 0 0 2 1 2 2 5M a rs h a ll 2 4 4 2 0 0 0 2 1 1 4 3M a u ry 8 1 1 3 5 1 3 0 4 1 6 1 1 3M c M in n 6 2 1 0 3 0 4 0 3 1 3 2 7M c N a iry 2 1 3 3 0 3 0 3 1 1 4 3M e ig s 1 4 2 1 0 1 0 1 0 1 0 2M o n ro e 4 4 7 2 0 5 0 1 0 4 2 9M o n t g o m e ry 1 9 6 3 2 2 5 3 1 0 1 6 2 8 1 1 7M o o re 2 0 0 0 0 0 0 0 1 0M o rg a n 3 0 5 2 0 0 0 1 0 8 2O b io n 3 7 6 5 1 2 0 1 0 1 0 2O v e rt o n 1 3 2 1 0 1 0 1 0 1 0 2P e rry 9 1 0 0 0 0 0 0 6 1P ic k e t t 4 1 0 0 0 0 0 0 7 2P o lk 1 7 3 3 0 2 0 1 0 8 2P u t n a m 5 6 9 8 1 0 0 2 1 3 2 7R h e a 4 8 8 3 0 3 0 3 1 2 0 4R o a n e 4 7 8 2 0 0 0 1 0 3 3 7R o b e rt s o n 5 1 8 7 1 5 0 1 0 4 4 9R u t h e rfo rd 2 0 9 3 4 2 2 3 4 0 7 2 1 2 9 2 8S c o t t 2 7 4 1 0 2 0 2 1 1 7 4S e q u a t c h ie 1 1 2 0 0 0 0 1 0 8 2S e v ie r 8 5 1 4 5 1 0 0 3 1 4 3 9S h e lb y 1 7 1 2 2 7 6 2 0 4 2 5 7 2 6 4 2 1 4 1 0 0 6 2 1 6S m it h 1 9 3 2 0 3 0 0 0 9 2S t e w a rt 1 4 2 3 0 0 0 1 0 7 2S u lliv a n 1 4 8 2 4 1 2 1 5 0 3 1 6 8 1 5S u m n e r 1 2 8 2 1 9 1 8 1 6 2 7 2 1 5T ip t o n 6 8 1 1 6 1 5 0 5 2 4 4 9T ro u s d a le 7 1 0 0 0 0 3 1 5 1U n ic o i 1 7 3 4 0 2 0 5 2 1 3 3U n io n 2 3 4 2 0 1 0 2 1 1 5 3V a n B u re n 3 0 1 0 0 0 1 0 5 1W a rre n 3 6 6 6 1 2 0 2 1 3 1 7W a s h in g t o n 1 0 1 1 6 9 1 2 0 6 2 5 3 1 1W a y n e 1 0 2 2 0 1 0 1 0 1 0 2W e a k le y 3 1 5 4 0 0 0 1 0 1 4 3W h it e 2 9 5 3 0 1 0 0 0 1 9 4W illia m s o n 1 0 7 1 7 4 0 4 0 4 1 2 9 6W ils o n 6 9 1 1 3 0 5 0 1 0 3 4 7 1 0
T e e n V i o l e n t D e a th s * * *
T e e n B i r th R a te * *
C o u n ty
L o w -B i r th -W e i g h t B a bi e s
In fa n t M o r ta l i ty * * C h i l d D e a th s * * *

�� �������������� �����������������������������������������������������������������

�������������� ����������������������������������������������������������������� ��
����������� ������� �������������
��������
� �������������� �����������������������������������������������������������������
)�� �� �������������� ������������������������������������� ����� �� �������������������������������� ��� ������������������ ��������������������� ���������� ����������� ������������ ��������������������������� ����������:���9( ���/����:��������:��+����555&��/���;���������;��� ����� �����<
� 3��������� �������� ������ ���
� /���������������
� =��� ���� �*�����
� �����������
� !���'������������������
#����/����������������������� �� ��� ������������� �� ��������������� ������������������ ��� ������ �������������� ���������
8�����0� �������8����� ��� ������� ���������������'���������'���'����������������������� �� �����������������������������������������
� )����� ����������������������� �� �����$�%%%��� ����� ��������������� �� �����8�����0� �������8����� ���
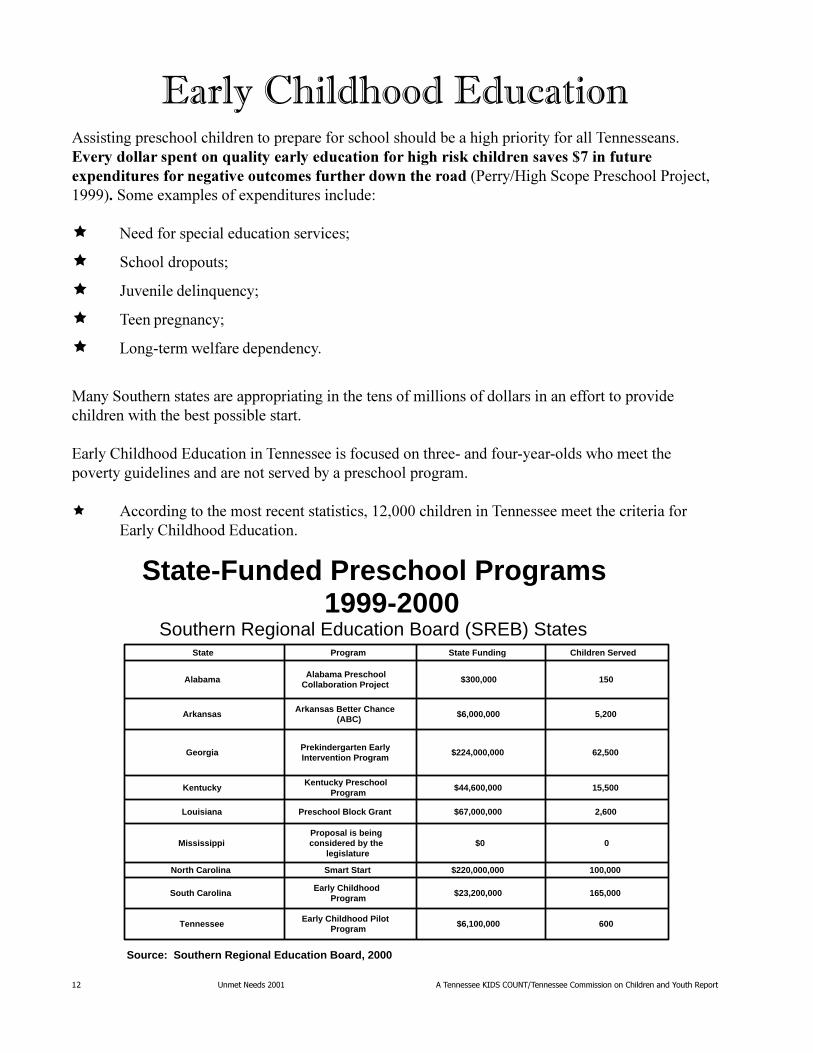
State-Funded Preschool Programs 1999-2000
Southern Regional Education Board (SREB) States
Source: Southern Regional Education Board, 2000
State Program State Funding Children Served
Alabama Alabama Preschool Collaboration Project $300,000 150
Arkansas Arkansas Better Chance (ABC) $6,000,000 5,200
Georgia Prekindergarten Early Intervention Program
$224,000,000 62,500
KentuckyKentucky Preschool
Program $44,600,000 15,500
Louisiana Preschool Block Grant $67,000,000 2,600
MississippiProposal is being considered by the
legislature$0 0
North Carolina Smart Start $220,000,000 100,000
South Carolina Early Childhood Program
$23,200,000 165,000
Tennessee Early Childhood Pilot Program $6,100,000 600
����� ������������������
�������������� ����������������������������������������������������������������� �
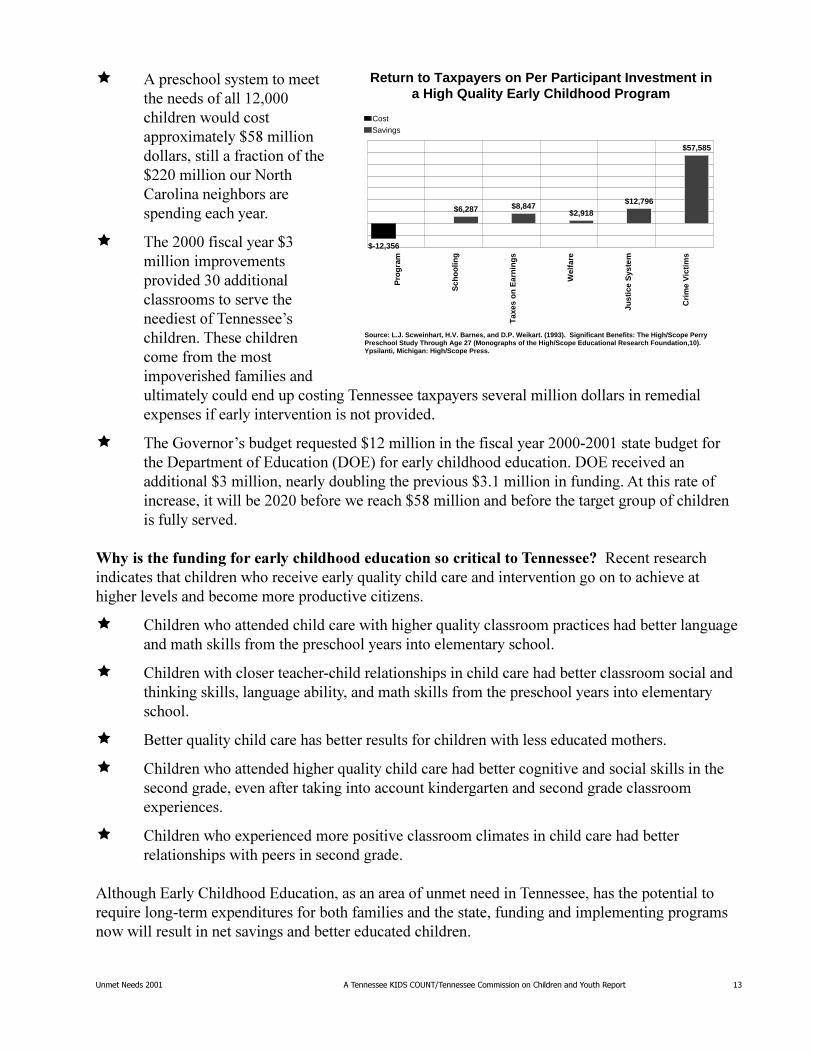
� )������������������������������������$�%%%�� ��������������������; ������>7?�� �� ������������� ���������� ��������>$$%�� �� �������3����0���� ���� ������������� �����������
� ��$%%%�� ���������>4� �� ��� ������������� ���4%���� � �������������������������� ����������6��� ����������� �������������������� ����� ������� � �������� ���������������������� ����������;������������� �� ����������� ����� ��;����� ������� ������ ��� ���������� ���
� ��@������6���������*�����>�$�� �� ��� ������ ���������$%%%'$%%������������������� �����������8����� ���� 18&������������ ������������ ���� 18��� �������� � �����>4�� �� ��������������� ��������� ����>4���� �� ��� ������ ����)���� �������� ������� ��� �����$%$%�������������>7?�� �� �������������������������������� ���� �������������
������������� �� �������������������������� ���������������� ��������A���������� �� ������������ ����������� �������*��� ����� ����������� ������ ��������������� ����� ����������������������������� ��� � B���
� 0� ������������������ �������� ���� ����*��� ������������������ ������������������������������ �������������������������� �������������������
� 0� ������ ��������������'�� ������� ���� ��� ���� ����������������������������� �������� �� ����� ��������������� � ��������������� �������������������������� ������������������
� C����*��� ����� ����������������������������� ������ ���������������������
� 0� ����������������� ����*��� ����� �������������������� � ��������� ����� ���� ��������������������������� ��� ������������� ���������������������������������;�� ����
� 0� ���������;�� ����������� � �������������� ����� ���� ������������������� ���� ���� ������� �������������
)��������8�����0� �������8����� ������������������������� �������������������� ������*� ������'����;��� ����������������� � ������������������� ������� ������ ���������������� ��������� �������� ���������������������� �����
Return to Taxpayers on Per Participant Investment in a High Quality Early Childhood Program
Source: L.J. Scweinhart, H.V. Barnes, and D.P. Weikart. (1993). Significant Benefits: The High/Scope Perry Preschool Study Through Age 27 (Monographs of the High/Scope Educational Research Foundation,10). Ypsilanti, Michigan: High/Scope Press.
$-12,356
$6,287 $8,847$2,918
$12,796
$57,585
Pro
gra
m
Sch
oo
ling
Tax
es o
n E
arn
ing
s
Wel
fare
Just
ice
Sys
tem
Cri
me
Vic
tim
s
Cost
Savings
�! �������������� �����������������������������������������������������������������
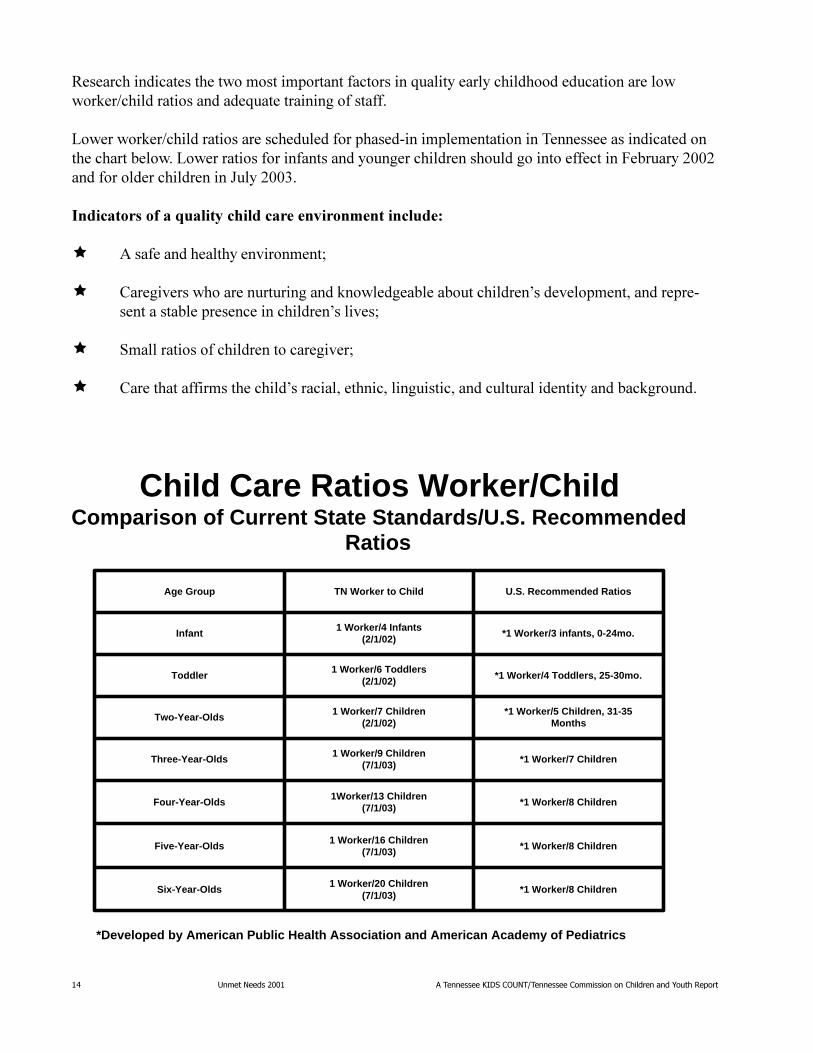
Child Care Ratios Worker/ChildComparison of Current State Standards/U.S. Recommended
Ratios
*Developed by American Public Health Association and American Academy of Pediatrics
Age Group TN Worker to Child U.S. Recommended Ratios
Infant1 Worker/4 Infants
(2/1/02)*1 Worker/3 infants, 0-24mo.
Toddler1 Worker/6 Toddlers
(2/1/02)*1 Worker/4 Toddlers, 25-30mo.
Two-Year-Olds1 Worker/7 Children
(2/1/02)*1 Worker/5 Children, 31-35
Months
Three-Year-Olds1 Worker/9 Children
(7/1/03)*1 Worker/7 Children
Four-Year-Olds1Worker/13 Children
(7/1/03)*1 Worker/8 Children
Five-Year-Olds1 Worker/16 Children
(7/1/03)*1 Worker/8 Children
Six-Year-Olds1 Worker/20 Children
(7/1/03)*1 Worker/8 Children
A������ �� ����������������� ����������������� ��*��� ���������� ������������ ��������������9�� ������ ���������*������� � ������������
!���������9�� ������ �����������������������' �� �������� ��� ���������� �� ����������������������!������� ������� �������������������� ��������������� ��������� ����������$%%$��������������� ����� ��=����$%%4�
���������������������������� ���� �� ��� ����!
� )������������������ �������
� 0��� ����������������� �������������������������� ����6�������������������'������������������ ���� ����6��� ���
� /�������� �������� ������������ ���
� 0����������� ��������� ��6����� ������� ���� ��� �� ���������������� ��� ������������������
�������������� ����������������������������������������������������������������� �"
8����� ��� ����D���� �������E�)�� �� � ����6���� � �������� ����������������������� ���������������������+��� ��������������������������� ������� ��������� ����������������� ��������� � ���� ���������������� ��������+�������������� ������������������������������������������������� � ��������������������������������*� ��������������������� �������� ������������������ ���� �����"��������������� ���������������������������������������������������������� �� ��� ��������������������������������������������������������������� � ����������������� �� ����=������� �������������������������� � ���������������� ������;���� ���� ����� ���+���������������������������������� ������� �����������������������D:��� � ������� ������ ���������������� ������������������ ��������������������������������������������E���/��*� ����"��������$%%%������&�
� ������55F'5G�������� ���� �� ����������� �������������"#��� ��7%������������� ���������@���� �������B ��/�����C����
� ��� �� ��������������$%��� �������������� �� ��� ����� ���� ������ ���������� �
� ,���������� ����������8����� ���� �����/��� �� ���0����������3�� �����0�������8����� ���/��� �� ���������&������� ��'�����()����� �*�� ������������������� �����+����+ �����������������������������������
� #��� �6���'�� ���;��� ��������$������������������������ � ���3���� ��6�����5�������
� :�'�� ���;��� ����������������� ������� ��� ��#��� �����$$��������������� � ������ ��3���� �����G������������
��������������
� ��0� ����6� ��������� �������6���������������� �� �� �����$%���������7�� �� ��$%%%�� �� ���
� ����������$,��� ����������� �� �����������������������
W.F. Fox, Center for Business and Economic Research, UT Knoxville, September 1999
�������������������� ����������������
��������������������� ��������������������������� ���
������������ ������������� ���
����������!�����"������������� � ���

�# �������������� �����������������������������������������������������������������
� ��A���������������������'���-�������� �������� ��&����������������������������� � ������� ��+������������ ���D������� �*����� ����E��� ��;� ��������������� ������ ������������B ������������������������� �� ������������������� ���������� ������������ ��� ���,����������������� ��������� ������ ���������������� ��������������������� � ��� ������B ������
,���55$�������������������� ���������� ������������������������ ������� ������������������������������ ����������� �����������������������������������)�����������C�� �8����� ���:���������������������������557���������'�����������;��������������������������� ���� ���� ������������������ ����������������� � ������������������������� ��������� �'����� ����� ������ � �������������� �����������������������������������������������
� ����� ������ ��.��������� �������������������(�� �������� ��� ��������
�������������� ������� ����� �������� ��������������� �������������/�������������������������������������'���� ��������� � ��� ������ ���� ����������������������� �������;�������;� ��&������ ����� � ��������� � ����������
� ,��������� �������������+����������������$��������������+��������� �����������$,��
� �����������/�+����� �������������� ��������������������B ��
� � �� ������� ��������������� ������ ��+����������� ������� ��� ��(� ����������������������������������$,������2�/�� �����������!������� �������������$%%���������������������������� ������������ �� ������ ������������������������� ���� ��������� ������� �������������
D���� ��������������� �� ������� �������������+����������� ������ ��� ������E������� ��������������������������� �������������������� ��� ������������������
� "� ������� � �� ������� ���������� ������ ����������; ����������������������������������55$�3�� �����)�����������)�����! �����&���� ������������������� ��� ������0,#����� �1�������������� ������02%������ �1������ ���� ������� ���� ����������1������ ���������������������������������� ���� �������������������������������������������
!���������������� �����������*������������� ������� �� �������
� ,���������$������ ���������� ���������3������� ���������������������������������� �� ����������%� ���� �������� ���,���55G���������������� � ���� ����� ��� � ����� ���������������� ���� �������4����4� ���������������������
,�������������������������������������+���������������� � ����������� ���������������� ������������ �� ���� ����������������������������������������������� ��������������6�� � B���
�������������� ����������������������������������������������������������������� �$
Social Promotion
/������� ��'��������������� ����� ��������������������� ������ ��������� ��������� ���������������������������;����������������������������������������� ��� ���� ������������&��/�� ��������� ��� ������ �������������������� ������������ ������������������ ������������������������������ ����� �������'������������ �������������������������D��� ���������� ��E� ������������ ���� �������������������������������������������� ������������� ���/A8C��$%%�&�
5������ �����������(���������������+����� �� ��������������� � �������� ������ ��� ����!
� )��������������������� ����� ����������'�������������������������������������;�����������-�,��������� ����������������������������������������������������� ������ �������������������������� ������ ��������������������-
� ,���������������������������� � ���������������� ������������������������������� ������������������������-
� )���������������������������� �� ������������������ ����������������������������������������� ������������ ����������������������������������&����� �������� B������������������ ��������������������� ����-
� ���������������������� �������� ��� ������� �������������������������� ��-
� )���������������������������� ����������� ���;����� ������������� ������������������������������������������������������������������� ��-
� ,����������������*� ��������������������� ����������������� �������������������������������������-�)�������������������������������������������������������������������������������� ��'*��� �������������� �� � ������������6����-
� )��������������������� ����������������������������������������������;������������ �����������������������������&-
� ,����������� ���*� ������������������������������������ �������������� ������������ ���������� �������� ���������������������� ��������������� ����� �-
� )������������������������������������9������������������ ������������� ���� ������������������ ������� �����������������������������������-
� ,����������� ��'*��� ���������� ����������������� ��������������� �������������������-
� )��������� � �������������������������� ������ ������������������-
� )�� ������� ������������������������� ������������������������������������ ��������� ����������������������������� ������������/A8C��$%%�&-
�%���
�����������
������������
�����������������
������������
������������������������
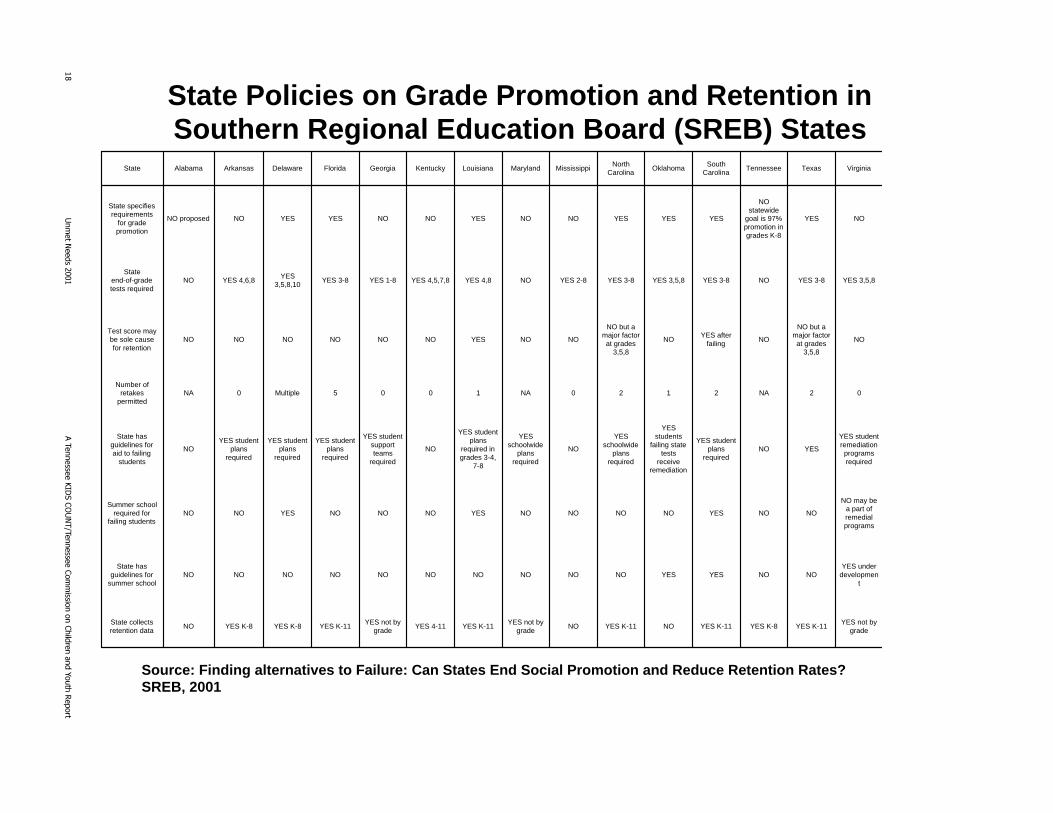
State Policies on Grade Promotion and Retention in Southern Regional Education Board (SREB) States
Source: Finding alternatives to Failure: Can States End Social Promotion and Reduce Retention Rates? SREB, 2001
State Alabama Arkansas Delaware Florida Georgia Kentucky Louisiana Maryland MississippiNorth
CarolinaOklahoma
South Carolina
Tennessee Texas Virginia
State specifies requirements
for grade promotion
NO proposed NO YES YES NO NO YES NO NO YES YES YES
NO statewide
goal is 97% promotion in grades K-8
YES NO
State end-of-grade tests required
NO YES 4,6,8YES
3,5,8,10YES 3-8 YES 1-8 YES 4,5,7,8 YES 4,8 NO YES 2-8 YES 3-8 YES 3,5,8 YES 3-8 NO YES 3-8 YES 3,5,8
Test score may be sole cause for retention
NO NO NO NO NO NO YES NO NO
NO but a major factor at grades
3,5,8
NOYES after
failingNO
NO but a major factor at grades
3,5,8
NO
Number of retakes
permittedNA 0 Multiple 5 0 0 1 NA 0 2 1 2 NA 2 0
State has guidelines for aid to failing
students
NOYES student
plans required
YES student plans
required
YES student plans
required
YES student support teams
required
NO
YES student plans
required in grades 3-4,
7-8
YES schoolwide
plans required
NO
YES schoolwide
plans required
YES students
failing state tests
receive remediation
YES student plans
requiredNO YES
YES student remediation programs required
Summer school required for
failing studentsNO NO YES NO NO NO YES NO NO NO NO YES NO NO
NO may be a part of remedial programs
State has guidelines for
summer schoolNO NO NO NO NO NO NO NO NO NO YES YES NO NO
YES under developmen
t
State collects retention data
NO YES K-8 YES K-8 YES K-11YES not by
gradeYES 4-11 YES K-11
YES not by grade
NO YES K-11 NO YES K-11 YES K-8 YES K-11YES not by
grade
�������������� ����������������������������������������������������������������� �&
���������������� ��������������������$7���������� �������������������F��� ������������ ����� ����������� ������C��������������� ����������������������������������������������������������� ��������;����� ������������������������� �� ����������� ���������������� �������������������� ����
� ,�� �����+��������� �� ��� ��������5�������������+���� ����*� �������������������������$7�������� ����*� ����������'����������� � ��������������������������1������� ��C� �&�
� )������������ ����������������� �� � ������������ �������������� �������55%���� ����������������������� ������������������������ ���������'����������H������������������������������������6���������� ���������������� ������������������������������������������������� ����������� ���������@8 ��7%�����5������������������������������������ ���&��0��� � ������8����� ����555��$%%%&�
���������������
Percent of Top Graduates Who Apply to In-State Colleges
Center for Business and Economic Research, UT Knoxville, NCES CCD
45%43%
32%
27%
18%
Virginia North Carolina Florida Georgia Tennessee
� ����� ����������� ������������� ���������������� �� ����� ���� ����5G%�������� ���������� �����������������������+�������� ����� ����������������������������� ��������������?����������������� ������ �������������� ��������$7��������������������A����0������55G&�
� �������)������ �������A�����0�����������/�����$%%%� �����������0������� ������� ���������)������� ��������������6��)������� ��*������
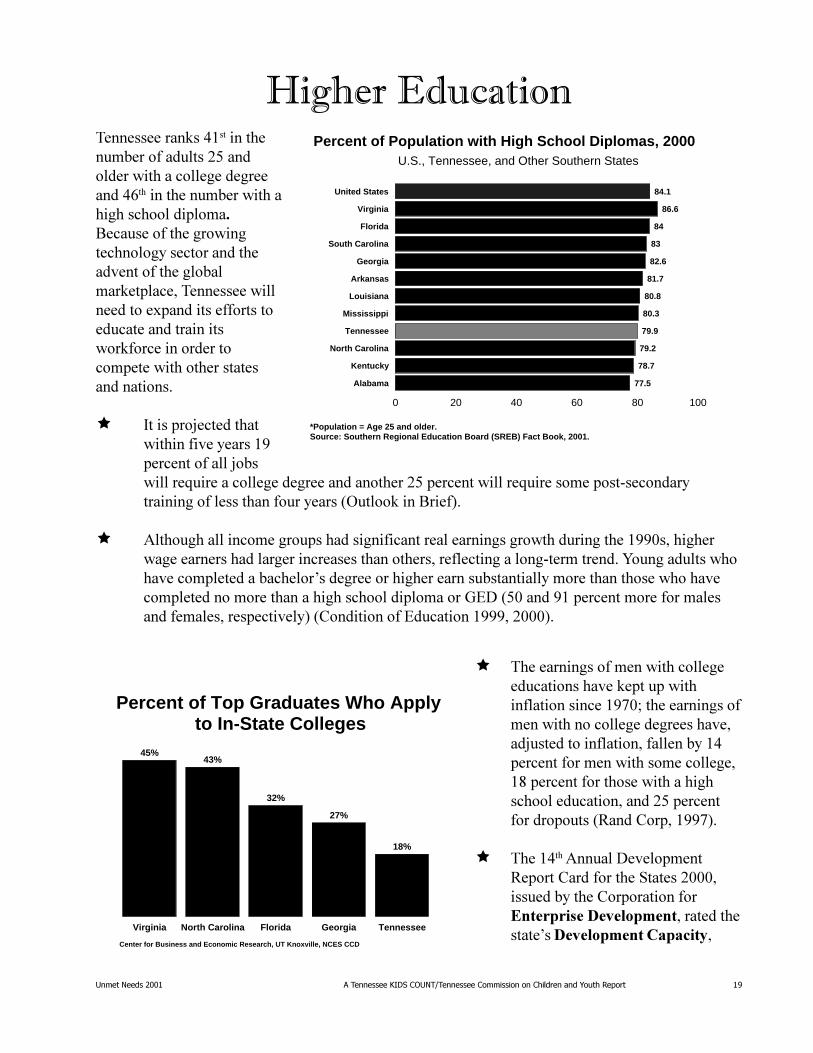
Percent of Population with High School Diplomas, 2000U.S., Tennessee, and Other Southern States
*Population = Age 25 and older.Source: Southern Regional Education Board (SREB) Fact Book, 2001.
84.1
86.6
84
83
82.6
81.7
80.8
80.3
79.9
79.2
78.7
77.5
United States
Virginia
Florida
South Carolina
Georgia
Arkansas
Louisiana
Mississippi
Tennessee
North Carolina
Kentucky
Alabama
0 20 40 60 80 100
� �������������� �����������������������������������������������������������������
�� ��������������������������6������� ���������1�6�� �7��������,��������������� ������D8�E������� ����� �9��������D)�E���(����A����������� ������ ������� ������� �������������������� ��������� �����;���������������������� ���� �� ����������,������ �������������������������������������� ����������������� �� ��������� ����������������������� ���������
0��������������� ������������������������������6��������������)��� ��6������� �������� ��� ���������������� � �������������������������� �����
� ������������� ���������������� ������� � ����������55?�"� � ���3�� �����)����������8����� ���:��������������������������������� � ����� ����������������'�� ������������������ ������������������������������������������44��������������������������&�
� /��������������������������� �������� ���������� �������������������������� ��������������������������� ��� �������
����� ���������� ����������������)����� �������������������/�����C����$%%%���� ����������������2"��� ����������������� �� ��� ��������������� �
� ������ �� ����������-"������ ����������������������������������� ������������'����������� ��$%%�'%$��"� �������� ����������������� � ��� ���������������'�������� ������������4��������������555'$%%%�������������������$%%%'%��������� �� �������������������������������"������ �� ��-#������ ������ ����������(���������� ������������� � ���������2� ��� �����������#� ����:����������������4������������55?'55�����$%%%'%���0�����C������$%%%&��)���� � ���� ���������������� ����������������������� ����������������������������� �������������������
� /��������� ������� ������������-�2� ��� � �������������*��� �������� �������� ��)����� ��������������������������������������������6��� ��������� ������� �������������������:����� �-%%;� ��-%%%4�����������������������(�������������� ���������������������������������� ��������������������� ����.���������,����� ��'��+����������������������(��������������� ��������+��
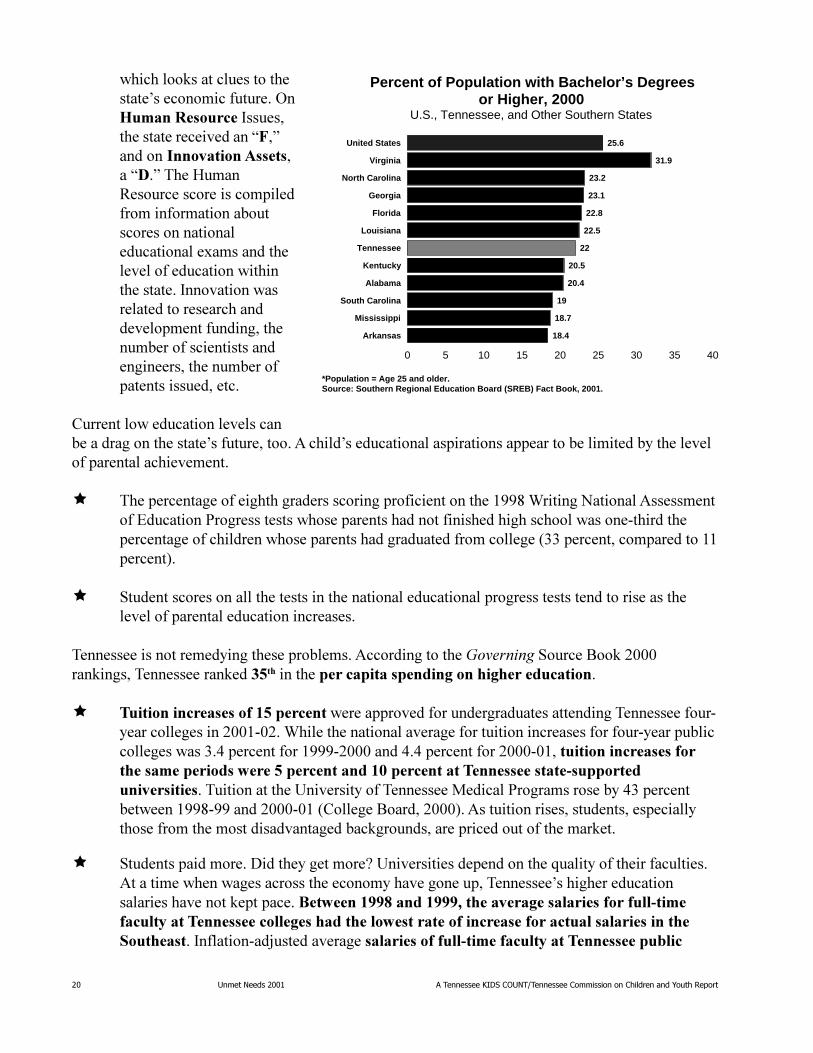
Percent of Population with Bachelor’s Degrees or Higher, 2000
U.S., Tennessee, and Other Southern States
*Population = Age 25 and older.Source: Southern Regional Education Board (SREB) Fact Book, 2001.
25.6
31.9
23.2
23.1
22.8
22.5
22
20.5
20.4
19
18.7
18.4
United States
Virginia
North Carolina
Georgia
Florida
Louisiana
Tennessee
Kentucky
Alabama
South Carolina
Mississippi
Arkansas
0 5 10 15 20 25 30 35 40
�������������� ����������������������������������������������������������������� �
����(�������������������+��,�$������ ������������������������ �����/����������������������'�������� ��������������� ������� ����������G�������
� ����6�������� ������ ���� ��� �������2� ��� ����������������������� �����2�/�3�������"�����A�����$%%����� ��������� ���������� ���� ��� � ������������������7���� �����������2� ��� ������I �� � ���������2� ��� ������3�����0���� ������0�����( �������� ��� � �� ��I �� � ������� ��@��� ������2� ��� ���������� �����������)������ �)�������������� ���������2'.�
� ,���55?���"������ �����9����� ����������� ������ ������������������������������� ������� ����������%��������� ���)��������� �����+�� ����;%������ �4��� ���������������������������� ������� ���+������������������������������������������������������� �� �������� �
� )������������ ���������������������� ���� ���� ������ �������������������� �� �� �������������������0������������������� ����������� ���������������������������+�������������������������������������������� ���������������������������������������� �������������<�����.������ ������4�=�����4�9�� ��4�8����4�>� �����4�?����� 4� �&������������������������� �������+�������������� ���+��������� ������(�� ���4������(+����������������������������
,����� � ������ ��� ���������� ������������ ������������ ������������ ��������� ��� ������� ���� ��� �������� � ������ � ��� ���������������������� ��� ������������ �������������
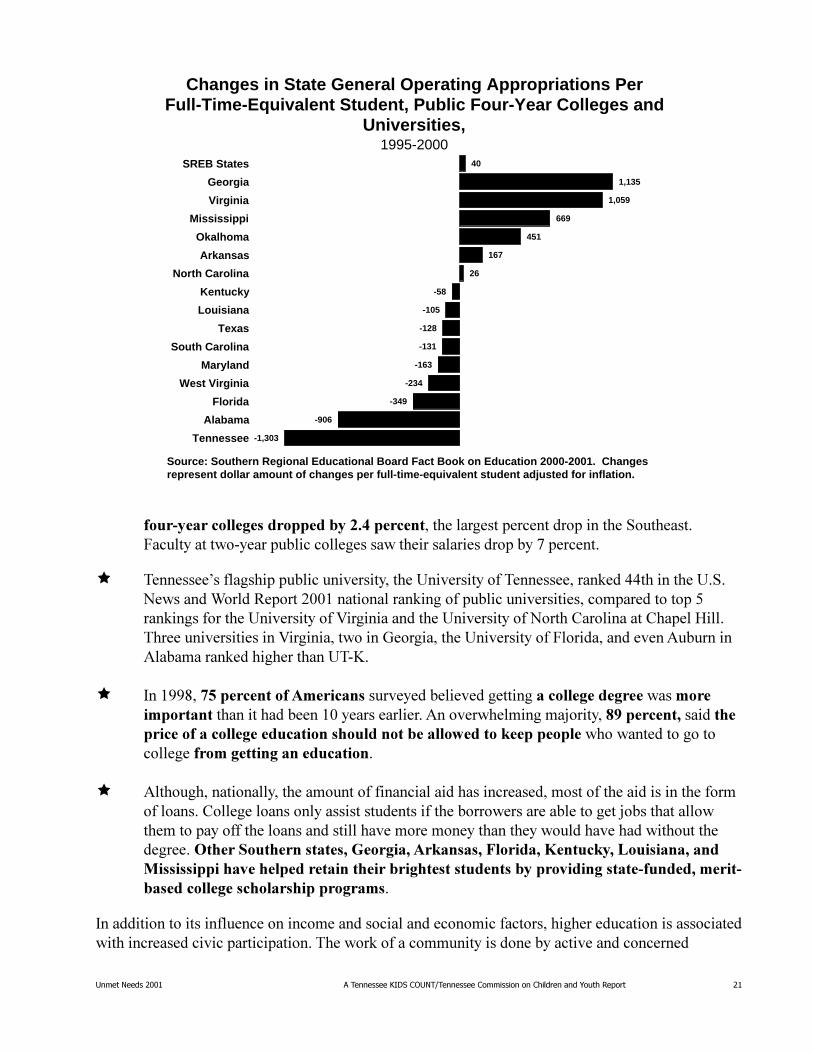
Changes in State General Operating Appropriations Per Full-Time-Equivalent Student, Public Four-Year Colleges and
Universities,1995-2000
Source: Southern Regional Educational Board Fact Book on Education 2000-2001. Changes represent dollar amount of changes per full-time-equivalent student adjusted for inflation.
40
1,135
1,059
669
451
167
26
-58
-105
-128
-131
-163
-234
-349
-906
-1,303
SREB States
Georgia
Virginia
Mississippi
Okalhoma
Arkansas
North Carolina
Kentucky
Louisiana
Texas
South Carolina
Maryland
West Virginia
Florida
Alabama
Tennessee
�������������� �����������������������������������������������������������������
� � B����#����� �� ������� B�� ��������� � ��� ��� �������� ������ ����� � � ������ ��������������� � ������� � � ������� ��� �������� ���������
� �����������"#��� �������� ��� ������ � ��� ��� ������55?�*� ������� ������� �����������$������������������6����� ������������� ��������
� ��,��� ��������"���6��:�� ���A�����������������$@������ ��������� ��������
���������� � ��;���� �������������������6���������������� ����� ������� ������ � ��� ����������������������������� ������ � ������� ��
,����� ����� ���������������������������������6��������)��:�� ����C ���0� ����������� ��D8����� ����������������� �� ���� �� ����������������� �� ���'�� ��������������>��7��� �� ����������� ������������E� ���0������6��0�� �����# ����� ���������������������������� ������������ ���� ����������������6��D� ��������� ��������� �������������� ����E
��������������� ��������������
����������������� ������� ������ �������������������� �������� �����������������������������
���� ����������� ������� ����������������������� ��������������������������������� ��������������������������������������������������������� �������������� �������� ��������������������������������������� ����������������� ������� �������������������������������������
������������������������ ����������
�� �������������������� ��� ������������������� ���������������������� ���������� �������������� ���������������������������� �������������� !�"������������� ��������������������#����������������������������$����������������� ���� ������������%�������%��������������"������������#���&�����%��������������%������ ���� �������������������� �������������������������� $������ ���� ����������&���������'��������������������� ����(�� ����������������������������������������������������� ������������������������������������������������������������)�� ��� ����*������ ����������������������� ��������������� ������������������������������+����������������������������
���������+���������� ��������������������������������������� ��������������������������&��������$������������������������������������������������
����������� �������������������������������������������������� ����� ���������������������������� ������������������������������������������� �������
���� ����������������!����"��#$$%
�������������� �����������������������������������������������������������������
,��+���������������������������� �������������������������� ������� �������������������� ������������������������������������������������������������������� �������������,��������� ���������������������� ������� ���������� � �������������� ��� ���
2���������������� ��������������������������������������������������6�������������������������� ������������� ������������������������ ��,��������� ������� ���������������������������������� ����������������)�����)������
�������������������� ������������������������ ������������� ���������������� ����� ��� ������� (+������� ���4������ ��/�+��������� ����������������,���������������� ������� � ��������������� ���������� ������ � ��������� ��������� ��������������� ��� ����������� � ������������ �������� ���,������������������������������ �� ���������������������$%�� �������� �������������� ������������� ���� �������������������2�/�� ����������0��������555&�
�������������������� ��������������������������������������������������������� ����������������������������������� � ���������������������������������������������������������� ��������
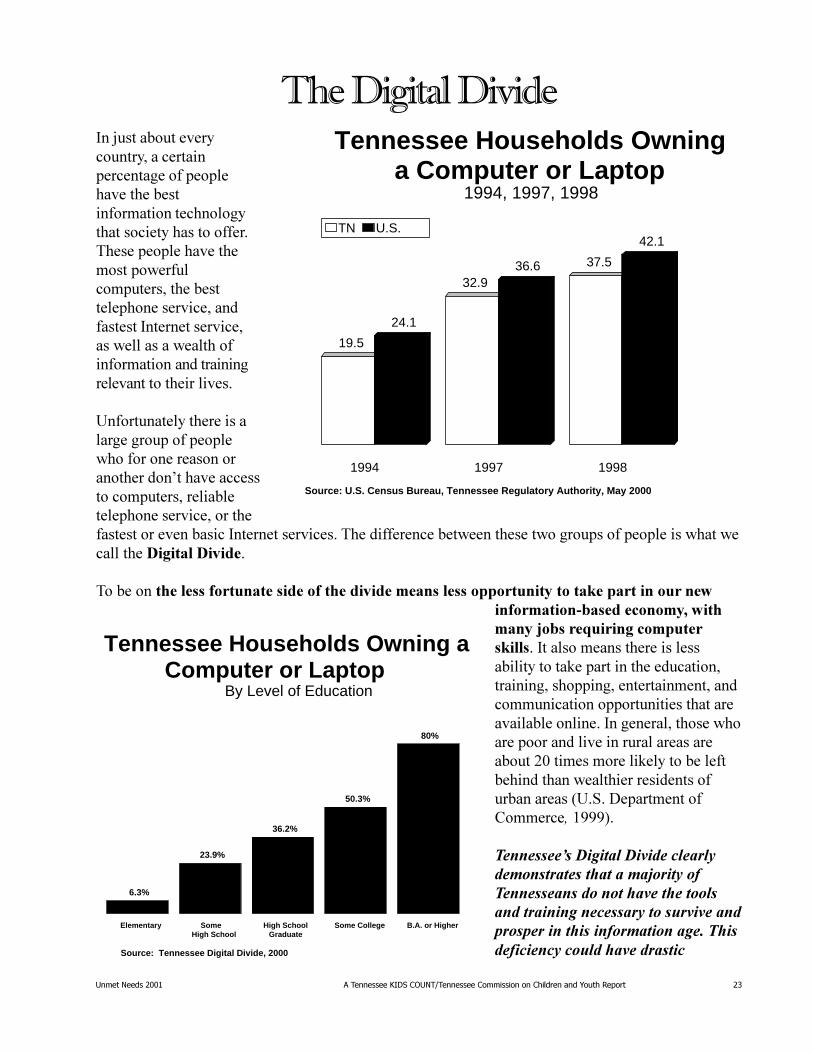
Tennessee Households Owning a Computer or Laptop
By Level of Education
Source: Tennessee Digital Divide, 2000
6.3%
23.9%
36.2%
50.3%
80%
Elementary Some High School
High School Graduate
Some College B.A. or Higher
������������������Tennessee Households Owning
a Computer or Laptop1994, 1997, 1998
Source: U.S. Census Bureau, Tennessee Regulatory Authority, May 2000
19.5
32.9
37.5
24.1
36.6
42.1
1994 1997 1998
TN U.S.
! �������������� �����������������������������������������������������������������
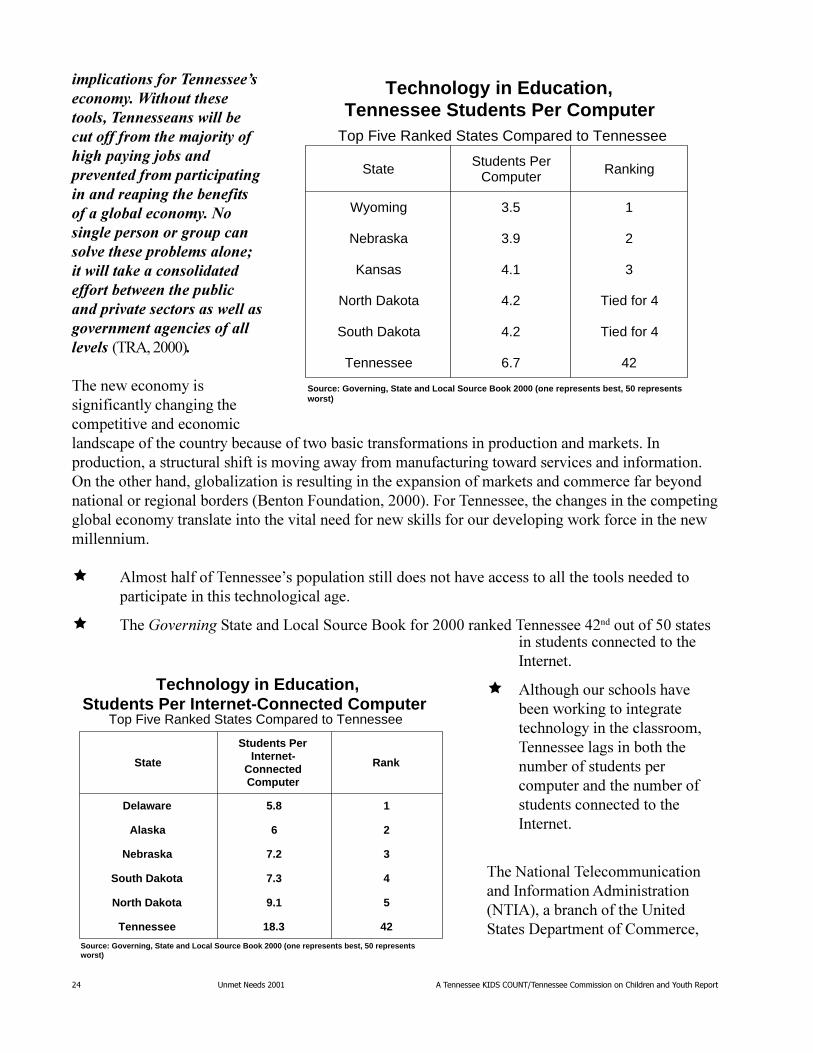
Technology in Education,Tennessee Students Per Computer
Top Five Ranked States Compared to Tennessee
Source: Governing, State and Local Source Book 2000 (one represents best, 50 represents worst)
State Students Per Computer Ranking
Wyoming 3.5 1
Nebraska 3.9 2
Kansas 4.1 3
North Dakota 4.2 Tied for 4
South Dakota 4.2 Tied for 4
Tennessee 6.7 42
Technology in Education,Students Per Internet-Connected Computer
Top Five Ranked States Compared to Tennessee
Source: Governing, State and Local Source Book 2000 (one represents best, 50 represents worst)
State
Students Per Internet-
Connected Computer
Rank
Delaware 5.8 1
Alaska 6 2
Nebraska 7.2 3
South Dakota 7.3 4
North Dakota 9.1 5
Tennessee 18.3 42
��������������������������������������������������������������������������������������������������������������������� ��������������������������������������������������������������������������������������������� ������������������������������ �������������������������������������������� ��������������������� ����������������������� �����A)��$%%%&�
������������ �� �� � ������������ ���������� � ����������� ���������������������������������������� ������������� ���� ��������� ���������������,�������� ������������������� ��� ����� ����������������������� ������������� ������� ������� ���1���������������������� B�� ��� ������� ��� �����;���� ������������������������������������ ���������� �������������C������������ ����$%%%&���������������������� ���������� ������������������������� �������� ���������������� ����������������� ������������� �������� ���� ���
� )������������������6��������� ����� ����������������������������������������������� � ���� ���� ���������� �������
� ������������/��������!�����/�����C��������$%%%�������������$����������7%������ �����������������������,������
� )������������������������������ ������ ���������������� ������������������������� ������������������������������������������������������������������������,������
��3�� ������������ ��� ������,������� ���)�� � ����� ���3,)&�����������������2� ��/����� �����������0������
�������������� ����������������������������������������������������������������� "
������������������������� ������ �� ����55������������������� �����������������,���������3,)6�������� � ����� � ��������� �!!����"��#�"��"���$���%�������"��������!�����&��������������������D������������)�� ��������������������� ��6�� ������� ��� ������������� ����� ���E
3����������� �����6��������� ����������� � ����� � ���� ���; ��������� ������������ ������������ �� �������� ���&� �������4���� ���������� �4����������������4� ������� ������ ��(��� �����������4������������ �������������� ������������� ���������4������ ������������������������������ ������� ���������A��3,)��555&�
,��� �������������� ��������� �����������A���������)����� ����A)&��������������� ��������������� ������������������������� �����������2� ��������������������������5%%���������������������0�����C����6�� ������55?��#������'�(#!�������#���)�����A)���� ��������������� �� ������������ ���������������� ������,��������������� � ����������������������� ������������������� �� ����������������������� �������� ������������������� �������������������������� ����������� ������'����A)��$%%%&�
��������*��+������!�����&��E����� ����������A)� ��$%%%��������������� � �� ������������ ��� ���������������� �������
� )���������������������� �� ������������������� ����55��������4G�7����������������������������������������������������������,������
� 0������������� ��� ������ ��������������������� ���������������� ��������%��������������� ��� �����������A)��$%%%&�
1������������������ ���������������������������� ��� ������� ����� ����������������������������� ��������������������������������������������������� ����� ����������������� ������������ �������������������� ����������� ��� ��������� ������'� �� ��� ������ � ��� �� ���� � ������������� ����������� �
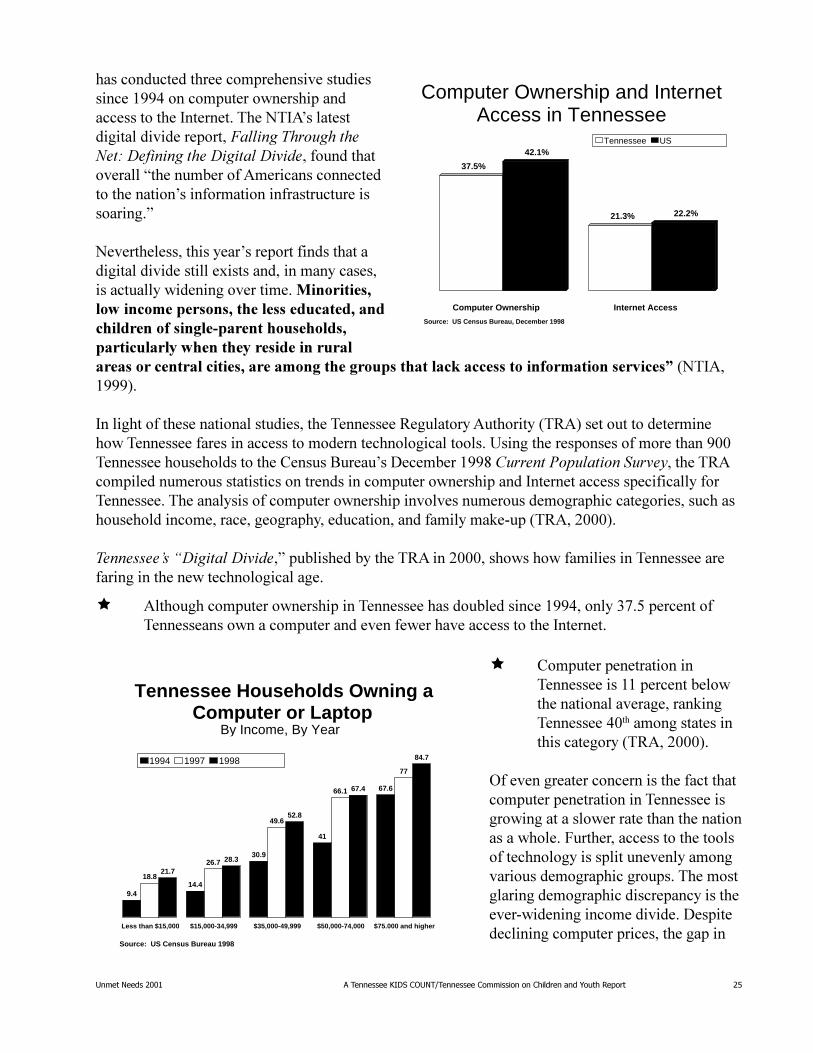
Computer Ownership and Internet Access in Tennessee
Source: US Census Bureau, December 1998
37.5%
21.3%
42.1%
22.2%
Computer Ownership Internet Access
Tennessee US
Tennessee Households Owning a Computer or Laptop
By Income, By Year
Source: US Census Bureau 1998
9.414.4
30.9
41
67.6
18.8
26.7
49.6
66.1
77
21.7
28.3
52.8
67.4
84.7
Less than $15,000 $15,000-34,999 $35,000-49,999 $50,000-74,000 $75.000 and higher
1994 1997 1998
# �������������� �����������������������������������������������������������������
�������������� ����������������������� ���������� �����������������>G7�%%%��������������� ���������� ���������>�7�%%%�������� �����������4�������������55G������55?�A)��$%%%&�
<������� �� �������� �����3��)�����)������� ����!
� ������������������ ������������>G7�%%%������������������� �������� ������������������������������������������� ���>�7�%%%����������������� �������� �������������������������������������� ��������>�7�%%%�����>47�%%%����������
� !���� �������������������� �����������������������,����������� ������������������
� "� ����������������� ������ ����������������������������6��)�� ���')�� �������������������� ���������������� �������)�� ���')�� �����������������"� ������������ ������$%������������������ ���55G�
� 9�� �������������� � ��������� ���"4###� ��4���������� �������� �+�������� ���� ������������ ������ ������"� ����������������)�� ���')�� �������������������� ������� ��������������� ��� ���� ���������� �������������������� �����
� < ��� �(����������� �����3������������ ����� ������������������������������������ �� ������������������������� ������������������������ ���C�����55G������55?������������������$%�������
� ������ ���������������� ������� ���'� ������������������������������������� ����������$?�������������55G������55?�
� ��'���������������� ������������ ������ ������������������������ �������������������
"��� ���� �� �����������������-�)����� �������������������������C������������ ����������� ��;���� ��������� ������� ��������������,&� ��������������������� ��� �����'������������������������������������������������������������������������������� ��������� ���������� �������)������ �����*���������������������+��,##@����� ��+��������������� �� ����� ������ ��������������+��--$������ �� ������ ��+�������������� �������� ������+��-#2������ ���8�������������������)�� ��������� ���� �� ���������� � ��������� � ����������� �������������������� ���������������� �����������,������� �����������)���� �� ������)�� ����,))&��� ���������������������������,������������� ����� ��������������������������� �� ���������� ����������������������������������������������������������������� ���&�� ����������F�� �� ����� ������������)���������� ����������������������$����0������"��������0��� �� �������2� ���/���������������� ��� ������������������������������������������,� ������������� ������ ��� �������� � �����

�������������� ����������������������������������������������������������������� $
��������������������������������������
% �������������� �����������������������������������������������������������������
�-%%$��� *����������� �����3��&�������������������� ������������������� ��������������� ������������������� �&�������
�� ��������� � � ���������0������������������� ���������������#� �� �'� � ���� ���������������������� ����������� ������������������#� �� �'� � ������������� ������������������������� ����������� � �� ����������
������� ���������� �� ����������������� ����������������������������������� *��4�����������������+��� ������������ ���-%%$��)������������������0����������������������� ��������������� ���������������������� ����554��������� �� �������������������������� �������� ����������������������F'�����/�������!� ���� ��0���������� ������� � �����#� �� ��(����/�� ���
� ��0��������������� ����� ���������������������������� ������� ���������������
��� *���� �+��� ������!
� ,������������� �� ������������� ������ ����� ���������������� ������������ ������ ������������ ���� B�� ����
� 8��������� ���������� �������������������� ��� � � �������������8���������:� �� �/��� ���� ����� ���������������8:/ &��*� ������
� ,�����������������������������
� 8��������� ������� ������ ��������������������������
)����� ���������0� ����6�� ����������������������������������������� ������� ���� ��������������������������������*����� � �������������4�������4� ���������� ���������������� ��������H���� �������� ����������������� ��������� ���� ���������������������������� ���0�������� ��� �������� ������������<
� #�������������� ������� ��������������������� �������
� ���� ������� ����������������������������
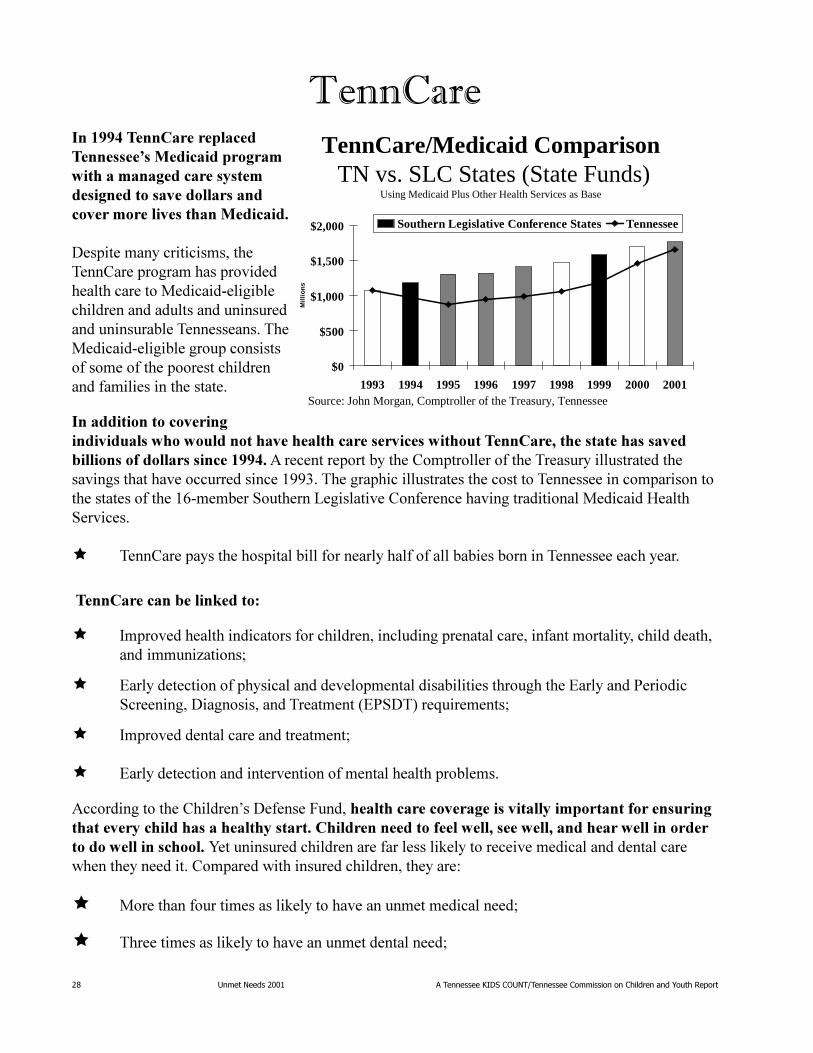
���� ��TennCare/Medicaid Comparison
TN vs. SLC States (State Funds)Using Medicaid Plus Other Health Services as Base
$0
$500
$1,000
$1,500
$2,000
1993 1994 1995 1996 1997 1998 1999 2000 2001
Mil
lio
ns
Southern Legislative Conference States Tennessee
Source: John Morgan, Comptroller of the Treasury, Tennessee
�������������� ����������������������������������������������������������������� &
� #������������� ������� ����������� ����������� �� ����� ��� ���
� )�������� ������ ��������������������������� � ��������0� ����6�� ����������$%%%&�
2� �������� ������������ ��������������� �����������+�� �������� �������� ������ ���������������� �������� �������� ������ �������� ������ ���� �������������������������� ����������#�������������� ��� B���������������������������������������������������������������������� ������������������������ ���� ����
� 0� ������ ����������� ��������������������������0� ������ �� ��� ��������� ����� ����� ������������������������������������2� �������� ��������$7������������ �������� ���������������� �����������������������0� ����6�� ����������$%%%&�
� 1�� �������������������������� ��� ���� �������� ������������������ � ����������������� ������������������������������������������ ��� ����������0� ����6�� ���������$%%%&�
� ,���� ��� ���� ����6�������������������������1�������������������������������� �������������������������� �������� ������������ ������� ������������� ���������6��� ������������������ ������������������8������������� � �������������G%���������� ����������6����;�������������������>�4�� �� ��� ���55F��0� ����6�� ���������$%%%&�
A���������2� ��� ��������������������������������0����� � �������������'������� ;��� ��������������7�%%%����������������������������������� ����554��/��������� �� ���� �����<
� ���� ���������������� ������ ���������������������7$�$4$� ���554����4?G�7?� ���555����������������4�������
� G������������������������� ���������������������������+����������������������� �������� ������������� ����������������� ��
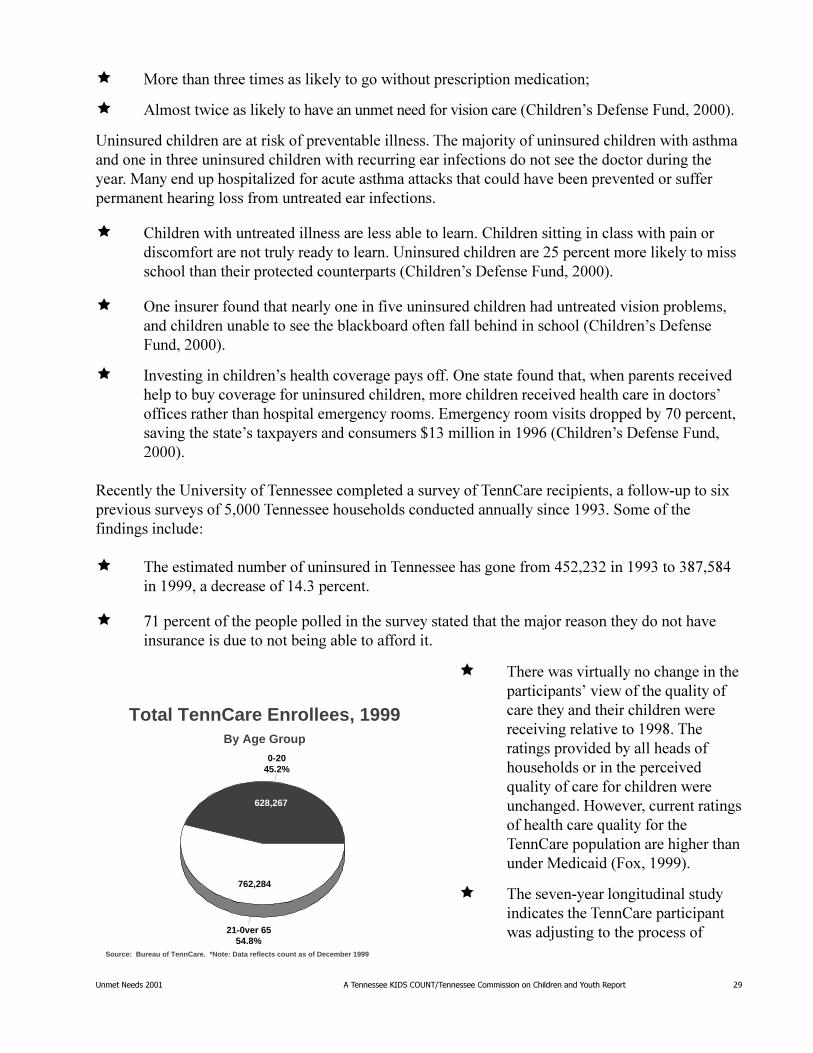
Total TennCare Enrollees, 1999By Age Group
Source: Bureau of TennCare. *Note: Data reflects count as of December 1999
0-2045.2%
21-0ver 6554.8%
628,267
762,284
� �������� ����������������� �������� � �����6�� ��������*��� ������������������� ���� ��������� � ������� ������55?������ �������� ������������������������������ �������� ��*��� ���������������� �����������������(���������������� ����������������*��� �����������0���������� ������� �������������#� �� �����;���555&�
� �����'�������� ��� ��������� �� ����������0������� � ����������+��� ������������������
� �������������� �����������������������������������������������������������������
Bled
soe
Hamilt
on
Ben
ton
Lake
Obion
Gibson
Tipton
Lauderdale
Dyer
Weakley
Shelby
Crockett
Haywood
McNairy
Davidson
Knox
Fayette Hardeman
Madison
Chester
Henderson
Hardin
Dec
atur
Henry
Carroll
Stewart
Houston
Mont-gomery
Robertson
Hum
phre
ys Dickson
Che
atha
m
Hickman
Perry
Williamson
Sumner
Wilson
Rutherford
LewisMaury
Mar
shal
l
Wayne LawrenceGiles Lincoln
CoffeeBedford
Trous.
Moo
re
MarionFranklin
Bra
dley
McMinnGrundy Mei
gs
Polk
Macon
OvertonJackson
Smith
Clay Pickett
Fentress
DeKalb
Putnam
Cannon
Wash-ington
Warren
WhiteCumberland
RheaVan
Buren
Scott CampbellClaiborne Hancock
John
son
Hawkins
Carter
UnicoiGreene
Cocke
SevierBlount
Monroe
Loudon
Roane
Morgan
Anderson
Union
GraingerHamblen
Jefferson
Sullivan
Ham
ilton
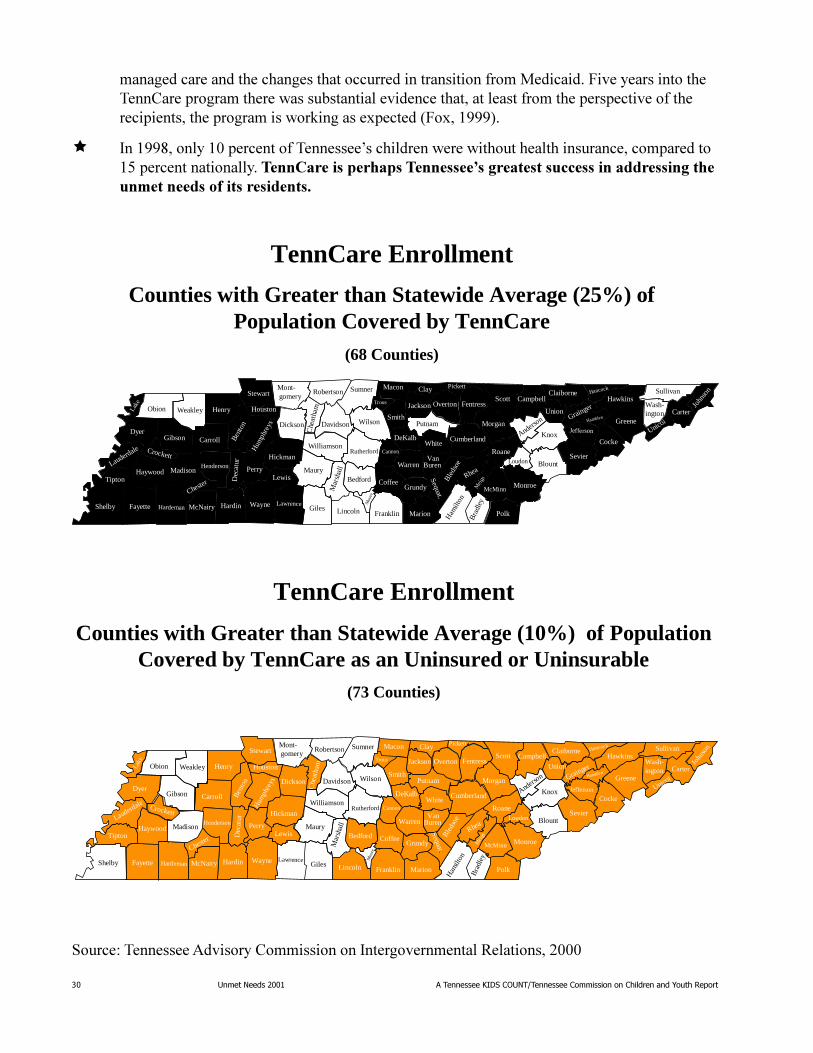
TennCare Enrollment
Counties with Greater than Statewide Average (10%) of Population Covered by TennCare as an Uninsured or Uninsurable
(73 Counties)
Sequat.
/����<������)�� �����0��� �� ������,��������������A��� �����$%%%
Crockett
Rhea
Hamilt
on
Ben
ton
Lake
Obion
Gibson
Tipton
Lauderdale
Dyer
Weakley
Shelby
Haywood
McNairy
Davidson
Knox
Fayette Hardeman
Madison
Chester
Henderson
Hardin
Dec
atur
Henry
Carroll
Stewart
Houston
Mont-gomery
Robertson
Hum
phre
ys Dickson
Che
atha
m
Hickman
Perry
Williamson
Sumner
Wilson
Rutherford
LewisMaury
Mar
shal
l
Wayne LawrenceGiles Lincoln
CoffeeBedford
Trous.
Moo
re
MarionFranklin
Bra
dley
McMinn
Sequat.
Grundy Mei
gs
Polk
Macon
OvertonJackson
Smith
Clay Pickett
Fentress
DeKalb
Putnam
Cannon
Wash-ington
Warren
WhiteCumberland
Ble
dsoe
Van Buren
Scott CampbellClaiborne Hancock
John
son
Hawkins
Carter
UnicoiGreene
Cocke
SevierBlount
Monroe
Loudon
Roane
Morgan
Anderson
UnionGrainger
Hamblen
Jefferson
Sullivan
Ham
ilton
TennCare Enrollment
Counties with Greater than Statewide Average (25%) of Population Covered by TennCare
(68 Counties)
�������������������������������������� ������� � ��������#� �� ���� ������� ��������0��������������������������� ���� �������������������������������� ��������� � ���������������� ������ ������;��������;���555&�
� ,���55?��������%��������������6���� ��������� ������������ ��������������������7���������� ���������� *��������������� �����3������������������� �������� ������ ���� ������������������ ���
�������������� ����������������������������������������������������������������� �
�� ������6�������� ��;��� ��� ����������������� ��������� � B���������� �� ����������� �� ������� ���������������� � ��� ������ ��������
� ��&������
� )��������� ������� ����������������������� ������ ��47����������� �������� ���������� ������� ��������� ��� ����� ��������������� ������� �������
� ,���55?��)�� ���')�� ���� ������������ �����I�������/��������� ������ �������� � ��� ��� ������������ �������"� �� �������
� ,���55?��F47�������� ������ ������������������� ��� ����� �������
,������������ ������������������ ����� ������ ������������ ������ � ���� ���������� ����������� � ��� ���� ��������������������� ���������������������������� ��������������� ��� ������������ ������������������� � ��� ������������������
?��(:�����������
� ����� ������������������������������������ ������������ ������� ���55?�������� ��������������'� ����� ������ ������������7�7������������ ���&������ ����������� ���7������������ �������������
� ������� �����������(����������������� ���55?�)�� ���')�� ���� ����������� ������ �������5�� ��&�������������������'� ����� ���������������"� �� �������
,��=����$%%%���������� �����������(��������� �������&�����,��-����"�.���"������� � ���� ����������������5?%������55G��� ������������������������������������'� ���'� ����� ��������� ��������%��������������������G��������� ����� ��� �������������� �����������"� ��� � ������������� ������������ �����������6�� ������D ������������������ ������ ��������������������'� ���'� ������� ��E��!���� ���������� �������������������� ������������������������ �� � ������� �������������� �����������������������'� ���'� ������� ���4�7������&������������������ ������������������ ��� ������ ���� �������������'���� ��������� ��������
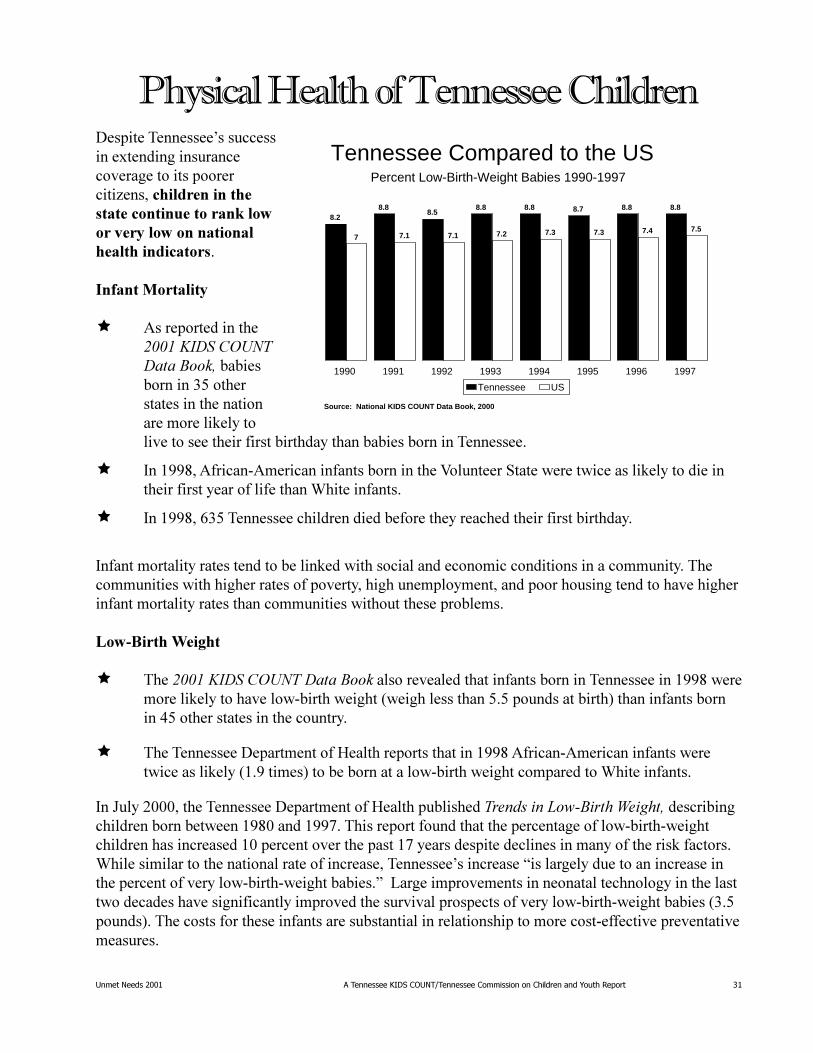
�������������������������� ������Tennessee Compared to the US
Percent Low-Birth-Weight Babies 1990-1997
Source: National KIDS COUNT Data Book, 2000
8.28.8
8.58.8 8.8 8.7 8.8 8.8
7 7.1 7.1 7.2 7.3 7.3 7.4 7.5
1990 1991 1992 1993 1994 1995 1996 1997
Tennessee US

�������������� �����������������������������������������������������������������
� )���������������������������)���������(�����0���:�� �������A������ �� ���������� ������������� ��� ����������������������������� ���'���� ���������� ����� �� �����������G7%������������G������������ �����>$G4�5%%&������������������������� ������� �� ���$�?���4�4���������>7?�%%%&��)���������(�����0���:�� �������A��������55?&�
� )�� ���� ���������$7%������������������������&�������� ���������� �����������������������>�$�%%%����>�F�%%%� ��� ���������� �����������������7%%������� ������ �� ������� ����������>$?�%%%� ����� ����
A��������������������'� ���'� ������� ���������� �������;�� ���� ��� � � ������������������������ ����� ����� ������ ������ � ���� ����� ��<
� ����� ���������
� � �����
� �������������
� ������� ��� � � ��
C�� ������������'� ����� ��������������������������� �� ���� ������� ���� ��� � � ������� ������������ ������ � � �������������
� A��� ������������������'� ���'� ������� �����������������G�������������������������� ���������������������$%%%�
� A����������������������������������� ����*����������������������������� ������� ��� ����������'� ����� ������� ��
� #��������������������� ���������������� ������������������ ��������������
.��������������� ���������������������������������������� ��� ����� ��+��������(+����(�������++���!
� .���� ��������� �������������������� ����������������������
� 2� ������������������ ����������������������������������������
� 0����������������������������� ���
*����)����7��
� ������� ������������������������������������� �������� ������������� ��4%�����������
� ���������%%�%%%��� ����������������� ���55G��4%�� ��
� 4�%��� �������������������� ��������� ����4������������������ �������

�������������� �����������������������������������������������������������������
� 3�� �������� ���55?������������������������������������� ������������� �������������� ��������� � ���������� � ��&����������� �������� �������!��������������� �� ������� ������� ������������6��������������������� �������55%��
� ����6������ �������������� ���55?������F�������� ��������������� �����������
� ,���55?��4%7��� ���������������������7������5� �������� �������� �����������
� #������� ������ �������������� ��������������������"� ���������� � ����������� ��������������������)�� ���')�� ��������
�������� ��������� ���������������������������� ������ ���������� �������������� �����������<
� I ����� ������ ���������������������������������� ���������� �� �������� � ��
� ,������ �������'����������������� �������� ���������� ��������������������� �����������
��� �B��� ��
� 1�����%������� ������������������ �������� ��������������������,���55?�����?4���������7'�G������ ����
� ����6������ ������������� ���55������������� ���� �������
� ������������� ���������������� �� �� �������?55��������������������������� �� ������������
A��� ��������������� �� ��������������������������������� ������������������������������������������������ ���������������+����� ����������������� ���������������0���*��������������� ���� ���������������� ����� � �����������������
� ���������������� �������� � ������������������� �������������������������������� ���������������;�� �������������������������� � �������� ���� ����
Source: W.F. Fox, Center for Business and Economic Research, UT Knoxville, September 1999. (One represents best, 50 represents worst)
�������������������� ����������������������
����������������� �������� ����
������������������������ ����
��������������� �������� ����
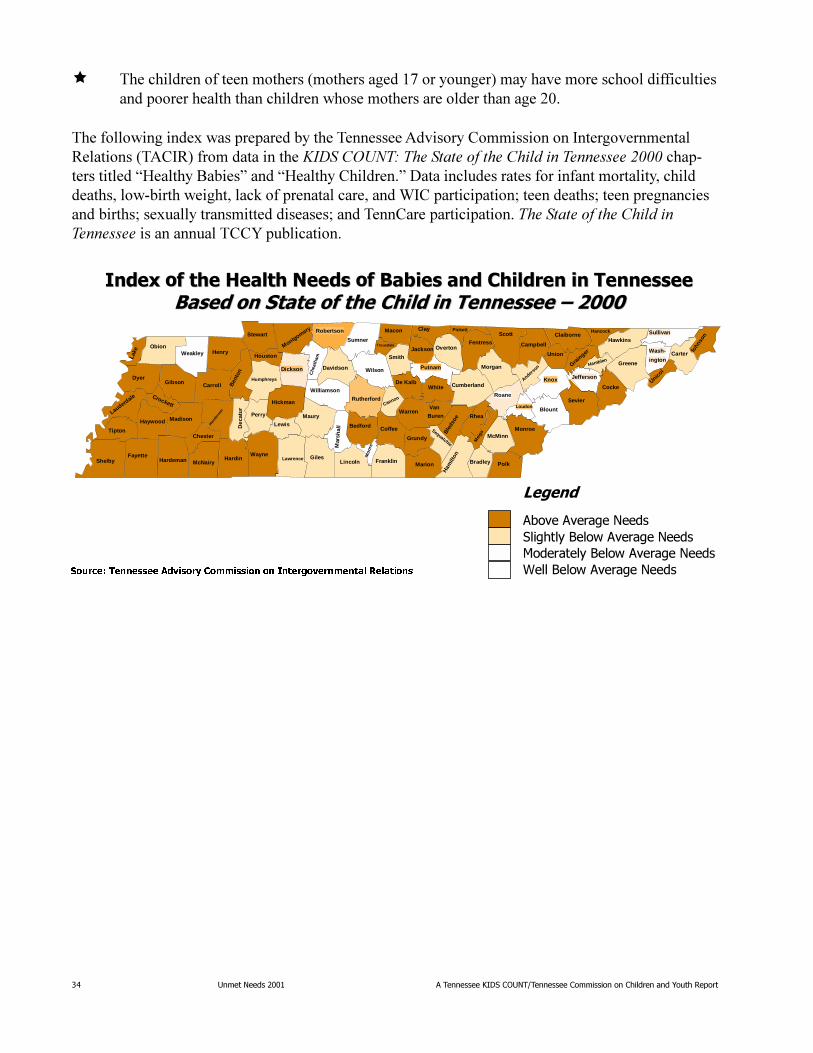
! �������������� �����������������������������������������������������������������
� ���� �������������������������������G����������&��������������������� �� ���� ������������������������ ���������������������������������$%�
�������������� ����������������������� ������������������������������� ����������������������� ����������������������������������� ������������������������������������ �������������������� ��������
Lake
ObionWeakley Henry
DyerGibson Carroll
Lauderdale Crockett
Madison
Hen
ders
on
Haywood
Tipton
ShelbyFayette
Hardeman
Chester
McNairy
Ben
ton
De
catu
r
HardinWayne
Perry
Humphreys
Houston
Stewart
Montgomery Robertson
Dickson
Hickman
Lewis
Lawrence GilesLincoln
Moo
re
Bedford
Maury
Mar
shal
l
Williamson
Rutherford
Che
atha
m
Davidson
Sumner
Wilson
FranklinMarion
Ham
ilton
Coffee
Grundy
SequatchieB
leds
oe
Van
Buren
Cannon
WhiteDe Kalb
Putnam
SmithJackson
Macon Clay
Trousdale OvertonFentress
ScottPickett
Campbell
Morgan
CumberlandAnder
son
Roane
Knox
Loudon
Monroe
PolkBradley
McMinn
Rhea
Mei
gs
ClaiborneHancock
HawkinsSullivan
Union
Grain
ger
Blount
Sevier
Jefferson
Cocke
GreeneHamblen
Wash-
ington
John
son
Carter
Unicoi
Warren
������
����������������� ��������������������������������������������������������������������������6RXUFH��7HQQHVVHH�$GYLVRU\�&RPPLVVLRQ�RQ�,QWHUJRYHUQPHQWDO�5HODWLRQV
�������� ��� ��;�����������������������)�� �����0��� �� ������,�������������A��� �����)0,A&����������� �������������$�"���������%��"���"�!&����������������������'����� ����D(������C�� �E�����D(������0� �����E� ���� ���������������� ������������ ������ ������������'� ����� ������������������������������",0����� � ��� ������������������������ ������ �������;������������ ����� ������������0������� � ��� ����"���������%��"���"�!&������������ ������������00H����� ��� ���

�������������� ����������������������������������������������������������������� "
����������������������������� ��
�����
# �������������� �����������������������������������������������������������������
)������������� �������������� ������� ������������ ����������� ����5?%�� �� ���� ���� �������� ����������5F%����������� ��������������5G%���@���� ����555&��,���� ����������������� ���� ��� ������ ��������������� ���� ����������� ���������������������������� �;���� ������-
� �� ��������������� ��� ��������������������� ��������������������� ��� ������� ���������������� ���������� ���� ����������������
� 0� ��������������������4��������� �������������������������������������������'��������������� ��������������������4�� �� ����������300:���55G&�
� C��������� ���������� � ���������������+��������� �������������������������C���+���� ���������� �� ��������������������������� ���������������0���������� ����� ����������������� � ��� ���������6����������������)�� ����������3����� � ���)3�&���������
� �� ���� �4�� ������4������ ��%$������ ������������������� ������������C�.������4�� �� ��22��� ��� ��
� 6����������������������������������������� ��������(�����������������+�������� � ������� � ������������������������������������� �� �������� ���� �������������������������������������������������������� ������������� ���������������������� ������� �������� ����������� ����������������������������������������(2 �$%%%&�
� ����������� ����������������������������� �������� ���������������� ����������������� ����������������������������� ������ � ������������������������� ���������(+�������� �������$%$������� ��4�� �����+������$-������ ������� �����
� ����������� ����������������������������������������������������� ���������������%������������������ ���������������4%������������ �� ������������ ��� ��>5�7%�����������?��������������������� � ���������)���������� ����������� � ��������������������������G�������������� ������� ����������������������'��������� ���������� ��������������"��� ����%����������������� � ���������������������������������������������>$FG��)����'��������� ����� � ��������; ����)3����������������������������������������>G%��3!,(0��$%%%&�
� :������ ����������������� �����������������������D���������������E�������������� ������������������ ����� ����� ���������������������������� ���������������� ����� ���'��������������������,�J������������ ����0� ����6�� �����������555&�
� 0���������������������������?%������������������ � �������������������� ����������� ��������'� ������'�������������� �B���� ���K�!�B����555&�
���� ������������
�������������� ����������������������������������������������������������������� $
� :������������� �� � �������������������� � ������ �������������� ��������������������������������� �������������������������������������������������/�������55G&�
� )����������������������������� ������������+����������������+������� �����������'�� �������'����+�������������������� ������� ��������������������������
� )������� ����������������������� ������� ������������������������������������������������������� ������� �������� ��������� ��������;��� ����������� ���D���� ����� ������������� ������������������������� ������� �������� ����� ������������� ���������� ������������������������ ����� ������������������������������������������ ����������� ���������������������;������� ����������������������������� ������������� �������� ������0��������� �� ���� ����������������������� ���������� � �� ����������������������� �� ���55F��������������>45�� �� ��E��/��������55G&�
� �� ������� ���$;����� ������"#�������� ������� ����������+� ������� ����1���# �� �� �� �����)������������������� ��������; ��������������� ����������� ��������� ��>�?7��>$������������������)��>���$%�������������6��)3�������� ������������������������������������������� ����������
� ,�����$%%��., /�0123����� ��������������������������������������� ��������������� ����� ���������� ��� ��� ���'�����������������)������4����������������� ������ �� ��� ���'������������������ �������� ����������� ��$G������������������������� ��������� ���������������� ����� ������ ��������� �����2� ��/������;������ ����������������� ����� ��� ���'����������������
� "�����������������5%����������� ���'����������������
� ���������������������������������+����� ��(�������� �����C�.�����$������� ���.� ������ ������������������������������ ������������� ����� ����
� ��������������� ���� ����� ���� ��������������� ���������������������� ������ �������������������� ��������������� �� ������57%���0�� �������������$%%%&�
� �� ������� ���"#���� ��������������� ������� ���< ��2������� ���������(���������������� ��� ��������������������������������� ���., /�0123� ����C���&�" ����������������������������� ������������������������������� ���� ���������������C������������ �������G������������������������������������������� ����� ��� ���'��������� � �������������� ��������� � ��� ����������,��� �������"���6��:�� ���A�������$%%%&�
� #� ��� ����� ������������� ���� ���� �����'��������� � �������� ���'��������� � ��)���K�@����������555&�
� '������������� ��(���������������������� ������+����������������� �D�� ����������� ������� ���������+�����������������
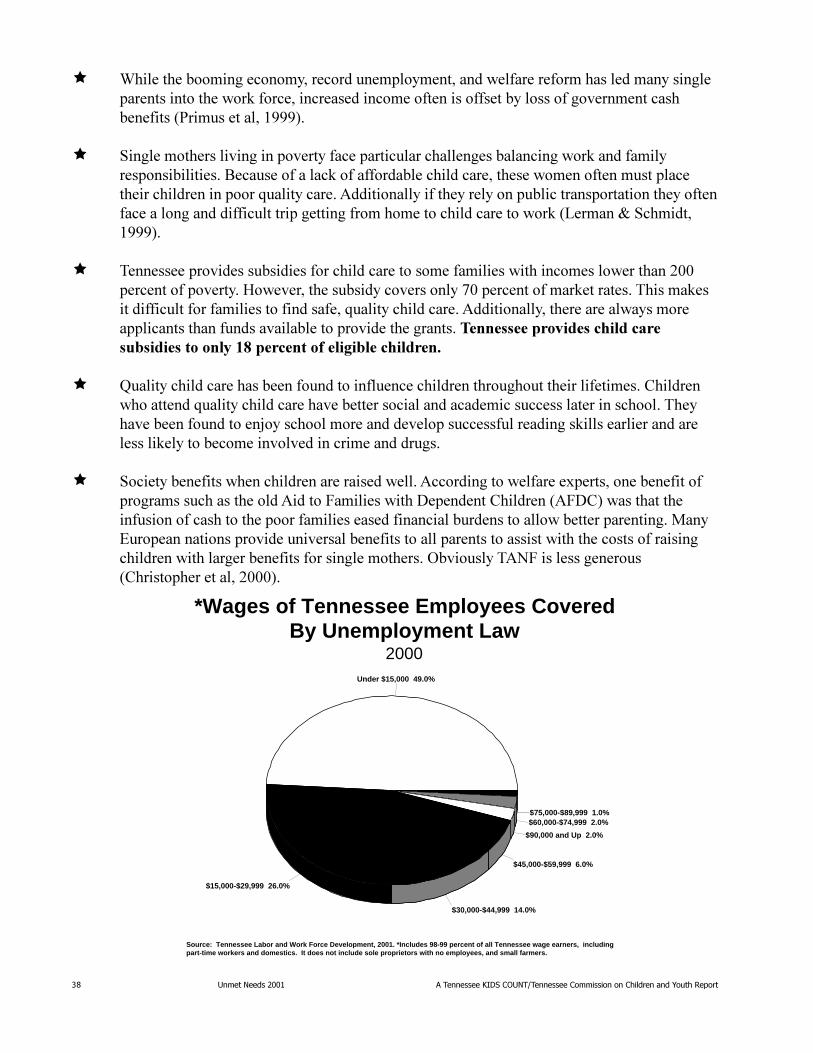
% �������������� �����������������������������������������������������������������
� "� ��������� ���������������������������������������������������������� ���������� ������������������ ������� ���������� ����������������������������������� ����:� �����������555&�
� / ������������ � ��� ����������������� ��������������������� ��������������� �������� � � � ���C������������������������������ ��������������������������������� ���� ����� �������*��� ��������)�� � ������� ����������������� ������������� ��������������������������� �� ������� ����� ����������������� ����������������!�����K�/��� ����555&�
� ��������� ������� � �������� ����������������� � ��� ��� ����������������$%%�����������������(������������� ��������������G%����������������������� ������ ��� �� ������������ � ������ ��������*��� ����� ��������)�� � ����������������������������� �������������������� ������������ ��������������� �������������������������+����������� ��-;������ ���������+�������� �
� J��� ����� ����������������������� ��������� ������������������ ��� �� ����0� ��������������*��� ����� ������������������� ������������ �������������� �����������������������������+������������������������������������� ����� ������� ������������� ������������ ������� ���� ������������
� /�� ������ ��������� ���������� ��������)����� ������������;������������ ����������������������������) �������� � ��� ��� ������0� ������)� 0&������������ ���� ������������������������� � ������� ���� ����������������������������� ����#���8���������� �������� ���� ��������� ����������������������� ���� ����������������� � ���� ������ ������������ �������� ������������1�� ������)3�� �������������0�� �������������$%%%&�
*Wages of Tennessee Employees Covered By Unemployment Law
2000
Source: Tennessee Labor and Work Force Development, 2001. *Includes 98-99 percent of all Tennessee wage earners, including part-time workers and domestics. It does not include sole proprietors with no employees, and small farmers.
Under $15,000 49.0%
$15,000-$29,999 26.0%
$30,000-$44,999 14.0%
$45,000-$59,999 6.0%
$90,000 and Up 2.0%
$60,000-$74,999 2.0%$75,000-$89,999 1.0%
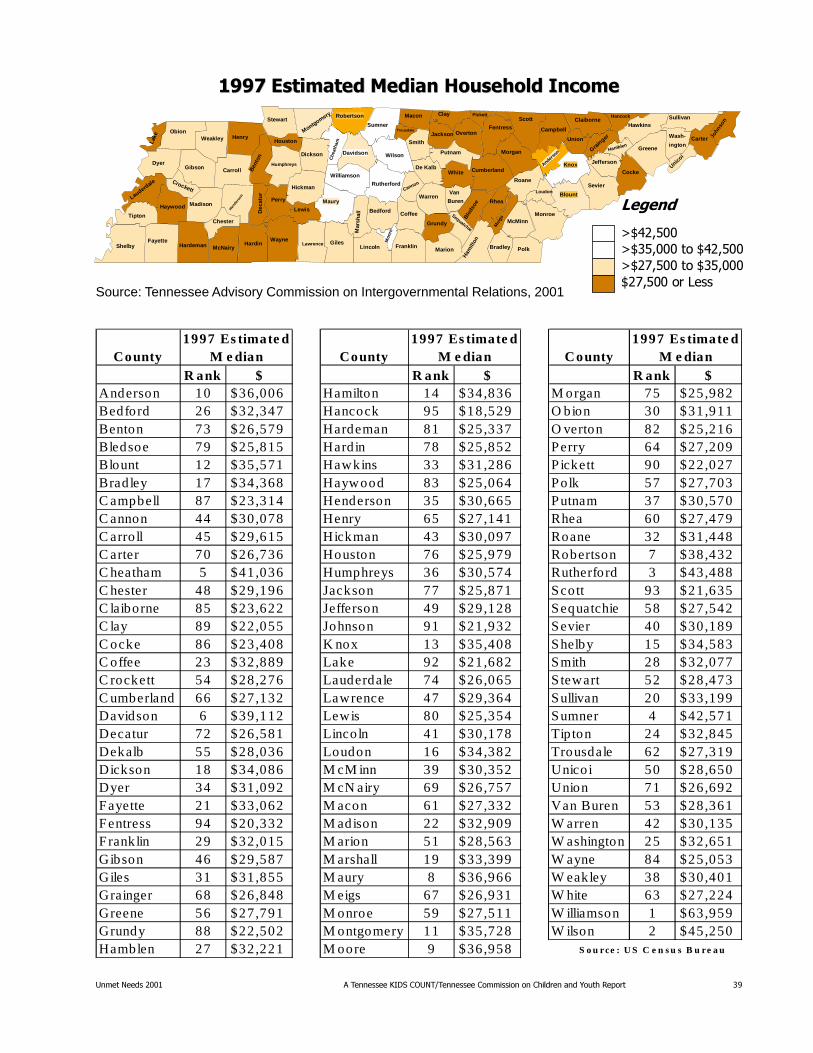
�������������� ����������������������������������������������������������������� &
������������� ��������������������������������� ��������������������
Lake
ObionWeakley Henry
DyerGibson Carroll
Lauderdale Crockett
Madison
Hende
rson
Haywood
Tipton
ShelbyFayette
Hardeman
Chester
McNairyB
ento
nD
ecat
ur
HardinWayne
Perry
Humphreys
Houston
Stewart
Montgomery Robertson
Dickson
Hickman
Lewis
Lawrence GilesLincoln
Moo
re
Bedford
Maury
Mar
shal
l
WilliamsonRutherford
Che
atha
m
Davidson
Sumner
Wilson
FranklinMarion
Ham
ilton
Coffee
Grundy
Sequatchie
Ble
dsoe
Van
Buren
Cannon
WhiteDe Kalb
Putnam
SmithJackson
Macon Clay
TrousdaleOverton
Fentress
ScottPickett
Campbell
Morgan
CumberlandAnder
son
Roane
Knox
Loudon
Monroe
PolkBradley
McMinn
Rhea
Mei
gs
ClaiborneHancock
HawkinsSullivan
Union
Grain
ger
Blount
Sevier
Jefferson
Cocke
GreeneHamblen
Wash-
ington
John
son
Carter
Unicoi
Warren
������
������������������������������������������������ ����
Source: Tennessee Advisory Commission on Intergovernmental Relations, 2001
County County CountyR ank $ R ank $ R ank $
Anderson 10 $36,006 Hamilton 14 $34,836 M organ 75 $25,982Bedford 26 $32,347 Hancock 95 $18,529 O bion 30 $31,911Benton 73 $26,579 Hardeman 81 $25,337 O verton 82 $25,216Bledsoe 79 $25,815 Hardin 78 $25,852 Perry 64 $27,209Blount 12 $35,571 Hawkins 33 $31,286 P ickett 90 $22,027Bradley 17 $34,368 Haywood 83 $25,064 Polk 57 $27,703C ampbell 87 $23,314 Henderson 35 $30,665 Putnam 37 $30,570C annon 44 $30,078 Henry 65 $27,141 Rhea 60 $27,479C arro ll 45 $29,615 Hickman 43 $30,097 Roane 32 $31,448C arter 70 $26,736 Houston 76 $25,979 Robertson 7 $38,432C heatham 5 $41,036 Humphreys 36 $30,574 Rutherford 3 $43,488C hester 48 $29,196 Jackson 77 $25,871 Scott 93 $21,635C laiborne 85 $23,622 Jefferson 49 $29,128 Sequatchie 58 $27,542C lay 89 $22,055 Johnson 91 $21,932 Sevier 40 $30,189C ocke 86 $23,408 K nox 13 $35,408 Shelby 15 $34,583C offee 23 $32,889 Lake 92 $21,682 Smith 28 $32,077C rockett 54 $28,276 Lauderdale 74 $26,065 S tewart 52 $28,473C umberland 66 $27,132 Lawrence 47 $29,364 Sullivan 20 $33,199Davidson 6 $39,112 Lewis 80 $25,354 Sumner 4 $42,571Decatur 72 $26,581 Lincoln 41 $30,178 Tipton 24 $32,845Dekalb 55 $28,036 Loudon 16 $34,382 Trousdale 62 $27,319Dickson 18 $34,086 M cM inn 39 $30,352 Unicoi 50 $28,650Dyer 34 $31,092 M cN airy 69 $26,757 Union 71 $26,692Fayette 21 $33,062 M acon 61 $27,332 Van Buren 53 $28,361Fentress 94 $20,332 M adison 22 $32,909 W arren 42 $30,135Franklin 29 $32,015 M arion 51 $28,563 W ashington 25 $32,651Gibson 46 $29,587 M arshall 19 $33,399 W ayne 84 $25,053Giles 31 $31,855 M aury 8 $36,966 W eakley 38 $30,401Grainger 68 $26,848 M eigs 67 $26,931 W hite 63 $27,224Greene 56 $27,791 M onroe 59 $27,511 W illiamson 1 $63,959Grundy 88 $22,502 M ontgomery 11 $35,728 W ilson 2 $45,250Hamblen 27 $32,221 M oore 9 $36,958 S o u rce : U S C e n s u s B u re a u
1997 Es timate d M e dian
1997 Es timate d M e dian
1997 Es timate d M e dian
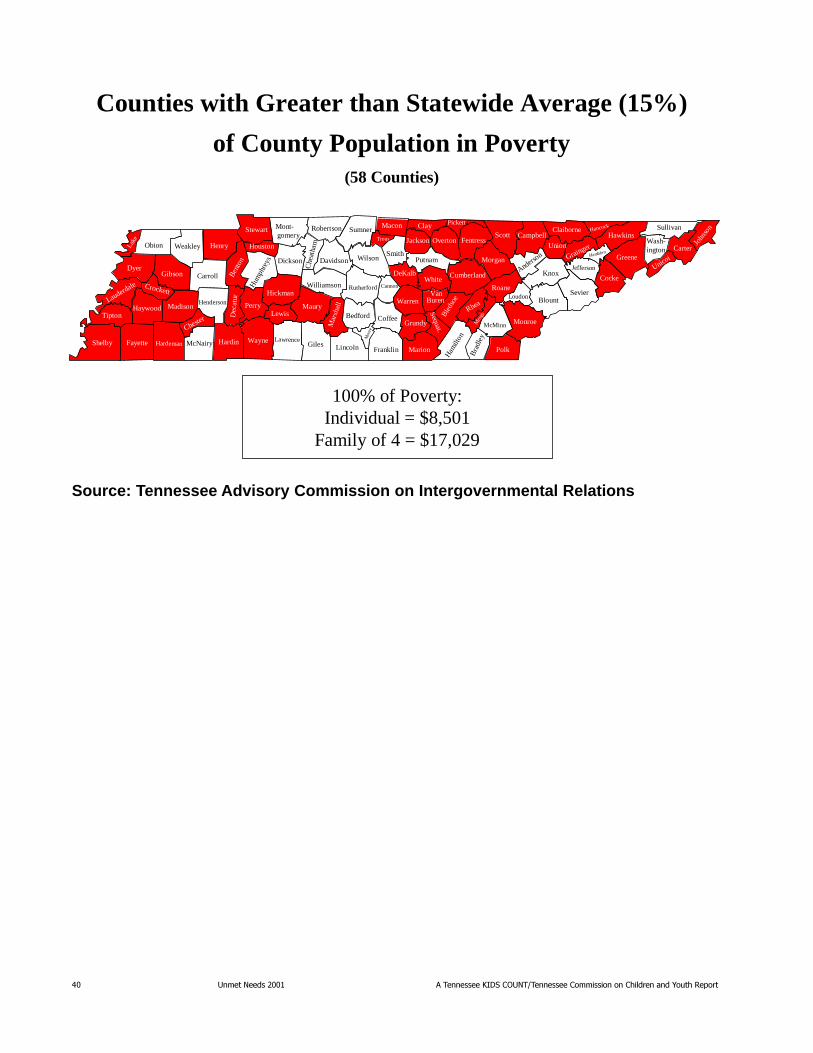
!� �������������� �����������������������������������������������������������������
Bled
soe
Dec
atur
GraingerHamblen
Ham
ilton
Ben
ton
Lake
Obion
Gibson
Tipton
Lauderdale
Dyer
Weakley
Shelby
Crockett
Haywood
McNairy
Davidson
Knox
Fayette Hardeman
Madison
Chester
Henderson
Hardin
Henry
Carroll
Stewart
Houston
Mont-gomery
Robertson
Hum
phre
ys Dickson
Che
atha
m
Hickman
Perry
Williamson
Sumner
Wilson
Rutherford
LewisMaury
Mar
shal
lWayne Lawrence
Giles Lincoln
CoffeeBedford
Trous.
Moo
re
MarionFranklin
Bra
dley
McMinnGrundy Mei
gs
Polk
Macon
OvertonJackson
Smith
Clay Pickett
Fentress
DeKalb
Putnam
Cannon
Wash-ington
Warren
WhiteCumberland
RheaVan
Buren
Scott CampbellClaiborne Hancock
John
son
Hawkins
Carter
UnicoiGreene
Cocke
SevierBlount
Monroe
LoudonRoane
MorganAnders
onUnion
Sullivan
Ham
ilton
Counties with Greater than Statewide Average (15%)
of County Population in Poverty(58 Counties)
Sequat.
Jefferson
100% of Poverty:Individual = $8,501
Family of 4 = $17,029
Source: Tennessee Advisory Commission on Intergovernmental Relations
�������������� ����������������������������������������������������������������� !�
8����� �� ������� ��������� ������6��� � B����������������������� �����������5��������� ������ ������������������� �������� � �� ���������<
� �5��������� ����������;����������� ���
� �5��������� ����;������� ��������������������������� �����@���� ����$%%%&�
� �����������6������������ �������������������� ���� � B��������� ��� �������� ����� ���������������������������������;�������
:����� ������������ ������������� �4��� ���� ����!
� �5��������� ��� ���������������� �������;��
� �?��� �������� �������;��� ������������ ���
1��������������� ����������� ���� ��������������������������� ������ ������ ������������������������������������� ������ ��������������������������������������������� �������� ����������� ����������� ����������������
8� �� ���� �����3������������ �� �������������������-%���� ��������4�� ������������$%��
� ���4�������� ����� ������� ��2�"�+��� �������������������������������������������������6��� � B���������
� 8����� ������������������������������������ ���������$���������������������
� "���������� ������)))��������� ���
� ,����� � ������������������������ ����������������������������� ���
� A����������� � �����������������������������������
8��������� ������������������� ��� ������������ ������������������������ ������� ������� ��� ������������<
� 8 ����������� ����;�������� ���
Source: W.F. Fox, Center for Business and Economic Research, UT Knoxville, September 1999. BEP represents Tennessee’s Better Education Program.
������������������� ��������������������
� ������������������������ ��������������!�
� "�����������������#���!�!����������$��������
� �!!�����%�&���� �����������������������������
� '������������������!����( )�*���+���)'������(������������������!�����,������&�������-��(����.���+�����!�����-
�������!������ ����������
! �������������� �����������������������������������������������������������������
� 3 ���� ����;�������������������������� �����
� � ��� �������� ����������;���������
� ��������� �������� ���������������� �� ����������������� ��������������E� �3�� �������� ������� ����������������&����������4�9+�4� �9�� ���� � � ����������������6���;��������������� ��"��� ����������������3���� ������� ��������
� ��������������� ����������������������������� ������������������������ ����6������(������ ���� ����������������������������������� � ���������,����������� �� ���������� ����������� ����������������������������������������������)����������������+�������������������������� ���������� ��� ����� ����� �������� ����/�� ������� ���������������������� ����������������� ������������������������� ��������������������������� �� ������8���������������������������������������� ��;���� ������� ����������� ������������� �������� �E�����������!
� 0��� �����������'��������� ���������������������� �������
� 0��� ���������(��������������������� ���������������
� 0��� ����������'����������� �����������������������%������
� !���'���������������������������������� ��� ���������������$%%?�
/�������� ��������� ������������������ ���� ������������������������������� �������� ��������� ��� ������������ ����������I�������/����
)������������6�������������������� ������������������������������ ���������������������� ����������������������������������������������7�7������&��������������������� ����� � ������� ��� ���������� ����� ��������������� ���������������������� �<
� $G��� �������������������
� 44��� �������� ����������� �����
������������ ���������������� ���24�22������� ����� ��� �������
Source: W.F. Fox, Center for Business and Economic Research, UT Knoxville, September 1999. PI stands for Personal Incom. (One represents best, 50 represents worst)
�������������������� �������������������������
��������������������������������� ���!"�#$$% &$��
������������������������ ��!"��#$$' &%��
������������������������ ��!"�#$$%� ��������������('��
������)������������������ �*�) +"�#$$% &,��
���������������*�)������-�.�� ���)+ &&��
�������������� &&��
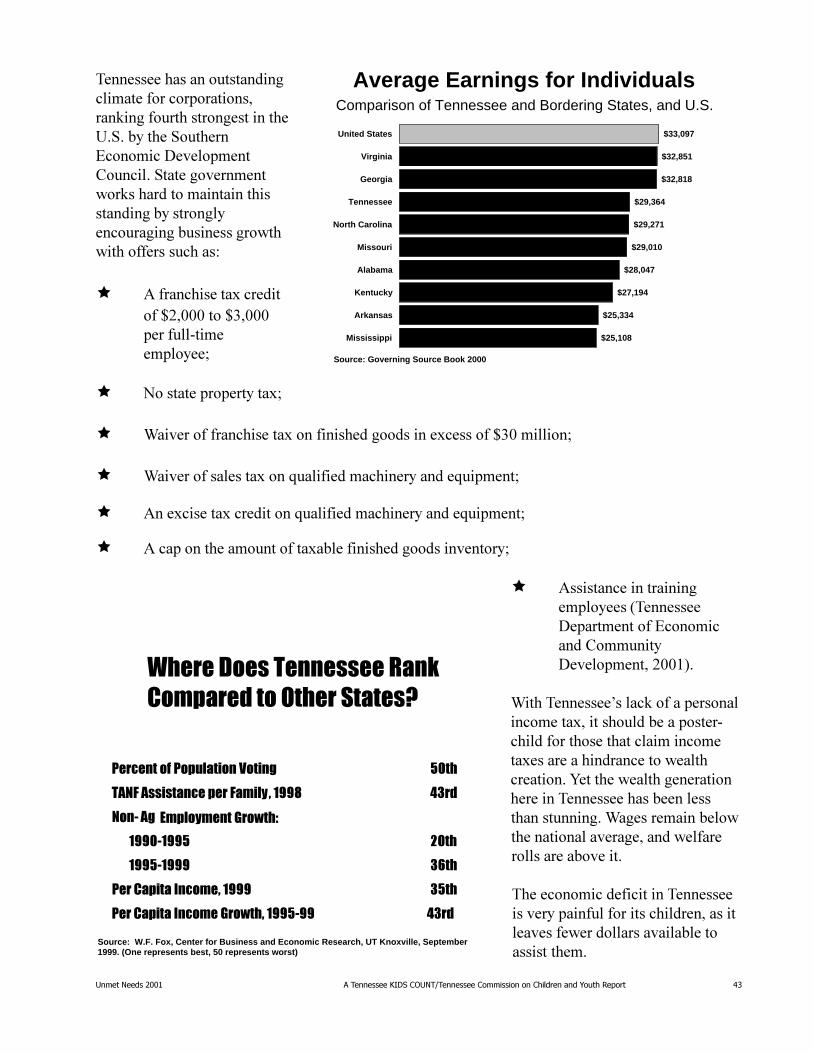
�������������� ����������������������������������������������������������������� !
�������������������� ���� ���������������� �������� ������������������� ����2�/��������/������8����� �� �������0���� ���/���������������������������� ��� ���� ������ ��������������������� ������ ����������� ����������������<
� )������� ����;���� ����>$�%%%����>4�%%%�������'� �������
� 3�����������������;�
� "� ������������ ����;����� � ���������� ��;�������>4%�� �� ���
� "� �������������;����*��� � ������ ��������*� �����
� )��;� ����;���� �����*��� � ������ ��������*� �����
� )�����������������������;����� � ���������� ��������
Average Earnings for IndividualsComparison of Tennessee and Bordering States, and U.S.
Source: Governing Source Book 2000
$33,097
$32,851
$32,818
$29,364
$29,271
$29,010
$28,047
$27,194
$25,334
$25,108
United States
Virginia
Georgia
Tennessee
North Carolina
Missouri
Alabama
Kentucky
Arkansas
Mississippi
Source: W.F. Fox, Center for Business and Economic Research, UT Knoxville, September 1999. (One represents best, 50 represents worst)
�������������������� ��������������������������
������������������������� ����
!"� �������������"����#$�%&&' ()��
!�* �� +����#����,��-��.
%&&�*%&&� /���
%&&�*%&&& )0��
�����������1����$�%&&& )���
�����������1�����,��-��$�%&&�*&& �������������� �()��
� )�� ������ ����� � �������������� �����������8����� �����0����� �� ���������$%%�&�
" �������6������������������� �������;�� ������������������'�� �������������������� �� ������;�������� ������������������� ����H���������������� ����� ��������������������������� ����"������� ������������ ����������������������������������� ��
������� ���� � �� ������ �������� ��������� ����� ��������� ��������������������� ���������� �������
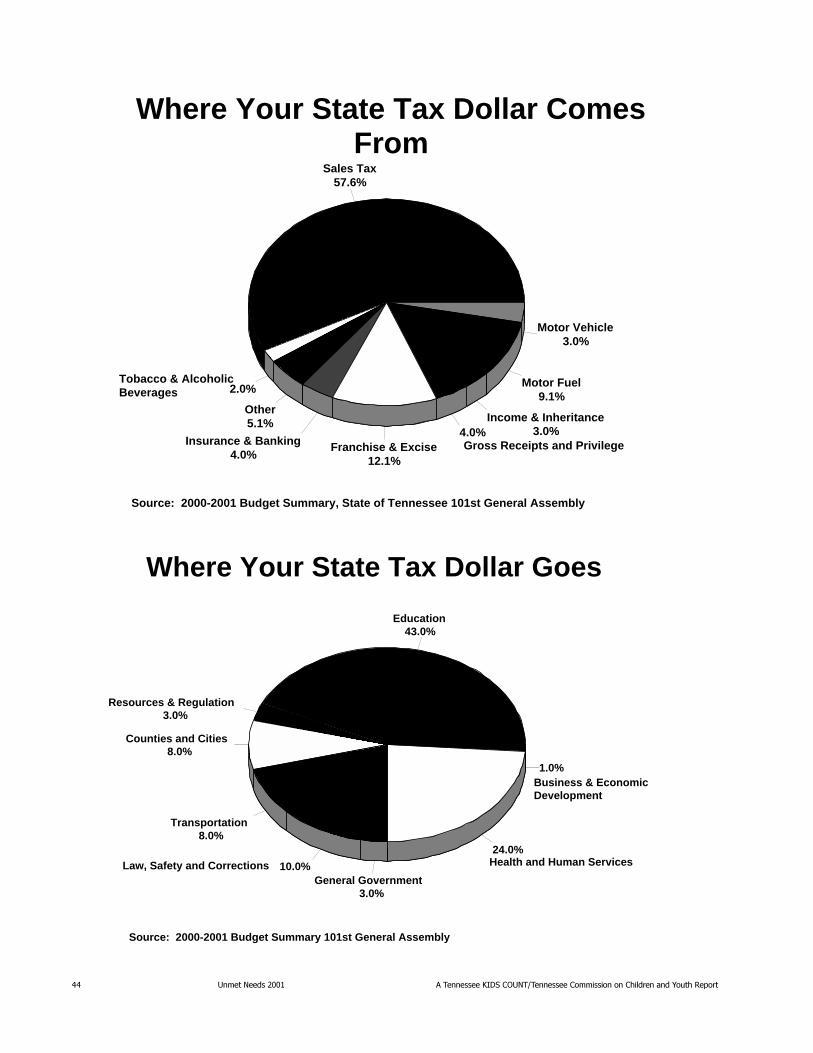
!! �������������� �����������������������������������������������������������������
Where Your State Tax Dollar Comes From
Source: 2000-2001 Budget Summary, State of Tennessee 101st General Assembly
Sales Tax57.6%
2.0%
Other5.1%
Insurance & Banking4.0%
Franchise & Excise12.1%
4.0%Income & Inheritance
3.0%
Motor Fuel9.1%
Motor Vehicle3.0%
Tobacco & Alcoholic Beverages
Gross Receipts and Privilege
Where Your State Tax Dollar Goes
Source: 2000-2001 Budget Summary 101st General Assembly
Education43.0%
Resources & Regulation3.0%
Counties and Cities8.0%
Transportation8.0%
10.0%General Government
3.0%
24.0%
1.0%Business & Economic Development
Health and Human ServicesLaw, Safety and Corrections
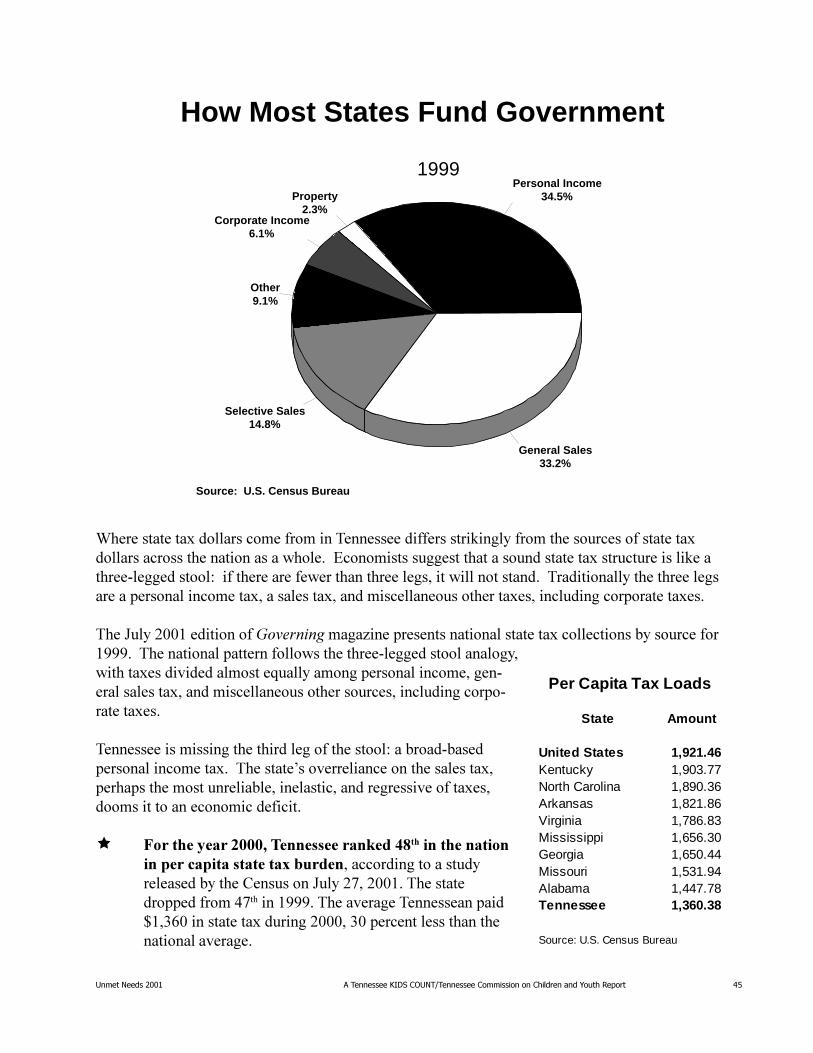
�������������� ����������������������������������������������������������������� !"
How Most States Fund Government
1999
Source: U.S. Census Bureau
Personal Income34.5%Property
2.3%Corporate Income
6.1%
Other9.1%
Selective Sales14.8%
General Sales33.2%
"����������;������������������ �������� �������� � ������������������������������;��������������������� ���������������8����� �������������������������������;���������� ��� ������'����������<�� ��������������������������� ��� ������������������ � ������������������������������ �������;�����������;������� �����������������;��� ����� ��������������;��
��=����$%%��� � ��������������������B ������������ ������������;������� �����������������555�������� ��������������������������'�������������������� �����;��� � ����������*�������������������� ��������'�����������;������� ����������������������� ����� ��������'������;��
����� ��� �� �������� �����������������<��������'������������ �������;���������6������� �����������������;�������������������� ����� ����� ������������ �������;�������� ������������� ���� � ��
� 8�����������,###4��� ������� ����$;���� ����� ��� � ������������������+���� �������� �������������������������0��������=����$G��$%%����������������������G��� ���555������������������� �>��4F%� ���������;���� ���$%%%��4%��������������������� �����������
State Amount
United States 1,921.46Kentucky 1,903.77North Carolina 1,890.36Arkansas 1,821.86Virginia 1,786.83Mississippi 1,656.30Georgia 1,650.44Missouri 1,531.94Alabama 1,447.78Tennessee 1,360.38
Source: U.S. Census Bureau
Per Capita Tax Loads
!# �������������� �����������������������������������������������������������������
���������������������������������%���������%$��������@�����)����� ������������ ��� ����� �����������������+����� ���������3������ ��� ������� ���������"� ������� � B����������������������������������������������� ��������� ����� �� � ������������������������� �� ������������ ����� �������������������� ���� ����������� � ���������������������� �������������������G%������
B������������-%,#�4��� �����3����������������������������� �� ������ ��������������������������������� ����������� �������������+��� �������� �������������������"����"���,,� ���������� ������������� ���������(�������������6�� ������ ���������������������������������������� ���������������� ���������� �������������������� ��������������������������������������������� ����������������� �������� ��� �����������������;��������������������� �������������� ����������������������������� �� ���� ��� ����������
,�*� � ������������� �����������*� ����������������� �����������@�����)�������������54%����������������� �������;����� ��� ��������������� ��������*� ��������������������� ����� �� �������;���������*������������������������/����/�����0��������� ��������� ��� ����� ������������������� ���9���� ���=� ���B��.������� ������������������������� ����� �����!�����5?���0������5?7��C��������554&������������������������������ �������������+���� �������� �
,���5G��������� �������������� �� ��������������������������� ���� ��������������� ����������������� ��������������������������;���;�� ����������� � ���/ ������������� ����������������������������� ��������������������6������������� ���������
� @�������!�����)�;����������������������������������� � ���������� ����������� ����������
� @�������3��#�"���������������;����������������������� �������� ���������
� @������� ���/��*� �������������� � � �����;���������������������� ���������� ���
:�������� �������6���������;�������������������� � �� ����<������ � ������������������� � ���
1�����;������� ��� �������������� ����������� ������;��������8���� � ������������������� ��������������������������� ������������� ������� ��������������������;�� �������� � ��������������������������������� �������������2��������6���������;����������;������ ���������������������� �������,������������ ���������������������������� �+����;"������ ���������� �� �������������/ ����������������� ���������������������������������� � ������� ������ ���������������������� ���� � ������������������� ���� � ����������� �� �� ������� ������������;�������������������
,����� � ��������� ������ ����� � ���������������;������������������������������6��������;����������������������������������������������
� "� ������������;� ������ �������������������� ����� ���������������������������������� ������������� ������� �� ���������������������������;��������������;�����������
��"�#���
�������������� ����������������������������������������������������������������� !$
�����*� ��������� ������ ������� ���������� ������&��3��<���������;���������������� ��������������������������� �������
/������;������������� �������� �������������������� ����������������������� �����������;������� ������������ ����� ����� ��������� ��������������������;������9����� �����3�� ����+��� ������������������� ��������������D�>� ������������������������������������������( ���� ������������� ������������;������ �������������� �����;���� �������������������������������������������
� ������ ����� ��������� �������������������������;�� ��� ���������������������������������/ �����������#������ ������� ����������E� ����������� �2#��� ������������������������������4�������������� � B��������� ����������� ����������������;��:������������� ��� ����������� ��� ����������������������������� ���������������������� ����;������������������ �������������� ��������������� ������������6��������������� ��� ������������������������������� ��������������� ���� �� ������� �������� �������������������� ��������������:����������� ���� �� �������� ������� �������������� ���� ��'� ���� ���������������� � �������+�����
� /�������������������������������� � ����������������� ��������������������������������� ��������������������������������������� ��������������������������������������������������� ������������� ����������������
� !��������������� ��� �� ������������������������� ���� ���� ��� �����������4����� ������������������������� � ���A�� �������� ����������������� ������� ��������� �����+�������������� ������������������� ���������������� ������������� ��������������(�����������������+����������� ����������� ��� �� ���������������� ��/ ��������� � B������������ ��� ��������������������������� ���������������� ����������������� ��������� ��� � ������ ������� ���������������������������������� ������������������������� ����� �������� �������� ����� ������1���������� � ���������� ���������������������������������6�������� ���������������������������+������ �������� ��"��'#����
�����������������������,������������������������������� ���������0����� ����������;��������������������������������������������������� ����� ������������� ��� ������������������������ ����� ����������������������� �����3������ ���������
� C��������������������;��������������������������������������������������������� ��������� ����������
� ��2�/��0����������������������������� � ��������� ����� ��� ������� ��,��������� ��������������;�� ���������������������������������� � ������ ������
� ������������������������������������������������;���� ������������������������������ ����� ������������ ������������������������;�������
/ ������,������ ��������� ������������� ������������������ ����� ������������������������ �����������;���� ���4����������������������������+������������� ��������������������������������������� ���������+���� ���� ������������������������� ���������������������������� ������������
!% �������������� �����������������������������������������������������������������
���������������C��������*� � ��� � B������������;���������������������'��'���������������(����������� � B����������������������������������� ����;��� ���������������������� �� ���� ��� ����*� ������
� 1�� ������������������ �����������+���������+���� ��������������������� �������������� ��������� ���
9��������������� ����� ���� �������������������� ������������������ ������������ ������ ����������;������ ����������������;�����<������� ���>�%�%%%�������� ���>��%%%� ����;������������� ���>�%%�%%%�������� ���>7�%%%� ����;���8�������������� ����������������������������������� ������� ��� ������>�%�%%%������������%����������� �� ����� ����;��������7������������� ����������2��������������������������������������������� ���� ��;������>��%%%����>�%�%%%������ ���&��)�������� ����������������������� ����������������� �����������������������������
6������������������������������"���������� ��������������� ���� �������������������� ��������������������������� ���������;��������������������� ������������� ���������)��������� ���� ��������������������� ������������� ��������������������;�������������� �������������������������������������������������� �������� ���������� �������+���������������;�������������������������� ��������������� ������������ ����������������� ������������������������������������������������ ���;������������;�� ���� ����� ���������� � ����������6��������
���� �� ���������� ������4������������4�������������������������������������� ���4������� ������������� ����� ����������������������� ������ �������������,��������������� ��������������� ���������������������������������������������� � ��
������������������� �������� �� ������;�� ����������������������� ������� ��������9����� ��
� &��-� �� ����������������� �������������������������;����� ������� ��� ��������� ���������� ��������
� &��,������������������;�������������� �� ���������������� ��������9����� ����� ������������;���������������� �� ��.���������)������������������������������;������������� �������������@��� ������3�����0���� ����������������������������;�������� �������������������������������;�������I �� � �6������ ���������������������� ���������������������������
� &��2������������������;��������� �� ���������������� ��������9����� ���1���3�����0���� ���������� ������;��������� �����������������@��� ����;������� ���������������������������������������������
� )�������������� ����������������������������� �������;���������������������������������&��$�
Shrinking Sales Tax BaseSales Tax Base as a Percent of Personal Income
Source: W.F. Fox, Center for Business and Economic Research, UT Knoxville, September 1999
58.69%
42.12%
1979 1997
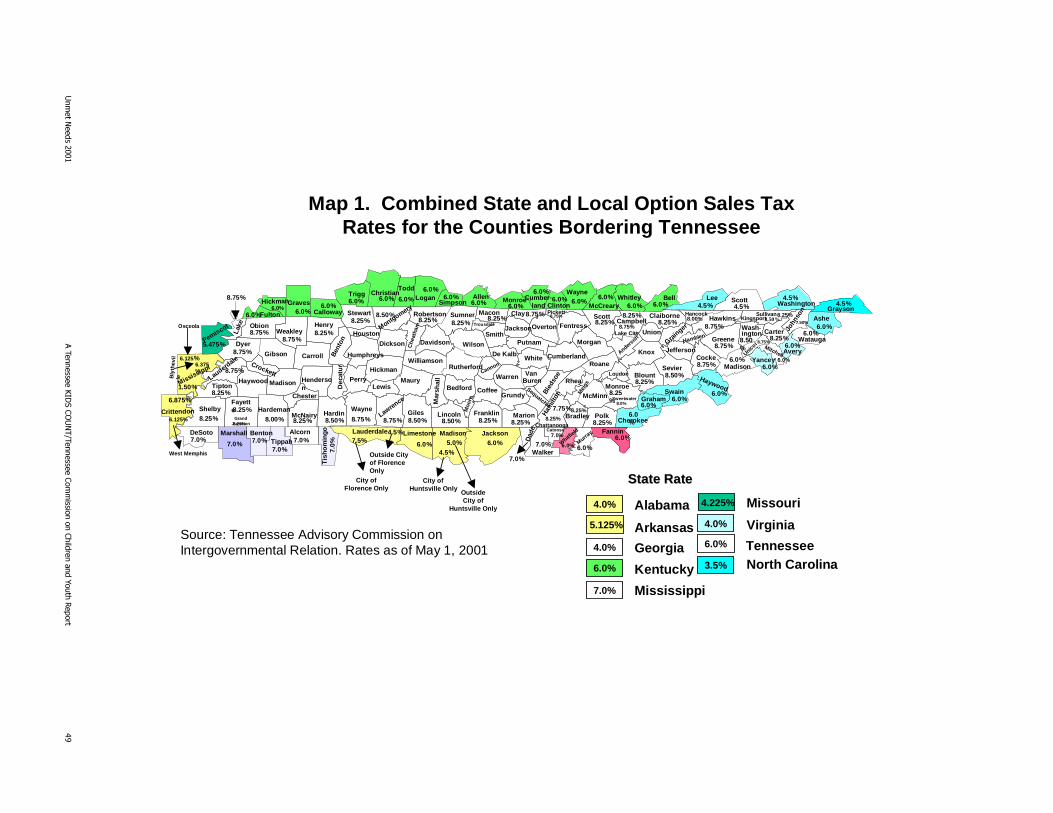
���
�����������
������������
�����������������
������������
������������������������!&
Map 1. Combined State and Local Option Sales Tax Rates for the Counties Bordering Tennessee
Lake Obion
WeakleyHenry
Dyer
Gibson Carroll
Lauderdale Crockett
Madison Henderson
HaywoodTipton
ShelbyFayette Hardeman
Chester
McNairy
Ben
ton
Dec
atu
r
HardinWayne
Perry
Humphreys
Houston
Stewart
MontgomeryRobertson
Dickson
Hickman
Lewis
Lawrence
Giles Lincoln
Moo
re
BedfordMaury
Mar
shal
l
WilliamsonRutherford
Che
atha
m
Davidson
Sumner
Wilson
Franklin Marion Ham
ilton
CoffeeGrundy
Sequatchie
Bled
soeVan
BurenCannon
WhiteDe Kalb
PutnamSmith
Jackson
Macon Clay
Trousdale Overton FentressScott
Pickett
Campbell
Morgan
Cumberland Anderso
n
Roane
Knox
Loudon Blount
Monroe
PolkBradley
McMinn
Rhea
Mei
gs
Claiborne HancockHawkins
Sullivan
Union
Grainger
Sevier
JeffersonCocke
GreeneHamblenWash-ington
John
son
Carter
Unicoi
Warren
DeSoto Marshall BentonTippah
Alcorn
Tis
ho
min
go Lauderdale Limestone Madison Jackson
Dad
e
Walker
Catoosa
Whitfield
Murray Fannin
Cherokee
GrahamSwain
Haywood
MadisonYancey
MitchellAvery
Watauga
AsheGrayson
WashingtonScottLeeBellWhitleyMcCreary
Wayne
ClintonCumber-
landMonroeAllen
SimpsonLogan
ToddChristianTrigg
CallowayGravesHickman
Fulton
Pemiscot
Mississippi
Crittendon
6.0%
4.5%7.5%
City of Florence Only
6.0% 5.0%4.5%
City ofHuntsville Only
OutsideCity of
Huntsville Only
7.0%
7.0% 6.0%
7.0%
6.0%
6.0%
6.0%
6.0%6.0%
6.0%
6.0%6.0%
6.0%
6.0%
6.0%6.0%
4.5%6.0%
6.0% 6.0%6.0%
6.0% 6.0% 6.0%
6.0%6.0%
6.0% 6.0%
6.0%6.0% 6.0%
6.0%6.0% 6.0%
5.475%
1.50%
6.125%
Osceola
6.875%
6.125%
West Memphis
8.25%8.50%8.75% 8.50% 8.25%8.75%
8.75%
8.75%
8.25%
8.25%
8.25%7.75%
8.25%Chattanooga 8.25%
8.25%
8.75%Lake City
8.25%8.75%
8.25%
8.75%
8.25%8.50% 8.75%8.25%
8.75%
8.25%8.25%8.25%
8.75%
8.25%Grand
Junction8.25%8.00% 8.25%
8.25%
8.25%
8.75%
8.75%
7.50%
8.25%Sweetwater
8.0%
8.50%
8.75%
8.00%8.75%
8.25%Kingsport8.50%
8.50%
7.0%7.0% 7.0%
7.0%7.0%
7.0
%
4.0% Alabama
7.0% Mississippi
5.125% Arkansas
State RateState Rate
4.5%4.5%
4.5%
Virginia
3.5%Kentucky6.0% North Carolina
4.0%
6.0% Tennessee
4.225% Missouri
4.0% Georgia
8.50%
Bly
thev
ille
6.375%
Outside City of Florence Only
Source: Tennessee Advisory Commission on Intergovernmental Relation. Rates as of May 1, 2001
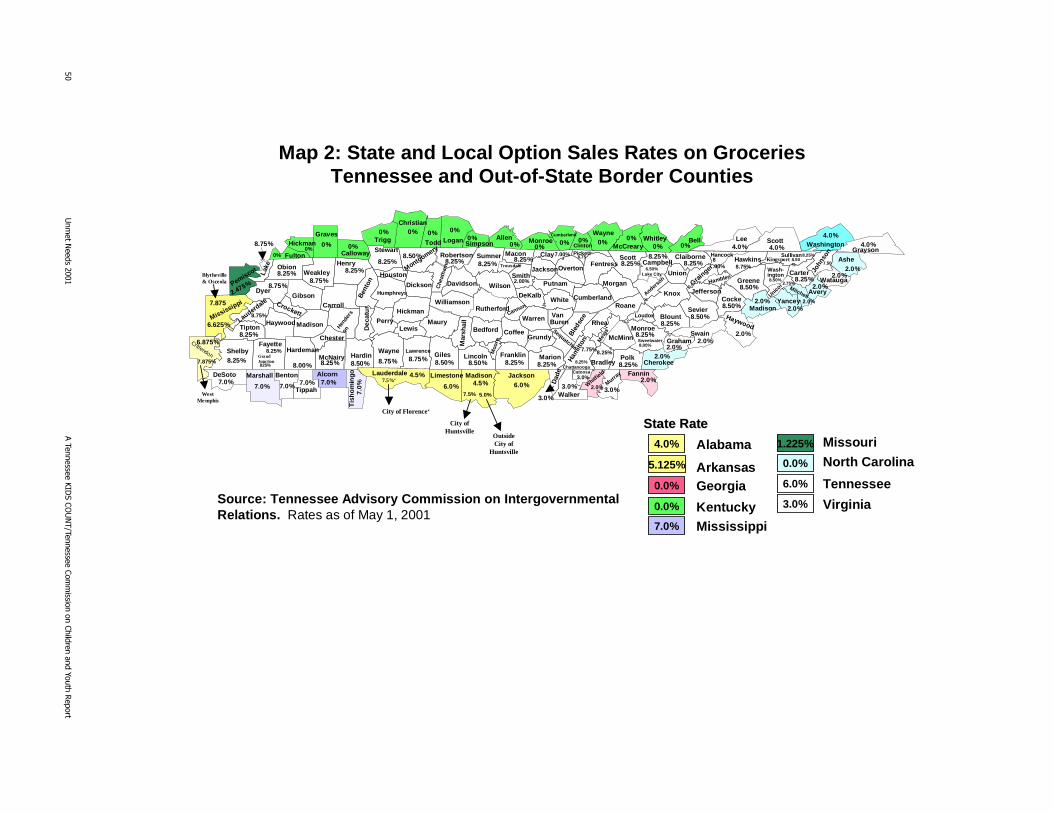
"����
�����������
������������
�����������������
������������
������������������������
Lake Obion
WeakleyHenry
DyerGibson
Carroll
Lauderdale Crockett
Madison Hende
rson
HaywoodTipton
ShelbyFayette
Hardeman
Chester
McNairyB
ento
nD
ecat
ur
Hardin 8.50%
Wayne
Perry
Humphreys
Houston
Stewart
MontgomeryRobertson
Dickson
Hickman
Lewis
LawrenceGiles Lincoln
Moo
re
BedfordMaury
Mar
shal
l
WilliamsonRutherford
Che
atha
m
Davidson
Sumner
Wilson
Franklin Marion Ham
ilton
CoffeeGrundy
Sequatchie
Bled
soeVan
BurenCannon
WhiteDeKalb
PutnamSmith
Jackson
Macon Clay
Trousdale OvertonFentress
ScottPickett
Campbell
Morgan
Cumberland Anderso
n
Roane
Knox
Loudon Blount
Monroe
PolkBradley
McMinn
Rhea
Mei
gs
Claiborne HancockHawkins
Sullivan
Union
Grainger
Sevier
JeffersonCocke
GreeneHamblenWash-ington
John
son
Carter
Unicoi
Warren
DeSoto Marshall Benton
Tippah
Alcorn
Tis
ho
min
go Lauderdale Limestone Madison Jackson
Dad
e
Walker
Catoosa
Whitf
ield
Murray Fannin
Cherokee
GrahamSwain
Haywood
MadisonYancey
MitchellAvery
Watauga
AsheGrayson
WashingtonScottLeeBellWhitleyMcCreary
Wayne
Clinton
Cumberland
MonroeAllenSimpsonLoganTodd
Christian
Trigg
Calloway
GravesHickman
Fulton
Pemiscot
Mississippi
Crittendon
6.0%
4.5%7.5%‘
City of Florence‘
6.0% 4.5%
5.0%7.5%
City ofHuntsville
OutsideCity of
Huntsville
3.0%
3.0% 2.0%
3.0%
3.0%
2.0%
2.0%2.0%
2.0%2.0%
2.0%2.0%
2.0%
2.0%
2.0%2.0%
4.0%0%
0%0% 0%
0% 0% 0% 0%0%
0% 0%0% 0% 0%
0%0% 0%
2.475%
6.625%
7.875
Blytheville& Osceola
6.875%
7.875%
West Memphis
8.25%8.50%8.75% 8.50% 8.25%8.75%
8.75%
8.75%
8.25%
8.25%
8.25%7.75%
8.25% Chattanooga 8.25%
8.25%
6.50%Lake City
8.25%7.00%
8.25%
8.75%
8.25%8.50% 8.758.25%
8.25%
8.25%8.25%8.25%
8.75%
8.25%Grand Junction825% 8.00% 8.25%
8.25%
8.25%
8.50%
8.50%
7.50
8.25%Sweetwater8.00%
8.50%
2.75%
8.00% 8.75%
2.00%
8.25%Kingsport 8.50
%
8.50%
7.0%7.0%
7.0% 7.0% 7.0%
7.0
%
Map 2: State and Local Option Sales Rates on GroceriesTennessee and Out-of-State Border Counties
4.0%
4.0%4.0%
4.0% Alabama
7.0% Mississippi
5.125% Arkansas
State RateState Rate
Virginia3.0%Kentucky0.0%
North Carolina0.0%
6.0% Tennessee
1.225% Missouri
0.0% GeorgiaSource: Tennessee Advisory Commission on Intergovernmental Relations. Rates as of May 1, 2001
���
�����������
������������
�����������������
������������
������������������������"�
Lake Obion
Weakley
Henry
Dyer Gibson
Carroll
Lauderdale Crockett
Madison
Hende
rso
n
HaywoodTipton
Shelby Fayette
Hardeman
Chester
McNairy
Ben
ton
Dec
atu
r
Hardin Wayne
Perry
Humphreys
Houston
Stewart
Montgomery Robertson
Dickson
Hickman
Lewis
LawrenceGiles Lincoln M
oore
BedfordMaury
Mar
shal
l
WilliamsonRutherford
Che
atha
m
Davidson
Sumner
Wilson
Franklin Marion Ham
ilton
CoffeeGrundy
Sequatchie
Bled
soeVan
Buren
CannonWhite
De Kalb
PutnamSmith
Jackson
Macon Clay
Trousdale OvertonFentress
ScottPickett
Campbell
Morgan
Cumberland Anderso
n
Roane
Knox
Loudon Blount
Monroe
PolkBradley
McMinn
Rhea
Mei
gs
Claiborne HancockHawkins Sullivan
Union
Grainger
Sevier
JeffersonCocke
GreeneHamblen
Wash-ington
John
son
Carter
Unicoi
Warren
De Soto Marshall Benton
Tippah
Alcorn
Tis
ho
min
go
Lauderdale Limestone Madison Jackson
Dad
e
Walker
Catoosa
Whitf
ield
Murray Fannin
Cherokee
GrahamSwain
Haywood
MadisonYancey
Mitchell Avery
Watauga
AsheGrayson
WashingtonScottLeeBellWhitleyMcCreary
Wayne
Clinton
Cumberland
MonroeAllenSimpson
LoganTodd
Christian
Trigg
Calloway
GravesHickman
Fulton
Pemiscot
Mississippi
Crittendon
$0.18
$0.075
$0.075
$0.216
$0.164
$0.1705
$0.187
$0.214
$0.214
$0.214
$0.214
$0.214$0.214 0.214
$0.214
$0.214
$0.214
$0.184
Map 3. State Tax on Gasoline in Tennessee andOut-of-State Border Counties
$0.175
$0.18 Alabama
$0.184 Mississippi
$0.187 Arkansas
State RateState Rate
Virginia$0.175
Kentucky$0.164
North Carolina$0.216
$0.214 Tennessee
$0.1705 Missouri
$0.075 Georgia
$0.18 $0.18 $0.18
$0.187
$0.075$0.075
$0.075
$0.075
$0.164$0.164 $0.164
$0.164 $0.164 $0.164$0.164
$0.164$0.164 $0.164
$0.164 $0.164 $0.164 $0.164$0.164 $0.164
$0.184$0.184
$0.184
$0.1
8 4
$ 0.1
8 4
$0.216
$0.216
$0.216$0.216
$0.216
$0.216$0.216
$0.216
$0.216
$0.175
$0.175$0.175
$0.214 $0.214 $0.214 $0.214
$0.214
$0.214$0.214 $0.214$0.214
$0.214
$0.214
$0.214
$0.214$0.214$0.214$0.214$0.214$0.214
$0.214$0.214
$0.214$0.214
$0.214 $0.214
$0.214
$0.214$0.214
$0.214
$0.214$0.214
$0.214
$0.214
Georgia levies a 3% tax on total retail sale price of gasoline. Rates include nominal environmental assurance fees except for Georgia.
Source: Tennessee Advisory Commission on Intergovernmental Relations
"���
�����������
������������
�����������������
������������
������������������������
Lake Obion
Weakley
Henry
Dyer Gibson
Carroll
Lauderdale Crockett
Madison
Hende
rson
HaywoodTipton
Shelby Fayette
Hardeman
Chester
McNairy
Ben
ton
Dec
atu
r
Hardin Wayne
Perry
Humphreys
Houston
Stewart
Montgomery Robertson
Dickson
Hickman
Lewis
LawrenceGiles Lincoln M
oore
BedfordMaury
Mar
shal
l
WilliamsonRutherford
Che
atha
m
Davidson
Sumner
Wilson
Franklin Marion Ham
ilton
CoffeeGrundy
Sequatchie
Bled
soeVan
Buren
CannonWhite
De Kalb
PutnamSmith
Jackson
Macon Clay
Trousdale OvertonFentress
ScottPickett
Campbell
Morgan
Cumberland Anderson
Roane
Knox
Loudon Blount
Monroe
PolkBradley
McMinn
Rhea
Mei
gs
Claiborne HancockHawkins Sullivan
Union
Grainger
Sevier
JeffersonCocke
GreeneHamblen
Wash-ington
John
son
Carter
Unicoi
Warren
De Soto Marshall Benton
Tippah
Alcorn
Tis
ho
min
go
Lauderdale Limestone Madison Jackson
Dad
e
Walker
Catoosa
Whitfield
Murray Fannin
Cherokee
GrahamSwain
Haywood
MadisonYancey
Mitchell Avery
Watauga
AsheGrayson
WashingtonScottLeeBellWhitleyMcCreary
Wayne
Clinton
Cumberland
MonroeAllenSimpson
LoganTodd
Christian
Trigg
Calloway
GravesHickman
Fulton
Pemiscot
Mississippi
Crittendon
Map 4. All States Bordering Tennessee Have Graduated Personal Income Taxes
2.0%-5.0%/3 brackets Alabama
3.0%-5.0%/3 brackets Mississippi
1.0%-7.0%/6 brackets Arkansas
State Graduated Tax Rate Range/Number BracketsState Graduated Tax Rate Range/Number Brackets
Virginia2.0%-5.75%/4 brackets
Kentucky2.0%-6.0%/5 brackets
North Carolina6.0%-7.75%/3 brackets
N/A Tennessee
1.5%-6.0%/10 brackets Missouri
1.0%-6.0%/6 brackets Georgia
Source: Tennessee Advisory Commission on Intergovernmental Relations
�������������� ����������������������������������������������������������������� "
A��������� �������� � ������������� �������;���������������������� ������6���� ������������������������� �����*������������ ����;��������(�������������'����������������� ������ �����/����0�� ���� ��=����$%%������ ������� �������� ������������ ��#���$%%�� �� ���� ���������������� ��������������������*��������������������� �������;�
"������ �������;� ���������� �������� ���� �������������������;������ � ��� ���������������;��������� ������'����� �� ��������������� �� �������������������;���&����������� �������������� ���������� ���������)�� � ������������� ��;�������������������������� ����������������������77���������������������������� ������������ ����������������������������� �#���$%%�����0 � B��������� ���;�������� ���'���������� � �������������������;������� ������
������������*��� ������������������������� �������;��� ������ �������� ����� ���� ����/C�5$%9(C��5�?&�������;������,������� �������� ����� ���� ���� ��� ��������� ���� ������ ��� ���� �� �����������������������������������������;���������������� ��� �����������;��������������� � B���
/���������������� � �������/C��5$%9(C��5�?� ���������������� ��<
� F�������(����,������;���������������
� !�������� ����������;���������������
� 2� �����������������;�������������G�������
� @����������������� ����������'����� �� �����������������;���������� �� ������������������;���&�
� )������'����������������������� �������;�
� �������������� ��������4�7����F�������
� >�?�%%%�;��� ���������� ������;�������>4F�%%%��������� ���������
� >$F��%%�;��� ���������� ��������������������
� >$�7%%������ ��������������������� � ������������
� " �������;��� ����� ����� �������� ��������'������������'������� ������ ���� �������;���� �������+����������� ������)@,&������������� �������;������
� ������� ������������������� ������ �������;���� ������������ ����� ��������������
� 3��'�� �������� ��� ����� �������������������� �������;�������������� ������� �� ���� ������������ �����
� 0�������� ������;� �&���;��������� ������������F����������F�7�������
� :����� ������� � �����;��������������������� ����� ������� �������;�� �� � ���
1�������������������������������� ������� ������ ����� �������������;���� ������������� ���7G�����������������������������;���� �������������;������� ��������+�� �������� ������������;�������;������������������������� ������� ������������ ���������������������������� ���;�������������������;��#������������ ������;���� �
"! �������������� �����������������������������������������������������������������
���������� ����������������������; �������������� ���������� ���������� ���� ����������������������� ������������� ������������;������ ����������� ����������������������� ���� ����� ����������� ������������� ������������������ � ���
� �� ���� ������������ � ����+��� ���������������� �� �������� �������������������������������;�������������� ����� �������� �������;��������� �������
� �� ����������������������� � ����+��� ���������������� �� �������� ������������������� ����,�������������� �������;���������������� ����������� ������� �� ��� �����������
� �� ��������������� �������� ��� ����� ������������ �������������������������������������������! �� ��� �������������� �������;����������������� ����������� ������ ������:���������@� BB� ������������������������� ���������������������������������� �������;� ������������������������� �������� �� �������������������������� �������������������������������������� ����
�������� ��������� �� �������� ������������ ������;����������� ����������� ��������� ����������� �����������,�� �� ������������������������������������������;����������������;������ ����*� ���������������������� ��������������� �������� � ������������� ������;������������� ����� ��� ����������������������� ������������ ����������
)�������� ���������� ������ ���� ��� ���������/C��5$%9(C��5�?�������������� �������������������������������������������������������������������;�� ���� ���� ���� �������������������������77������� ������������������������������������� �������������������������� ��������������������������������������������������� �����������������������������������������������������;����������������� � ���������������������/C��5$%9(C�5�?� �" �� ������������ �������������������F��������������������,������+�� ���������� ���75&�G%��������������������������������������
Comparison of Proposed Legislation vs. Current Sales Tax
Impact on Various Income Groups
Source: Tax Reform Study, Women’s Institute for Policy Studies, Vanderbilt University "Tax Reform Study 2001."
Family Type and IncomePercent of Income
Paid in TaxesPercent of Income
Paid in TaxesPercent of Income
Paid in Taxes
Current Sales Tax Structure
Sales and Services
Previously Proposed
Rochelle/Head/Elsea Income Tax Bill
Single Female-Headed Household Earning $10,000 7.14% 8.94% 4.2%
Single Female-Headed Household Earning $17,000 5.99% 7.44% 3.52%
Husband/Wife Earning $17,000
6.36% 7.81% 3.67%
Husband/Wife Earning $35,000
4.19% 4.98% 2.56%
Husband/Wife Earning $44,000 4.77% 5.65% 2.41%
Husband/Wife Earning $60,000 3.30% 3.93% 3.1%
Husband/Wife Earning $113,000 2.54% 3.1% 4.49%
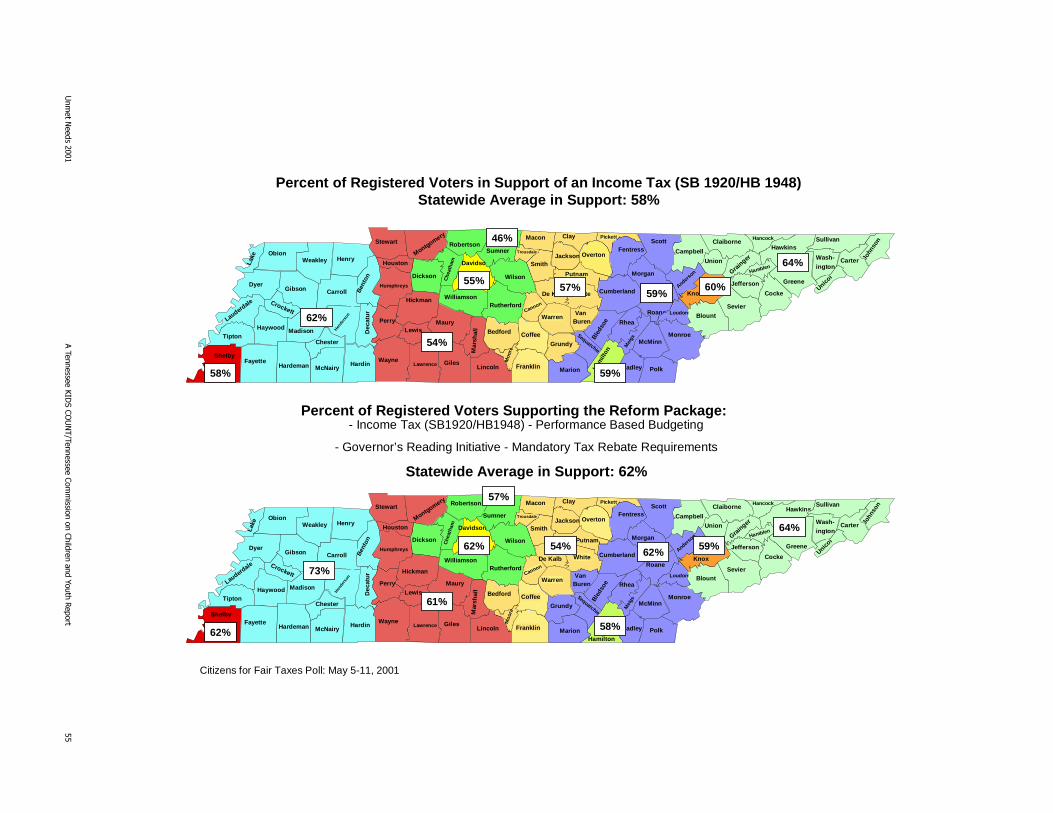
���
�����������
������������
�����������������
������������
������������������������""
Percent of Registered Voters in Support of an Income Tax (SB 1920/HB 1948)Statewide Average in Support: 58%
Citizens for Fair Taxes Poll: May 5-11, 2001
Lake
ObionWeakley Henry
DyerGibson Carroll
Lauderdale Crockett
Madison Hender
son
HaywoodTipton
ShelbyFayette
Hardeman
Chester
McNairy
Ben
ton
Dec
atu
rHardin
Wayne
Perry
Humphreys
Houston
Stewart
Montgomery
Robertson
Dickson
Hickman
Lewis
Lawrence GilesLincoln
Moo
re
Bedford
Maury
Mar
shal
l
WilliamsonRutherford
Che
atha
m Davidson
Sumner
Wilson
Franklin Marion Ham
ilton
Coffee
Grundy
Sequatchie
Bled
soe
VanBuren
Cannon
WhiteDe Kalb
Putnam
SmithJackson
Macon Clay
Trousdale OvertonFentress
ScottPickett
Campbell
Morgan
CumberlandAnder
son
Roane
Knox
Loudon
Monroe
PolkBradley
McMinn
Rhea
Mei
gs
ClaiborneHancock
HawkinsSullivan
Union
Grain
ger
Blount
Sevier
Jefferson
Cocke
Greene
Hamblen
Wash-
ington
John
son
Carter
Unicoi
Warren
58%
62%
54%
46%
55%57%
59%
59%60%
64%
Percent of Registered Voters Supporting the Reform Package:- Income Tax (SB1920/HB1948) - Performance Based Budgeting
- Governor’s Reading Initiative - Mandatory Tax Rebate Requirements
Statewide Average in Support: 62%
Lake
ObionWeakley Henry
DyerGibson Carroll
Lauderdale Crockett
Madison
Hende
rson
HaywoodTipton
ShelbyFayette
Hardeman
Chester
McNairy
Ben
ton
Dec
atu
r
HardinWayne
Perry
Humphreys
Houston
Stewart
Montgomery Robertson
Dickson
Hickman
Lewis
Lawrence GilesLincoln
Moo
re
Bedford
Maury
Mar
shal
l
WilliamsonRutherford
Che
atha
m
Davidson
Sumner
Wilson
Franklin MarionHamilton
CoffeeGrundy
Sequatchie
Bled
soe
VanBuren
Cannon
WhiteDe Kalb
Putnam
SmithJackson
Macon Clay
Trousdale OvertonFentress
ScottPickett
Campbell
Morgan
CumberlandAnder
son
RoaneKnox
Loudon
Monroe
PolkBradley
McMinn
Rhea
Mei
gs
ClaiborneHancock
HawkinsSullivan
Union
Grain
ger
BlountSevier
Jefferson
Cocke
Greene
Hamblen
Wash-ington
John
son
Carter
Unicoi
Warren
62%
73%
61%
57%
62% 54%
58%
59%
64%
62%
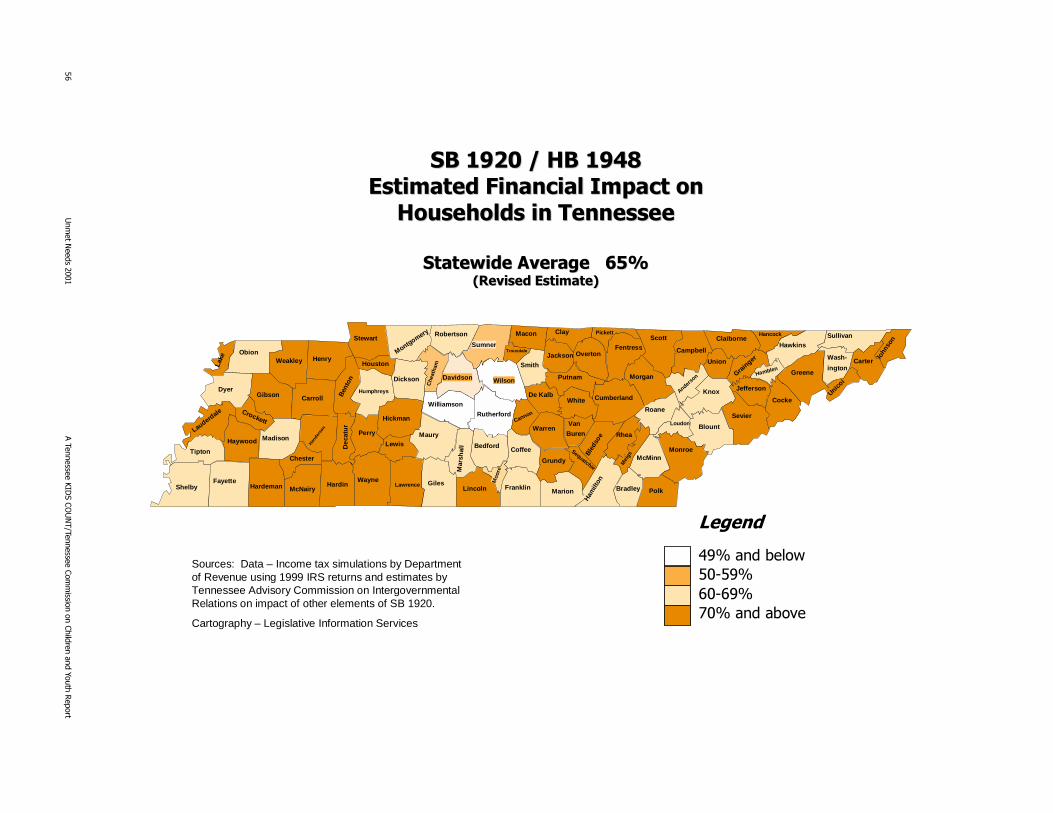
"#���
�����������
������������
�����������������
������������
������������������������
������������������������������� ���������������������������� ���������������������������
�� ����� ��������� ���� ����� ��������� ��
����������� �!�"����#$%����������� �!�"����#$%&'� � ���� ������(&'� � ���� ������(
Lake
ObionWeakley Henry
DyerGibson Carroll
Lauderdale Crockett
Madison
Hende
rson
Haywood
Tipton
ShelbyFayette
Hardeman
Chester
McNairy
Ben
ton
Dec
atu
r
HardinWayne
Perry
Humphreys
Houston
Stewart
Montgomery Robertson
Dickson
Hickman
Lewis
Lawrence GilesLincoln
Moo
re
Bedford
Maury
Mar
shal
l
Williamson
Rutherford
Che
atha
m
Davidson
Sumner
Wilson
Franklin Marion
Ham
ilton
Coffee
Grundy
Sequatchie
Bled
soe
Van
Buren
Cannon
WhiteDe Kalb
Putnam
SmithJackson
Macon Clay
Trousdale OvertonFentress
ScottPickett
Campbell
Morgan
CumberlandAnder
son
Roane
Knox
Loudon
Monroe
PolkBradley
McMinn
Rhea
Mei
gs
ClaiborneHancock
HawkinsSullivan
Union
Grain
ger
Blount
Sevier
Jefferson
Cocke
GreeneHamblen
Wash-
ington
John
son
Carter
Unicoi
Warren
������
����������� �� ��������������������
Sources: Data – Income tax simulations by Department of Revenue using 1999 IRS returns and estimates by Tennessee Advisory Commission on Intergovernmental Relations on impact of other elements of SB 1920.
Cartography – Legislative Information Services
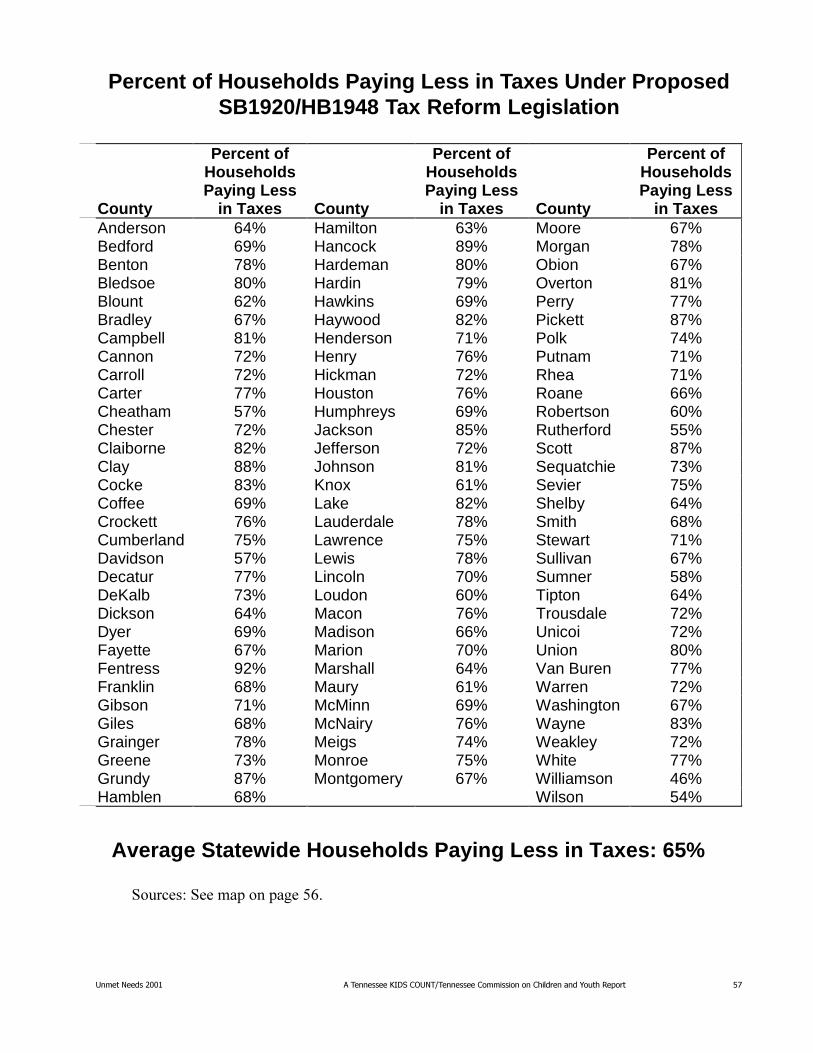
�������������� ����������������������������������������������������������������� "$
Percent of Households Paying Less in Taxes Under ProposedSB1920/HB1948 Tax Reform Legislation
���������/�����<�/������������7F�
County
Percent of Households Paying Less
in Taxes County
Percent of Households Paying Less
in Taxes County
Percent of Households Paying Less
in Taxes Anderson 64% Hamilton 63% Moore 67% Bedford 69% Hancock 89% Morgan 78% Benton 78% Hardeman 80% Obion 67% Bledsoe 80% Hardin 79% Overton 81% Blount 62% Hawkins 69% Perry 77% Bradley 67% Haywood 82% Pickett 87% Campbell 81% Henderson 71% Polk 74% Cannon 72% Henry 76% Putnam 71% Carroll 72% Hickman 72% Rhea 71% Carter 77% Houston 76% Roane 66% Cheatham 57% Humphreys 69% Robertson 60% Chester 72% Jackson 85% Rutherford 55% Claiborne 82% Jefferson 72% Scott 87% Clay 88% Johnson 81% Sequatchie 73% Cocke 83% Knox 61% Sevier 75% Coffee 69% Lake 82% Shelby 64% Crockett 76% Lauderdale 78% Smith 68% Cumberland 75% Lawrence 75% Stewart 71% Davidson 57% Lewis 78% Sullivan 67% Decatur 77% Lincoln 70% Sumner 58% DeKalb 73% Loudon 60% Tipton 64% Dickson 64% Macon 76% Trousdale 72% Dyer 69% Madison 66% Unicoi 72% Fayette 67% Marion 70% Union 80% Fentress 92% Marshall 64% Van Buren 77% Franklin 68% Maury 61% Warren 72% Gibson 71% McMinn 69% Washington 67% Giles 68% McNairy 76% Wayne 83% Grainger 78% Meigs 74% Weakley 72% Greene 73% Monroe 75% White 77% Grundy 87% Montgomery 67% Williamson 46% Hamblen 68% Wilson 54%
Average Statewide Households Paying Less in Taxes: 65%
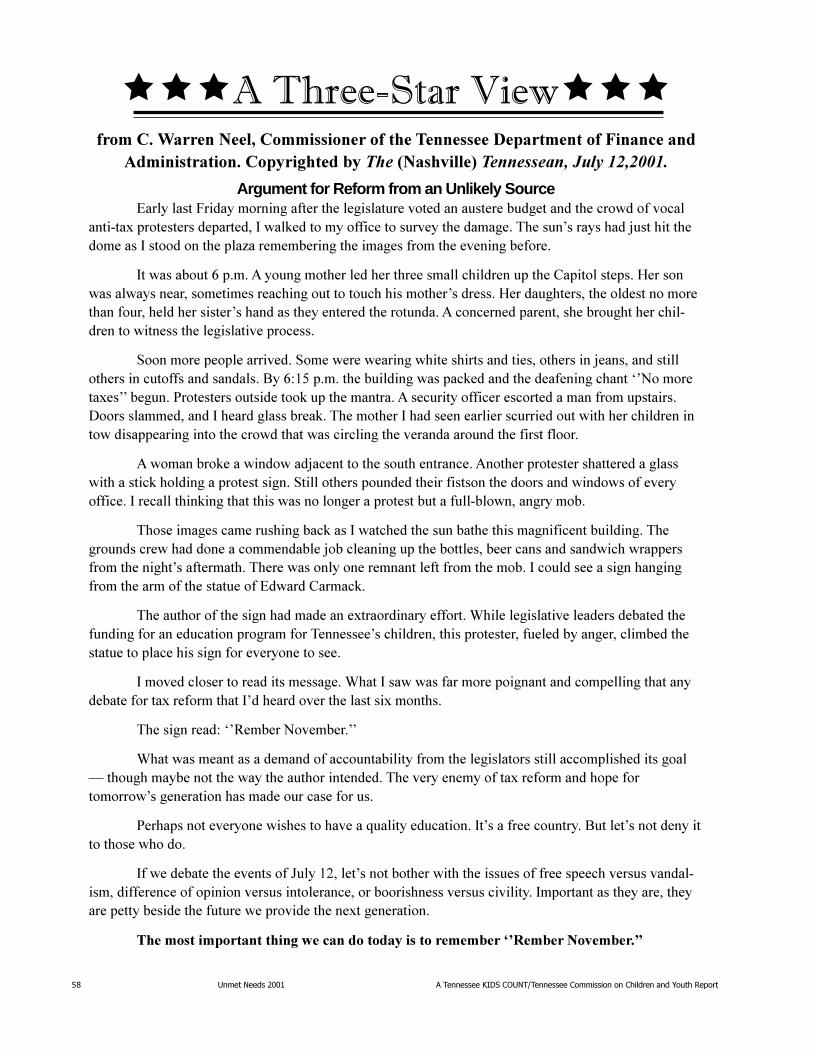
"% �������������� �����������������������������������������������������������������
���$������%���&��'������������������&����������������������������������������������������� ���������������������������'������������(&��������)���������������� ����� �
Argument for Reform from an Unlikely Source����������������� ��������������������������� �������������������������������� ��� ��� ���
���������� ���������������������������� ���� ������ ��������������������������� �����������!����������� ���������� �� ���������"������������������������� ���������������� ���
��������� ���#������$�� ����� ����������������������������������������%��� ���������&���� ������������������� ��������������� ���� �� �������� ���� ���������&������������������ ������� �� �������� ������������������ ���������������������������� �������$�� ���������������������� ������������������� ������������������������ �����
' ��� ����� ������������' ����������������������������������� ��������!�������������� ����������� �����������������(��#)*+���������������������������������������������������, - �� ������� ��������.� �������� ������� �����������������$��������� ��������� ������������� ����������/ ������������������������������������������ ������������������������������� ��������������������� ��������������� ������� ��������������������������������� ��������������� ��
$�� ������ �������� ����!������� ������ ��������������$� ������� ������������������������������������ ��������� ����������'���� ������� ��������������� ������� ���������� ��� ������� ������������������������������������ �� ��������� ������������������ ����������� ��
�� �������������������������������������������������������������������������������� ��������������� ������ ����������! ������������������ ��������������������������������������� ���������� ����������������������� ���� ������������������ ������� ������ ���������������������� ���������� ������������� ���������%�������
�������� �� ��������������������������� ���������� ����0����������������������������������������� ����������� ���� ������ ����������� ����������������� ������������������������������������������� ��������������� ������� ���� �����
��� ������ ����� ������������������0������������������� ���� ����������� ������������������������ ��������� ��������� �������� ����������������� �����
������������)�, 1������- �������
0�������������������������� ����� ����������� ������������� ����������� ������������ ��2��� ����������� ������������������ �������������������������� ��������� �������� ���� �� � �� � ��������� ����������� ��������� �����
.�������� ������� ���������� ��������3������������ ����� ���������� �������(������ ��� ��������� ��� ����� �� �
������������������������ ��4����*5����� ��� ��� ������������������� ������������������������������������������ �� �� ����������� ��������� ��� ������������������������� ������������������������������������������������������� �������������������� ��
�������������� ���� ������� ��������������������������������������������

�������������� ����������������������������������������������������������������� "&
���������������������������� �������
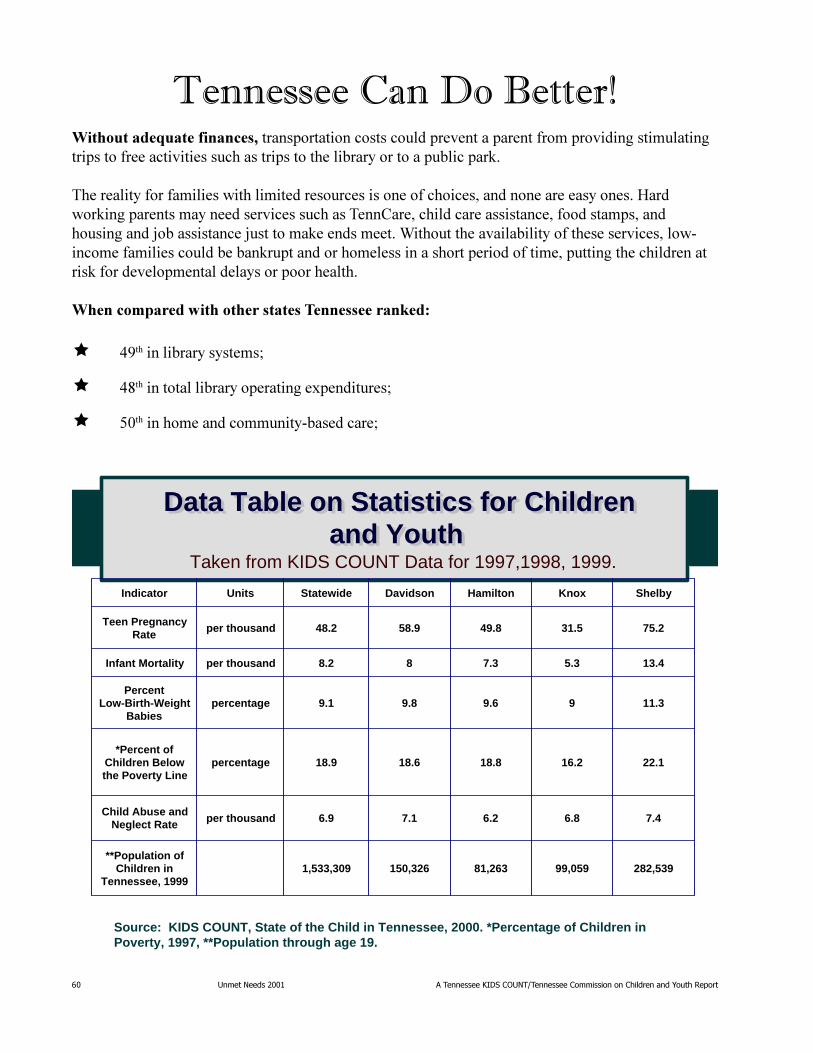
#� �������������� �����������������������������������������������������������������
����������������� ���4������������ �������������������������������������� � ����� ����� ���� ������������ � � ������������ ���������� ������������������ �������
����� ���������� � ��� ���� � ����������� ����������� ������������������������(������� �������������������� �������������0������ ���������� ��������������������������� �������+������ ������+�������������������" ������������ ��� � ������������� �������' �������� � ��������������������������������� ������������ ������� ������� �������� �������� ��������������������������������������
��� ���������������������������� ������� ���!
� �5��� ��� �������������
� �?��� ��������� ����������� ���;��� �����
� 7%��� ���������������� ��'���������
Data Table on Statistics for Children and Youth
Data Table on Statistics for Children and Youth
Taken from KIDS COUNT Data for 1997,1998, 1999.
Source: KIDS COUNT, State of the Child in Tennessee, 2000. *Percentage of Children in Poverty, 1997, **Population through age 19.
Indicator Units Statewide Davidson Hamilton Knox Shelby
Teen Pregnancy Rate
per thousand 48.2 58.9 49.8 31.5 75.2
Infant Mortality per thousand 8.2 8 7.3 5.3 13.4
Percent Low-Birth-Weight
Babiespercentage 9.1 9.8 9.6 9 11.3
*Percent of Children Below the Poverty Line
percentage 18.9 18.6 18.8 16.2 22.1
Child Abuse and Neglect Rate per thousand 6.9 7.1 6.2 6.8 7.4
**Population of Children in
Tennessee, 19991,533,309 150,326 81,263 99,059 282,539
�������� �����������(
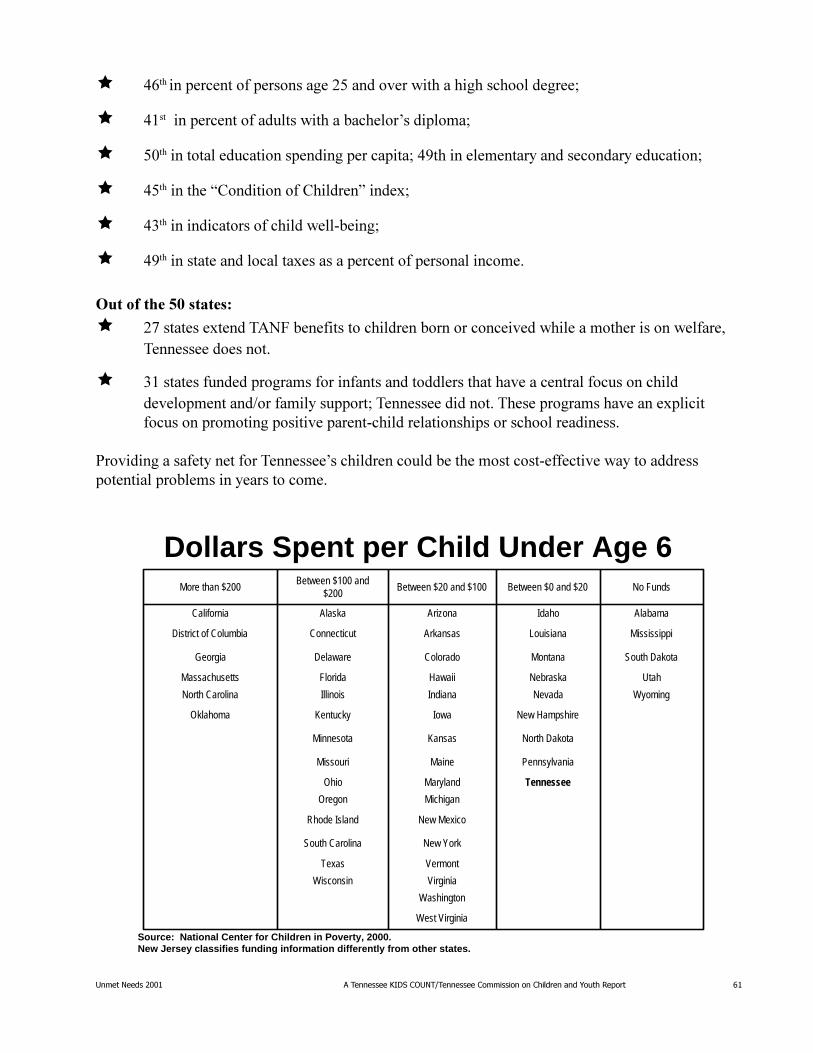
�������������� ����������������������������������������������������������������� #�
� �F��� ���������������������$7���������� ������ ��������������
� ������ ������������������� ������������6��� ������
� 7%��� ������������� ������� ��������� �����5��� ���������������������������� ���
� �7��� �����D0��� � ������0� ����E� ��;�
� �4��� �� �� ������������ ������'� ���
� �5��� �������������������;������������������������ �����
<����������"#������!
� $G�������;����)3����� �������� ����������������� ����� ���������� ������������������������
� 4��������������������������� ������������������������������������������������ ��������������9������ ������������������ ��������������������������;�� � ���������������� ������ � �������'�� ������� ���� ���������������� ����
:��� � ����������������������6���� �������������������������'���� �������������������� ����������� ��������������
Dollars Spent per Child Under Age 6
Source: National Center for Children in Poverty, 2000. New Jersey classifies funding information differently from other states.
More than $200Between $100 and
$200Between $20 and $100 Between $0 and $20 No Funds
California Alaska Arizona Idaho Alabama
District of Columbia Connecticut Arkansas Louisiana Mississippi
Georgia Delaware Colorado Montana South Dakota
Massachusetts Florida Hawaii Nebraska Utah
North Carolina Illinois Indiana Nevada Wyoming
Oklahoma Kentucky Iowa New Hampshire
Minnesota Kansas North Dakota
Missouri Maine Pennsylvania
Ohio Maryland Tennessee
Oregon Michigan
Rhode Island New Mexico
South Carolina New York
Texas Vermont
Wisconsin Virginia
Washington
West Virginia
# �������������� �����������������������������������������������������������������
"�������� �������������������������� ���� ��������������� ��������� � ��������������������������� ���-��2������������� ����� � ������������� ��� �� ������������ ��������� �����������*������� ���
A�� �� ������� ������������ ������������������� ��������*�������� ���������������������� � ��� ��� ������������������������������� ������;���������������������� ������� �'�������������� �������� ����� ���*���&�����������������������������������������<
� D/�����/������E������ ��������� ��*� ��� ������� ��������� ��������������� ��
� !���� ������� ���������� ����� ��������������������� �������� ����������������
� ! � ��� �������*� ����*���9������� ������ ��������������������������������� ����� ���������������
� !���� ���������������� ����� ����������*� ������������� ����� ��������������� ������ �����������������������������0��9#� �� ��
�����������������������������������6������� �����'� ������������������������� ������������������� ��������
�������������� ����������������������������������������������������������������� #
#�������)����@��K�@���������#����555&��/���������/�����������,�����,������� ���)�����)�� ���0� ����<�/����������"����� �&���!����� ����� ���:�������2�����,��� �����"��� ������� 0�
)���������(�����0���:�� �������A���������55?�� ����&������������������������!)� �����������0��"�%�����%�����.���"�����!����������'�#�&���"���1�'�#�&���/0�'2��2�����3"�/3���������I����$$$��A���� ����# ������<99�������������9�
)�� �8��0����������� �����$%%�&�������������� ������������C��� �����#� �
C������������ �����$%%%&��/&&���������"�������&�%��������%���������/���.���%��3���"��� ������ 0������<99����� � ���� � �����������9������9���� �9 ��;����-��L$%
C��������!�����/��� �� ����2�/�� �����������!�������$%%%&�����55?'$%%?�=���1������� ��C� ���33#(������!��#�!����4#�����!)��"��� ������� 0�
C�������.���0�;��.���/�������A���K��������/���$%%%&��"��,��������5������!���&���%���0��"-��3"��!��)���3���)��$����0������"��������0��� �� ����#�����8����� ��0����������/��������:��� ��:�� ����@����#�����2� ��� ����"��� ������� 0��������������$�����9������M������ ������
0� ����6�� ����������$%%%&���������%���������*���"�!&���$��"�!&��������"��������6�"��� ������ 0��"��($77���63"�!&����&�%����6���7������7&���6��6"��6
0�� ��������.���8��������:���A�����.���/�� �������K�#�!��������/���$%%%&��.����*��'�����)2�!���������8��*�����/%%!#����������<�����!��8��"��"��&���&��"�������6�=� ���0��������:������A������/����� ���"��� ������� 0�
0�������������������������$%%%&����3"������&�����2��&$�������������������5��#�"��3���� ���3�
0������� �������8����� �� ����������$%%%&�� 9���/��#�!�����!�(�����2�(�������&�%����"��������������"��� ������� 0�
�����������K��������.����55?&�� �&���!���&������� #�&����%����"�!&���*��'�����������2����,��� ���������<99������� ������������9����9����7������
8����� ���� �����/��� �� ���0�����3�� �����0��������8����� ���/��� �� ����:��� ��/������ ��� ��� �����:��/����<�/������H����557'5F������<99���������9�� �9�����9�����M ��������
8����� ���"����$%%��6�4#�!��)���#������� $�/����������!��3�$�����&��&����������&��������%��"���������I����$%��3����G��C�������# �
8�������8;�� ��� ���C�������$%%%&��#��������&� ��������-��� $�����������"��/��#�!��#���)��%��!!������%��"����!!��������&��3��H�����3H�
������8��� ���0��� �� ������555&��:�����2��������������&�#���#��;� <<=������������9����9��K��5?�����
� �B���� ����0�/���!�B���8����555&��'�����)����(����.����0��&>���6�0�������C���������:�� ��:� �� � ���"��� ������� 0�
#! �������������� �����������������������������������������������������������������
��;��"�����C�����#���0��� �������I���I ������C�C�����55?&�� ���!���� ����6�:������������� '�����������(�����/�� ���������0��������C�� ��������8����� ��A���������2� ��� �����������.��;� ����.��;� ����3�
@���� ���/������#���B ��/����������$%%%&��������?�,�3�!���#�3�������������"��� ������ 0�
@���� ���$%%%�/��������!�����/�����C������$%%%&�������������'��%�����3��'��@�3����� 72�(�������&$�����������"��� ������� 0������<99����� ������9���9����������
@���� ���A���=�����=���.���� ;�������555&��,�������(!�)�����2������.����� #�!�'�����)���-3!������0�������C���������:�� ���:� �� � ���"��� ������� 0�
,���������=�����55?&��"��'��3���%�/&�������$�"������������(�����3���%�0��"���5������3�� �����0��������( ����8����� �������:�� ����/���=����0)
,��� ��������"���6��:�� ���A���������55?&��8�&����/��#�!� ���!����&�8�!��5��������>)���!!����&�2�����%��� #!!������ #!!�������5�(!�)�&�8�����&�.����$�2�����3"�����%6�"��� ������� 0�
,��� ��������"���6��:�� ���A��������$%%%&��"������#���%�.����������������<�0��"!��"�����������"������#���%�.���������"����������"��� ������� 0������ �������9������
!�������A�,���/��� ����/�����555&��/������������%�53�����3����3��!���&�����3����3����&��/%%�3�-�����"���6�6�,�>���8�����6���2�����,��� �����"��� ������� 0�
# 0��,�����$%%%&���������%��"����#�"�������0�����( ����30������<99������� ������9/��/�����M$����
3�� �����0��������0� ����� ��:��������$%%%&��8�(���&���3������6�3��H�����3H�
3�� �����0��������0� ����� ��:���������55F&��������� �#�$�/����3�*����#������'�����4�'7$��3�H�����3H�
3�� �����0��������8����� ���/��� �� ������555&��������!�/�����������%�5������!�'��������� <<=.�������������2�(������"��� ������� 0�
3�� �����0��������( ����8����� �������:�� ������55G&�� <<A�������/�������������8��"�����3��"��� ������� 0�
3�� �����0��������( ����8����� �������:�� �����$%%%&��8���#������(�����$�"��������>)������2�(�������&�%���0��"���5�������/���=����0�� ��
3�� �����,��� ��������! ��������$%%%&�� �3���"���$������3�����!�5�����6�"��� ������� 0������<99����� ������9�������9����������
3�� �����!���,�����(��� ���0��� � �����$%%%&���#���%�2��3"����������6�"��� ������� 0������<99������ ������9�� '� ;9�����
:� �����"���A��� �����!���!�� ;��.���:������.����555&��"��������!���(�3���%�.�!%����2�%��������"���3������%�����!��8��"��� ���!���6�0�������C���������:�� ���:� �� � ���"��� ������� 0�
A����0�������55G&������������"����3��!�������3�$�"�� ��3�!�����������0��"���5�������"��� ��'����� 0��������������9���� ��� ���90)890)8�%%�
A������������$%%%�6+.")�2#��!�8������B$�"����&�%���5���)��������������/3��������2#��!�5�-����6�"��� ������� 0�
�������������� ����������������������������������������������������������������� #"
/�������)����55G&��0� ����6�� ����������"��0��"�������%�'�����)����/����3���'�����)�8��-������"��� ������� 0�
/�������A� �����8����� ���C�������$%%�&�� �3����������0��"���5�������)��������@)�
/�������A� �����8����� ���C�������$%%%&�� �3#!�)���!�����������!!�������&�������������$�."�������25�������������&6�)��������@)��$%%%������<99�����������9�� �9C��������$%%%9������������ ������
/�������A� �����8����� ���C�������$%%%&����3"����/!!���&�����2��&��)��������@)������<99�����������9��������9���9����9�������9��� ��)��0� ���������
/���� ��������$%%%&��:��0����������/������5������������A ��������I)������<99��������� �����9 �����������-,���, L�$��
�����0��� �� ������0� ���������H�������$%%%&����������$�"���������%��"���"�!&����������������6�3���� ����3�
����� �����������8����� ������0����� ��� ����������$%%�&������<99��������������9��9��;M ��������
����� �����������(�������$%%%&����������*���"�!&�0��!�"����#���3��'������6���0��C������3���� ����3������<99��������������9�����9������9�
����� �����������(�������$%%%&�����&�����,��-����"-.���"�-���>���6�3���� ����3�
�����A���������)����� �����$%%%&����������*��������!�����&�6�3���� ����3�
�����/����C��������8����� �����$%%%&���������������3�5������'������������-��� 63���� ����3�
��0�����C�������$%%%&�����&�������!!����'��3����������3��H�����3H�
��0�����C�������$%%%&�����&�������#&����/�&�������3��H�����3H�
2�/��0�����C�������$%%%&����3!#&�������%�&��3���������!���%�5��������$�8��3"�������"��� ������ 0������<99�������������9������� ��9������9����� ��9�$%'74F9�$%'74F�����
2�/��0�����C�������$%%%&��5������!�/�����������%��"��'�(#!�������C���������&��������)�������"��� ������� 0�
2�/�� �����������0������3�� ������������ ��� ��������,������� ���)�� � ����� ���$%%%&�� �!!����"��#�"��"������"��� ������� �0�
2�/�� �����������0������1�� ��������������:�� ������555&��/����3�*�������%�3��$�"��"��������%���%����������3"��!��)�.��������"��� ������� 0������<99��������������9A�����9 ���9 ��������
2�/�� �����������8����� �����$%%%&�����&�������%�5������ <<<���&�������"��� ������� 0�
2�/�� �����������(��� �������2����� �����������555&��0������$ <<<�0����������"�(2����0����2�3��&�/��#�!�0��"��%�AA6=�'��3���6�"��� ������� 0������<99�����������9������9��%%'�G������
2�/��3�������"�����A�������$%%�&���(�������!�'#>!�3������������������ ���!!����2��������3��H�����3H������<99�������������9�����9��9�����9���� ���9����M��������
## �������������� �����������������������������������������������������������������
����������������� �����
����������������� ���� ��������� ������������� �����
��������� ��������������������������������� ������
�������� ����� ������ � � �� ���������
�������� ����� ����������� � ����� ����� ����
������������������ ��������������� �������������
�����������������
�������������� ����������������������������������������������������������������� #$
������������������������� ���������������� ���������� ��������������������������� �!����������������������"���� ����#����������������$�%���&�����