Embed Size (px)
Citation preview

IB Biology BTHS
Effect of Various Temperatures on Fermentation Rate of Yeast Meher Pandher
Design Question: How will different water bath temperatures affect the rate of fermentation in yeast? Rationale and Hypothesis:
Fermentation involves yeast's ability to break down sugars in anaerobically, or without the presence of oxygen. Yeast's anaerobic respiration can be measured by the amount of carbon dioxide produced, because products of alcoholic fermentation include ethanol and carbon dioxide (Damon, McGonegal, Tosto, & Ward, 2007). Temperature is an essential part of the yeast's environment, so manipulating it will change the yeast's ability to produce carbon dioxide. The carbon dioxide output will be measured through the gas pressure sensor that will monitor the fermentation rate by keeping track of the change in pressure. (Redding & Masterman, 2007) If the experiment is carried out correctly, then the optimal temperature for yeast fermentation will be around 40 degrees Celsius while temperatures any lower or higher than that will lead to lower carbon dioxide production, and therefore lower rates of fermentation.
Variables Units Uncertainties
Independent Variable Temperature (20, 30, 40, 50, 60)
Degrees Celsius +/ 1 degree Celsius
Dependent Variable Gas Pressure kPA/s +/ 0.000001 kPA/s
Controlled Variables Units Possible effects on results
Method of control
amount of glucose in yeast solution
mL Fluctuation in amount ofmedium of yeast suspension may alter amount of carbon dioxide produced
2.5 mL of 5% glucose solution used
amount of yeast solution used
mL fluctuation in amount of yeast solution used may alter amount of carbon dioxide produced
2.5 mL of yeast suspension used
amount of time data is time (minutes) Fluctuation in amount of 10 minute data
IB Biology BTHS
collected time data is collected will lead to a skewed rate of fermentation for the trials
collection period
incubation period time (minutes) fluctuation in time of incubation may skew rate of fermentation for trials
10 minute incubation period
Protocol Diagram attached on sheet Photo of Lab Setup
Materials: logger pro, yeast solution, glucose solution, computer, 1hole rubberstopper assembly, plastic tubing with Luerlock fitting, 5% glucose solution, ring stand, beaker, water, test tube, thermometer,

IB Biology BTHS
vegetable, yeast, test tube clamp Procedure (Redding & Masterman, 2007)
● Yeast solution was prepared by mixing 7 grams of yeast in 100 mL of water and heating the
solution to about 40 degrees for 10 minutes ● Gas pressure sensor was connected to computer and logger pro was opened ● Plastic tubing was connected to valve on gas pressure sensor ● Water bath was prepared to appropriate temperature (20, 30, 40, 50, or 60 degrees Celsius) with
600700 mL of water. Thermometer was used to maintain temperature throughout experiment. ● Ring stand was set up with attached test tube clamp ● 2.5 mL glucose solution was placed into a test tube. ● Test tube was secured in test tube clamp and placed in water bath so that most of the test tube
was completely covered by water in the water bath. ● Yeast solution was stirred, and 2.5 mL yeast solution was added and mixed into test tube with
glucose solution. ● Enough vegetable oil to completely cover surface of yeast/glucose mixture was added to the test
tube. ● Singleholed rubberstopper was inserted into test tube with an airtight fit ● Test tube was incubated for 10 minutes in water bath. ● After incubation period, data collection began (by clicking button) and ran for 15 minutes while
temperature of water bath was maintained. ● After data collection, bestfit linear regression line was added to the graph on logger pro, and the
slope was recorded. A copy of the graph and the regression line was kept. ● This process was repeated for each individual temperature (20, 30, 40, 50 or 60 degrees Celsius)
with 5 replicates each ● After data collection, plastic tubing was disconnected, rubber stopper was removed, and contents
of test tube and water bath were discarded in waste beaker.
Data Collection
IB Biology BTHS
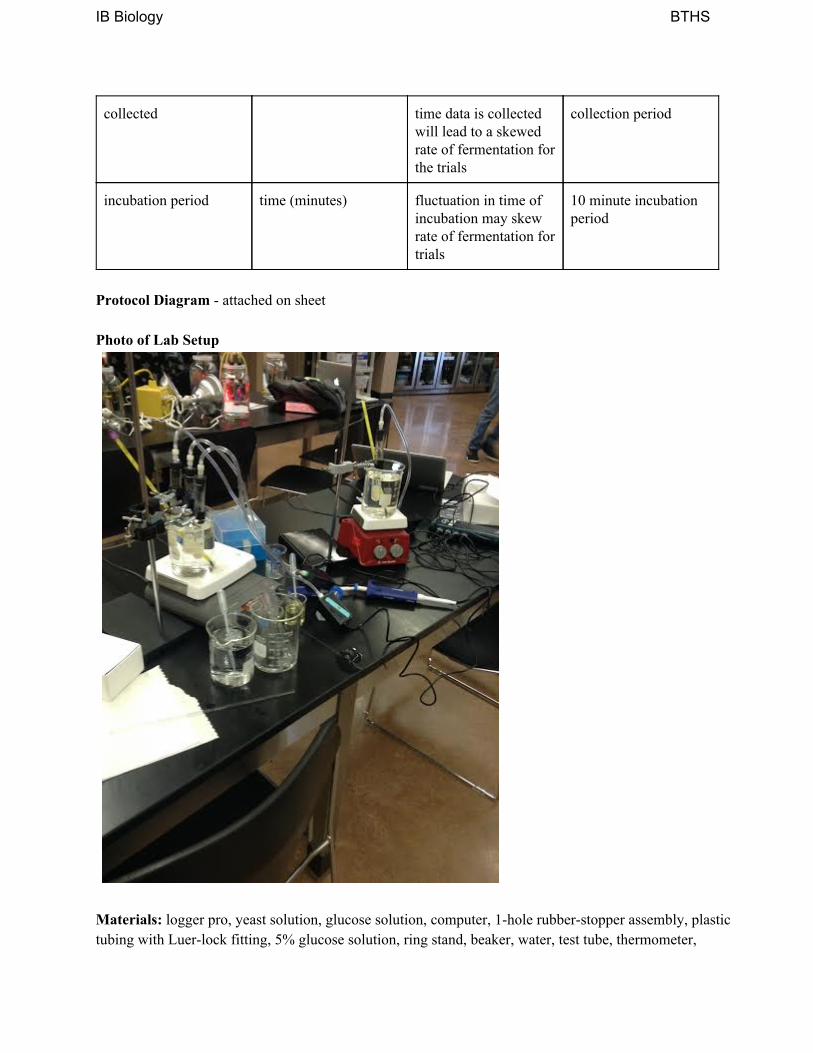
Table 1: Raw Data of Beginning and Ending Gas Pressures (kPA) (+/ 0.01 kPA)
20°C 30 °C 40 °C 50 °C 60 °C
Trial 1 Pressure at beginning of data collection (kPA) (+/ 0.01 kPA)
103.40 108.95 113.67 103.77 112.66
Pressure at end of data collection (kPA) (+/ 0.01 kPA)
102.76 116.09 125.23 102.38 111.92
Trial 2 Pressure at beginning of data collection (kPA) (+/ 0.01 kPA)
105.41 109.27 114.47 105.12 110.80
Pressure at end of data collection (kPA) (+/ 0.01 kPA)
104.72 115.77 119.02 104.37 109.44
Trial 3 Pressure at beginning of data collection (kPA) (+/ 0.01 kPA)
103.27 104.53 105.44 104.15 108.56
Pressure at end of data collection (kPA) (+/ 0.01 kPA)
102.63 108.40 116.13 103.08 107.54
*Uncertainties are to the hundredths place because that is the specificity of the gaspressure sensor. Qualitative Data: After running the trials and detaching the rubber stopper from the test tubes, the 30°C and 40°C trials emitted a small popping noise. However, this noise was not audible in the 20°C, 50°C or 60°C trials.
IB Biology BTHS
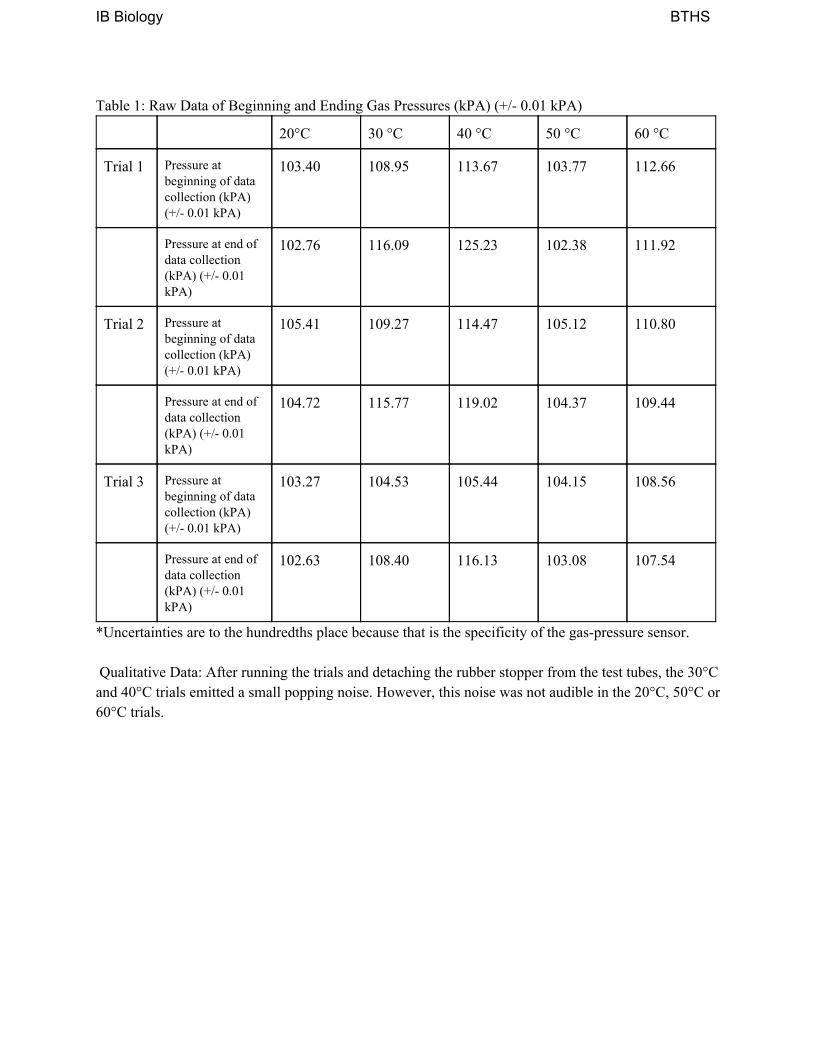
Graph 1: Raw Data (Pressures 1,2, and 3 = 20°C & Pressure 4 = 30°C)
Graph 2: Raw Data (Pressures 1 and 2 = 30°C & Pressures 3 and 4 = 40 °C)
IB Biology BTHS
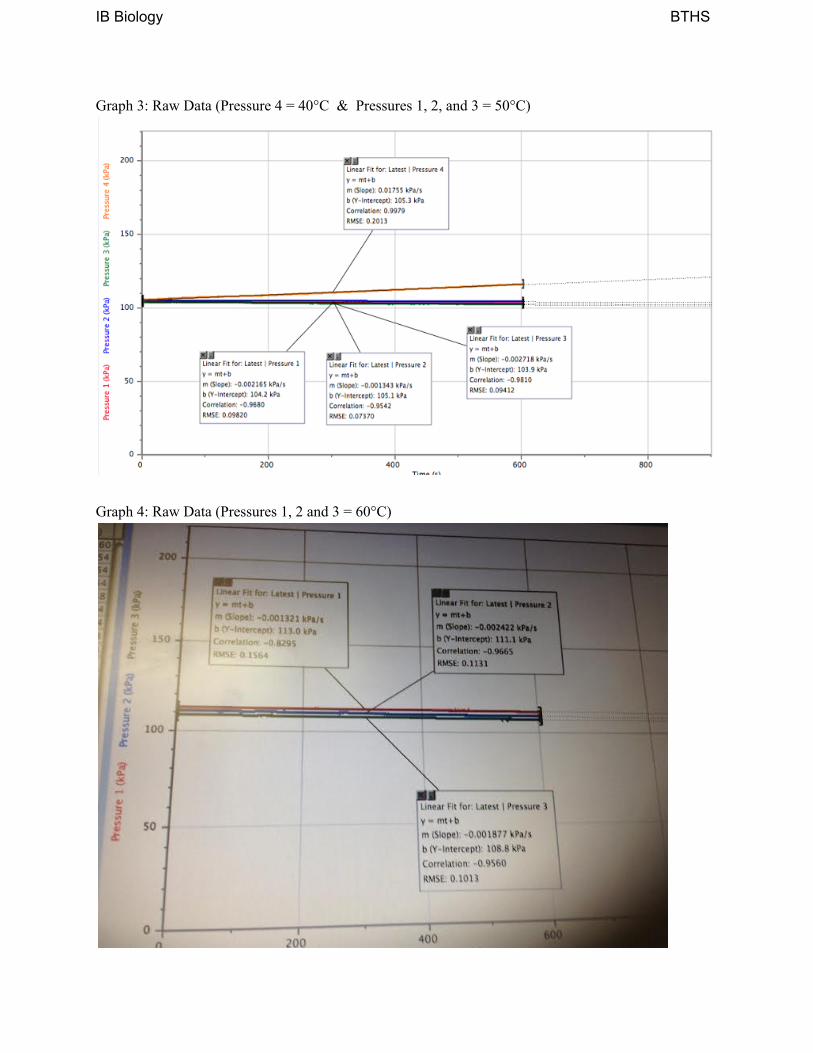
Graph 3: Raw Data (Pressure 4 = 40°C & Pressures 1, 2, and 3 = 50°C)
Graph 4: Raw Data (Pressures 1, 2 and 3 = 60°C)
IB Biology BTHS
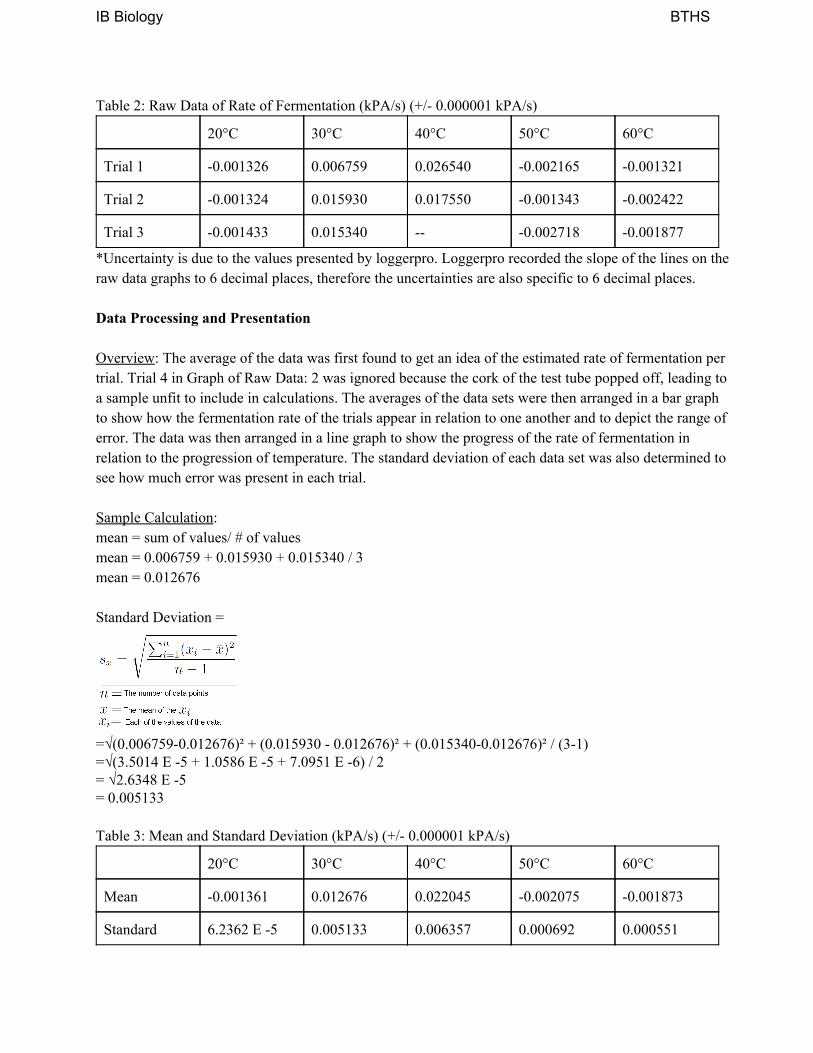
Table 2: Raw Data of Rate of Fermentation (kPA/s) (+/ 0.000001 kPA/s)
20°C 30°C 40°C 50°C 60°C
Trial 1 0.001326 0.006759 0.026540 0.002165 0.001321
Trial 2 0.001324 0.015930 0.017550 0.001343 0.002422
Trial 3 0.001433 0.015340 0.002718 0.001877
*Uncertainty is due to the values presented by loggerpro. Loggerpro recorded the slope of the lines on the raw data graphs to 6 decimal places, therefore the uncertainties are also specific to 6 decimal places. Data Processing and Presentation Overview: The average of the data was first found to get an idea of the estimated rate of fermentation per trial. Trial 4 in Graph of Raw Data: 2 was ignored because the cork of the test tube popped off, leading to a sample unfit to include in calculations. The averages of the data sets were then arranged in a bar graph to show how the fermentation rate of the trials appear in relation to one another and to depict the range of error. The data was then arranged in a line graph to show the progress of the rate of fermentation in relation to the progression of temperature. The standard deviation of each data set was also determined to see how much error was present in each trial. Sample Calculation: mean = sum of values/ # of values mean = 0.006759 + 0.015930 + 0.015340 / 3 mean = 0.012676 Standard Deviation =
=√(0.0067590.012676)² + (0.015930 0.012676)² + (0.0153400.012676)² / (31) =√(3.5014 E 5 + 1.0586 E 5 + 7.0951 E 6) / 2 = √2.6348 E 5 = 0.005133 Table 3: Mean and Standard Deviation (kPA/s) (+/ 0.000001 kPA/s)
20°C 30°C 40°C 50°C 60°C
Mean 0.001361 0.012676 0.022045 0.002075 0.001873
Standard 6.2362 E 5 0.005133 0.006357 0.000692 0.000551

IB Biology BTHS
Deviation
*Uncertainty is due to the values presented by loggerpro. Loggerpro recorded the slope of the lines on the raw data graphs to 6 decimal places, therefore the uncertainties are also specific to 6 decimal places. Graph 5: Processed Data Bar Graph
Graph 6: Processed Data Line Graph
Conclusion and Evaluation

IB Biology BTHS
Conclusion: The data does support the hypothesis because the highest rate of fermentation occurred at 40°C. The 30°C trial exhibited the next largest fermentation rate while the 20°C, 50°C, and 60°C trials also showed negative fermentation rates, indicating that the yeast was inactive at those temperatures. The results show that yeast is prone to high rates of fermentation from 3040°C. Any colder than that and the yeast does not have the thermal energy required to become active. Exposure to any higher temperatures kill off the yeast, resulting in no fermentation. The results indicate that 40°C is the ideal temperature for high yeast fermentation rate. There were no anomalies, but one 40°C trial had to be thrown out because the cork popped off in the middle of the data collection. This lead to a sudden dip in air pressure, skewing the rate of fermentation for the particular trial. The data collected by this experiment is in accordance with other scientific research, since most organisms generally have an optimal temperature. Usually, any variance too far away from the optimal temperature results in limited activity, as was reiterated by this experiment. What would be interesting to see next is if a change in incubation temperature and data collection temperature will affect the rate of fermentation in any way. For example, if the yeast was incubated at a temperature of 30°C, and then moved to a water bath set at 50°C, will the change in temperature affect the rate of fermentation? How long will it take the yeast to become affected by the temperature change? Evaluation: There were no anomalies, but the faulty trial was discarded so its inaccurate results would not skew the mean and standard deviation of the 40°C variable. However, because of the limited time available, only 3 replicates were conducted instead of 5. This increased the likelihood of error since more replicates allows for a more accurate mean and standard deviation. For better results, next time the experiment should be conducted with 5 replicates, and time should be managed accordingly. Also, it was difficult to maintain a constant temperature throughout both the incubation and data collection period. Often, the temperature would rise or fall a couple degrees below the required value. This may have compromised some of the results, and led to skewed measures of gas pressure. The fluctuating temperatures was kept somewhat in check with the addition of ice cubes and hot water, but the variance was only avoidable to a degree. Another factor that may have affected the results was the amount of water bath that covered the yeast in the test tubes. Some test tubes were more submerged in the water bath than others. This may have altered the internal temperature of the test tubes, making some yeast trials hotter/colder than the others. For example, two test tubes both exposed to a 50°C water bath should have the same internal temperature inside the tube. However, if one test tube is more submerged in the hot water bath than the other, the internal temperature of that test tube may be higher than the other test tube that was not as submerged. In order to produce a more accurate experiment, next time the amount of test tube submerged in the hot water bath should be made constant. Also, the temperature should be kept as close to the necessary value as possible, adjusting the water bath with hot water and ice cubes more attentively. References Damon, A., McGonegal, R., Tosto, P., & Ward, W. (2007). Higher level biology: Developed

IB Biology BTHS
specifically for the IB diploma. England: Pearson Education Limited. Redding, K., Masterman, D. (2007). Biology with vernier. Beaverton, OR: Vernier Software
Technology.


![NAVRACHANA INTERNATIONAL SCHOOL VADODARA IB DP PHYSICS HL ... · PDF fileInternal Assessment Group 4 Sciences [Biology, Chemistry & Physics] Weighting - 20% Time – 10 hours The new](https://img.pdfslide.tips/doc/110x75/5aa30cfb7f8b9ab4208dd9d8/navrachana-international-school-vadodara-ib-dp-physics-hl-assessment-group-4.jpg)