Embed Size (px)
Citation preview

ACTA
UNIVERSITATIS
UPSALIENSIS
UPPSALA
2007
Digital Comprehensive Summaries of Uppsala Dissertationsfrom the Faculty of Science and Technology 369
Identification of ViscoelasticMaterials by Use of WavePropagation Methods
SAED MOUSAVI
ISSN 1651-6214ISBN 978-91-554-7033-3urn:nbn:se:uu:diva-8324

���������� �������� �� ������ �������� � �� �������� ������� � ������������������������ �������������� �� ������� ������ �������� �!� ���" �� ��#�$ %���� ������ % ���� % &�������' (�� �������� )��� �� ������� � *)�����'
��������
+������ *' ���"' ,����%����� % -���������� +�������� �� �� % .��� &�������+�����' /��� ����������� ���������' ������� ��� � ���� ����� � � ����������� ������� �� �� ������� � ��� �� ��� � ������ 012' $1 ��' ������',*34 2"562�6$$!6"�0060'
7����� ����� �� &���8� ���� ���� ��� ��������� ���� �������� �� ������)��� ����������' (�� ���� )��� ���� %� ��������� % �������� �� ������ % �)�������� ��������� ������������ 9&++/: �� ���������� 9&&:' (�� ������� % ������������ )��� %�� � �� ���� � ����� �� �������' / ����������� ������� % ��%%������������ ��������� %� ������ ������ �� &���8� ���� )�� �������' ,� )�� ��)���� � ;�� �������� % ������ ������ �� &���8� ���� ������� ��� ��������� �������'7��������� ��������� )�� �������� � ��� %��<���� ���� $6�$ =>? %� &���8� ����'/ 6�<��������� ����� >�=�� �������� ��� 9*>&3: �������� %� �����%����� %
������ ������ ��� ��� ��������' () ������%��� ��������� )��� ��� �����������' 3�������������� ��� �������� % ��� ������ ������' (�� ������ ������ % && )�������%��� ���� &++/ �� �������� ����� �� ��� ��������� ������ ������ )�� � ���������� )��� ��������� �������' (�� �������� )�� %�� � �� �������� ���������� % ���������� ��?� � ��� �������6�6��� �������� ����' (�� �������� )�� ��� ���� �����?� ��� ��������� ������ % %�� �������� �������������� ������ ���������' /�����6��=� �������� )�� ������� %� ��� ������ ���������' ����?�� *>&3 �%%�������� ��<����� =)����� ���� ��� ������ ������ ���� �� ������
���� %� ��������' (����%�� ��� ������ ���)�� � ���������� ����=�� �� � �� ������������� % ����������� �������� )�� ������� ������������ �� �������������' *����� �������� ������� ������ ��� � &++/ ��� �������� �� ����=��� % ��� ���� �������� ������ )��� )������ ���������� �������'/ ����� %� �����%����� % ������ ����� ������ %�� �������� ����� ������ �
���� ���;����� � � ������� ��<�� �� ��� ����� ��� ��� �����������' (�� �)6��������)��� ������ ���� ��� ����� � ��� ���� % �����6�������� �����' (�� ������� %������������� ����� )��� ��%%���� ��� ���������� �� ������� ����� )��� )��� ���� ����'
� ������ ,����%������ -����������� 7����� ������� 7����� &���@� ����� )����,�����
�� � ������� � ���� �� � ���� ���� ��� �� �� ���� � �������� !" #$%� ����������� ������ � &'#()( �������� �� � �
A *��� +����� ���"
,**4 �1$�61��!,*34 2"562�6$$!6"�0060��#�#��#��#����650�! 9����#BB��'=�'��B������C��D��#�#��#��#����650�!:

To my family


List of Papers
This thesis is a summary of the following papers: I S. Mousavi, D.F. Nicolas, B. Lundberg, Identification of complex
moduli and Poisson’s ratio from measured strains on an impacted bar, Journal of Sound and Vibration, Vol. 277, 2004, p 971-986
II K. Mahata, S. Mousavi, T. Söderström, On the estimation of com-
plex modulus and Poisson's ratio using longitudinal wave ex-periments, Mechanical Systems and Signal Processing, Vol. 20, Nov. 2006, p 2080-2094
III S. Mousavi, K. Welch, U. Valdek, B. Lundberg, Non-equilibrium
split Hopkinson pressure bar procedure for non-parametric iden-tification of complex modulus, International Journal of Impact Engineering, Vol. 31, 2005, p 1133-1151
IV K. Welch, S. Mousavi, B. Lundberg, M. Strømme, Viscoelastic
characterization of compacted pharmaceutical excipient materials by analysis of frequency-dependent mechanical relaxation proc-esses, European Physical Journal E, Vol. 18, Sept. 2005, p 105-112
V M.-N. Bussac, P. Collet, G. Gary, B. Lundberg, S. Mousavi, Vis-
coelastic impact between a cylindrical striker and a long cylin-drical bar, International Journal of Impact Engineering, Avail-able online 24 March 2007
VI S. Mousavi, L. Hillström, B. Lundberg, Identification of complex
shear modulus from measured shear strains on a circular disc subjected to transient torsion at its centre, submitted for publica-tion in the Journal of Sound and Vibration

The author’s main contributions to these papers are as follows: I. Part of theoretical work, major part of numerical and experimental
work, and part of writing. II. Part of theoretical work, major part of experimental work, part of
writing. III. Part of theoretical work, numerical work, major part of experimen-
tal work, and part of writing. IV. Part of experimental work. V. Experimental work, and part of writing. VI. Theoretical work, part of numerical work, experimental work, and
part of writing.

Contents
1. Introduction...............................................................................................11
2. Viscoelastic Waves ...................................................................................14 2.1. Constitutive relations.........................................................................14 2.2. Extensional and torsional waves in bars............................................16 2.3. Shear waves in circular discs.............................................................17
3. Viscoelastic Impact ...................................................................................19 3.1. Theory ...............................................................................................19 3.2. Experiments.......................................................................................21 3.3. Results and discussion.......................................................................23
4. Identification Based on Extensional and Torsional Waves in Bars ..........26 4.1. Theory ...............................................................................................26 4.2. Experiments.......................................................................................28 4.3. Results and discussion.......................................................................29
5. Identification Based on SHPB ..................................................................33 5.1. Theory ...............................................................................................33 5.2. Experiments.......................................................................................36 5.3. Results and discussion.......................................................................38
6. Identification Based on Shear Waves in a Circular Disc ..........................42 6.1. Theory ...............................................................................................42 6.2. Experiments.......................................................................................43 6.3. Results and discussion.......................................................................44
7. Conclusions...............................................................................................48
8. Summary in Swedish ................................................................................50
Acknowledgements.......................................................................................52
References.....................................................................................................54

Nomenclature
A cross-sectional area a length of specimen b distance from the bar/specimen interface, outer boundary c wave speed E complex extension modulus, elastic constant f frequency G complex shear modulus, elastic constant, impulse response k wave number M complex modulus N normal force, wave amplitude n number of equations P wave amplitude r radial co-ordinate, impedance ratio t time V impact velocity v particle velocity, displacement Z characteristic impedance z axial co-ordinate x axial co-ordinate W energy Greek � damping coefficient � wave number � relaxation strength � phase angle, Dirac delta function � wave propagation coefficient, shear strain � viscosity � strain wavelength Poisson’s ratio � density

� stress shear stress, relaxation time � frequency Subscripts A strain gauge position B strain gauge position b strain gauge position, bar C strain gauge position cl classical E extensional G shear HI high I incident LO low lf low frequency m number of sections N negative direction n number of sections/equations P positive direction, provisional R reflected r Debye parameter (relaxed) T transmitted, shear u Debye parameter (un-relaxed) M measured 1 first, striker 2 second, bar Superscripts d dissipative e elastic M measured

10

11
1. Introduction
The first systematic studies of the viscoelastic behaviour of materials were carried out during the 19th century by Weber, Maxwell and Boltzmann. Ma-terials with such behaviour are of great importance when it comes to sup-pressing and controlling vibrations in structures and structural elements which may lead to fatigue, noise pollution, instability and other problems.
In order to make use of the unique properties of these materials, one needs extensive knowledge about their viscoelastic properties. In recent years, therefore, a variety of methods have been developed for the characterization of viscoelastic materials.
In engineering applications, the behaviour of viscoelastic materials can often be approximated as linear. In the linear regime, an isotropic viscoelas-tic material is characterized by two independent complex-valued functions of frequency � . Such functions are, e.g., the complex extension modulus
)(�E , the complex shear modulus )(�G and the complex Poisson's ratio )(� . The relative magnitudes of the complex moduli for a given material
have been considered by Theocaris [1], while the general frequency depend-encies of these moduli and of the complex Poisson’s ratio have been exam-ined by Pritz [2].
A typical frequency range of interest in engineering applications may be from a few hundred Hz to a few kHz. In this frequency range, wave propaga-tion methods are suitable for identification purposes. Several such methods for identification of the complex extension modulus [3-18], the complex shear modulus [19] and the complex Poisson’s ratio [20] have been devel-oped.
Wave propagation methods based on measurements on bars under such conditions that the waves are not overlapping at instrumented sections have been used in several studies [3-9] concerning identification of complex moduli. It has been shown that for the case of extensional or torsional waves, at least two independent measurements are needed. Since these methods require that the waves do not overlap, long specimens are needed. Methods that permit overlap of the waves at measurement sections [10-17] require at least three independent measurements. For the case of flexural waves in beams such methods require at least five independent measurements. How-

12
ever, use of boundary conditions can reduce the number of measurements needed. These methods allow the use of relatively short bars.
Sometimes, the material under investigation cannot be manufactured in the size required by wave propagation methods, or instrumentation of the test specimen is difficult or impossible. Examples of such materials are foams, cements used in biotechnology and pharmaceutical excipients. For such materials, Split Hopkinson Pressure Bar (SHPB) testing offers a possi-bility. SHPB testing is commonly used when studying the constitutive prop-erties of materials at high (103 s-1) or very high (>104 s-1) strain rates. The method originates from the work by Hopkinson [21] and Davies [22], but today’s use is mainly due to Kolsky [23] who introduced the placement of a short specimen between two long bars, called pressure bars. The SHPB tech-nique was originally developed for testing materials in compression, but it has also been used for testing in torsion and other cases of load. The pressure bar materials commonly used have been high strength steel or titanium al-loys, which have very high mechanical impedance compared with viscoelas-tic materials such as polymers.
A review of problems and developments in classical SHPB testing has been provided by Gray III [24]. Recently, there has also been much interest in testing soft materials, which has lead to the use of viscoelastic low-impedance bars made of polymeric materials [25-32]. In polymeric bars, dispersion and damping are generally significant.
For a SHPB test to be considered valid, it is required that several condi-tions concerning the specimen should be approximately fulfilled: (i) Equilib-rium should prevail, (ii) the states of stress and strain should be uniform, (iii) the state of stress should be uni-axial, and (iv) the effects of friction at the bar/specimen interfaces should be negligible. These conditions are interde-pendent and sometimes in conflict. Thus, (i) requires low whereas (iii) and (iv) require high aspect ratios (length to diameter). The condition (ii) is in conflict with itself as axial uniformity requires a low and radial uniformity a high aspect ratio.
In order to achieve the best possible result with the SHPB technique it is of importance to have an incident wave that is suitable for the test. Recently, some effort has been made by Kumar et al. [33] to prescribe the loading and unloading in a SHPB test. Producing the incident pulse in a viscoelastic SPHB requires understanding of the process of impact between two viscoe-lastic bodies. The axial impact between flat-ended cylindrical elastic bars was considered in detail by Saint-Venant in the 1860s. In Paper V the axial impact between a cylindrical striker of finite length and a long cylindrical bar, both of linearly viscoelastic material, is considered. Theoretical results

13
for this impact process can serve as a guide for the choice of impact veloci-ties, dimensions and positions of sensors.
In Paper III, a modified SHPB test procedure for characterization of vis-coelastic materials was developed, and in Paper IV the mechanical proper-ties of some viscoelastic pharmaceutical excipients were identified by use of this procedure.
The aim of Papers I and II was to develop a procedure, based on propaga-tion of waves in a single test bar, for the identification of the complex exten-sion modulus )(�E , the complex shear modulus )(�G and the complex Poisson’s ratio )(� . Of principal interest was the assessment of linearity and isotropy. The procedure was applied to two materials of importance in engineering, viz., polymethyl methacrylate (PMMA) and polypropylene (PP).
Identification of complex shear modulus based on propagation of tor-sional waves in a prismatic bar requires a long test specimen (Paper I). Many materials used today are manufactured with other geometries like blocks, sheets and plates. Therefore, an identification method has been de-veloped in Paper VI that makes use of a circular disc specimen. Such a specimen geometry has not been used before.

14
2. Viscoelastic Waves
2.1. Constitutive relations Viscoelasticity concerns time-dependent deformation behaviour. In the vi-cinity of the glass transition temperature, long-chain polymers show strong viscoelastic behaviour such that the strain depends not only on the present load condition but also on the entire load history.
The relation between stress and strain in linearly viscoelastic materials can be expressed
dt)()()(0
� � �� ��t
tYt , (1)
where )(tY is the stress relaxation function and t is time. Fourier transfor-mation gives
)(ˆ)(ˆi)(ˆ ������ Y� , (2)
where )(ˆi)( ��� YE � is the complex extension modulus and f�2�� is the angular frequency.
The complex shear modulus )(�G can be defined similarly. For isotropic linearly viscoelastic materials, )(�E , )(�G and the complex Poisson’s ratio
)(� are interrelated by
)1(2 �� GE . (3)
The real part of the complex moduli, referred to as storage moduli, relates components of stresses and strains that are in phase. Conversely, the imagi-nary parts, referred to as loss moduli, relate components of stresses and

15
strains that are 90� out of phase. It is common to define the loss angles E� and G� as
EE
E ���
�)tan(� , GG
G ���
�)tan(� , (4)
where prime and double prime indicate real and imaginary parts, respec-tively, of the complex moduli.
The behaviour of viscoelastic materials can often be described by simple mechanical models composed of perfectly elastic springs and perfectly vis-cous dashpots. The standard linear solid (SLS) [34], shown in Fig. 1, is com-posed of two elastic springs with stiffness parameters eE (or eG ), dE (or
dG ) and a viscous dashpot with viscosity d� .
Fig. 1. Standard linear solid (SLS). eE (or eG ) and dE (or dG ) represent the stiffness of the springs and d� the viscosity of the dashpot.
The complex modulus )(�E can be expressed in terms of the constitutive parameters eE , dE and d� as
dde
ded
i)i()(
�����
���
�EE
EEE . (5)
This is a parametric description of a viscoelastic material. For materials with more complex behavior, several SLS modules can be combined in se-ries or in parallel with each other. By use of Debye relaxation parameters, Eq. (5) can be rewritten as
� �
i1)(
��
�� ruu
EEEE , (6)

16
where )( ded EE ��� (relaxation time, defining the time scale of the relaxation process), eEEu � (un-relaxed modulus at frequencies � 1�� ),
)( dede EEEEEr �� (relaxed modulus at frequencies � 1�� ). A mate-rial may have several relaxation mechanisms.
It can be shown [35] that
)tan(2��2 EEE
WW ���
��
���
���
�� , (7)
where W� and W are the energy dissipated and the maximum elastic en-ergy stored per cycle of deformation, respectively, and E� is the phase angle by which the strain lags behind the stress. Thus, )tan( E� is a measure of the relative energy dissipation in the material. From a parametrically identified complex modulus, one can obtain the energy dissipation peak and the relaxa-tion strength, quantities which provide insight into the physical processes and structures of the materials. From Eqs. (6) and (7), the dissipation factor
)tan(� can be expressed in terms of the model parameters. Setting the de-rivative of )tan(� with respect to � to zero gives the maximum dissipation frequency,
d
2eedmax
max �2�2 �� EEEf �
�� , (8)
and the relaxation strength, rru EEE )( ��� . The relaxation strength can be written in terms of model parameters as ed EE�� .
2.2. Extensional and torsional waves in bars The governing equation in terms of strain for both extensional and torsional waves in slender prismatic bars is
),(ˆ)(),(ˆ 22
2
������ zzz
��
� , (9)

17
where ),(ˆ �� z is the Fourier transform of the relevant strain component ( ),(ˆ �� zzz for extensional waves and ),(ˆ �� � zz for torsional waves). Also,
)(�� is the wave propagation coefficient
)(
22
����
M�� , (10)
where )(�M is the complex extension modulus )(�E for extension and the complex shear modulus )(�G for torsion, and � is the density of the mate-rial. The general solution of Eq. (9) is
zz NPz �� ���� e)(ˆe)(ˆ),(ˆ �� � , (11)
where )(ˆ �P and )(ˆ �N are frequency-dependent complex-valued ampli-tudes of harmonic waves travelling in opposite directions. The damping co-efficient )(�� is the real part of the complex wave propagation coefficient for both extension and torsion, and the wave number )(�k is the imaginary part. The wavelength is inversely proportional to the wave number k ,
k2�� .
2.3. Shear waves in circular discs Axi-symmetric shear waves in circular discs with constant thickness are governed by the differential equation
0ˆ)1)((ˆˆ 2
2
22 ���
��
��� vr
rvr
rvr � , (12)
where v̂ is the Fourier transform of displacement field ),( trv , Tc�� � is a complex wave number, and Tc is the shear wave speed. The shear strain �̂ is calculated from the displacement filed as rvrv ˆˆˆ ����� . The general solution of this equation is a linear combination of the Hankel functions
)(i)()( 11)1(
1 ��� YJH �� and )(i)()( 11)2(
1 ��� YJH �� , with r�� � . The general solution can be written as
)()(ˆ)()(ˆˆ )1(1
)2(1 rHNrHPv ���� �� , (13)

18
where )(ˆ �P and )(ˆ �N are complex-valued amplitudes. Because of the as-ymptotic behaviour of the Hankel functions, these complex amplitudes can be shown to be associated with outgoing and ingoing waves, respectively.
The shear strain �̂ can be calculated using the differentiation rules )()/1()()()d/d( )(
1)(
0)(
1 ����� jjj HHH �� with �j 1, 2. It can be expressed as
!
"#$
%��
!
"#$
%�� )(2)(ˆ)(2)(ˆˆ )1(
1)1(
0)2(
1)2(
0 rHr
rHNrHr
rHP ��
����
��� . (14)

19
3. Viscoelastic Impact
3.1. Theory The incident pulse in a SHPB is generated by the impact of a striker, which is preferably made of the same material as the bars. For testing of soft mate-rials, in particular, the bar and the striker are commonly made of polymeric materials with low characteristic impedance. These materials often show strong viscoelastic behaviour. Therefore, viscoelastic impact between a cy-lindrical striker and a cylindrical bar is of fundamental importance in SHPB testing of materials with low characteristic impedance.
By the assumptions that initially plane cross-sections remain plane and radial inertia can be neglected, the wave motion in the striker and the bar is governed by the two differential equations vAxN ˆiˆ ����� and
AENxv ˆiˆ ���� , where x is an axial co-ordinate with origin at the striker/bar interface as shown in Fig. 2.
Fig. 2. Axial impact between a cylindrical striker and a long cylindrical bar of a viscoelastic material.
The general solution of the two governing equations is �� � xNN �eˆˆp
x�N en and )eˆeˆ)(1(ˆ npxx NNZv �� ��� � where )(ˆ
p �N and )(ˆn �N are am-
plitudes at 0�x associated with waves travelling in apposite directions and 21)( �EAZ � is the characteristic impedance.
Let the velocity responses of the impact faces of the striker and the bar to impulsive forces )(t� be )(1 tG and )(2 tG , respectively, with velocities and forces directed into the impact faces defined as positive. Also, assume provi-

20
sionally that the impact faces of the striker and the bar remain in contact after their initial contact at time 0�t . As a result of impact, the velocities of the impact faces then become )()()( p111 tFtGVtv &�� and �)(2 tv
)()( p2 tFtG & , respectively, where )(p tF is a provisional impact force. As the convolutions )()( p1 tFtG & and )()( p2 tFtG & are zero for 0�t , and the im-pact faces have common velocity )()( 21 tvtv � for 0�t , the provisional im-pact force can be determined from the integral equation [36, 37]
' ( )()()()( 1p21 tHVtFtGtG �&� , (15)
where )(tH is Heaviside’s unit step function. Fourier transformation gives
21
1p ˆˆ
1i
ˆGG
VF�
��
. (16)
By using the conditions 0),(ˆ1 �� �LN , )(ˆ),0(ˆ
p �� FN �� and �),0(ˆ �v )(ˆ)(ˆ
p1 �� FG� for the striker and )(ˆ),0(ˆp �� FN �� , )(ˆ)(ˆ),0(ˆ p2 ��� FGv �
and 0)(ˆn ��N for the bar, one obtains the impulse responses
11
11
2
2
11 e1
e11ˆL
L
ZG �
�
�
�
��
� , 2
21ˆ
ZG � . (17)
Substitution of these relations into Eq. (16) gives
11
11
2
211
p e1e1
i1
2ˆ
L
L
RRVZF �
�
� �
�
���
� , (18)
where )1()1()()( 1212 rrZZZZR ������ is the reflection coefficient, related to the normal force, for waves in the striker at the striker/bar interface and 21 ZZr � is the striker-to-bar characteristic impedance ratio. The pro-visional impact force )(p tF is positive initially. If it remains nonnegative for all time, the actual impact force becomes )()( p0 tFtF � . If, instead, it changes sign from positive to negative at some finite time 0tt � , separation occurs at this time and the actual impact force becomes

21
' ( )()(1)( p00 tFttHtF ��� (19)
provided that the contact between the striker and the bar is not re-established. With )�0t , this expression applies also to the case that )(tF remains non-negative for all time.
The conditions 0)(ˆn ��N and �),0(ˆ �N )(ˆ
0 �F� give the normal force and the particle velocity
xFN 2eˆˆ0
���� , x
ZFv 2eˆ
ˆ2
0 ��� (20)
in the bar. The strain in the bar is given by 22/ˆ EAN , i.e.,
x
cZF
2eˆ
ˆ22
0 �� �� . (21)
3.2. Experiments Figure. 11 shows the experimental set-up. Cylindrical strikers and a cylindri-cal bar were fabricated from a single bar of polymethyl methacryalate (PMMA). The bar was first machined to a diameter of 11.93 mm, which made strikers and the bar fit into the barrel of an air gun with a tolerance of 0.06 mm. The ends of the strikers and the bar were machined to be flat and perpendicular to the centre lines. The length of the strikers used was 120.0 and 360.0 mm, and the length of the bar was 2000 mm. The bar was sup-ported by eight Teflon bearings mounted on the same heavy aluminium beam as the air gun. The impact end of the bar was located inside the barrel about 40 mm from the muzzle. Near the muzzle, axial slots in the barrel al-lowed the air to escape on both sides of the striker. In this way no significant air cushion was formed in front of the striker, and the pressure acting on the rear end of the striker during impact was negligible. The slots also made it possible to estimate the impact velocity from the time of flight of the striker between two axial positions.

22
Fig. 3. Experimental set-up for viscoelastic impact tests.
The bar was instrumented with pairs of diametrically opposite and axially oriented resistive strain gauges A, B and C at distances �Ax 120, �Bx 420 and �Cx 720 mm, respectively, from its impacted end. The active length of the strain gauges was 6 mm, and they were connected to Wheatstone bridges followed by amplifiers (Measurement Group 2210B) with bandwidth 100 kHz so as to make the output signals proportional to the symmetric compo-nents of strain. These signals were recorded with sampling frequency 1 MHz by a 16-bit data acquisition board. Shunt calibration was used for each chan-nel.
A separate impact test was carried out in order to identify the complex modulus of the PMMA. In this test a standard lead projectile was fired with an air rifle against the impacted end of the bar. The projectile had a diameter of 4.5 mm, and length 5 mm approximately. The weight of the projectile was about 0.4 g. The complex modulus was identified non-parametrically and constitutive parameters eE , dE and d� were obtained by minimizing the difference between the non-parametric complex modulus and the complex modulus given by Eq. (5) for the three-parameter viscoelastic standard model. This was done in the frequency interval 0.5 to 32 kHz in the sense of least squares. The same number of discrete frequencies were considered in each subinterval 0.5-1, 1-2, 2-4, …, and 16-32 kHz. The details of the ex-periments for viscoelastic impact tests are can be found in Paper V.
The non-parametric complex modulus was estimated from the changes in amplitude and phase of a strain pulse travelling through sections A and C of the bar [7, 11]. Thus, the wave propagation constant is given by

23
* +* +AC
CA ˆ/ˆln xx �
���� (22)
and the complex modulus by 2)( �����E . The impact velocities of the 120 and 360 mm PMMA strikers were estimated to be 9.5 and 8.7 m/s. The velocities were scaled with factors 0.98 and 1.03 respectively in order to facilitate comparison of the strain pulse shapes calculated using parametri-cally estimated complex modulus and measured strains.
3.3. Results and discussion The non-parametric and parametric results for the complex modulus E of the PMMA material are shown versus frequency f in Fig. 4, where also the discrete points used for parametric identification are indicated with dots. The constitutive parameters of the SLS were estimated to be 78.5e �E
3.72d �E GPa and 75.4d �� MPas.
Fig. 4. Non-parametric (dots) and parametric (solid curves) complex modulus E of the PMMA versus frequency �/�2�f .
The experimental and theoretical results for the strains A� , B� and C� versus time t , and the corresponding spectrum 2
A�̂ versus frequency f are shown in Figs. 5 and 6. It can be seen that there is a good general agreement between the experimental and the theoretical results. Thus, (i) there are only small deviations in pulse shapes, which are mainly due to oscillations of the measured strains. Furthermore, (ii) the rise and fall of the measured main pulses are steep and their widths correspond to two transit times for the dis-

24
Fig. 5. Strain � versus time t at strain gauge stations A, B and C and strain spec-trum
2�̂ versus frequency f at strain gauge station A of PMMA bar. Comparison of theory (thick curves) and experiment (thin curves) for 120 mm striker. Measured impact velocity scaled by factor 0.98.
Fig. 6. Strain � versus time t at strain gauge stations A, B and C and strain spec-trum
2�̂ versus frequency f at strain gauge station A of the PMMA bar. Com-parison of theory (thick curves) and experiment (thin curves) for 360 mm striker. Measured impact velocity scaled by factor 1.03.

25
continuous viscoelastic wave front through the strikers, as predicted by the-ory.
Agreement according to (i) and (ii) requires that the conditions be close to 1D so that geometrical dispersion can be neglected. This means that the wavelengths of the predominating waves must be much larger than the diameter d of the striker and the bar, i.e. dfc ��, /e or
��f �dc /e 185 kHz.
26
4. Identification Based on Extensional and Torsional Waves in Bars
4.1. Theory An identification procedure for both extensional and torsional waves can be based on the use of redundant measurements of relevant strain components. This procedure was used by Hillström et al. [16] for identification of com-plex modulus E .
The procedure used here is based on measurement of n surface strains )(1̂ �� , )(ˆ2 �� , ..., )(ˆ �� n at sections �1z �2z ...< nz . These measurements
together with Eq. (11) give a system of n equations
!
"
####
$
%
� !
"#$
%
!
"
#####
$
%
�
�
�
)(ˆ
)(ˆ)(ˆ
)(ˆ)(ˆ
ee
eeee
2
1
)()(
)()(
)()(
22
11
��
����
��
����
����
����
nzz
zz
zz
NP
nn
���. (23)
Here, the three complex valued functions )(ˆ),( ��� P and )(ˆ �N are to be determined. Then, by use of Eq. (10), the relevant complex modulus )(�M can be calculated.
If the number of measurements corresponds to the number of unknowns, in this case three, there generally exists an exact solution for )(�� . Due to measurement errors, the result for )(�� at very low frequencies may give large errors in )(�E and )(�G . For higher frequencies, the results for
)(�E are valid only if the 1D requirement is satisfied. For )(�G , however, there is no such limitation.
For an over-determined system, with 3�n , there is no unique solution. However, it is possible to obtain an approximate solution in the sense of least squares by minimizing the error

27
��wAw ˆ/ˆˆ),ˆ(~ ���e , (24)
!
"
####
$
%
�
)(ˆ
)(ˆ)(ˆ
)(ˆ 2
1
��
����
�
n
�� ,
!
"#$
%�
)(ˆ)(ˆ
)(ˆ���
NPw ,
!
"
#####
$
%
�
�
�
�
nn zz
zz
zz
)()(
)()(
)()(
ee
eeee
)(22
11
����
����
����
���
A (25)
where )(ˆ �� is the column vector of measured strains ( zz� for the case of extension and �� z for the case of torsion), )(ˆ �w is that of complex ampli-tudes, and double bars denote the Euclidean norm.
The complex Poisson’s ratio )(� can be calculated using axial and circumferential strains measured at the same axial position and the relation
),(ˆ)(),(ˆ ������� zz zz�� . (26)
Equation (3) can be used to study the isotropy of the material. Due to the linearity of the system (23) and Eq. (26), the quality of the estimated Pois-son’s ratio can be improved by a joint estimation approach. Then, the circumferential strains do not need to be obtained at the same axial position as the axial strains. The requirement is a minimum of three axial strain measurements and one in the circumferential direction. With this approach, the system (23) and Eq. (26) are replaced by the system
!
"
###########
$
%
� !
"#$
%
!
"
###########
$
%
��
����
�
�
�
�
�
�
)(ˆ
)(ˆ)(ˆ)(ˆ
)(ˆ)(ˆ
)(ˆ)(ˆ
ee
eeee
ee
eeee
2
1
2
1
)()(
)()(
)()(
)()(
)()(
)()(
22
11
22
11
��
������
����
��
����
����
����
����
����
����
cm
c
c
n
yy
yy
yy
zz
zz
zz
NP
mm
nn
�
�
��
��
, (27)
where nz are the axial positions for axial strain measurements and my are those for circumferential measurements. Using the same least squares proce-

28
dure as above, one can obtain estimates for )(�E and )(� . In Paper II it has been shown that the joint estimation approach yields the best possible result for )(� compared to a simple or weighted averaging.
4.2. Experiments Two different materials were used in the experimental tests, polymethyl methacrylate (PMMA) and polypropylene (PP). PMMA is an amorphous polymer with relatively low loss, and at room temperature it is below the glass transition temperature (Tg). The density for PMMA used in the experi-ments was estimated to be 1183 kg/m3. PP is a semi-crystalline polymer with relatively high loss. Its glass transition temperature is below room tempera-ture. The density for the PP bars used in the experiments was 915 kg/m3. PP bars had been manufactured through extrusion, which led to some deviation from circular shape of the cross-sections of the bars. The materials used are typical for high and low loss materials and are commonly used in engineer-ing applications.
The tests were carried out for bars with dimension, 10 mm diameter and approximately 1000 mm length. Each test bar was instrumented at four dif-ferent sections ( 2zz � to 5z ) with strain gauges for measurement of the normal strains zz� and the shear strains z�� . Use was also made of the cir-cumstance that at a free end ( 1zz � ) of a bar these strains are zero, which provided 5�n strains, two of which were redundant, for the identification of the complex extension modulus )(�E and the complex shear modulus
)(�G , respectively. In addition, each bar was instrumented at a fifth section ( 0zz � ) with strain gauges for measurement of the normal strains zz� and
��� needed for the identification of the complex Poisson’s ratio ).(�
Fig. 7. Experimental setup for identification of complex modulus E . The bar was suspended with thin fishing wires to minimize the effect of supports. It was excited by impact.

29
Signals from the strain gauges were amplified and filtered prior to digiti-sation using a digital oscilloscope. The experimental set-up for axial impact tests is shown schematically in Fig. 7 and that for torsional impact tests in Fig. 8. In the latter tests, a torsional wave was generated by torsional impact at one end of the bar. The impacted end of the bar was machined and secured in a metallic support to prevent lateral movement during the impact. Data from the experiments were converted to strains using shunt calibration. The experiments were carried out with two different levels of excitation, high and low, in both the axial and the torsional and impact tests. The non-impacted end of the bars was always kept free. In all tests, the bars were excited using an air rifle. The experiments are described in detail in Paper I.
Fig. 8. Experimental set-up for identification of complex shear modulus G . The bar was suspended with thin fishing wires to minimize the effect of supports. The im-pacted end was secured for lateral movement using a metallic support.
For the joint estimation, a bar with length 2000 mm and diameter 10 mm was instrumented with both axial and circumferential strain gauges at four different sections, 210, 470, 685.5 and 854.5 mm from the impacted end. The eight strain signals obtained from these gauges were recorded with a sampling interval of 0.2 �s . The same recording equipment and experimen-tal setup as in Fig. 7 was used.
4.3. Results and discussion Some of the results for the 10 mm bars are presented here. Complete results for 10 and 20 mm bars are presented in Paper I. The results obtained for the complex moduli E , G and the Poisson's ratio versus frequency for the

30
10 mm bars are shown in Fig. 9. For PMMA, the results are presented up to 40 kHz, and for PP they are presented up to 15 kHz.
For both materials, the complex Poisson's ratio is approximately constant. The ratios of the complex extension moduli LOHI EE and the complex shear
Fig. 9. Complex Extension modulus E, complex shear modulus G and complex Poisson’s ratio for PMMA and PP versus frequency for 10 mm test bars.
moduli LOHI GG at high (index HI) and low (index LO) levels of impact excitation are shown versus frequency in Fig. 10 for PMMA and PP. For both materials, these ratios are approximately real and equal to unity, which indicates that the responses are very close to linear under the conditions of the tests.
The ratio EG )1(2 � is shown versus frequency in Fig. 11 for PMMA and PP. This ratio is expected to be real and equal to unity for an isotropic material. For the 10 mm PMMA bar, this ratio is very close to being real and equal to unity. For the 10 mm PP bar, it is approximately real but somewhat smaller than unity ( 9.0, ). This deviation from unity indicates a certain de-gree of anisotropy. It is believed that some anisotropy may be due to the extrusion process used for fabrication of the PP test bars.

31
Fig. 10. Ratios of complex extension moduli LOHI EE and complex shear moduli
LOHI GG of PMMA and PP at different levels of impact excitation versus frequency for 10 mm test bars.
Fig. 11. Ratio EG )1(2 � for PMMA and PP versus frequency for 10 mm test bars.
The results for extension modulus are valid for frequencies that fulfil the 1D requirement, while the results for complex shear modulus is valid for all frequencies. For PMMA at 40 kHz, the wavelength of quasi-longitudinal waves is approximately 55 mm or 5.5 diameters for the 10 mm test bar. For PP at 15 kHz, the wavelength of such waves is approximately 120 mm or 12 diameters for the 10 mm test bar.
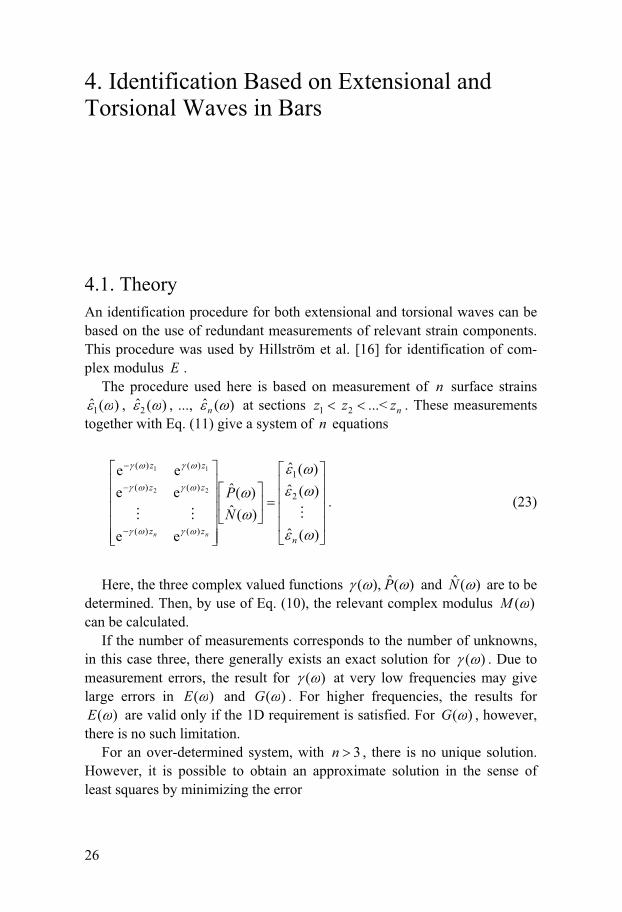
For the joint estimation of complex modulus )(�E and Poisson’s ratio )(� , the results obtained for PMMA from Eq. (27) are shown in Fig. 12. In
the frequency range 5-15 kHz, the quality of the result for Poisson’s ratio is
32
considerably improved compared with the results shown in Fig 9. It has been shown in Paper II that the joint estimation improves the quality of the esti-mated Poisson’s ratio and is especially helpful for cases where the excitation is poor or the measurement of axial and circumferential strain components at the same position is difficult or impossible.
Fig. 12. Results for PMMA from joint estimation of complex Extension modulus and Poisson’s ratio as functions of frequency. The results are based on an average of five experiments with eight measured signals, four in the axial and four in the circumferential direction.

33
5. Identification Based on SHPB
5.1. Theory Consider the SHPB shown in Fig. 13. A cylindrical specimen with length a and cross-sectional area A is placed between two cylindrical bars with cross-sectional area bA . The bars and the specimen are co-axial, and the contacts at the bar/specimen interfaces are assumed to be perfect. The mate-rial of the specimen is linearly viscoelastic with complex modulus )(�E , where � is the angular frequency, and density � . The material of the bars is linearly viscoelastic with complex modulus )(b �E and density b� . A wave
Fig. 13. Bars and specimen.
is generated in the left bar and at the test specimen it is partially transmitted into the right bar and partially reflected back into the left bar. The strain wave time histories for the incident wave )(IM t� , the reflected wave )(RM t� and the transmitted wave )(TM t� are recorded at a distance b from the specimen/bar interfaces.
It is considered that the wavelengths and b of waves in the specimen and the bars, respectively, are much longer than the diameters such that one-
34
dimensional conditions prevail. Let the )(ˆIM �� , )(ˆRM �� and )(ˆTM �� be the Fourier transforms of the measured strain histories and let b� , bZ be the wave propagation coefficient and characteristic impedance of the bars, re-spectively. Then, the relations hold for particle velocities and normal forces in the bars (indices 1 and 2 refer to left and right bar, respectively),
* +1b1b1b1b eˆeˆ1ˆ,eˆeˆˆRI
b1RI1
xxxx NNZ
vNNN ���� ����� �� , (28)
2b2b eˆ1ˆ,eˆˆT
b2T2
xx NZ
vNN �� �� ��� , (29)
where 1x and 2x are axial co-ordinates with origins at the bar/specimen interfaces, )(ˆ
I �N and )(ˆR �N are the amplitudes of the incident and re-
flected waves at the first bar/specimen interface, and )(ˆT �N is the ampli-
tude of the transmitted wave at the second bar/specimen interface. From these relations and those between normal forces, normal stresses and normal strains in the bars, the amplitudes of the incident, reflected and transmitted waves at the bar/specimen interfaces can be expressed in terms of the meas-ured strains as
.ˆeˆ,ˆeˆ,ˆeˆTMbbTRMbbRIMbbI
bbb ��� ��� bbb EANEANEAN ��� � (30)
The normal force ),(ˆ �xN and the particle velocity ),(ˆ �xv in the speci-men are given by
* +,ˆˆ1ˆ,ˆˆˆNPNP
xxxx eNeNZ
veNeNN ���� ����� �� (31)
where x is an axial co-ordinate with origin at the centre of the specimen and � and Z are the wave propagation coefficient and characteristic impedance of the test specimen. Using the continuity of normal forces and particle ve-locities at the bar/specimen interfaces and Eqs. (28) to (31), one can express the relation between the measured strains )(ˆRM �� and )(ˆTM �� as
35
)sinh(21
)(ˆ)(ˆ
TM
RM aZZ
ZZ b
b�
����
���
����
��� . (32)
At low frequencies and/or for a short specimen, aa �� ,)sinh( , and the complex modulus E of the specimen can be approximated by
-��
���
����
���,
�
1
,ˆˆ
222
1
TM
RMb
bb
bbblf
a
aAAa
AAEEE
�
���
���
(33)
If the characteristic impedance of the specimen is also low, one obtains from Eq. (32)
.1,1
,ˆˆ
22
b
2
RM
TMbbbcl
����
��,
ZZa
aAAEEE
�
���
(34)
This approximation is the one used in the classical (cl) SHPB procedure, which is based on the assumption that the specimen is in a state of equilib-rium.
The deviations of lfE and clE from E at low frequencies can be obtained by substituting the strain ratio (32) with !3/)()sinh( 3aaa ��� �, into Eqs. (33) and (34). This gives
!
"
##
$
%
!
"
##$
%���
����
���, 2
2
blf )(1
611 a
ZZEE � , 12 ��a� , (35)
!"
#$% �
!
"
##$
%���
����
��, 2
2
bcl )(
6111 a
ZZEE � , 12 ��a� . (36)

36
5.2. Experiments Two series of SHPB tests were carried out, one with PP specimens (Table 1) and two different bar materials, PMMA and aluminium (AL), and the other with four materials representing a broad range of excipients used in direct compression of pharmaceutical tablets. Microcrystalline cellulose (Avicel PH102, FMC, (MCC)) is a frequently used binder/filler due to its high com-pressibility and good strength characteristics [38]. From the starch category, maize starch (Starch 1500, Colorcon) was selected. Starches are also widely used binders/fillers in the pharmaceutical industry due to their availability and low cost. Sorbitol (Roquette) was selected as a commonly used pharma-ceutical sugar alcohol. The fourth material used was the cellulose derivative ethyl cellulose (Fluka Chemika). This material is used as both a tablet coat-ing and a matrix former in tablets designed to have a controlled drug release profile. It does not disintegrate or dissolve when administered orally as do the other three tablet types.
Table 1. Test Conditions for PP specimen.
Specimen size Strain amplitudes Test Bar
material Diameter [mm]
Length [mm]
RM� [ 610� ]
TM� [ 610� ]
1A PMMA 19.98 9.90 69.8 -751.4 1B PMMA 19.98 19.90 149.9 -878.0 1C PMMA 19.99 49.93 185.9 -692.6 1D PMMA 19.99 99.93 176.7 -626.4 2A AL 19.98 9.90 111.8 -135.2 2B AL 19.98 19.90 232.7 -152.1 2C AL 19.99 49.93 163.0 -69.8 2D AL 19.99 99.93 233.9 -95.7
A striker was fired by means of an air gun to generate the incident wave.
The material of the striker was the same as that of the bars used in each test. For the PP tests, the diameter of the bars, the test specimen and the strikers were approximately 20 mm. The densities of AL and PMMA bars were 2700 and 1183 kg/m3 respectively, while the PP test specimen had density 915 kg/m3. The nominal specimen lengths in the PP tests were 10, 20, 50 and 100 mm. The bars used in the experiments had a length of approximately 2000 mm, and they were supported on the test bench by 13 Teflon bearings, Fig. 14. The mass of the powder used to make each pharmaceutical tablet was varied and resulted in tablet thicknesses that ranged from 3.25 mm t o 6.76 mm. The experiments are described in detail in Papers III and IV.

37
Fig. 14. Experimental set-up for SHPB tests. Lengths in mm.
In order to achieve a good contact at the bar/specimen interfaces, a thin layer of silicon-based lubricant was applied on the contact surfaces prior to the tests. Two pairs of strain gauges where mounted on each bar at distances of 600 and 1000 mm from the interfaces. The strain histories measured at 600 mm were used throughout the experiments. For the test with AL bars, the elastic modulus E was used to calculate the wave propagation coeffi-cient b� . The elastic modulus of the AL bars was set to 71 GPa for all tests. For the PMMA bars, the two pairs of strain gauges mounted on the first bar were used to determine b� for each test by use of Eq. (22).
Since the contact condition between the bars and the test specimen was important for achieving good results, the bars and specimen were pre-loaded to 0.3 MPa approximately. The Fourier transform of the isolated reflected and transmitted waves were calculated using a fast Fourier transform algo-rithm.
The set-up used for the PP specimen and AL bars was also used for the pharmaceutic-tablet tests. However, AL bars with diameter 11.3 mm were used to agree with the standard size of the tablets. The striker used was a 40 mm long AL cylinder. The strain history of incident, reflected and transmit-ted waves were recorded with 1 MHz sampling rate. All tests were carried out in ambient temperature of 22.0.5 �C.

38
5.3. Results and discussion The results presented in this section concerns PP specimen with length 10 and 50 mm and the four excipients materials MCC, Sorbitol, ethyl cellulose and Starch. More detailed results are given in Paper III and Paper IV. The strain histories )(RM t� and )(TM t� representing the isolated reflected and transmitted waves are shown in Fig. 15 for PMMA bars and in Fig. 16 for AL bars. For the AL bars, the reflected signal from the test specimen is strong due to the characteristic impedance mismatch between the AL bars and the PP specimen. For the PMMA bars, the reflected wave is smaller as result of better impedance match.
The length of the pressure bars imposes a limitation on the possible length of the recorded signals. The unavoidable truncation of the tail of the trans-mitted and reflected signals give rise to a truncation error observed on the estimated complex moduli )(�E , )(lf �E and )(cl �E . The truncation error is more significant for long specimens and manifests itself as oscillations in the estimated results. See Fig. 17 (Test 2C). In Paper III this topic is covered extensively.
Fig. 15. Strain histories )(RM t� and )(TM t� representing reflected and transmitted waves in tests with PMMA bars and PP specimens of lengths 10 and 50 mm (Tests 1A and 1C).
Fig. 16. Strain histories )(RM t� and )(TM t� representing reflected and transmitted waves in tests with AL bars and PP specimens of lengths 10 and 50 mm (Tests 2A and 2C).

39
The estimated complex Extension moduli )(�E , )(lf �E and )(cl �E for PP based on Eqs. (32)-(34) and use of AL bars are shown in Fig. 17. The corresponding results for PP with PMMA bars are shown in Fig. 18. The modulus refE estimated in a Paper I is also shown for comparison. In order
Fig. 17. Estimations E , lfE and clE of the complex modulus of PP versus fre-quency f obtained with AL bars and specimens of lengths 10 and 50 mm (Tests 2A-2C). Estimation refE shown for comparison.
Fig. 18. Estimations E , lfE and clE of the complex modulus of PP versus fre-quency f obtained with PMMA bars and specimens of lengths 10 and 50 mm (Tests 1A-1C). Estimation refE shown for comparison.
to avoid significant 3D effects and ensure the validity of the results, the fre-quency interval 0-10 kHz was chosen for the results shown in Figs. 17 and 18. The wavelengths for AL, PMMA and PP at 10 kHz were approximately 26, 11 and 9 diameters, respectively.
The estimated complex modulus )(�E obtained with AL and PMMA bars are in good agreement with the reference data from Paper I. In Fig. 17 (Test 2C) the result for the 50 mm PP specimen shows a weak oscillation in both real and imaginary part, which is due to effect of truncation of the re-flected and transmitted wave signals.
Equation (35) shows that the low-frequency estimation lfE is accurate if (i) 62 ��a� . In contrast, Eq. (36) shows that the classical estimation clE is

40
accurate only if also (ii) 1/ 2b ��ZZ . The first condition expresses close-
ness to equilibrium in the specimen, but the second does not. Thus, the clas-sical estimation, which is based on the assumption of equilibrium, is not necessarily accurate even if the condition of equilibrium is approximately fulfilled. Near impedance matching, clE is highly inaccurate no matter how well equilibrium is satisfied, while, in contrast, lfE is highly accurate almost regardless of equilibrium. In the tests carried out, the equilibrium condition is well satisfied at low frequencies and/or for short specimens while the im-pedance condition is not. Thus, for the PMMA bars 2
b/ ZZ is always greater than 0.42, which gives rise to large errors in clE at all frequencies. For the AL bars this quantity is always greater than 0.027, which gives rise to a much smaller but still finite error at all frequencies. These observations are consistent with the results obtained for the complex modulus (Figs. 17 and 18).
Typical recorded strain histories for transmitted and reflected waves from the tests with pharmaceutical tablets are shown in Fig. 19.
Fig. 19. Typical recorded strain waves from a test with a MCC tablet. )(RM t� and
)(TM t� are time-domain data for the reflected and the transmitted wave, respec-tively.
Figure 20 displays the real and imaginary parts of the parametric and non-parametric complex modulus as functions of frequency for the investigated tablet materials. The figure shows that a relaxation process, located at ~ 5 - 10 kHz, is present in all materials. A close study of the location in frequency, the strength and even the shape of the relaxation can yield information about the material and its relaxing units. For example, the location in frequency of the relaxation is determined by factors such as the size of the relaxing units and the strength of the interaction forces associated with these units. The relaxation strength is determined in part by the number of relaxing units per unit material volume [39].
41
Fig. 20. Fitted parametric curves (solid lines) for the complex modulus superim-posed over measured data (dashed [ E� ] and dotted [ E �� ] lines) of (a) MCC, (b) sorbitol, (c) ethyl cellulose and (d) Starch 1500.
The density, model parameters, frequency of maximum dissipation maxf and relaxation strength � for the pharmaceutical tablet materials are given in Table 2.
Table 2. Data for pharmaceutical materials given as mean values of three determina-tions with standard deviations in parenthesis
Density d� eE dE maxf � Material
(kg/m3) (MPas) (GPa) (GPa) (kHz)
MCC PH102 1273 (14)
0.17 (0.02)
2.30 (0.09)
8.7 (0.6)
9.08 (0.45)
0.27 (0.02)
sorbitol 1294 (7)
0.54 (0.03)
6.52 (0.27)
21.6 (2.4)
7.25 (0.44)
0.30 (0.03)
ethyl cellulose
1026 (2)
0.13 (0.02)
1.16 (0.05)
5.4 (1.0)
7.07 (0.26)
0.22 (0.04)
Starch 1500 1227 (0)
0.12 (0.00)
1.27 (0.02)
3.2 (0.1)
5.24 (0.26)
0.40 (0.01)
42
6. Identification Based on Shear Waves in a Circular Disc
6.1. Theory The shear strain in a disc is described by Eq. (14), where )(ˆ �P , )(ˆ �N and
)(�� are considered unknowns. It is assumed that the disc is loaded by a transient shear stress )(ˆ),(ˆ � � aa � at its inner boundary ( ar � ) and that its outer boundary is either free or located at infinity.
It is now assumed that the shear strains )(ˆ),(ˆ M11 ���� �r and �),(ˆ 2 �� r
)(ˆM2 �� are measured at the radii 1rr � and 2rr � , respectively, with
brra ��� 21 . If the complete shear strain history of the wave generated at the inner radius ar � can be measured at the radii 1rr � and 2rr � before a reflected wave from the outer radius br � has reached the radius 2rr � , then one can consider the disc infinite and let 0ˆ /N . Then, by Eq. (14), one can express the ratio of the measured strains as )(/)(ˆ/ˆ 21
M2
M1 ���� 00� ,
where the functions )(1 �0 and )(2 �0 are independent of the excitation )(ˆ �� a . This equation rewritten as
0)(ˆ)(ˆ 1M22
M1 �0�0 ���� (37)
can be solved for � and then, by using the relations Tc�� � and �Gc �T , one can obtain the non-parametric result
2
���
����
��
���G (38)
for the complex shear modulus provided that numerical difficulties do not occur.
The complex shear modulus )(�G can be identified parametrically using the three-parameter SLS

43
dde
dde
ii),(
�������
��
GGGGG p (39)
with parameter vector Tdde ],,[ �GG�p . This model is illustrated in Fig. 1. The optimum parameter vector optp is determined by minimizing the error
222
21
T2 )()()()()()( ppppepepe neee ����� � (40)
with respect to p , where
)],([)(ˆ)],([)(ˆ)( 1M22
M1 ppp iiiiie �������� 0�0� (41)
is the complex-valued residual at i� , n is the number of frequency compo-nents and
2/1
),(),(
!
"#$
%�
pp
iii G �
���� (42)
is the complex valued wave number.
6.2. Experiments Experimental identification tests were carried out with the set-up shown in Fig. 21. A disc made of PP with 6 mm thickness and outer diameter 1000 mm was attached to a hub at its centre. The hub itself was welded to a pris-matic steel shaft with length 6470 mm and diameter 20 mm. At its opposite end, the shaft was preloaded in torsion between two clamps. When the clamp closest to the disc was suddenly released, by fracturing a pre-notched bolt, a torsional wave was generated in the shaft. The wave, with length approxi-mately twice the inter-clamp distance, propagated towards the disc, at which it was partially reflected. As a result, a transient torque that produced an outgoing shear wave loaded the disc. The shear strains were measured at two different locations 601 �r and 962 �r mm using strain gauges. The gauges were connected to a bridge amplifier and the signals from the amplifier were
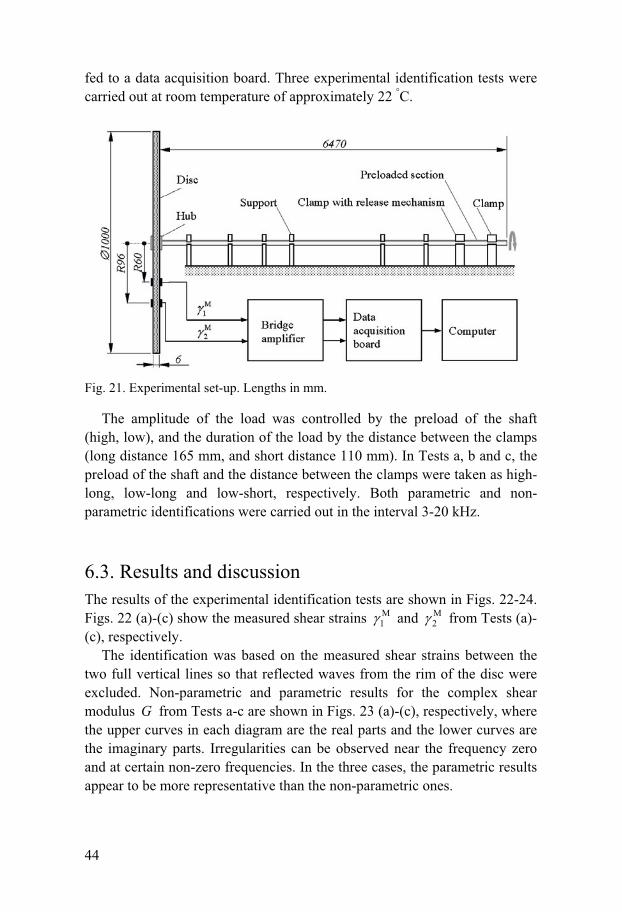
44
fed to a data acquisition board. Three experimental identification tests were carried out at room temperature of approximately 22 �C.
Fig. 21. Experimental set-up. Lengths in mm.
The amplitude of the load was controlled by the preload of the shaft (high, low), and the duration of the load by the distance between the clamps (long distance 165 mm, and short distance 110 mm). In Tests a, b and c, the preload of the shaft and the distance between the clamps were taken as high-long, low-long and low-short, respectively. Both parametric and non-parametric identifications were carried out in the interval 3-20 kHz.
6.3. Results and discussion The results of the experimental identification tests are shown in Figs. 22-24. Figs. 22 (a)-(c) show the measured shear strains M
1� and M2� from Tests (a)-
(c), respectively. The identification was based on the measured shear strains between the
two full vertical lines so that reflected waves from the rim of the disc were excluded. Non-parametric and parametric results for the complex shear modulus G from Tests a-c are shown in Figs. 23 (a)-(c), respectively, where the upper curves in each diagram are the real parts and the lower curves are the imaginary parts. Irregularities can be observed near the frequency zero and at certain non-zero frequencies. In the three cases, the parametric results appear to be more representative than the non-parametric ones.

45
Fig. 22. Measured shear strains M
1� and M2� versus time t in experimental identifi-
cation tests employing load with (a) high amplitude and long duration, (b) low am-plitude and long duration, and (c) low amplitude and short duration. The identifica-tion was based on the measured shear strains between the two vertical lines.
Table 3. Standard linear solid parameters in experimental tests.
Estimated value Parameter Start value
Test a Test b Test c )GPa(eG 1.623 1.231 1.186 1.170 )GPa(dG 0.952 3.703 3.636 3.329 )MPas(d� 0.064 0.116 0.128 0.183
Considering the boundary condition at the rim of the disc, one can iden-
tify the complex shear modulus without being restricted to outgoing waves. This procedure is a two-dimensional analogue of a procedure used for bar specimens, e.g., [5, 6, 7], and has the advantage of not requiring a minimum size of the disc specimen. However, it is computationally complex and may lead to reduced accuracy.

46
Fig. 23. Complex shear modulus G versus frequency f from experimental identi-fication tests employing load with (a) high amplitude and long duration, (b) low amplitude and long duration, and (c) low amplitude and short duration. Upper curves in each diagram show real parts and lower curves imaginary parts. Non-parametric (thin curves with dot marks) and parametric (thick curves) results.
The parametric results can be compared in Fig. 24. The results of para-metric identification are shown also in Table 3.
Fig. 24. Parametric complex shear modulus G versus frequency f from experi-mental identification tests employing load with high amplitude and long duration (dotted curves), low amplitude and long duration (dashed curves), and low ampli-tude and short duration (solid curves). Upper curves show real parts and lower curves imaginary parts.

47
The disturbing inaccuracies at certain frequencies in Fig. 23 depend on the duration of the loading pulse (Fig. 22). These frequencies, at which the excitation of the disc is weak or nonexistent, can be moved out of the fre-quency range of interest by using an excitation pulse that is sufficiently nar-row. If problematic frequencies are present, the accuracy of the parametri-cally estimated complex shear modulus can be improved by excluding measurement data at and around these frequencies.

48
7. Conclusions
In Paper I, the complex extension modulus, the complex shear modulus and the complex Poisson’s ratio at room temperature have been identified for polymethyl methacrylate (PMMA) and polypropylene (PP) in the approxi-mate frequency range 1 to 40 kHz for PMMA and 1 to 15 kHz for PP. The responses of both materials were found to be very close to linear and nearly isotropic under the conditions of the tests. The deviation from isotropy was larger for PP than that for PMMA. The observed deviation from isotropy is believed to be partly due to the extrusion and cooling processes used for fabrication of the PP test bars.
In Paper II it has been shown that the joint estimation approach will im-prove the overall quality of the estimated complex modulus E and Pois-son’s ratio . When the excitation level is high, the least-squares estimation of complex modulus and simple or weighted averaging of complex Poisson’s ratio give results of similar quality. When the excitation level is low or the optimization problem is poorly conditioned numerically, however, the dif-ference between the results obtained with the different methods can be sig-nificant.
For the non-equilibrium SHPB procedure studied in Paper III, the follow-ing can be concluded. (i) The non-equilibrium SHPB procedure developed, and its simplified low-frequency version, can be used to estimate the com-plex modulus in terms of measured strains associated with the reflected and transmitted waves. (ii) The quality of the results is sensitive to truncation and imperfect contact conditions at the bar-specimen interfaces. (iii) With PMMA bars, good results were obtained up to 10 kHz for specimens with aspect ratios 0.5, 1.0 and 2.5, and fair results were obtained for specimens with aspect ratio 5.0. (iv) With AL bars, very good results were obtained up to 10 kHz for specimens with aspect ratios 0.5 and 1.0, and fair results were obtained for the specimen with aspect ratio 2.5. (iv) The classical SHPB procedure, based on equilibrium in the specimen, overestimates the magni-tude of the complex modulus at all frequencies.
The non-equilibrium SHPB procedure was used in Paper IV to identify the complex extension modulus for thin pharmaceutical tablets for frequen-cies up to 20 kHz. In addition to providing a measure of the tablet stiffness
49
as a function of frequency, a relaxation was observed in the materials that could be related to the inter-particle binding mechanisms. With help of pa-rametric data, the interpretations of these relaxations show the potential of this method in achieving a better understanding of the binding mechanisms and physical properties of compacted materials.
Conclusions from the study of viscoelastic impact in Paper V can be sum-marised as follows: (i) The impact force consists of a main pulse that is ei-ther isolated or followed by a tail with finite or infinite length. The rise and fall of the main pulse are discontinuous, and the width of this pulse corre-sponds to two transit times through the striker for the viscoelastic wave front. (ii) The tail of the impact force and the phenomenon of multiple im-pacts can be avoided by choosing striker-to-bar characteristic impedance ratio r sufficiently small. This is of particular interest in SHPB testing. (iii) There is good agreement between experimental and theoretical results for strains in a PMMA bar impacted by strikers of the same material and with the same cross-sectional area.
In Paper VI, it has been shown theoretically and experimentally that: (i) The complex shear modulus of an isotropic and linearly viscoelastic material can be identified on the basis of the evolution of an outgoing shear wave between two radial positions on a disc at which shear strains associated with the wave are measured. (ii) The two-dimensional wave solutions used are exact in the sense of three-dimensional theory, and therefore there is, in principle, no frequency beyond which the theoretical basis is not valid. (iii) The method requires a minimum disc size which is related to the duration of the load. (iv) The non-parametric results become inaccurate at frequencies near zero and at frequencies where the excitation is weak or non-existent. (v) The former frequencies can be moved towards zero and the latter can be moved outside the frequency range of interest by sufficiently decreasing the duration of the loading pulse. Alternatively, the required size of the disc can be reduced. (vi) If there are problematic frequencies within the range of in-terest, the results of parametric identification are more accurate and repre-sentative than those of non-parametric identification. (vii) Parametric results from experimental tests with loads having different amplitudes and durations agree well with each other in accord with the assumed linearity of the tested Polypropylene material. (viii) The complex shear modulus of an isotropic and linearly viscoelastic material can be identified similarly also without restriction to outgoing waves. This procedure has the advantage of not re-quiring a minimum size of the specimen but is computationally complex and may lead to reduced accuracy.

50
8. Summary in Swedish
Dynamiska metoder används i stor utsträckning för studier av visko-elastiska egenskaper hos material. Polymera material utgör den största grup-pen av material med viskoelastiska egenskaper. Användningen av polymerer ökar, framförallt i vibrationshämmande och lastbärande komponenter. Be-hovet av nya metoder hänger samman med att nya material ständigt utveck-las och i allt större utsträckning är tillgängliga i prefabricerade geometrier, såsom stänger, rör, skivor osv. Under senare år har flera metoder för karak-terisering av viskoelastiska material baserad på vågutbredning i materialen utvecklats. Dessa metoder har fördelar jämfört med vanligt förekommande testmetoder som ”Forced Non-Resonance Method”, som bygger på kraft- och förskjutningsmätningar vid varje frekvens, eller ”Torsion Pendulum” som utnyttjar fria svängningar. De senare metoderna kräver, till skillnad från vågutbredningmetoder, komplicerad apparatur, och de kan endast ge data för en frekvens i taget. Flera vågutbredningsbaserade metoder har utvecklats i artiklarna I-IV och VI. Dessa metoder genererar vid ett enda experiment data inom ett brett frekvensintervall, och de kräver inte komplicerad utrustning.
I artiklarna I och II identifierades de komplexa modulerna E och G samt komplexa Poissons tal med hjälp av axiell töjningsmätning på stäng-er av polymetyl metacrylat (PMMA) och polypropen (PP). Dessa stänger exciterades med en kortvarig töjningsvåg som genererats genom anslag av en projektil. Stänger i två olika dimensioner, 10 och 20 mm diameter, av varje material instrumenterades och provades för två olika excitationsnivåer. De komplexa modulerna identifierades genom mätning av axiell töjning i fem instrumenterade tvärsnitt. Med hjälp av töjningsdata i axiell led och omkretsled från samma instrumenterade tvärsnitt bestämdes Poisson’s tal. Resultat för stänger med 10 mm diameter var acceptabla upp till 40 kHz för PMMA och 15 kHz för PP, och materialen uppvisade linjärt och isotropt beteende inom dessa frekvensområden. De använda stångdimensionerna vi-sade sig ge en viss inverkan på de komplexa modulerna. En statistisk analys visade att ett förfarande där E och identifieras samtidigt avsevärt förbätt-rar resultatet för , speciellt om excitationsnivåerna är låga.
Split Hopkinson Pressure Bar (SHPB) -teknik används vanligen för bes-tämning av materialegenskaper vid stora och snabba deformationer men har

51
här använts för identifiering av E . För att experimenten ska kunna anses tillförlitliga måste flera villkor uppfyllas: (i) Provet måste vara i jämvikt, (ii) spänning och töjning måste vara uniforma, (iii) spänningstillståndet måste vara enaxligt, och (iv) friktionseffekterna vid kontaktytorna mellan prov och stänger måste vara försumbara. Dessa villkor är sammankopplade och delvis motstridiga. I artikel III presenteras en SHPB-procedur för icke-parametrisk identifiering av E utan krav på uniformt spänningstillstånd. Två enklare procedurer presenteras också, en för låga frekvenser eller korta prov, och en som är identisk med den klassiska SHPB-proceduren. Experiment har utförts för identifiering av E för PP med provlängder 10, 20, 50 och 100 mm, både med aluminium- och PMMA-stänger. Det har framkommit att resultatet är känsligt för kontaktvillkoren och för trunkering av töjningssignalerna. Den metod som har utvecklats i artikel III lämpar sig för fall där långa provkrop-par inte finns att tillgå. Ett sådant fall är farmaceutiska tablettmaterial. I arti-kel IV karakteriseras fyra tablettmaterial; mikrokristallin cellulosa, sorbitol, etylcellulosa och stärkelse. Data från experimenten har använts för att analy-sera materialens mekaniska egenskaper samt för att få information om mate-rialens struktur.
Vid SHPB-experiment genereras en tryckvåg i sändarstången som sedan belastar provet. Tryckvågen genereras med hjälp av en kolv som oftast är av samma material som stängerna. För att på bästa möjliga sätt kunna använda tekniken måste man ha kvantitativ kunskap om hur tryckvågen skapas. I ar-tikel V behandlas stöt mellan två viskoelastiska cylindrar, och uttryck för kontaktkraft, partikelhastighet och töjning i stängerna härleds. Dessa sam-band används för att numeriskt bestämma töjningsförloppet vid tre snitt längs en PMMA-stång träffad av en cylindrisk kolv av samma material, och resultaten visar god överensstämmelse med experimentella data.
I artikel VI har en metod utvecklats för identifikation av G genom töjn-ingsmätningar på en cirkulär skiva. Metoden är baserad på utbredningen av utåtgående skjuvvågor längs en radie hos skivan. Skjuvvågen genereras ge-nom kortvarig belastning med ett vridande moment vid den inre randen. De tvådimensionella lösningar som ligger till grund för metoden uppfyller kra-ven för tredimensionell teori, vilket innebär att lösningen inte begränsas av något giltighetsområde i frekvens. Denna metod ställer enbart krav på storlek hos skivan relativt excitationstiden. Numeriska simuleringar har visat att det kan finnas problemfrekvenser med låg excitationsnivå vid estimering av komplexa modulen. Dessa frekvenser kan flyttas utanför det studerade om-rådet genom ändring av excitationstiden.

52
Acknowledgements
Never knew that a day like this would come! I wish I had the opportunity to thank my dearest friend Lars Holmberg for encouraging me to seek for a PhD position and for the moral support he offered when it was most needed.
This work was carried out at the Uppsala University, The Ångström labo-ratory and was financially supported by Swedish Research Council for Engi-neering Sciences (TFR) under contract 2000-587, and the Swedish Research Council (VR) under contract 2004-5169.
First of all, I would like to extend my gratitude to my supervisor, Profes-sor Bengt Lundberg, for all the help and guidance I received during my time as PhD student. I would also like to thank my assisting supervisor, Dr. Ur-mas Valdek and Dr. Lars Hillström for their help. Furthermore, I would like to thank Professor Torsten Söderström and Professor Maria Strømme for initiatives that led to interesting collaborations.
I am thankful to fellow PhD student Anders Jansson for being a good friend and for all the interesting brain storming and helpful discussions, sometimes late into the nights at our laboratory. I have also been privileged to get to know a wonderful friend and co-author Dr. Ken Welch whose help was always appreciated.
During my work as a PhD student I have had the opportunity to meet new friends and to work with extraordinary co-authors. I would like to thank David Nicolas for the time he spent with us and for the careful experimental work he carried out, and Professor Miloslav Okrouhlik for enlightening dis-cussions. Special thanks go to Dr. Kaushik Mahata for our enjoyable and fruitful collaboration. I would also like to thank my co-authors at Ecole Polytechnique, Professor Marie-No�l Bussac, Professor Pierre Collet and Professor Gérard Gary for the cooperation leading to Paper V in my thesis.
It’s in place to express my appreciation of all the support I have received from many people at The Ångström laboratory and FOI: Åke Dahlberg for his help with the manufacture of experimental equipment and helpful advice that often saved lots of time for me; my fellow PhD students, Martin Nils-son, Ewa Lidén, Lars Westerling, and Dr. René Renström and Dr. Patrik Lundberg; Eva Lind, Agneta Wiberg, Ingrid Ringård, Jonatan Bagge, Mikael Österberg and Enrique Carrasco.

53
Finally I would like to thank my family, Mom, Dad, Milad, Said and Massod for the support they gave me during my time as a PhD student. Thank you Mahla!. Uppsala, November 2007

54
References
1. P. S. Theocaris, Interrelation between dynamic moduli and compliances in polymers. Kolloid-Zeitschrift und Zeitschrift fur Polymere 235 (1960) 1182-1188.
2. T. Pritz, Frequency dependences of complex moduli and complex Poisson’s ratio of real solid materials. Journal of Sound and Vibration 214 (1998) 83-104.
3. H. Kolsky and S.S. Lee, The propagation and reflection of stress pulses in linear viscoelastic media. Brown University Technical Report No. 5, 1962.
4. P. S. Theocaris and N. Papadopoulou, Propagation of stress waves in viscoelas-tic media. Polymer 19 (1978) 215-219.
5. R. H. Blanc, Détermination de l'équation de comportement des corps viscoé-lastiques linéaires par une méthode d'impulsion. PhD Thesis, Université d'Aix-Marseille, 1971. Published in part in Problèmes de la rhéologie (W. K. Nowacki, editor) 65-85, IPPT PAN, Warsaw 1973.
6. R. H. Blanc, Progress in pulse testing methods for viscoelastic solids. Proceed-ings of the 2nd National Congress on Theoretical and Applied Mechanics, Varna, Bulgarian Academy of Science Publication, Sofia, 2, 1976, pp. 555-564.
7. R. H. Blanc, Transient wave propagation methods for determining the viscoe-lastic properties of solids. Journal of Applied Mechanics 60 (1993) 763-768.
8. Y. Sogabe, K. Kishida and K. Nakagawa, Wave propagation analysis for deter-mining the dynamic properties of high damping alloys. Bulletin of the Japan So-ciety of Mechanical Engineers 25 (1982) 321-327.
9. Y. Sogabe and M. Tsuzuki, Identification of the dynamic properties of linear-viscoelastic materials by the wave propagation testing. Bulletin of the Japan So-ciety of Mechanical Engineers 29 (1986) 2410-2417.
10. J. L. Buchanan, Numerical solution for the dynamic moduli of a viscoelastic bar. Journal of the Acoustical Society of America 81 (1987) 1775-1786.
11. B. Lundberg and R. H. Blanc, Determination of mechanical material properties from the two-point response of an impacted linearly viscoelastic rod specimen. Journal of Sound and Vibration 126 (1988) 97-108.
12. S. Ödeen and B. Lundberg, Determination of complex modulus from measured end-point accelerations of an impacted rod specimen. Journal of Sound and Vi-bration 165 (1993) 1-8.
13. B. Lundberg and S. Ödeen, In situ determination of the complex modulus from strain measurements on an impacted structure. Journal of Sound and Vibration 167 (1993) 413-419.
14. A. J. Hull, An inverse method to measure the axial modulus of composite mate-rials under tension. Journal of Sound and Vibration 195 (1996) 545-551.
15. M. Soula, T. Vinh, Y. Chevalier, T. Beda and C. Esteoule, Measurements of isothermal complex moduli of viscoelastic materials over a large range of fre-quencies. Journal of Sound and Vibration 205 (1997) 167-184.

55
16. L. Hillström, M. Mossberg and B. Lundberg, Identification of complex modulus from measured strains on an axially impacted bar using least squares. Journal of Sound and Vibration 230 (2000) 689-707.
17. L. Hillström, U. Valdek and B. Lundberg, Estimation of the state vector and identification of the complex modulus of a beam. Journal of Sound and Vibra-tion 261 (2003) 653-673.
18. M. Mossberg, L. Hillström and L. Abrahamsson, Parametric identification of viscoelastic materials from time and frequency domain data. Inverse Problems in Engineering 9 (2001) 645-670.
19. I. Kennedy and G. R. Tomlinson, Torsional vibration transmissibility character-istics of reinforced viscoelastic flexible pipes. Journal of Sound and Vibration 122 (1988) 149-169.
20. T. Pritz, Measurement methods of complex Poisson’s ratio of viscoelastic mate-rials. Applied Acoustics 60 (2000) 279-292.
21. B. Hopkinson, A method of measuring the pressure produced in the detonation of high explosives or by the impact of bullets. Philos Trans R Soc London A 1914;213 437-456.
22. R. M. Davies, A critical study of the Hopkinson pressure bar. Philos Trans R Soc London A 1948 240 375-457.
23. H. Kolsky, An investigation of the mechanical properties of materials at very high rates of loading. Proc Phys Soc London 1949 63B 676-700.
24. G. Gray, Classic split Hopkinson pressure bar testing. ASM Handbook Vol 8, Mechanical testing and evaluation. ASM 2000 462-476.
25. G Gary, JR. Klepaczko, H. Zhao, Correction de dispersion pour l’analyse des petites déformations aux barres de Hopkinson. Journal de Physique IV, Collo-que C3, suppl to Journal de Physique III 1991 1 403-410.
26. L. Wang, K. Labibes, Z. Azari, G. Pluvinage, Generalization of split Hopkinson bar technique to use viscoelastic bars. International Journal of Impact Engineer-ing 1994 15 669-686.
27. G. Gary, JR. Klepaczko, H. Zhao, Generalization of split Hopkinson bar tech-nique to use viscoelastic materials. International Journal of Impact Engineering 1995 16 529-530.
28. H. Zhao, G. Gary, A three dimensional analytical solution of the longitudinal wave propagation in an infinite linear viscoelastic cylindrical bar: application to experimental techniques. Journal of the Mechanics and Physics of Solids 1995 43 1335-1348.
29. G. Gary, L. Rota, H. Zhao, Testing viscous soft materials at medium and high strain rates. Constitutive relation in high/very high strain rates, Kawata K, Shioiri, Ed, Springer-Verlag, Tokyo 1996 25-32.
30. H. Zhao, G. Gary, JR. Klepaczko, On the use of a viscoelastic split Hopkinson pressure bar. International Journal of Impact Engineering 1997 19 319-330.
31. Y. Sogabe, T. Yokoyama, M. Nakano, Z. Wu, Y. Arimitsu, A viscoelastic split Hopkinson pressure technique and its applications to several materials. Impact Engineering and Application, Chiba A, Tanimura S, Hokamoto K, Ed, Elsevier Science Ltd 2001 767-772.
32. GT. Gray III, WR. Blumenthal, Split Hopkinson pressure bar testing of soft materials. ASM Handbook Vol 8, Mechanical testing and evaluation. ASM 2000 488-496.
33. A. Kuma, L. T. Seng, Z. Pengjun, Design of an impact striker for a split Hop-kinson pressure bar. Journal of The Institution of Engineers, Vol. 44 1, 2004.
34. C. Zener, Mechanical behavior of high Damping metals. Journal of Applied Physics. 18, 1022-1025 (1947).

56
35. G. Fantozzi, Mechanical Spectroscopy Q-1 2001 366-3, 3-31 (Trans Tech Pub-lications, Inc., 2001).
36. B Lundberg, M. Lesser, On impactor synthesis. Journal of Sound and Vibration. 1978 58 5-14.
37. S. Ödeen, B. Lundberg, Prediction of impact force by impulse response method. Int J Impact Eng 1991;11:149-158.
38. G. K. Bolhuis and Z. T. Chowhan, in Pharmaceutical Powder Compaction Technology; Vol. 71, edited by G. Alderborn and C. Nyström (Marcel Dekker, Inc., New York, 1996) 419-500
39. J. San Juan, Mechanical Spectroscopy Q-1 2001 366-3, 32-73 (Trans Tech Publications, Inc., 2001).


Acta Universitatis UpsaliensisDigital Comprehensive Summaries of Uppsala Dissertationsfrom the Faculty of Science and Technology 369
Editor: The Dean of the Faculty of Science and Technology
A doctoral dissertation from the Faculty of Science andTechnology, Uppsala University, is usually a summary of anumber of papers. A few copies of the complete dissertationare kept at major Swedish research libraries, while thesummary alone is distributed internationally through theseries Digital Comprehensive Summaries of UppsalaDissertations from the Faculty of Science and Technology.(Prior to January, 2005, the series was published under thetitle “Comprehensive Summaries of Uppsala Dissertationsfrom the Faculty of Science and Technology”.)
Distribution: publications.uu.seurn:nbn:se:uu:diva-8324
ACTA
UNIVERSITATIS
UPSALIENSIS
UPPSALA
2007