Embed Size (px)
Citation preview
II SimpósioInternacional PwCInovação em Gestão PúblicaAbril 2011
www.pwc.com/br
II Simpósio Internacional PwC - Inovação em Gestão Pública
Agenda
1. PwC
2. Global PPP context
3. What is PPP
4. Payment Mechanisms and Demand Risk
5. Alternative Financing Models
2
II Simpósio Internacional PwC - Inovação em Gestão Pública
PwC
3
II Simpósio Internacional PwC - Inovação em Gestão Pública
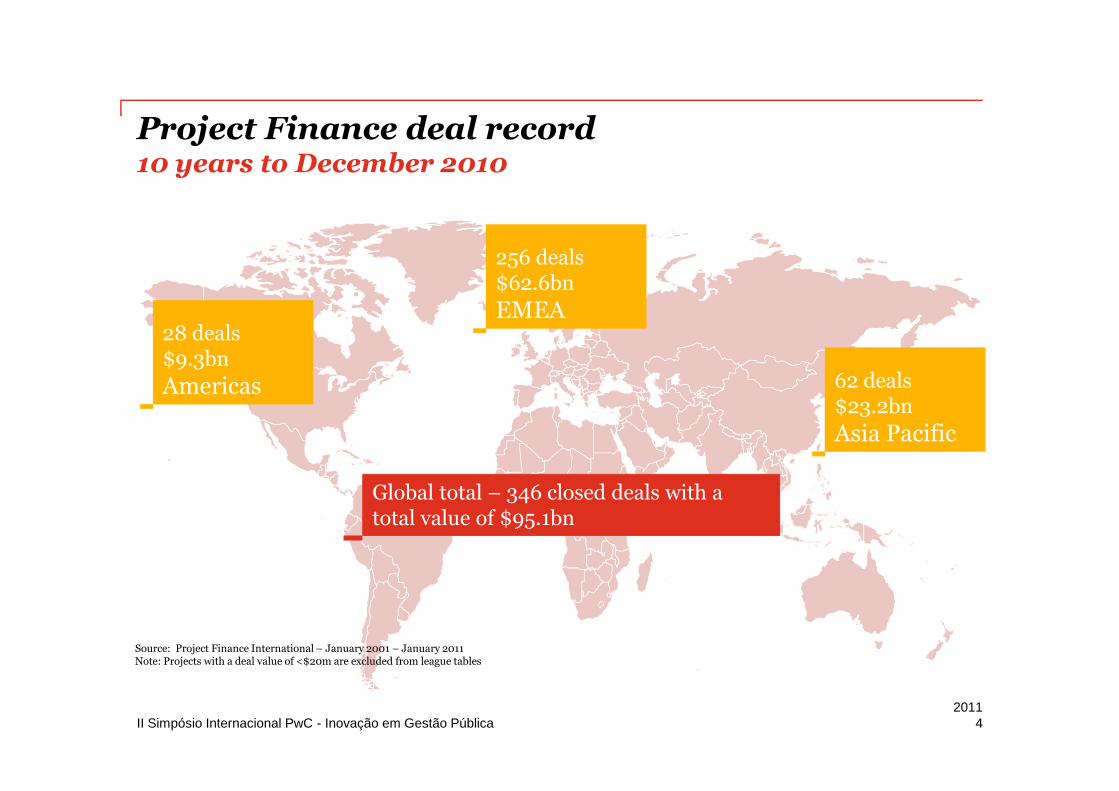
Project Finance deal record10 years to December 2010
42011
Source: Project Finance International – January 2001 – January 2011Note: Projects with a deal value of <$20m are excluded from league tables
256 deals$62.6bn
EMEA
62 deals$23.2bn
Asia Pacific
28 deals$9.3bn
Americas
Global total – 346 closed deals with atotal value of $95.1bn
II Simpósio Internacional PwC - Inovação em Gestão Pública
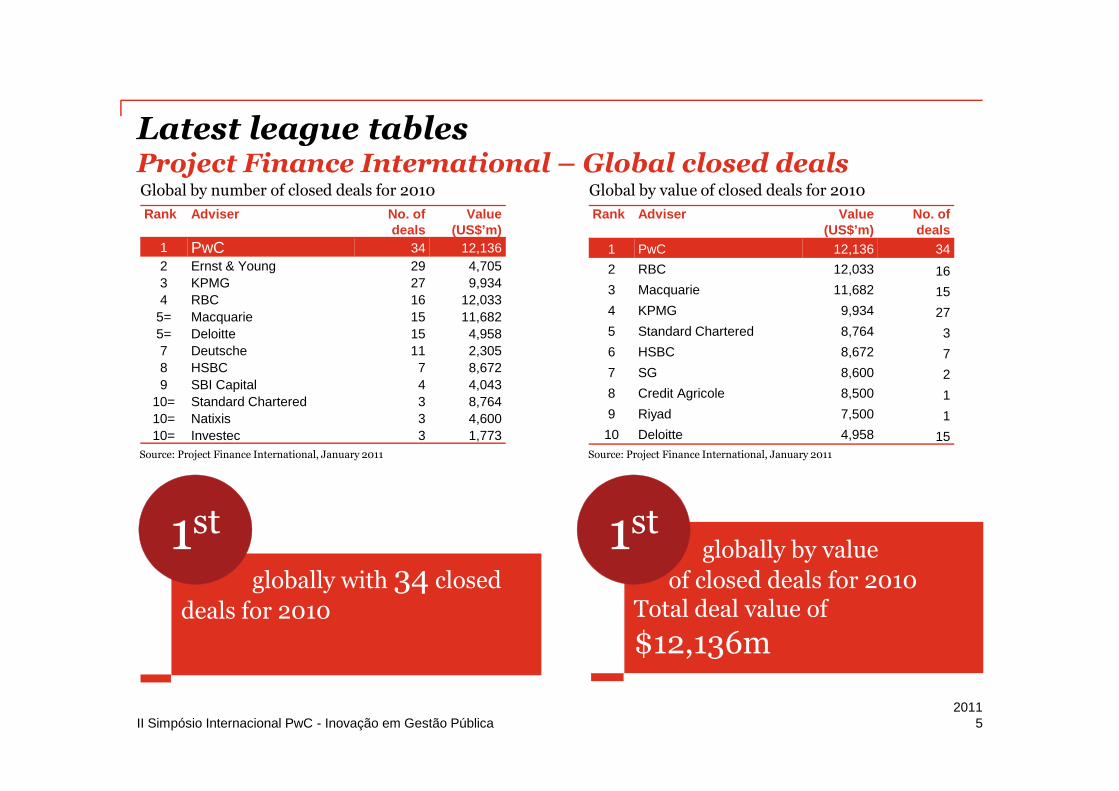
Latest league tablesProject Finance International – Global closed deals
52011
Global by number of closed deals for 2010
Source: Project Finance International, January 2011 Source: Project Finance International, January 2011
Global by value of closed deals for 2010
Rank Adviser No. ofdeals
Value(US$’m)
1 PwC 34 12,136
2 Ernst & Young 29 4,705
3 KPMG 27 9,934
4 RBC 16 12,033
5= Macquarie 15 11,682
5= Deloitte 15 4,958
7 Deutsche 11 2,305
8 HSBC 7 8,672
9 SBI Capital 4 4,043
10= Standard Chartered 3 8,764
10= Natixis 3 4,600
10= Investec 3 1,773
Rank Adviser Value(US$’m)
No. ofdeals
1 PwC 12,136 34
2 RBC 12,033 16
3 Macquarie 11,682 15
4 KPMG 9,934 27
5 Standard Chartered 8,764 3
6 HSBC 8,672 7
7 SG 8,600 2
8 Credit Agricole 8,500 1
9 Riyad 7,500 1
10 Deloitte 4,958 15
globally with 34 closed
deals for 2010
1stglobally by value
of closed deals for 2010Total deal value of
$12,136m
1st
II Simpósio Internacional PwC - Inovação em Gestão Pública
Global PPP Context
6
II Simpósio Internacional PwC - Inovação em Gestão Pública
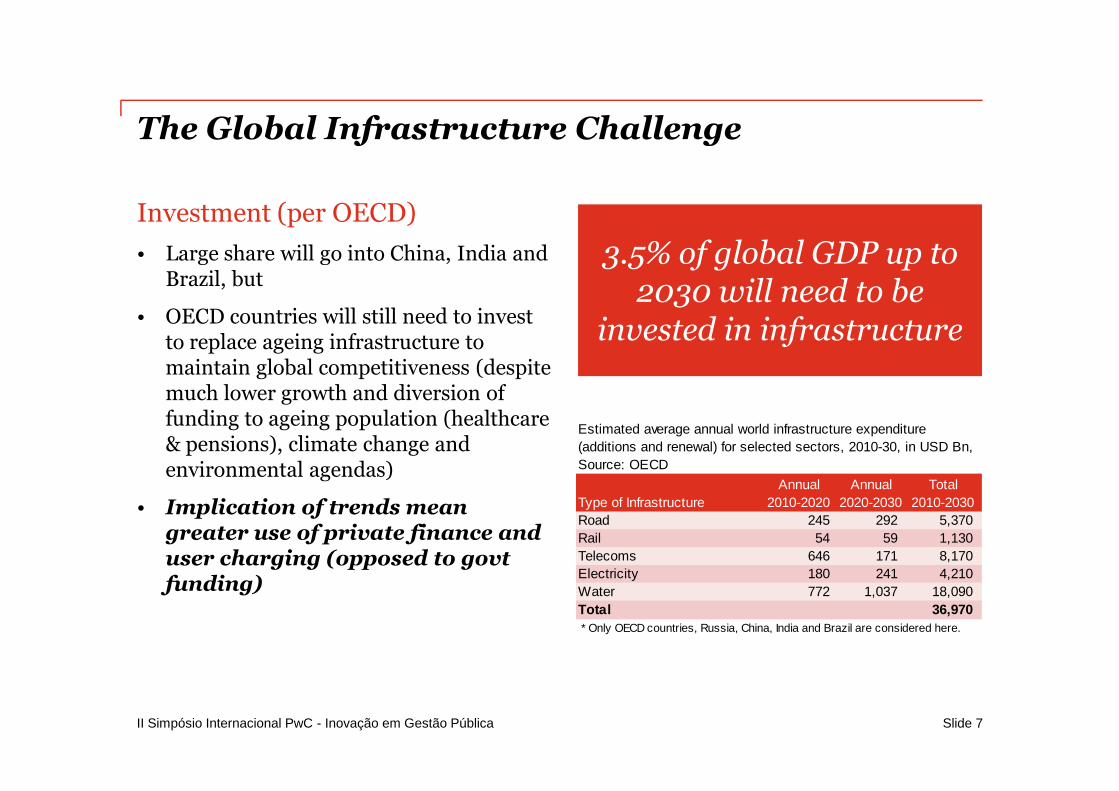
The Global Infrastructure Challenge
Investment (per OECD)
• Large share will go into China, India andBrazil, but
• OECD countries will still need to investto replace ageing infrastructure tomaintain global competitiveness (despitemuch lower growth and diversion offunding to ageing population (healthcare& pensions), climate change andenvironmental agendas)
• Implication of trends meangreater use of private finance anduser charging (opposed to govtfunding)
Slide 7
3.5% of global GDP up to2030 will need to be
invested in infrastructure
Annual Annual Total
Type of Infrastructure 2010-2020 2020-2030 2010-2030
Road 245 292 5,370
Rail 54 59 1,130
Telecoms 646 171 8,170
Electricity 180 241 4,210
Water 772 1,037 18,090
Total 36,970
* Only OECD countries, Russia, China, India and Brazil are considered here.
Estimated average annual world infrastructure expenditure
(additions and renewal) for selected sectors, 2010-30, in USD Bn,
Source: OECD
II Simpósio Internacional PwC - Inovação em Gestão Pública
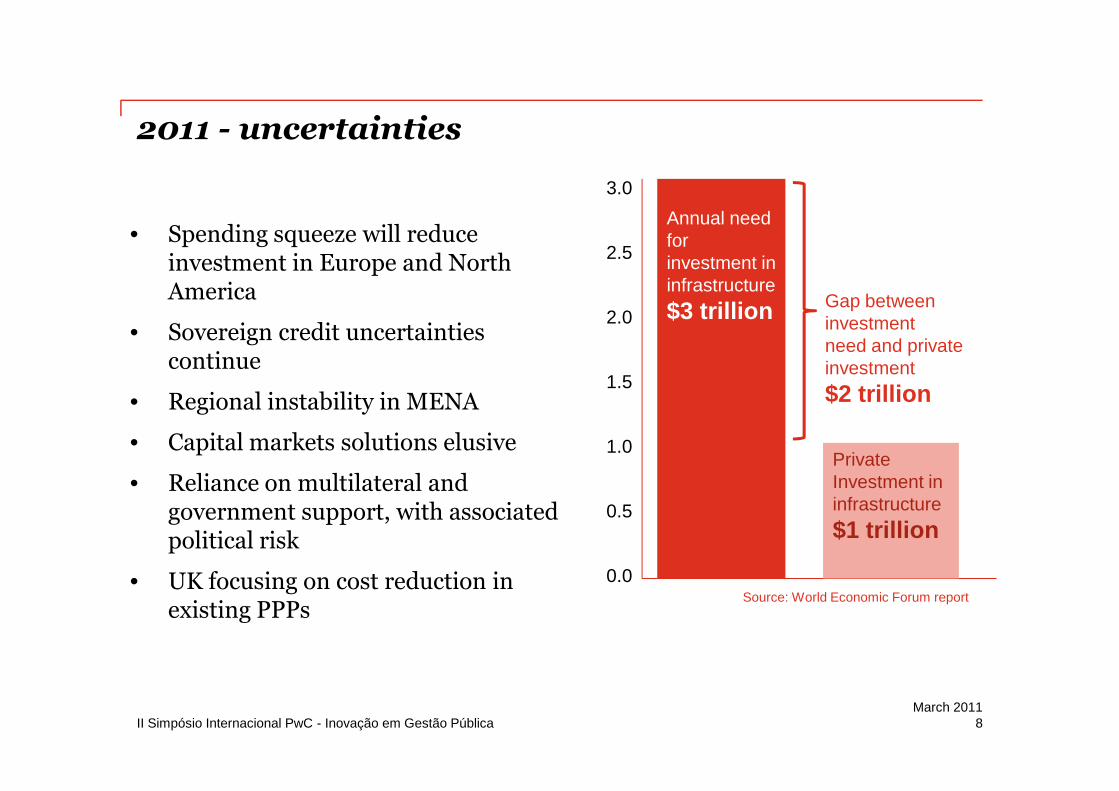
2011 - uncertainties
8March 2011
• Spending squeeze will reduceinvestment in Europe and NorthAmerica
• Sovereign credit uncertaintiescontinue
• Regional instability in MENA
• Capital markets solutions elusive
• Reliance on multilateral andgovernment support, with associatedpolitical risk
• UK focusing on cost reduction inexisting PPPs
3.0
2.5
2.0
1.5
1.0
0.5
0.0
Gap betweeninvestmentneed and privateinvestment
$2 trillion
PrivateInvestment ininfrastructure
$1 trillion
Annual needforinvestment ininfrastructure
$3 trillion
Source: World Economic Forum report
II Simpósio Internacional PwC - Inovação em Gestão Pública
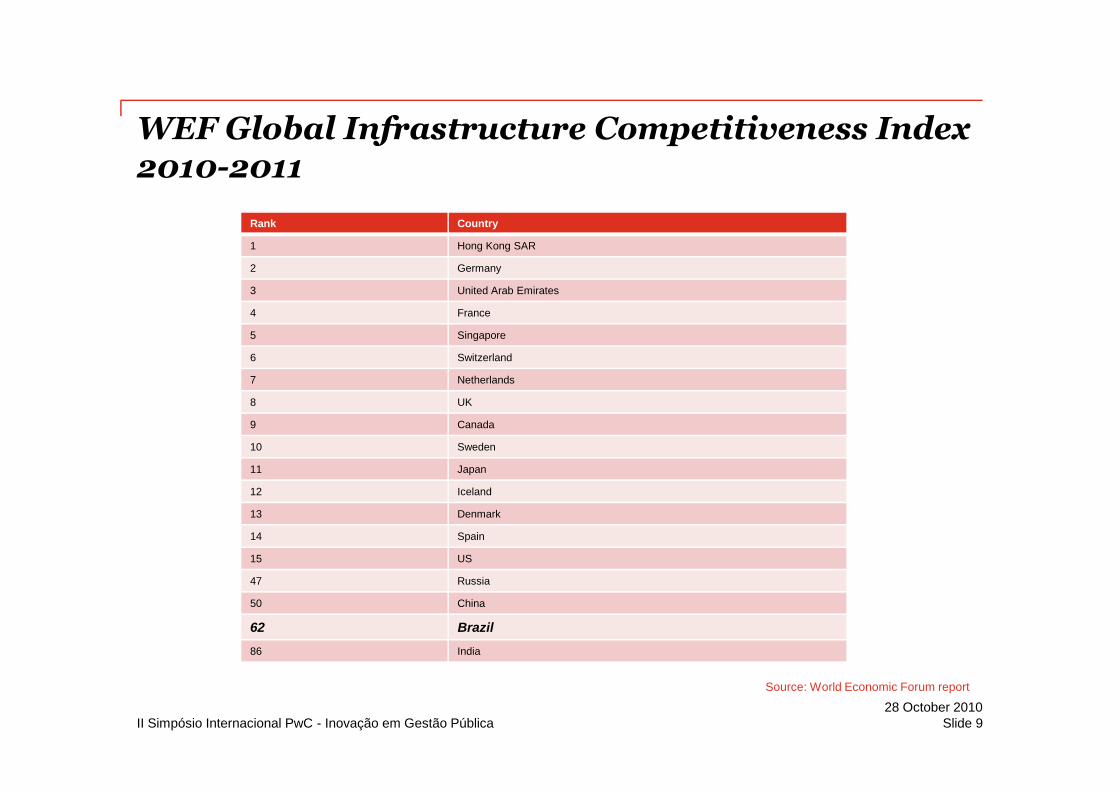
WEF Global Infrastructure Competitiveness Index2010-2011
Rank Country
1 Hong Kong SAR
2 Germany
3 United Arab Emirates
4 France
5 Singapore
6 Switzerland
7 Netherlands
8 UK
9 Canada
10 Sweden
11 Japan
12 Iceland
13 Denmark
14 Spain
15 US
47 Russia
50 China
62 Brazil
86 India
Slide 928 October 2010
Source: World Economic Forum report
II Simpósio Internacional PwC - Inovação em Gestão Pública
0
20
40
60
80
100
120
140%
of
GD
P
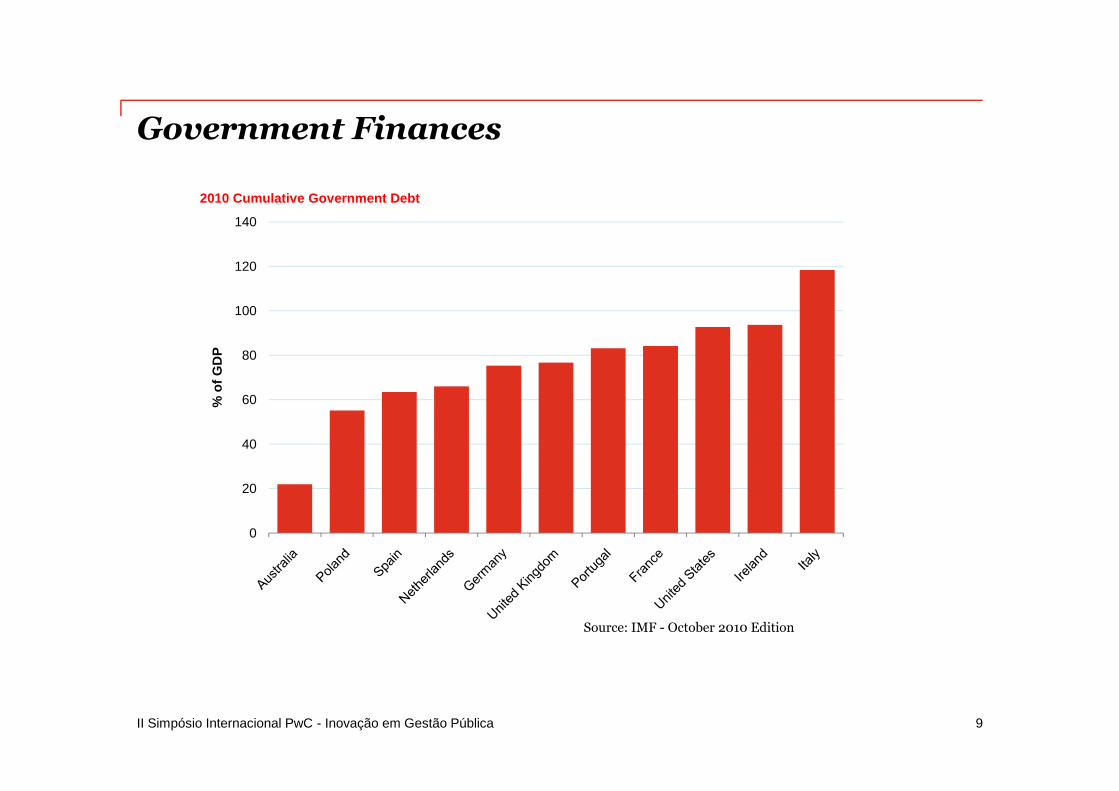
2010 Cumulative Government Debt
Government Finances
9
Source: IMF - October 2010 Edition
II Simpósio Internacional PwC - Inovação em Gestão Pública
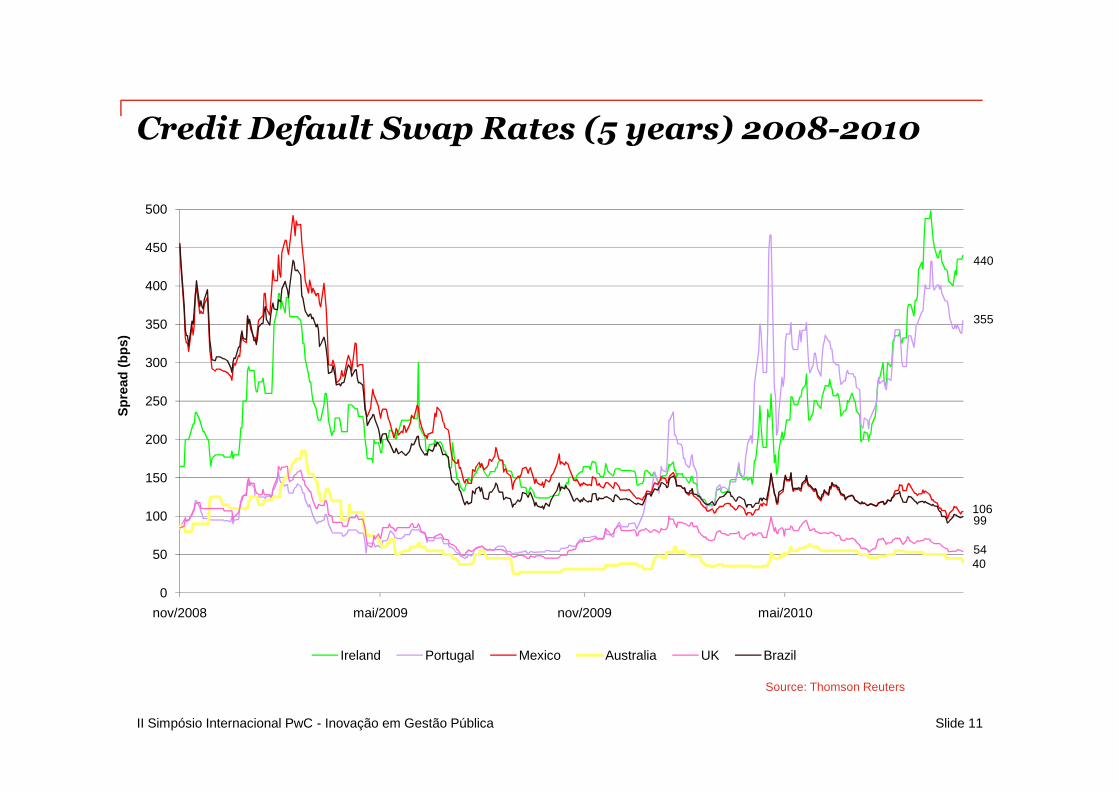
Credit Default Swap Rates (5 years) 2008-2010
Slide 11
Source: Thomson Reuters
0
50
100
150
200
250
300
350
400
450
500
nov/2008 mai/2009 nov/2009 mai/2010
Sp
read
(bp
s)
DateIreland Portugal Mexico Australia UK Brazil
99
440
106
355
5440
II Simpósio Internacional PwC - Inovação em Gestão Pública
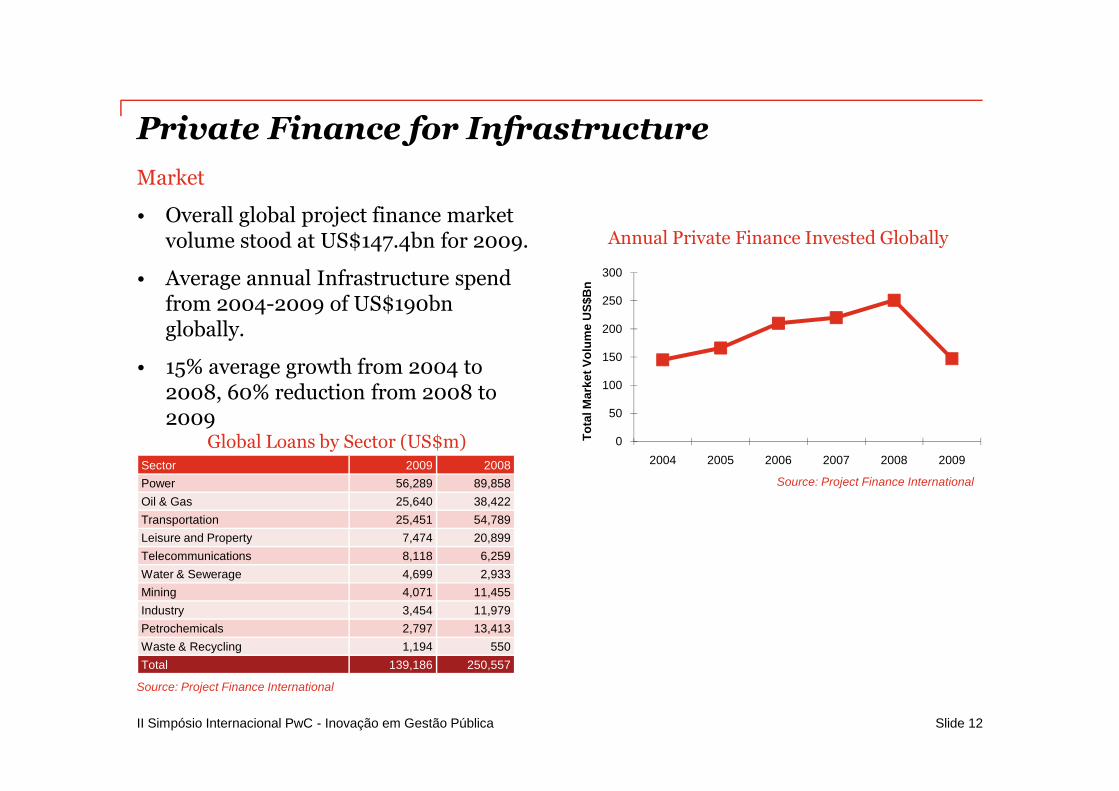
Private Finance for Infrastructure
Market
• Overall global project finance marketvolume stood at US$147.4bn for 2009.
• Average annual Infrastructure spendfrom 2004-2009 of US$190bnglobally.
• 15% average growth from 2004 to2008, 60% reduction from 2008 to2009
Slide 12
0
50
100
150
200
250
300
2004 2005 2006 2007 2008 2009
To
talM
ark
et
Vo
lum
eU
S$
Bn
Annual Private Finance Invested Globally
Sector 2009 2008
Power 56,289 89,858
Oil & Gas 25,640 38,422
Transportation 25,451 54,789
Leisure and Property 7,474 20,899
Telecommunications 8,118 6,259
Water & Sewerage 4,699 2,933
Mining 4,071 11,455
Industry 3,454 11,979
Petrochemicals 2,797 13,413
Waste & Recycling 1,194 550
Total 139,186 250,557
Global Loans by Sector (US$m)
Source: Project Finance International
Source: Project Finance International
II Simpósio Internacional PwC - Inovação em Gestão Pública
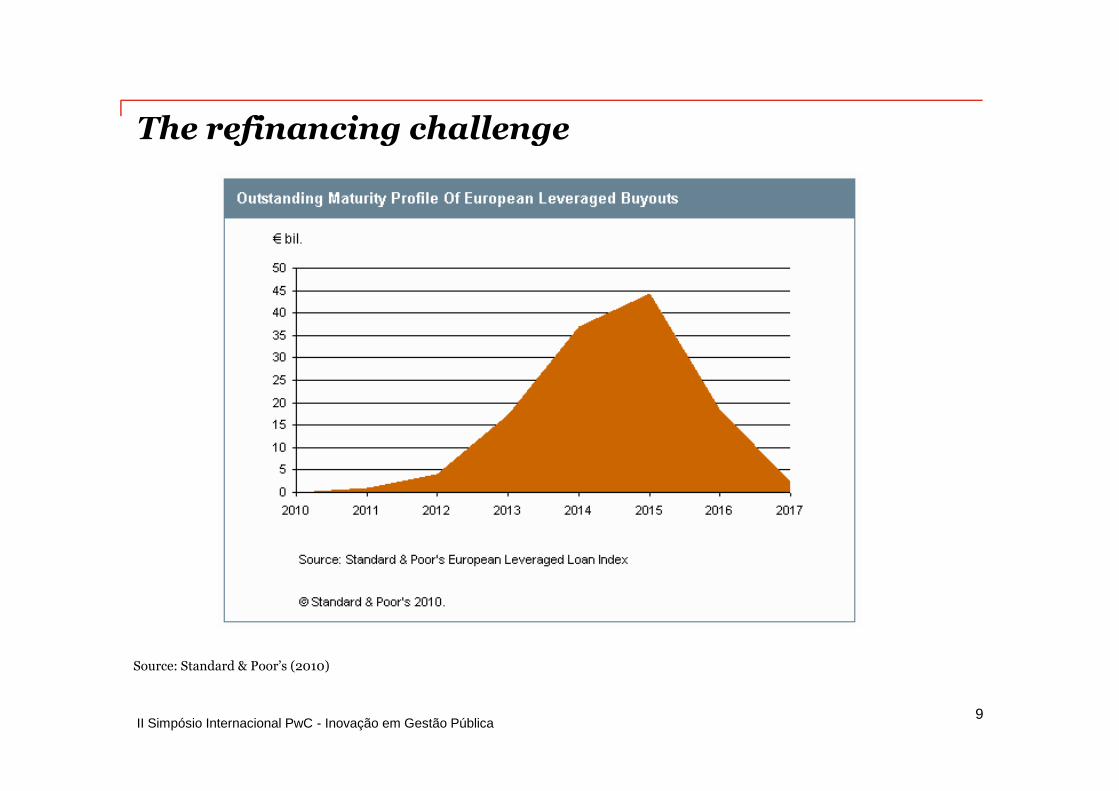
The refinancing challenge
9
Source: Standard & Poor’s (2010)
II Simpósio Internacional PwC - Inovação em Gestão Pública
UK PPP Context
14
II Simpósio Internacional PwC - Inovação em Gestão Pública
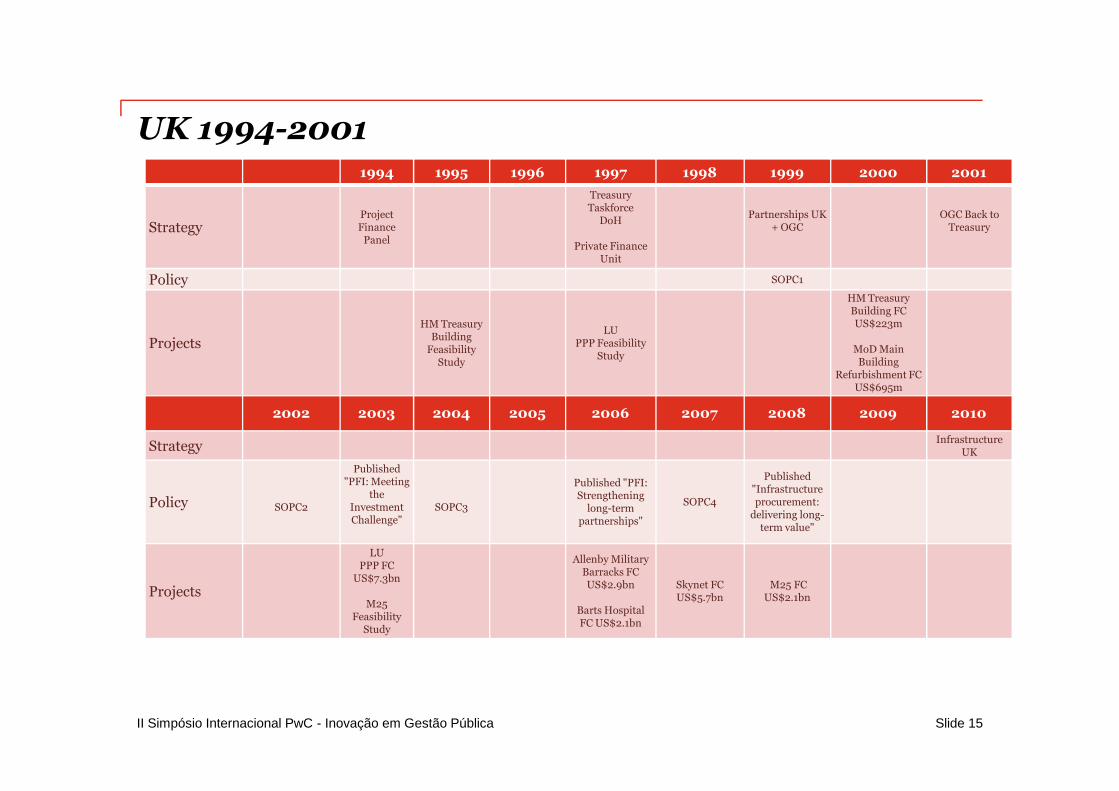
UK 1994-2001
Slide 15
1994 1995 1996 1997 1998 1999 2000 2001
StrategyProjectFinance
Panel
TreasuryTaskforce
DoH
Private FinanceUnit
Partnerships UK+ OGC
OGC Back toTreasury
Policy SOPC1
Projects
HM TreasuryBuilding
FeasibilityStudy
LUPPP Feasibility
Study
HM TreasuryBuilding FCUS$223m
MoD MainBuilding
Refurbishment FCUS$695m
2002 2003 2004 2005 2006 2007 2008 2009 2010
StrategyInfrastructure
UK
Policy SOPC2
Published"PFI: Meeting
theInvestmentChallenge"
SOPC3
Published "PFI:Strengthening
long-termpartnerships"
SOPC4
Published"Infrastructureprocurement:
delivering long-term value"
Projects
LUPPP FC
US$7.3bn
M25Feasibility
Study
Allenby MilitaryBarracks FCUS$2.9bn
Barts HospitalFC US$2.1bn
Skynet FCUS$5.7bn
M25 FCUS$2.1bn
II Simpósio Internacional PwC - Inovação em Gestão Pública
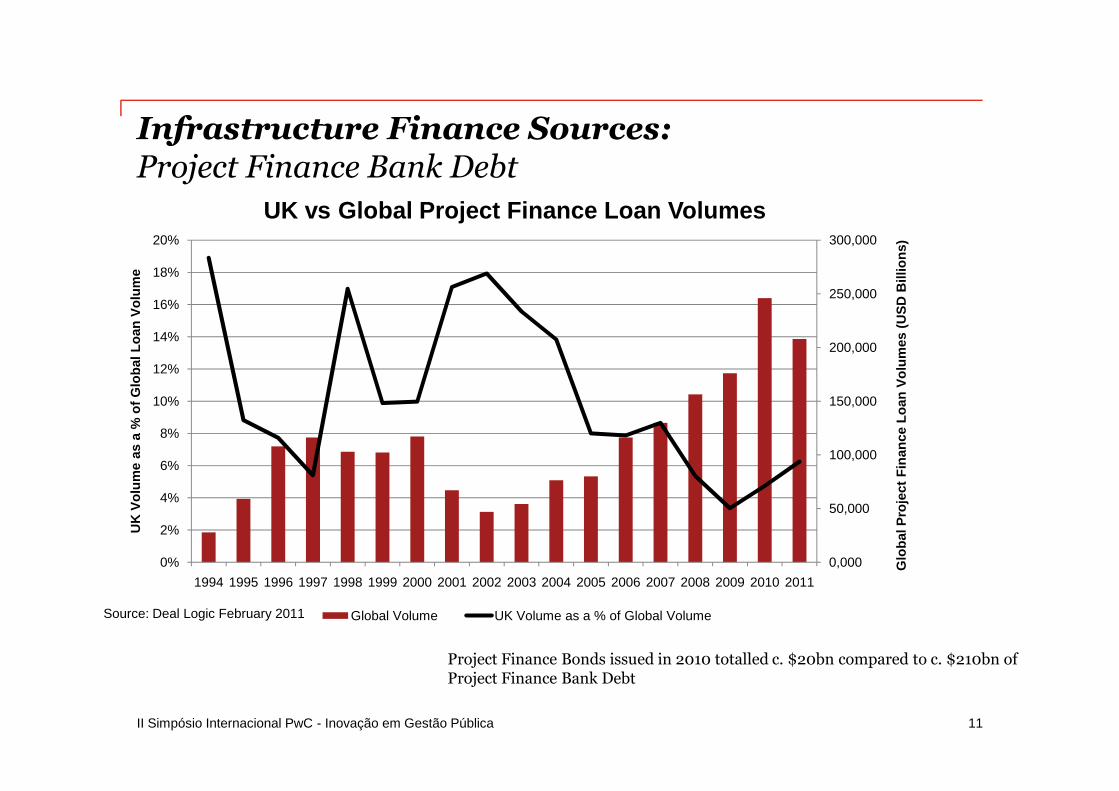
Infrastructure Finance Sources:Project Finance Bank Debt
11
Source: Deal Logic February 2011
0,000
50,000
100,000
150,000
200,000
250,000
300,000
0%
2%
4%
6%
8%
10%
12%
14%
16%
18%
20%
1994 1995 1996 1997 1998 1999 2000 2001 2002 2003 2004 2005 2006 2007 2008 2009 2010 2011
Glo
balP
roje
ct
Fin
an
ce
Lo
an
Vo
lum
es
(US
DB
illio
ns)
UK
Vo
lum
eas
a%
of
Glo
bal
Lo
an
Vo
lum
e
UK vs Global Project Finance Loan Volumes
Global Volume UK Volume as a % of Global Volume
Project Finance Bonds issued in 2010 totalled c. $20bn compared to c. $210bn ofProject Finance Bank Debt
II Simpósio Internacional PwC - Inovação em Gestão Pública
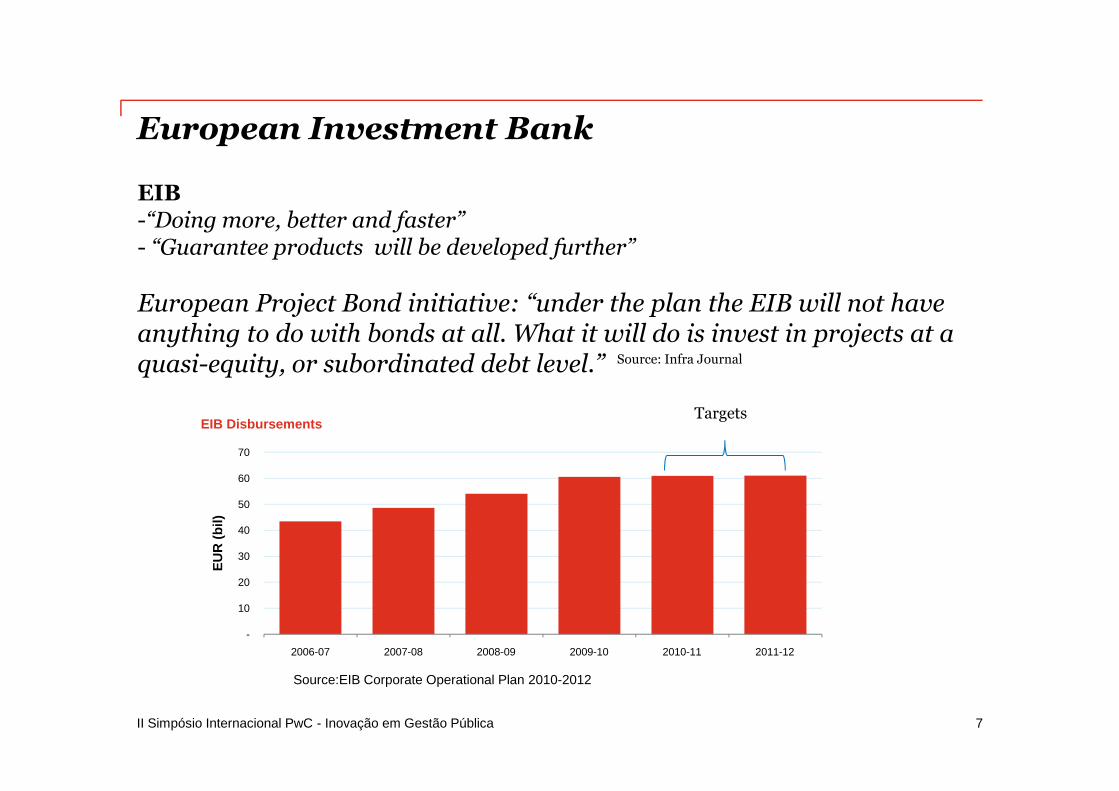
-
10
20
30
40
50
60
70
2006-07 2007-08 2008-09 2009-10 2010-11 2011-12
EU
R(b
il)
EIB Disbursements
European Investment Bank
7
EIB-“Doing more, better and faster”- “Guarantee products will be developed further”
European Project Bond initiative: “under the plan the EIB will not haveanything to do with bonds at all. What it will do is invest in projects at aquasi-equity, or subordinated debt level.”
Targets
Source: Infra Journal
Source:EIB Corporate Operational Plan 2010-2012
II Simpósio Internacional PwC - Inovação em Gestão Pública
What is PPP?
18
II Simpósio Internacional PwC - Inovação em Gestão Pública
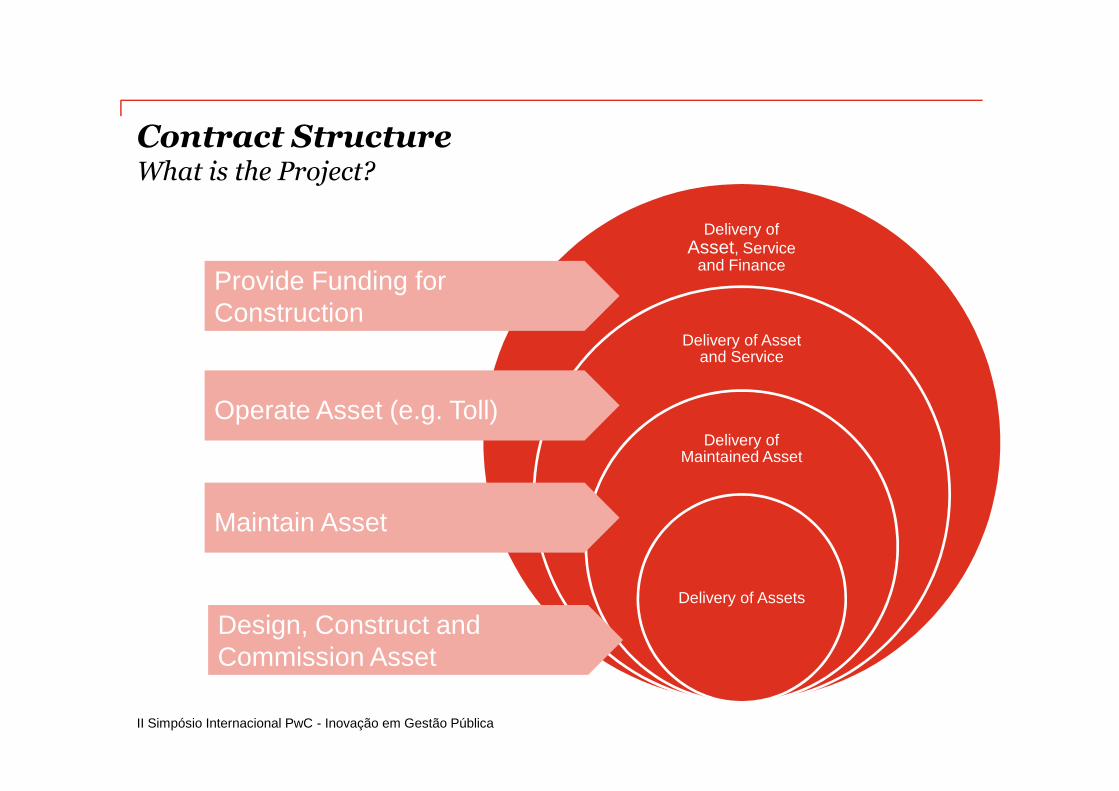
Contract StructureWhat is the Project?
Delivery ofAsset, Service
and Finance
Delivery of Assetand Service
Delivery ofMaintained Asset
Delivery of Assets
Provide Funding forConstruction
Operate Asset (e.g. Toll)
Maintain Asset
Design, Construct andCommission Asset
II Simpósio Internacional PwC - Inovação em Gestão Pública
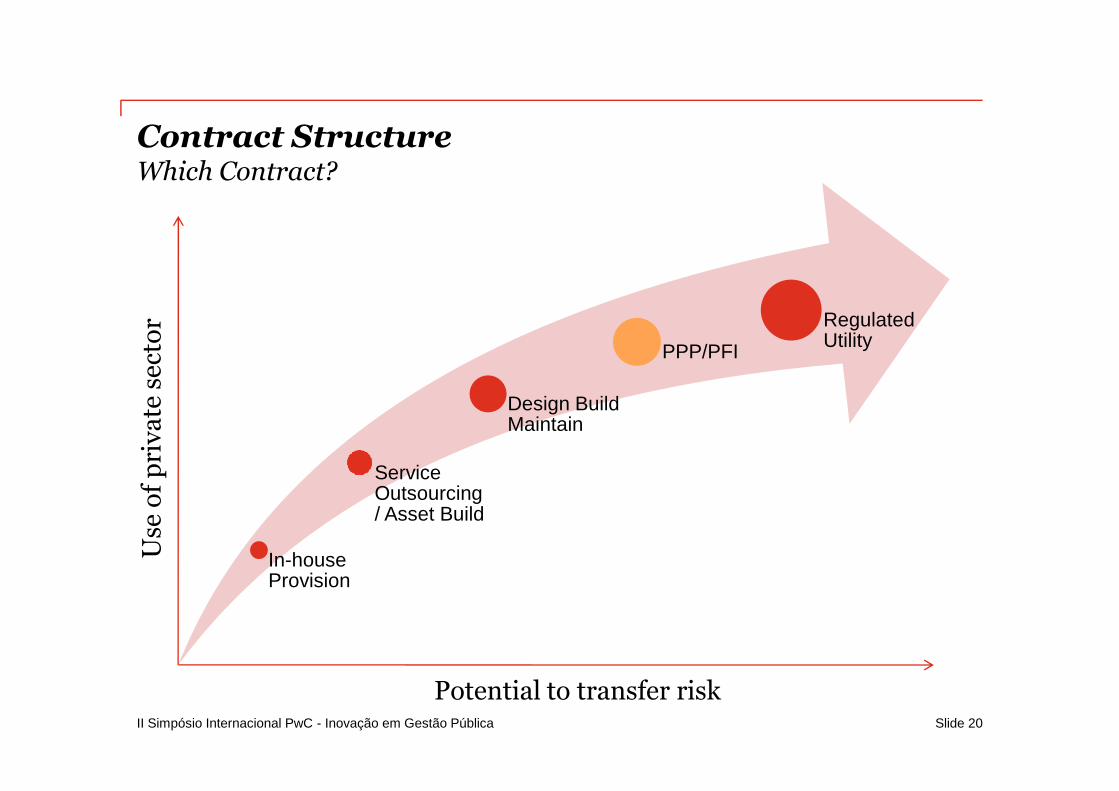
Contract StructureWhich Contract?
Slide 20
In-houseProvision
ServiceOutsourcing/ Asset Build
Design BuildMaintain
PPP/PFI
RegulatedUtility
Use
of
pri
vate
sect
or
Potential to transfer risk
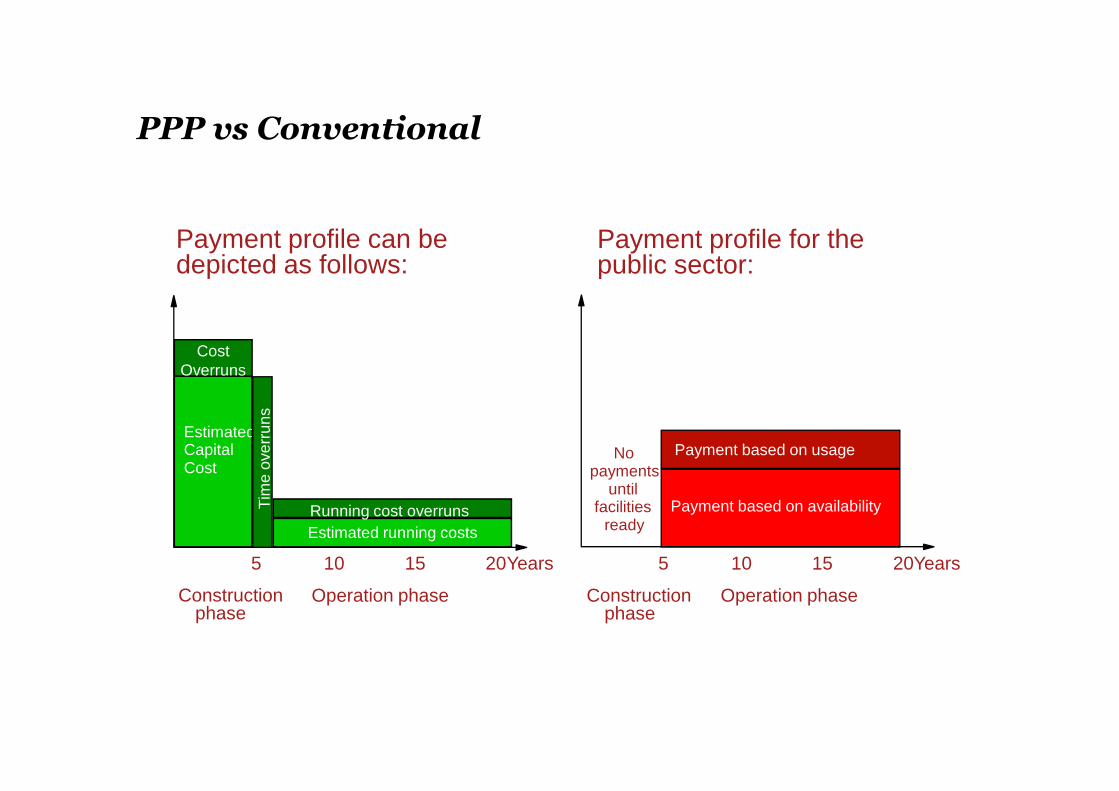
PPP vs Conventional
CostOverruns
Constructionphase
Operation phase
Running cost overruns
Payment based on usageNopayments
untilfacilities
readyPayment based on availability
5 10 15 20 5 10 15 20Years Years
Constructionphase
Operation phase
EstimatedCapitalCost
Estimated running costs
Payment profile can bedepicted as follows:
Payment profile for thepublic sector:
Tim
eo
verr
un
s
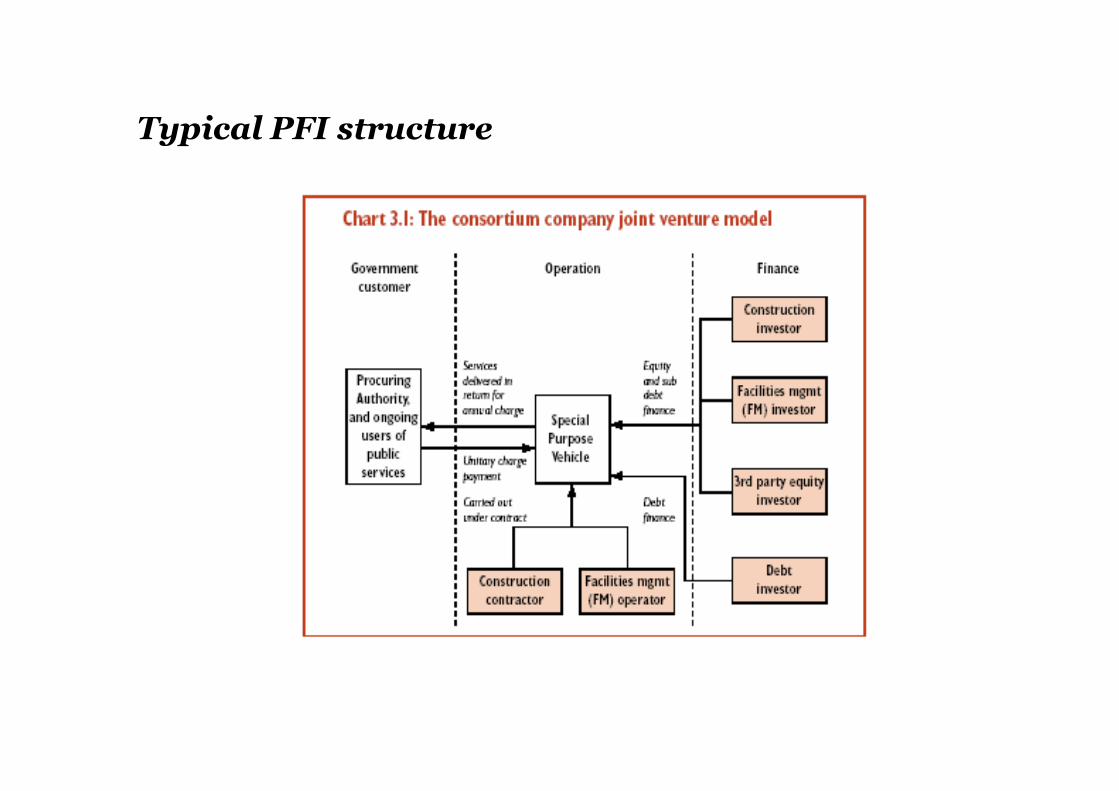
Typical PFI structure
II Simpósio Internacional PwC - Inovação em Gestão Pública
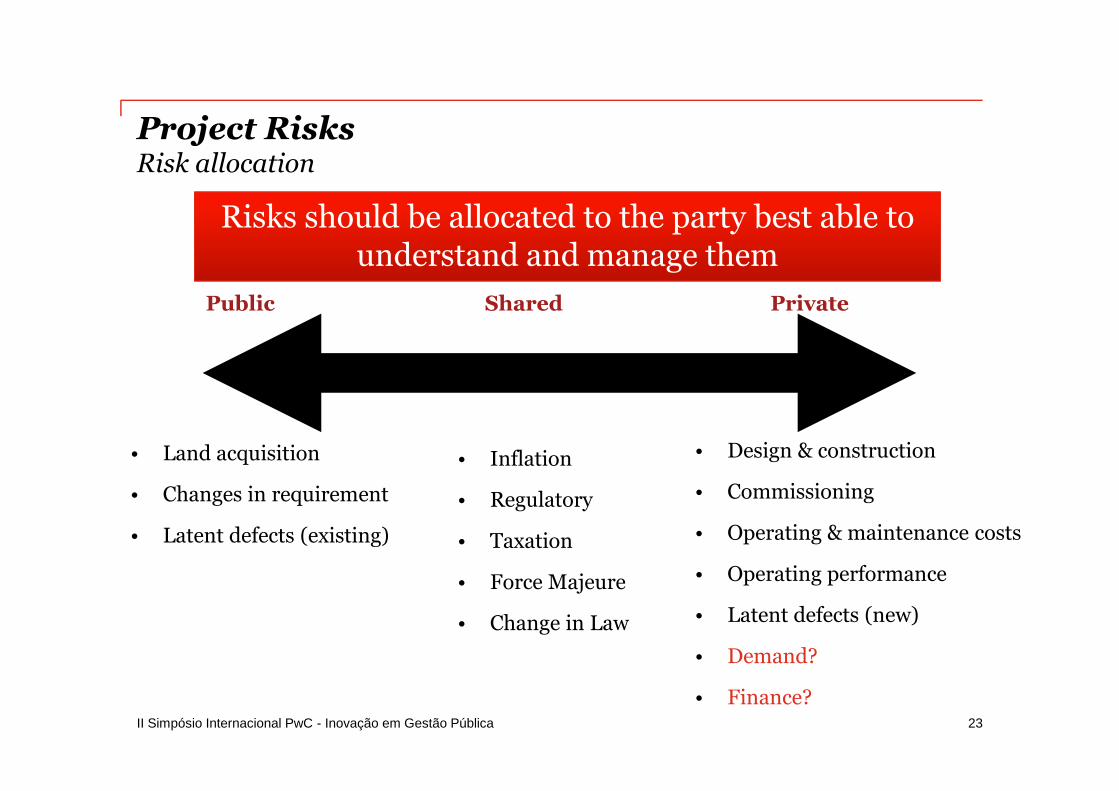
Project RisksRisk allocation
23
Public Shared Private
• Land acquisition
• Changes in requirement
• Latent defects (existing)
• Inflation
• Regulatory
• Taxation
• Force Majeure
• Change in Law
• Design & construction
• Commissioning
• Operating & maintenance costs
• Operating performance
• Latent defects (new)
• Demand?
• Finance?
Risks should be allocated to the party best able tounderstand and manage them
II Simpósio Internacional PwC - Inovação em Gestão Pública
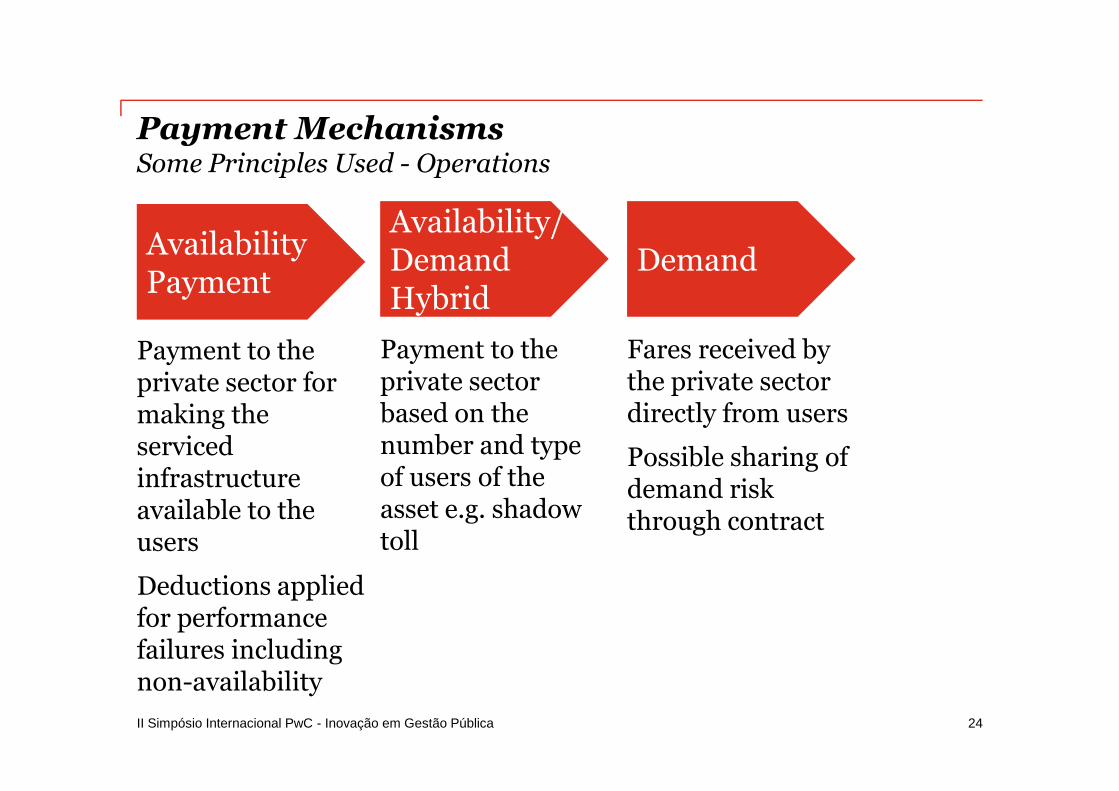
Payment MechanismsSome Principles Used - Operations
Payment to theprivate sector formaking theservicedinfrastructureavailable to theusers
Deductions appliedfor performancefailures includingnon-availability
24
AvailabilityPayment
Payment to theprivate sectorbased on thenumber and typeof users of theasset e.g. shadowtoll
Availability/DemandHybrid
Fares received bythe private sectordirectly from users
Possible sharing ofdemand riskthrough contract
Demand
II Simpósio Internacional PwC - Inovação em Gestão Pública
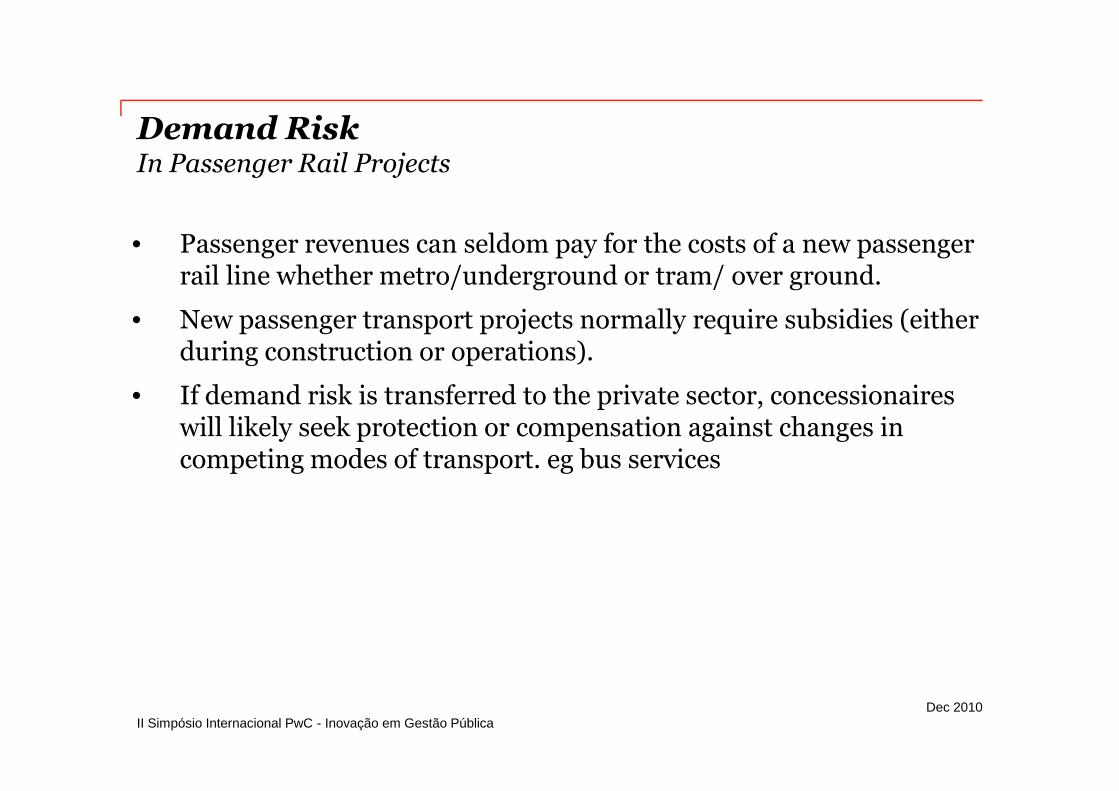
Demand RiskIn Passenger Rail Projects
Dec 2010
• Passenger revenues can seldom pay for the costs of a new passengerrail line whether metro/underground or tram/ over ground.
• New passenger transport projects normally require subsidies (eitherduring construction or operations).
• If demand risk is transferred to the private sector, concessionaireswill likely seek protection or compensation against changes incompeting modes of transport. eg bus services
II Simpósio Internacional PwC - Inovação em Gestão Pública
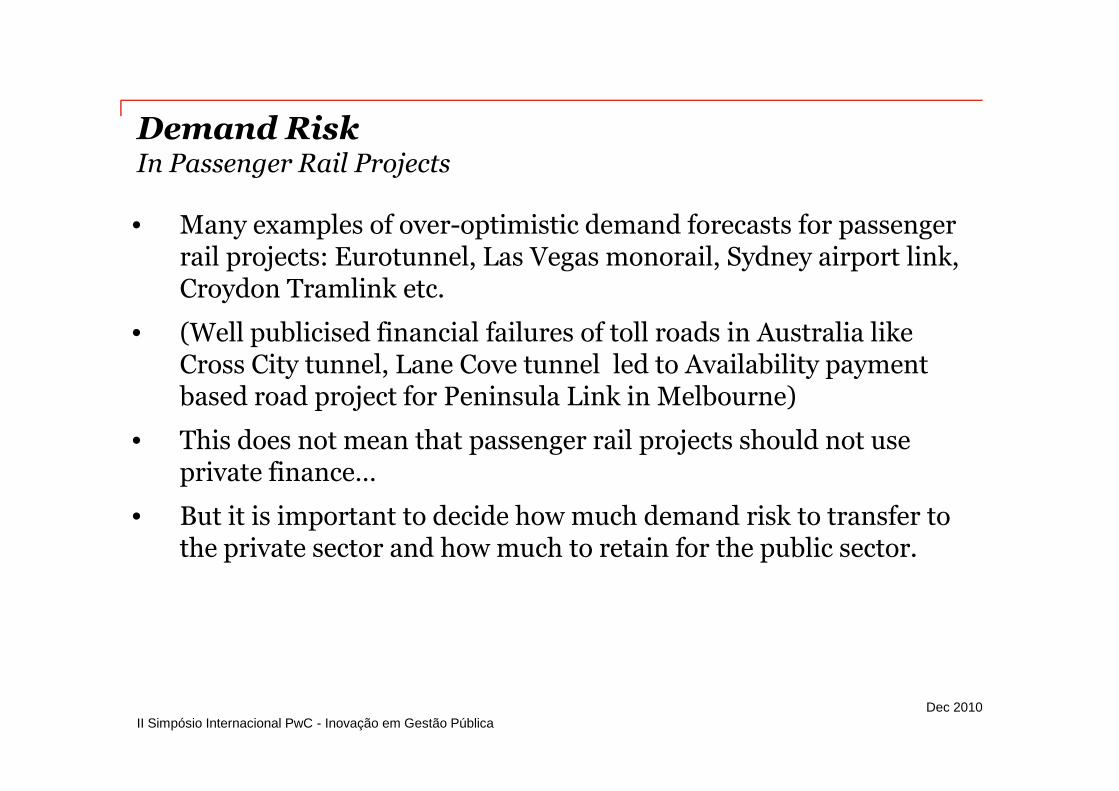
Demand RiskIn Passenger Rail Projects
Dec 2010
• Many examples of over-optimistic demand forecasts for passengerrail projects: Eurotunnel, Las Vegas monorail, Sydney airport link,Croydon Tramlink etc.
• (Well publicised financial failures of toll roads in Australia likeCross City tunnel, Lane Cove tunnel led to Availability paymentbased road project for Peninsula Link in Melbourne)
• This does not mean that passenger rail projects should not useprivate finance…
• But it is important to decide how much demand risk to transfer tothe private sector and how much to retain for the public sector.
II Simpósio Internacional PwC - Inovação em Gestão Pública
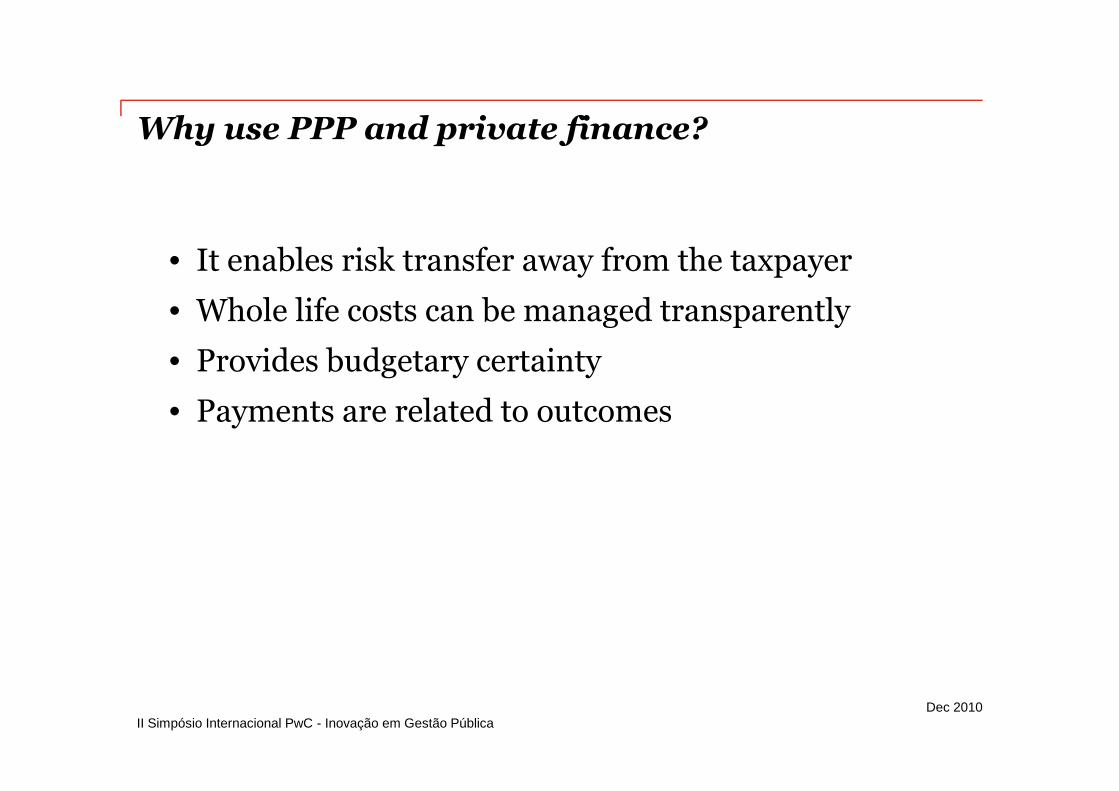
Why use PPP and private finance?
Dec 2010
• It enables risk transfer away from the taxpayer
• Whole life costs can be managed transparently
• Provides budgetary certainty
• Payments are related to outcomes
II Simpósio Internacional PwC - Inovação em Gestão Pública
Alternative Funding Models
28
II Simpósio Internacional PwC - Inovação em Gestão Pública
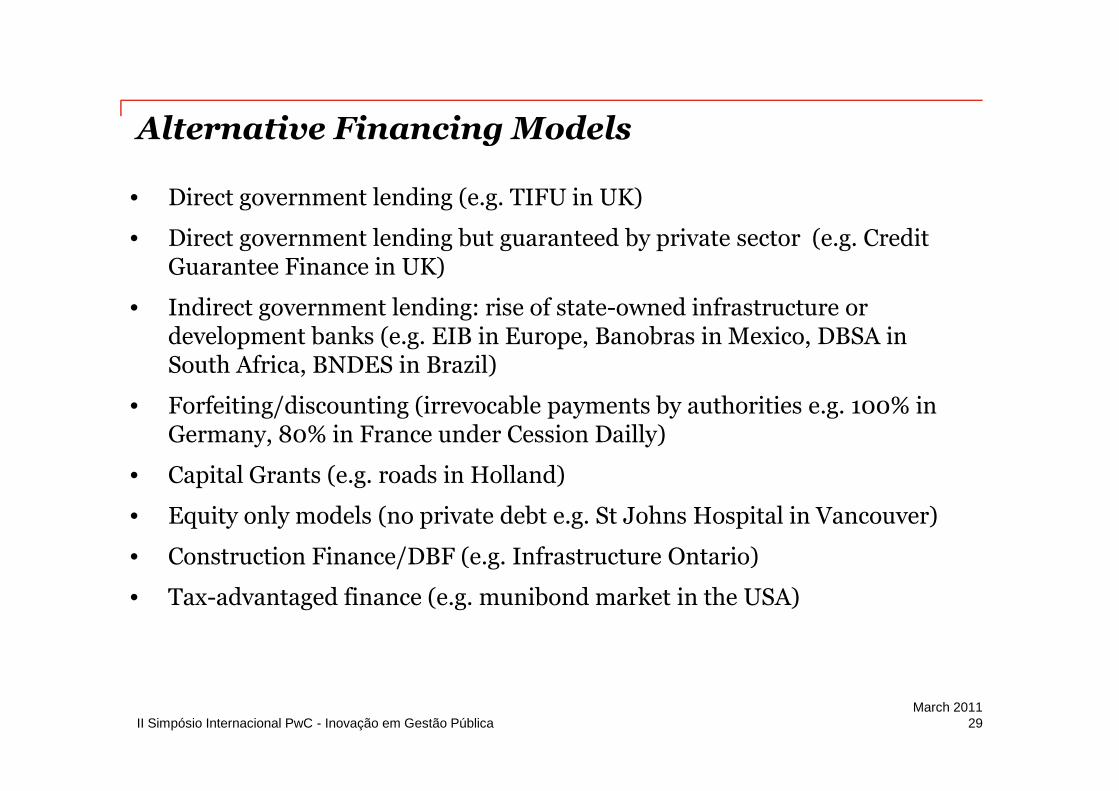
Alternative Financing Models
29March 2011
• Direct government lending (e.g. TIFU in UK)
• Direct government lending but guaranteed by private sector (e.g. CreditGuarantee Finance in UK)
• Indirect government lending: rise of state-owned infrastructure ordevelopment banks (e.g. EIB in Europe, Banobras in Mexico, DBSA inSouth Africa, BNDES in Brazil)
• Forfeiting/discounting (irrevocable payments by authorities e.g. 100% inGermany, 80% in France under Cession Dailly)
• Capital Grants (e.g. roads in Holland)
• Equity only models (no private debt e.g. St Johns Hospital in Vancouver)
• Construction Finance/DBF (e.g. Infrastructure Ontario)
• Tax-advantaged finance (e.g. munibond market in the USA)
This publication has been prepared for general guidance on matters of interest only, and doesnot constitute professional advice. You should not act upon the information contained in thispublication without obtaining specific professional advice. No representation or warranty(express or implied) is given as to the accuracy or completeness of the information containedin this publication, and, to the extent permitted by law, PricewaterhouseCoopers LLP, itsmembers, employees and agents do not accept or assume any liability, responsibility or duty ofcare for any consequences of you or anyone else acting, or refraining to act, in reliance on theinformation contained in this publication or for any decision based on it.
© 2010 PricewaterhouseCoopers LLP. All rights reserved. In this document, “PwC” refers toPricewaterhouseCoopers LLP (a limited liability partnership in the United Kingdom) which is amember firm of PricewaterhouseCoopers International Limited, each member firm of which is aseparate legal entity.


![Calendario Fiscal PwC Costa Rica · conformada por siete firmas: PwC Panamá, PwC Costa Rica, PwC El Salvador, PwC Nicaragua, ... Ralph Waldo Emerson [Escritor y Poeta] 15; Mensuales-03:](https://img.pdfslide.tips/doc/110x75/5bb099af09d3f2830e8c5016/calendario-fiscal-pwc-costa-rica-conformada-por-siete-firmas-pwc-panama-pwc.jpg)