Embed Size (px)
Citation preview
5h Sept 2014 Microsec Research
Investment Highlights
Key Financials Highlights (Figure in INR CR)
STRONG BUY
IL&FS Transportation Networks Ltd
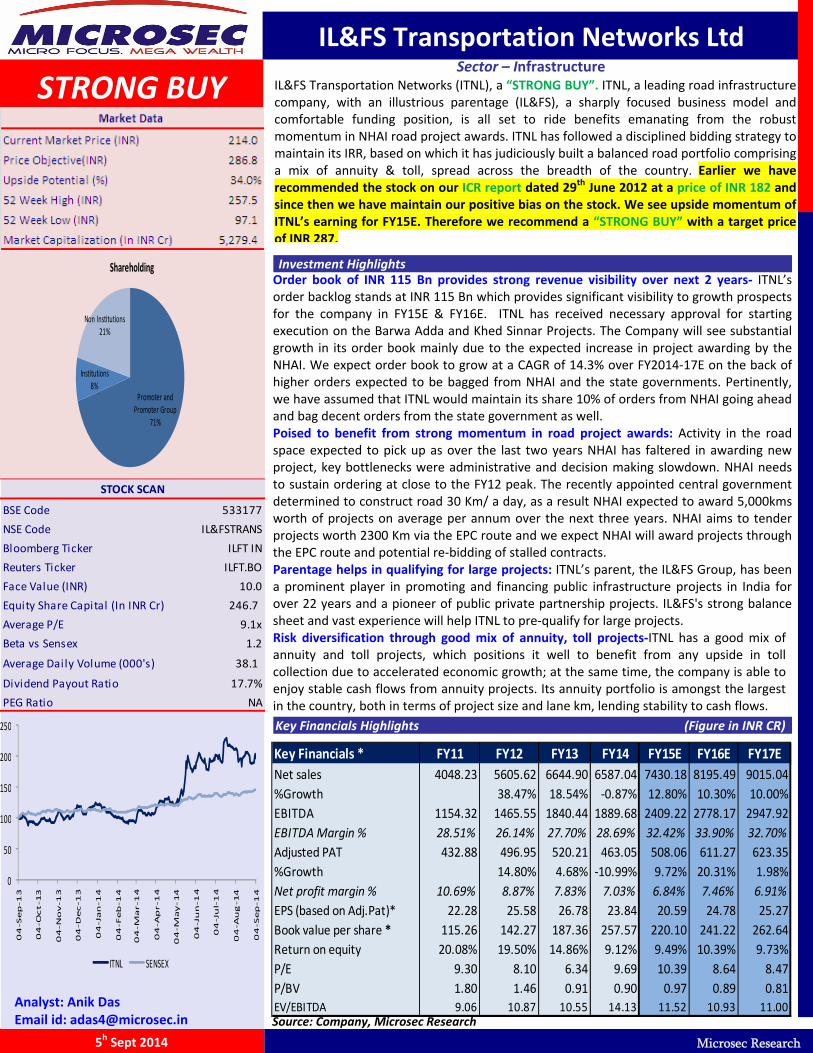
Sector – Infrastructure IL&FS Transportation Networks (ITNL), a “STRONG BUY”. ITNL, a leading road infrastructure company, with an illustrious parentage (IL&FS), a sharply focused business model and comfortable funding position, is all set to ride benefits emanating from the robust momentum in NHAI road project awards. ITNL has followed a disciplined bidding strategy to maintain its IRR, based on which it has judiciously built a balanced road portfolio comprising a mix of annuity & toll, spread across the breadth of the country. Earlier we have recommended the stock on our ICR report dated 29th June 2012 at a price of INR 182 and since then we have maintain our positive bias on the stock. We see upside momentum of ITNL’s earning for FY15E. Therefore we recommend a “STRONG BUY” with a target price of INR 287.
Order book of INR 115 Bn provides strong revenue visibility over next 2 years‐ ITNL’s order backlog stands at INR 115 Bn which provides significant visibility to growth prospects for the company in FY15E & FY16E. ITNL has received necessary approval for starting execution on the Barwa Adda and Khed Sinnar Projects. The Company will see substantial growth in its order book mainly due to the expected increase in project awarding by the NHAI. We expect order book to grow at a CAGR of 14.3% over FY2014‐17E on the back of higher orders expected to be bagged from NHAI and the state governments. Pertinently, we have assumed that ITNL would maintain its share 10% of orders from NHAI going ahead and bag decent orders from the state government as well. Poised to benefit from strong momentum in road project awards: Activity in the road space expected to pick up as over the last two years NHAI has faltered in awarding new project, key bottlenecks were administrative and decision making slowdown. NHAI needs to sustain ordering at close to the FY12 peak. The recently appointed central government determined to construct road 30 Km/ a day, as a result NHAI expected to award 5,000kms worth of projects on average per annum over the next three years. NHAI aims to tender projects worth 2300 Km via the EPC route and we expect NHAI will award projects through the EPC route and potential re‐bidding of stalled contracts. Parentage helps in qualifying for large projects: ITNL’s parent, the IL&FS Group, has been a prominent player in promoting and financing public infrastructure projects in India for over 22 years and a pioneer of public private partnership projects. IL&FS's strong balance sheet and vast experience will help ITNL to pre‐qualify for large projects. Risk diversification through good mix of annuity, toll projects‐ITNL has a good mix of annuity and toll projects, which positions it well to benefit from any upside in toll collection due to accelerated economic growth; at the same time, the company is able to enjoy stable cash flows from annuity projects. Its annuity portfolio is amongst the largest in the country, both in terms of project size and lane km, lending stability to cash flows.
Analyst: Anik Das Email id: [email protected] Source: Company, Microsec Research
Promoter and Promoter Group
71%
Institutions8%
Non Institutions21%
Shareholding
BSE Code 533177
NSE Code IL&FSTRANS
Bloomberg Ticker ILFT IN
Reuters Ticker ILFT.BO
Face Value (INR) 10.0
Equity Share Capital (In INR Cr) 246.7
Average P/E 9.1x
Beta vs Sensex 1.2
Average Daily Volume (000's) 38.1
Dividend Payout Ratio 17.7%
PEG Ratio NA
STOCK SCAN
0
50
100
150
200
250
04‐Sep‐13
04‐Oct‐13
04‐Nov‐13
04‐Dec‐13
04‐Jan‐14
04‐Feb‐14
04‐Mar‐14
04‐Apr‐14
04‐May‐14
04‐Jun‐14
04‐Jul‐14
04‐Aug‐14
04‐Sep‐14
ITNL SENSEX
Key Financials * FY11 FY12 FY13 FY14 FY15E FY16E FY17E
Net sales 4048.23 5605.62 6644.90 6587.04 7430.18 8195.49 9015.04
%Growth 38.47% 18.54% ‐0.87% 12.80% 10.30% 10.00%
EBITDA 1154.32 1465.55 1840.44 1889.68 2409.22 2778.17 2947.92
EBITDA Margin % 28.51% 26.14% 27.70% 28.69% 32.42% 33.90% 32.70%
Adjusted PAT 432.88 496.95 520.21 463.05 508.06 611.27 623.35
%Growth 14.80% 4.68% ‐10.99% 9.72% 20.31% 1.98%
Net profit margin % 10.69% 8.87% 7.83% 7.03% 6.84% 7.46% 6.91%
EPS (based on Adj.Pat)* 22.28 25.58 26.78 23.84 20.59 24.78 25.27
Book value per share * 115.26 142.27 187.36 257.57 220.10 241.22 262.64
Return on equity 20.08% 19.50% 14.86% 9.12% 9.49% 10.39% 9.73%
P/E 9.30 8.10 6.34 9.69 10.39 8.64 8.47
P/BV 1.80 1.46 0.91 0.90 0.97 0.89 0.81
EV/EBITDA 9.06 10.87 10.55 14.13 11.52 10.93 11.00
- 2 -
Microsec Research 5th Sept 2014
Investment Rationale
Order book of INR 115 Bn provides strong revenue visibility over next 2years –
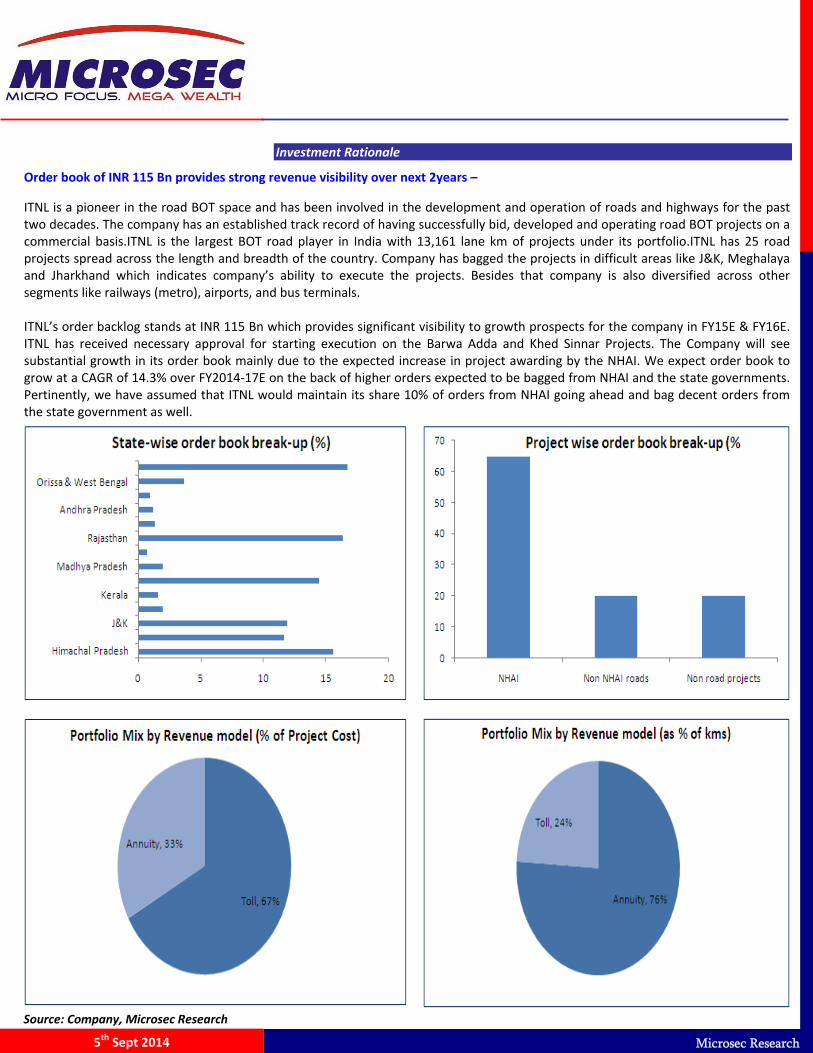
ITNL is a pioneer in the road BOT space and has been involved in the development and operation of roads and highways for the past two decades. The company has an established track record of having successfully bid, developed and operating road BOT projects on a commercial basis.ITNL is the largest BOT road player in India with 13,161 lane km of projects under its portfolio.ITNL has 25 road projects spread across the length and breadth of the country. Company has bagged the projects in difficult areas like J&K, Meghalaya and Jharkhand which indicates company’s ability to execute the projects. Besides that company is also diversified across other segments like railways (metro), airports, and bus terminals. ITNL’s order backlog stands at INR 115 Bn which provides significant visibility to growth prospects for the company in FY15E & FY16E. ITNL has received necessary approval for starting execution on the Barwa Adda and Khed Sinnar Projects. The Company will see substantial growth in its order book mainly due to the expected increase in project awarding by the NHAI. We expect order book to grow at a CAGR of 14.3% over FY2014‐17E on the back of higher orders expected to be bagged from NHAI and the state governments. Pertinently, we have assumed that ITNL would maintain its share 10% of orders from NHAI going ahead and bag decent orders from the state government as well. Defence Procurement process flowchart‐
Defence Value Chain – Indian Context
Source: Company, Microsec Research
- 3 -
Microsec Research 5th Sept 2014
Business Model‐
ITNL’S Value Chain‐
ITNL’S Value Chain
Project Portfolio‐
ITNL
Controlling stake in SPV
SPV signs concession agreement with respective Govt. authority
Advisory Fees
EPC contract
Third party contractor
ITNL
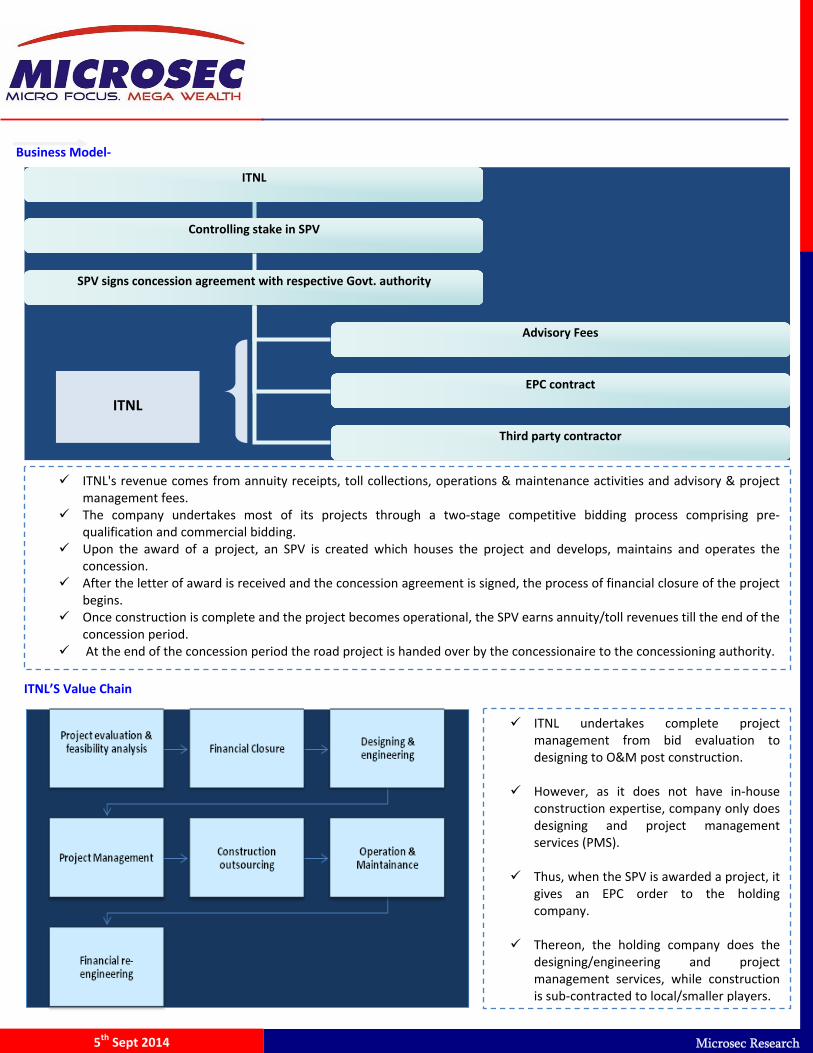
ITNL's revenue comes from annuity receipts, toll collections, operations & maintenance activities and advisory & project management fees.
The company undertakes most of its projects through a two‐stage competitive bidding process comprising pre‐qualification and commercial bidding.
Upon the award of a project, an SPV is created which houses the project and develops, maintains and operates the concession.
After the letter of award is received and the concession agreement is signed, the process of financial closure of the project begins.
Once construction is complete and the project becomes operational, the SPV earns annuity/toll revenues till the end of the concession period.
At the end of the concession period the road project is handed over by the concessionaire to the concessioning authority.
ITNL undertakes complete project management from bid evaluation to designing to O&M post construction.
However, as it does not have in‐house
construction expertise, company only does designing and project management services (PMS).
Thus, when the SPV is awarded a project, it
gives an EPC order to the holding company.
Thereon, the holding company does the
designing/engineering and project management services, while construction is sub‐contracted to local/smaller players.

- 4 -
Microsec Research 5th Sept 2014
Project Portfolio‐
Source: Company, Microsec Research
Project Portfolio
Annuity Toll Projects Urban Others
NKEL EHEL (74%)
APEL (100%) JSEL (50%)
TRDCL JRPPICL
HREL (74%) Hyderabad Ring Road Limited (26%)
CNTL
GRICL WGEL
NTBCL (25.35%)
IRIDCL
RIDCOR PSRDCL
MBEL WCBTRL
NAMEL BAEL (100%)
Chongqing Yuhe Expressway
KSEL (100%)
Sociedad Concesionaria Autovía A‐4 Madrid
SBHL (100%)
KNCL BKEL (100%)
VNIL (90%) MPBCDCL
RMGL Charminar RoboPark Limited (89.20%)
RMGSL
IRL (71.37%) IOPL , Singapore (100%)
ITNL International Pte Ltd, Singapore (100%)
ITNL International JLT (“IIJLT”), Dubai (100%)
Elsamex SA, Spain

- 5 -
Microsec Research 5th Sept 2014
Industry snapshot‐ The Indian road network comprises expressways, national highways, state highways, major district roads and rural and other roads. National Highways are the key constituents of India's road network since they carry 40% of the total road traffic although they constitute only 2% of the total road network. The Indian Government has envisaged the National Highways Development Project (NHDP), which is being implemented through the National Highways Authority of India (NHAI). The NHDP provides a significant opportunity for the development of National Highways including construction of bridges, flyovers and elevated structures. The 13th Finance Commission has decided to provide a central grant of INR 199.30 billion over the period 2011 ‐15 for development of state roads across the country. This is in addition to the normal expenditure that is undertaken. Private sector participation is expected to be 35% of overall investments. BOT is the most favored PPP format with 75% projects being awarded on this model. Activity in the road space expected to pick up as over the last two years NHAI has faltered in awarding new project, key bottlenecks were administrative and decision making slowdown. NHAI needs to sustain ordering at close to the FY12 peak. The recently appointed central government determined to construct road 30 Km/ a day, as a result NHAI expected to award 5,000kms worth of projects on average per annum over the next three years.
For the last two years project award activity fell discernibly and NHAI now targets to push 6000 Km of projects on an urgent basis. Tendering would be done on BOT & EPC basis. During FY 2013‐14, both BOT and EPC project awards by the NHAI declined to 1116km/213km in FY13/FY14 V/S 6380km in FY12. In FY13‐14, NHAI awarded only 1116km of BOT projects as against the original target of 8800km. NHAI aims to tender projects worth 2300 Km via the EPC route and we expect NHAI will award projects through the EPC route and potential re‐bidding of stalled contracts.
NHAI has bring a notable changes in the premiums rescheduling scheme to resolved the much needed cash flow mismatch. From now on developers will be able to reschedule their premium dues to NHAI into a loan. Earlier methodology was, developers could defer premium payment to 75% during first 3 years of the construction period and 50% of the premium for the remaining years
for six‐laning projects.
Source: Company, Microsec Research
- 6 -
Microsec Research 5th Sept 2014
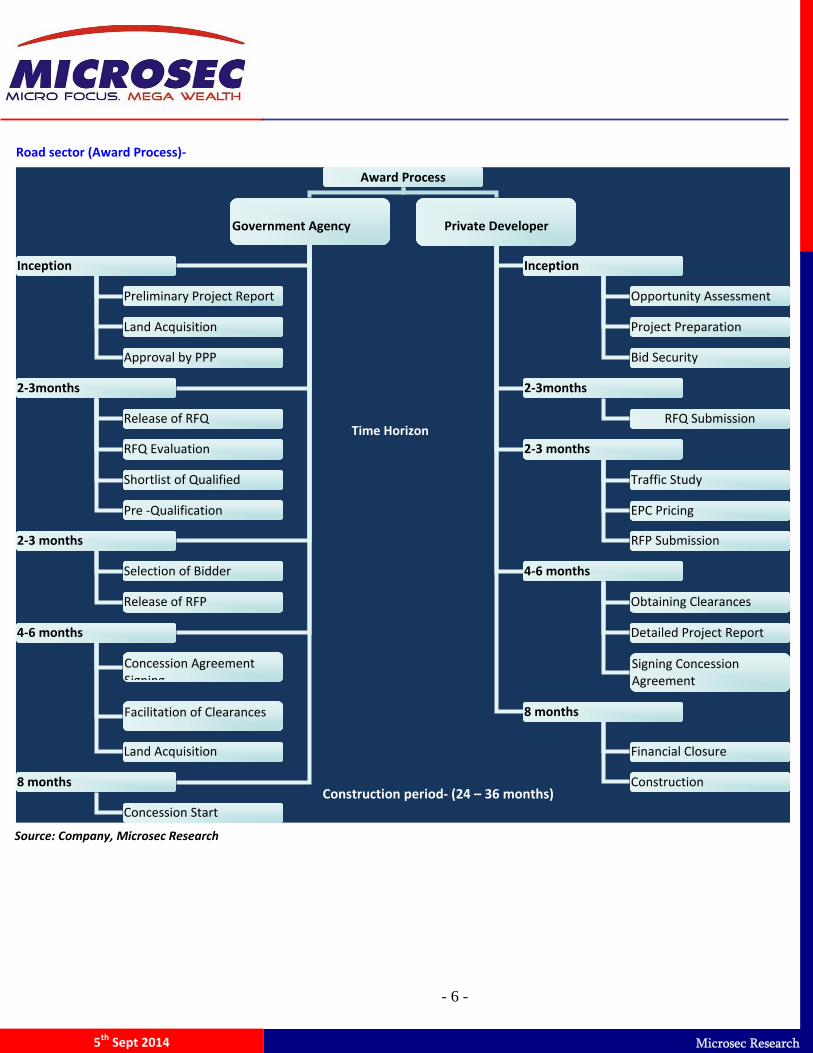
Road sector (Award Process)‐
Award Process
Government Agency Private Developer
Inception
2‐3months
2‐3 months
4‐6 months
8 months
Inception
2‐3months
2‐3 months
4‐6 months
8 months
Preliminary Project Report
Land Acquisition
Approval by PPP
Opportunity Assessment
Project Preparation
Bid Security
Release of RFQ
RFQ Evaluation
Shortlist of Qualified
Pre ‐Qualification
RFQ Submission
Selection of Bidder
Release of RFP
Traffic Study
EPC Pricing
RFP Submission
Concession Agreement Signing
Facilitation of Clearances
Land Acquisition
Obtaining Clearances
Detailed Project Report
Signing Concession Agreement
Concession Start
Financial Closure
Construction
Time Horizon
Construction period‐ (24 – 36 months)
Source: Company, Microsec Research
- 7 -
Microsec Research 5th Sept 2014
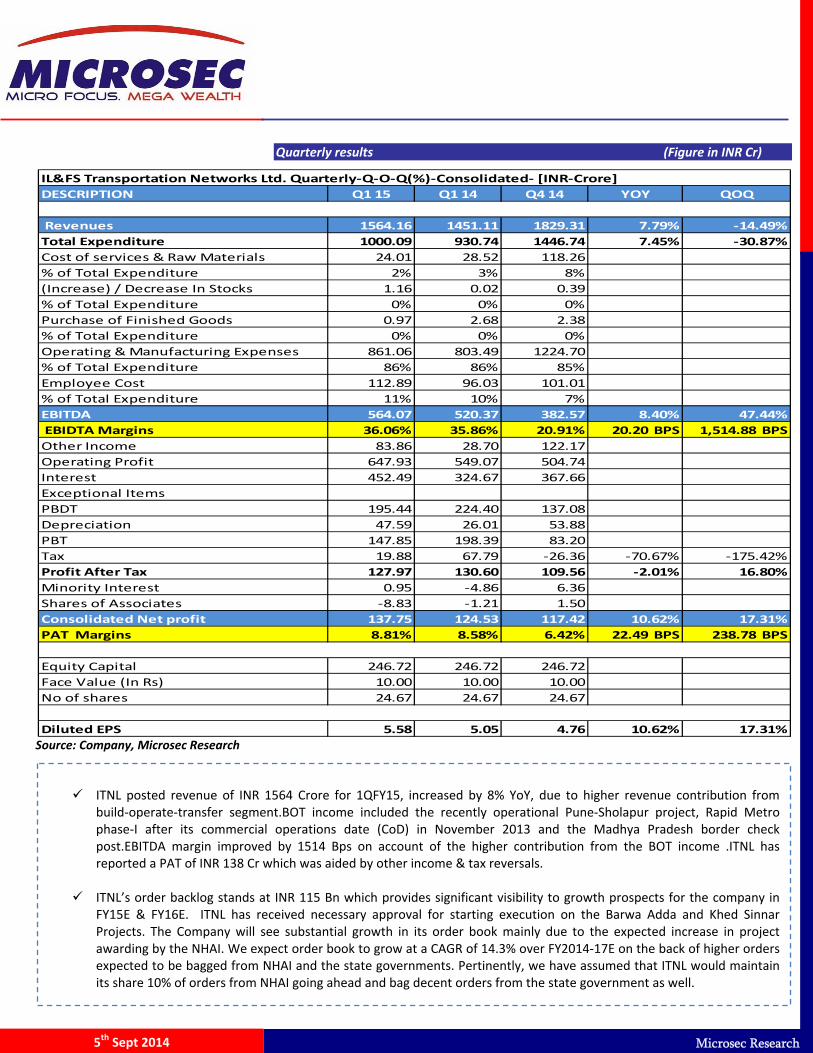
Quarterly results (Figure in INR Cr)
Source: Company, Microsec Research
ITNL posted revenue of INR 1564 Crore for 1QFY15, increased by 8% YoY, due to higher revenue contribution from
build‐operate‐transfer segment.BOT income included the recently operational Pune‐Sholapur project, Rapid Metro phase‐I after its commercial operations date (CoD) in November 2013 and the Madhya Pradesh border check post.EBITDA margin improved by 1514 Bps on account of the higher contribution from the BOT income .ITNL has reported a PAT of INR 138 Cr which was aided by other income & tax reversals.
ITNL’s order backlog stands at INR 115 Bn which provides significant visibility to growth prospects for the company in FY15E & FY16E. ITNL has received necessary approval for starting execution on the Barwa Adda and Khed Sinnar Projects. The Company will see substantial growth in its order book mainly due to the expected increase in project awarding by the NHAI. We expect order book to grow at a CAGR of 14.3% over FY2014‐17E on the back of higher orders expected to be bagged from NHAI and the state governments. Pertinently, we have assumed that ITNL would maintain its share 10% of orders from NHAI going ahead and bag decent orders from the state government as well.
DESCRIPTION Q1 15 Q1 14 Q4 14 YOY QOQ
Revenues 1564.16 1451.11 1829.31 7.79% ‐14.49%
Total Expenditure 1000.09 930.74 1446.74 7.45% ‐30.87%
Cost of services & Raw Materials 24.01 28.52 118.26
% of Total Expenditure 2% 3% 8%
(Increase) / Decrease In Stocks 1.16 0.02 0.39
% of Total Expenditure 0% 0% 0%
Purchase of Finished Goods 0.97 2.68 2.38
% of Total Expenditure 0% 0% 0%
Operating & Manufacturing Expenses 861.06 803.49 1224.70
% of Total Expenditure 86% 86% 85%
Employee Cost 112.89 96.03 101.01
% of Total Expenditure 11% 10% 7%
EBITDA 564.07 520.37 382.57 8.40% 47.44%
EBIDTA Margins 36.06% 35.86% 20.91% 20.20 BPS 1,514.88 BPS
Other Income 83.86 28.70 122.17
Operating Profit 647.93 549.07 504.74
Interest 452.49 324.67 367.66
Exceptional Items
PBDT 195.44 224.40 137.08
Depreciation 47.59 26.01 53.88
PBT 147.85 198.39 83.20
Tax 19.88 67.79 ‐26.36 ‐70.67% ‐175.42%
Profit After Tax 127.97 130.60 109.56 ‐2.01% 16.80%
Minority Interest 0.95 ‐4.86 6.36
Shares of Associates ‐8.83 ‐1.21 1.50
Consolidated Net profit 137.75 124.53 117.42 10.62% 17.31%
PAT Margins 8.81% 8.58% 6.42% 22.49 BPS 238.78 BPS
Equity Capital 246.72 246.72 246.72
Face Value (In Rs) 10.00 10.00 10.00
No of shares 24.67 24.67 24.67
Diluted EPS 5.58 5.05 4.76 10.62% 17.31%
IL&FS Transportation Networks Ltd. Quarterly‐Q‐O‐Q(%)‐Consolidated‐ [INR‐Crore]
- 8 -
Microsec Research 5th Sept 2014
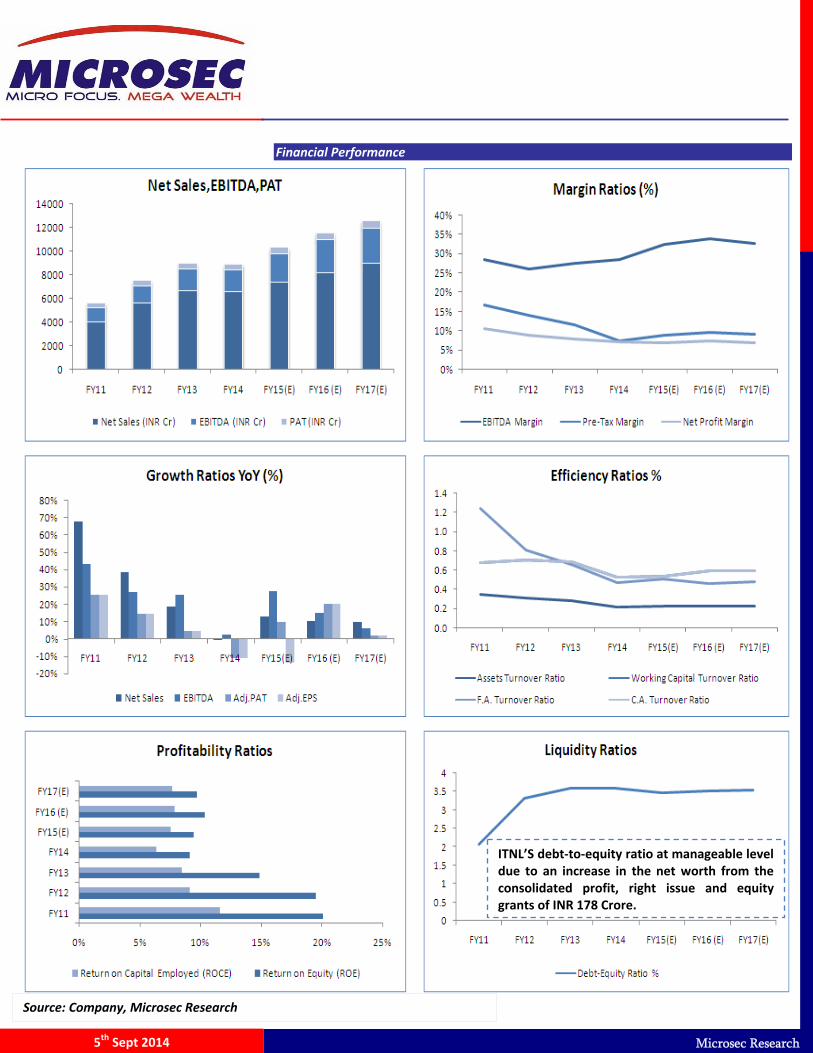
Financial Performance
Source: Company, Microsec Research
ITNL’S debt‐to‐equity ratio at manageable level due to an increase in the net worth from the consolidated profit, right issue and equity grants of INR 178 Crore.

- 9 -
Microsec Research 5th Sept 2014
Peer Comparison
Source: Company, Microsec Research
FY 15E FY 16E FY 15E FY 16E FY 15E FY 16E
IRB Infrastructure Developers Ltd 257.8 8568.2 47.0 12.3 2.9 15.3 14.0 2.07 1.85 14.3% 14.6%
Sadbhav Engineering Ltd 210.5 3193.3 16.3 1.0 3.8 53.7 27.7 2.34 2.09 6.5% 10.3%
Ashoka Buildcon Ltd 140.1 2213.0 22.0 3.5 2.4 18.0 16.5 1.48 1.37 8.6% 8.6%
Pratibha Industries Ltd. 52.9 534.6 12.9 0.7 2.2 8.2 5.2 0.79 0.70 9.9% 14.1%
Simplex Infrastructures Ltd 285.1 1415.5 9.3 1.0 2.1 21.6 11.6 0.96 0.89 4.1% 6.5%
IL&FS Transportation Networks Ltd 214.0 5279.4 28.7 7.0 3.6 10.4 8.6 0.97 0.89 9.5% 10.4%
Note: All figures are on Consolidated, Figures represent FY14 figures
P/E (x) P/BV (x) ROE (%)Company (India)
CMP (INR)
M‐Cap Rs
cr EBITDA % PAT % D/E
- 10 -
Microsec Research 5th Sept 2014
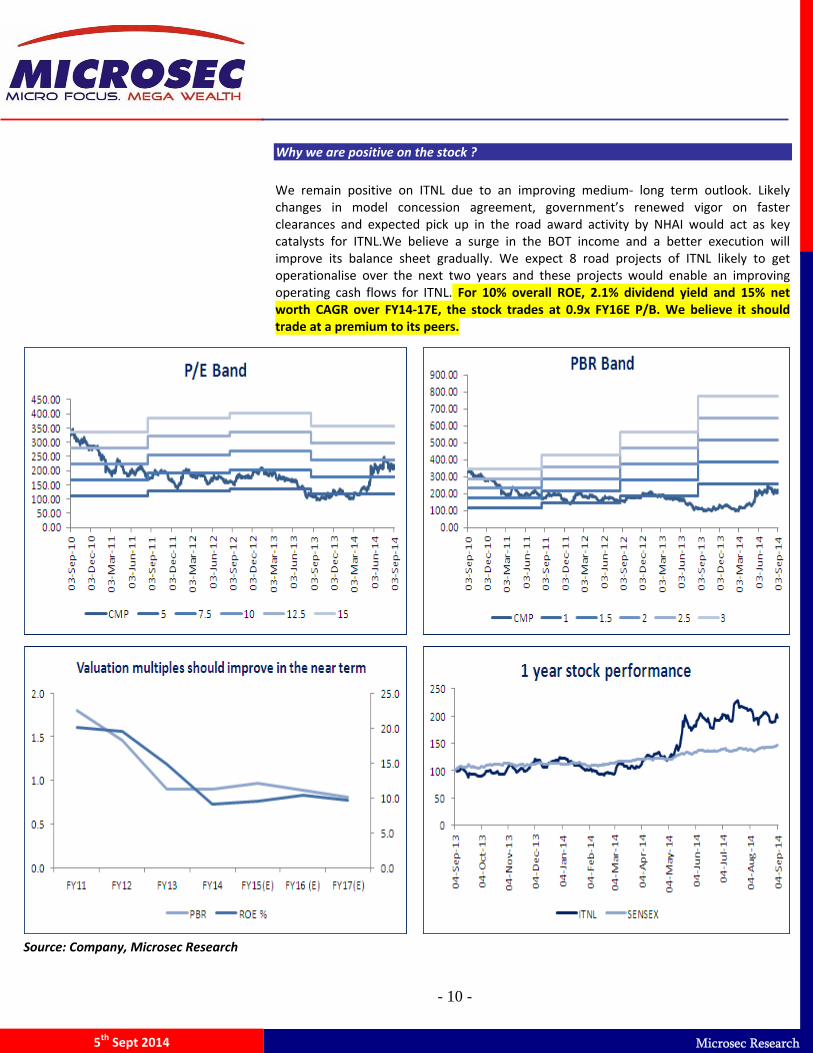
Why we are positive on the stock ?
We remain positive on ITNL due to an improving medium‐ long term outlook. Likely changes in model concession agreement, government’s renewed vigor on faster clearances and expected pick up in the road award activity by NHAI would act as key catalysts for ITNL.We believe a surge in the BOT income and a better execution will improve its balance sheet gradually. We expect 8 road projects of ITNL likely to get operationalise over the next two years and these projects would enable an improving operating cash flows for ITNL. For 10% overall ROE, 2.1% dividend yield and 15% net worth CAGR over FY14‐17E, the stock trades at 0.9x FY16E P/B. We believe it should trade at a premium to its peers.
Source: Company, Microsec Research
- 11 -
Microsec Research 5th Sept 2014
Valuation & View
At the CMP of INR 214 per share, ITNL is quoting at 0.97x and 0.89x its FY15E and FY16E price to book value (P/B), respectively. We have used the discounted cash flow (DCF) method to value ITNL. We have assigned a WACC of 11.40% and assumed a terminal growth rate of 3%. Our DCF based price target is INR 287 which shows an upside potential of 34% from the current market price of INR 214. Hence we recommend a “STRONG BUY” for the stock from long term perspective.
Key Risks
Risk associated with BOT projects‐
ITNL is involved in development of PPP road projects; it is exposed to risks associated with gaining right‐of‐way on land stretches, execution risk, and ‘force majeure’ risk, among others
Interest Rate Risk‐
BOT projects are inherently high‐leverage projects. Hence, ITNL’s business model is vulnerable to interest rate fluctuations and any hike in interest rates could increase the company’s interest costs.
- 12 -
Microsec Research 5th Sept 2014
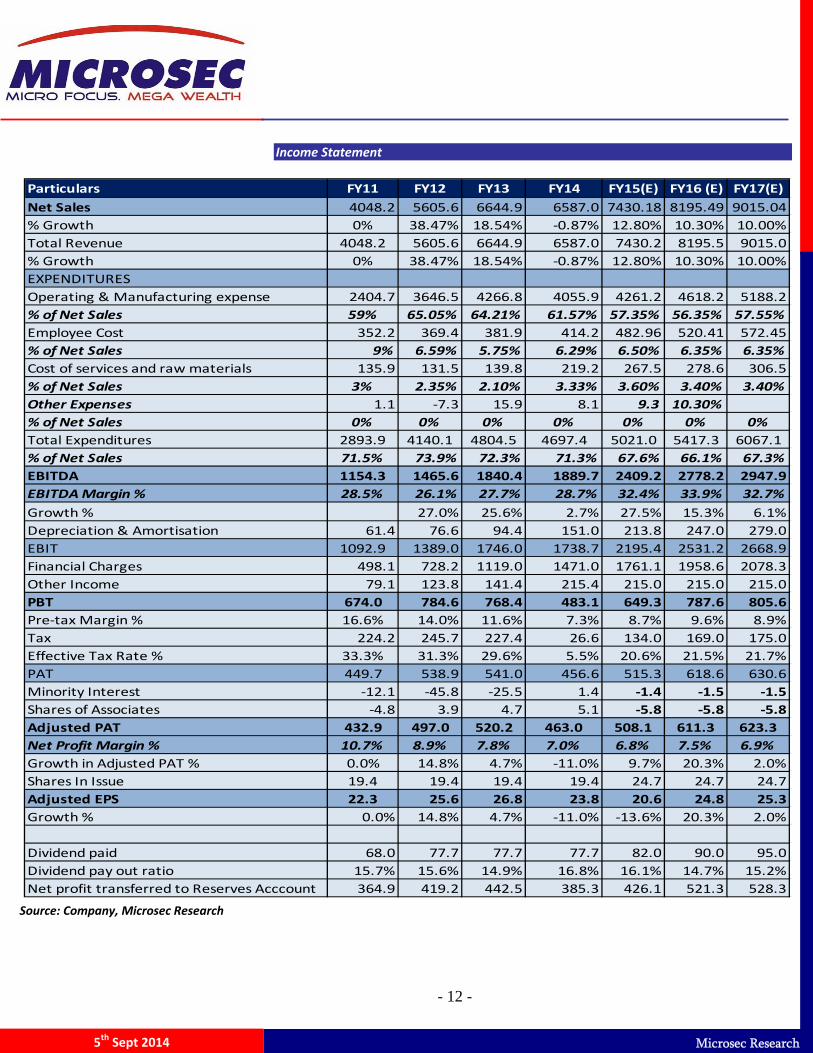
Income Statement
Source: Company, Microsec Research
Particulars FY11 FY12 FY13 FY14 FY15(E) FY16 (E) FY17(E)
Net Sales 4048.2 5605.6 6644.9 6587.0 7430.18 8195.49 9015.04
% Growth 0% 38.47% 18.54% ‐0.87% 12.80% 10.30% 10.00%
Total Revenue 4048.2 5605.6 6644.9 6587.0 7430.2 8195.5 9015.0
% Growth 0% 38.47% 18.54% ‐0.87% 12.80% 10.30% 10.00%
EXPENDITURES
Operating & Manufacturing expense 2404.7 3646.5 4266.8 4055.9 4261.2 4618.2 5188.2
% of Net Sales 59% 65.05% 64.21% 61.57% 57.35% 56.35% 57.55%
Employee Cost 352.2 369.4 381.9 414.2 482.96 520.41 572.45
% of Net Sales 9% 6.59% 5.75% 6.29% 6.50% 6.35% 6.35%
Cost of services and raw materials 135.9 131.5 139.8 219.2 267.5 278.6 306.5
% of Net Sales 3% 2.35% 2.10% 3.33% 3.60% 3.40% 3.40%
Other Expenses 1.1 ‐7.3 15.9 8.1 9.3 10.30%
% of Net Sales 0% 0% 0% 0% 0% 0% 0%
Total Expenditures 2893.9 4140.1 4804.5 4697.4 5021.0 5417.3 6067.1
% of Net Sales 71.5% 73.9% 72.3% 71.3% 67.6% 66.1% 67.3%
EBITDA 1154.3 1465.6 1840.4 1889.7 2409.2 2778.2 2947.9
EBITDA Margin % 28.5% 26.1% 27.7% 28.7% 32.4% 33.9% 32.7%
Growth % 27.0% 25.6% 2.7% 27.5% 15.3% 6.1%
Depreciation & Amortisation 61.4 76.6 94.4 151.0 213.8 247.0 279.0
EBIT 1092.9 1389.0 1746.0 1738.7 2195.4 2531.2 2668.9
Financial Charges 498.1 728.2 1119.0 1471.0 1761.1 1958.6 2078.3
Other Income 79.1 123.8 141.4 215.4 215.0 215.0 215.0
PBT 674.0 784.6 768.4 483.1 649.3 787.6 805.6
Pre‐tax Margin % 16.6% 14.0% 11.6% 7.3% 8.7% 9.6% 8.9%
Tax 224.2 245.7 227.4 26.6 134.0 169.0 175.0
Effective Tax Rate % 33.3% 31.3% 29.6% 5.5% 20.6% 21.5% 21.7%
PAT 449.7 538.9 541.0 456.6 515.3 618.6 630.6
Minority Interest ‐12.1 ‐45.8 ‐25.5 1.4 ‐1.4 ‐1.5 ‐1.5
Shares of Associates ‐4.8 3.9 4.7 5.1 ‐5.8 ‐5.8 ‐5.8
Adjusted PAT 432.9 497.0 520.2 463.0 508.1 611.3 623.3
Net Profit Margin % 10.7% 8.9% 7.8% 7.0% 6.8% 7.5% 6.9%
Growth in Adjusted PAT % 0.0% 14.8% 4.7% ‐11.0% 9.7% 20.3% 2.0%
Shares In Issue 19.4 19.4 19.4 19.4 24.7 24.7 24.7
Adjusted EPS 22.3 25.6 26.8 23.8 20.6 24.8 25.3
Growth % 0.0% 14.8% 4.7% ‐11.0% ‐13.6% 20.3% 2.0%
Dividend paid 68.0 77.7 77.7 77.7 82.0 90.0 95.0
Dividend pay out ratio 15.7% 15.6% 14.9% 16.8% 16.1% 14.7% 15.2%
Net profit transferred to Reserves Acccount 364.9 419.2 442.5 385.3 426.1 521.3 528.3
- 13 -
Microsec Research 5th Sept 2014
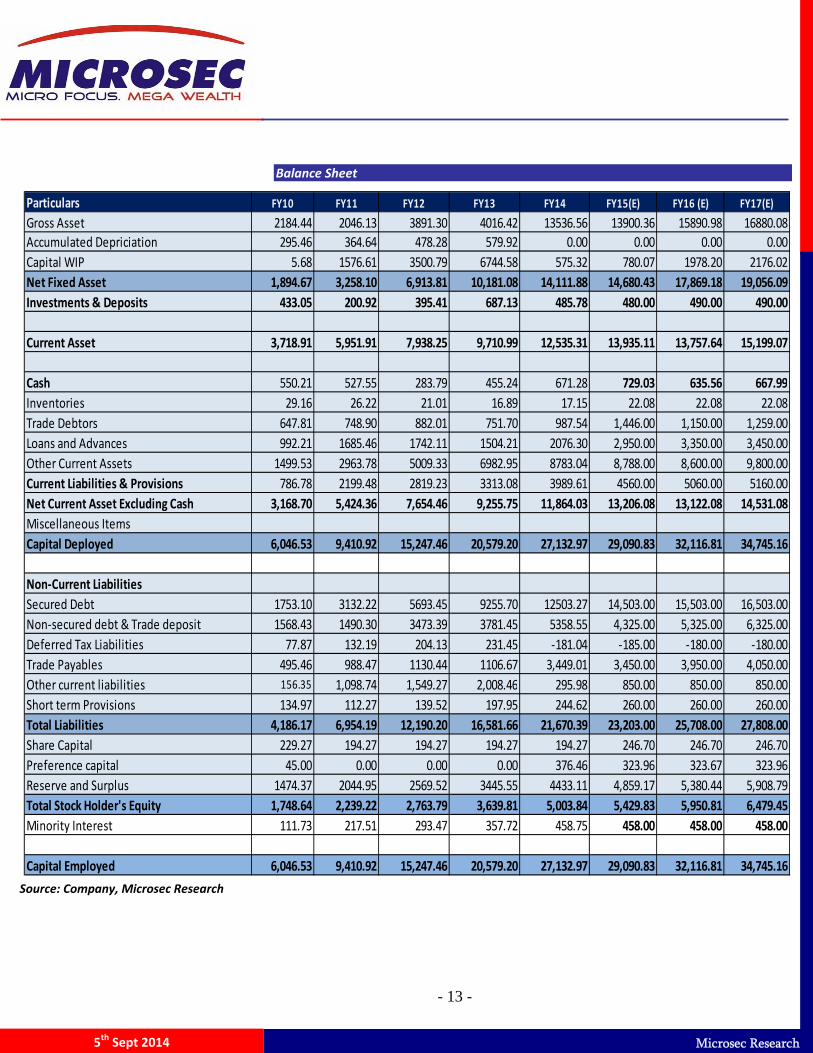
Balance Sheet
Income Statement
Source: Company, Microsec Research
Particulars FY10 FY11 FY12 FY13 FY14 FY15(E) FY16 (E) FY17(E)
Gross Asset 2184.44 2046.13 3891.30 4016.42 13536.56 13900.36 15890.98 16880.08
Accumulated Depriciation 295.46 364.64 478.28 579.92 0.00 0.00 0.00 0.00
Capital WIP 5.68 1576.61 3500.79 6744.58 575.32 780.07 1978.20 2176.02
Net Fixed Asset 1,894.67 3,258.10 6,913.81 10,181.08 14,111.88 14,680.43 17,869.18 19,056.09
Investments & Deposits 433.05 200.92 395.41 687.13 485.78 480.00 490.00 490.00
Current Asset 3,718.91 5,951.91 7,938.25 9,710.99 12,535.31 13,935.11 13,757.64 15,199.07
Cash 550.21 527.55 283.79 455.24 671.28 729.03 635.56 667.99
Inventories 29.16 26.22 21.01 16.89 17.15 22.08 22.08 22.08
Trade Debtors 647.81 748.90 882.01 751.70 987.54 1,446.00 1,150.00 1,259.00
Loans and Advances 992.21 1685.46 1742.11 1504.21 2076.30 2,950.00 3,350.00 3,450.00
Other Current Assets 1499.53 2963.78 5009.33 6982.95 8783.04 8,788.00 8,600.00 9,800.00
Current Liabilities & Provisions 786.78 2199.48 2819.23 3313.08 3989.61 4560.00 5060.00 5160.00
Net Current Asset Excluding Cash 3,168.70 5,424.36 7,654.46 9,255.75 11,864.03 13,206.08 13,122.08 14,531.08
Miscellaneous Items
Capital Deployed 6,046.53 9,410.92 15,247.46 20,579.20 27,132.97 29,090.83 32,116.81 34,745.16
Non‐Current Liabilities
Secured Debt 1753.10 3132.22 5693.45 9255.70 12503.27 14,503.00 15,503.00 16,503.00
Non‐secured debt & Trade deposit 1568.43 1490.30 3473.39 3781.45 5358.55 4,325.00 5,325.00 6,325.00
Deferred Tax Liabilities 77.87 132.19 204.13 231.45 ‐181.04 ‐185.00 ‐180.00 ‐180.00
Trade Payables 495.46 988.47 1130.44 1106.67 3,449.01 3,450.00 3,950.00 4,050.00
Other current liabilities 156.35 1,098.74 1,549.27 2,008.46 295.98 850.00 850.00 850.00
Short term Provisions 134.97 112.27 139.52 197.95 244.62 260.00 260.00 260.00
Total Liabilities 4,186.17 6,954.19 12,190.20 16,581.66 21,670.39 23,203.00 25,708.00 27,808.00
Share Capital 229.27 194.27 194.27 194.27 194.27 246.70 246.70 246.70
Preference capital 45.00 0.00 0.00 0.00 376.46 323.96 323.67 323.96
Reserve and Surplus 1474.37 2044.95 2569.52 3445.55 4433.11 4,859.17 5,380.44 5,908.79
Total Stock Holder's Equity 1,748.64 2,239.22 2,763.79 3,639.81 5,003.84 5,429.83 5,950.81 6,479.45
Minority Interest 111.73 217.51 293.47 357.72 458.75 458.00 458.00 458.00
Capital Employed 6,046.53 9,410.92 15,247.46 20,579.20 27,132.97 29,090.83 32,116.81 34,745.16
- 14 -
Microsec Research 5th Sept 2014
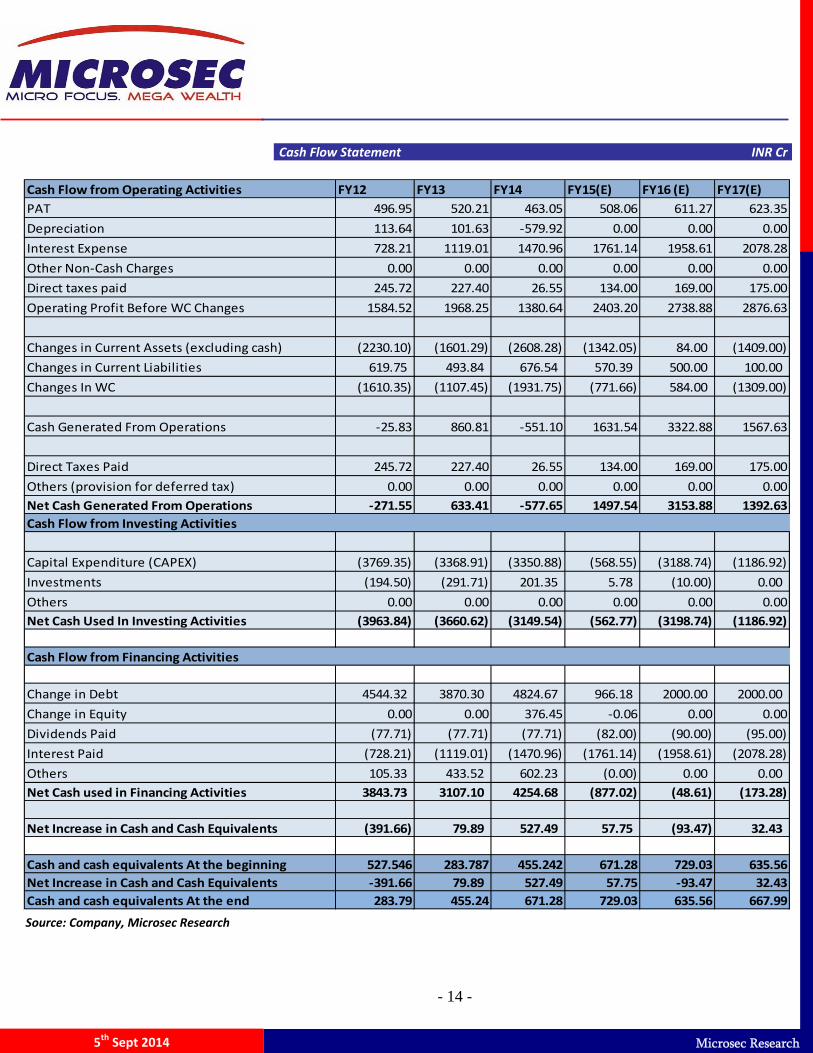
Cash Flow Statement INR Cr
Source: Company, Microsec Research
Cash Flow from Operating Activities FY12 FY13 FY14 FY15(E) FY16 (E) FY17(E)
PAT 496.95 520.21 463.05 508.06 611.27 623.35
Depreciation 113.64 101.63 ‐579.92 0.00 0.00 0.00
Interest Expense 728.21 1119.01 1470.96 1761.14 1958.61 2078.28
Other Non‐Cash Charges 0.00 0.00 0.00 0.00 0.00 0.00
Direct taxes paid 245.72 227.40 26.55 134.00 169.00 175.00
Operating Profit Before WC Changes 1584.52 1968.25 1380.64 2403.20 2738.88 2876.63
Changes in Current Assets (excluding cash) (2230.10) (1601.29) (2608.28) (1342.05) 84.00 (1409.00)
Changes in Current Liabilities 619.75 493.84 676.54 570.39 500.00 100.00
Changes In WC (1610.35) (1107.45) (1931.75) (771.66) 584.00 (1309.00)
Cash Generated From Operations ‐25.83 860.81 ‐551.10 1631.54 3322.88 1567.63
Direct Taxes Paid 245.72 227.40 26.55 134.00 169.00 175.00
Others (provision for deferred tax) 0.00 0.00 0.00 0.00 0.00 0.00
Net Cash Generated From Operations ‐271.55 633.41 ‐577.65 1497.54 3153.88 1392.63
Capital Expenditure (CAPEX) (3769.35) (3368.91) (3350.88) (568.55) (3188.74) (1186.92)
Investments (194.50) (291.71) 201.35 5.78 (10.00) 0.00
Others 0.00 0.00 0.00 0.00 0.00 0.00
Net Cash Used In Investing Activities (3963.84) (3660.62) (3149.54) (562.77) (3198.74) (1186.92)
Change in Debt 4544.32 3870.30 4824.67 966.18 2000.00 2000.00
Change in Equity 0.00 0.00 376.45 ‐0.06 0.00 0.00
Dividends Paid (77.71) (77.71) (77.71) (82.00) (90.00) (95.00)
Interest Paid (728.21) (1119.01) (1470.96) (1761.14) (1958.61) (2078.28)
Others 105.33 433.52 602.23 (0.00) 0.00 0.00
Net Cash used in Financing Activities 3843.73 3107.10 4254.68 (877.02) (48.61) (173.28)
Net Increase in Cash and Cash Equivalents (391.66) 79.89 527.49 57.75 (93.47) 32.43
Cash and cash equivalents At the beginning 527.546 283.787 455.242 671.28 729.03 635.56
Net Increase in Cash and Cash Equivalents ‐391.66 79.89 527.49 57.75 ‐93.47 32.43
Cash and cash equivalents At the end 283.79 455.24 671.28 729.03 635.56 667.99
Cash Flow from Financing Activities
Cash Flow from Investing Activities
- 15 -
Microsec Research 5th Sept 2014
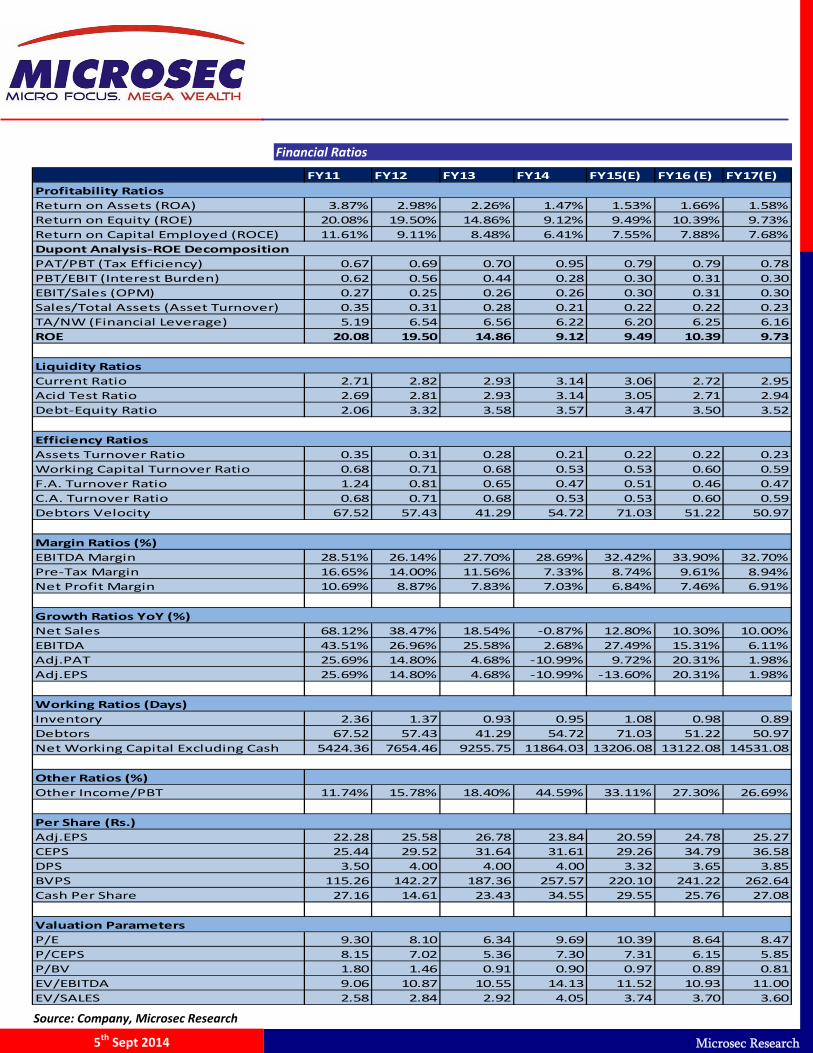
Financial Ratios
Source: Company, Microsec Research
FY11 FY12 FY13 FY14 FY15(E) FY16 (E) FY17(E)
Return on Assets (ROA) 3.87% 2.98% 2.26% 1.47% 1.53% 1.66% 1.58%
Return on Equity (ROE) 20.08% 19.50% 14.86% 9.12% 9.49% 10.39% 9.73%
Return on Capital Employed (ROCE) 11.61% 9.11% 8.48% 6.41% 7.55% 7.88% 7.68%
PAT/PBT (Tax Efficiency) 0.67 0.69 0.70 0.95 0.79 0.79 0.78
PBT/EBIT (Interest Burden) 0.62 0.56 0.44 0.28 0.30 0.31 0.30
EBIT/Sales (OPM) 0.27 0.25 0.26 0.26 0.30 0.31 0.30
Sales/Total Assets (Asset Turnover) 0.35 0.31 0.28 0.21 0.22 0.22 0.23
TA/NW (Financial Leverage) 5.19 6.54 6.56 6.22 6.20 6.25 6.16
ROE 20.08 19.50 14.86 9.12 9.49 10.39 9.73
Current Ratio 2.71 2.82 2.93 3.14 3.06 2.72 2.95
Acid Test Ratio 2.69 2.81 2.93 3.14 3.05 2.71 2.94
Debt‐Equity Ratio 2.06 3.32 3.58 3.57 3.47 3.50 3.52
Assets Turnover Ratio 0.35 0.31 0.28 0.21 0.22 0.22 0.23
Working Capital Turnover Ratio 0.68 0.71 0.68 0.53 0.53 0.60 0.59
F.A. Turnover Ratio 1.24 0.81 0.65 0.47 0.51 0.46 0.47
C.A. Turnover Ratio 0.68 0.71 0.68 0.53 0.53 0.60 0.59
Debtors Velocity 67.52 57.43 41.29 54.72 71.03 51.22 50.97
EBITDA Margin 28.51% 26.14% 27.70% 28.69% 32.42% 33.90% 32.70%
Pre‐Tax Margin 16.65% 14.00% 11.56% 7.33% 8.74% 9.61% 8.94%
Net Profit Margin 10.69% 8.87% 7.83% 7.03% 6.84% 7.46% 6.91%
Net Sales 68.12% 38.47% 18.54% ‐0.87% 12.80% 10.30% 10.00%
EBITDA 43.51% 26.96% 25.58% 2.68% 27.49% 15.31% 6.11%
Adj.PAT 25.69% 14.80% 4.68% ‐10.99% 9.72% 20.31% 1.98%
Adj.EPS 25.69% 14.80% 4.68% ‐10.99% ‐13.60% 20.31% 1.98%
Inventory 2.36 1.37 0.93 0.95 1.08 0.98 0.89
Debtors 67.52 57.43 41.29 54.72 71.03 51.22 50.97
Net Working Capital Excluding Cash 5424.36 7654.46 9255.75 11864.03 13206.08 13122.08 14531.08
Other Ratios (%)
Other Income/PBT 11.74% 15.78% 18.40% 44.59% 33.11% 27.30% 26.69%
Adj.EPS 22.28 25.58 26.78 23.84 20.59 24.78 25.27
CEPS 25.44 29.52 31.64 31.61 29.26 34.79 36.58
DPS 3.50 4.00 4.00 4.00 3.32 3.65 3.85
BVPS 115.26 142.27 187.36 257.57 220.10 241.22 262.64
Cash Per Share 27.16 14.61 23.43 34.55 29.55 25.76 27.08
P/E 9.30 8.10 6.34 9.69 10.39 8.64 8.47
P/CEPS 8.15 7.02 5.36 7.30 7.31 6.15 5.85
P/BV 1.80 1.46 0.91 0.90 0.97 0.89 0.81
EV/EBITDA 9.06 10.87 10.55 14.13 11.52 10.93 11.00
EV/SALES 2.58 2.84 2.92 4.05 3.74 3.70 3.60
Profitability Ratios
Dupont Analysis‐ROE Decomposition
Liquidity Ratios
Efficiency Ratios
Margin Ratios (%)
Growth Ratios YoY (%)
Working Ratios (Days)
Per Share (Rs.)
Valuation Parameters
- 16 -
Microsec Research 5th Sept 2014
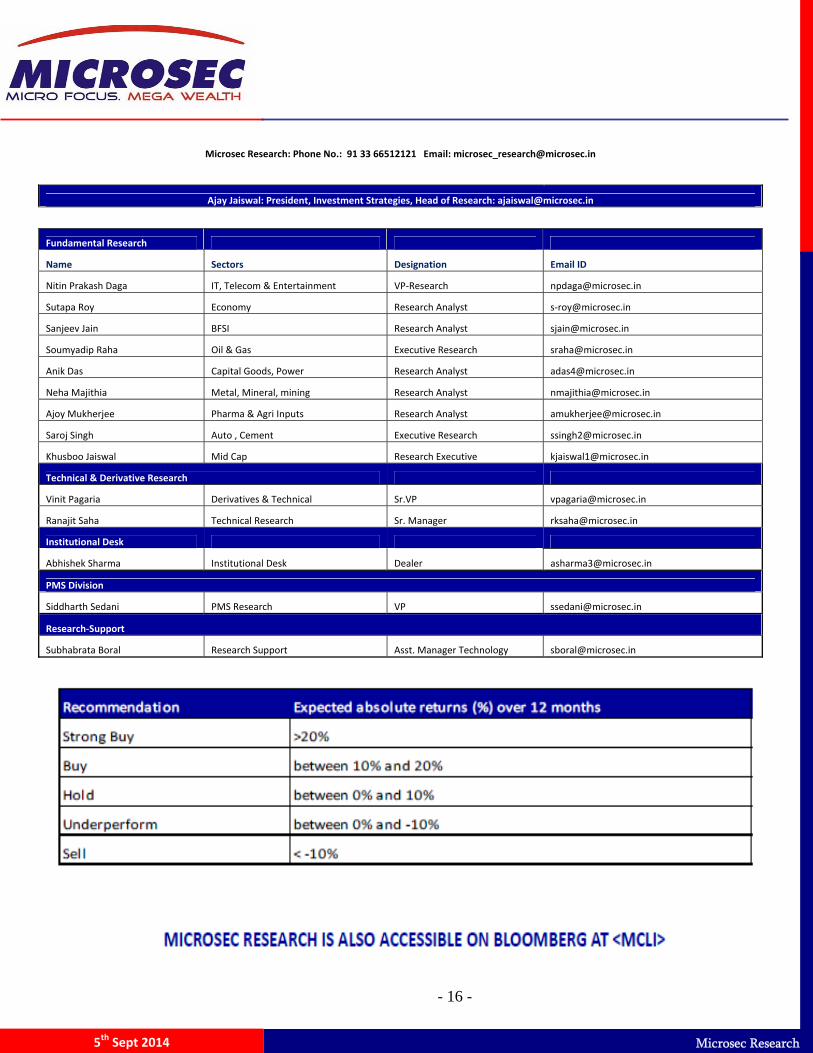
Microsec Research: Phone No.: 91 33 66512121 Email: [email protected]
Ajay Jaiswal: President, Investment Strategies, Head of Research: [email protected]
Fundamental Research
Name Sectors Designation Email ID
Nitin Prakash Daga IT, Telecom & Entertainment VP‐Research [email protected]
Sutapa Roy Economy Research Analyst s‐[email protected]
Sanjeev Jain BFSI Research Analyst [email protected]
Soumyadip Raha Oil & Gas Executive Research [email protected]
Anik Das Capital Goods, Power Research Analyst [email protected]
Neha Majithia Metal, Mineral, mining Research Analyst [email protected]
Ajoy Mukherjee Pharma & Agri Inputs Research Analyst [email protected]
Saroj Singh Auto , Cement Executive Research [email protected]
Khusboo Jaiswal Mid Cap Research Executive [email protected]
Technical & Derivative Research
Vinit Pagaria Derivatives & Technical Sr.VP [email protected]
Ranajit Saha Technical Research Sr. Manager [email protected]
Institutional Desk
Abhishek Sharma Institutional Desk Dealer [email protected]
PMS Division
Siddharth Sedani PMS Research VP [email protected]
Research‐Support
Subhabrata Boral Research Support Asst. Manager Technology [email protected]
- 17 -
Microsec Research 5th Sept 2014

- 18 -
Microsec Research 5th Sept 2014


![Rakesh Singh[1]](https://img.pdfslide.tips/doc/110x75/577c807a1a28abe054a8dd22/rakesh-singh1.jpg)