Embed Size (px)
Citation preview
BMJ Open Diab Res Care 2020;8:e001578. doi:10.1136/bmjdrc-2020-001578
Open access
1
Open access
Impact of tissue macrophage proliferation on peripheral and systemic insulin resistance in obese mice with diabetes
Yutaro Morita,1 Takafumi Senokuchi ,1 Sarie Yamada,1 Toshiaki Wada,1 Tatsuya Furusho,1 Takeshi Matsumura,1 Norio Ishii,1 Saiko Nishida,1 Syuhei Nishida,1 Hiroyuki Motoshima,2 Yoshihiro Komohara,3 Kazuya Yamagata,4 Eiichi Araki1
For numbered affiliations see end of article.
Correspondence toDr Takafumi Senokuchi; ts2281@ kumamoto- u. ac. jp
To cite: Morita Y, Senokuchi T, Yamada S, et al. Impact of tissue macrophage proliferation on peripheral and systemic insulin resistance in obese mice with diabetes. BMJ Open Diab Res Care 2020;8:e001578. doi:10.1136/bmjdrc-2020-001578
► Supplemental material is published online only. To view, please visit the journal online (http:// dx. doi. org/ 10. 1136/ bmjdrc- 2020- 001578).
Received 16 May 2020Revised 6 August 2020Accepted 17 September 2020
Original research
Metabolism
© Author(s) (or their employer(s)) 2020. Re- use permitted under CC BY- NC. No commercial re- use. See rights and permissions. Published by BMJ.
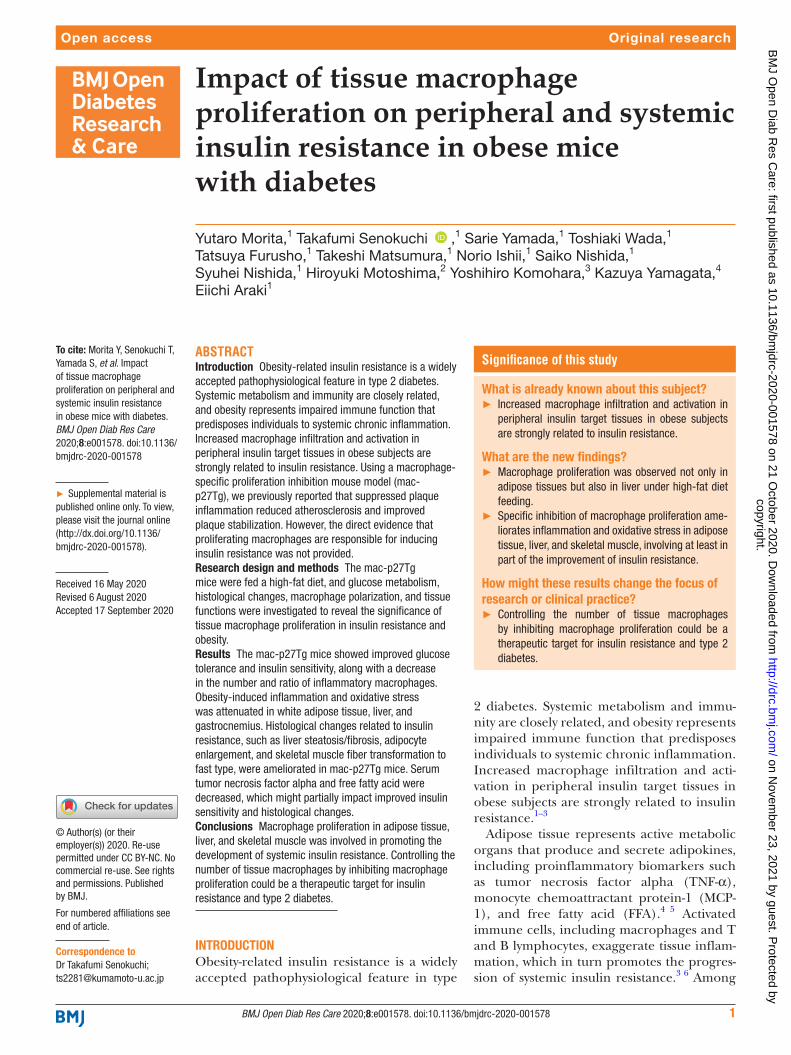
ABSTRACTIntroduction Obesity- related insulin resistance is a widely accepted pathophysiological feature in type 2 diabetes. Systemic metabolism and immunity are closely related, and obesity represents impaired immune function that predisposes individuals to systemic chronic inflammation. Increased macrophage infiltration and activation in peripheral insulin target tissues in obese subjects are strongly related to insulin resistance. Using a macrophage- specific proliferation inhibition mouse model (mac- p27Tg), we previously reported that suppressed plaque inflammation reduced atherosclerosis and improved plaque stabilization. However, the direct evidence that proliferating macrophages are responsible for inducing insulin resistance was not provided.Research design and methods The mac- p27Tg mice were fed a high- fat diet, and glucose metabolism, histological changes, macrophage polarization, and tissue functions were investigated to reveal the significance of tissue macrophage proliferation in insulin resistance and obesity.Results The mac- p27Tg mice showed improved glucose tolerance and insulin sensitivity, along with a decrease in the number and ratio of inflammatory macrophages. Obesity- induced inflammation and oxidative stress was attenuated in white adipose tissue, liver, and gastrocnemius. Histological changes related to insulin resistance, such as liver steatosis/fibrosis, adipocyte enlargement, and skeletal muscle fiber transformation to fast type, were ameliorated in mac- p27Tg mice. Serum tumor necrosis factor alpha and free fatty acid were decreased, which might partially impact improved insulin sensitivity and histological changes.Conclusions Macrophage proliferation in adipose tissue, liver, and skeletal muscle was involved in promoting the development of systemic insulin resistance. Controlling the number of tissue macrophages by inhibiting macrophage proliferation could be a therapeutic target for insulin resistance and type 2 diabetes.
INTRODUCTIONObesity- related insulin resistance is a widely accepted pathophysiological feature in type
2 diabetes. Systemic metabolism and immu-nity are closely related, and obesity represents impaired immune function that predisposes individuals to systemic chronic inflammation. Increased macrophage infiltration and acti-vation in peripheral insulin target tissues in obese subjects are strongly related to insulin resistance.1–3
Adipose tissue represents active metabolic organs that produce and secrete adipokines, including proinflammatory biomarkers such as tumor necrosis factor alpha (TNF-α), monocyte chemoattractant protein-1 (MCP-1), and free fatty acid (FFA).4 5 Activated immune cells, including macrophages and T and B lymphocytes, exaggerate tissue inflam-mation, which in turn promotes the progres-sion of systemic insulin resistance.3 6 Among
Significance of this study
What is already known about this subject? ► Increased macrophage infiltration and activation in peripheral insulin target tissues in obese subjects are strongly related to insulin resistance.
What are the new findings? ► Macrophage proliferation was observed not only in adipose tissues but also in liver under high- fat diet feeding.
► Specific inhibition of macrophage proliferation ame-liorates inflammation and oxidative stress in adipose tissue, liver, and skeletal muscle, involving at least in part of the improvement of insulin resistance.
How might these results change the focus of research or clinical practice?
► Controlling the number of tissue macrophages by inhibiting macrophage proliferation could be a therapeutic target for insulin resistance and type 2 diabetes.
copyright. on N
ovember 23, 2021 by guest. P
rotected byhttp://drc.bm
j.com/
BM
J Open D
iab Res C
are: first published as 10.1136/bmjdrc-2020-001578 on 21 O
ctober 2020. Dow
nloaded from
2 BMJ Open Diab Res Care 2020;8:e001578. doi:10.1136/bmjdrc-2020-001578
Metabolism
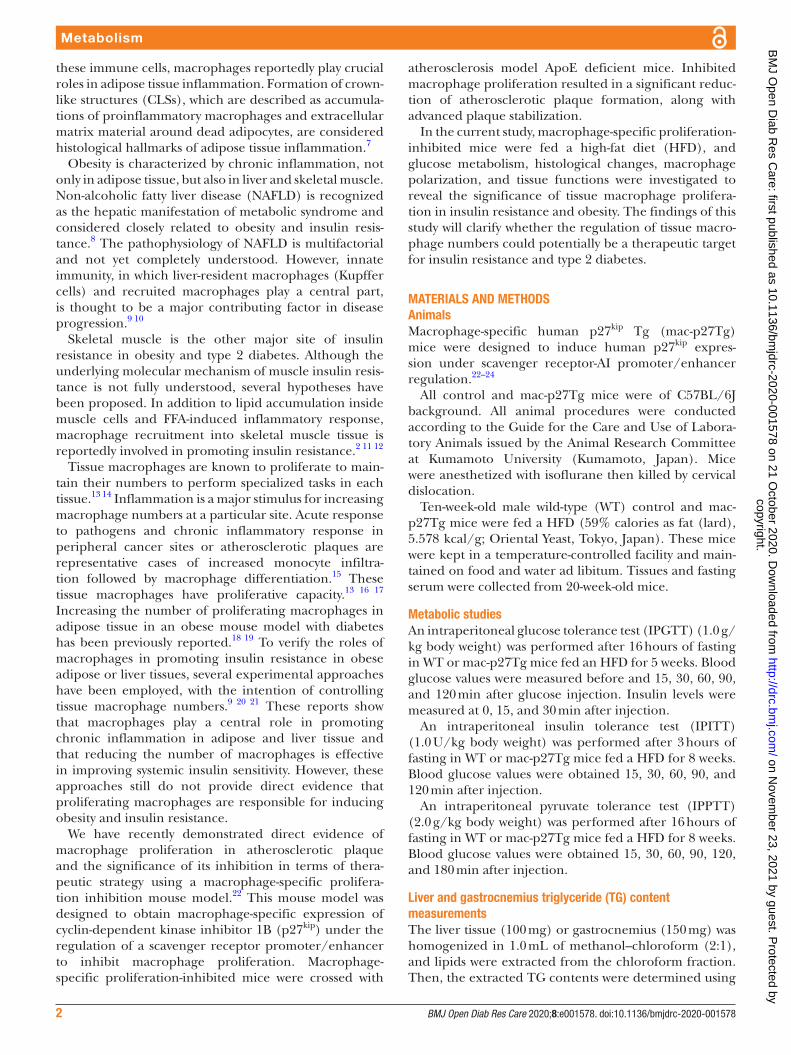
these immune cells, macrophages reportedly play crucial roles in adipose tissue inflammation. Formation of crown- like structures (CLSs), which are described as accumula-tions of proinflammatory macrophages and extracellular matrix material around dead adipocytes, are considered histological hallmarks of adipose tissue inflammation.7
Obesity is characterized by chronic inflammation, not only in adipose tissue, but also in liver and skeletal muscle. Non- alcoholic fatty liver disease (NAFLD) is recognized as the hepatic manifestation of metabolic syndrome and considered closely related to obesity and insulin resis-tance.8 The pathophysiology of NAFLD is multifactorial and not yet completely understood. However, innate immunity, in which liver- resident macrophages (Kupffer cells) and recruited macrophages play a central part, is thought to be a major contributing factor in disease progression.9 10
Skeletal muscle is the other major site of insulin resistance in obesity and type 2 diabetes. Although the underlying molecular mechanism of muscle insulin resis-tance is not fully understood, several hypotheses have been proposed. In addition to lipid accumulation inside muscle cells and FFA- induced inflammatory response, macrophage recruitment into skeletal muscle tissue is reportedly involved in promoting insulin resistance.2 11 12
Tissue macrophages are known to proliferate to main-tain their numbers to perform specialized tasks in each tissue.13 14 Inflammation is a major stimulus for increasing macrophage numbers at a particular site. Acute response to pathogens and chronic inflammatory response in peripheral cancer sites or atherosclerotic plaques are representative cases of increased monocyte infiltra-tion followed by macrophage differentiation.15 These tissue macrophages have proliferative capacity.13 16 17 Increasing the number of proliferating macrophages in adipose tissue in an obese mouse model with diabetes has been previously reported.18 19 To verify the roles of macrophages in promoting insulin resistance in obese adipose or liver tissues, several experimental approaches have been employed, with the intention of controlling tissue macrophage numbers.9 20 21 These reports show that macrophages play a central role in promoting chronic inflammation in adipose and liver tissue and that reducing the number of macrophages is effective in improving systemic insulin sensitivity. However, these approaches still do not provide direct evidence that proliferating macrophages are responsible for inducing obesity and insulin resistance.
We have recently demonstrated direct evidence of macrophage proliferation in atherosclerotic plaque and the significance of its inhibition in terms of thera-peutic strategy using a macrophage- specific prolifera-tion inhibition mouse model.22 This mouse model was designed to obtain macrophage- specific expression of cyclin- dependent kinase inhibitor 1B (p27kip) under the regulation of a scavenger receptor promoter/enhancer to inhibit macrophage proliferation. Macrophage- specific proliferation- inhibited mice were crossed with
atherosclerosis model ApoE deficient mice. Inhibited macrophage proliferation resulted in a significant reduc-tion of atherosclerotic plaque formation, along with advanced plaque stabilization.
In the current study, macrophage- specific proliferation- inhibited mice were fed a high- fat diet (HFD), and glucose metabolism, histological changes, macrophage polarization, and tissue functions were investigated to reveal the significance of tissue macrophage prolifera-tion in insulin resistance and obesity. The findings of this study will clarify whether the regulation of tissue macro-phage numbers could potentially be a therapeutic target for insulin resistance and type 2 diabetes.
MATERIALS AND METHODSAnimalsMacrophage- specific human p27kip Tg (mac- p27Tg) mice were designed to induce human p27kip expres-sion under scavenger receptor- AI promoter/enhancer regulation.22–24
All control and mac- p27Tg mice were of C57BL/6J background. All animal procedures were conducted according to the Guide for the Care and Use of Labora-tory Animals issued by the Animal Research Committee at Kumamoto University (Kumamoto, Japan). Mice were anesthetized with isoflurane then killed by cervical dislocation.
Ten- week- old male wild- type (WT) control and mac- p27Tg mice were fed a HFD (59% calories as fat (lard), 5.578 kcal/g; Oriental Yeast, Tokyo, Japan). These mice were kept in a temperature- controlled facility and main-tained on food and water ad libitum. Tissues and fasting serum were collected from 20- week- old mice.
Metabolic studiesAn intraperitoneal glucose tolerance test (IPGTT) (1.0 g/kg body weight) was performed after 16 hours of fasting in WT or mac- p27Tg mice fed an HFD for 5 weeks. Blood glucose values were measured before and 15, 30, 60, 90, and 120 min after glucose injection. Insulin levels were measured at 0, 15, and 30 min after injection.
An intraperitoneal insulin tolerance test (IPITT) (1.0 U/kg body weight) was performed after 3 hours of fasting in WT or mac- p27Tg mice fed a HFD for 8 weeks. Blood glucose values were obtained 15, 30, 60, 90, and 120 min after injection.
An intraperitoneal pyruvate tolerance test (IPPTT) (2.0 g/kg body weight) was performed after 16 hours of fasting in WT or mac- p27Tg mice fed a HFD for 8 weeks. Blood glucose values were obtained 15, 30, 60, 90, 120, and 180 min after injection.
Liver and gastrocnemius triglyceride (TG) content measurementsThe liver tissue (100 mg) or gastrocnemius (150 mg) was homogenized in 1.0 mL of methanol–chloroform (2:1), and lipids were extracted from the chloroform fraction. Then, the extracted TG contents were determined using
copyright. on N
ovember 23, 2021 by guest. P
rotected byhttp://drc.bm
j.com/
BM
J Open D
iab Res C
are: first published as 10.1136/bmjdrc-2020-001578 on 21 O
ctober 2020. Dow
nloaded from
3BMJ Open Diab Res Care 2020;8:e001578. doi:10.1136/bmjdrc-2020-001578
Metabolism
a LabAssay Triglyceride kit (Wako, Osaka, Japan). TG concentration was evaluated as mg/g wet tissue.
ELISASerum insulin, TNF-α, adiponectin, and FFA levels were determined using an insulin ELISA kit (Shibayagi, Shibu-kawa, Japan), a TNF-α Mouse ELISA Kit (Invitrogen, California, USA), a Mouse Adiponectin ELISA Kit (Ray Biotech, Georgia, USA), and a free fatty acid assay kit (Cosmobio, Tokyo, Japan), respectively, following the manufacturers’ instructions.
Histological examination of liver and adipose tissue sectionsLiver and epididymal white adipose tissue (epi- WAT) were fixed with neutral- buffered 10% formalin and embedded in paraffin. The sections were stained with anti- Iba-1 monoclonal antibody (Wako). The tissues were incubated for 1.5 hours at room temperature with secondary antibodies and visualized with DAB (Nichirei Bioscience, Tokyo, Japan). To estimate adipocyte size, epi- WAT sections were stained with H&E, and 400 adipocytes per mouse were quantitatively evaluated. Liver sections were stained with azan to identify fibrosis.
Immunostained samples were histologically analyzed under a BZ- X700 microscope (Keyence, Osaka, Japan).
Nicotinamide adenine dinucleotide–tetrazolium reductase (NADH-TR) stainingFrozen gastrocnemius sections were incubated for 15 min at room temperature in a solution of 0.2 mol/L Trizma base, 1.5 mmol/L nicotinamide adenine dinucleotide, and 1.5 mmol/L nitro tetrazolium blue. Sections were then serially incubated with acetone solutions (60, 80, 100, 80, and 60% for 2 min each). Staining intensity on each section was assessed using ImageJ software.
Immunostaining of gastrocnemius sectionsFrozen gastrocnemius sections were incubated for 30 min at room temperature and fixed with acetone. Sections were blocked in 3.0% goat serum and washed with phosphate- buffered saline (PBS) for 2 hours at room temperature. Sections were incubated overnight at 4℃ with monoclonal antiskeletal myosin (Slow, Clone NOQ7.5.4D) and antilaminin (Sigma- Aldrich, Missouri, USA). The tissues were incubated for 1 hour at room temperature with secondary antibody, then visualized with Alexa Fluor 488 or Alexa Fluor 350. Immunostained samples were histologically analyzed using a BZ- X700 microscope (Keyence).
Quantitative reverse-transcription PCR analysisTotal RNA from liver was isolated using an RNeasy Mini Kit (Qiagen, California, USA). Total RNAs of the epi- WAT and gastrocnemius were respectively extracted with an RNeasy Lipid Tissue Kit and an RNeasy Fibrous Tissue Mini Kit (Qiagen). First- strand cDNA was synthe-sized using ReverTra Ace (Toyobo, Osaka, Japan). Quan-titative PCR was performed using GoTaq qPCR Master Mix (Promega, Mannheim, Germany) in an ABI 7300
real- time PCR system (Applied Biosystems, CA, USA). Quantitative mRNA results were normalized to 18S mRNA. A dissociation curve analysis was performed after the last amplification cycle to assess amplified PCR product specificity. The primers used in this study are listed in online supplemental table 1.
Tissue insulin signaling by western blot analysisLiver, epi- WAT, and gastrocnemius were dissected 1 min (liver), 3 min (epi- WAT), and 5 min (gastrocnemius) after 0.5 U/kg body weight of insulin were injected into the inferior vena cava of anesthetized 20- week- old mice after 16 hours of fasting.
Tissues were lysed in 0.5% CHAPS (3-[(3- Cholamidopropyl)dimethylammonio]-1 - propanesulfonate) lysis buffer. Equal amounts of protein were separated by sodium dodecyl sulfate–polyacryl-amide gel electrophoresis and transferred onto polyvi-nylidene fluoride membranes. Membranes were probed with purified mouse anti- Akt (1:1000) (Cell Signaling Technology, USA) and anti- pAkt (1:1000) (Ser473, Cell Signaling Technology). Following incubation with horse-radish peroxidase (HRP)- conjugated secondary anti-bodies, proteins were visualized with Immobilon Western Chemiluminescent HRP Substrate (Millipore, Massachu-setts, USA) according to the manufacturer’s instructions. Immunoblotting signals were quantified with a Light Capture II (ATTO, Tokyo, Japan).
Hyperinsulinemic–euglycemic clamp studyMice were implanted with jugular venous catheters 3 days before hyperinsulinemic–euglycemic clamp testing. Basal whole- body glucose turnover was measured by infusing [3H] glucose (high- performance liquid chromatography purified; PerkinElmer Life Sciences, Massachusetts, USA) at 0.05 µCi/min for 120 min into the jugular cath-eter after 3 hour of fasting. Following this basal period, hyperinsulinemic- euglycemic clamping was conducted in conscious mice for 120 min with a primed infusion of insulin (10.0 mU/kg/min) and [3H] glucose (0.1 µCi/min), followed by a continuous infusion of insulin (3.0 mU/kg/min) and [3H] glucose (0.1 µCi/min), and a variable infusion of 40% glucose to maintain euglycemia (<120 mg/dL). Plasma samples were collected from the tail at 0, 90, 100, 110, and 120 min.
Flow cytometryLiver and adipose tissue samples for flow cytometry anal-ysis were collected from 20- week- old mice. The mice were perfused with PBS from the inferior vena cava to remove blood from the liver. Macrophage isolation was performed by cutting organs into small pieces, then digesting them in PBS containing 2% FBS, 100 U/mL collagenase Ⅳ (liver) or 1 mg/mL collagenase Ⅱ (adipose tissue), and DNase (Sigma- Aldrich) for 20 min at 37 ℃ with shaking at 200 rpm. The digested cell suspension was then washed with PBS and passed sequentially through 100 µm cell strainers. The following antibodies were
copyright. on N
ovember 23, 2021 by guest. P
rotected byhttp://drc.bm
j.com/
BM
J Open D
iab Res C
are: first published as 10.1136/bmjdrc-2020-001578 on 21 O
ctober 2020. Dow
nloaded from
4 BMJ Open Diab Res Care 2020;8:e001578. doi:10.1136/bmjdrc-2020-001578
Metabolism
used for flow cytometric analyses: CD11b- PerCP- Cy5.5 (BD Biosciences, Franklin Lakes, New Jersey, USA), CD11c- allophycocyanin (BD Biosciences), CD206- PE (BioLegend, San Diego, California, USA), and F4/80- PE- Cy7 (BioLegend). Antibody dilutions were in the range of 1:200. Liver macrophages were identified as CD11bhigh/lowF4/80+. Adipose tissue macrophages were identified as CD11b+F4/80+. The M1:M2 ratio was calcu-lated from the number of CD11c positive (M1) or CD206 positive (M2) cells, counting 5000 tissue macrophages for each mouse. Oxidative stress in tissue macrophages was detected using CellRox Green Reagent (Invitrogen) according to manufacturer recommendations. Macro-phage proliferation was assessed by cellular DNA content using DAPI (4,6- diamidino-2- phenylindole) staining. DAPI staining was performed by the same method as that of the previous report25; 5000 tissue macrophages were counted; and the ratio of S/G2/M phase macrophages was calculated.
All gating strategies are shown in online supplemental figure 1. Data were acquired on a SH800S cell sorter (Sony, Tokyo, Japan) and analyzed with FlowJo V.10.
Measurement of thiobarbituric acid-reactive substances (TBARS)TBARS measurement was based on malondialdehyde formation using a commercially available TBARS Assay kit (Cayman Chemical, Michigan, USA) following the manufacturer’s instructions.
Statistical analysisResults were expressed as mean±SEM. Statistical tests used included an unpaired Student’s t- test with Welch’s correction for unequal variances and one- way analysis of variance followed by Tukey’s multiple comparison test. A p value of <0.05 denoted statistical significance.
RESULTSImpact of macrophage proliferation on insulin sensitivityTo investigate the effect of macrophage proliferation inhibi-tion on glucose tolerance and insulin sensitivity, 10- week- old WT and mac- p27Tg mice were fed a HFD for 10 weeks.
There was no significant difference in basal metabolic parameters between WT controls and mac- p27Tg mice (online supplemental figure 2).
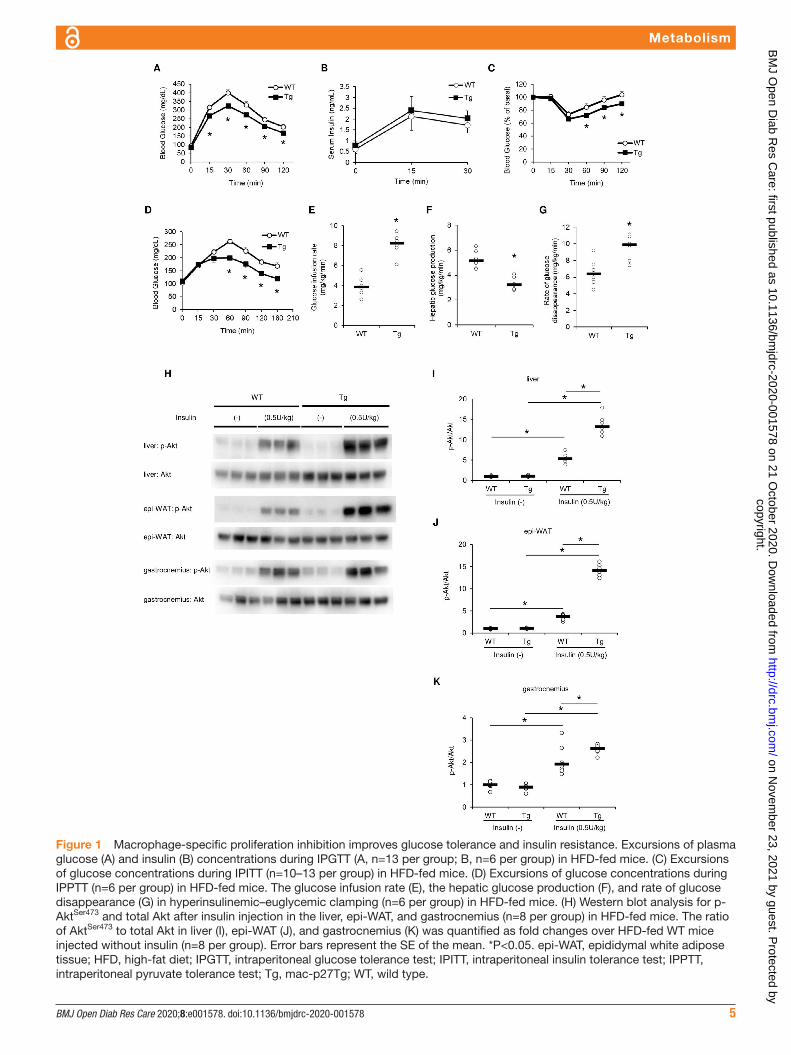
IPGTT, IPITT, and IPPTT results showed that on IPGTT, plasma glucose levels were significantly lower in mac- p27Tg mice than in WT controls (figure 1A). After glucose injec-tion, no significant difference in plasma insulin levels was observed between the two groups (figure 1B). On IPITT, plasma glucose levels were significantly lower in mac- p27Tg mice at 60, 90, and 120 min (figure 1C). In IPPTT, plasma glucose levels were significantly lower in mac- p27Tg mice at 60, 90, 120, and 180 min (figure 1D).
Hyperinsulinemic- euglycemic clamp showed that the glucose infusion rate and rate of glucose disappearance were significantly higher in mac- p27Tg mice (figure 1E,G), and hepatic glucose production was significantly lower in
mac- p27Tg mice (figure 1F). These findings suggested that macrophage- specific proliferation inhibition improved systemic glucose tolerance, ameliorated peripheral insulin sensitivity, and suppressed hepatic gluconeogenesis.
In addition to the systemic improvement in glucose metabolism on HFD feeding, we assessed insulin signaling in each insulin sensitive tissue after insulin injection. Insulin- stimulated Akt phosphorylation in the liver, epi- WAT, and gastrocnemius were all significantly increased in mac- p27Tg mice (figure 1H–K), suggesting that tissue macrophage proliferation inhibition resulted in significantly improved insulin sensitivity in major insulin target tissues.
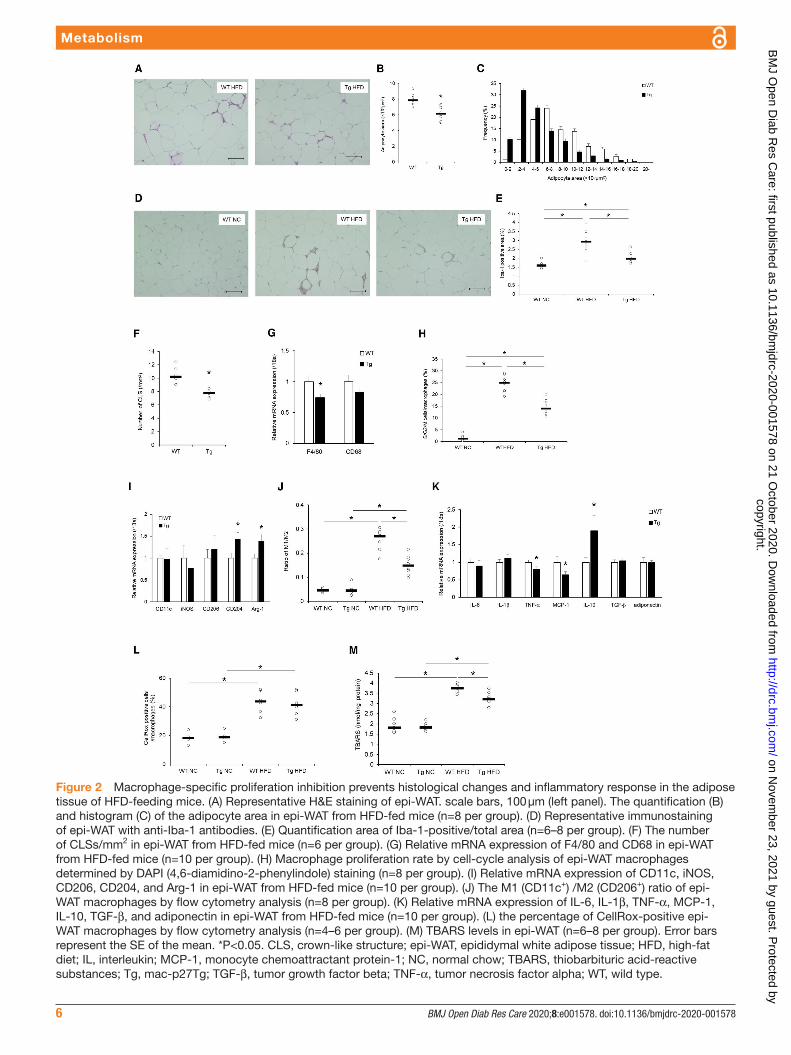
Impact of macrophage proliferation on histological changes in adipose tissueAssessment of the impact of macrophage proliferation on histological changes in adipose tissue caused by HFD feeding showed that the increase in adipocyte size induced by HFD feeding was less pronounced in mac- p27Tg mice than that in control mice (figure 2A–C). Immunohistochemical staining against Iba-1 showed that macrophage infiltration into adipose tissue induced by HFD feeding was extensively reduced in mac- p27Tg mice compared with WT controls (figure 2D,E). CLS formation was significantly inhibited in epi- WAT samples of mac- p27Tg mice compared with WT mice (figure 2F). The mRNA expression of macrophage- specific F4/80 was significantly lower in HFD- fed mac- p27Tg mice than those in WT controls (figure 2G). Proliferating epi- WAT macrophages in the S/G2/M cell cycle phases were significantly fewer in HFD- fed mac- p27Tg mice than those in WT controls (figure 2H). Therefore, macrophage prolifera-tion inhibition resulted in reduced macrophage accumula-tion, adipocyte enlargement, and CLS formation in adipose tissue.
Impact of macrophage proliferation on inflammatory response in adipose tissueIn epi- WAT, the mRNA expression of CD204 and Arg-1 (M2 macrophage markers) was significantly higher in mac- p27Tg mice than the WT controls, whereas there was no significant difference in the mRNA expression of CD11c and iNOS (M1 macrophage markers) between the two groups (figure 2I). Flow cytometry analysis revealed that the increase in the M1 (CD11c+)/M2 (CD206+) ratio of epi- WAT macrophages by HFD feeding was significantly decreased in mac- p27Tg mice (figure 2J).
The mRNA expression of TNF-α and MCP-1 was signifi-cantly lower in adipose tissue from mac- p27Tg mice than that of WT controls. In contrast, interleukin (IL)-10 mRNA expression was significantly increased in mac- p27Tg mice. The expression of adiponectin mRNA was comparable between mac- p27Tg mice and WT controls (figure 2K).
In addition, flow cytometry assessment of oxidative stress in epi- WAT macrophages using CellRox Green fluorescence showed that the percentage of CellRox positive epi- WAT macrophages was significantly increased by HFD feeding in WT and mac- p27Tg mice. However, HFD- induced oxidative stress was comparable between the two groups (figure 2L).
copyright. on N
ovember 23, 2021 by guest. P
rotected byhttp://drc.bm
j.com/
BM
J Open D
iab Res C
are: first published as 10.1136/bmjdrc-2020-001578 on 21 O
ctober 2020. Dow
nloaded from
5BMJ Open Diab Res Care 2020;8:e001578. doi:10.1136/bmjdrc-2020-001578
Metabolism
Figure 1 Macrophage- specific proliferation inhibition improves glucose tolerance and insulin resistance. Excursions of plasma glucose (A) and insulin (B) concentrations during IPGTT (A, n=13 per group; B, n=6 per group) in HFD- fed mice. (C) Excursions of glucose concentrations during IPITT (n=10–13 per group) in HFD- fed mice. (D) Excursions of glucose concentrations during IPPTT (n=6 per group) in HFD- fed mice. The glucose infusion rate (E), the hepatic glucose production (F), and rate of glucose disappearance (G) in hyperinsulinemic–euglycemic clamping (n=6 per group) in HFD- fed mice. (H) Western blot analysis for p- AktSer473 and total Akt after insulin injection in the liver, epi- WAT, and gastrocnemius (n=8 per group) in HFD- fed mice. The ratio of AktSer473 to total Akt in liver (I), epi- WAT (J), and gastrocnemius (K) was quantified as fold changes over HFD- fed WT mice injected without insulin (n=8 per group). Error bars represent the SE of the mean. *P<0.05. epi- WAT, epididymal white adipose tissue; HFD, high- fat diet; IPGTT, intraperitoneal glucose tolerance test; IPITT, intraperitoneal insulin tolerance test; IPPTT, intraperitoneal pyruvate tolerance test; Tg, mac- p27Tg; WT, wild type.
copyright. on N
ovember 23, 2021 by guest. P
rotected byhttp://drc.bm
j.com/
BM
J Open D
iab Res C
are: first published as 10.1136/bmjdrc-2020-001578 on 21 O
ctober 2020. Dow
nloaded from
6 BMJ Open Diab Res Care 2020;8:e001578. doi:10.1136/bmjdrc-2020-001578
Metabolism
Figure 2 Macrophage- specific proliferation inhibition prevents histological changes and inflammatory response in the adipose tissue of HFD- feeding mice. (A) Representative H&E staining of epi- WAT. scale bars, 100 µm (left panel). The quantification (B) and histogram (C) of the adipocyte area in epi- WAT from HFD- fed mice (n=8 per group). (D) Representative immunostaining of epi- WAT with anti- Iba-1 antibodies. (E) Quantification area of Iba-1- positive/total area (n=6–8 per group). (F) The number of CLSs/mm2 in epi- WAT from HFD- fed mice (n=6 per group). (G) Relative mRNA expression of F4/80 and CD68 in epi- WAT from HFD- fed mice (n=10 per group). (H) Macrophage proliferation rate by cell- cycle analysis of epi- WAT macrophages determined by DAPI (4,6- diamidino-2- phenylindole) staining (n=8 per group). (I) Relative mRNA expression of CD11c, iNOS, CD206, CD204, and Arg-1 in epi- WAT from HFD- fed mice (n=10 per group). (J) The M1 (CD11c+) /M2 (CD206+) ratio of epi- WAT macrophages by flow cytometry analysis (n=8 per group). (K) Relative mRNA expression of IL-6, IL-1β, TNF-α, MCP-1, IL-10, TGF-β, and adiponectin in epi- WAT from HFD- fed mice (n=10 per group). (L) the percentage of CellRox- positive epi- WAT macrophages by flow cytometry analysis (n=4–6 per group). (M) TBARS levels in epi- WAT (n=6–8 per group). Error bars represent the SE of the mean. *P<0.05. CLS, crown- like structure; epi- WAT, epididymal white adipose tissue; HFD, high- fat diet; IL, interleukin; MCP-1, monocyte chemoattractant protein-1; NC, normal chow; TBARS, thiobarbituric acid- reactive substances; Tg, mac- p27Tg; TGF-β, tumor growth factor beta; TNF-α, tumor necrosis factor alpha; WT, wild type.
copyright. on N
ovember 23, 2021 by guest. P
rotected byhttp://drc.bm
j.com/
BM
J Open D
iab Res C
are: first published as 10.1136/bmjdrc-2020-001578 on 21 O
ctober 2020. Dow
nloaded from
7BMJ Open Diab Res Care 2020;8:e001578. doi:10.1136/bmjdrc-2020-001578
Metabolism
TBARS elevation in epi- WAT caused by HFD feeding was significantly suppressed in mac- p27Tg mice (figure 2M). Therefore, inhibition of macrophage proliferation did not affect reactive oxygen species (ROS) production in each macrophage but ameliorated whole tissue oxidative stress by reducing the number of macrophages in adipose tissue.
In adipose tissue, the increased number of macrophages via proliferation was strongly related to tissue inflamma-tion and oxidative stress caused by HFD feeding. Inhibition of macrophage proliferation may involve at least in part of ameliorating adipose tissue inflammation, oxidative stress, and insulin resistance.
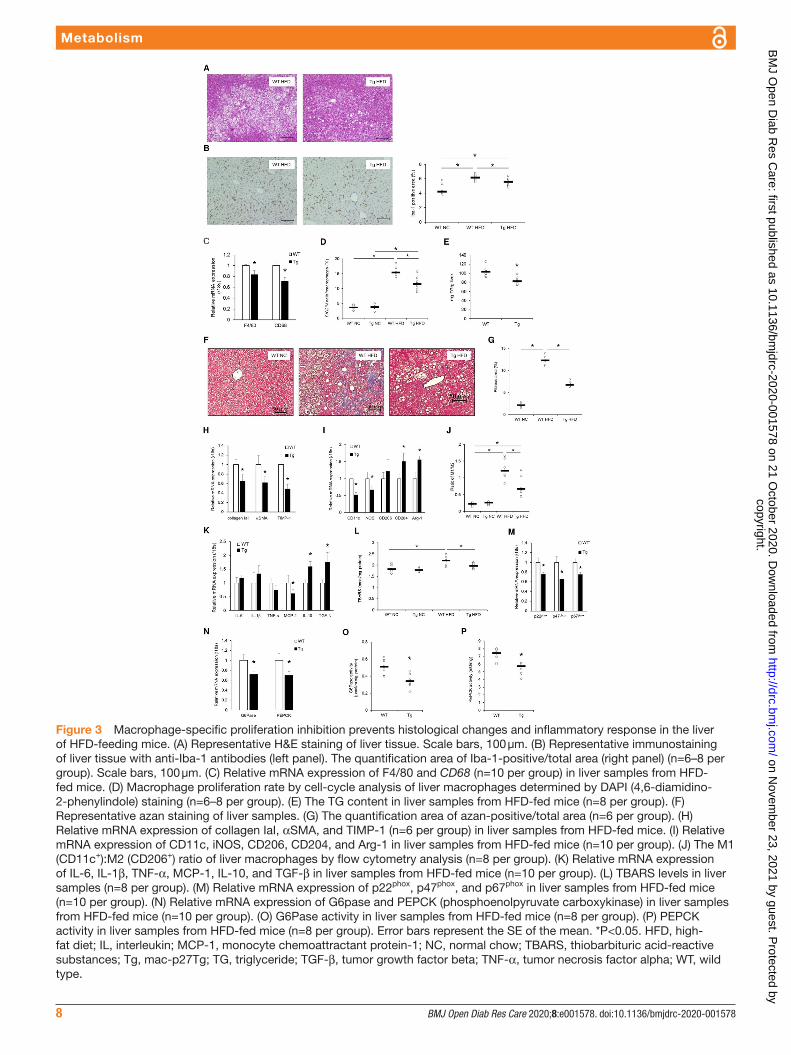
Impact of macrophage proliferation on hepatic steatosis and fibrosisAs shown in figure 1D,G, macrophage proliferation inhibition suppressed hepatic gluconeogenesis that was increased by HFD feeding. Investigation of the histo-logical changes and mRNA expression in the liver of WT controls and mac- p27Tg mice showed that typical histological features of hepatic steatosis, such as hepato-cyte ballooning, Mallory- Denk bodies, and increased macrophage- specific staining against Iba-1, appeared in liver sections from HFD- fed WT controls. In contrast, a marked improvement of steatosis and reduction of macrophage staining was observed in the liver of mac- p27Tg mice (figure 3A,B). In parallel to these histo-logical changes, macrophage- specific F4/80 and CD68 mRNA expression was significantly reduced (figure 3C), with a lower percentage of proliferating macrophages (figure 3D) in HFD- fed mac- p27Tg mice than in WT controls. Moreover, liver TG content was also significantly reduced in mac- p27Tg mice (figure 3E).
Azan staining showed that HFD- induced hepatic fibrosis was significantly reduced in mac- p27Tg mice (figure 3F,G). In accordance with the histological changes, the mRNA expression of collagen IaI, αSMA, and TIMP-1 was significantly lower in HFD- fed mac- p27Tg mice than the WT controls (figure 3H).
Impact of macrophage proliferation on liver inflammatory response and oxidative stressThe mRNA expression of CD11c and iNOS was signifi-cantly lower in mac- p27Tg mice than in WT controls. CD204 and Arg-1 mRNA expressions were significantly higher in mac- p27Tg mice than those in WT controls (figure 3I). Flow cytometric analysis of liver macrophages revealed that the M1 (CD11c+)/M2 (CD206+) ratio increased by HFD feeding was significantly decreased in mac- p27Tg mice (figure 3J). The mRNA expression of anti- inflammatory cytokines such as IL-10 and TGF-β was markedly increased in liver tissues of mac- p27Tg mice (figure 3K). Macrophage number reduction by prolifera-tion inhibition resulted in reduced tissue inflammation.
Oxidative stress in the liver assessed by TBARS was significantly decreased with the reduction of nicotin-amide adenine dinucleotide phosphate (NADPH) oxidase component mRNA expression (figure 3L,M).
The mRNA expressions of G6Pase and PEPCK, which are related to hepatic gluconeogenesis, were signifi-cantly decreased in mac- p27Tg mice (figure 3N). G6Pase (figure 3O) and PEPCK (figure 3P) activities were also significantly decreased in mac- p27Tg mice.
These findings suggested that the increased number of macrophages resulting from proliferation promoted HFD feeding- induced hepatic steatosis, fibrosis, and hepatic insulin resistance. Proliferation inhibition reversed all three liver phenotypes by ameliorating local inflammation and oxidative stress.
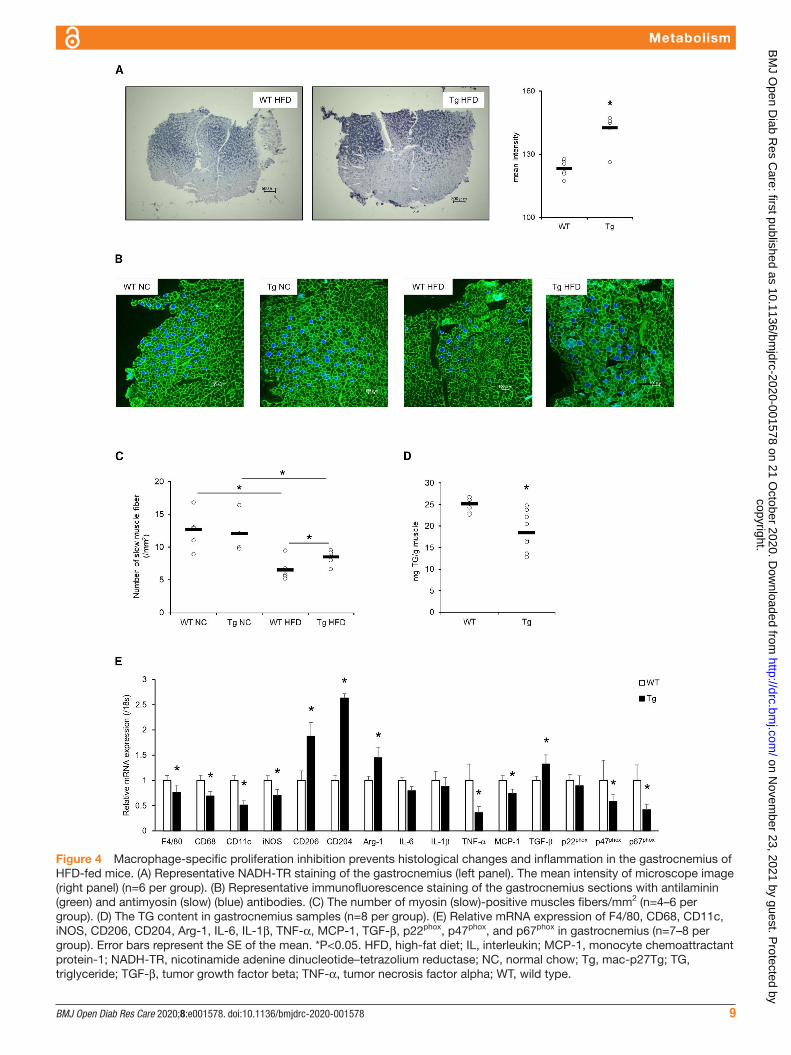
Impact of macrophage proliferation on the skeletal muscle fiber type of HFD-fed miceIt has been reported that diet- induced obesity causes the decrease in muscle oxidative capacity and the slow- to- fast shift of rodent skeletal muscle fiber that is thought to be related to muscle insulin resistance.26 27
Mean intensity of microscopic NADH- TR staining images in the gastrocnemius was significantly lower in mac- p27Tg mice than in WT controls, indicating that the oxidative capacity of skeletal muscle, which was decreased by HFD feeding, remained higher through macrophage proliferation inhibition (figure 4A). Immu-nofluorescence staining revealed that the slow muscle fiber reduction caused by HFD feeding was significantly prevented in mac- p27Tg mice (figure 4B,C). These find-ings suggested that macrophage- specific proliferation inhibition prevented the slow- to- fast shift in muscle fiber caused by HFD feeding. The gastrocnemius TG content was significantly lower in HFD- fed mac- p27Tg mice than in HFD- fed WT controls (figure 4D). The mRNA expres-sions of macrophage markers, inflammatory cytokine/chemokines, and NADPH oxidase components were significantly lower in gastrocnemius from HFD- fed mac- p27Tg mice than in the HFD- fed WT controls. In contrast, M2 macrophage markers and anti- inflammatory cytokine expression were significantly higher in mac- p27Tg mice (figure 4E).
These findings suggested that macrophage prolifera-tion inhibition resulted in improved insulin sensitivity in skeletal muscle through the prevention of the slow- to- fast muscle fiber shift, reduced fat contents, and the amelio-ration of inflammation and oxidative stress.
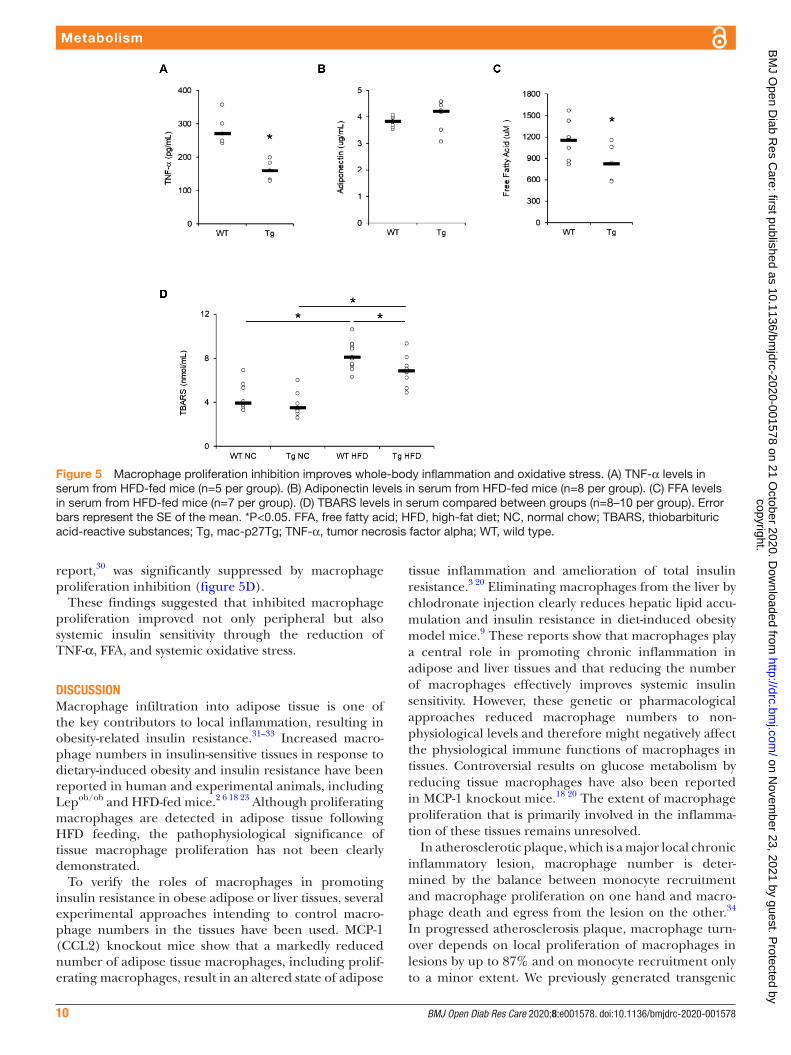
Impact of macrophage proliferation on systemic inflammation and oxidative stressIt is well accepted that TNF-α and FFA, which are secreted from inflamed adipose tissue, play crucial roles in promoting systemic insulin resistance.5 28 29
Serum TNF-α and FFA levels were significantly lower in HFD- fed mac- p27Tg mice than WT controls, whereas there was no difference in serum adiponectin level between the two groups (figure 5A–C). In addition to adipokines, we also assessed TBARS serum levels, which reflect systemic oxidative stress. The elevation of serum TBARS level by HFD feeding, consistent with a previous
copyright. on N
ovember 23, 2021 by guest. P
rotected byhttp://drc.bm
j.com/
BM
J Open D
iab Res C
are: first published as 10.1136/bmjdrc-2020-001578 on 21 O
ctober 2020. Dow
nloaded from
8 BMJ Open Diab Res Care 2020;8:e001578. doi:10.1136/bmjdrc-2020-001578
Metabolism
Figure 3 Macrophage- specific proliferation inhibition prevents histological changes and inflammatory response in the liver of HFD- feeding mice. (A) Representative H&E staining of liver tissue. Scale bars, 100 µm. (B) Representative immunostaining of liver tissue with anti- Iba-1 antibodies (left panel). The quantification area of Iba-1- positive/total area (right panel) (n=6–8 per group). Scale bars, 100 µm. (C) Relative mRNA expression of F4/80 and CD68 (n=10 per group) in liver samples from HFD- fed mice. (D) Macrophage proliferation rate by cell- cycle analysis of liver macrophages determined by DAPI (4,6- diamidino-2- phenylindole) staining (n=6–8 per group). (E) The TG content in liver samples from HFD- fed mice (n=8 per group). (F) Representative azan staining of liver samples. (G) The quantification area of azan- positive/total area (n=6 per group). (H) Relative mRNA expression of collagen IaI, αSMA, and TIMP-1 (n=6 per group) in liver samples from HFD- fed mice. (I) Relative mRNA expression of CD11c, iNOS, CD206, CD204, and Arg-1 in liver samples from HFD- fed mice (n=10 per group). (J) The M1 (CD11c+):M2 (CD206+) ratio of liver macrophages by flow cytometry analysis (n=8 per group). (K) Relative mRNA expression of IL-6, IL-1β, TNF-α, MCP-1, IL-10, and TGF-β in liver samples from HFD- fed mice (n=10 per group). (L) TBARS levels in liver samples (n=8 per group). (M) Relative mRNA expression of p22phox, p47phox, and p67phox in liver samples from HFD- fed mice (n=10 per group). (N) Relative mRNA expression of G6pase and PEPCK (phosphoenolpyruvate carboxykinase) in liver samples from HFD- fed mice (n=10 per group). (O) G6Pase activity in liver samples from HFD- fed mice (n=8 per group). (P) PEPCK activity in liver samples from HFD- fed mice (n=8 per group). Error bars represent the SE of the mean. *P<0.05. HFD, high- fat diet; IL, interleukin; MCP-1, monocyte chemoattractant protein-1; NC, normal chow; TBARS, thiobarbituric acid- reactive substances; Tg, mac- p27Tg; TG, triglyceride; TGF-β, tumor growth factor beta; TNF-α, tumor necrosis factor alpha; WT, wild type.
copyright. on N
ovember 23, 2021 by guest. P
rotected byhttp://drc.bm
j.com/
BM
J Open D
iab Res C
are: first published as 10.1136/bmjdrc-2020-001578 on 21 O
ctober 2020. Dow
nloaded from
9BMJ Open Diab Res Care 2020;8:e001578. doi:10.1136/bmjdrc-2020-001578
Metabolism
Figure 4 Macrophage- specific proliferation inhibition prevents histological changes and inflammation in the gastrocnemius of HFD- fed mice. (A) Representative NADH- TR staining of the gastrocnemius (left panel). The mean intensity of microscope image (right panel) (n=6 per group). (B) Representative immunofluorescence staining of the gastrocnemius sections with antilaminin (green) and antimyosin (slow) (blue) antibodies. (C) The number of myosin (slow)- positive muscles fibers/mm2 (n=4–6 per group). (D) The TG content in gastrocnemius samples (n=8 per group). (E) Relative mRNA expression of F4/80, CD68, CD11c, iNOS, CD206, CD204, Arg-1, IL-6, IL-1β, TNF-α, MCP-1, TGF-β, p22phox, p47phox, and p67phox in gastrocnemius (n=7–8 per group). Error bars represent the SE of the mean. *P<0.05. HFD, high- fat diet; IL, interleukin; MCP-1, monocyte chemoattractant protein-1; NADH- TR, nicotinamide adenine dinucleotide–tetrazolium reductase; NC, normal chow; Tg, mac- p27Tg; TG, triglyceride; TGF-β, tumor growth factor beta; TNF-α, tumor necrosis factor alpha; WT, wild type.
copyright. on N
ovember 23, 2021 by guest. P
rotected byhttp://drc.bm
j.com/
BM
J Open D
iab Res C
are: first published as 10.1136/bmjdrc-2020-001578 on 21 O
ctober 2020. Dow
nloaded from
10 BMJ Open Diab Res Care 2020;8:e001578. doi:10.1136/bmjdrc-2020-001578
Metabolism
report,30 was significantly suppressed by macrophage proliferation inhibition (figure 5D).
These findings suggested that inhibited macrophage proliferation improved not only peripheral but also systemic insulin sensitivity through the reduction of TNF-α, FFA, and systemic oxidative stress.
DISCUSSIONMacrophage infiltration into adipose tissue is one of the key contributors to local inflammation, resulting in obesity- related insulin resistance.31–33 Increased macro-phage numbers in insulin- sensitive tissues in response to dietary- induced obesity and insulin resistance have been reported in human and experimental animals, including Lepob/ob and HFD- fed mice.2 6 18 23 Although proliferating macrophages are detected in adipose tissue following HFD feeding, the pathophysiological significance of tissue macrophage proliferation has not been clearly demonstrated.
To verify the roles of macrophages in promoting insulin resistance in obese adipose or liver tissues, several experimental approaches intending to control macro-phage numbers in the tissues have been used. MCP-1 (CCL2) knockout mice show that a markedly reduced number of adipose tissue macrophages, including prolif-erating macrophages, result in an altered state of adipose
tissue inflammation and amelioration of total insulin resistance.3 20 Eliminating macrophages from the liver by chlodronate injection clearly reduces hepatic lipid accu-mulation and insulin resistance in diet- induced obesity model mice.9 These reports show that macrophages play a central role in promoting chronic inflammation in adipose and liver tissues and that reducing the number of macrophages effectively improves systemic insulin sensitivity. However, these genetic or pharmacological approaches reduced macrophage numbers to non- physiological levels and therefore might negatively affect the physiological immune functions of macrophages in tissues. Controversial results on glucose metabolism by reducing tissue macrophages have also been reported in MCP-1 knockout mice.18 20 The extent of macrophage proliferation that is primarily involved in the inflamma-tion of these tissues remains unresolved.
In atherosclerotic plaque, which is a major local chronic inflammatory lesion, macrophage number is deter-mined by the balance between monocyte recruitment and macrophage proliferation on one hand and macro-phage death and egress from the lesion on the other.34 In progressed atherosclerosis plaque, macrophage turn-over depends on local proliferation of macrophages in lesions by up to 87% and on monocyte recruitment only to a minor extent. We previously generated transgenic
Figure 5 Macrophage proliferation inhibition improves whole- body inflammation and oxidative stress. (A) TNF-α levels in serum from HFD- fed mice (n=5 per group). (B) Adiponectin levels in serum from HFD- fed mice (n=8 per group). (C) FFA levels in serum from HFD- fed mice (n=7 per group). (D) TBARS levels in serum compared between groups (n=8–10 per group). Error bars represent the SE of the mean. *P<0.05. FFA, free fatty acid; HFD, high- fat diet; NC, normal chow; TBARS, thiobarbituric acid- reactive substances; Tg, mac- p27Tg; TNF-α, tumor necrosis factor alpha; WT, wild type.
copyright. on N
ovember 23, 2021 by guest. P
rotected byhttp://drc.bm
j.com/
BM
J Open D
iab Res C
are: first published as 10.1136/bmjdrc-2020-001578 on 21 O
ctober 2020. Dow
nloaded from
11BMJ Open Diab Res Care 2020;8:e001578. doi:10.1136/bmjdrc-2020-001578
Metabolism
mice selectively expressing human p27kip in macro-phages and reported that macrophage proliferation suppression blocks atherosclerosis progression in ApoE knockout mice.22 These results provide direct evidence of the involvement of local macrophage proliferation in chronic tissue inflammation.
Macrophage proliferation inhibition in insulin resis-tance and obesity model mice induced by high fat loading resulted in a marked amelioration of histolog-ical changes, including adipocyte enlargement and CSL formation in the adipose tissue, steatosis and fibrosis in the liver, and a slow- to- fast shift in muscle fiber, all of which are also related to improved insulin sensitivity in these tissues. Inhibition of macrophage proliferation also showed improvement of the tissue functions impaired by HFD loading, such as increased FFA secretion from adipocytes, increased gluconeogenesis in hepatocytes, and impaired mitochondrial function in skeletal muscles. All of these results suggest that the reduction of macro-phage numbers in stroma improves insulin sensitivity not only by reducing tissue inflammation but also by amelio-rating functions in the parenchyma in insulin sensitive tissues. In addition to these changes in each tissue, the significant decrease in inflammatory molecules mainly secreted from adipose tissue, such as serum TNF-α and FFA, suggested that the reduction of macrophage number in the adipose tissue contributed to improved insulin sensitivity in liver and skeletal muscles. However, the serum adiponectin level unexpectedly did not increase as a result of inhibited macrophage proliferation, possibly because the HFD feeding period was not long enough to induce serum adiponectin reduction or the impact of macrophage proliferation inhibition was not enough to make a difference in epi- WAT weight and thereby failed to increase adiponectin secretion. Decreased TNF-α and FFA serum levels may also impact reduced lipid accumu-lation in liver and skeletal muscle and improved insulin sensitivity of these tissues. MCP-1 has been reported as one of the factors which promote macrophage prolif-eration in adipose tissue of obese mice. Many other factors, such as oxidized low- density lipoprotein,35 IL-4,14 GM- CSF, and M- CSF36 have been reported to promote macrophage proliferation in relating to atherosclerosis or different inflammatory conditions. However, other possible candidates that promote obesity- induced macro-phage proliferation have not been demonstrated.
Our results also demonstrated that the control of local macrophage numbers could be a novel therapeutic target for insulin resistance. However, in terms of the clinical utility of this concept, further research and tech-nical development in the selective delivery of agents to tissue macrophages and in selectively targeted inhibition of macrophage growth are required. The investigation of macrophage growth factor is another important aspect to establish the therapeutic strategy.
In conclusion, by using our previously created macrophage- specific human p27kip transgenic mice, we demonstrated that selective inhibition of macrophage
proliferation resulted in a systemic amelioration of insulin resistance, along with a reduction of local inflammation and oxidative stress in adipose tissue, liver, and skeletal muscles. Therefore, the inhibition of local macrophage proliferation could be a therapeutic target for type 2 diabetes based on insulin resistance.
Author affiliations1Department of Metabolic Medicine Faculty of Life Sciences, Kumamoto University Hospital, Chuo- ku, Kumamoto, Japan2Department of Metabolic Medicine and Endocrinology, Kikuchi Medical Association Hospital, Kikuchi, Kumamoto, Japan3Cell Pathology Faculty of Life Sciences, Kumamoto University Hospital, Chuo- ku, Kumamoto, Japan4Medical Biochemistry, Faculty of Life Sciences, Kumamoto University Hospital, Chuo- ku, Kumamoto, Japan
Acknowledgements We thank Dr Christopher K Glass (University of California, San Diego, California, USA) for kindly providing the plasmid vector containing the scavenger receptor- AI enhancer/promoter and Dr Kei- ichi Nakayama (Kyushu University, Fukuoka, Japan) for providing the plasmid vector containing human p27kip. We thank Satoshi Yamashita MD, PhD, and Ms. Mika Oka in the Department of Neurology, Kumamoto University, for providing technical assistance.
Contributors YM and TS designed the study. YM, TS, SY, TW, and TF performed the experiments. YM and TS analyzed the data. YM and TS wrote the paper. TM, NI, SaN, SyN, HM, YK, and KY helped with data interpretation and revisions of the manuscript. EA had primary responsibility for final content. All authors read and approved the final manuscript.
Funding Japan Society for the Promotion of Science KAKENHI Grant Numbers JP 25461361 and 16K09787 to TS. The funders had no role in the study design, data collection and interpretation or the decision to submit the work for publication.
Competing interests None declared.
Patient consent for publication Not required.
Ethics approval Experimental procedures were approved by the Ethics Committee on Animal Experiments, Faculty of Life Sciences, Kumamoto University (Permit Number: A2019-126).
Provenance and peer review Not commissioned; externally peer reviewed.
Data availability statement All data relevant to the study are included in the article or uploaded as supplemental information. There are no clinical patient data included.
Supplemental material This content has been supplied by the author(s). It has not been vetted by BMJ Publishing Group Limited (BMJ) and may not have been peer- reviewed. Any opinions or recommendations discussed are solely those of the author(s) and are not endorsed by BMJ. BMJ disclaims all liability and responsibility arising from any reliance placed on the content. Where the content includes any translated material, BMJ does not warrant the accuracy and reliability of the translations (including but not limited to local regulations, clinical guidelines, terminology, drug names and drug dosages), and is not responsible for any error and/or omissions arising from translation and adaptation or otherwise.
Open access This is an open access article distributed in accordance with the Creative Commons Attribution Non Commercial (CC BY- NC 4.0) license, which permits others to distribute, remix, adapt, build upon this work non- commercially, and license their derivative works on different terms, provided the original work is properly cited, appropriate credit is given, any changes made indicated, and the use is non- commercial. See: http:// creativecommons. org/ licenses/ by- nc/ 4. 0/.
ORCID iDTakafumi Senokuchi http:// orcid. org/ 0000- 0001- 7423- 0878
REFERENCES 1 Aouadi M, Tencerova M, Vangala P, et al. Gene silencing in adipose
tissue macrophages regulates whole- body metabolism in obese mice. Proc Natl Acad Sci U S A 2013;110:8278–83.
2 Olefsky JM, Glass CK. Macrophages, inflammation, and insulin resistance. Annu Rev Physiol 2010;72:219–46.
copyright. on N
ovember 23, 2021 by guest. P
rotected byhttp://drc.bm
j.com/
BM
J Open D
iab Res C
are: first published as 10.1136/bmjdrc-2020-001578 on 21 O
ctober 2020. Dow
nloaded from
12 BMJ Open Diab Res Care 2020;8:e001578. doi:10.1136/bmjdrc-2020-001578
Metabolism
3 Weisberg SP, McCann D, Desai M, et al. Obesity is associated with macrophage accumulation in adipose tissue. J Clin Invest 2003;112:1796–808.
4 Ahima RS. Adipose tissue as an endocrine organ. Obesity 2006;14 Suppl 5:242S–9.
5 Scherer PE. Adipose tissue: from lipid storage compartment to endocrine organ. Diabetes 2006;55:1537–45.
6 Xu H, Barnes GT, Yang Q, et al. Chronic inflammation in fat plays a crucial role in the development of obesity- related insulin resistance. J Clin Invest 2003;112:1821–30.
7 Murano I, Barbatelli G, Parisani V, et al. Dead adipocytes, detected as crown- like structures, are prevalent in visceral fat depots of genetically obese mice. J Lipid Res 2008;49:1562–8.
8 Marchesini G. Marzocchi R: metabolic syndrome and NASH. Clin Liver Dis 2007;11:105–17.
9 Tosello- Trampont A- C, Landes SG, Nguyen V, et al. Kuppfer cells trigger nonalcoholic steatohepatitis development in diet- induced mouse model through tumor necrosis factor-α production. J Biol Chem 2012;287:40161–72.
10 Cha J- Y, Kim D- H, Chun K- H. The role of hepatic macrophages in nonalcoholic fatty liver disease and nonalcoholic steatohepatitis. Lab Anim Res 2018;34:133–9.
11 Khan IM, Perrard XY, Brunner G, et al. Intermuscular and perimuscular fat expansion in obesity correlates with skeletal muscle T cell and macrophage infiltration and insulin resistance. Int J Obes 2015;39:1607–18.
12 Wu H, Ballantyne CM. Skeletal muscle inflammation and insulin resistance in obesity. J Clin Invest 2017;127:43–54.
13 Davies LC, Rosas M, Jenkins SJ, et al. Distinct bone marrow- derived and tissue- resident macrophage lineages proliferate at key stages during inflammation. Nat Commun 2013;4:4.
14 Jenkins SJ, Ruckerl D, Cook PC, et al. Local macrophage proliferation, rather than recruitment from the blood, is a signature of Th2 inflammation. Science 2011;332:1284–8.
15 Murray PJ, Wynn TA. Protective and pathogenic functions of macrophage subsets. Nat Rev Immunol 2011;11:723–37.
16 Gordon D, Reidy MA, Benditt EP, et al. Cell proliferation in human coronary arteries. Proc Natl Acad Sci U S A 1990;87:4600–4.
17 Franklin RA, Liao W, Sarkar A, et al. The cellular and molecular origin of tumor- associated macrophages. Science 2014;344:921–5.
18 Amano SU, Cohen JL, Vangala P, et al. Local proliferation of macrophages contributes to obesity- associated adipose tissue inflammation. Cell Metab 2014;19:162–71.
19 Haase J, Weyer U, Immig K, et al. Local proliferation of macrophages in adipose tissue during obesity- induced inflammation. Diabetologia 2014;57:562–71.
20 Kanda H, Tateya S, Tamori Y, et al. Mcp-1 contributes to macrophage infiltration into adipose tissue, insulin resistance, and hepatic steatosis in obesity. J Clin Invest 2006;116:1494–505.
21 Baeck C, Wehr A, Karlmark KR, et al. Pharmacological inhibition of the chemokine CCL2 (MCP-1) diminishes liver macrophage infiltration and steatohepatitis in chronic hepatic injury. Gut 2012;61:416–26.
22 Yamada S, Senokuchi T, Matsumura T, et al. Inhibition of local macrophage growth ameliorates focal inflammation and suppresses atherosclerosis. Arterioscler Thromb Vasc Biol 2018;38:994–1006.
23 Glass CK, Olefsky JM. Inflammation and lipid signaling in the etiology of insulin resistance. Cell Metab 2012;15:635–45.
24 Horvai A, Palinski W, Wu H, et al. Scavenger receptor a gene regulatory elements target gene expression to macrophages and to foam cells of atherosclerotic lesions. Proc Natl Acad Sci U S A 1995;92:5391–5.
25 Roukos V, Pegoraro G, Voss TC, et al. Cell cycle staging of individual cells by fluorescence microscopy. Nat Protoc 2015;10:334–48.
26 Denies MS, Johnson J, Maliphol AB, et al. Diet- Induced obesity alters skeletal muscle fiber types of male but not female mice. Physiol Rep 2014;2:e00204.
27 Abou Mrad J, Yakubu F, Lin D, et al. Skeletal muscle composition in dietary obesity- susceptible and dietary obesity- resistant rats. Am J Physiol 1992;262:R684–8.
28 Wang P, Mariman E, Renes J, et al. The secretory function of adipocytes in the physiology of white adipose tissue. J Cell Physiol 2008;216:3–13.
29 Shi H, Kokoeva MV, Inouye K, et al. Tlr4 links innate immunity and fatty acid–induced insulin resistance. J Clin Invest 2006;116:3015–25.
30 Della Vedova MC, Muñoz MD, Santillan LD, et al. A mouse model of diet- induced obesity resembling most features of human metabolic syndrome. Nutr Metab Insights 2016;9:NMI.S32907:93–102.
31 Cinti S, Mitchell G, Barbatelli G, et al. Adipocyte death defines macrophage localization and function in adipose tissue of obese mice and humans. J Lipid Res 2005;46:2347–55.
32 Donath MY, Shoelson SE. Type 2 diabetes as an inflammatory disease. Nat Rev Immunol 2011;11:98–107.
33 Nishimura S, Manabe I, Nagasaki M, et al. Adipogenesis in obesity requires close interplay between differentiating adipocytes, stromal cells, and blood vessels. Diabetes 2007;56:1517–26.
34 Tabas I. Consequences and therapeutic implications of macrophage apoptosis in atherosclerosis: the importance of lesion stage and phagocytic efficiency. Arterioscler Thromb Vasc Biol 2005;25:2255–64.
35 Biwa T, Sakai M, Matsumura T, et al. Sites of action of protein kinase C and phosphatidylinositol 3- kinase are distinct in oxidized low density lipoprotein- induced macrophage proliferation. J Biol Chem 2000;275:5810–6.
36 Hashimoto D, Chow A, Noizat C, et al. Tissue- Resident macrophages self- maintain locally throughout adult life with minimal contribution from circulating monocytes. Immunity 2013;38:792–804.
copyright. on N
ovember 23, 2021 by guest. P
rotected byhttp://drc.bm
j.com/
BM
J Open D
iab Res C
are: first published as 10.1136/bmjdrc-2020-001578 on 21 O
ctober 2020. Dow
nloaded from