Embed Size (px)
Citation preview
IMPROVING WOOD KILN BOILER RELIABILITY VIA A NEW WATER TREATMENT CONTROL TECHNOLOGY
Authors: John D. Deines, David A. Grattan, PhD, Thomas S. Hughes, Brian V. Jenkins, John Ostberg, Benjamin D. Riley, Catherine J. Stetenfeld, Nalco Company
Contributors: Ernie Lundquist, Steve Fuhriman, Ryan Lawrence and Robin Schernitzki, Boise Building Solutions, Manufacturing
Here’s what we’ll be covering this morning
• Purpose of the boiler in a wood products plant• Challenges associated with operating a boiler in a
wood products mill– Operational– Resources– Personnel work load
• Boiler chemical treatment, its application and evolution
• New developments in boiler feedwater scale and corrosion control
• Wood products plant application of the new technologies
• Outcome and benefits of the application
The boiler is crucial for wood products manufacturing
• Controls the drying process– Kiln coil heating– Steam humidification
• Optimum Moisture Content is Crucial– Higher end-use product value– Better material usability– Increased product strength– Lower shipping costs– Better insulating and finished material properties
• Drying too fast / too slow - both are bad
As much as 80% of a mill’s energy requirement can be for the drying process
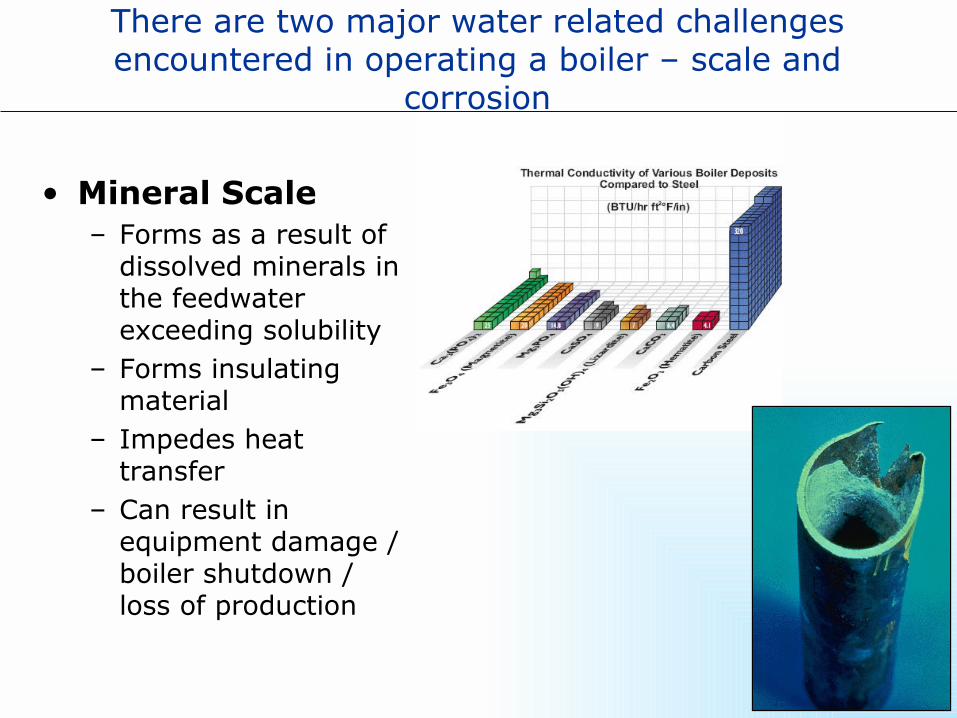
Figure 1 Boiler scale greatly impedes heat transfer and reduces efficiency
There are two major water related challenges encountered in operating a boiler – scale and
corrosion
• Mineral Scale– Forms as a result of
dissolved minerals in the feedwater exceeding solubility
– Forms insulating material
– Impedes heat transfer
– Can result in equipment damage / boiler shutdown / loss of production
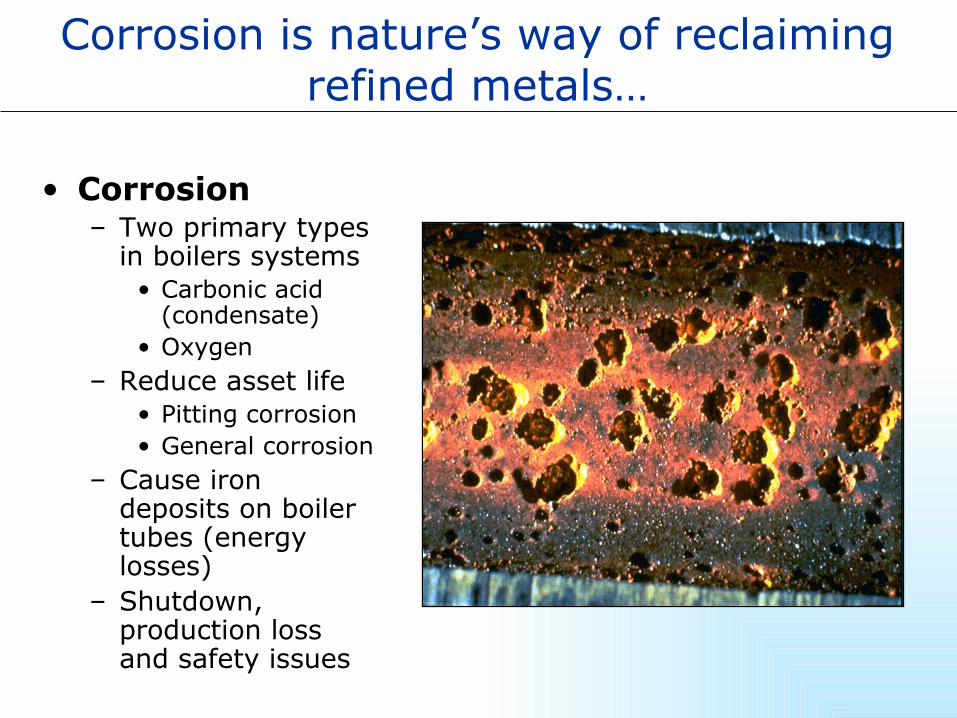
Corrosion is nature’s way of reclaiming refined metals…
• Corrosion– Two primary types
in boilers systems• Carbonic acid
(condensate)• Oxygen
– Reduce asset life• Pitting corrosion• General corrosion
– Cause iron deposits on boiler tubes (energy losses)
– Shutdown, production loss and safety issues
Over time, chemical treatment of boiler feedwater to prevent or reduce the impact of
these challenges has changed
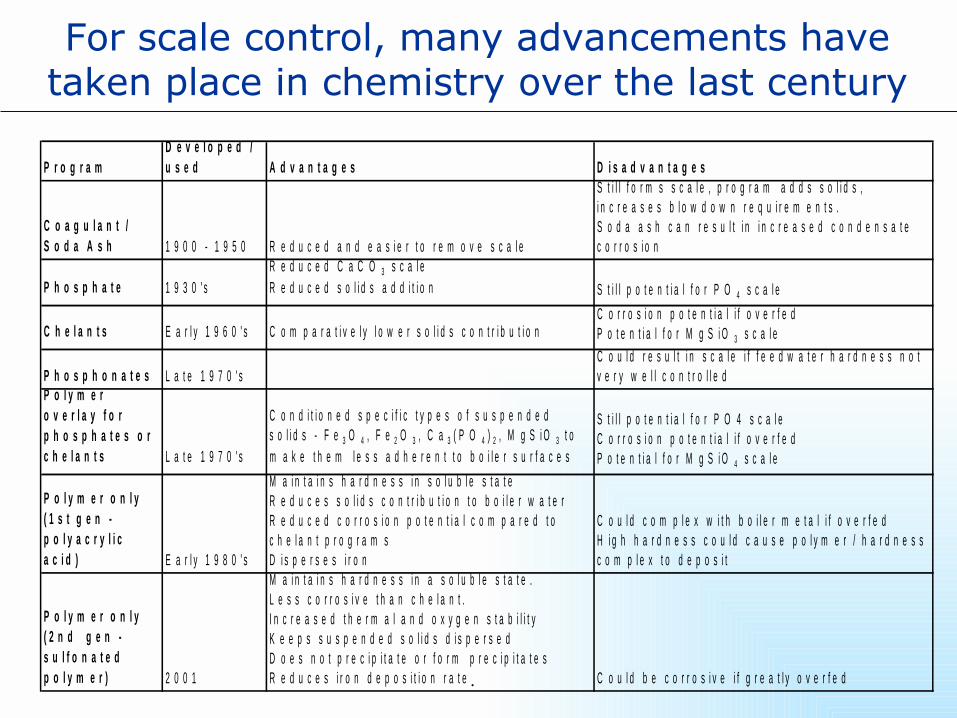
For scale control, many advancements have taken place in chemistry over the last century
P r o g r a mD e v e l o p e d / u s e d A d v a n t a g e s D i s a d v a n t a g e s
C o a g u l a n t / S o d a A s h 1 9 0 0 - 1 9 5 0 R e d u c e d a n d e a s i e r t o r e m o v e s c a l e
S t i l l f o r m s s c a l e , p r o g r a m a d d s s o l i d s , i n c r e a s e s b l o w d o w n r e q u i r e m e n t s . S o d a a s h c a n r e s u l t i n i n c r e a s e d c o n d e n s a t e c o r r o s i o n
P h o s p h a t e 1 9 3 0 ' sR e d u c e d C a C O 3 s c a l eR e d u c e d s o l i d s a d d i t i o n S t i l l p o t e n t i a l f o r P O 4 s c a l e
C h e l a n t s E a r l y 1 9 6 0 ' s C o m p a r a t i v e l y l o w e r s o l i d s c o n t r i b u t i o nC o r r o s i o n p o t e n t i a l i f o v e r f e dP o t e n t i a l f o r M g S i O 3 s c a l e
P h o s p h o n a t e s L a t e 1 9 7 0 ' sC o u l d r e s u l t i n s c a l e i f f e e d w a t e r h a r d n e s s n o t v e r y w e l l c o n t r o l l e d
P o l y m e r o v e r l a y f o r p h o s p h a t e s o r c h e l a n t s L a t e 1 9 7 0 ' s
C o n d i t i o n e d s p e c i f i c t y p e s o f s u s p e n d e d s o l i d s - F e 3 O 4 , F e 2 O 3 , C a 3 ( P O 4 ) 2 , M g S i O 3 t o m a k e t h e m l e s s a d h e r e n t t o b o i l e r s u r f a c e s
S t i l l p o t e n t i a l f o r P O 4 s c a l eC o r r o s i o n p o t e n t i a l i f o v e r f e dP o t e n t i a l f o r M g S i O 4 s c a l e
P o l y m e r o n l y ( 1 s t g e n - p o l y a c r y l i c a c i d ) E a r l y 1 9 8 0 ' s
M a i n t a i n s h a r d n e s s i n s o l u b l e s t a t eR e d u c e s s o l i d s c o n t r i b u t i o n t o b o i l e r w a t e rR e d u c e d c o r r o s i o n p o t e n t i a l c o m p a r e d t o c h e l a n t p r o g r a m sD i s p e r s e s i r o n
C o u l d c o m p l e x w i t h b o i l e r m e t a l i f o v e r f e dH i g h h a r d n e s s c o u l d c a u s e p o l y m e r / h a r d n e s s c o m p l e x t o d e p o s i t
P o l y m e r o n l y ( 2 n d g e n - s u l f o n a t e d p o l y m e r ) 2 0 0 1
M a i n t a i n s h a r d n e s s i n a s o l u b l e s t a t e . L e s s c o r r o s i v e t h a n c h e l a n t . I n c r e a s e d t h e r m a l a n d o x y g e n s t a b i l i t yK e e p s s u s p e n d e d s o l i d s d i s p e r s e dD o e s n o t p r e c i p i t a t e o r f o r m p r e c i p i t a t e s R e d u c e s i r o n d e p o s i t i o n r a t e . C o u l d b e c o r r o s i v e i f g r e a t l y o v e r f e d

For control of oxygen corrosion in preboiler equipment, we have developed effective chemical oxygen scavengers …
Indirect Direct
Measuring ChemicalResiduals
► Dearator Inspections
► Monitoring DissolvedOxygen
► IronTesting
► ?
… but we have still lacked technology that could reliably monitor and control changes in that environment!
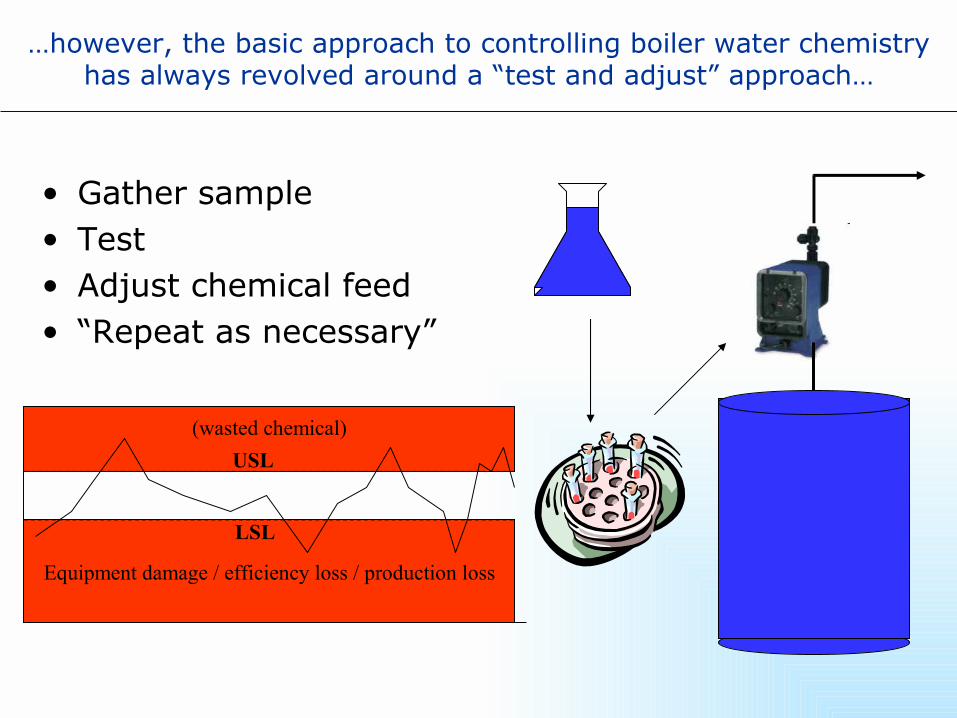
…however, the basic approach to controlling boiler water chemistry has always revolved around a “test and adjust” approach…
• Gather sample• Test• Adjust chemical feed• “Repeat as necessary”
Equipment damage / efficiency loss / production loss
(wasted chemical)USL
LSL
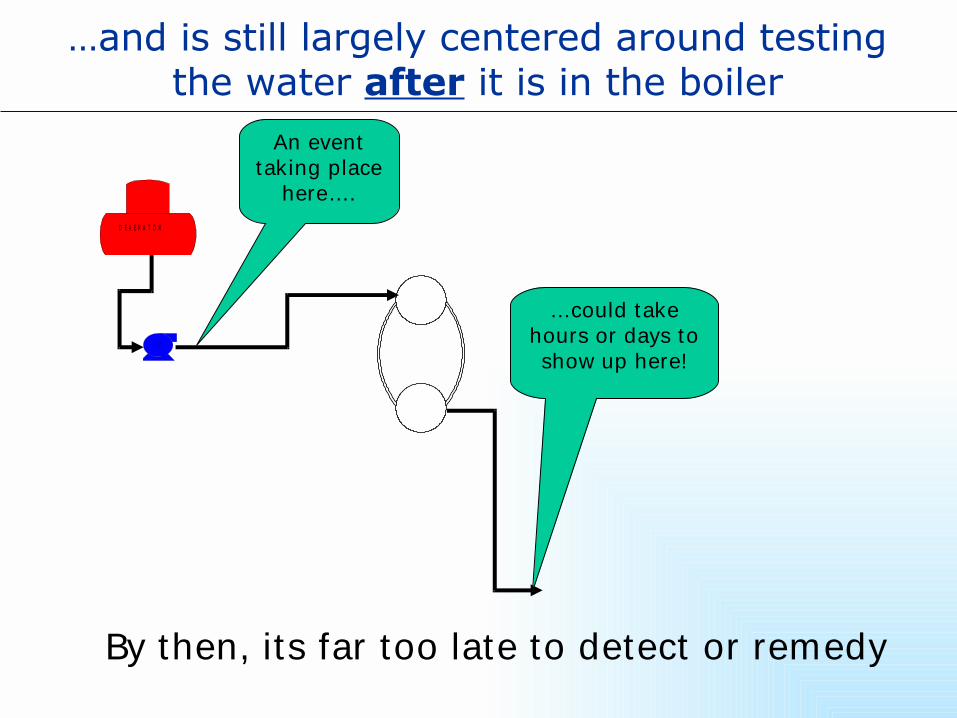
…and is still largely centered around testing the water after it is in the boiler
D E A E R A T O R
An event taking place
here….
…could take hours or days to
show up here!
By then, its far too late to detect or remedy
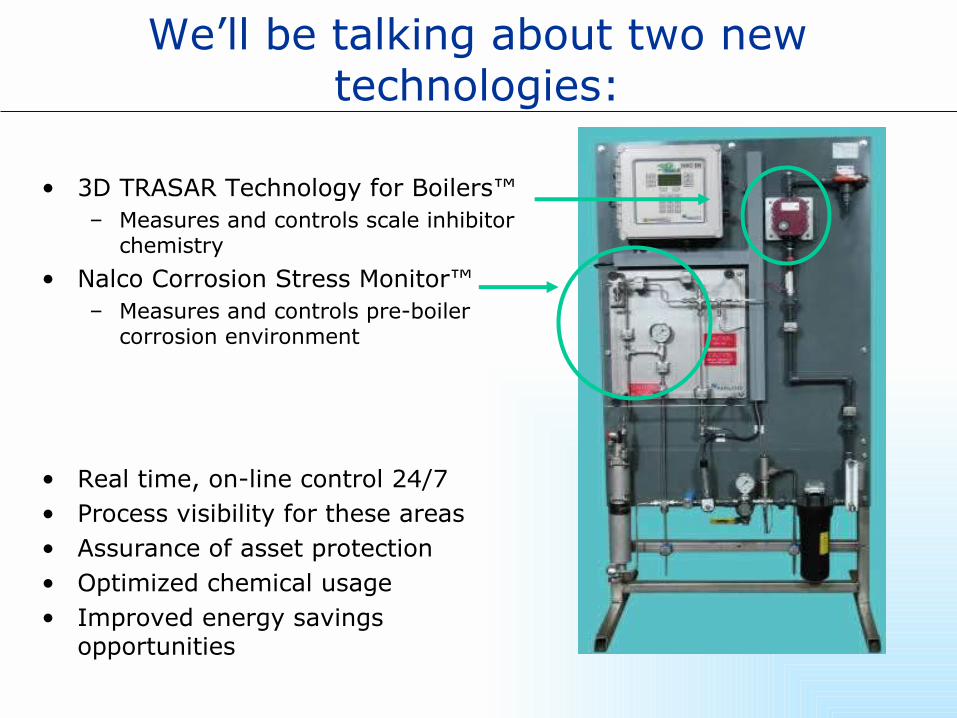
We’ll be talking about two new technologies:
• 3D TRASAR Technology for Boilers™– Measures and controls scale inhibitor
chemistry• Nalco Corrosion Stress Monitor™
– Measures and controls pre-boiler corrosion environment
• Real time, on-line control 24/7• Process visibility for these areas• Assurance of asset protection• Optimized chemical usage• Improved energy savings
opportunities
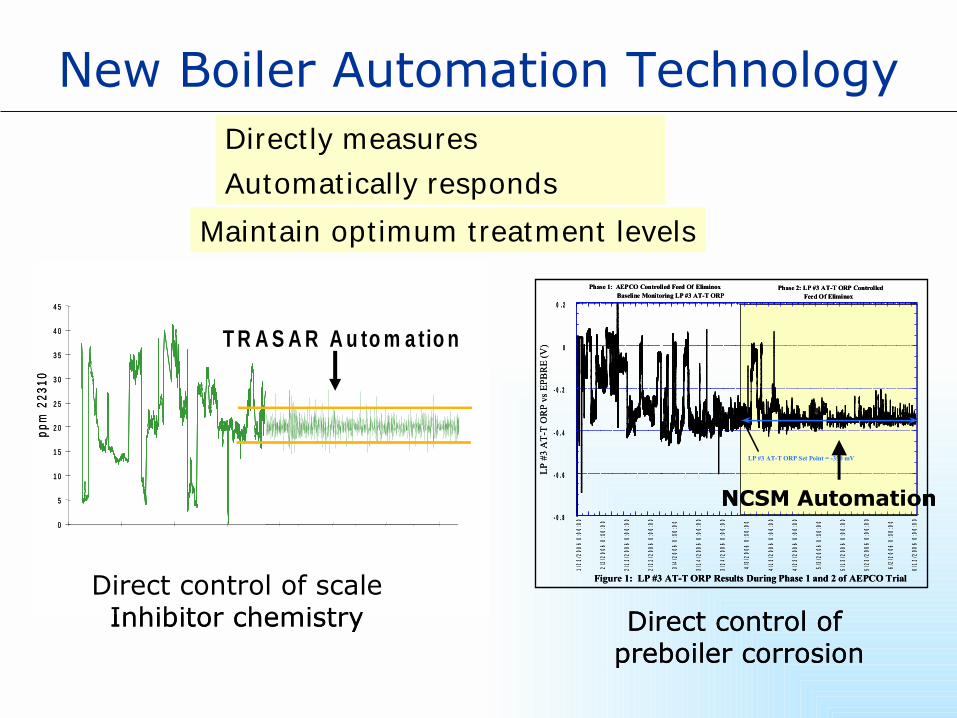
New Boiler Automation Technology
Automat ically responds
Maintain opt imum treatment levels
Direct ly measures
ppm
223
10
0
5
1 0
1 5
2 0
2 5
3 0
3 5
4 0
4 5
0 1 / 1 0 /9 9 0 1 /2 0 / 9 9 0 1 /3 0 /9 9 0 2 / 0 9 /9 9 0 2 /1 9 / 9 9 0 3 /0 1 / 9 9 0 3 / 1 1 /9 9 0 3 / 2 1 /9 9
D a te
O p tim u m O p e ra tio n
D e te c t S y s te mU p s e ts
T R A S A R A u to m a t io n
0
5
1 0
1 5
2 0
2 5
3 0
3 5
4 0
4 5
0 1 /1 0 /9 9 0 1 /2 0 /9 9 0 1 /3 0 /9 9 0 2 /0 9 /9 9 0 2 /1 9 /9 9 0 3 /01 /9 9 0 3 /1 1 /9 9 0 3 /2 1 /9 9
D a te
0
5
1 0
1 5
2 0
2 5
3 0
3 5
4 0
4 5
1 0 /1 1 /1 9 9 7 2 0 /1 1 /1 9 9 7 3 0 /1 1 /1 9 9 7 1 0 /1 2 /1 9 9 7 2 0 /1 2 /1 9 9 7 3 0 /1 2 /1 9 9 7 0 9 /0 1 /1 9 9 8 1 9 /0 1 /1 9 9 8
D a te
ppm
223
10
T R A S A R A u to m a tio n
Direct control of scaleInhibitor chemistry
ppm
223
10
0
5
1 0
1 5
2 0
2 5
3 0
3 5
4 0
4 5
0 1 / 1 0 /9 9 0 1 /2 0 / 9 9 0 1 /3 0 /9 9 0 2 / 0 9 /9 9 0 2 /1 9 / 9 9 0 3 /0 1 / 9 9 0 3 / 1 1 /9 9 0 3 / 2 1 /9 9
D a te
O p tim u m O p e ra tio n
D e te c t S y s te mU p s e ts
T R A S A R A u to m a t io n
0
5
1 0
1 5
2 0
2 5
3 0
3 5
4 0
4 5
0 1 /1 0 /9 9 0 1 /2 0 /9 9 0 1 /3 0 /9 9 0 2 /0 9 /9 9 0 2 /1 9 /9 9 0 3 /01 /9 9 0 3 /1 1 /9 9 0 3 /2 1 /9 9
D a te
0
5
1 0
1 5
2 0
2 5
3 0
3 5
4 0
4 5
1 0 /1 1 /1 9 9 7 2 0 /1 1 /1 9 9 7 3 0 /1 1 /1 9 9 7 1 0 /1 2 /1 9 9 7 2 0 /1 2 /1 9 9 7 3 0 /1 2 /1 9 9 7 0 9 /0 1 /1 9 9 8 1 9 /0 1 /1 9 9 8
D a te
ppm
223
10
T R A S A R A u to m a tio n
ppm
223
10
0
5
1 0
1 5
2 0
2 5
3 0
3 5
4 0
4 5
0 1 / 1 0 /9 9 0 1 /2 0 / 9 9 0 1 /3 0 /9 9 0 2 / 0 9 /9 9 0 2 /1 9 / 9 9 0 3 /0 1 / 9 9 0 3 / 1 1 /9 9 0 3 / 2 1 /9 9
D a te
O p tim u m O p e ra tio n
D e te c t S y s te mU p s e ts
T R A S A R A u to m a t io n
ppm
223
10
0
5
1 0
1 5
2 0
2 5
3 0
3 5
4 0
4 5
0 1 / 1 0 /9 9 0 1 /2 0 / 9 9 0 1 /3 0 /9 9 0 2 / 0 9 /9 9 0 2 /1 9 / 9 9 0 3 /0 1 / 9 9 0 3 / 1 1 /9 9 0 3 / 2 1 /9 9
D a te
O p tim u m O p e ra tio n
D e te c t S y s te mU p s e ts
T R A S A R A u to m a t io n
ppm
223
10
0
5
1 0
1 5
2 0
2 5
3 0
3 5
4 0
4 5
0 1 / 1 0 /9 9 0 1 /2 0 / 9 9 0 1 /3 0 /9 9 0 2 / 0 9 /9 9 0 2 /1 9 / 9 9 0 3 /0 1 / 9 9 0 3 / 1 1 /9 9 0 3 / 2 1 /9 9
D a te
O p tim u m O p e ra tio n
D e te c t S y s te mU p s e ts
ppm
223
10
0
5
1 0
1 5
2 0
2 5
3 0
3 5
4 0
4 5
0 1 / 1 0 /9 9 0 1 /2 0 / 9 9 0 1 /3 0 /9 9 0 2 / 0 9 /9 9 0 2 /1 9 / 9 9 0 3 /0 1 / 9 9 0 3 / 1 1 /9 9 0 3 / 2 1 /9 9
D a te
O p tim u m O p e ra tio n
D e te c t S y s te mU p s e ts
T R A S A R A u to m a t io n
0
5
1 0
1 5
2 0
2 5
3 0
3 5
4 0
4 5
0 1 /1 0 /9 9 0 1 /2 0 /9 9 0 1 /3 0 /9 9 0 2 /0 9 /9 9 0 2 /1 9 /9 9 0 3 /01 /9 9 0 3 /1 1 /9 9 0 3 /2 1 /9 9
D a te
0
5
1 0
1 5
2 0
2 5
3 0
3 5
4 0
4 5
1 0 /1 1 /1 9 9 7 2 0 /1 1 /1 9 9 7 3 0 /1 1 /1 9 9 7 1 0 /1 2 /1 9 9 7 2 0 /1 2 /1 9 9 7 3 0 /1 2 /1 9 9 7 0 9 /0 1 /1 9 9 8 1 9 /0 1 /1 9 9 8
D a te
ppm
223
10
0
5
1 0
1 5
2 0
2 5
3 0
3 5
4 0
4 5
0 1 /1 0 /9 9 0 1 /2 0 /9 9 0 1 /3 0 /9 9 0 2 /0 9 /9 9 0 2 /1 9 /9 9 0 3 /01 /9 9 0 3 /1 1 /9 9 0 3 /2 1 /9 9
D a te
0
5
1 0
1 5
2 0
2 5
3 0
3 5
4 0
4 5
1 0 /1 1 /1 9 9 7 2 0 /1 1 /1 9 9 7 3 0 /1 1 /1 9 9 7 1 0 /1 2 /1 9 9 7 2 0 /1 2 /1 9 9 7 3 0 /1 2 /1 9 9 7 0 9 /0 1 /1 9 9 8 1 9 /0 1 /1 9 9 8
D a te
ppm
223
10
T R A S A R A u to m a tio n
Direct control of scaleInhibitor chemistry
- 0 . 8
- 0 . 6
- 0 . 4
- 0 . 2
0
0 . 2
1/2
3/2
006
0:0
0:00
2/2
/200
6 0:
00:0
0
2/1
2/2
006
0:0
0:0
0
2/2
2/2
006
0:0
0:00
3/4
/20
06 0
:00
:00
3/1
4/2
006
0:0
0:00
3/2
4/2
006
0:0
0:0
0
4/3/
200
6 0
:00
:00
4/1
3/2
006
0:0
0:0
0
4/2
3/2
006
0:0
0:0
0
5/3
/20
06 0
:00
:00
5/1
3/2
006
0:0
0:0
0
5/2
3/2
006
0:00
:00
6/2
/20
06 0
:00
:00
6/1
2/2
006
0:00
:00
LP #
3 A
T-T
OR
P vs
EPB
RE
(V)
Phase 2: LP #3 AT-T ORP Controlled Feed Of Eliminox
Phase 1: AEPCO Controlled Feed Of Eliminox Baseline Monitoring LP #3 AT-T ORP
LP #3 AT-T ORP Set Point = -350 mV
Figure 1: LP #3 AT-T ORP Results During Phase 1 and 2 of AEPCO Trial
Direct control of preboiler corrosion
NCSM Automation- 0 . 8
- 0 . 6
- 0 . 4
- 0 . 2
0
0 . 2
1/2
3/2
006
0:0
0:00
2/2
/200
6 0:
00:0
0
2/1
2/2
006
0:0
0:0
0
2/2
2/2
006
0:0
0:00
3/4
/20
06 0
:00
:00
3/1
4/2
006
0:0
0:00
3/2
4/2
006
0:0
0:0
0
4/3/
200
6 0
:00
:00
4/1
3/2
006
0:0
0:0
0
4/2
3/2
006
0:0
0:0
0
5/3
/20
06 0
:00
:00
5/1
3/2
006
0:0
0:0
0
5/2
3/2
006
0:00
:00
6/2
/20
06 0
:00
:00
6/1
2/2
006
0:00
:00
LP #
3 A
T-T
OR
P vs
EPB
RE
(V)
Phase 2: LP #3 AT-T ORP Controlled Feed Of Eliminox
Phase 1: AEPCO Controlled Feed Of Eliminox Baseline Monitoring LP #3 AT-T ORP
LP #3 AT-T ORP Set Point = -350 mV
Figure 1: LP #3 AT-T ORP Results During Phase 1 and 2 of AEPCO Trial
Direct control of preboiler corrosion
NCSM Automation
We implemented and evaluated these technologies at Boise Building Solutions,
Manufacturing in Kettle Falls, WAResults from on-site work
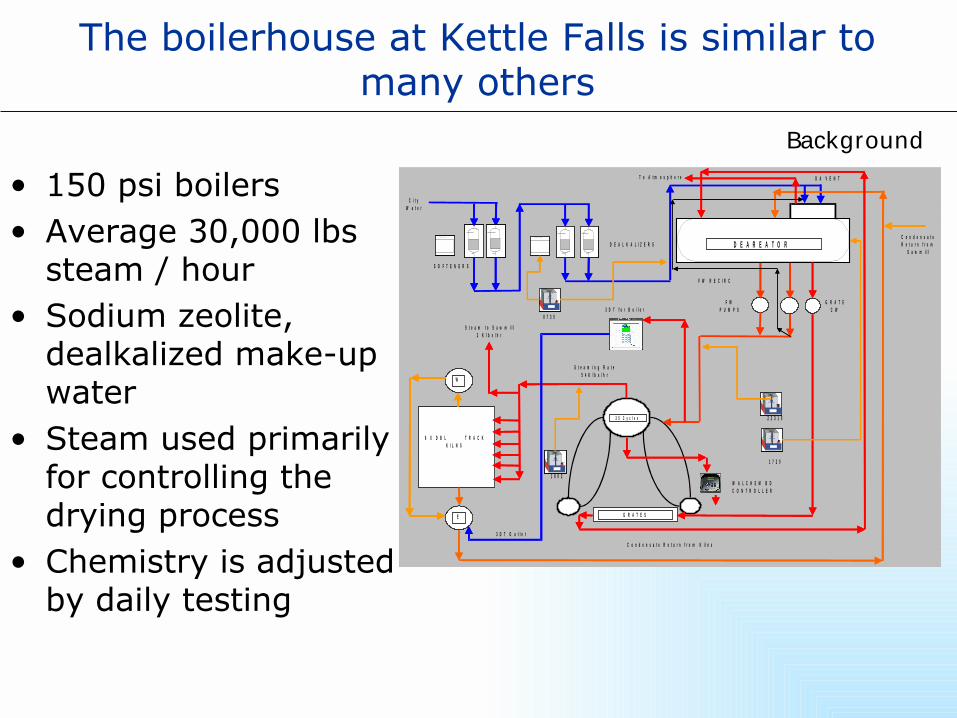
The boilerhouse at Kettle Falls is similar to many others
• 150 psi boilers• Average 30,000 lbs
steam / hour• Sodium zeolite,
dealkalized make-up water
• Steam used primarily for controlling the drying process
• Chemistry is adjusted by daily testing
C o n d e n s a t e R e t u r n f r o m K i l n s
1 8 0 2
3 D T O u t l e t
C i t y W a t e r
W A L C H E M B D C O N T R O L L E R
S O F T E N E R S
8 7 3 5
F W P U M P S
1 7 2 0
2 2 3 1 0
S t e a m i n g R a t e 5 4 K l b s / h r
D A V E N T
S t e a m t o S a w m i l l 2 K l b s / h r
C o n d e n s a t e R e t u r n f r o m
S a w m i l l
3 D T f o r B o i l e rG R A T E
C W
T o A t m o s p h e r e
F W R E C I R C
D E A L K A L I Z E R S
6 X D B L T R A C K K I L N S
3 5 C y c l e s
C l o s e d t a n k C l o s e d t a n k
G R A T E S
D E A R E A T O R
W
E
C o n d e n s a t e R e t u r n f r o m K i l n s
1 8 0 2
3 D T O u t l e t
C i t y W a t e r
W A L C H E M B D C O N T R O L L E R
S O F T E N E R S
8 7 3 5
F W P U M P S
1 7 2 0
2 2 3 1 0
S t e a m i n g R a t e 5 4 K l b s / h r
D A V E N T
S t e a m t o S a w m i l l 2 K l b s / h r
C o n d e n s a t e R e t u r n f r o m
S a w m i l l
3 D T f o r B o i l e rG R A T E
C W
T o A t m o s p h e r e
F W R E C I R C
D E A L K A L I Z E R S
6 X D B L T R A C K K I L N S
3 5 C y c l e s
C l o s e d t a n kC l o s e d t a n k C l o s e d t a n kC l o s e d t a n k
G R A T E S
D E A R E A T O R
W
E
Figure 2 – The boiler system at Boise Building Solutions, Manufacturing is similar
to many in the wood products industry
Background
There were several objectives for the evaluation
• Improved chemistry control• Optimized operating costs
– Reduced water costs– Reduced energy costs– Improved efficiency – avoiding iron deposits in the boiler
Evaluat ion goals
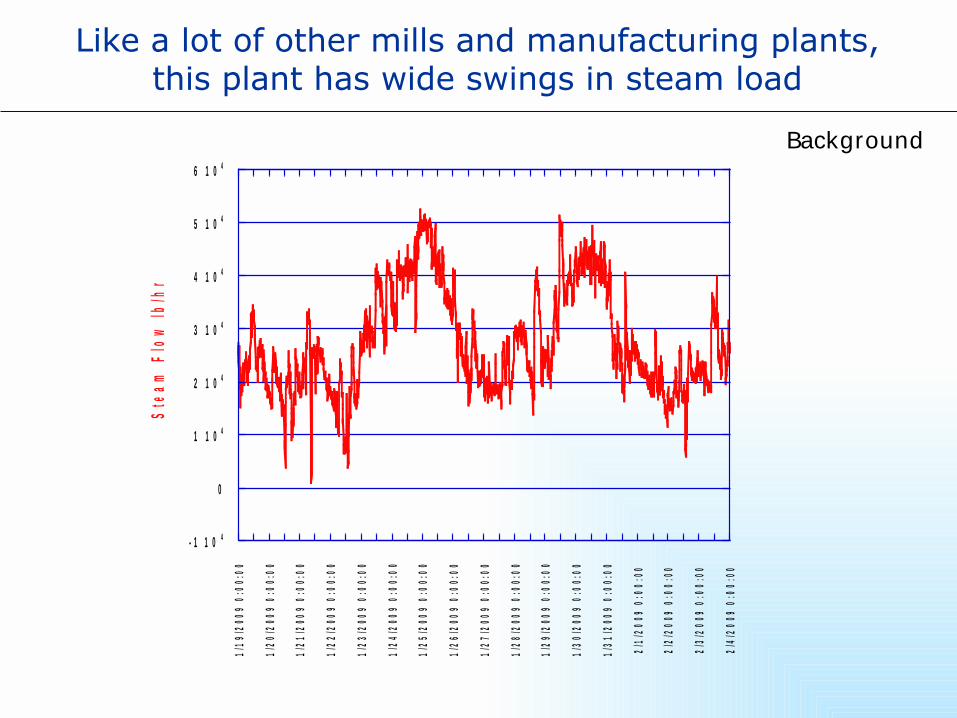
Like a lot of other mills and manufacturing plants, this plant has wide swings in steam load
Figure 4 shows the steam load variations common to wood plants
- 1 1 0 4
0
1 1 0 4
2 1 0 4
3 1 0 4
4 1 0 4
5 1 0 4
6 1 0 4
1/19
/200
9 0:
00:0
0
1/20
/200
9 0:
00:0
0
1/21
/200
9 0:
00:0
0
1/22
/200
9 0:
00:0
0
1/23
/200
9 0:
00:0
0
1/24
/200
9 0:
00:0
0
1/25
/200
9 0:
00:0
0
1/26
/200
9 0:
00:0
0
1/27
/200
9 0:
00:0
0
1/28
/200
9 0:
00:0
0
1/29
/200
9 0:
00:0
0
1/30
/200
9 0:
00:0
0
1/31
/200
9 0:
00:0
0
2/1/
2009
0:0
0:00
2/2/
2009
0:0
0:00
2/3/
2009
0:0
0:00
2/4/
2009
0:0
0:00
Ste
am F
low
lb/h
rBackground
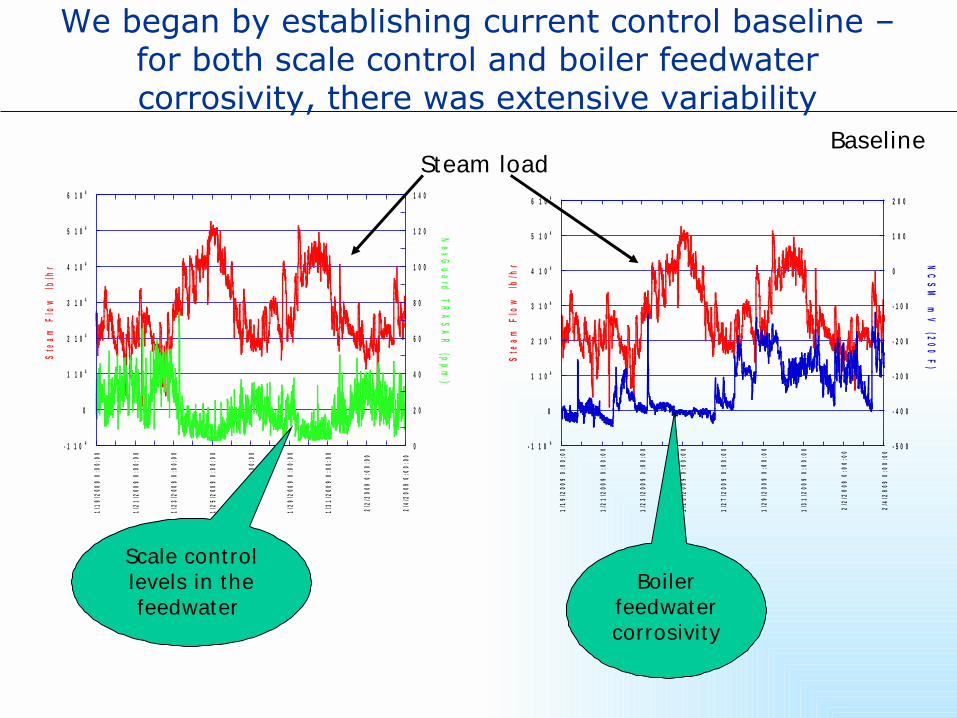
We began by establishing current control baseline – for both scale control and boiler feedwater corrosivity, there was extensive variability
Figure 5 – Steam load and scale inhibitor levels vary greatly during the monitoring phase of the
new control technology implementation
- 1 1 0 4
0
1 1 0 4
2 1 0 4
3 1 0 4
4 1 0 4
5 1 0 4
6 1 0 4
0
2 0
4 0
6 0
8 0
1 0 0
1 2 0
1 4 0
1/19
/200
9 0:
00:0
0
1/21
/200
9 0:
00:0
0
1/23
/200
9 0:
00:0
0
1/25
/200
9 0:
00:0
0
1/27
/200
9 0:
00:0
0
1/29
/200
9 0:
00:0
0
1/31
/200
9 0:
00:0
0
2/2/
2009
0:0
0:00
2/4/
2009
0:0
0:00
Ste
am F
low
lb
/hr
NexG
uard
TR
AS
AR
(pp
m)
Figure 6 – Boiler feedwater corrosivity also varies widely with steam load swings during the
monitoring phase
- 1 1 0 4
0
1 1 0 4
2 1 0 4
3 1 0 4
4 1 0 4
5 1 0 4
6 1 0 4
- 5 0 0
- 4 0 0
- 3 0 0
- 2 0 0
- 1 0 0
0
1 0 0
2 0 0
1/1
9/2
009
0:0
0:0
0
1/2
1/2
009
0:0
0:0
0
1/2
3/2
009
0:0
0:0
0
1/2
5/2
009
0:0
0:0
0
1/2
7/2
009
0:0
0:0
0
1/2
9/2
009
0:0
0:0
0
1/3
1/2
009
0:0
0:0
0
2/2
/20
09 0
:00
:00
2/4
/20
09 0
:00
:00
Ste
am F
low
lb
/hr N
CS
M m
V (200 F
)
Scale cont rol levels in the feedwater
Steam load
Boiler feedwater corrosivity
Baseline
Many useful discoveries occurred during the evaluation
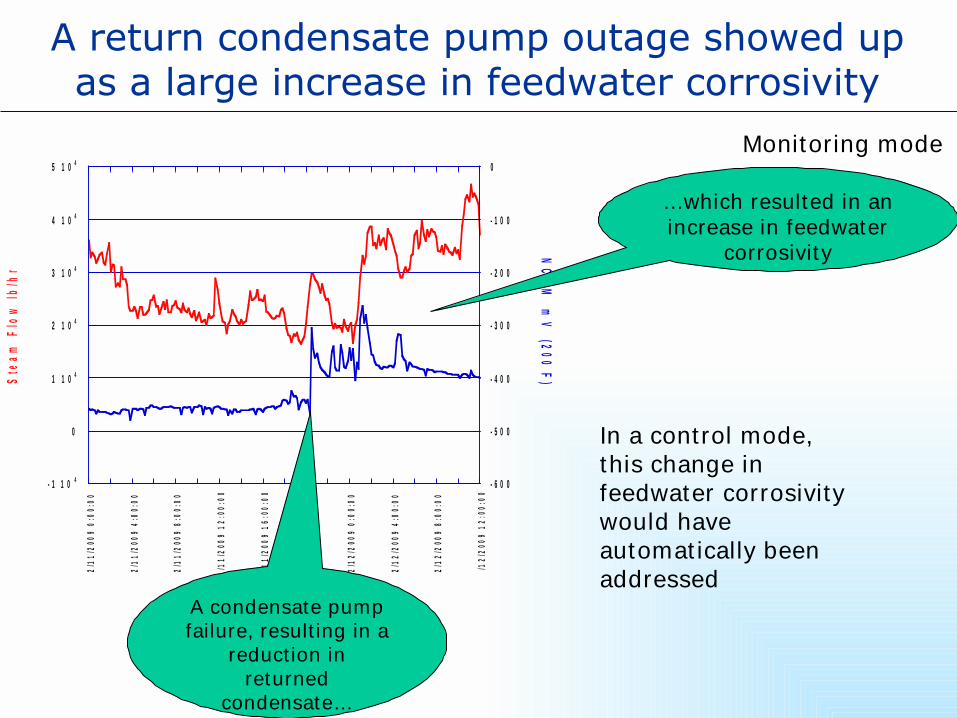
A return condensate pump outage showed up as a large increase in feedwater corrosivity
Figure 7 – A condensate return pump outage is recorded as a change in
feedwater corrosivity by the NCSM
- 1 1 0 4
0
1 1 0 4
2 1 0 4
3 1 0 4
4 1 0 4
5 1 0 4
- 6 0 0
- 5 0 0
- 4 0 0
- 3 0 0
- 2 0 0
- 1 0 0
0
2/11
/200
9 0:
00:0
0
2/11
/200
9 4:
00:0
0
2/11
/200
9 8:
00:0
0
2/11
/200
9 12
:00:
00
2/11
/200
9 16
:00:
00
2/11
/200
9 20
:00:
00
2/1
2/20
09 0
:00:
00
2/12
/200
9 4:
00:0
0
2/12
/200
9 8:
00:0
0
2/12
/200
9 12
:00:
00
Ste
am F
low
lb/h
r
NC
SM
mV
(200 F)
A condensate pump failure, result ing in a
reduct ion in returned
condensate…
…which resulted in an increase in feedwater
corrosivity
Monitoring mode
In a control mode, this change in feedwater corrosivity would have automat ically been addressed
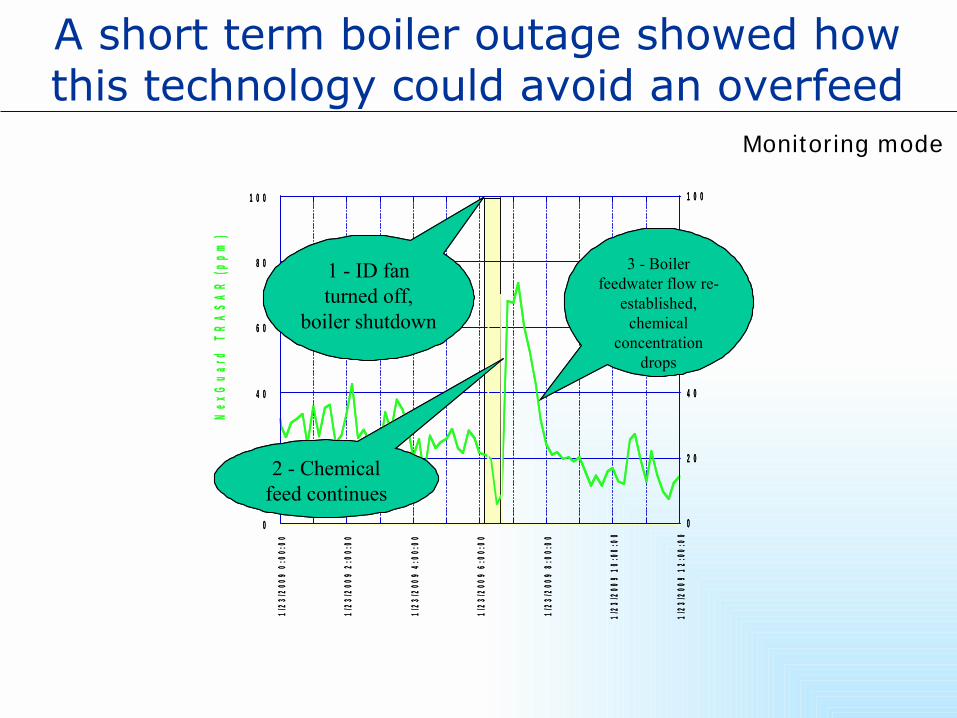
A short term boiler outage showed how this technology could avoid an overfeed
Monitoring mode
Figure 8 shows how a chemical overfeed can occur in the absence of real-time control capability
0
2 0
4 0
6 0
8 0
1 0 0
1/23
/200
9 0:
00:0
0
1/23
/200
9 2:
00:0
0
1/23
/200
9 4:
00:0
0
1/23
/200
9 6:
00:0
0
1/23
/200
9 8:
00:0
0
1/23
/200
9 10
:00:
00
1/23
/200
9 12
:00:
00
0
2 0
4 0
6 0
8 0
1 0 0
Nex
Gu
ard
TR
AS
AR
(p
pm
)
3 - Boiler feedwater flow re-
established, chemical
concentration drops
1 - ID fan turned off,
boiler shutdown
2 - Chemical feed continues
0
2 0
4 0
6 0
8 0
1 0 0
1/23
/200
9 0:
00:0
0
1/23
/200
9 2:
00:0
0
1/23
/200
9 4:
00:0
0
1/23
/200
9 6:
00:0
0
1/23
/200
9 8:
00:0
0
1/23
/200
9 10
:00:
00
1/23
/200
9 12
:00:
00
0
2 0
4 0
6 0
8 0
1 0 0
Nex
Gu
ard
TR
AS
AR
(p
pm
)
3 - Boiler feedwater flow re-
established, chemical
concentration drops
1 - ID fan turned off,
boiler shutdown
2 - Chemical feed continues
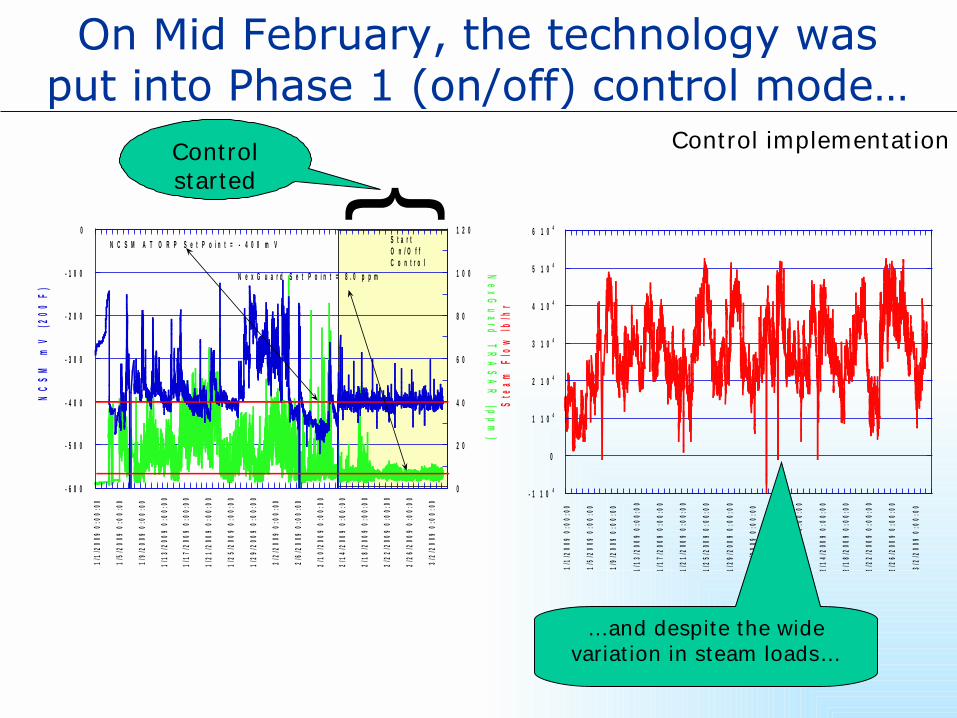
On Mid February, the technology was put into Phase 1 (on/off) control mode…
Figure 10 shows the before / after control improvement in scale control and oxygen
scavenger chemistry
- 6 0 0
- 5 0 0
- 4 0 0
- 3 0 0
- 2 0 0
- 1 0 0
0
0
2 0
4 0
6 0
8 0
1 0 0
1 2 0
1/1
/200
9 0:
00:0
0
1/5/
2009
0:0
0:00
1/9/
2009
0:0
0:00
1/13
/200
9 0:
00:
00
1/17
/200
9 0
:00:
00
1/21
/200
9 0:
00:0
0
1/2
5/20
09 0
:00:
00
1/29
/200
9 0:
00:
00
2/2/
2009
0:0
0:00
2/6/
200
9 0
:00:
00
2/1
0/20
09 0
:00:
00
2/14
/200
9 0
:00:
00
2/18
/200
9 0:
00:0
0
2/2
2/20
09 0
:00:
00
2/2
6/20
09 0
:00:
00
3/2/
2009
0:0
0:00
NC
SM
mV
(20
0 F
)
NexG
uard
TR
AS
AR
(pp
m)
N e x G u a r d S e t P o i n t = 8 . 0 p p m
N C S M A T O R P S e t P o i n t = - 4 0 0 m V S t a r t O n / O f f C o n t r o l
Figure 11 shows the comparatively wide swings in steam load this mill experiences for the same time frame as Figure 10– this is a normal scenario for
most manufacturing plants
- 1 1 0 4
0
1 1 0 4
2 1 0 4
3 1 0 4
4 1 0 4
5 1 0 4
6 1 0 4
1/1
/200
9 0:
00:0
0
1/5/
2009
0:0
0:0
0
1/9
/200
9 0:
00:0
0
1/13
/200
9 0:
00:0
0
1/17
/200
9 0:
00:0
0
1/21
/200
9 0:
00:0
0
1/2
5/20
09 0
:00:
00
1/29
/200
9 0:
00:0
0
2/2/
2009
0:0
0:00
2/6/
2009
0:0
0:00
2/10
/200
9 0
:00:
00
2/14
/200
9 0:
00:0
0
2/18
/200
9 0
:00:
00
2/2
2/20
09 0
:00:
00
2/26
/200
9 0
:00:
00
3/2/
2009
0:0
0:00
Ste
am F
low
lb/h
r
…and despite the wide variat ion in steam loads…
}Control started
Control implementat ion

One of the other advantages of this technology is the ability to view the data on the web in real
time to ensure control is maintained
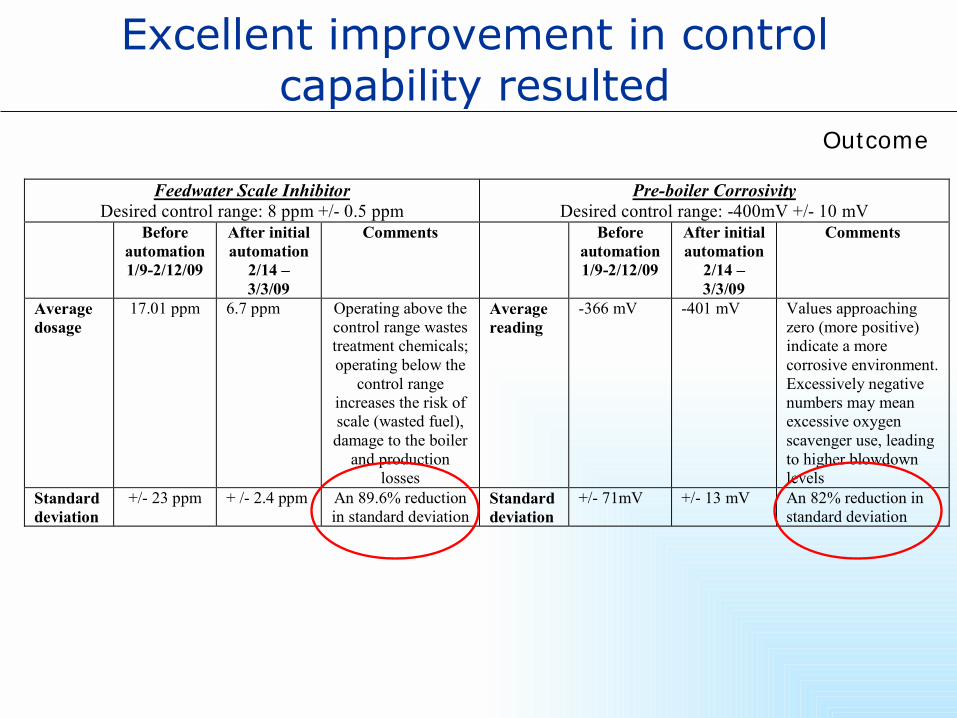
Excellent improvement in control capability resulted
Feedwater Scale Inhibitor Desired control range: 8 ppm +/- 0.5 ppm
Pre-boiler Corrosivity Desired control range: -400mV +/- 10 mV
Before automation 1/9-2/12/09
After initial automation
2/14 – 3/3/09
Comments Before automation 1/9-2/12/09
After initial automation
2/14 – 3/3/09
Comments
Average dosage
17.01 ppm 6.7 ppm Operating above the control range wastes treatment chemicals; operating below the
control range increases the risk of scale (wasted fuel), damage to the boiler
and production losses
Average reading
-366 mV -401 mV Values approaching zero (more positive) indicate a more corrosive environment. Excessively negative numbers may mean excessive oxygen scavenger use, leading to higher blowdown levels
Standard deviation
+/- 23 ppm + /- 2.4 ppm An 89.6% reduction in standard deviation
Standard deviation
+/- 71mV +/- 13 mV An 82% reduction in standard deviation
Outcome
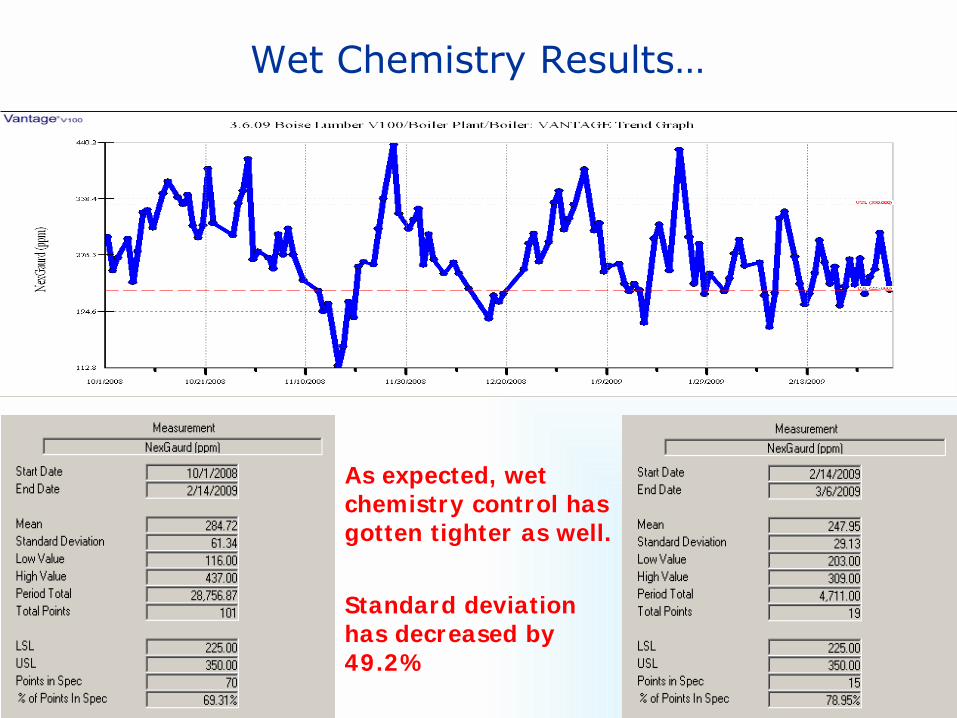
Wet Chemistry Results…
As expected, wet chemistry control has gotten tighter as well.
Standard deviation has decreased by 49.2%
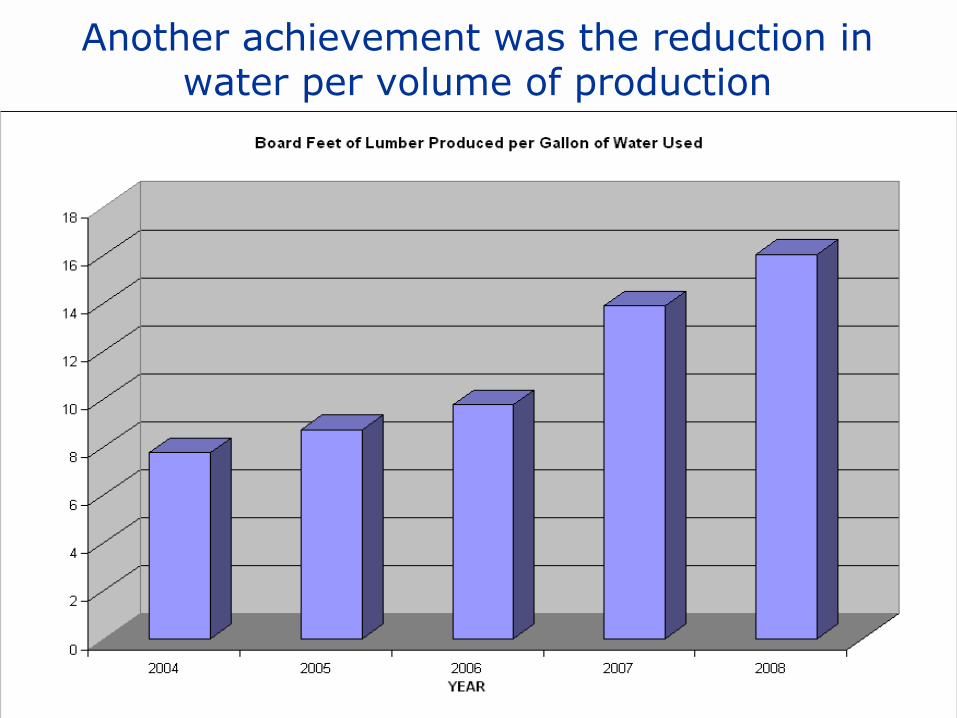
Another achievement was the reduction in water per volume of production
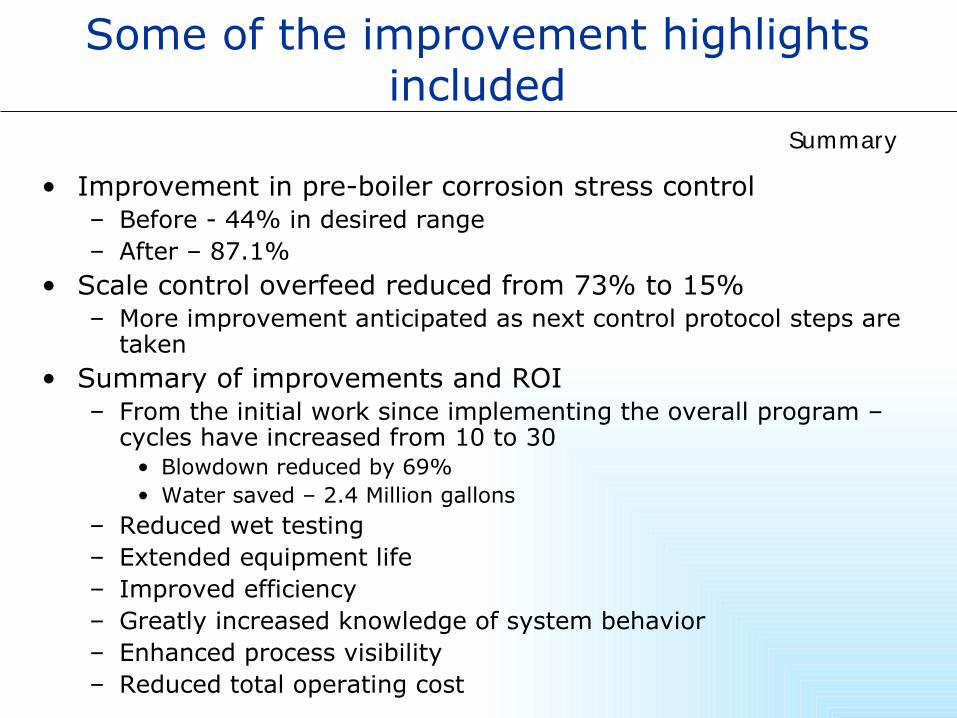
Some of the improvement highlights included
• Improvement in pre-boiler corrosion stress control– Before - 44% in desired range– After – 87.1%
• Scale control overfeed reduced from 73% to 15%– More improvement anticipated as next control protocol steps are
taken• Summary of improvements and ROI
– From the initial work since implementing the overall program – cycles have increased from 10 to 30
• Blowdown reduced by 69%• Water saved – 2.4 Million gallons
– Reduced wet testing– Extended equipment life– Improved efficiency– Greatly increased knowledge of system behavior– Enhanced process visibility– Reduced total operating cost
Summary
Key Take Aways…
• Asset Reliability and Efficiency is the Key in Steam Plant Operations
• Controlling Scale and Corrosion is the Key to Asset Reliability
• New Methods of Measurement and Control have “Changed the Game”
• Indirect Control to Direct Control• Reactive to Proactive• Greater Visibility with less Operations Time Requirement• Equals Greater Asset Reliability with lower Total Costs of
Operations
Summary