Embed Size (px)
Citation preview
See important disclosures at the end of this report Powered by Enhanced Datasystems’ EFATM
Platform 1
Initiating Coverage, 7 August 2013
STP&I (STPI TB) Buy Industrial - Manufactured Goods Target Price: THB26.0
Market Cap: USD856m Price: THB18.2
Leader In Modular Fabrication
Macro
2.00
Risks
2.00
Growth
3.00
Value
3.00
78
103
128
153
178
203
228
253
278
303
328
5
7
9
11
13
15
17
19
21
23
25
STP&I (STPI TB)Price Close Relative to Stock Exchange of Thailand Index (RHS)
10
20
30
40
50
60
70
Au
g-1
2
Oct-
12
De
c-1
2
Fe
b-1
3
Apr-
13
Ju
n-1
3
Vo
l m
Source: Bloomberg
Avg Turnover (THB/USD) 45.7m/1.49m
Cons. Upside (%) 61.0
Upside (%) 42.9
52-wk Price low/high (THB) 7.06 - 23.9
Free float (%) 78
Shareholders (%)
Mr Anutin Charnvirakul 10.1
Thai NVDR 5.9
Mr Suthep Setboonsang 4.8
Shariah compliant
Kowit Pongwinyoo +662 862 9743
License No.18348 [email protected]
Chun Phokaisawan +66 2862 2029
Forecasts and Valuations Dec-10 Dec-11 Dec-12 Dec-13F Dec-14F
Total turnover (THBm) 4,770 1,001 3,140 7,585 10,150
Reported net profit (THBm) 2,021 400 1,090 2,163 2,327
Recurring net profit (THBm) 2,021 400 1,090 2,163 2,327
Recurring net profit growth (%) 56.3 (80.2) 172.8 98.5 7.6
Core EPS (THB) 5.81 1.09 2.96 1.46 1.57
DPS (THB) 3.46 1.31 0.32 0.44 0.47
Dividend Yield (%) 19.0 7.2 1.8 2.4 2.6
Core P/E (x) 3.1 16.8 6.1 12.4 11.6
Return on average equity (%) 70.1 12.6 29.4 42.7 35.0
P/B (x) 2.07 2.16 1.56 4.62 3.61
P/CF (x) 12.8 34.3 2.9 26.3 9.1
EV/EBITDA (x) 1.5 43.1 1.5 8.1 7.4
Net debt to equity (%) net cash net cash net cash net cash net cash
Our vs consensus EPS (%) 0.0 0.0
Source: Company data, RHB estimates
STP&I PCL (STPI) fabricates steel for use in construction and civil works such as seaports, bridges, roads, highways and industrial plants. Recently, it started focusing more on the international market by pushing exports of pre-fabricated structural steels and modules. We project 2013-2014 earnings growth at 98%/8% respectively. Our THB26.00 TP offers a 42% upside. We initiate coverage with a BUY.
High backlog to support FY13/FY14 earnings growth. STPI had a
total backlog of THB23bn at end-1QFY13, comprising two module projects worth THB22bn – Queensland Curtis and Ichthys liquefied natural gas (LNG) projects – and an Australia Pacific piping project worth THB773m. Of the total backlog, we expect the company to realise around THB6.5bn in 2HFY13 and THB10.1bn in 2014, which should lead to robust y-o-y earnings growth of 98% for FY13 and 8% for FY14.
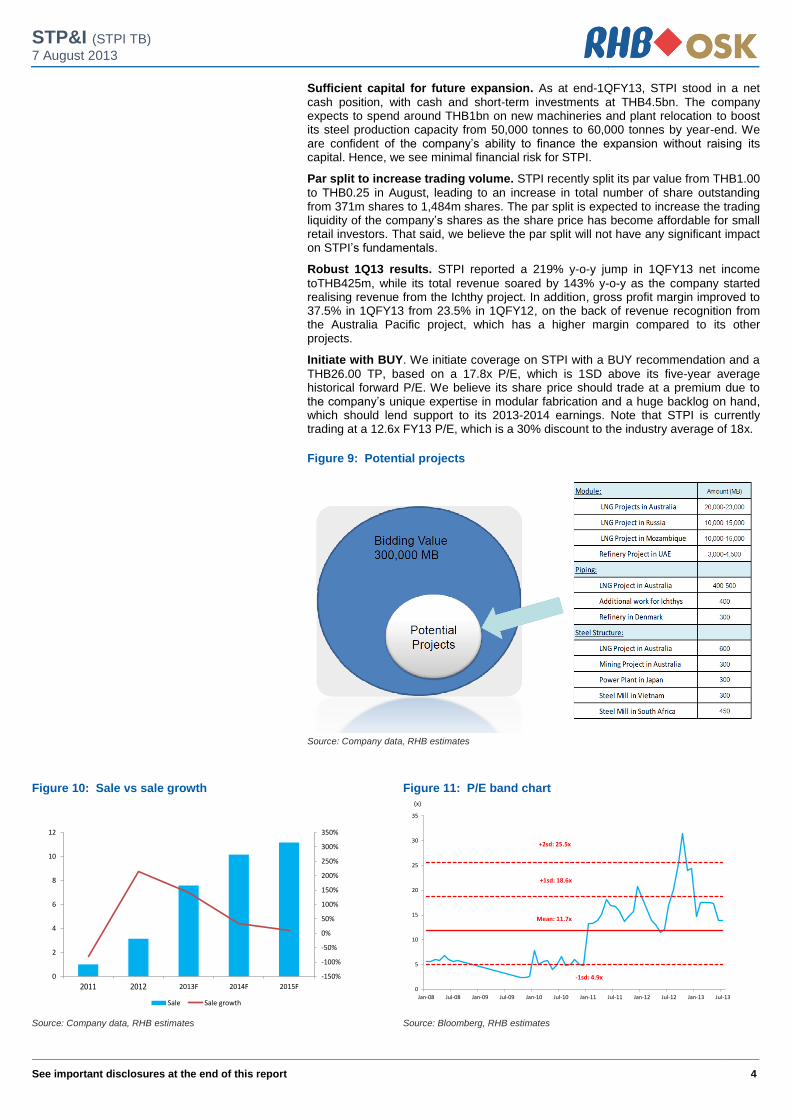
Potential projects. The company is currently bidding for new projects
worth some THB50bn, including the Woodside Pluto LNG projects in Australia worth THB20bn, a THB10bn LNG project in Russia and a THB10bn LNG project in Mozambique. The bidding results for these projects are expected to be announced between 4QFY13 and 2QFY14. These projects, if successfully secured, will support STPI’s FY15 earnings, post the completion of the Ichthys project.
Attractive margins. STPI is Thailand’s biggest exporter of fabricated
steel structures. The industry has high barriers of entry with few players, as new entrants are required to have assembly yards by the sea. Currently, STPI has a higher gross margin of 35% vs the industry average of 10%. We expect the company’s gross margin to be maintained at 35% this year, but decline to around 28% in FY14, after the Australia Pacific piping project – which has a higher margin than module projects – is completed this year.
STP&I (STPI TB)
7 August 2013
See important disclosures at the end of this report 2
Leader In Modular Fabrication Core business. STPI’s core business can be categorised into three groups, namely:
i) engineering services, ii) fabrication, and iii) construction. The company provides engineering services in designing steel-to-steel connections, shop drawing for steel structures, and piping and erection works by various specialised softwares. It also provides fabrication services and has the capability to fabricate steels and pipes in its workshops, which are equipped with state-of-the-art machines and equipment. Lastly, STPI’s construction works include assembly, mechanical equipment installation and erection for various manufacturing plants.
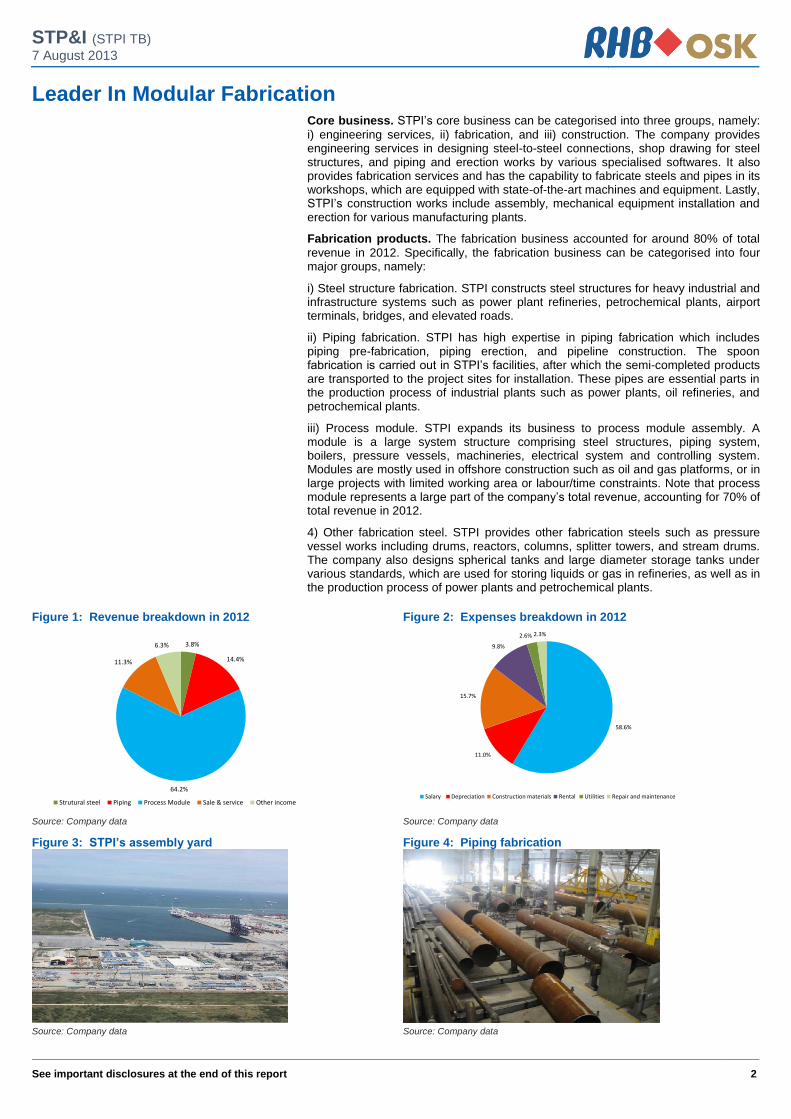
Fabrication products. The fabrication business accounted for around 80% of total
revenue in 2012. Specifically, the fabrication business can be categorised into four major groups, namely:
i) Steel structure fabrication. STPI constructs steel structures for heavy industrial and infrastructure systems such as power plant refineries, petrochemical plants, airport terminals, bridges, and elevated roads.
ii) Piping fabrication. STPI has high expertise in piping fabrication which includes piping pre-fabrication, piping erection, and pipeline construction. The spoon fabrication is carried out in STPI’s facilities, after which the semi-completed products are transported to the project sites for installation. These pipes are essential parts in the production process of industrial plants such as power plants, oil refineries, and petrochemical plants.
iii) Process module. STPI expands its business to process module assembly. A module is a large system structure comprising steel structures, piping system, boilers, pressure vessels, machineries, electrical system and controlling system. Modules are mostly used in offshore construction such as oil and gas platforms, or in large projects with limited working area or labour/time constraints. Note that process module represents a large part of the company’s total revenue, accounting for 70% of total revenue in 2012.
4) Other fabrication steel. STPI provides other fabrication steels such as pressure vessel works including drums, reactors, columns, splitter towers, and stream drums. The company also designs spherical tanks and large diameter storage tanks under various standards, which are used for storing liquids or gas in refineries, as well as in the production process of power plants and petrochemical plants.
Figure 1: Revenue breakdown in 2012 Figure 2: Expenses breakdown in 2012
3.8%
14.4%
64.2%
11.3%
6.3%
Strutural steel Piping Process Module Sale & service Other income
58.6%
11.0%
15.7%
9.8%
2.6% 2.3%
Salary Depreciation Construction materials Rental Utilities Repair and maintenance
Source: Company data Source: Company data
Figure 3: STPI’s assembly yard Figure 4: Piping fabrication
Source: Company data Source: Company data
STP&I (STPI TB)
7 August 2013
See important disclosures at the end of this report 3
Competition in the industry. Competition in the steel fabrication industry is
relatively low as the energy and petrochemical industries are growing rapidly, giving rise to a large amount of fabrication works. Currently, there are only seven key local competitors in the industry. Competition is limited due to the high imported raw material costs and the high standards set by the Thai Industrial Standards Institute (TISI). Domestically, STPI has a 20%-25% share in the steel structure market, with Thai Herrick Company Limited, Eurotech Engineering International Company Limited, and Vatana Phaisal Engineering Company Limited as its major competitors. In the modular fabrication industry, STPI only has three major competitors, namely Thai Nippon Steel Engineering and Construction Company Limited, Clutch Thailand Company Limited, and CULE Company Limited.
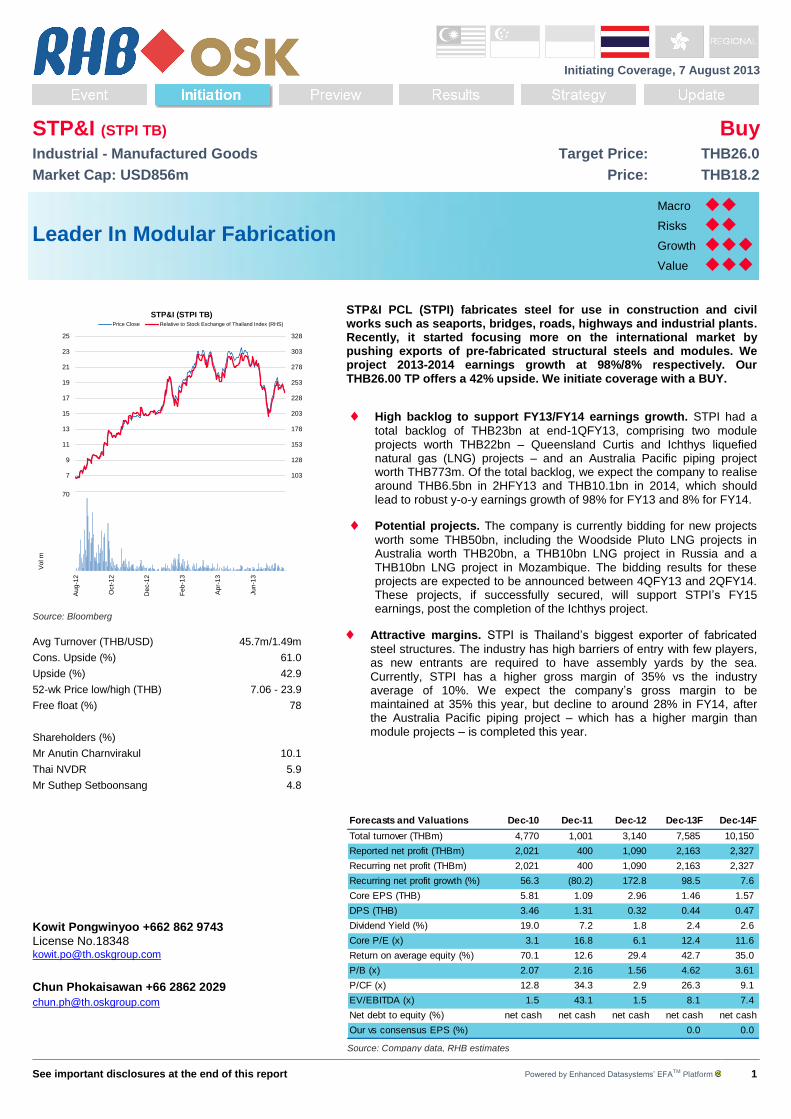
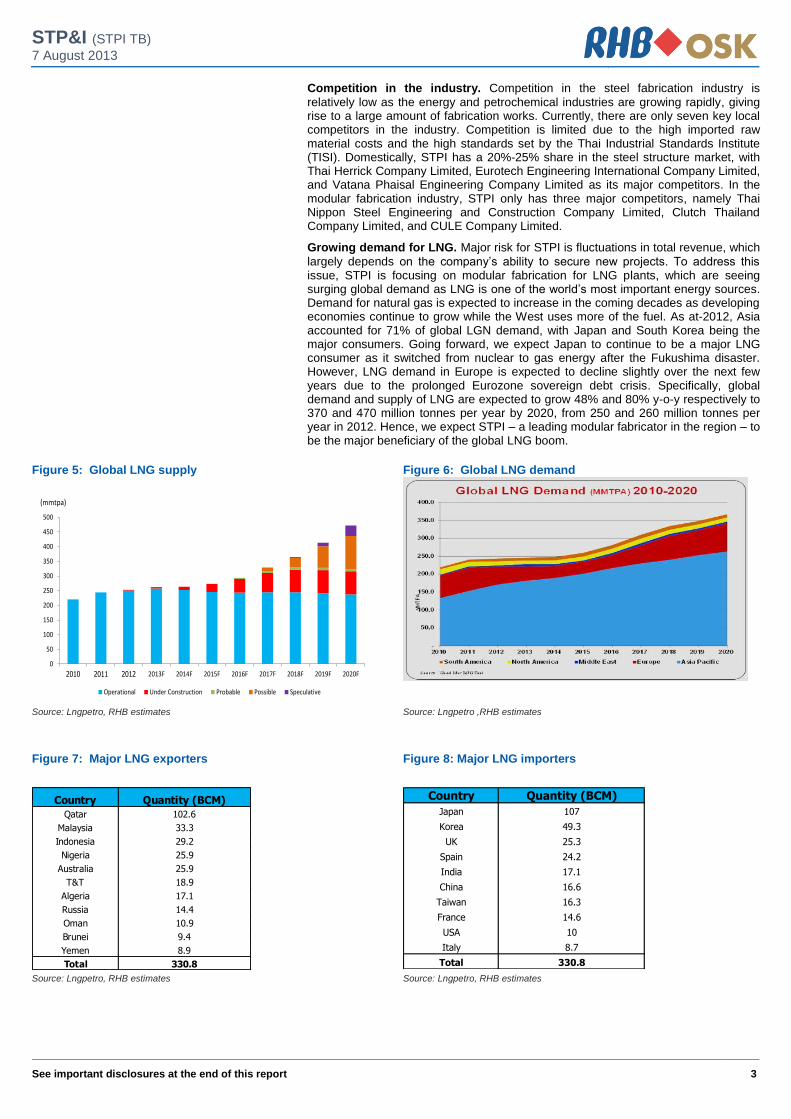
Growing demand for LNG. Major risk for STPI is fluctuations in total revenue, which
largely depends on the company’s ability to secure new projects. To address this issue, STPI is focusing on modular fabrication for LNG plants, which are seeing surging global demand as LNG is one of the world’s most important energy sources. Demand for natural gas is expected to increase in the coming decades as developing economies continue to grow while the West uses more of the fuel. As at-2012, Asia accounted for 71% of global LGN demand, with Japan and South Korea being the major consumers. Going forward, we expect Japan to continue to be a major LNG consumer as it switched from nuclear to gas energy after the Fukushima disaster. However, LNG demand in Europe is expected to decline slightly over the next few years due to the prolonged Eurozone sovereign debt crisis. Specifically, global demand and supply of LNG are expected to grow 48% and 80% y-o-y respectively to 370 and 470 million tonnes per year by 2020, from 250 and 260 million tonnes per year in 2012. Hence, we expect STPI – a leading modular fabricator in the region – to be the major beneficiary of the global LNG boom.
Figure 5: Global LNG supply Figure 6: Global LNG demand
0
50
100
150
200
250
300
350
400
450
500
2013F 2014F 2015F 2016F 2017F 2018F 2019F 2020F
Operational Under Construction Probable Possible Speculative
(mmtpa)
Source: Lngpetro, RHB estimates Source: Lngpetro ,RHB estimates
Figure 7: Major LNG exporters
Figure 8: Major LNG importers
Country Quantity (BCM)
Qatar 102.6
Malaysia 33.3
Indonesia 29.2
Nigeria 25.9
Australia 25.9
T&T 18.9
Algeria 17.1
Russia 14.4
Oman 10.9
Brunei 9.4
Yemen 8.9
Total 330.8
Country Quantity (BCM)
Japan 107
Korea 49.3
UK 25.3
Spain 24.2
India 17.1
China 16.6
Taiwan 16.3
France 14.6
USA 10
Italy 8.7
Total 330.8 Source: Lngpetro, RHB estimates Source: Lngpetro, RHB estimates
STP&I (STPI TB)
7 August 2013
See important disclosures at the end of this report 4
Sufficient capital for future expansion. As at end-1QFY13, STPI stood in a net
cash position, with cash and short-term investments at THB4.5bn. The company expects to spend around THB1bn on new machineries and plant relocation to boost its steel production capacity from 50,000 tonnes to 60,000 tonnes by year-end. We are confident of the company’s ability to finance the expansion without raising its capital. Hence, we see minimal financial risk for STPI.
Par split to increase trading volume. STPI recently split its par value from THB1.00
to THB0.25 in August, leading to an increase in total number of share outstanding from 371m shares to 1,484m shares. The par split is expected to increase the trading liquidity of the company’s shares as the share price has become affordable for small retail investors. That said, we believe the par split will not have any significant impact on STPI’s fundamentals.
Robust 1Q13 results. STPI reported a 219% y-o-y jump in 1QFY13 net income
toTHB425m, while its total revenue soared by 143% y-o-y as the company started realising revenue from the Ichthy project. In addition, gross profit margin improved to 37.5% in 1QFY13 from 23.5% in 1QFY12, on the back of revenue recognition from the Australia Pacific project, which has a higher margin compared to its other projects.
Initiate with BUY. We initiate coverage on STPI with a BUY recommendation and a
THB26.00 TP, based on a 17.8x P/E, which is 1SD above its five-year average historical forward P/E. We believe its share price should trade at a premium due to the company’s unique expertise in modular fabrication and a huge backlog on hand, which should lend support to its 2013-2014 earnings. Note that STPI is currently trading at a 12.6x FY13 P/E, which is a 30% discount to the industry average of 18x.
Figure 9: Potential projects
Source: Company data, RHB estimates
Figure 10: Sale vs sale growth Figure 11: P/E band chart
-150%
-100%
-50%
0%
50%
100%
150%
200%
250%
300%
350%
0
2
4
6
8
10
12
2013F 2014F 2015F
Sale Sale growth
0
5
10
15
20
25
30
35
Jan-08 Jul-08 Jan-09 Jul-09 Jan-10 Jul-10 Jan-11 Jul-11 Jan-12 Jul-12 Jan-13 Jul-13
(x)
-1sd: 4.9x
Mean: 11.7x
+1sd: 18.6x
+2sd: 25.5x
Source: Company data, RHB estimates Source: Bloomberg, RHB estimates
STP&I (STPI TB)
7 August 2013
See important disclosures at the end of this report 5
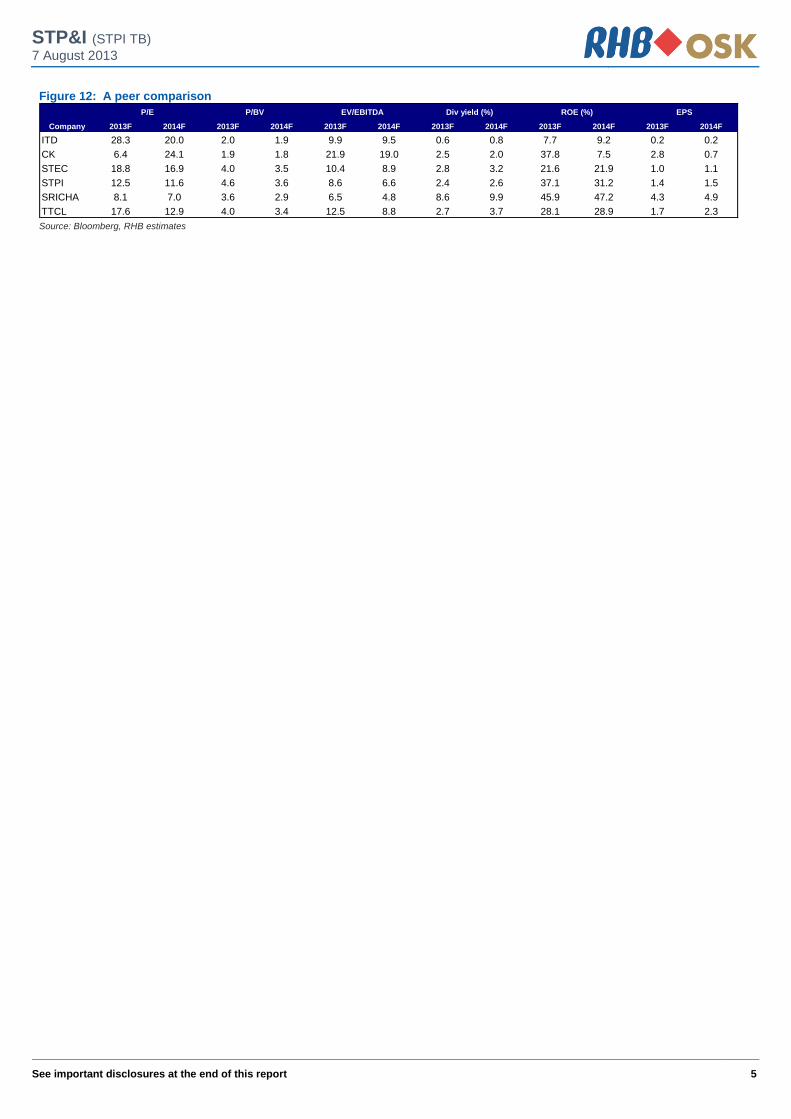
Figure 12: A peer comparison
Company 2013F 2014F 2013F 2014F 2013F 2014F 2013F 2014F 2013F 2014F 2013F 2014F
ITD 28.3 20.0 2.0 1.9 9.9 9.5 0.6 0.8 7.7 9.2 0.2 0.2
CK 6.4 24.1 1.9 1.8 21.9 19.0 2.5 2.0 37.8 7.5 2.8 0.7
STEC 18.8 16.9 4.0 3.5 10.4 8.9 2.8 3.2 21.6 21.9 1.0 1.1
STPI 12.5 11.6 4.6 3.6 8.6 6.6 2.4 2.6 37.1 31.2 1.4 1.5
SRICHA 8.1 7.0 3.6 2.9 6.5 4.8 8.6 9.9 45.9 47.2 4.3 4.9
TTCL 17.6 12.9 4.0 3.4 12.5 8.8 2.7 3.7 28.1 28.9 1.7 2.3
EPSP/E P/BV EV/EBITDA Div yield (%) ROE (%)
Source: Bloomberg, RHB estimates
STP&I (STPI TB)
7 August 2013
See important disclosures at the end of this report 6
Financial Exhibits
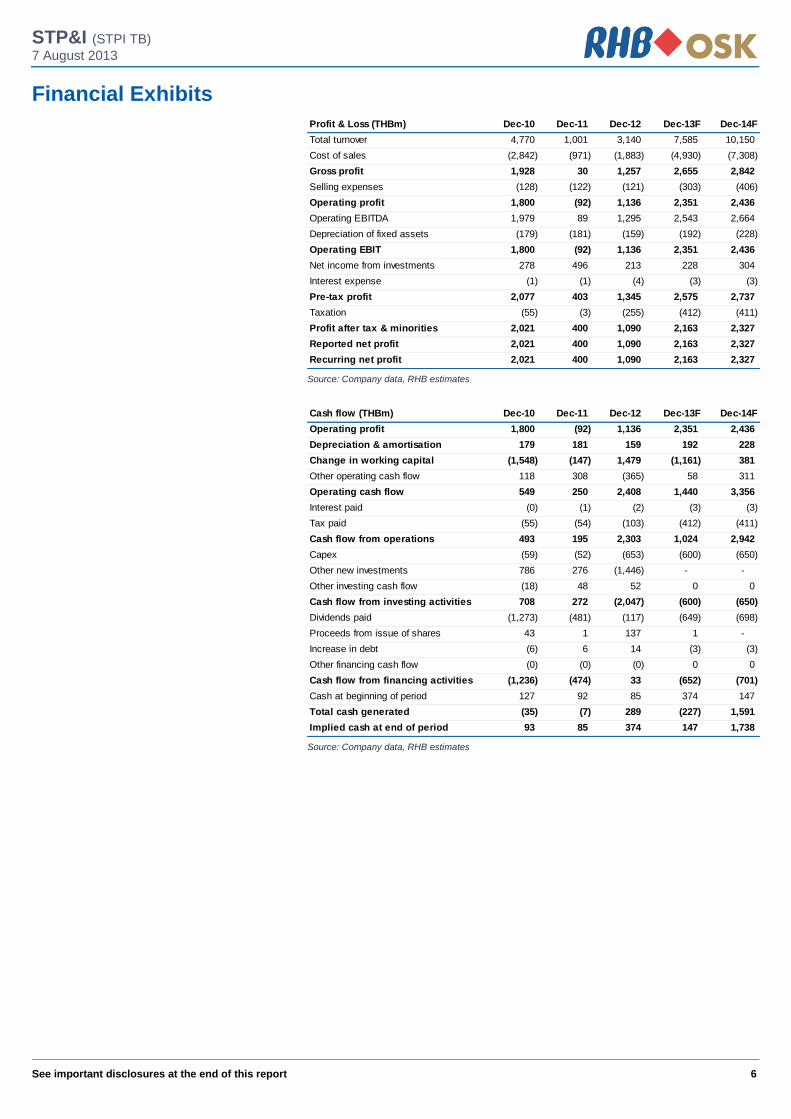
Profit & Loss (THBm) Dec-10 Dec-11 Dec-12 Dec-13F Dec-14F
Total turnover 4,770 1,001 3,140 7,585 10,150
Cost of sales (2,842) (971) (1,883) (4,930) (7,308)
Gross profit 1,928 30 1,257 2,655 2,842
Selling expenses (128) (122) (121) (303) (406)
Operating profit 1,800 (92) 1,136 2,351 2,436
Operating EBITDA 1,979 89 1,295 2,543 2,664
Depreciation of fixed assets (179) (181) (159) (192) (228)
Operating EBIT 1,800 (92) 1,136 2,351 2,436
Net income from investments 278 496 213 228 304
Interest expense (1) (1) (4) (3) (3)
Pre-tax profit 2,077 403 1,345 2,575 2,737
Taxation (55) (3) (255) (412) (411)
Profit after tax & minorities 2,021 400 1,090 2,163 2,327
Reported net profit 2,021 400 1,090 2,163 2,327
Recurring net profit 2,021 400 1,090 2,163 2,327
Source: Company data, RHB estimates
Cash flow (THBm) Dec-10 Dec-11 Dec-12 Dec-13F Dec-14F
Operating profit 1,800 (92) 1,136 2,351 2,436
Depreciation & amortisation 179 181 159 192 228
Change in working capital (1,548) (147) 1,479 (1,161) 381
Other operating cash flow 118 308 (365) 58 311
Operating cash flow 549 250 2,408 1,440 3,356
Interest paid (0) (1) (2) (3) (3)
Tax paid (55) (54) (103) (412) (411)
Cash flow from operations 493 195 2,303 1,024 2,942
Capex (59) (52) (653) (600) (650)
Other new investments 786 276 (1,446) - -
Other investing cash flow (18) 48 52 0 0
Cash flow from investing activities 708 272 (2,047) (600) (650)
Dividends paid (1,273) (481) (117) (649) (698)
Proceeds from issue of shares 43 1 137 1 -
Increase in debt (6) 6 14 (3) (3)
Other financing cash flow (0) (0) (0) 0 0
Cash flow from financing activities (1,236) (474) 33 (652) (701)
Cash at beginning of period 127 92 85 374 147
Total cash generated (35) (7) 289 (227) 1,591
Implied cash at end of period 93 85 374 147 1,738
Source: Company data, RHB estimates
STP&I (STPI TB)
7 August 2013
See important disclosures at the end of this report 7
Financial Exhibits
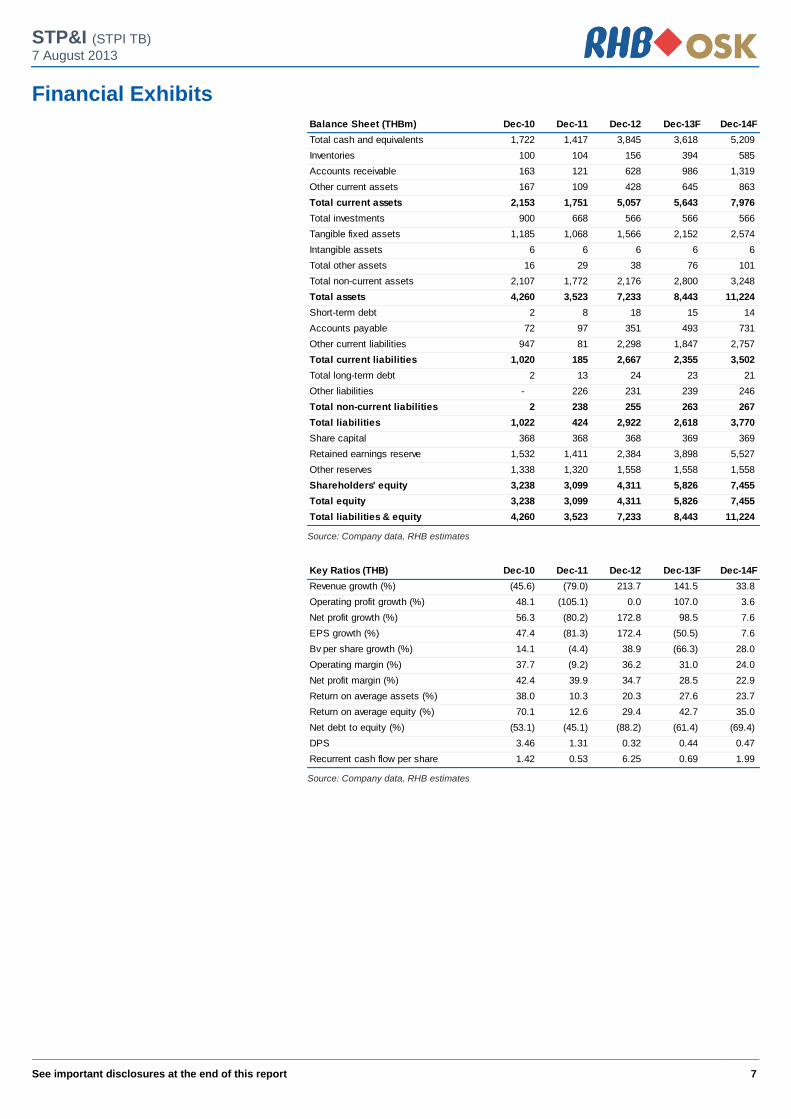
Balance Sheet (THBm) Dec-10 Dec-11 Dec-12 Dec-13F Dec-14F
Total cash and equivalents 1,722 1,417 3,845 3,618 5,209
Inventories 100 104 156 394 585
Accounts receivable 163 121 628 986 1,319
Other current assets 167 109 428 645 863
Total current assets 2,153 1,751 5,057 5,643 7,976
Total investments 900 668 566 566 566
Tangible fixed assets 1,185 1,068 1,566 2,152 2,574
Intangible assets 6 6 6 6 6
Total other assets 16 29 38 76 101
Total non-current assets 2,107 1,772 2,176 2,800 3,248
Total assets 4,260 3,523 7,233 8,443 11,224
Short-term debt 2 8 18 15 14
Accounts payable 72 97 351 493 731
Other current liabilities 947 81 2,298 1,847 2,757
Total current liabilities 1,020 185 2,667 2,355 3,502
Total long-term debt 2 13 24 23 21
Other liabilities - 226 231 239 246
Total non-current liabilities 2 238 255 263 267
Total liabilities 1,022 424 2,922 2,618 3,770
Share capital 368 368 368 369 369
Retained earnings reserve 1,532 1,411 2,384 3,898 5,527
Other reserves 1,338 1,320 1,558 1,558 1,558
Shareholders' equity 3,238 3,099 4,311 5,826 7,455
Total equity 3,238 3,099 4,311 5,826 7,455
Total liabilities & equity 4,260 3,523 7,233 8,443 11,224
Source: Company data, RHB estimates
Key Ratios (THB) Dec-10 Dec-11 Dec-12 Dec-13F Dec-14F
Revenue growth (%) (45.6) (79.0) 213.7 141.5 33.8
Operating profit growth (%) 48.1 (105.1) 0.0 107.0 3.6
Net profit growth (%) 56.3 (80.2) 172.8 98.5 7.6
EPS growth (%) 47.4 (81.3) 172.4 (50.5) 7.6
Bv per share growth (%) 14.1 (4.4) 38.9 (66.3) 28.0
Operating margin (%) 37.7 (9.2) 36.2 31.0 24.0
Net profit margin (%) 42.4 39.9 34.7 28.5 22.9
Return on average assets (%) 38.0 10.3 20.3 27.6 23.7
Return on average equity (%) 70.1 12.6 29.4 42.7 35.0
Net debt to equity (%) (53.1) (45.1) (88.2) (61.4) (69.4)
DPS 3.46 1.31 0.32 0.44 0.47
Recurrent cash flow per share 1.42 0.53 6.25 0.69 1.99
Source: Company data, RHB estimates
STP&I (STPI TB)
7 August 2013
See important disclosures at the end of this report 8
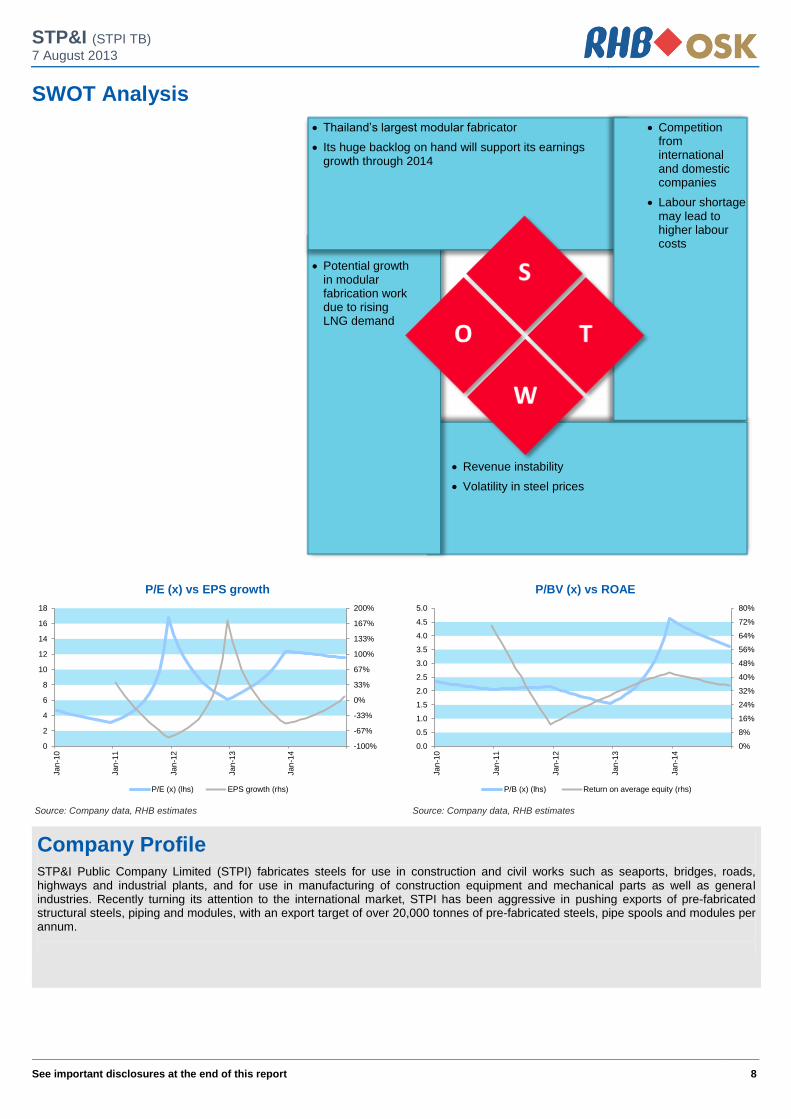
SWOT Analysis
Thailand’s largest modular fabricator
Its huge backlog on hand will support its earnings growth through 2014
Competition from international and domestic companies
Labour shortage may lead to higher labour costs
Potential growth in modular fabrication work due to rising LNG demand
Revenue instability
Volatility in steel prices
-100%
-67%
-33%
0%
33%
67%
100%
133%
167%
200%
0
2
4
6
8
10
12
14
16
18
Jan
-10
Jan
-11
Jan
-12
Jan
-13
Jan
-14
P/E (x) vs EPS growth
P/E (x) (lhs) EPS growth (rhs)
0%
8%
16%
24%
32%
40%
48%
56%
64%
72%
80%
0.0
0.5
1.0
1.5
2.0
2.5
3.0
3.5
4.0
4.5
5.0
Jan
-10
Jan
-11
Jan
-12
Jan
-13
Jan
-14
P/BV (x) vs ROAE
P/B (x) (lhs) Return on average equity (rhs)
Source: Company data, RHB estimates Source: Company data, RHB estimates
Company Profile STP&I Public Company Limited (STPI) fabricates steels for use in construction and civil works such as seaports, bridges, roads, highways and industrial plants, and for use in manufacturing of construction equipment and mechanical parts as well as general industries. Recently turning its attention to the international market, STPI has been aggressive in pushing exports of pre-fabricated structural steels, piping and modules, with an export target of over 20,000 tonnes of pre-fabricated steels, pipe spools and modules per annum.
STP&I (STPI TB)
7 August 2013
See important disclosures at the end of this report 9
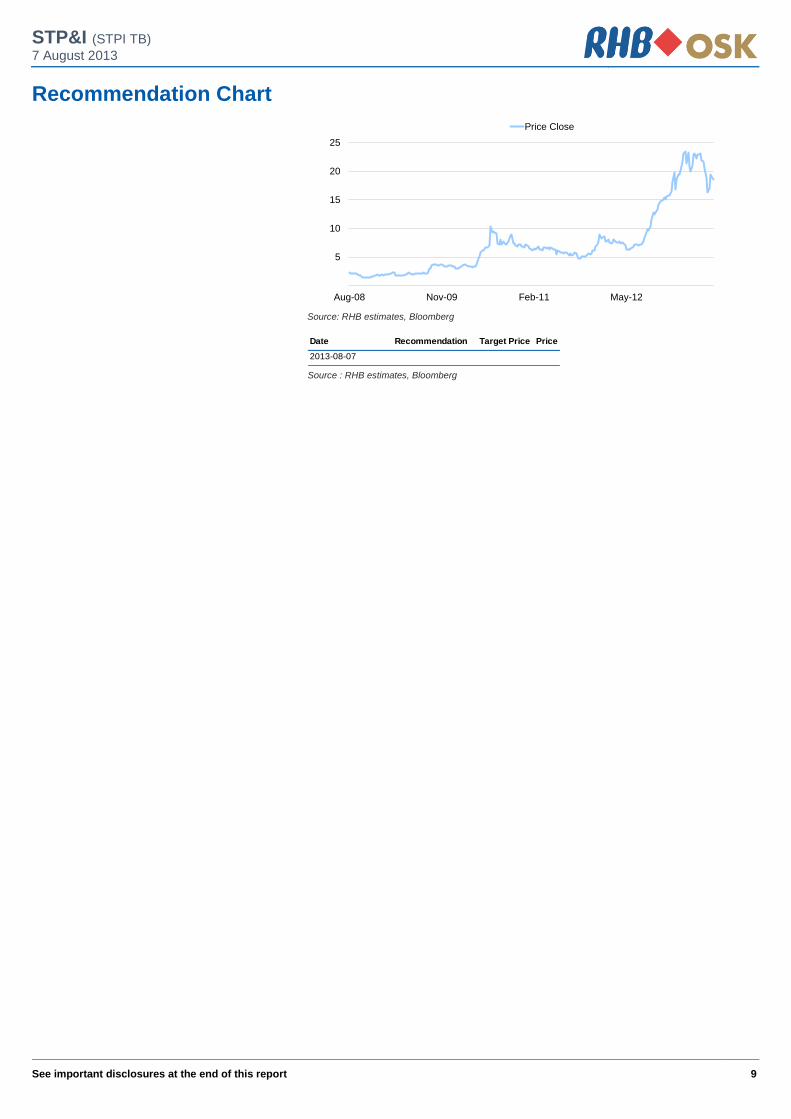
Recommendation Chart
0
5
10
15
20
25
Aug-08 Nov-09 Feb-11 May-12
Price Close
Source: RHB estimates, Bloomberg
Date Recommendation Target Price Price
2013-08-07
Source : RHB estimates, Bloomberg
10
RHB Guide to Investment Ratings Buy: Share price may exceed 10% over the next 12 months Trading Buy: Share price may exceed 15% over the next 3 months, however longer-term outlook remains uncertain Neutral: Share price may fall within the range of +/- 10% over the next 12 months Take Profit: Target price has been attained. Look to accumulate at lower levels Sell: Share price may fall by more than 10% over the next 12 months Not Rated: Stock is not within regular research coverage Disclosure & Disclaimer All research is based on material compiled from data considered to be reliable at the time of writing, but RHB does not make any representation or warranty, express or implied, as to its accuracy, completeness or correctness. No part of this report is to be construed as an offer or solicitation of an offer to transact any securities or financial instruments whether referred to herein or otherwise. This report is general in nature and has been prepared for information purposes only. It is intended for circulation to the clients of RHB and its related companies. Any recommendation contained in this report does not have regard to the specific investment objectives, financial situation and the particular needs of any specific addressee. This report is for the information of addressees only and is not to be taken in substitution for the exercise of judgment by addressees, who should obtain separate legal or financial advice to independently evaluate the particular investments and strategies. RHB, its affiliates and related companies, their respective directors, associates, connected parties and/or employees may own or have positions in securities of the company(ies) covered in this research report or any securities related thereto, and may from time to time add to, or dispose off, or may be materially interested in any such securities. Further, RHB, its affiliates and related companies do and seek to do business with the company(ies) covered in this research report and may from time to time act as market maker or have assumed an underwriting commitment in securities of such company(ies), may sell them or buy them from customers on a principal basis and may also perform or seek to perform significant investment banking, advisory or underwriting services for or relating to such company(ies), as well as solicit such investment, advisory or other services from any entity mentioned in this research report. RHB and its employees and/or agents do not accept any liability, be it directly, indirectly or consequential losses, loss of profits or damages that may arise from any reliance based on this report or further communication given in relation to this report, including where such losses, loss of profits or damages are alleged to have arisen due to the contents of such report or communication being perceived as defamatory in nature. The term “RHB” shall denote where applicable, the relevant entity distributing the report in the particular jurisdiction mentioned specifically herein below and shall refer to RHB Research Institute Sdn Bhd, its holding company, affiliates, subsidiaries and related companies. All Rights Reserved. This report is for the use of intended recipients only and may not be reproduced, distributed or published for any purpose without prior consent of RHB and RHB accepts no liability whatsoever for the actions of third parties in this respect. Malaysia This report is published and distributed in Malaysia by RHB Research Institute Sdn Bhd (233327-M), Level 11, Tower One, RHB Centre, Jalan Tun Razak, 50400 Kuala Lumpur, a wholly-owned subsidiary of RHB Investment Bank Berhad (RHBIB), which in turn is a wholly-owned subsidiary of RHB Capital Berhad. Singapore This report is published and distributed in Singapore by DMG & Partners Research Pte Ltd (Reg. No. 200808705N), a wholly-owned subsidiary of DMG & Partners Securities Pte Ltd, a joint venture between Deutsche Asia Pacific Holdings Pte Ltd (a subsidiary of Deutsche Bank Group) and OSK Investment Bank Berhad, Malaysia which have since merged into RHB Investment Bank Berhad (the merged entity is referred to as “RHBIB”, which in turn is a wholly-owned subsidiary of RHB Capital Berhad). DMG & Partners Securities Pte Ltd is a Member of the Singapore Exchange Securities Trading Limited. DMG & Partners Securities Pte Ltd may have received compensation from the company covered in this report for its corporate finance or its dealing activities; this report is therefore classified as a non-independent report. As of 6 August 2013, DMG & Partners Securities Pte Ltd and its subsidiaries, including DMG & Partners Research Pte Ltd do not have proprietary positions in the securities covered in this report, except for: a) - As of 6 August 2013, none of the analysts who covered the securities in this report has an interest in such securities, except for: a) STP&I Special Distribution by RHB Where the research report is produced by an RHB entity (excluding DMG & Partners Research Pte Ltd) and distributed in Singapore, it is only distributed to "Institutional Investors", "Expert Investors" or "Accredited Investors" as defined in the Securities and Futures Act, CAP. 289 of Singapore. If you are not an "Institutional Investor", "Expert Investor" or "Accredited Investor", this research report is not intended for you and you should disregard this research report in its entirety. In respect of any matters arising from, or in connection with this research report, you are to contact our Singapore Office, DMG & Partners Securities Pte Ltd. Hong Kong This report is published and distributed in Hong Kong by RHB OSK Securities Hong Kong Limited (“RHBSHK”) (formerly known as OSK Securities Hong Kong Limited), a subsidiary of OSK Investment Bank Berhad, Malaysia which have since merged into RHB Investment Bank Berhad (the merged entity is referred to as “RHBIB”), which in turn is a wholly-owned subsidiary of RHB Capital Berhad. RHBSHK, RHBIB and/or other affiliates may beneficially own a total of 1% or more of any class of common equity securities of the subject company. RHBSHK, RHBIB and/or other affiliates may, within the past 12 months, have received compensation and/or within the next 3 months seek to obtain compensation for investment banking services from the subject company.
11
Risk Disclosure Statements The prices of securities fluctuate, sometimes dramatically. The price of a security may move up or down, and may become valueless. It is as likely that losses will be incurred rather than profit made as a result of buying and selling securities. Past performance is not a guide to future performance. RHBSHK does not maintain a predetermined schedule for publication of research and will not necessarily update this report Indonesia This report is published and distributed in Indonesia by PT RHB OSK Securities Indonesia (formerly known as PT OSK Nusadana Securities Indonesia), a subsidiary of OSK Investment Bank Berhad, Malaysia, which have since merged into RHB Investment Bank Berhad, which in turn is a wholly-owned subsidiary of RHB Capital Berhad. Thailand This report is published and distributed in Thailand by RHB OSK Securities (Thailand) PCL (formerly known as OSK Securities (Thailand) PCL), a subsidiary of OSK Investment Bank Berhad, Malaysia, which have since merged into RHB Investment Bank Berhad, which in turn is a wholly-owned subsidiary of RHB Capital Berhad. Other Jurisdictions In any other jurisdictions, this report is intended to be distributed to qualified, accredited and professional investors, in compliance with the law and regulations of the jurisdictions. DMG & Partners Research Guide to Investment Ratings Buy: Share price may exceed 10% over the next 12 months Trading Buy: Share price may exceed 15% over the next 3 months, however longer-term outlook remains uncertain Neutral: Share price may fall within the range of +/- 10% over the next 12 months Take Profit: Target price has been attained. Look to accumulate at lower levels Sell: Share price may fall by more than 10% over the next 12 months Not Rated: Stock is not within regular research coverage DISCLAIMERS This research is issued by DMG & Partners Research Pte Ltd and it is for general distribution only. It does not have any regard to the specific investment objectives, financial situation and particular needs of any specific recipient of this research report. You should independently evaluate particular investments and consult an independent financial adviser before making any investments or entering into any transaction in relation to any securities or investment instruments mentioned in this report. The information contained herein has been obtained from sources we believed to be reliable but we do not make any representation or warranty nor accept any responsibility or liability as to its accuracy, completeness or correctness. Opinions and views expressed in this report are subject to change without notice. This report does not constitute or form part of any offer or solicitation of any offer to buy or sell any securities. DMG & Partners Research Pte Ltd is a wholly-owned subsidiary of DMG & Partners Securities Pte Ltd, a joint venture between OSK Investment Bank Berhad, Malaysia which have since merged into RHB Investment Bank Berhad (the merged entity is referred to as “RHBIB” which in turn is a wholly-owned subsidiary of RHB Capital Berhad) and Deutsche Asia Pacific Holdings Pte Ltd (a subsidiary of Deutsche Bank Group). DMG & Partners Securities Pte Ltd is a Member of the Singapore Exchange Securities Trading Limited. DMG & Partners Securities Pte Ltd and their associates, directors, and/or employees may have positions in, and may effect transactions in the securities covered in the report, and may also perform or seek to perform broking and other corporate finance related services for the corporations whose securities are covered in the report. This report is therefore classified as a non-independent report. As of 6 August 2013, DMG & Partners Securities Pte Ltd and its subsidiaries, including DMG & Partners Research Pte Ltd, do not have proprietary positions in the subject companies, except for: a) - As of 6 August 2013, none of the analysts who covered the stock in this report has an interest in the subject companies covered in this report, except for: a) STP&I DMG & Partners Research Pte. Ltd. (Reg. No. 200808705N)
Kuala Lumpur Hong Kong Singapore
Malaysia Research Office
RHB Research Institute Sdn Bhd Level 11, Tower One, RHB Centre
Jalan Tun Razak Kuala Lumpur
Malaysia Tel : +(60) 3 9280 2185 Fax : +(60) 3 9284 8693
RHB OSK Securities Hong Kong Ltd.
(formerly known as OSK Securities Hong Kong Ltd.) 12th Floor
World-Wide House 19 Des Voeux Road Central, Hong Kong
Tel : +(852) 2525 1118 Fax : +(852) 2810 0908
DMG & Partners
Securities Pte. Ltd. 10 Collyer Quay
#09-08 Ocean Financial Centre Singapore 049315
Tel : +(65) 6533 1818 Fax : +(65) 6532 6211
Jakarta Shanghai Phnom Penh
PT RHB OSK Securities Indonesia
(formerly known as PT OSK Nusadana Securities Indonesia)
Plaza CIMB Niaga 14th Floor
Jl. Jend. Sudirman Kav.25 Jakarta Selatan 12920, Indonesia
Tel : +(6221) 2598 6888 Fax : +(6221) 2598 6777
RHB OSK (China) Investment Advisory Co. Ltd.
(formerly known as OSK (China) Investment Advisory Co. Ltd.)
Suite 4005, CITIC Square 1168 Nanjing West Road
Shanghai 20041 China
Tel : +(8621) 6288 9611 Fax : +(8621) 6288 9633
RHB OSK Indochina Securities Limited
(formerly known as OSK Indochina Securities Limited) No. 1-3, Street 271
Sangkat Toeuk Thla, Khan Sen Sok Phnom Penh
Cambodia Tel: +(855) 23 969 161 Fax: +(855) 23 969 171
Bangkok
RHB OSK Securities (Thailand) PCL
(formerly known as OSK Securities (Thailand) PCL) 10th Floor, Sathorn Square Office Tower
98, North Sathorn Road,Silom Bangrak, Bangkok 10500
Thailand Tel: +(66) 862 9999 Fax : +(66) 108 0999
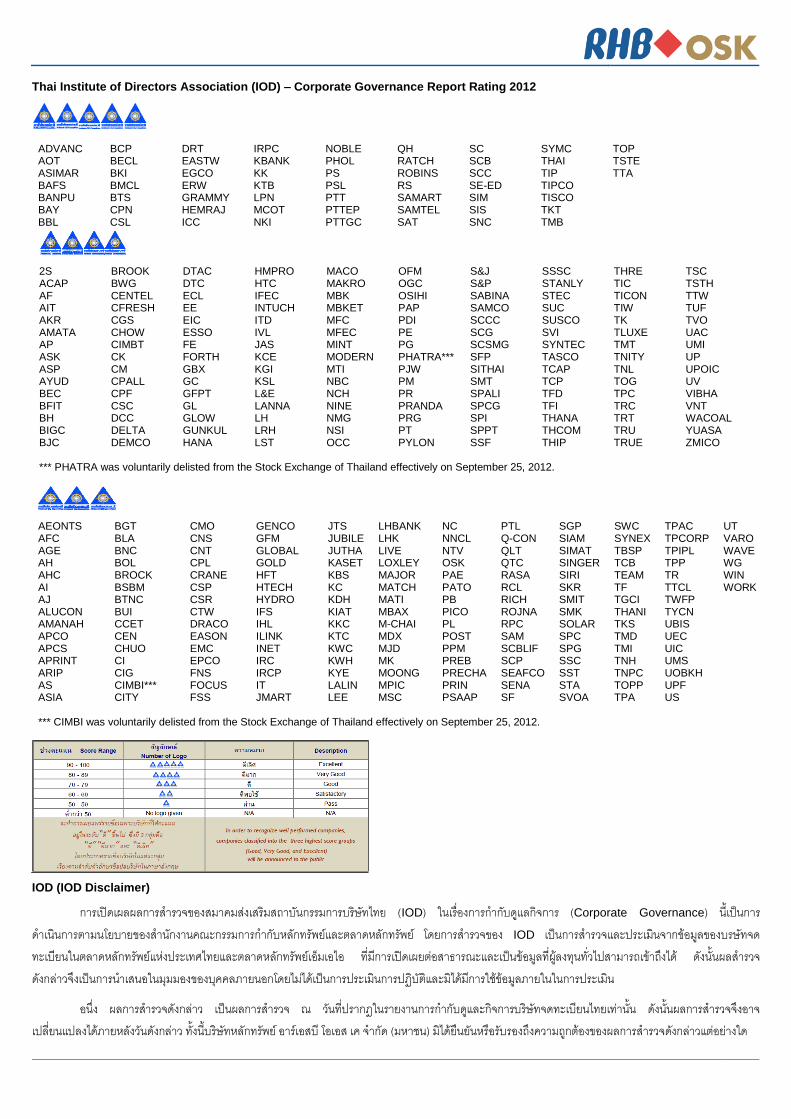
Thai Institute of Directors Association (IOD) – Corporate Governance Report Rating 2012
ADVANC BCP DRT IRPC NOBLE QH SC SYMC TOP AOT BECL EASTW KBANK PHOL RATCH SCB THAI TSTE ASIMAR BKI EGCO KK PS ROBINS SCC TIP TTA BAFS BMCL ERW KTB PSL RS SE-ED TIPCO
BANPU BTS GRAMMY LPN PTT SAMART SIM TISCO BAY CPN HEMRAJ MCOT PTTEP SAMTEL SIS TKT BBL CSL ICC NKI PTTGC SAT SNC TMB
2S BROOK DTAC HMPRO MACO OFM S&J SSSC THRE TSC ACAP BWG DTC HTC MAKRO OGC S&P STANLY TIC TSTH AF CENTEL ECL IFEC MBK OSIHI SABINA STEC TICON TTW AIT CFRESH EE INTUCH MBKET PAP SAMCO SUC TIW TUF AKR CGS EIC ITD MFC PDI SCCC SUSCO TK TVO AMATA CHOW ESSO IVL MFEC PE SCG SVI TLUXE UAC AP CIMBT FE JAS MINT PG SCSMG SYNTEC TMT UMI ASK CK FORTH KCE MODERN PHATRA*** SFP TASCO TNITY UP ASP CM GBX KGI MTI PJW SITHAI TCAP TNL UPOIC AYUD CPALL GC KSL NBC PM SMT TCP TOG UV BEC CPF GFPT L&E NCH PR SPALI TFD TPC VIBHA BFIT CSC GL LANNA NINE PRANDA SPCG TFI TRC VNT BH DCC GLOW LH NMG PRG SPI THANA TRT WACOAL BIGC DELTA GUNKUL LRH NSI PT SPPT THCOM TRU YUASA BJC DEMCO HANA LST OCC PYLON SSF THIP TRUE ZMICO *** PHATRA was voluntarily delisted from the Stock Exchange of Thailand effectively on September 25, 2012.
AEONTS BGT CMO GENCO JTS LHBANK NC PTL SGP SWC TPAC UT AFC BLA CNS GFM JUBILE LHK NNCL Q-CON SIAM SYNEX TPCORP VARO AGE BNC CNT GLOBAL JUTHA LIVE NTV QLT SIMAT TBSP TPIPL WAVE AH BOL CPL GOLD KASET LOXLEY OSK QTC SINGER TCB TPP WG AHC BROCK CRANE HFT KBS MAJOR PAE RASA SIRI TEAM TR WIN AI BSBM CSP HTECH KC MATCH PATO RCL SKR TF TTCL WORK AJ BTNC CSR HYDRO KDH MATI PB RICH SMIT TGCI TWFP
ALUCON BUI CTW IFS KIAT MBAX PICO ROJNA SMK THANI TYCN AMANAH CCET DRACO IHL KKC M-CHAI PL RPC SOLAR TKS UBIS APCO CEN EASON ILINK KTC MDX POST SAM SPC TMD UEC APCS CHUO EMC INET KWC MJD PPM SCBLIF SPG TMI UIC APRINT CI EPCO IRC KWH MK PREB SCP SSC TNH UMS ARIP CIG FNS IRCP KYE MOONG PRECHA SEAFCO SST TNPC UOBKH AS CIMBI*** FOCUS IT LALIN MPIC PRIN SENA STA TOPP UPF ASIA CITY FSS JMART LEE MSC PSAAP SF SVOA TPA US
*** CIMBI was voluntarily delisted from the Stock Exchange of Thailand effectively on September 25, 2012.
IOD (IOD Disclaimer)
การเปิดเผลผลการส ารวจของสมาคมส่งเสริมสถาบันกรรมการบรษิัทไทย (IOD) ในเรื่องการก ากับดูแลกิจการ (Corporate Governance) นี้เป็นการด าเนินการตามนโยบายของส านักงานคณะกรรมการก ากับหลักทรัพย์และตลาดหลักทรัพย์ โดยการส ารวจของ IOD เป็นการส ารวจและประเมินจากข้อมูลของบรษัทจดทะเบียนในตลาดหลักทรัพย์แห่งประเทศไทยและตลาดหลกัทรัพย์เอ็มเอไอ ที่มีการเปิดเผยต่อสาธารณะและเป็นข้อมูลที่ผูล้งทุนทั่วไปสามารถเข้าถงึได้ ดังนั้นผลส ารวจดังกล่าวจึงเป็นการน าเสนอในมุมมองของบุคคลภายนอกโดยไม่ได้เป็นการประเมินการปฏิบัติและมิได้มีการใช้ข้อมูลภายในในการประเมิน
อนึ่ง ผลการส ารวจดังกล่าว เป็นผลการส ารวจ ณ วนัที่ปรากฎในรายงานการก ากับดแูละกิจการบริษัทจดทะเบียนไทยเท่านั้น ดังนั้นผลการส ารวจจึงอาจเปลี่ยนแปลงได้ภายหลังวันดังกล่าว ทัง้นี้บริษัทหลักทรัพย์ อาร์เอสบี โอเอส เค จ ากัด (มหาชน) มิได้ยืนยันหรือรับรองถึงความถูกต้องของผลการส ารวจดงักล่าวแต่อย่างใด