Embed Size (px)
Citation preview

1
Institute of International Finance
Global Economic and Financial Outlook
Highlights
Global Economic Trend of 2011-2015
2011 2012 2013 2014 2015
发达经济体 1.7 1.2 1.4 1.8 2.2
美国 1.6 2.3 2.2 2.2 3.0
英国 1.1 0.3 1.7 3.2 2.8
日本 -0.5 1.5 1.5 0.9 1.0
欧元区 1.6 -0.7 -0.4 0.8 1.0
新兴经济体 6.2 5.1 4.7 4.4 5.0
中国 9.3 7.7 7.7 7.4 7.2
印度 6.6 4.7 5.0 5.6 6.5
俄罗斯 4.3 3.4 1.3 0.2 0.5
巴西 2.7 1.0 2.5 0.3 1.5
全球经济 2.9 2.4 2.5 2.6 3.0
BOC Institute of International Finance
Global Economic and Financial Research
Team
Team leader: Chen Weidong
Deputy leaders: Cao Yuanzheng
Zong Liang
Zhong Hong
Team members: Bian Weihong
Wang Jiaqiang
Liao Shuping
Chen Jing
Xu Yihan
Wang Youxin
Lu Xiaoming
(New York)
Qu Kang
(London)
Contact: Bian Weihong
Tel.: 010-66592776
E-mail: [email protected]
Annual Report 2015 (Issue 21) December 2, 2014
● So far, global economic recovery has been confronted with further
differentiation and insufficient endogenous driving forces. Relaxed
policies and the withdrawal of short-term factors will accelerate
growth in 2015 which, however, will be exposed to potential risks
such as policy differentiation and regional turbulence.
● Fluctuations in global financial markets are influencing different
economies in different ways. The US dollar is expected to be
stronger, but commodities will see downward movements in price.
There will be further divergence in global Bond markets, imposing
higher solvency pressure on emerging markets.
● Global monetary policies are coming to a new watershed. It is
expected that the Federal Reserve (Fed) will kick start the interest
rate increase in the latter half of 2015, while the euro area and Japan
will adopt more easing policies. Policy differentiation will exert
new effects on global capital flows.
● The US will see stronger economic recovery; Europe will face
more difficulties; Japan is expected to be trapped in poor economic
growth; Asian EMs will continue at a speed exceeding the others;
Africa will maintain the momentum of development; Latin America,
on the contrary, is expected to be lackluster.
Developed economies
US
UK
Japan
Euro Area
Emerging economies
China
India
Russia
Brazil
Global economy
%

Global Economic and Financial Outlook
Institute of International Finance BOC 2 Year 2015
A New Inflection Point along Recovery
- Global Economic and Financial Outlook (2015)
The year of 2014 has witnessed continued divergence in global economic recovery, and insufficient
endogenous driving force for economic growth. With patterns of withdrawal of the U.S. Fed’s
quantitative easing policy and more easing policies in Europe and Japan, these have brought
violent fluctuations in the international financial market. Looking to 2015, easing political
environments will continue and the global economy is expected to accelerate in growth with an
absence of shocks in the short-term. However, risks remain arising from policy divergence and
regional turbulence. More specifically, the U.S. will accelerate in growth, the European economy
will be stagnant and Japan will be trapped in poor economic growth. EM Asia will continue at a
speed exceeding all others; Africa will maintain its’ momentum of development; Latin America, on
the contrary, is expected to be lackluster.
I. Global economy: more divergence along recovery, insufficient endogenous
driving force
The global economy has undergone some frustrations since it began to recover in the latter half of
2009. Negative factors in 2014, such as abnormal weather in the US, adjustment of the excise tax
in Japan and sanctions imposed by Europe and the US on Russia, damaged growth. Alongside the
recovery, imbalance in growth rates was demonstrated with Anglo countries (the US, UK, Australia
and Canada) resilient to crisis, but the euro area and Japan were stagnant. EM Asia was energetic;
however, Eastern Europe, Latin America and Middle East were restless. The weak global recovery
should be attributed to, apart from short-term factors, insufficient endogenous driving force.
The demographic dividend is diminishing. Aging population, shrinking labor force and high
post-crisis unemployment rate in developed countries have limited the contribution of human
capital to economic growth. Sluggish structural reforms and the reluctance of numerous young
people and women in Europe and Japan to enter into the labor market are problems beyond the
capability of short-term macro policies. Besides, some EMs, such as China, are facing the turning
point of demographic dividend and are steeped into the “new-norm”.
Capital accumulation is subject to supervision. As a source of economic growth, it has been
significantly restricted since the financial crisis, partially because of weak financial institutions and
poor transmission of monetary policies. More strict supervision on financial sectors has weakened
the support of the financial sector and to the economy in the short-run. Since the crisis occurred,
most countries have suffered from low credit, more severe capital accumulation bubbles through
self-cycling in the financial system, and low efficiency of injecting capital into the real economy.
There has been no signal regarding sufficient technological innovation availability. Technological
innovations that can be translated into productive forces did not emerge after the financial crisis,
failing to boost fixed asset investment and consumption upgrading. Mobile internet was the
continuity of the IT movement, shale gas revolution reduced the global energy price, which has
made up for the decrease of investment in the traditional energy industry, and developed countries
saw recovery of the real estate market with low technological content.
Looking into the future, we project a new inflection point along global economic recovery,
although it is still difficult to resume the pre-crisis average growth rate of 3.4%. Assuming no

Global Economic and Financial Outlook
Institute of International Finance BOC 3 Year 2015
unexpected shocks, the global GDP growth rate may be above 3.0% in 2015, reversing the
declining tendency of lingering on/at 2.5% in the past (Figure 1); the price will maintain stability in
general, but the commodity price will decline and the euro area will be under great pressure of
deflation.
Figure 1: Forecast of global economy Table 1: Growth forecast of major economies.
Source: Institute of International Finance BOC
To be specific, the global economic recovery is strengthened mainly by following elements: (1)
short-term factors impeding economic recovery may be alleviated or disappear. The US, Japan and
euro area will see accelerated economic growth in 2015, which will benefit other countries through
trade (Table 1); (2) major mature economies will continue their easing of monetary policy. Pressure
of financial consolidation on Euro Area countries will be reduced, and the relaxed macro policies
will push economic recovery further. Financing conditions by the capital market will be improved
so as to fill the real economy; (3) despite negative effects on the exporting country, lower
commodity prices helped reduce the trade deficit of the importing country, so as to promote
investment and consumption. It made a contribution, to some extent, to cooperative infrastructure
development, and construction in the Asian-Pacific region which is an important production base;
(4) the global economy progresses towards re-balance. The US, the engine for developed countries,
and China which can represent developing countries, have both made outstanding performances in
adjusting their respective economic structures. “Re-industrialization” and “shale gas revolution” in
the US have become a new source of endogenous driving force and have broken energy restrictions.
China has made considerable progress in adjusting its industrial and distribution structures and
reducing external dependency.
Nevertheless, potential risks exist, and there should be concerns. (1) out-of-control risk of the
Fed’s QE withdrawal pace, exposes EM countries to capital outflow and currency depreciation,
especially those with double deficits and high dependency on external financing; EM Europe may
also be affected by higher yields of the US government bond and exchange rate fluctuations; (2)
Ebola virus control and prevention remains open to doubt and may damage the global economy. So
far, related prevention, treatment and research have produced significant costs. According to
estimates by the World Bank, Ebola prevention and control will cost Africa USD 32billion.
European and American countries will also face considerable outlays in this regard. The total
expenditure is still unpredictable. In the most extreme case, international customs will be closed
due to rampant virus outbreaks, retarding world trade and international investment; (3) geopolitical
0%
1%
2%
3%
4%
5%
6%
2010 2011 2012 2013 2014 2015
2011 2012 2013 2014 2015
发达经济体 1.7 1.2 1.4 1.8 2.2
美国 1.6 2.3 2.2 2.2 3.0
英国 1.1 0.3 1.7 3.2 2.8
日本 -0.5 1.5 1.5 0.9 1.0
欧元区 1.6 -0.7 -0.4 0.8 1.0
新兴经济体 6.2 5.1 4.7 4.4 5.0
中国 9.3 7.7 7.7 7.4 7.2
印度 6.6 4.7 5.0 5.6 6.5
俄罗斯 4.3 3.4 1.3 0.2 0.5
巴西 2.7 1.0 2.5 0.3 1.5
全球经济 2.9 2.4 2.5 2.6 3.0
Quarter-to-quarter growth
2012 2013 2014 2015
发达经济体 1.7 1.2 1.4
1.8 2.2
美国 1.6 2.3 2.2 2.2 3.0
英国 1.1 0.3 1.7 3.2 2.8
日本 -0.5 1.5 1.5 0.9
1.0
欧元区 1.6 -0.7
-0.4 0.8 1.0
新兴经济体 6.2 5.1 4.7
4.4 5.0
中国 9.3 7.7 7.7 7.4 7.2
印度 6.6 4.7 5.0 5.6 6.5
俄罗斯 4.3 3.4 1.3 0.2
0.5
巴西 2.7 1.0 2.5 0.3 1.5
全球经济 2.9 2.4 2.5 2.6
3.0同比
Year-on-year growth
发达经济体 1.7 1.2
1.4 1.8 2.2
美国 1.6 2.3 2.2 2.2
3.0
英国 1.1 0.3 1.7 3.2
2.8
日本 -0.5 1.5 1.5
0.9 1.0
欧元区 1.6 -0.7
-0.4 0.8 1.0
新兴经济体 6.2 5.1
4.7 4.4 5.0
中国 9.3 7.7 7.7 7.4
7.2
印度 6.6 4.7 5.0 5.6
6.5
俄罗斯 4.3 3.4 1.3
0.2 0.5
巴西 2.7 1.0 2.5 0.3
1.5
全球经济 2.9 2.4 2.5
2.6 3.0同比
Developed
US
UK
Japan
Euro area
Emerging
China
India
Russia
Brazil
Global economy
Global Economic and Financial Outlook
Institute of International Finance BOC 4 Year 2015
problems in Eastern Europe may become more complex and remain for a considerable period of
time. Negative economic effects due to the Ukraine crisis on the euro Area and Russia have been
viewed. If the international community fails to establish an effective coordination mechanism, the
conflict in Ukraine is likely to persist, adding endless pressures on the global economy. It is already
reasonable to say that the Ukraine has pushed the confrontation between Western countries and
Russia into a pattern of the “Cold War” again. Such new confrontation and conflict will impose
far-reaching influences on the global political and economic structures.
II. Global financial system: stable but with shadow banking risks
Since the outbreak of the financial crisis, countries have improved the stability of their economic
and financial systems with structural adjustment, such as: European and American banking
industries have cleaned up their balance sheets, strengthened their capital and maintained sound
improvement; European and American countries have tightened macro-prudent supervision over
their banking industries and the credit market, reducing the possibility of a re-occurrence of
systematic risks in the banking industry; the global current account imbalances have been reduced
by 1/3 in 2013 from 2006; and the US and other major countries have seen improvement in their
fiscal deficits and debts. However, the stable condition remains fragile with increasing fluctuations
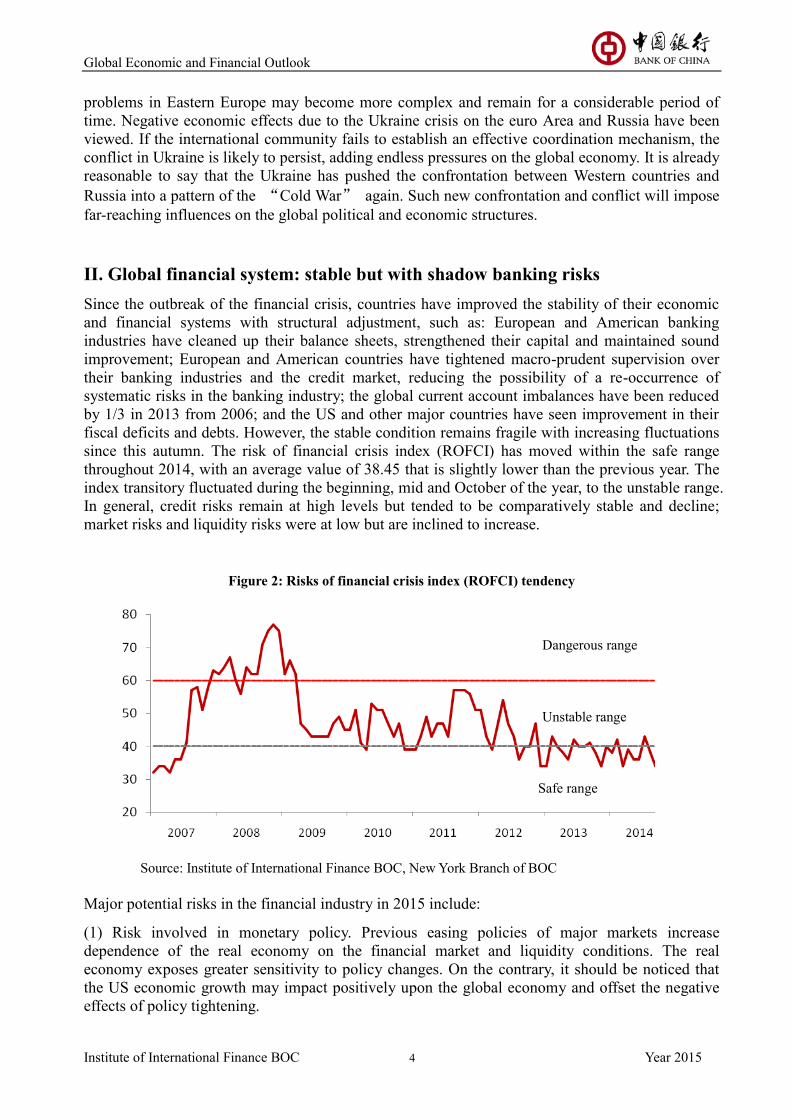
since this autumn. The risk of financial crisis index (ROFCI) has moved within the safe range
throughout 2014, with an average value of 38.45 that is slightly lower than the previous year. The
index transitory fluctuated during the beginning, mid and October of the year, to the unstable range.
In general, credit risks remain at high levels but tended to be comparatively stable and decline;
market risks and liquidity risks were at low but are inclined to increase.
Figure 2: Risks of financial crisis index (ROFCI) tendency
Source: Institute of International Finance BOC, New York Branch of BOC
Major potential risks in the financial industry in 2015 include:
(1) Risk involved in monetary policy. Previous easing policies of major markets increase
dependence of the real economy on the financial market and liquidity conditions. The real
economy exposes greater sensitivity to policy changes. On the contrary, it should be noticed that
the US economic growth may impact positively upon the global economy and offset the negative
effects of policy tightening.
Dangerous range
Unstable range
Safe range

Global Economic and Financial Outlook
Institute of International Finance BOC 5 Year 2015
(2) Shadow banking risks. Sufficient liquidity, prolonging low interest rates, strict supervision on
banks and other factors drive capital flows into non-banking and high-risk assets. The global
shadow banking industry continues to expand its size to USD27 trillion in 2013. Among them, the
proportion of UK’s shadow banking to GDP ratio was twice that of other parts of the world
(Figure 3) In the US, the issuance of CDO, CLO, high-yield corporate bonds, high-leverage loans,
secondary loans and ABS have drastically increased since 2011 to the pre-crisis level. The features
of shadow banking such as high leverage ratio, maturity and liquidity mismatch is likely to induce
systemic risks. The contribution of shadow banking to systematic risks in the US has risen from 23%
in 2009 to 33%, higher than that in other mature markets. The shadow banking industries in
emerging markets, especially in China, have rapidly expanded, although, not like the case in
mature markets, are limited in their domestic market and with little spillover effect.
Figure 3: Size of global shadow banking industry
Source: IMF Financial Stability Report, October 2014.
(3) Risk of vulnerable emerging markets. As the US tightened its monetary policy and appreciated
its currency, capital began to flow out of emerging markets, leading to lower MSCI of such
markets; besides, some emerging markets saw currency depreciation and more fluctuations.
Foreign capital in emerging markets is mostly direct investment with low liquidity. Due to
generally low liquidity, although net capital inflow in such markets will be obstructed, drastic
capital flight is barely possibly. However, we should pay attention to risk transmission caused by
capital outflow in some such markets, which has been demonstrated in the slowing of economic
growth of the market. Capital flight will make the growth even more sluggish through depreciation
of domestic currency, higher interest rates and lower asset prices, thus triggering the outbreak of
another financial crisis. Countries with unstable financial markets, with poor capacity, high
government debt, current account deficits and less dependency on exports are particularly
vulnerable. For example, emerging markets like Turkey, Brazil, India, Indonesia and South Africa
have vulnerabilities too severe to be ignored.
III. Commodity: falling with varying spillover
Since the latter half of 2014, commodity price has drastically dropped to record lows in the past
400
300
200
100
0
US
Other developed markets
Euro area
UK
Emerging markets
2002 2004 2006 2008 2010 2012

Global Economic and Financial Outlook
Institute of International Finance BOC 6 Year 2015
four years. As of November 12, S&P GSCI closed at 528.13, 21.04% down from the highest level
of the year on June 20 and 14.87% lower than the year beginning. Among commodities, energy
prices have experienced the longest drop in the past six years. WTI light oil and ICE Brent crude
oil saw decreases of 21.75% and 27.84% YTD, respectively. Prices of agricultural products and
gold were YTD 7.39% and 5.59% low, respectively (Figure 4).
Figure 4: Commodity GSCI
Source: Bloomberg
Unexpected falls of commodity prices is mainly attributed to the following reasons: firstly, the US
dollar value is proceeding strongly and the interest in the U.S. is expected to rise, take pressures on
commodities which are priced in terms of USD; secondly, stagnant economies in Europe and a
slowdown in China reflect reduced demands for commodities; thirdly, supply of commodities
continued to surge by a combination of factors. For instance, US sales, biological and deep-sea
technology brings burgeoning production on crude oil. OPEC countries have sustained high output
levels despite a weakening price outlook. After reaching the new low for crude oil prices, Saudi
Arabia, Iraq, Iran and Kuwait have reduced the official oil price, indicating that OPEC countries
value market shares more than profits from high prices regarding the new output pattern.
Giving the lackluster condition of the commodity market, hedge funds have cut their positions in
this market, implying the finance attribute pricing of commodities is drawing to a close. According
to CFTC, WTI crude oil long position continued to drop, with non-commercial trade based net
position dropping to the record low for the past one and a half years. According to ICE active
futures of Brent crude oil, as of November 12, 2014, only 44,200 net positions have been managed
by funds. The position was even in short during the fourth quarter.
It is expected that in 2015, commodities will see further price declines. WTI crude oil price will be
no higher than $80/bbl; Brent oil will be at prices between $80-90/bbl. Agricultural products will
bounce back quarter by quarter; gold will stand at the low price of $1,200 per ounce for adjustment;
and the industrial metals will be slightly less expensive.
The falling price of crude oil will not affect the overall situation of shale oil production in the US.
Traditional oil producing countries are now in a dilemma: maintaining the output at low price
levels will lead to lower incomes; however, reducing production may lose market shares. Lower oil
prices may reduce the investment in R&D of new and most costly technologies, thus affecting
future exploration technologies. On the other hand, however, it can also stimulate further

Global Economic and Financial Outlook
Institute of International Finance BOC 7 Year 2015
innovation of the currently mature oil extraction technologies to increase extraction efficiency and
capacity. As a matter of fact, the price of $80/bbl will not hit US shale oil production, since the cost
of shale oil producing ranges from $40/bbl to $90/bbl with an average of $60/bbl. With the current
international price, no profits will be made if each barrel costs over USD80, but the rest will not
been affected.
The slump in crude oil prices affects exporting countries in different ways. Russia was affected
most, while OPEC countries less. Russian public finance depends highly on energy exports, with
oil and natural gas exports contributing almost a half to its fiscal revenue and accounting for 8.9%
of GDP. According to calculations from the Savings Bank of the Russian Federation, the crude oil
price must be maintained at $104/bbl to keep balanced expenditure and income. However, a price
slump will not bring about a collapse of the Russian economy. Russia insists that foreign exchange
reserves and a free floating exchange rate with the ruble can mitigate the effects of a price slump.
Furthermore, the country is capable of standing firm in the case of $80/bbl. Unlike Russia, OPEC
countries export oil to many areas, and they can partially avoid price slum risks through structural
adjustment of the oil price. For example, Saudi Arabia lowered the official price of oil exported to
the US, but increased that for Asian markets.
IV. Global foreign exchange market
IV.1 Stable increasing dollar index
On October 29, 2014, the Federal Open Market Committee announced halting the purchase of new
bonds by November; the Federal fund rate will be maintained in the target range of 0-0.25%; and it
declared strong employment growth, the previous expression of “obviously insufficient utilization
of labor resources”. QE withdrawal drove the dollar index to soar to a new high since July 2010.
After that, the market focus has shifted to the timing and pace of lifting interest rates. Taking into
consideration the hawkish-trend to outcomes in October, the Fed basically maintained the same
stand and it is expected to manage the exit from zero interest rates in the latter half of 2015.
Considering the generally encouraging US economic recovery, international capital flowing back
to the US and the higher expectation for rate increases by the Fed, US dollar will become
increasingly stronger, and the dollar index will grow steadily in the next year (Figure 5).
IV.2 Further depreciation of euro against US dollar
The economic situation in the euro area has been stagnant in 2014 with sustained pressures of
credit and deflation risks and shrinkage of the ECB balance sheet. The economies of the whole
area have experienced downturn pressures, which have brought more burdens to the European
Central Bank to further relax monetary policy. Weak economic fundamentals and loose monetary
policy bore down on the euro exchange rate. As of November 11, the exchange rate of the euro
against the US dollar was 1.2424, down by 9.04% compared with the beginning of the year. In
2014, the euro area will continue to adopt a quantitative easing policy, and may purchase more
bonds, which will malign the euro in the international monetary market. The exchange rate of euro
against US dollar is expected to further slump to below 1.20 (Figure 6).

Global Economic and Financial Outlook
Institute of International Finance BOC 8 Year 2015
Figure 5: USD index Figure 6: Exchange rate of Euro and Yen
Source: Wind Source: Wind
IV.3 Japanese yen depreciation accelerated by Japan’s qualitative and quantitative
monetary easing policy
At the end of October 2014, the central bank of Japan lowered the GDP growth expectation of
2014 to 0.5% from 1% in July. To curb economic development from declining, it announced its
decision on purchasing more financial assets and expanding its QQE policy. The annual
stimulation object for the monetary base has been increased from JPY60-70 trillion to JPY80
trillion, and the purchase of Japan’s government bonds has gone up from JPY50 trillion/year to
JPY80 trillion. The duration of the government bond has been prolonged from four to seven years
to seven to ten years. The Government Pension Investment Fund (GPIF) released the structural
adjustment policy at the same time, to increase the holding of overseas stocks and bonds and hold
less government bonds. QQE expansion was beyond market expectations, and the Japanese yen
was sharply depreciated. The yen index of the day dropped by 2.39%, and the spot exchange of the
Japanese yen against the US dollar increased by 5.46% from 109.23 to 115.19 on November 7.
In 2015, QQE expansion and increased foreign asset position of GPIF will impose more pressure
on the Japanese yen for depreciation. As the Abe Administration may push up the excise tax from 8%
to 10% next October and also consider taking hedge measures concerning monetary policy after
the tax increase, it is expected that the Japanese yen will continue to be depreciated and the spot
exchange rate of JPY against USD will reach about 125.
IV.4 Slight appreciation of RMB exchange rate with fluctuations
Persistent current account surplus, and huge foreign exchange reserves of China, have shielded the
country from US dollar appreciation. No essential changes occurred to the liquidity abundance in
the international market, and it is highly possible for China to become a destination of foreign
capital flow, which will push the RMB to become stronger. As of November 11, 2014, the spot
exchange rate for the RMB against the US dollar was 6.1252, increasing by 1.23% from the
beginning of the year. In 2015, China will enter the “new normal” economic development model,
in which the negative effects of previous stimulation policies will gradually become weaker and
cease to exist, reform bonuses will be gradually released, and the recovery of the real estate market
will substantially re-invigorate related industries. As a major energy importer, China will see a
much higher trade surplus due to the international oil price slump. In general, it is more likely for

Global Economic and Financial Outlook
Institute of International Finance BOC 9 Year 2015
the RMB to appreciate than depreciate, but substantial appreciation in the short term will be poorly
fueled, and the RMB/USD exchange rate will rise slightly through two-way fluctuations (Figure 7).
IV.5 Exchange rate tendency of other currencies
Despite an encouraging recovery in the U.K., worse budgeting and falling international oil prices
have brought pressure on the pound. We can hold an optimistic view for the pound in 2015, but the
relative advantage of US dollars can hardly be offset. With a bleak outlook for the European
economy, it is possible the Swiss Franc will depreciate against the US dollar (Figure 8).
Figure 7: RMB spot exchange rate and NDF Figure 8: Exchange rate of other major currencies
Source: Wind Source: Wind
V. Global bond market
V.1 Divergence of ME’s government bonds, secondary market depth in the US caused
concern
In 2014, the bond market of developed economies generally presented three major features, namely,
declining yields of US and European bonds, further differentiation between the US and Europe and
concern over the secondary market depth. Due to low long-term inflation expectation and lack of
fuel for economic growth, US bonds saw yields falling and a smooth and gradual spread curve.
The yield of major US and European government bonds, which used to be basically the same,
began to vary from each other from 2013. In 2014, the US saw this figure descending, but slower
than that of Germany, further widening the yield gap (Figure 9). That should be attributed to the
greater difference between the US and Europe in terms of economic recovery and monetary policy,
namely, the market expectation for Fed’s QE withdrawal and uncertainties caused by resistance of
core countries in the euro area against the accommodative policies of the European Central Bank.
In 2014, the liquidity in the secondary bond market of the US dropped continuously. Since the
outbreak of the financial crisis, the US bond market has constantly grown from USD32.7 trillion in
2008 to the current USD38.2 trillion, while the daily trading volume has dropped from USD1
trillion in 2007 to the present USD690 billion (Figure 10). Insufficient market fluctuations caused
by low interest rates, plus risk appetite of marketing makers was dampened by strict supervision,
significantly reducing market-making activities. Corporate bonds held by market makers in the US

Global Economic and Financial Outlook
Institute of International Finance BOC 10 Year 2015
have dropped from USD235 billion in 2014 to the current USD60 billion. That implies liquidity
and depth of the US secondary bond markets is now much lower than the pre-crisis level.
Figure 9: Yield of US and European 10-year
government bonds
Figure 10: Size and trading volume of the US bond
market
Source: Wind, IIF
In 2015, the US will maintain the current economic fundamentals, tighten monetary policies as
scheduled, and maintain a smooth yield curve for government bonds. There is faint possibility for
further differentiation in monetary policies between the US and euro area, and the government
bond yield difference will remain unchanged or be narrowed consequently. Close attention should
be paid to the liquidity indicator of the US secondary bond market, considering the huge possibility
of an interest rate increase by the Fed in 2015. An excessively fast bond yield increase will lead to
a fire sale, and insufficient depth makes a liquidity crunch highly possible, causing systematic risks
that can by no means be ignored.
V.2 High issuing but big repayment pressure on EM’s bonds
The year 2014 has experienced a decrease of the bond market followed by a rise in emerging
markets. The JP Morgan Emerging Market Bond Index (EMBI) yield dropped from over 6% in the
year beginning to the current 5.8%. Affected by the expectation for an interest rate increase by the
Fed, the spread between EMBI and the US government bond yield has bounced back from the
lower level in the mid-year to the current value of over 300 base points (Figure 11).

Global Economic and Financial Outlook
Institute of International Finance BOC 11 Year 2015
Figure 11: Government bonds spread tendency of emerging economies and the US.
Index, bps
Source: Bloomberg
The bond market of emerging economies presents the following features in 2014:
Firstly, bond issues reached to a new high. The prolonged low interest rate in the global market,
climbing asset prices and low fluctuations, lead to investment needs for high risk premium assets,
and stimulated the issuing of EM bonds. The issuing of non-financial corporate bonds in emerging
economies has maintained the trend of fast growth since 2010, and reach a YTD USD4.5 trillion
figure. The proportion of corporation bonds in GDP of some emerging countries, though lower
than that of developed countries, has been close to 100%.
Secondly, violent fluctuations in trading spread became normal. Due to a prolonged lack of
liquidity in the secondary market, the spread of trading in the secondary bond market of emerging
economies has increased from the pre-crisis two to four base points, to the current seven base
points. Despite sharp fluctuations, the spread still was as high as six to eight base points in 2014,
indicating that the spread of trading in violent fluctuations has basically become normal.
In 2015, the bond market of emerging economies will be mainly affected by monetary policy
change of developed countries. As the Fed will manage to lift the interest rate, global liquidity will
be changed, bringing with it considerable pressure regarding debt service to companies with
excessive leverage in some emerging economies. Besides, similar to the situation in developed
countries, insufficient liquidity in the secondary bond market of emerging economies may cause
systematic risks, which are worth close attention.
VI. Global monetary policies
VI.1 At diverging stages of global monetary policy
In 2014, since countries are in different stages of recovery, global monetary policy is becoming
complicated. “Divergence” has become a keynote. Mature economies have broken their
synchronized easing policies. New Zealand took the lead with raising the interest rate, the Fed

Global Economic and Financial Outlook
Institute of International Finance BOC 12 Year 2015
completely concluded QE, the US and the UK intended to change their interest rate policy, The
European Central Bank adopted a negative interest rate, which has never been seen before, and the
central bank of Japan purchased more assets. Likewise, emerging economies have varied monetary
policies. Countries like Russia and Brazil increased consecutively their interest rates and
intervened in the foreign exchange market to counter pressure of inflation and currency
depreciation, while Chile, Turkey, Hungary and some other countries lowered the benchmark
interest rate to assist stimulating economic growth.
Behind differentiation of policies are differences in the economic and financial structure. The
ultimate goals of the monetary policy include sufficient employment, stable commodity prices and
better economic growth and balance of payments. Through years of practice and evolution, central
banks of developed economies have usually targeted only or primarily stable commodity prices,
while those in emerging economies take multiple goals in consideration. Indeed, such goals may
change. Especially during a crisis, the monetary policy usually focuses more on economic growth
or employment, and sometimes on financial stability with forward-looking guidance. For example,
the Fed included employment promotion into the goal of its monetary policy at the end of 2012,
and used the unemployment rate as an indicator linked with forward-looking guidance, to provide a
new theoretical basis for continuing the monetary easing policy.
The aforementioned goals must be realized through proper monetary policies, including regular
and irregular tools. The financial system of developed economies was hit immediately when the
global financial crisis erupted. To counter the crisis, major central banks used regular tools like
interest rate cuts, which failed to effectively stimulate economic recovery. In this case, numerous
irregular measures played a vital role, especially quantitative tools including such overall policies
as general quantitative easing and structural policies like “Operation Twist” and directed credit (e.g.
Funding for Leading Scheme in UK).
Underlying the policy and tool differences, different goals regarding monetary policy are the
apparent reason. However, varying economic conditional and financial structures are indeed the
base. In general, the US, UK and other economies, with direct financing as the mainstay, smooth
transmission of the interest rate and high independence of the central bank, usually affect the rate
expectation. This has been achieved by adjusting the benchmark interest rate or the turnover of
government bonds, and take quantitative easing measures only when the economy is weak and falls
into the liquidity trap. On the contrary, the euro area, Japan and other economies with indirect
financing taking the dominance, division of the financial market and lack of interest rate elasticity,
usually affect the bank’s liquidity by direct credit expansion and crunch. Canada, Australia and
some other countries take the benchmark interest rate adjustment as the major tool, since their
banking industry takes a very high proportion and little hit by the financial crisis, and the interest
rate policy still works.
Table 2: Monetary policy goals of central banks in major developed economies
Major Central
Banks Policy goal Latest economic indicators in 2014
Fed Full employment+ Stable
commodity price (2%)
GDP 3.5% (Q3); unemployment rate 5.8% (October); CPI
1.7% (September)
EUROPEAN
CENTRAL
BANK
Price increase rate slightly
lower than 2%
GDP 0.2% (Q3); unemployment rate 11.5% (September);
CPI 0.4% (October)
CENTRAL
BANK OF UK Price increase rate 2%
GDP 3.0% (Q3); unemployment rate 2.6% (October); CPI
1.2% (September)

Global Economic and Financial Outlook
Institute of International Finance BOC 13 Year 2015
CENTRAL
BANK OF
JAPAN
Price increase rate 2%+QQE GDP -1.6% (Q3);unemployment rate 3.6% (September);
CPI 3.2% (September)
CENTRAL
BANK OF
CANADA
Price increase rate 2%
+Floating exchange rate
GDP 2.45% (Q2); unemployment rate 6.5% (October); CPI
2.11% (September)
CENTRAL
BANK OF
SWITZER-
LAND
Price increase rate below 2% GDP 0.58% (Q2); unemployment rate 3.1% (October); CPI
0% (October)
RESERVE
BANK OF
AUSTRALIA
(Mid-term goal) Price increase
rate 2%-3%+Full employment
+ Economic boom+ People’s
wellbeing
GDP 3.1% (Q2); unemployment rate 6.24% (October); CPI
2.3% (Q3)
RESERVE
BANK OF
NEW
ZEALAND
(Mid-term goal) Price increase
rate 1%-3%
GDP 3.5% (Q2); unemployment rate 5.4% (Q3); CPI 1.0%
(Q3)
Note: Quarter-on-quarter annualized rate at constant price for GDP of the US, Europe, Japan and UK,
year-on-year rate at constant price for GDP of Canada, Swiss, Australia and New Zealand.
Source: Wind, central banks of different countries, classified by the author
VI.2 Divergence will be retained in 2015, interest rate upward movements elevating concerns.
In 2015, with an unstable engine for sustainable recovery of the global economy, some countries
will continue their accommodative policies, but policies of different countries will vary even more.
Due to low inflation in the euro area and Japan, their central banks are expected to provide more
liquidity to the market. The asset purchase program of European Central Bank will last for at least
two years, aiming at activating the credit market and rebuilding confidence of companies and
consumers. Mario Draghi once said that this program will restore the balance sheet of the European
Central Bank to the level at the beginning of 2012. According to this estimation, EUR1 trillion will
be added to the balance sheet through the purchase of asset-backed securities (ABS) and covered
bond and the Targeted Longer-term Refinancing Operations (TLTRO). The central bank of Japan
will continue the current QQE policy. The US and the UK, based on a gradual and optimistic
estimation of inflation and employment, will carefully adjust their interest rate policies according
to the market situation, and are expected to start rate increases no sooner than mid2015. Some
emerging countries will be affected in terms of the exchange rate and financial market by
uncertainties accompanying the aforementioned differentiation among developed countries, and
will be confronted with more challenges of the monetary policy. For example, Russia will continue
to increase the interest rate so as to curb inflation and ruble depreciation. India, Indonesia and other
countries highly depending on foreign capital will strengthen capital regulation to prevent capital
outflow and an asset price slump caused by the Fed’s rate increase. Some commodity exporters in
the Middle East and Latin America will relax their monetary policies to counter the pressure of
economic downturns.
Expectation for an interest rate increase affected global capital flow. Recent years saw a great deal
of international capital flow into emerging markets under the effect of accommodative monetary
policies of developed economies. Among others, the spillover effect of Fed’s QE policy was an
important trigger of international capital flow. As shown by IFF’s research, every time when the
Fed accounted the QE policy, a large amount of capital flowed into emerging markets. The capital
inflow to emerging economies was slowed in May 2013 when the Fed declared the possibility of

Global Economic and Financial Outlook
Institute of International Finance BOC 14 Year 2015
reducing asset purchases (Figure 12, Figure 13).
At present, QE has been officially withdrawn, and rate increase has been put on the agenda.
Considering the global importance of the US dollar and the size of the capital market and fund
management in the US, the negative effects of future rate change on emerging markets can by no
means be taken lightly. Fortunately, some such effects will be offset by the accommodative
monetary policy adopted by central banks of Europe and Japan. In general, capital inflow to
emerging economies was maintained in 2014 at the same level as in the previous year.
Figure 12: Capital flow of emerging markets Figure 13:Fed’s QE and capital flow of emerging
markets
Unit: USD1 billion
Unit: USD1 billion; t=0 indicating the start of QE
Source: IIF
In 2015, expectation for the Fed’s interest rate increase will significantly affect the global capital
flow, intensify capital fluctuation and shock some economies as a result. Among such possibly
affected economies, Brazil, Indonesia, Russia, South Africa and Turkey are less capable of
resisting external risks and will thus be exposed to comparatively high overall risks, due to severe
current account deficits, excessive credit growth and high involvement of foreign investors in local
bond markets.
VII. Specific regions and countries
VII.1The United States
2014 has been an important year for the US economic recovery, since it contains endogenous
momentum of sustained economic expansion and is on track for stable growth. Balance sheets of
both households and companies have basically become healthy. The household monthly average
liabilities and expense/disposable income ratio dropped to below 10% in 2014, the lowest level
ever. The total corporate after-tax profits increased by 9.67% annually on average in this year to
reach a record high; the demand deposits and the total amount of cash hit a record high with the
annual average growth rate of 27.8%, accounting for 9% of all assets. Investors regained their
confidence, as the total demand was improved and economic policies became more certain in 2014.
Corporate investment in software and equipment increased rapidly and even faster than the total
fixed asset investment, and companies have been preparing for production expansion. Among all
driving forces, stable consumer expenditure and accelerated investment in non-housing fixed assets
with the proportion growing from 10.9% during the economic recession to 12.2%, provided more

Global Economic and Financial Outlook
Institute of International Finance BOC 15 Year 2015
impetus for sustained GDP growth.
The US public finance has been much improved. Along with increasing fiscal income, fiscal
deficits dropped from the highest level 10% to 2.8% in 2014, lower than the average value for
recent 40 years, and government expenditure made a strong and positive contribution to GDP,
instead of a negative or weak positive contribution as in previous years.
The following leading economic index shows that the US will maintain moderate growth in 2015
(Figure 14).
Figure 14: Conference Board leading economic index and coincidence index (the year 2004=100)
Source: The Conference Board
Firstly, the average working hours per week, in the manufacturing industry climbed to 42.1 in 2014
from the lowest 39.3, establishing a new record; furthermore, the number of new applicants
seeking unemployment payments each week steadily dropped to below 300,000 in 2014, which is
close to the lowest level in the history, implying a sustained employment increases.
Secondly, ISM manufacturer new order index was in the expansion range in 2014 and exceeded the
historical value average; the manufacturer new order index of consumer goods reached a record
high and has maintained this soaring momentum recently. What is more, the manufacturer new
order index of non-national-defense capital goods has also broken previous norms to establish a
new record and has been dramatically rising more recently. All these show an obvious expansion
tendency of the manufacturing industry.
Thirdly, the increasing credit leading indicator in 2014 indicates possibly stronger support of credit
for future economic growth.
Fourthly, the consumer confidence index rebounded, albeit in a limited way through fluctuations,
and stood at 85, lower than the historical average value, implying constant but limited consumer
expenditure expansion in the US.
Fifthly, the Conference Board leading economic index has in large part maintained the momentum
of increase since the recovery began, but was still below the pre-recession highest level.
Both fundamental factors and the latest leading index indicate the possibility of faster US
economic growth, and the US economy will enter a stage of almost overall recovery and
comparatively stable growth. The US is expected to see its unemployment rate drop to 5.4% and
real GDP growth rate ascend to about 3.0%, and then to embrace a stage of stable growth.
110
100
90
80
0
Coincidence index
Leading economic index
2000 2002 2004 2006 2008 2010 2012 2014
110
100
90
80
0

Global Economic and Financial Outlook
Institute of International Finance BOC 16 Year 2015
VII.2 Europe
The euro area will brook a weak recovery which may take a moderate pace in 2015. The adjusted
quarter-to-quarter GDP growth rate in the third quarter of 2014 was 0.2%, slightly higher than 0.1%
in the second quarter. The year-on-year increase in the third quarter stood at 0.8%, the same as that
of the previous quarter. At present, the unemployment rate of this area is as high as 11.5%, slightly
higher than 11.7% at the beginning of the year, and the inflation rate is only 0.4% (Figure 15).
Figure 15: Major economic indicators for the euro area
Source: Eurostat
Economic recovery in the euro area remained weak, maybe mainly because of the poor growth of
industrial production. In 2014, the industrial production (not including the construction industry)
made an insufficient contribution to economic development of the region, and particularly impeded
the economic growth of Germany where the manufacturing industry plays a major role. In terms of
demand, private consumption remained low, but investment improved and increased at a rate
unsurpassed during past three years. The external demand, as insufficient as it was, became the
major reason for economic stagnation in Germany, since it caused a consecutive export slump of
manufactured goods.
A recently downward movement in the price of crude oil has helped the recovery of this region, as
it lowered costs. Although it dampened the effects of European Central Bank’s inflation stimulation
measures, the low inflation rate of this area has provided a sound foundation for further
accommodative monetary policy.
The European Central Bank embarked on a bond purchase program since October to further
expand its balance sheet and prevent the inflation rate from getting lower. Along with the
completion of the stress testing and asset quality appraisal for European banking industry, the
differentiation in the financial sector will be effectively restrained, and banks will be encouraged to
gradually increase credit. In addition, the euro area seemed to relax its fiscal policy. The European
Union has approved the fiscal budgets of Italy and France whose fiscal deficits in 2015 are much
above the level stipulated in EU Fiscal Compact framework.

Global Economic and Financial Outlook
Institute of International Finance BOC 17 Year 2015
The euro area has been confronted with influences and challenges from US monetary policy. The
Fed has concluded the asset purchase program in QE3 as scheduled, and begun to normalize its
interest rate, while the European Central Bank is still under pressure for adopting a more
accommodative monetary policy.
In 2015, a weaker euro and gradual stable growth of the German economy, will fuel the economic
recovery of the euro area. However, it will remain weak, due to factors like considerable restraints
in terms of the fiscal policy, high unemployment figures, insufficient credit from banks and
geopolitical risks (especially the Ukraine crisis). The European Central Bank’s new stimulation
policies will yield tangible effects in 2015. If economic indicators in the first quarter of 2015 are
unsatisfying, euro area countries may reach agreement to intensify such stimulation measures, like
complete quantitative easing policy and the purchasing of government bonds of member states of
the euro area. In brief, we think the euro area will maintain a moderate pace of recovery in 2015.
The UK: stable growth with an emphasis on sustainable development. Stable growth in 2014
has laid a more solid foundation for UK’s recovery. With the quarter-on-quarter GDP growth rate
of 0.7% in the third quarter of 2014, UK has maintained positive growth for seven consecutive
quarters, making the longest growth period since the financial crisis outbreak in 2008. The
year-on-year GDP growth rate in the third quarter stood at 3%, the same as the average level from
1997 to 2007. Its unemployment rate dropped to 6%, getting close to the pre-crisis level.
Furthermore, the UK's inflation rate continued to decline in 2014 and maintained a low level since
the crisis (Figure 16). Despite all these indicators, the country maintained the record-low
benchmark interest rate of 0.5%, and continued its quantitative easing policy.
Figure 16: Change of UK’s major economic indicators
Source: Office of National Statistics
In terms of major sectors driving the economic recovery, private consumption and investment
pulled the economic growth of the UK, as indicated by significant improvement of consumer
confidence and retail index. Due to insufficient external demand and especially the sluggish
economic growth in the euro area, the net export made a limited contribution to the UK’s economy.
The increasing fiscal deficits prevented the government spending and playing a role in pulling
economic growth.
Among all industries, the service industry grew faster than the manufacturing and construction
industries. The output of the former in 2014 has exceeded the pre-crisis level, and that of the latter
industries was also increasing but far below the pre-crisis level. In 2014, the producer price index

Global Economic and Financial Outlook
Institute of International Finance BOC 18 Year 2015
dropped and effectively supported the recovery of the manufacturing industry, but the growth
potential of the manufacturing industry was handicapped by the weak economic development and
demand in the euro area. The construction industry showed an upward momentum but its
development in the latter half of 2014 allowed for no optimism, as its year-on-year growth rate
dropped by 0.3% in August, the first negative growth since May 2013. Despite strong growth, the
housing construction industry will be affected by the cooling of housing prices in the UK.
The average remuneration kept declining in 2014, despite the good recovery momentum and
falling unemployment rate. Besides, house prices grew much faster than the residents’ income. The
UK’s real estate market has begun to cool down after several years of rapid growth; in particular,
the quarter-on-quarter growth rate of the housing price in London began to decline.
The year 2015 will possibly see a turning of the UK’s monetary policy. As the country provides a
more solid foundation for its economic growth, a gradual interest rate increase is highly possible to
maintain sustainable economic development, which will enhance lending costs, affect people’s
enthusiasm in consumption and commercial activities, and further cooling down of the real estate
market. Private consumption will become the most important driving force for growth. Along with
a falling unemployment rate, the current labor abundance will change. Actual wage growth will
begin to increase in 2015, to further stimulate personal spending and support the sustainable
development of the real estate market. Almost all real-estate-related crises are caused by late
market intervention to the cooling process. The fact that the UK’s real estate market has begun to
cool down now shows the market can develop in a sound and sustainable way.
VII.3 Japan
As Abenomics has been applied in more sectors, the Q1 2014 Japanese real GDP growth rate
reached 1.6%, and then was hit by a rising excise tax. The real GDP shrank by 1.8% in the second
quarter and maintained this negative growth (about -0.4%) in the third quarter due to a slow upturn
of individual consumption and insufficient investment potential in corporate equipment. Despite
slowing and declining growth rate, the GDP saw a more severe drop than expected. The growth
rate of the third quarter is an important base for Abe Administration to determine whether to
increase the excise tax from 8% to 10% in October 2015. Therefore, the unexpected shrinking
pushed the government to postpone the excise tax increase. Bad weather and natural disasters in
the summer handicapped Japan’s economic development. When such factors receded, the country
showed weak recovery. The central bank of Japan expanded the scale of its monetary stimulus to
counter the pressure of a slump in commodity prices caused by weak growth and a fall in the price
of oil. However, the country is still confronted with consumption, export and labor force
insufficiencies. Therefore, the country is expected to maintain negative growth in the fiscal year of
2014.
In 2015, Japan will benefit from intensified monetary stimulus, a favorable taxation policy and
increased public investment, which will drive an increase of household income, consumption,
corporate earnings and equipment investment. On the other hand, it will be affected negatively by
hiking commodity prices and sluggish consumption recovery caused by difficulties in enhancing
average remuneration and export decline due to recession in emerging market economies. In
general, Japan’s economy will be basically on track for recovery, but with the actual growth rate
being about 1%.
VII.4 Asian EMs
Asian Emerging economies grew most rapidly in 2014. Slowing down, due to reduced global
exports and decelerated growth of China in the first half of 2014. The emerging Asian economies’
growth regained its momentum as pulled by domestic and external demands in the latter half of the

Global Economic and Financial Outlook
Institute of International Finance BOC 19 Year 2015
year. It is expected that the actual growth rate of such economies will reach 6.6% in 2015 from 6.5%
in 2014. Among them, Thailand which may pacify the present political tension, and push economic
growth drastically upward from 1.5% in 2014 to about 4.0% in 2015, and maintain the overall
inflation rate at a moderate level of around 4%. The price level in India will remain above 7.5%.
Some countries will see improved balance of payments and fiscal conditions (Table 3).
Table 3: Economic and financial indicators prediction of major Asian emerging countries
Real GDP
(Year-on-year
growth rate %)
CPI
(Year-on-year
growth rate %)
Unemployment
rate
(%)
Current account
(GDP %)
Fiscal budget
(GDP %)
Interest rate
of the central
bank (%)
2014 2015 2014 2015 2014 2015 2014 2015 2014 2015 2014 2015
India 5.5 6.5 7.8 7.5 - - -2.0 -2.1 - -4.3 8.0 7.7
Indonesia 5.2 5.5 6.2 5.8 6.1 6.0 -3.1 -2.6 -2.4 -2.0 7.5 7.6
Thailand 1.5 4.0 2.3 2.5 0.9 0.8 1.6 1.0 -2.4 -2.2 2.0 2.5
Malaysia 5.7 5.2 3.2 3.6 3.1 3.1 5.1 5.3 -3.5 -3.0 3.3 3.5
Philippines 6.3 6.5 4.3 3.9 7.0 7.0 3.1 2.6 -2.0 -1.9 4.3 4.4
Vietnam 5.6 5.8 5.0 5.8 4.4 4.4 4.4 3.6 -6.1 -5.5 - -
Source: Bloomberg, Institute of International Finance BOC
However, emerging Asian economies will be confronted with more uncertainties in their economic
operation. Among them, major risks are from the poor foundation for capital inflow, especially the
debt capital inflow, against the background of expectation for the Fed’s interest rate increase and
the careful change of the global appetite for risk. Among emerging Asian economies seeing drastic
expansion of private debts in past years, some still depend excessively on external financing (like
India and Indonesia), or have an over high proportion of foreign capital in the financial market, and
some others are incapable of effectively reducing their debts in 2015 (like the Philippines). Besides,
emerging Asian economies have yet to completed their structural reforms, and have to “wait and
see” whether they can gain new growth momentum in the transformation to “new normal”
economic development.
VII.5 Africa
The economic performance in Africa in recent years has been eye-catching. Africa’s GDP totaled
around USD2.3 trillion in 2014, equaling Brazil’s economic aggregate and growing at a speed
second only to that of Asian-Pacific emerging markets. Furthermore, Africa made contributions to
global economic growth of twice that made by Japan. From 2000 to now, with an annual average
GDP growth of 5.0% and 6.0% respectively (Figure 17), the Middle East and North Africa have
totally overcome recessions and disturbances which were evident in the previous two decades and
have become a new focus of global investors. They have imposed a huge influence on the global
economy compared to their economic size, as they are major suppliers of such primary
commodities as energy and resources.

Global Economic and Financial Outlook
Institute of International Finance BOC 20 Year 2015
Figure 17: GDP growth in Africa
Source: IMF, Institute of International Finance BOC
Economic growth of Africa was driven by the following factors. First, the commodity price hike
driven by global demands has boosted income growth, infrastructure construction and industrial
investment and development in this region. Second, Africa is much more stable now, than in the
1980s and 1990s, which provides a more favorable environment for economic growth. Third, better
macroeconomic policies and investment environment have created conditions for capital flow and
money supply in this region.
Hit by the global financial crisis and affected by local political instability in the past five years, the
real economy in Africa has under gone more violent fluctuations. In particular, under the influence
of commodity price slumps, the Arab Spring, Syrian wars and other major events, North Africa saw
its annual average GDP growth rate drop to 3.5%. The economic growth in Africa is expected to be
more rapid in 2015 than in the previous year. The growth rate for the northern region will increase
from 2.6% in 2014 to 3.8% in 2015, and that for the southern part will be up from 5.1% to 5.8%
(Table 4). Among all countries in this region, oil exporters, such as Nigeria, Angola and Gabon,
may be affected by an energy price downturn, while oil importers like Egypt, Sudan and South
Africa will benefit from that. Severely Ebola-hit Guinea, Sierra Leone, Libya and other countries
will suffer from drastic growth rate decline.
South Africa
2012 2013 2014 2015
发达经济体 1.7 1.2
1.4 1.8 2.2
美国 1.6 2.3 2.2 2.2
3.0
英国 1.1 0.3 1.7 3.2
2.8
日本 -0.5 1.5 1.5
0.9 1.0
欧元区 1.6 -0.7
-0.4 0.8 1.0
新兴经济体 6.2 5.1
4.7 4.4 5.0
中国 9.3 7.7 7.7 7.4
7.2
印度 6.6 4.7 5.0 5.6
6.5
俄罗斯 4.3 3.4 1.3
0.2 0.5
巴西 2.7 1.0 2.5 0.3
1.5
全球经济 2.9 2.4 2.5
2.6 3.0同比
Middle East and North Africa
2011 2012 2013 2014 2015
发达经济体 1.7 1.2 1.4 1.8 2.2
美国 1.6 2.3 2.2 2.2 3.0
英国 1.1 0.3 1.7 3.2 2.8
日本 -0.5 1.5 1.5 0.9 1.0
欧元区 1.6 -0.7 -0.4 0.8
1.0
新兴经济体 6.2 5.1 4.7 4.4 5.0
中国 9.3 7.7 7.7 7.4 7.2
印度 6.6 4.7 5.0 5.6 6.5
俄罗斯 4.3 3.4 1.3 0.2 0.5
巴西 2.7 1.0 2.5 0.3 1.5
全球经济 2.9 2.4 2.5 2.6 3.0同比
GDP growth rate, %
英 1.7 3.2 2.8
日本 -0.5 1.5 1.5
0.9 1.0
欧元区 1.6 -0.7
-0.4 0.8 1.0
新兴经济体 6.2 5.1
4.7 4.4 5.0
中国 9.3 7.7 7.7 7.4
7.2
印度 6.6 4.7 5.0 5.6
6.5
俄罗斯 4.3 3.4 1.3
0.2 0.5
巴西 2.7 1.0 2.5 0.3
1.5
全球经济 2.9 2.4 2.5
2.6 3.0同比

Global Economic and Financial Outlook
Institute of International Finance BOC 21 Year 2015
Table 4: Growth prediction of major economies in the Middle East and Africa
Source: IMF, Institute of International Finance BOC
In general, Africa will still be the land of milk and honey for investors, thanks to its rapid economic
growth. Nigeria, Angola, Morocco and Kenya are worth attention for the large size and rapid
growth potential of their economy. Among them, Nigeria performed particularly well as the
outstanding leader of all African economies. Despite wide corruption, oil theft and rampant
rebellion by Islamic extremists in the northern part of the country, its real economy maintained fast
growth, making the country an economic star in Africa. In 2012, Nigeria saw its revised GDP
doubled to USD510 billion, and replaced South Africa to become the biggest economy in Africa.
The annual average GDP growth rate was 8.2% during 2000 to 2013, and is expected to increase
from 7.0% in 2014 to 7.3% in 2015 and maintained at 7.0% from 2015 to 2019.
USD100 million, %

Global Economic and Financial Outlook
Institute of International Finance BOC 22 Year 2015
Figure 18: GDP growth rate of top 20 economies in Africa of five years
Source: IMF, Institute of International Finance BOC
Among countries in northern Africa, Libya has presented the most remarkable changes in its
economic situation. Affected by February 17 Revolution and constant protests in oil fields and
ports, Libya saw continuous recession and its economic growth dropped to about 20%. With
improved domestic stability in 2015, the economic recovery rate is expected to reach 15%, but
considerable risks will remain. Since August 2014, the “Islamic State” (IS), an extremist group in
the Middle East has been hit by troops of the US and Europe in Iraq and Syrian. If it is driven out
of these two countries, it may go to Libya and other countries. Darna, a port city in the north of
Libya, pledged allegiance to the IS recently, indicating no optimism for stability and economic
prospects.
VII.6 Latin America
Latin American countries slowed down their economic growth to varying degrees. On the one hand,
domestic demands were weak, since supply bottlenecked and policy uncertainty harmed people’s
confidence in business and reduced investment, plus higher unemployment rate and sluggish wage
growth. On the other hand, a deteriorating external environment also retarded economic growth.
QE withdrawal in 2014 caused a reduction of foreign capital flowing into Latin America and
impeded corporate investment. Tardy economic growth and weak external demand of OECD
countries led to constantly high trade deficits and worse trade conditions for this region. It is
estimated that the real GDP of Latin America and Caribbean regions grew by 1.3%, a year-on-year,
a decrease of 1.4 percentage points. Among them, the real GDP grew by 3.8%, down by 0.4
percentage points year-on-year in Central America, 0.7% or 2.5 percentage points lower than the
previous year in South America, and 3.8% or 0.6% percentage points on the yearly basis in the
Caribbean region. The sluggish growth in this region was mainly attributed to the slow growth in
Per capita GDP, USD
Annual average GDP growth rate
2015-2019, %
英国 1.1 0.3 1.7 3.2 2.8
日本 -0.5 1.5 1.5 0.9 1.0
欧元区 1.6 -0.7 -0.4 0.8
1.0
新兴经济体 6.2 5.1 4.7 4.4 5.0
中国 9.3 7.7 7.7 7.4 7.2
印度 6.6 4.7 5.0 5.6 6.5
俄罗斯 4.3 3.4 1.3 0.2 0.5
巴西 2.7 1.0 2.5 0.3 1.5
全球经济 2.9 2.4 2.5 2.6 3.0同
比

Global Economic and Financial Outlook
Institute of International Finance BOC 23 Year 2015
Brazil and Argentina. Brazil was haunted by severe stagflation; in addition, investment and
consumption were curbed by tightened financial conditions and constant low levels of confidence
in business and consumption. Argentina has not yet ended the debt crisis that broke out 13 years
ago, or may fall into the same trouble; besides, with sharply decreasing international reserves, the
country has been under great pressure for currency depreciation and is confronted with much more
risks of an economic hard landing in the short term. In 2014, Brazil and Argentina grew
respectively by 0.3% and -1.7%. In Mexico, since the introduction of multiple structural reform
measures, the country has witnessed improved economic development and real GDP growth of 2.4%
in 2014, or a year-on-year increase of 1.3%.
In 2015, Latin America will embrace gradual recovery, a more solid macroeconomic foundation,
resilience of domestic demand and achievements due to the structural reform in some countries.
Therefore, its real GDP is expected to grow by 2.2% in 2015, 0.9 percentage points higher than that
in 2014. However, given the low growth potential, laggard infrastructure construction and severe
structural problems, this region should push ahead with structural reforms, enhance infrastructure
investment and boost sustainable development.
Disclaimer
This Report was drafted by the Institute of International Finance BOC, and all the information cited in this report
is publicly available.
Any view or estimate contained in this Report only represents the author’s judgments to date, not necessarily
reflects BOC’s views. The Institute of International Finance may change this Report without notice, and shall not
be held liable for update, correction or revision of this Report.
The contents and views contained in this Report are for reference only, which do not constitute any investment
recommendation. BOC will not be liable for any direct or indirect profit/loss on investment caused by the use of
any information provided herein.
The copyright of this Report is exclusively owned by the Institute of International Finance BOC, and shall not be
reprinted, duplicated or published by any institution or individual. In case of any quote for distribution, it shall be
indicated that the source is the Institute of International Finance BOC, and the report shall not be quoted,
abridged and modified contrary to its original intention. The Institute of International Finance BOC reserves
rights to investigate any infringement or quotation contrary to the original intention of this Report.