Embed Size (px)
Citation preview

Integrative Biomedical Informatics and Clinical Phenotype Characterization
Joel Saltz MD, PhD Director Center for Comprehensive
Informatics

Disclosures
• Member of Appistry Scientific Advisory Board

Cen
ter
for
Com
pre
hen
sive
In
form
atic
s
INTEGRATIVE BIOMEDICAL INFORMATICS ANALYSIS • Reproducible anatomic/functional characterization at fine level (Pathology) and gross level (Radiology) • Integration of anatomic/functional characterization with multiple types of “omic” information • Create categories of jointly classified data to describe pathophysiology, predict prognosis, response to treatment • Characterize clinical phenotype

Cen
ter
for
Com
pre
hen
sive
In
form
atic
s
Integration of heterogeneous multiscale information
• Coordinated initiatives Pathology, Radiology, “omics”
• Exploit synergies between all initiatives to improve ability to forecast survival & response.
Radiology Imaging
Patient Outco
me
Pathologic Features
“Omic” Data

Cen
ter
for
Com
pre
hen
sive
In
form
atic
s
Unsupervised Morphological Clustering – Outcome and Molecular Correlates

Cen
ter
for
Com
preh
ensi
ve I
nfor
mat
ics
• Leverage exascale data and
computer resources to squeeze the most out of image, sensor or simulation data
• Run lots of different algorithms to derive same features
• Run lots of algorithms to derive complementary features
• Data models and data management infrastructure to manage data products, feature sets and results from classification and machine learning algorithms
Extreme Spatio-Temporal Sensor Data Analytics

Cen
ter
for
Com
pre
hen
sive
In
form
atic
s
• Example Project: Find hot spots in readmissions within 30 days – What fraction of patients with a given principal diagnosis will be
readmitted within 30 days? – What fraction of patients with a given set of diseases will be readmitted
within 30 days? – How does severity and time course of co-morbidities affect
readmissions? – Geographic analyses
• Compare and contrast with UHC Clinical Data Base – Repeat analyses across all UHC hospitals – Are we performing the same? – How are UHC-curated groupings of patients (e.g., product lines) useful?
• Need a repeatable process that we can apply identically to both local and UHC data
Clinical Phenotype Characterization and the Emory Analytic Information Warehouse

Overall System
I2b2 Web Server
I2b2 Database
Source data
Database Mapper
Source data
Source data
Data Processing
Metadata Manager
Metadata Repository
Query Specification
Investigator
Data Analyst
Data Analyst
Data Modeler
Investigator
Query tools Study-
specific Database
Investigator

Cen
ter
for
Com
pre
hen
sive
In
form
atic
s
5-year Datasets from Emory and University Healthcare Consortium • EUH, EUHM and WW (inpatient encounters) • Removed encounter pairs with chemotherapy and radiation
therapy readmit encounters (CDW data)
• Encounter location (down to unit for Emory) • Providers (Emory only) • Discharge disposition • Primary and secondary ICD9 codes • Procedure codes • DRGs • Medication orders (Emory only) • Labs (Emory only) • Vitals (Emory only) • Geographic information (CDW only + US Census and American
Community Survey) Analytic Information Warehouse

Cen
ter
for
Com
pre
hen
sive
In
form
atic
s
Using Emory & UHC Data to Find Associations With 30-day Readmits
• Problem: “Raw” clinical and administrative variables are difficult to use for associative data mining – Too many diagnosis codes, procedure codes – Continuous variables (e.g., labs) require interpretation – Temporal relationships between variables are implicit
• Solution: Transform the data into a much smaller set of variables using heuristic knowledge – Categorize diagnosis and procedure codes using code
hierarchies – Classify continuous variables using standard
interpretations (e.g., high, normal, low) – Identify temporal patterns (e.g., frequency, duration,
sequence) – Apply standard data mining techniques
Analytic Information Warehouse

Cen
ter
for
Com
pre
hen
sive
In
form
atic
s
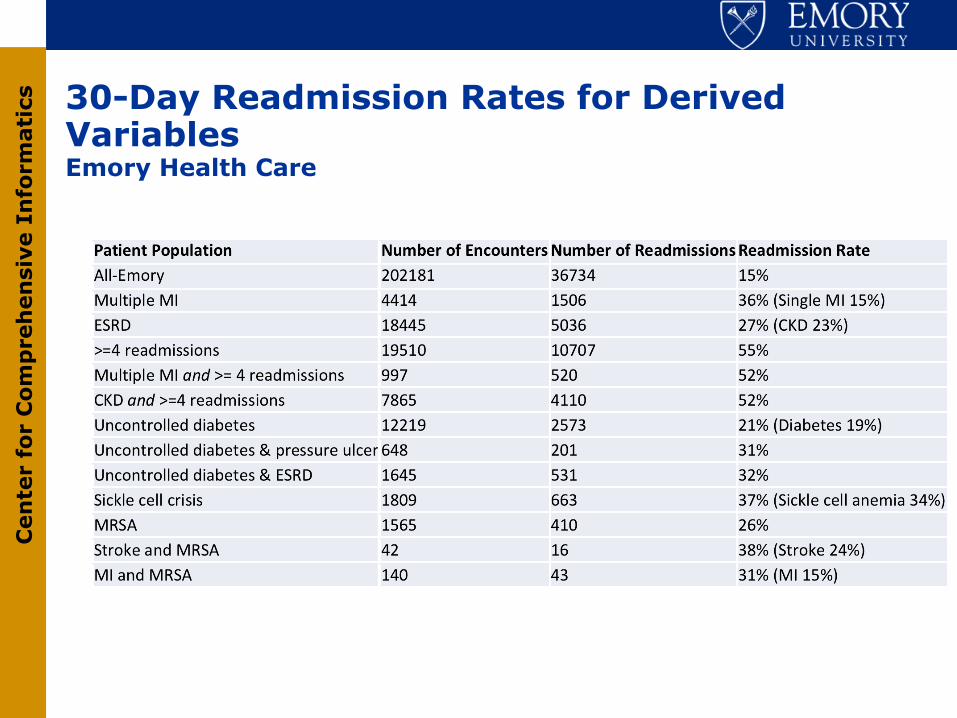
Derived Variables
• 30-day readmit • The 9 Emory Enhanced Risk Assessment Tool diagnosis categories • UHC product lines • Variables derived from a combination of codes and/or laboratory test results
– Obesity – Diabetes/uncontrolled diabetes – End-stage renal disease (ESRD) – Pressure ulcer – Sickle cell disease/sickle cell crisis
• Temporal variables derived over multiple encounters – Multiple MI – Multiple 30-day readmissions – Chemotherapy within 180 (or 365) days before surgery – Previous encounter within the last 90 (or 180) days
Cen
ter
for
Com
pre
hen
sive
In
form
atic
s
30-Day Readmission Rates for Derived Variables Emory Health Care

Cen
ter
for
Com
pre
hen
sive
In
form
atic
s
Geographic Analyses UHC Medicine General Product Line (#15)
Analytic Information Warehouse

Cen
ter
for
Com
pre
hen
sive
In
form
atic
s
Predictive Modeling for Readmission
• Random forests (ensemble of decision trees) – Create a decision tree using a random subset of the
variables in the dataset – Generate a large number of such trees – All trees vote to classify each test example in a
training dataset – Generate a patient-specific readmission risk for each
encounter • Rank the encounters by risk for a subsequent 30-
day readmission
Analytic Information Warehouse

Cen
ter
for
Com
pre
hen
sive
In
form
atic
s
Emory Readmission Rates for High and Low Risk Groups Generated with Random Forest

Graphics (non-programmer!) Interface

Display and Integrative Analysis of Combined Physiologic and EHR Data
Slide from Timothy Buchman

Cen
ter
for
Com
pre
hen
sive
In
form
atic
s
Status of Clinical Phenotype Analysis and Characterization • Integrative dataset analysis can leverage patient
information gathered over many encounters • Temporal analyses can generate derived variables that
appear to correlate with readmissions • Predictive modeling has promise of providing decision
support • Joint work with Kaiser on treatment patterns and efficacy for
newly treated African American hypertensives • Ongoing analyses involve characterization of clinical
phenotype in GWAS, biomarker and quality improvement efforts
• Collaborations with Tim Buchman, Sharath Cholleti in Critical Care informatics
• Co-lead (with Bill Hersh) of CTSA CER Informatics taskforce dedicated informatics support for Pragmatic Clinical Trials

Cen
ter
for
Com
pre
hen
sive
In
form
atic
s
Summary and Perspective
• Large scale integrative data analytic methods and tools to integrate clinical, molecular, Pathology, Radiology data (happy to discuss Radiology aspects off line)
• Coordinated methods to analyze healthcare data and to define clinical phenotypes
• Generate and manage nuanced temporal summary of patients health status, co-morbidities, treatment, treatment response

Thanks to: • In silico center team: Dan Brat (Science PI), Tahsin Kurc, Ashish Sharma, Tony Pan, David
Gutman, Jun Kong, Sharath Cholleti, Carlos Moreno, Chad Holder, Erwin Van Meir, Daniel Rubin, Tom Mikkelsen, Adam Flanders, Joel Saltz (Director)
• caGrid Knowledge Center: Joel Saltz, Mike Caliguiri, Steve Langella co-Directors; Tahsin Kurc, Himanshu Rathod Emory leads
• caBIG In vivo imaging team: Eliot Siegel, Paul Mulhern, Adam Flanders, David Channon, Daniel Rubin, Fred Prior, Larry Tarbox and many others
• In vivo imaging Emory team: Tony Pan, Ashish Sharma, Joel Saltz • Emory ATC Supplement team: Tim Fox, Ashish Sharma, Tony Pan, Edi Schreibmann, Paul
Pantalone • Digital Pathology R01: Foran and Saltz; Jun Kong, Sharath Cholleti, Fusheng Wang, Tony
Pan, Tahsin Kurc, Ashish Sharma, David Gutman (Emory), Wenjin Chen, Vicky Chu, Jun Hu, Lin Yang, David J. Foran (Rutgers)
• NIH/in silico TCGA Imaging Group: Scott Hwang, Bob Clifford, Erich Huang, Dima Hammoud, Manal Jilwan, Prashant Raghavan, Max Wintermark, David Gutman, Carlos Moreno, Lee Cooper, John Freymann, Justin Kirby, Arun Krishnan, Seena Dehkharghani, Carl Jaffe
• ACTSI Biomedical Informatics Program: Marc Overcash, Tim Morris, Tahsin Kurc, Alexander Quarshie, Circe Tsui, Adam Davis, Sharon Mason, Andrew Post, Alfredo Tirado-Ramos
• NSF Scientific Workflow Collaboration: Vijay Kumar, Yolanda Gil, Mary Hall, Ewa Deelman, Tahsin Kurc, P. Sadayappan, Gaurang Mehta, Karan Vahi

The AIW/CVRG/MH-GRID Teams • Stakeholders
– Joel Saltz, MD, PhD – CCI Director and ACTSI BIP Director – William Bornstein, MD, PhD – Emory Healthcare Chief Quality Officer – Dee Cantrell, RN – Emory Healthcare CIO – Marc Overcash – Emory Deputy CIO of Research and Health Sciences IT
• Project Team – Andrew Post, MD, PhD – AIW Project Lead & CCI Clinical Informatics Architect – Terry Willey, RN – IS Director of Business Strategy/Planning – Richie Willard – Project Manager – Tahsin Kurc, PhD – CCI Chief Software Architect – Sharath Cholleti, PhD – Research Scientist – Jingjing Gao, PhD – Biostatistician – Michel Mansour – Software Engineer – Himanshu Rathod – Software Engineer – Mike Torian – Data Warehouse Engineer – Michael Brown – Software Engineer – Geoff Milton – Software Engineer – Akshatha Kalsanka Pai – Software Engineer
Analytic Information Warehouse

Thanks!


![[DDBJing33] Japanese Genotype-phenotype Archive の紹介](https://img.pdfslide.tips/doc/110x75/5870c1d21a28ab0b4a8b7447/ddbjing33-japanese-genotype-phenotype-archive-.jpg)
![[DDBJing31] Japanese Genotype-phenotype Archive の紹介](https://img.pdfslide.tips/doc/110x75/55bff5edbb61ebb8188b4864/ddbjing31-japanese-genotype-phenotype-archive-.jpg)
![Genotype- and Phenotype-Guided Management of Congenital Long QT [복구됨] [자동 저장]](https://img.pdfslide.tips/doc/110x75/577cd5581a28ab9e789a8a88/genotype-and-phenotype-guided-management-of-congenital-long-qt-.jpg)

