Embed Size (px)
Citation preview
2014
Yudi Mirley Lozano Bernal
INTERACCIONES ENTRE PLANTAS Y MICROORGANISMOS DEL SUELO
Consecuencias para la dinámica de comunidades vegetales
INTER
AC
CIO
NES E
NTR
E P
LA
NTA
S
Y M
ICR
OO
RG
AN
ISM
OS D
EL S
UELO
C
onsecuencia
s p
ara
la d
inám
ica d
e c
om
unid
ades v
egeta
les

2
3
Departamento de Química y Física Facultad de Ciencias Experimentales
Universidad de Almería
Interacciones entre plantas y microorganismos del suelo:
Consecuencias para la dinámica de comunidades vegetales
Memoria presentada por la Ingeniera Yudi Mirley Lozano Bernal para optar al título de Doctora por la
Universidad de Almería, dirigida por el Dr. Francisco I. Pugnaire de Iraola y la Dra. Sara Hortal
Botifoll.
Septiembre de 2014
La Doctoranda VoBo de los Directores
Yudi M. Lozano Bernal Francisco I. Pugnaire de Iraola Sara Hortal Botifoll

4

5
AGRADECIMIENTOS Muchos han sido los que con su ayuda han hecho posible que un sueño de una chica de 16 años
deje de ser sueño y se convierta en una realidad. ¡Ser doctora y hacer investigación! Hoy, gracias
a vosotros es una realidad.
En primer lugar, gracias al proyecto de excelencia de la Junta de Andalucía que ha financiado
esta tesis doctoral y los experimentos aquí presentados. Gracias al Consejo Superior de
Investigaciones Científicas, EEZA-CSIC, por permitir desarrollar mi actividad investigadora en este
centro y a todo el personal administrativo, técnico y de laboratorio que han contribuido en ello.
Gracias también a la Universidad de Almería, por acogerme en su programa de doctorado en
Ciencias.
Gracias a mis directores de tesis, por guiarme en mi formación como investigadora: A Paco por la
confianza, por darme la oportunidad de hacer parte de tu grupo de investigación y por compartir tu
visión del “negocio” conmigo. ¡Ha sido muy enriquecedor! A Sara por enseñarme a navegar en el
mundo de los microorganismos, por escuchar una y mil veces mis ideas de experimentos, a veces
sin mucho sentido, y aún así no desanimarme. Gracias por tantas charlas de la vida y de la
ciencia, por tener siempre una sonrisa para todos.
Gracias Cris. No te imaginas cuanta admiración tengo hacia ti. Eres de las mejores científicas y
personas que he podido conocer; tu amor por la ciencia, tu dedicación y el verte disfrutar día a día
con lo que haces, es realmente contagioso. Gracias por guiar mis elucubraciones, a veces con
sentido.
Gracias a los 3 por estos 4 años. No siempre se puede trabajar con los mejores y ya que lo he
disfrutado he de decir que ha sido todo un lujo.
Gracias a Fernando Casanoves por ayudarme a descubrir muchos de los secretos insondables de
la estadística; y a Christian, Juan Soler y Jordi por atender mis múltiples solicitudes sobre este
tema. Gracias a Ashraf por tus conocimientos en GIS. ¡He aprendido mucho con vosotros!
Gracias a Carlos García, José Luis, Felipe, Sara e Irene del CEBAS de Murcía. Gracias a Wim
van der Putten, Olga Kostenko y todo el equipo del Instituto Holandés de Ecología. Haber estado
con vosotros de estancia fue de inspiración para avanzar en esta tesis.
Gracias a Nuria y Carme, mis compañeras y amigas de combate estos 4 años. Por tantos abrazos
que me habéis permitido compartir con vosotras y por tantas horas de experiencias en la 302.
Sois de lo que no hay, ¡Os quiero un montón! Gracias a Nieke por tantas horas y horas de charla
en el campo. Menos mal que estabas ahí; el desierto era más llevadero en tu compañía. Te echo
mucho de menos cariño.
Gracias a todas mis niñas chumberas: Ángela, Lourdes, Mónica, Maite, Meire, Cris, Olga; por
tanto arte junto, por dejaros querer, por dirigir y/o participar en nuestras terapias de risa, por
6
siempre estar…. Y como no a Laura, con esa energía desbordando por doquier, gracias por las
charlas profundas y trascendentales que disfrutábamos de vez en cuando. Las he echado mucho
de menos. A todo los chumberos, Ori, Ana, Gustavo, Petr, Luisa, David, Joseph, Josep, Lupe,
Fran, Miguel, Sonia, Sandro, María Jesús, gracias por tantos momentos de vóley, tapas,
celebraciones, matrimonios, películas, cenas, etc.
Gracias a Miriam, Luisa, Marcela y Manuel por hacer que mi estancia en el centro fuese cercana a
un hotel 5 estrellas. Miriam como me encantaba hacerte rabiar, ¡te echare mucho de menos!
A Alona, Ana C, Ana F, Davi, Elena, Mariana, Dani, Marcos, Emily, Sele, Toñi, Marisa, José, Juan,
Mari Carmen, Amadeo, Jesús, Victor, Kevin, Geles, Jonathan, y a aquellos que se me quedan en
el tintero. A todos gracias; vuestra compañía reanimaba mi espíritu sábado tras sábado. Os quiero
un montón.
Gracias a Miko por enseñarme a dar vueltas cuando se está feliz, y a Isats (nire Retama txikia) por
enseñarme que siempre, siempre es un buen momento para salir a pasear.
Gracias en especial a esas personas tan importantes en mi vida.
A mi Noe, porque has tenido que vivir cada día de esta tesis, por apoyarme en cada momento, por
ser mi mejor amiga y mi familia todo este tiempo. Gracias por existir y hacernos, a quienes
disfrutamos de tu presencia, mucho más felices. El mundo necesita más personas como tú.
A mis hermanos, porque siempre habéis sido y siempre seréis mis niños. ¡Sí! los sueños son
también para soñarlos. Me alegra que esto también sea una realidad en vuestra vida.
A mi madre, porque tu amor ha traspasado fronteras, por enseñarme el valor del trabajo
perseverante, de tener metas claras e ir a por ellas. Te amo con todo mi corazón.
A mi padre, porque tu recuerdo me fortalece día a día, porque esa capacidad soñadora le heredé
de ti y mira que la agradezco. Un sueño es el primer paso para la metas. Te echo mucho de
menos, pero guardo la bendita esperanza de verte pronto. ¡Sí, te veré!
A Dios, porque soy lo que soy gracias a ti. Porque tu amor no se cansa de perseguirme y porque
siempre he visto que soy la niña de tus ojos, y eso me hacer ser inmensamente feliz. Gracias
porque a través de la ciencia he aprendido a conocerte más. Gracias por existir, por ser tan real
incluso más real que esta misma tesis.
Gracias por los sueños, por las metas, pero sobre todo por el camino. He disfrutado mucho el
caminar estos 4 años. Y si esto ha sido así, no me imagino lo que vendrá. Será sencillamente
espectacular!
¡Gracias a todos!

7

8
….Y si entiendo todos los misterios y poseo todo conocimiento,
pero me falta amor, no soy nada.
1 Corintios: 13.

9
10
TABLA DE CONTENIDO
RESUMEN ..................................................................................................................................... 12
INTRODUCCIÓN GENERAL ......................................................................................................... 16
OBJETIVOS GENERALES ........................................................................................................... 20
1. SOILS UNDER NURSE SPECIES AFFECT PLANT PRODUCTIVITY AND DIVERSITY
INDEPENDENTLY OF THE CANOPY EFFECT ............................................................................ 22
1.1. ABSTRACT ................................................................................................................... 24
1.2. INTRODUCTION............................................................................................................ 25
1.3. OBJECTIVES ................................................................................................................ 26
1.4. HYPOTHESES............................................................................................................... 26
1.5. METHODS ..................................................................................................................... 26
1.6. RESULTS ...................................................................................................................... 29
1.7. DISCUSSION ................................................................................................................. 34
1.8. CONCLUSIONS............................................................................................................. 39
1.9. APPENDIX ..................................................................................................................... 39
2. ISOLATING NOVEL FROM WELL-KNOWN FACILITATION MECHANISMS: EFFECTS OF
SOIL MICROORGANISMS, MICROHABITAT AND SOIL PROPERTIES IN A NURSE SYSTEM
IN A SEMIARID ENVIRONMENT .................................................................................................. 42
2.1. ABSTRACT ................................................................................................................... 44
2.2. INTRODUCTION............................................................................................................ 45
2.3. OBJECTIVES ................................................................................................................ 46
2.4. HYPOTHESIS ................................................................................................................ 47
2.5. METHODS ..................................................................................................................... 47
2.6. RESULTS ...................................................................................................................... 52
2.7. DISCUSSION ................................................................................................................. 59
2.8. CONCLUSIONS............................................................................................................. 63
2.9. APPENDIX ..................................................................................................................... 64
3. INTERACTIONS AMONG SOIL, PLANTS, AND MICROORGANISMS DRIVE SECONDARY
SUCCESSION IN A DRY ENVIRONMENT ................................................................................... 69
3.1. ABSTRACT ................................................................................................................... 71
11
3.2. INTRODUCTION ........................................................................................................... 72
3.3. OBJECTIVES ................................................................................................................ 73
3.4. HYPOTHESIS ................................................................................................................ 73
3.5. METHODS ..................................................................................................................... 73
3.6. RESULTS ...................................................................................................................... 79
3.7. DISCUSSION ................................................................................................................ 88
3.8. CONCLUSIONS ............................................................................................................ 92
3.9. APPENDIX .................................................................................................................... 93
4. ARRESTED SUCCESSION AS OUTCOME OF THE INTERACTION BETWEEN PLANTS
AND SOIL MICROORGANISMS ................................................................................................... 97
4.1. ABSTRACT ................................................................................................................... 99
4.2. INTRODUCTION ......................................................................................................... 100
4.3. OBJECTIVES .............................................................................................................. 101
4.4. HYPOTHESES ............................................................................................................ 102
4.5. METHODS ................................................................................................................... 102
Growth chamber experiments: seeds and saplings ....................................................... 103
Greenhouse experiment: Adult plants ............................................................................. 104
4.6. RESULTS .................................................................................................................... 108
4.7. DISCUSSION .............................................................................................................. 117
4.8. CONCLUSIONS .......................................................................................................... 120
4.9. APPENDIX .................................................................................................................. 121
CONCLUSIONES GENERALES ................................................................................................. 125
REFERENCES ............................................................................................................................ 129
ASPECTOS GENERALES
12
RESUMEN
En esta tesis doctoral pretendemos aclarar aspectos fundamentales relacionados con la
interacción entre plantas y microorganismos del suelo y sus consecuencias para la dinámica de
las comunidades vegetales. Pretendemos comprobar si las comunidades microbianas están
determinando interacciones negativas y/o positivas entre plantas; si tras el abandono de tierras
dedicadas al cultivo, las plantas y los microorganismos del suelo siguen patrones sucesionales, y
si los microorganismos asociados a las especies vegetales son los que determinan su éxito
competitivo en una comunidad vegetal. Para evaluar esto realizamos diferentes experimentos en
campo y en invernadero apoyados por una serie de análisis físicos, químicos, biológicos y
moleculares del suelo y de sus comunidades microbianas.
En el primer capítulo de esta tesis buscábamos separar, dentro de los procesos de facilitación
entre plantas, el efecto del suelo y de la copa del arbusto facilitador sobre el desarrollo de la
comunidad de herbáceas que vive bajo el mismo. Para ello, en campo (Rambla del Saltador,
Tabernas, Almería) seleccionamos individuos de copa pequeña, mediana y grande del arbusto
facilitador Retama sphaerocarpa (Retama) e intercambiamos bloques de suelo tomados bajo cada
una de estas copas. Encontramos que existe un fuerte efecto del suelo sobre la diversidad, la
biomasa y la abundancia de la comunidad de herbáceas, el cual es independiente e incluso más
importante que el conocido efecto de copa.
Con base a estos resultados, en el segundo capítulo buscábamos indagar en mayor profundidad
sobre aquellos factores, en especial de la matriz del suelo, que influyen sobre el desarrollo de la
comunidad de herbáceas facilitadas. Establecimos un experimento en campo (Rambla del
Saltador) usando como factores de estudio los microorganismos, el microhabitat y las propiedades
físico-químicas del suelo asociados a los arbustos de Retama y a los claros de suelo desnudo
entre arbustos. Evaluamos la respuesta en la germinación y desarrollo de especies vegetales que
típicamente se desarrollan en claro o bajo Retama, y encontramos que los microorganismos del
suelo asociados a Retama afectan positivamente a la germinación y desarrollo inicial de algunas
especies pero negativamente a los de otras. Así mismo, la copa favorece la germinación de las
plantas pero tiene un efecto neutro en cuanto a su desarrollo en biomasa, mientras que las
propiedades del suelo tienen un efecto positivo sobre la germinación y el desarrollo de las plantas
convirtiéndolo en el principal promotor de los procesos de facilitación entre plantas.
ASPECTOS GENERALES
13
Dentro de la dinámica de las comunidades vegetales, otro proceso de relevancia es la sucesión
secundaria. En el tercer capítulo buscábamos conocer si los microorganismos del suelo sufren un
proceso de sucesión secundaria similar al de las plantas y si existen vínculos entre ambas
sucesiones. Para esto, seleccionamos una extensa área de campos abandonados en diferentes
fechas desde hace aproximadamente 100 años en el municipio de Tabernas (Almería). Usando
sistemas de información geográfica, establecimos una cronosecuencia con 5 fechas de abandono
distintas y en cada etapa caracterizamos las comunidades vegetales (cobertura y diversidad) y
microbianas del suelo (biomasa, actividad y composición microbiana), así como las propiedades
físico-químicas del suelo. Encontramos que los campos abandonados sufren procesos de
sucesión secundaria tanto en lo referente a los microorganismos del suelo como a las
comunidades vegetales, caracterizados por cambios en las propiedades del suelo, en la biomasa,
actividad y composición microbiana, así como por cambios en la cobertura y diversidad de
plantas. De esta manera, nuestros resultados sugieren que la sucesión microbiana sigue en el
tiempo a la sucesión de plantas.
En esta misma zona, también encontramos áreas que durante estos 100 años de estudio no han
presentado ningún cambio en cuanto a la composición y estructura de las comunidades vegetales,
es decir, que no han sufrido un proceso de sucesión secundaria. Estas áreas son dominadas por
la gramínea Lygeum spartum (Lygeum) e impiden la entrada de otras especies típicas de la zona
como Salsola oppositifolia (Salsola). En el cuarto capítulo pretendíamos profundizar en las
razones que han llevado a esta detención de la sucesión secundaria, determinando si la habilidad
competitiva de esta especie está vinculada a las comunidades microbianas del suelo, a las
propiedades del suelo o a estrategias de la planta a lo largo de su etapa de desarrollo. Bajo
condiciones controladas, realizamos 3 experimentos donde usamos semillas, plantas jóvenes o
plantas adultas, respectivamente, de Lygeum y Salsola creciendo en interacción intra o inter-
específica, con suelos procedentes de bajo la copa de Lygeum o Salsola y con o sin
microorganismos. Encontramos que los microorganismos de los suelos pertenecientes a Lygeum
facilitan el desarrollo de Salsola tanto en estado juvenil como en estado adulto, pero las semillas
de Lygeum germinan mucho más rápido que las de Salsola, lo que sugiere una rápida ocupación
del espacio por parte de Lygeum. Esto sumado a su forma de crecimiento clonal, la convierte en
una especie muy competitiva y con una gran dominancia, pudiendo incluso detener el avance de
la sucesión secundaria.

ASPECTOS GENERALES
14
La información obtenida con el desarrollo de esta tesis es relevante de cara a realizar
predicciones de los efectos del cambio global en ecosistemas semiáridos ya que, al incluir tanto el
estudio de comunidades vegetales como microbianas, proporciona un mejor conocimiento de los
cambios funcionales y estructurales que pueden ocurrir en dichos ecosistemas. Esto permitiría
anticipar las respuestas ante los cambios ambientales y, por tanto, mejorar su gestión y
conservación.

15
ASPECTOS GENERALES
16
INTRODUCCIÓN GENERAL
La biodiversidad global está siendo sometida a una tasa de cambio sin precedentes (Pimm et al.
1995) como respuesta a los múltiples factores antropogénicos que inciden en el medio ambiente
(Vitousek 1994). Entre los principales vectores que afectan el funcionamiento y la biodiversidad de
los ecosistemas se destacan en orden, el cambio de uso del suelo y el cambio climático (Sala et
al. 2000). Uno de los más importantes cambios en el uso del suelo ha tenido lugar en áreas
dedicadas a la agricultura. La intensificación de los cultivos y la severa desertificación relacionada
con el calentamiento global y la sequía, han incrementado el abandono de tierras en zonas áridas
(Zhao et al. 2005, Lasanta 2012). Los ecosistemas áridos comprenden cerca del 41% de la
superficie terrestre y son habitados por más del 38% de la población mundial (Reynolds et al.
2007), por lo que la degradación de tierras afecta aproximadamente a más de 2500 millones de
personas en el mundo, cifra que aumentará en el futuro cercano debido al cambio climático y al
rápido crecimiento poblacional (MEA 2005, FAO 2010). Por otra parte, el clima y la composición
de la atmósfera están cambiando rápidamente, registrándose aumentos significativos en la
temperatura global y la concentración de dióxido de carbono que desencadenan alteraciones en el
ciclo hidrológico global y cambios en los patrones regionales de precipitación (IPCC 2007).
Las interacciones planta-planta son una parte principal de los mecanismos que gobiernan la
respuesta de las especies y comunidades vegetales a estos cambios ambientales (Brooker 2006);
pueden ser positivas o negativas, y el balance neto de la interacción será de facilitación (si es
positivo) o de competencia (Armas and Pugnaire 2005). Aunque por mucho tiempo la teoría
ecológica y los modelos de interacción entre plantas han estado centrados en la competencia,
existe gran evidencia experimental sobre las interacciones positivas entre plantas (Pugnaire et al.
1996b, Callaway and Pugnaire 2007, Brooker et al. 2008), las cuales toman gran relevancia en
zonas de elevado estrés ambiental (Callaway et al. 2002) tales como los ecosistemas áridos
(Tirado and Pugnaire 2005).
Bajo las extremas condiciones ambientales de estos ecosistemas, el efecto nodriza, un clásico
ejemplo de facilitación donde una especie facilita el establecimiento y crecimiento de otras
mediante el mejoramiento de las condiciones físicas bajo su copa (Flores and Jurado 2003,
Callaway 2007), es un mecanismo clave para mantener la biodiversidad global, ya que promueve
tanto la diversidad de especies como el aumento de la productividad del sistema (Callaway 1995,
Pugnaire et al. 1996a, Pugnaire et al. 1996b, Brooker et al. 2008). Se ha visto que plantas nodriza,
ASPECTOS GENERALES
17
como es el caso de Retama sphaerocarpa (L) Boiss., protegen a las plantas beneficiarias de los
altos niveles de irradiación y temperatura (Moro et al. 1997, Yang et al. 2009, Jankju 2013),
contribuyen al aumento de la disponibilidad hídrica por acción de la sombra o del levantamiento
hidráulico (Zou et al. 2005, Prieto et al. 2012) e incrementan la disponibilidad de nutrientes debido
a la acumulación de hojarasca (Rodríguez-Echeverría and Pérez-Fernández 2003). Las grandes
modificaciones inducidas por las plantas nodriza sobre las propiedades del suelo y las condiciones
microclimáticas han sido tradicionalmente identificadas como el principal mecanismo de
facilitación en ambientes áridos. Sin embargo, datos recientes han sugerido un posible papel de
los microorganismos del suelo en este proceso (Hortal et al. 2013, Rodríguez-Echeverría et al.
2013), que se ha explorado para las asociaciones de micorrizas (Van Der Heijden and Horton
2009, Van der Putten 2009), pero que se ha obviado para las comunidades de bacterias a pesar
de la fuerte influencia que tienen para el desarrollo de las plantas.
La mayoría de los modelos actuales consideran la disponibilidad de luz y nutrientes como la
fuerza que gobierna las interacciones entre plantas (Grime 1983, Tilman 1988) y, por tanto, la
composición y estructura de las comunidades vegetales. Sin embargo, las interacciones entre
plantas y organismos del suelo pueden tener consecuencias importantes para la dinámica de la
vegetación (Van der Putten and Peters 1997) porque, aunque la naturaleza de las interacciones
suelo-planta es todavía en gran parte desconocida, se sabe que la identidad de las especies
vegetales influye notablemente en la comunidad de organismos del suelo, y que éstos dejan un
legado que condiciona el desarrollo posterior de la comunidad vegetal. Este legado vendría
mediado por la acumulación en la rizosfera de microorganismos cuyos efectos pueden ser
positivos (Bever 2003, Rodríguez-Echeverría et al. 2013) o negativos (Klironomos 2002) afectando
al resultado de la interacción con otras especies de plantas (Van der Putten and Peters 1997,
Bonanomi and Mazzoleni 2005).
Otro mecanismo que promueve la biodiversidad y en el que los microorganismos pueden también
jugar un papel importante, es la sucesión secundaria que ocurre tras una fuerte perturbación como
el cambio de uso del suelo o el abandono de tierras dedicadas al cultivo. Los fenómenos de
sucesión secundaria se desarrollan a lo largo del tiempo tendiendo a la restauración natural de los
ecosistemas perturbados. El estudio de la sucesión secundaria en ecosistemas áridos ha estado
principalmente centrado en la dinámica de las comunidades de plantas, con escasa atención a las
comunidades microbianas del suelo. En otros ecosistemas como dunas arenosas de interior se
han observado cambios en las comunidades microbianas a lo largo del tiempo (Tarlera et al.
ASPECTOS GENERALES
18
2008). Así mismo, tras la restauración de ecosistemas forestales se han observado tendencias
sucesionales en la comunidad de bacterias (Banning et al. 2011), mientras que otros autores
(Kuramae et al. 2011) encontraron cambios en las comunidades microbianas pero únicamente en
etapas tempranas de sucesión. Aun así, en comparación con las comunidades de plantas, hay
una escasa evidencia que demuestre patrones sucesionales en comunidades microbianas y
menos aún sobre su cambio respecto a la composición de las comunidades de plantas. Sin
embargo, cambios en los microorganismos del suelo pueden resultar en efectos lineales sobre la
tasa de crecimiento de las plantas (Bever 2003), y aunque la escasa evidencia experimental
existente ha sido principalmente desarrollada bajo condiciones controladas, los datos disponibles
sugieren que las comunidades microbianas pueden jugar un importante papel en la sucesión
secundaria. El escaso conocimiento actual nos muestra que, dependiendo de la posición
sucesional de las especies de planta implicadas, las interacciones negativas planta-suelo pueden
promover el avance sucesional favoreciendo el reemplazo de especies (Klironomos 2002, Bever
2003, Bonanomi et al. 2005, Kardol et al. 2006) o, por el contrario, retroalimentaciones positivas
pueden conducir a la dominancia de una especie, reduciendo la tasa de sucesión (Bever 2003,
Kardol et al. 2006).
Parece probado que las plantas pueden modificar la estructura de la comunidad microbiana
asociada a la rizosfera (Chanway et al. 1991, Kowalchuk et al. 2002, Hortal et al. 2013) y que
estos cambios influyen en su propio funcionamiento (Bever 1994, Bever et al. 1997), lo que puede
hacer que aumente o disminuya su tasa de crecimiento. No obstante, el papel de tales
interacciones en la dinámica temporal de la comunidad vegetal ha recibido poca atención
(Bardgett et al. 2005, Kardol et al. 2006). No está claro, por ejemplo, cómo cambios específicos en
la comunidad de microorganismos del suelo contribuyen a la dinámica de la comunidad vegetal y
sus tasas de reemplazo sucesional, o cuánto tiempo permanecen operacionales estos efectos
(Van der Putten 2003). Lo que sí parece claro es que cuando la interacción suelo-planta reduce la
capacidad competitiva de una especie pionera, también afecta de forma decisiva el resultado de
competencia con especies sucesionalmente más tardías (Bever 2003), de forma que la influencia
de las especies pioneras sobre el suelo influye en la dinámica posterior de la comunidad vegetal.
Las dificultades tradicionalmente asociadas al estudio de los microorganismos han hecho que
exista un gran desconocimiento sobre su influencia en la dinámica de las comunidades vegetales.
Recientemente, los avances asociados al uso de técnicas moleculares han facilitado acceder a
esta caja negra y comprender mejor cómo funcionan las comunidades microbianas. Está
ASPECTOS GENERALES
19
demostrado, por ejemplo, que la diversidad y composición de las comunidades microbianas del
suelo influyen en el crecimiento y la productividad de las plantas (Wardle et al. 2004) y en la
abundancia de especies (Klironomos 2002, Hortal et al. 2013). El efecto de los microorganismos
del suelo en las comunidades de plantas es el resultado combinado de la interacción entre
diferentes grupos microbianos así como entre plantas y organismos patógenos, parásitos,
mutualistas y descomponedores (Van der Putten and Peters 1997, Kulmatiski and Beard 2008,
Rodríguez-Echeverría et al. 2013). Por tanto, la integración de las comunidades microbianas del
suelo en el marco de las interacciones entre plantas y de la sucesión secundaria nos debería
proporcionar una imagen más realista de estos procesos.
ASPECTOS GENERALES
20
OBJETIVOS GENERALES
Explicar aspectos fundamentales relacionados con la interacción entre plantas y microorganismos
del suelo y sus consecuencias para la dinámica de las comunidades vegetales.
Específicamente, los objetivos que se abordarán en los diferentes capítulos de esta tesis son:
Determinar si en los procesos de facilitación en ecosistemas semiáridos, los suelos de las
especies nodriza afectan la productividad y diversidad de las plantas a las que benefician,
en un proceso independiente del efecto de copa.
Diferenciar el efecto de los microorganismos del suelo, del microhabitat y de las
propiedades del suelo en los procesos de facilitación en ecosistemas semiáridos.
Evaluar si las interacciones entre plantas, suelo y microorganismos del suelo definen la
sucesión secundaria en ecosistemas semiáridos (capítulo 3).
Definir si la interrupción de la sucesión es el resultado de la interacción entre plantas y
microorganismos del suelo.

21
CHAPTER 1. SOILS AFFECT PLAN PRODUCTIVITY AND DIVERSITY INDEPENDENTLY OF THE CANOPY EFFECT
22
1. SOILS UNDER NURSE SPECIES AFFECT PLANT PRODUCTIVITY AND
DIVERSITY INDEPENDENTLY OF THE CANOPY EFFECT
Lozano Y.M., Hortal S., Armas C. and Pugnaire F.I. Soils under nurse species affect plant productivity and diversity independently of the canopy effect. In preparation.

23
CHAPTER 1. SOILS AFFECT PLAN PRODUCTIVITY AND DIVERSITY INDEPENDENTLY OF THE CANOPY EFFECT
24
1.1. ABSTRACT
The nurse plant effect has been mainly explained by the positive effect of the canopy on the
amelioration of microclimatic conditions while the direct effect of the complex soil matrix on this
facilitation process has received less attention. We examined the effects of both canopy and soil of
the nurse shrub Retama sphaerocarpa on changes occurring in aboveground biomass,
abundance, diversity and richness of the understorey plant community. We hypothesized that, in
addition to the positive effect of the canopy associated to size, there will be a strong and
independent effect of soil on these changes. For this, we collected three soil blocks 20 cm x 20 cm
x 15 cm (length, width, depth) under the canopy of eighteen Retama shrubs grouped into three
different canopy sizes (small, medium, large) and randomly distributed it back into the extraction
holes under the shrubs, such that each shrub had three soil blocks, each of them from a different
soil origin (collected under small, medium or large shrubs). We found that both soil origin and
canopy size of the nurse shrub independently affected the total aboveground biomass and plant
diversity. Regarding canopy effect, both biomass and diversity increased in communities growing
under large Retama canopies promoted by a decrease in irradiance and temperature related to
deeper shade. However, regarding soil origin, we recorded an inverse relation between them so
that aboveground biomass increased and plant diversity decreased under soils from large Retama
shrubs. The positive effects of soil organic matter and the increase in nutrients added to soil
microbial and activity could promote a higher biomass under soils from large Retama shrubs. On
the other hand, factors linked to low soil seed bank diversity due to limitations in seed dispersal,
temporally variable environment or positive plant interactions of some species with soil
microorganisms or nutrients that could cause competitive exclusion may explain the reduced plant
diversity observed in soils from under large shrubs. The effect of soil origin on biomass and
abundance per species was larger than the canopy effect, thus playing a key role in determining
the structure of understorey communities. Overall, complex processes that occur in the soil matrix
need more attention to increase our understanding of the mechanisms that regulate facilitation
among plants.
CHAPTER 1. SOILS AFFECT PLAN PRODUCTIVITY AND DIVERSITY INDEPENDENTLY OF THE CANOPY EFFECT
25
1.2. INTRODUCTION
Although models for plant interactions have mainly emphasized competition (Went 1973, Tilman
1982, Aerts 1999, Keddy 2001, Grime 2002), plant species may also provide benefits to neighbors
through facilitation processes (Callaway 1995, 2007, Callaway and Pugnaire 2007). Facilitation,
defined as the interaction where one plant species benefits another neighboring species in terms
of germination, survival or growth, is a well-known phenomenon described in many ecosystems
around the world (Callaway 2007). A particular case of facilitation is the nurse plant effect (Niering
et al. 1963), in which a species develops several mechanisms to facilitate the establishment and
growth of others species beneath their canopy (Pugnaire et al. 1996a, Callaway 2007). The nurse
effect has great relevance in extreme conditions, such as arid environments (Flores and Jurado
2003), where nurse plants mitigate high temperatures and irradiance (Moro et al. 1997, Yang et al.
2009, Jankju 2013) through shade and increased water availability due to shading or hydraulic lift
(Zou et al. 2005, Prieto et al. 2012). Nurse plants also increase nutrient availability and cycling
through the accumulation of litter and increased decomposition due to higher soil moisture
(Rodríguez-Echeverría and Pérez-Fernández 2003, Armas et al. 2012) and microbial activity and
biomass (Hortal et al. 2013). All these mechanisms promote the establishment of a plant
community under the canopy of nurse plants including species that would otherwise be absent
without facilitator species (Armas et al. 2011).
The nurse effect has been mainly linked to plant age and canopy size and its buffering of physical
conditions underneath (Pugnaire et al. 1996a, Pugnaire et al. 1996b, Moro et al. 1997, Callaway
2007). As a consequence, understorey plant diversity and productivity increases with increasing
canopy size of the nurse (Pugnaire et al. 1996b, Schöb et al. 2013). Canopies also affect soil
chemical and physical properties underneath, increasing fertility under the canopy of nurse shrubs
compared to gaps (Pugnaire et al. 2004). Although changes promoted by nurse plant canopies on
soil properties and microclimatic conditions have been recognized as the main mechanism behind
the facilitative effects of nurses in arid conditions, the role of soil has been scantly addressed and
mostly considered a consequence not independent from canopy effects. Recent reports have
shown, however, that soil biota changes in composition, biomass and activity with shrub age
(Hortal et al. 2013) suggesting a potential role of soil microbial communities in the facilitation
process (Rodríguez-Echeverría et al. 2013). Moreover, the complex soil matrix under a nurse plant
species has intrinsic properties that may directly affect the development of understorey
communities. For instance, soil texture, soil organic matter contents and aggregation have an
CHAPTER 1. SOILS AFFECT PLAN PRODUCTIVITY AND DIVERSITY INDEPENDENTLY OF THE CANOPY EFFECT
26
effect on water dynamics and soil oxygenation, affecting the availability of dissolved nutrients and
root development (Porta-Casanellas et al. 2003, Rucks et al. 2004).
In an experiment in the field we addressed these points trying to tell apart the effects of soil origin
(collected under small, medium or large nurse shrubs) and canopy (small, medium or large
canopies) of the facilitator shrub species Retama sphaerocarpa on the plant community growing
underneath this shrub species.
1.3. OBJECTIVES
Our main objectives were 1) to determine whether there is an effect of soil on plant communities
growing under Retama sphaerocarpa, and whether this effect is independent of the canopy; and 2)
to assess the contribution of both soil origin and canopy size on plant diversity and productivity of
the understorey plant community.
1.4. HYPOTHESES
We hypothesized that, in addition to the well-known positive effect of the canopy associated to
size, there will be a strong effect of soil independent from the canopy influencing understorey
communities. We expected an increase in plant productivity, diversity and richness under the
canopy of large Retama shrubs compared to small shrubs, an in soils collected under large
Retama shrubs compared to soils collected under small shrubs, as well as a strong and
independent effect of soil on plant biomass and abundance per species.
1.5. METHODS
1.5.1. Field site and species
The field site was located in the Rambla del Saltador, a dry valley on the southern slope of the
Sierra de los Filabres mountain range, Almería, southeast Spain (37º08´N, º22´W; 630 m altitude).
The climate is semiarid Mediterranean, with a mean annual temperature of 16º C and mean annual
rainfall of 300 mm (Puigdefabregas et al. 1999). The soil is of alluvial origin, with a loamy sand
texture, characterized by low values of water holding capacity, electrical conductivity, cation
exchange capacity, organic matter, nutrient concentrations, and a moderate alkaline pH (Pugnaire
CHAPTER 1. SOILS AFFECT PLAN PRODUCTIVITY AND DIVERSITY INDEPENDENTLY OF THE CANOPY EFFECT
27
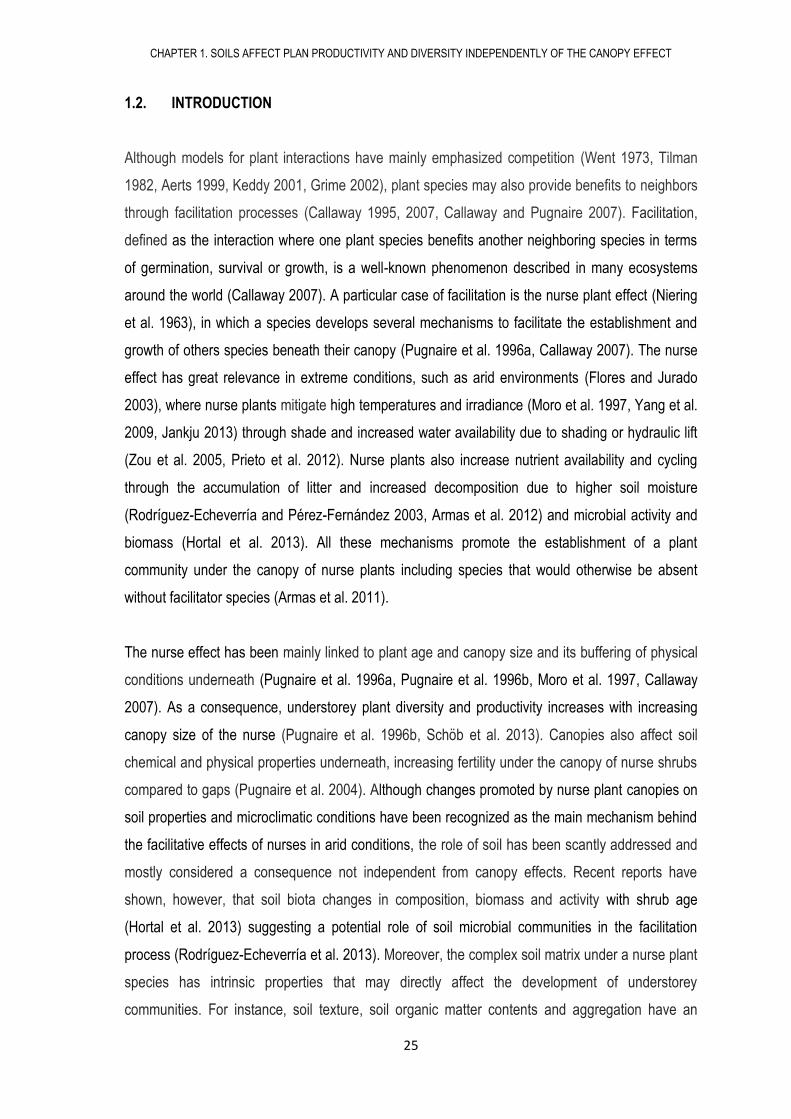
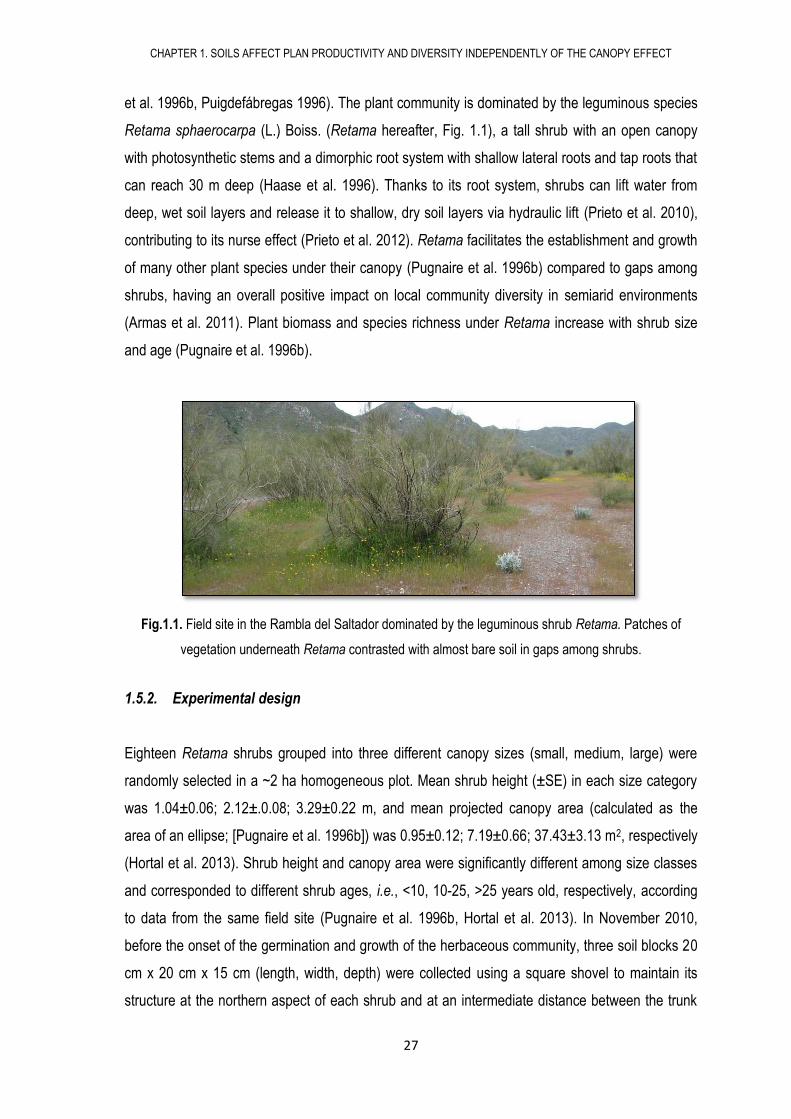
et al. 1996b, Puigdefábregas 1996). The plant community is dominated by the leguminous species
Retama sphaerocarpa (L.) Boiss. (Retama hereafter, Fig. 1.1), a tall shrub with an open canopy
with photosynthetic stems and a dimorphic root system with shallow lateral roots and tap roots that
can reach 30 m deep (Haase et al. 1996). Thanks to its root system, shrubs can lift water from
deep, wet soil layers and release it to shallow, dry soil layers via hydraulic lift (Prieto et al. 2010),
contributing to its nurse effect (Prieto et al. 2012). Retama facilitates the establishment and growth
of many other plant species under their canopy (Pugnaire et al. 1996b) compared to gaps among
shrubs, having an overall positive impact on local community diversity in semiarid environments
(Armas et al. 2011). Plant biomass and species richness under Retama increase with shrub size
and age (Pugnaire et al. 1996b).
Fig.1.1. Field site in the Rambla del Saltador dominated by the leguminous shrub Retama. Patches of
vegetation underneath Retama contrasted with almost bare soil in gaps among shrubs.
1.5.2. Experimental design
Eighteen Retama shrubs grouped into three different canopy sizes (small, medium, large) were
randomly selected in a ~2 ha homogeneous plot. Mean shrub height (±SE) in each size category
was 1.04±0.06; 2.12±.0.08; 3.29±0.22 m, and mean projected canopy area (calculated as the
area of an ellipse; [Pugnaire et al. 1996b]) was 0.95±0.12; 7.19±0.66; 37.43±3.13 m2, respectively
(Hortal et al. 2013). Shrub height and canopy area were significantly different among size classes
and corresponded to different shrub ages, i.e., <10, 10-25, >25 years old, respectively, according
to data from the same field site (Pugnaire et al. 1996b, Hortal et al. 2013). In November 2010,
before the onset of the germination and growth of the herbaceous community, three soil blocks 20
cm x 20 cm x 15 cm (length, width, depth) were collected using a square shovel to maintain its
structure at the northern aspect of each shrub and at an intermediate distance between the trunk
CHAPTER 1. SOILS AFFECT PLAN PRODUCTIVITY AND DIVERSITY INDEPENDENTLY OF THE CANOPY EFFECT
28
and the edge of the canopy, where microclimatic conditions, soil chemical fertility and soil seed
bank lead to high levels of productivity and diversity (Moro et al. 1997).
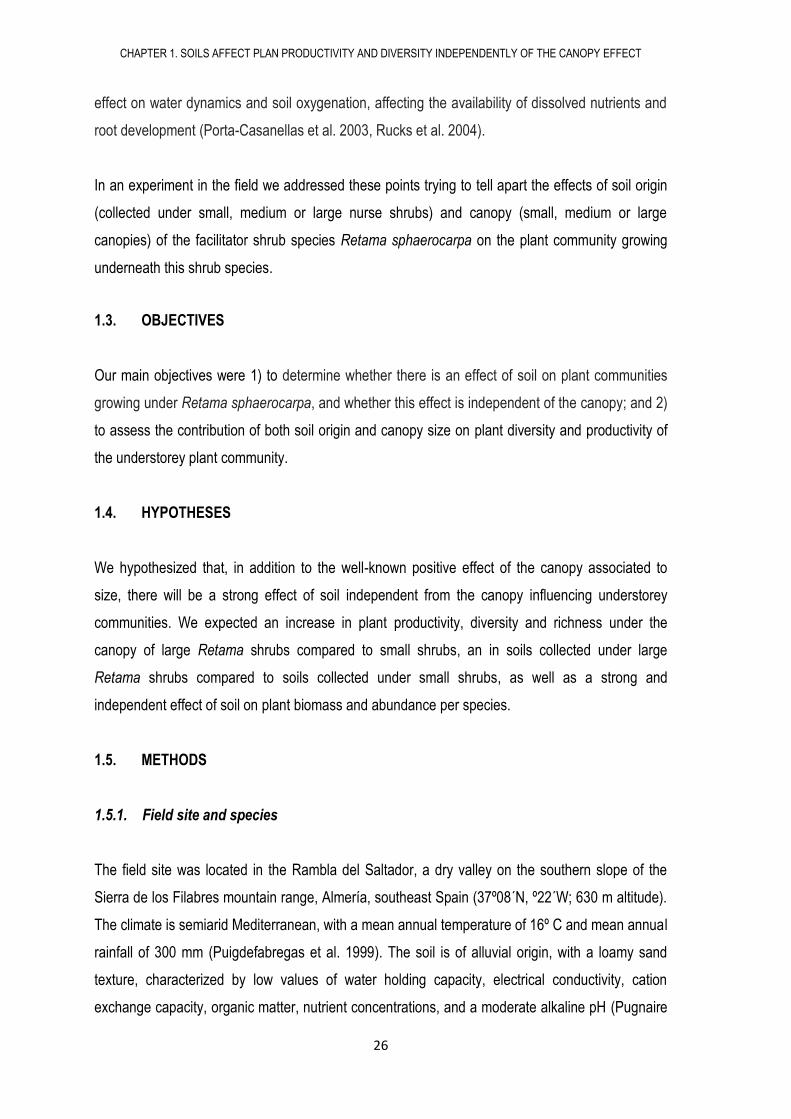
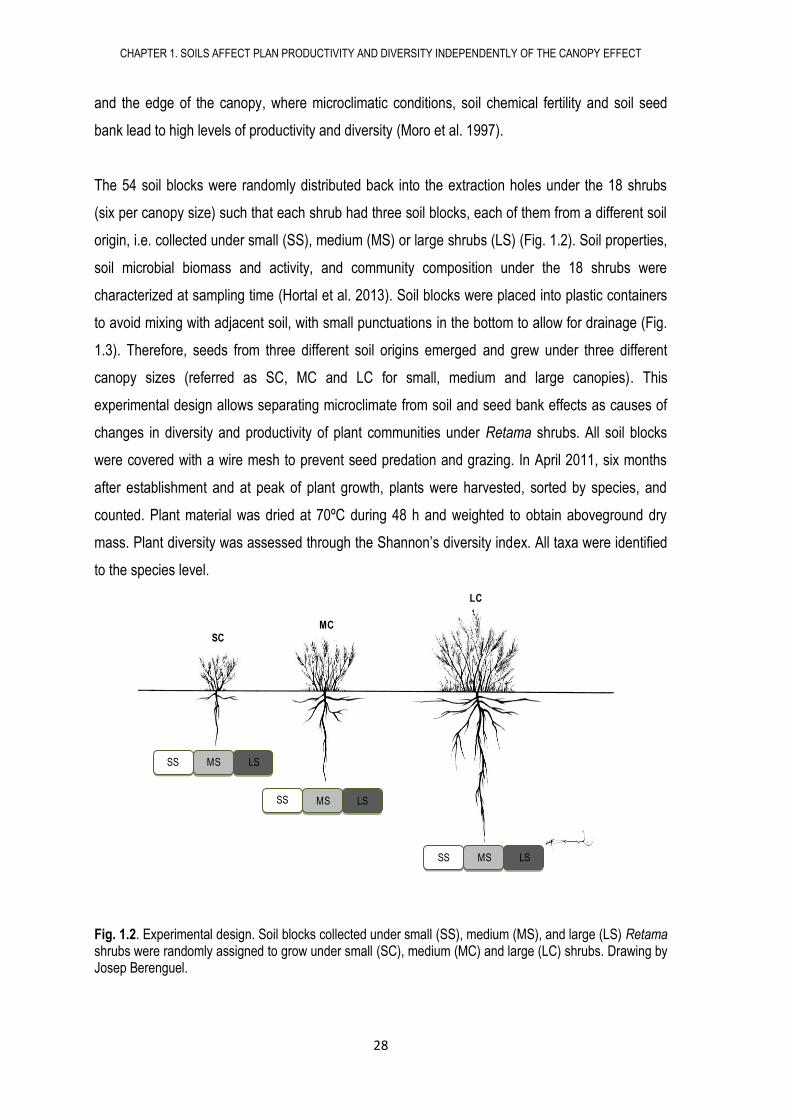
The 54 soil blocks were randomly distributed back into the extraction holes under the 18 shrubs
(six per canopy size) such that each shrub had three soil blocks, each of them from a different soil
origin, i.e. collected under small (SS), medium (MS) or large shrubs (LS) (Fig. 1.2). Soil properties,
soil microbial biomass and activity, and community composition under the 18 shrubs were
characterized at sampling time (Hortal et al. 2013). Soil blocks were placed into plastic containers
to avoid mixing with adjacent soil, with small punctuations in the bottom to allow for drainage (Fig.
1.3). Therefore, seeds from three different soil origins emerged and grew under three different
canopy sizes (referred as SC, MC and LC for small, medium and large canopies). This
experimental design allows separating microclimate from soil and seed bank effects as causes of
changes in diversity and productivity of plant communities under Retama shrubs. All soil blocks
were covered with a wire mesh to prevent seed predation and grazing. In April 2011, six months
after establishment and at peak of plant growth, plants were harvested, sorted by species, and
counted. Plant material was dried at 70ºC during 48 h and weighted to obtain aboveground dry
mass. Plant diversity was assessed through the Shannon’s diversity index. All taxa were identified
to the species level.
Fig. 1.2. Experimental design. Soil blocks collected under small (SS), medium (MS), and large (LS) Retama shrubs were randomly assigned to grow under small (SC), medium (MC) and large (LC) shrubs. Drawing by Josep Berenguel.
MS LS SS
MS LS SS
MS LS SS
SC MC
LC
CHAPTER 1. SOILS AFFECT PLAN PRODUCTIVITY AND DIVERSITY INDEPENDENTLY OF THE CANOPY EFFECT
29
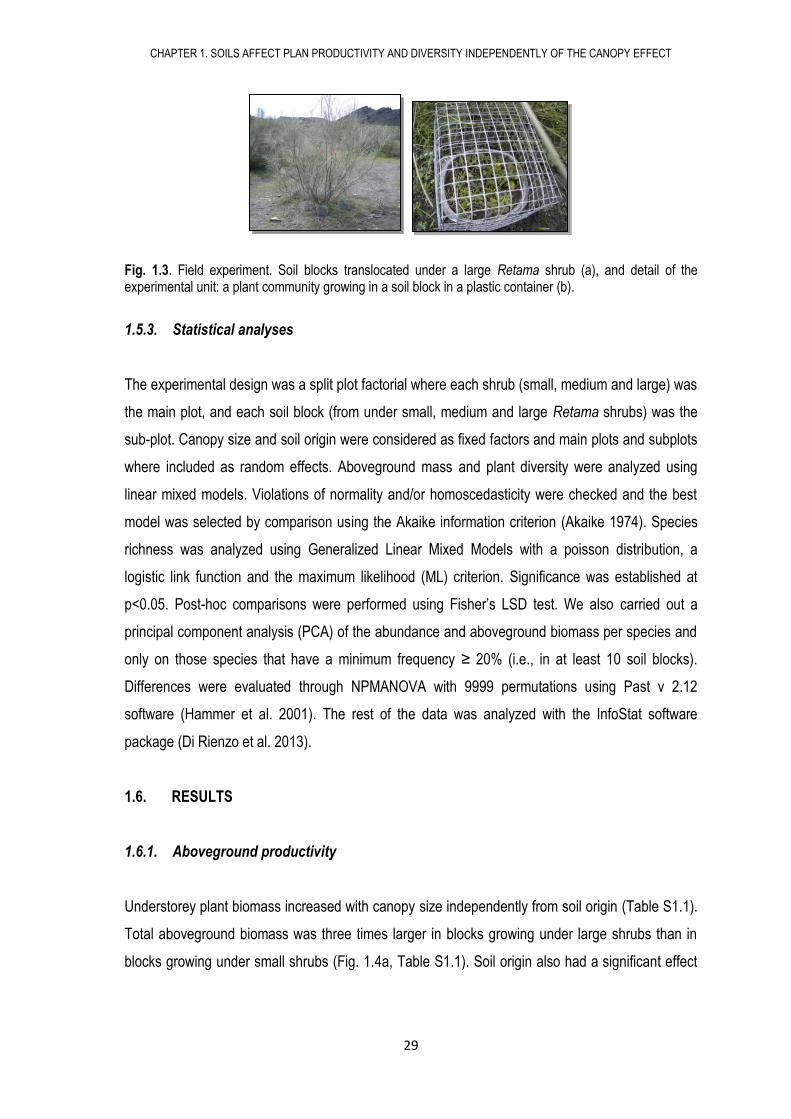
Fig. 1.3. Field experiment. Soil blocks translocated under a large Retama shrub (a), and detail of the experimental unit: a plant community growing in a soil block in a plastic container (b).
1.5.3. Statistical analyses
The experimental design was a split plot factorial where each shrub (small, medium and large) was
the main plot, and each soil block (from under small, medium and large Retama shrubs) was the
sub-plot. Canopy size and soil origin were considered as fixed factors and main plots and subplots
where included as random effects. Aboveground mass and plant diversity were analyzed using
linear mixed models. Violations of normality and/or homoscedasticity were checked and the best
model was selected by comparison using the Akaike information criterion (Akaike 1974). Species
richness was analyzed using Generalized Linear Mixed Models with a poisson distribution, a
logistic link function and the maximum likelihood (ML) criterion. Significance was established at
p<0.05. Post-hoc comparisons were performed using Fisher’s LSD test. We also carried out a
principal component analysis (PCA) of the abundance and aboveground biomass per species and
only on those species that have a minimum frequency ≥ 20% (i.e., in at least 10 soil blocks).
Differences were evaluated through NPMANOVA with 9999 permutations using Past v 2.12
software (Hammer et al. 2001). The rest of the data was analyzed with the InfoStat software
package (Di Rienzo et al. 2013).
1.6. RESULTS
1.6.1. Aboveground productivity
Understorey plant biomass increased with canopy size independently from soil origin (Table S1.1).
Total aboveground biomass was three times larger in blocks growing under large shrubs than in
blocks growing under small shrubs (Fig. 1.4a, Table S1.1). Soil origin also had a significant effect
CHAPTER 1. SOILS AFFECT PLAN PRODUCTIVITY AND DIVERSITY INDEPENDENTLY OF THE CANOPY EFFECT
30
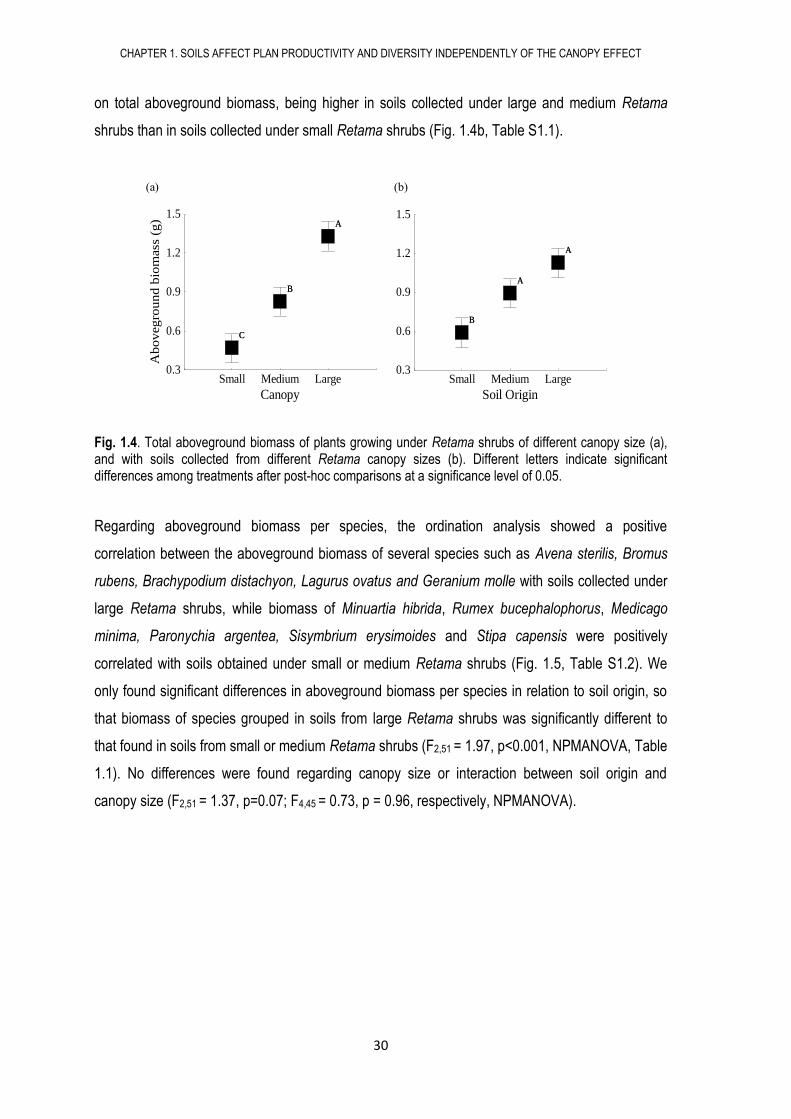
on total aboveground biomass, being higher in soils collected under large and medium Retama
shrubs than in soils collected under small Retama shrubs (Fig. 1.4b, Table S1.1).
Fig. 1.4. Total aboveground biomass of plants growing under Retama shrubs of different canopy size (a), and with soils collected from different Retama canopy sizes (b). Different letters indicate significant differences among treatments after post-hoc comparisons at a significance level of 0.05.
Regarding aboveground biomass per species, the ordination analysis showed a positive
correlation between the aboveground biomass of several species such as Avena sterilis, Bromus
rubens, Brachypodium distachyon, Lagurus ovatus and Geranium molle with soils collected under
large Retama shrubs, while biomass of Minuartia hibrida, Rumex bucephalophorus, Medicago
minima, Paronychia argentea, Sisymbrium erysimoides and Stipa capensis were positively
correlated with soils obtained under small or medium Retama shrubs (Fig. 1.5, Table S1.2). We
only found significant differences in aboveground biomass per species in relation to soil origin, so
that biomass of species grouped in soils from large Retama shrubs was significantly different to
that found in soils from small or medium Retama shrubs (F2,51 = 1.97, p<0.001, NPMANOVA, Table
1.1). No differences were found regarding canopy size or interaction between soil origin and
canopy size (F2,51 = 1.37, p=0.07; F4,45 = 0.73, p = 0.96, respectively, NPMANOVA).
(a) (b)
Small Medium Large
Canopy
0.3
0.6
0.9
1.2
1.5
Abovegro
und b
iom
ass
(g) A
B
C
A
B
C
ddd
Small Medium Large
Soil Origin
0.3
0.6
0.9
1.2
1.5
Ab
ov
eg
rou
nd
bio
mass
(g
)
A
A
B
A
A
B
dddd
CHAPTER 1. SOILS AFFECT PLAN PRODUCTIVITY AND DIVERSITY INDEPENDENTLY OF THE CANOPY EFFECT
31
Soil Origin
Aboveground biomass Abundance
Small (SS)
Medium (MS)
Large (LS)
Small (SS)
Medium (MS)
Large (LS)
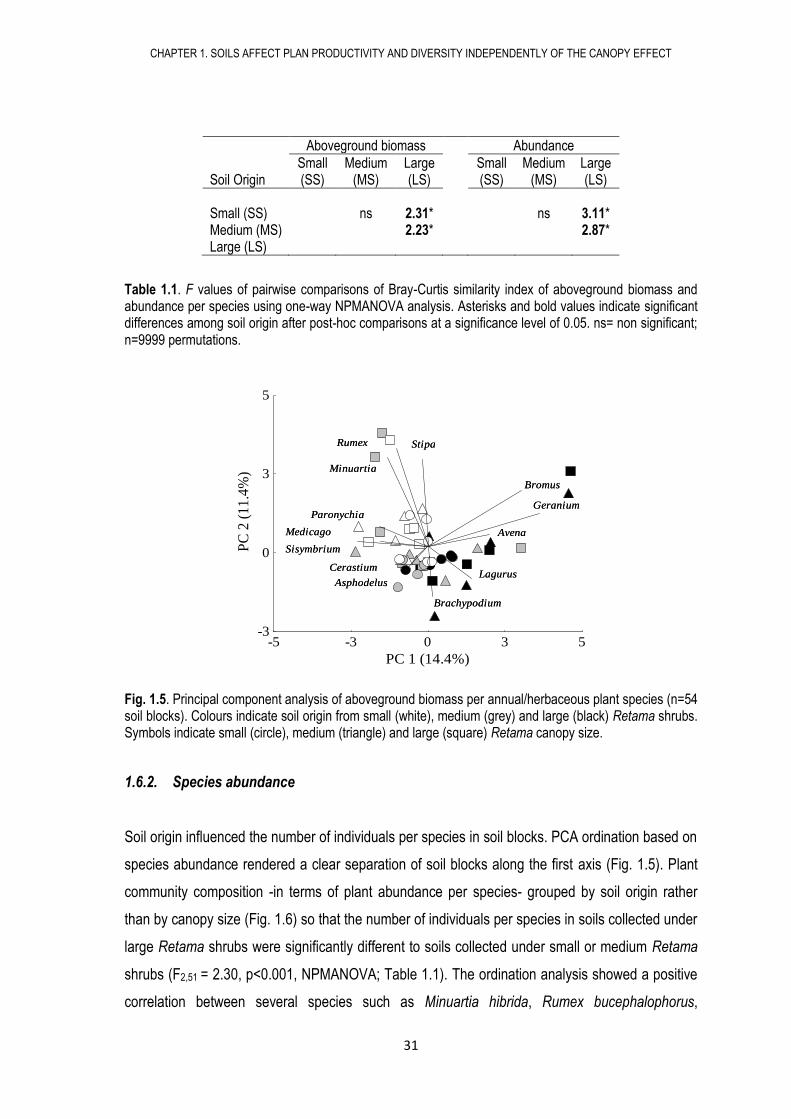
Small (SS) ns 2.31* ns 3.11* Medium (MS) 2.23* 2.87* Large (LS)
Table 1.1. F values of pairwise comparisons of Bray-Curtis similarity index of aboveground biomass and abundance per species using one-way NPMANOVA analysis. Asterisks and bold values indicate significant differences among soil origin after post-hoc comparisons at a significance level of 0.05. ns= non significant; n=9999 permutations.
Fig. 1.5. Principal component analysis of aboveground biomass per annual/herbaceous plant species (n=54 soil blocks). Colours indicate soil origin from small (white), medium (grey) and large (black) Retama shrubs. Symbols indicate small (circle), medium (triangle) and large (square) Retama canopy size.
1.6.2. Species abundance
Soil origin influenced the number of individuals per species in soil blocks. PCA ordination based on
species abundance rendered a clear separation of soil blocks along the first axis (Fig. 1.5). Plant
community composition -in terms of plant abundance per species- grouped by soil origin rather
than by canopy size (Fig. 1.6) so that the number of individuals per species in soils collected under
large Retama shrubs were significantly different to soils collected under small or medium Retama
shrubs (F2,51 = 2.30, p<0.001, NPMANOVA; Table 1.1). The ordination analysis showed a positive
correlation between several species such as Minuartia hibrida, Rumex bucephalophorus,
-5 -3 0 3 5
PC 1 (14.4%)
-3
0
3
5
PC
2 (
11
.4%
)
Asphodelus
Avena
Brachypodium
Bromus
Cerastium
Geranium
Lagurus
Minuartia
Medicago
Paronychia
Rumex Stipa
Sisymbrium
Asphodelus
Avena
Brachypodium
Bromus
Cerastium
Geranium
Lagurus
Minuartia
Medicago
Paronychia
Rumex Stipa
Sisymbrium
Título
CHAPTER 1. SOILS AFFECT PLAN PRODUCTIVITY AND DIVERSITY INDEPENDENTLY OF THE CANOPY EFFECT
32
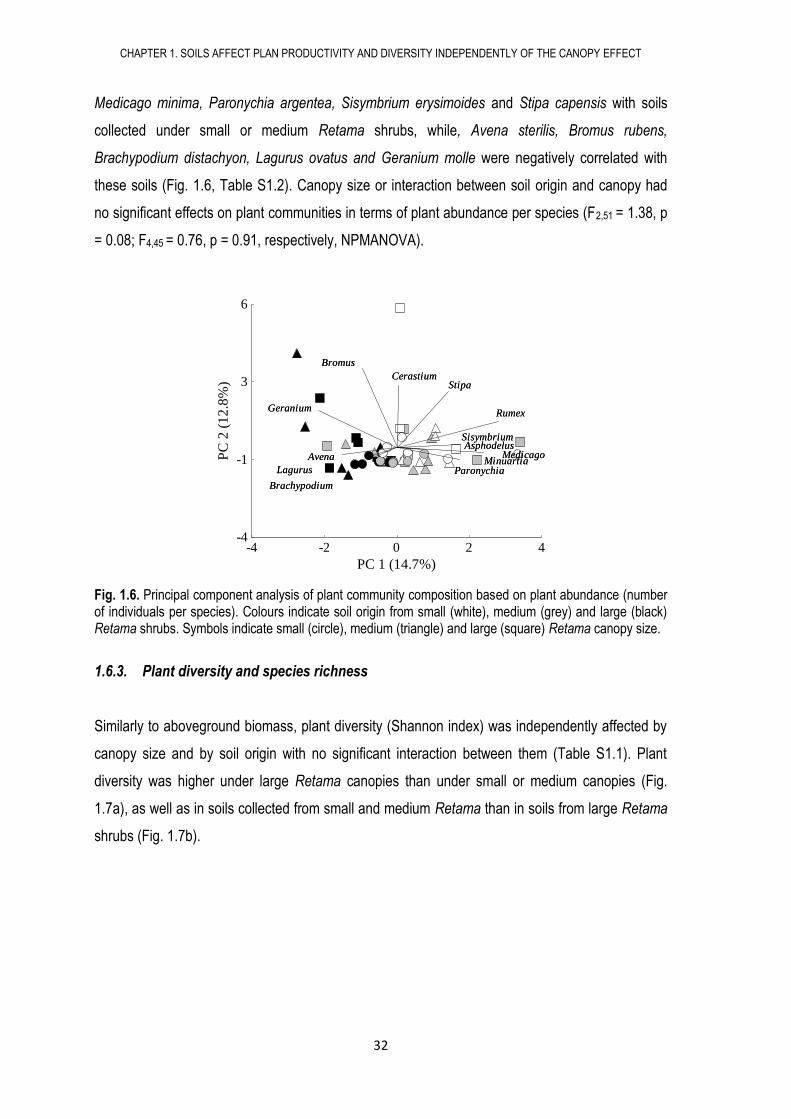
Medicago minima, Paronychia argentea, Sisymbrium erysimoides and Stipa capensis with soils
collected under small or medium Retama shrubs, while, Avena sterilis, Bromus rubens,
Brachypodium distachyon, Lagurus ovatus and Geranium molle were negatively correlated with
these soils (Fig. 1.6, Table S1.2). Canopy size or interaction between soil origin and canopy had
no significant effects on plant communities in terms of plant abundance per species (F2,51 = 1.38, p
= 0.08; F4,45 = 0.76, p = 0.91, respectively, NPMANOVA).
Fig. 1.6. Principal component analysis of plant community composition based on plant abundance (number of individuals per species). Colours indicate soil origin from small (white), medium (grey) and large (black) Retama shrubs. Symbols indicate small (circle), medium (triangle) and large (square) Retama canopy size.
1.6.3. Plant diversity and species richness
Similarly to aboveground biomass, plant diversity (Shannon index) was independently affected by
canopy size and by soil origin with no significant interaction between them (Table S1.1). Plant
diversity was higher under large Retama canopies than under small or medium canopies (Fig.
1.7a), as well as in soils collected from small and medium Retama than in soils from large Retama
shrubs (Fig. 1.7b).
-4 -2 0 2 4
PC 1 (14.7%)
-4
-1
3
6
PC
2 (
12
.8%
)
AsphodelusAvena
Brachypodium
Bromus
Cerastium
Geranium
Lagurus
MedicagoMinuartia
Paronychia
Rumex
Sisymbrium
Stipa
AsphodelusAvena
Brachypodium
Bromus
Cerastium
Geranium
Lagurus
MedicagoMinuartia
Paronychia
Rumex
Sisymbrium
Stipa
ssss
CHAPTER 1. SOILS AFFECT PLAN PRODUCTIVITY AND DIVERSITY INDEPENDENTLY OF THE CANOPY EFFECT
33
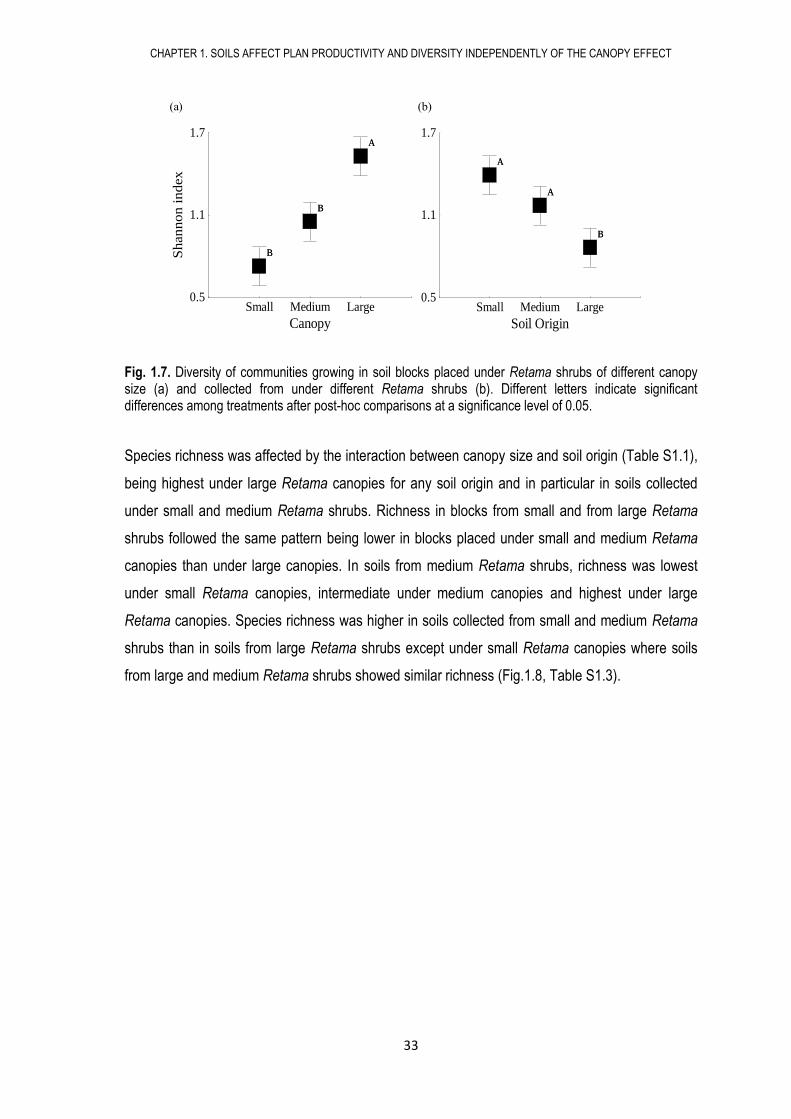
Fig. 1.7. Diversity of communities growing in soil blocks placed under Retama shrubs of different canopy size (a) and collected from under different Retama shrubs (b). Different letters indicate significant differences among treatments after post-hoc comparisons at a significance level of 0.05.
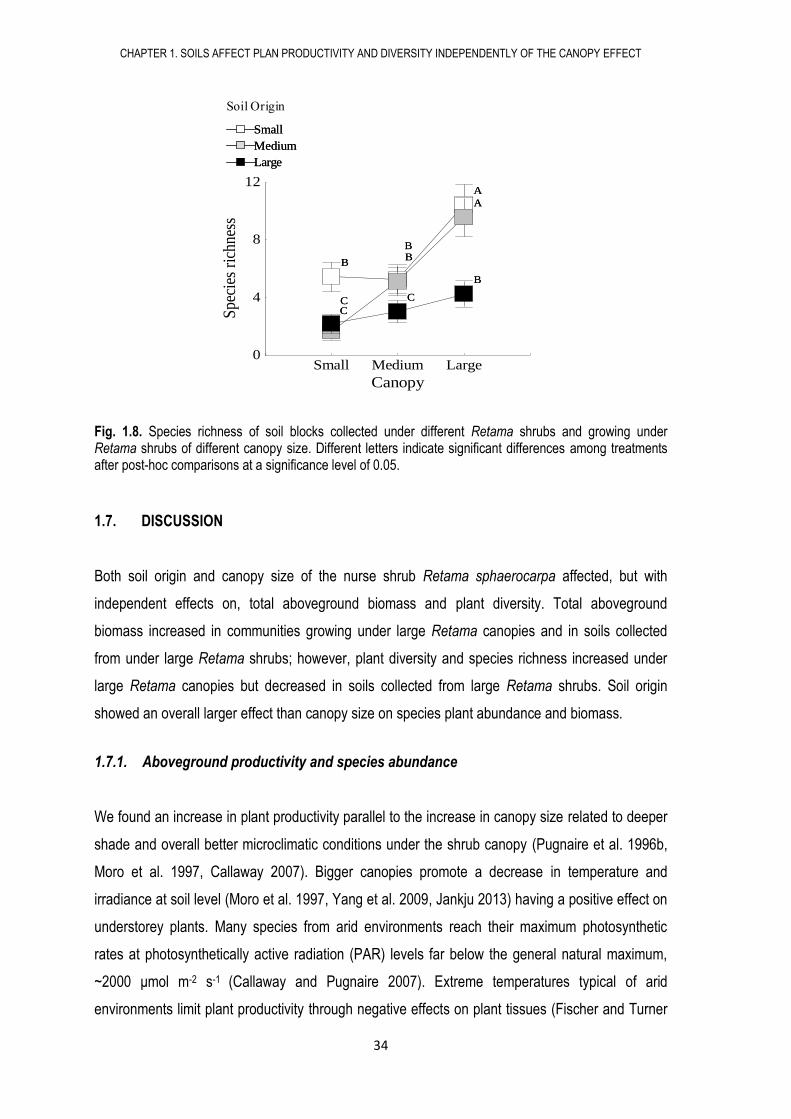
Species richness was affected by the interaction between canopy size and soil origin (Table S1.1),
being highest under large Retama canopies for any soil origin and in particular in soils collected
under small and medium Retama shrubs. Richness in blocks from small and from large Retama
shrubs followed the same pattern being lower in blocks placed under small and medium Retama
canopies than under large canopies. In soils from medium Retama shrubs, richness was lowest
under small Retama canopies, intermediate under medium canopies and highest under large
Retama canopies. Species richness was higher in soils collected from small and medium Retama
shrubs than in soils from large Retama shrubs except under small Retama canopies where soils
from large and medium Retama shrubs showed similar richness (Fig.1.8, Table S1.3).
Small Medium Large
Soil Origin
0.5
1.1
1.7
Shannon i
ndex
A
A
B
A
A
B
Título
Small Medium Large
Canopy
0.5
1.1
1.7
Shannon i
ndex
A
B
B
A
B
B
Título
(a) (b)
CHAPTER 1. SOILS AFFECT PLAN PRODUCTIVITY AND DIVERSITY INDEPENDENTLY OF THE CANOPY EFFECT
34
Fig. 1.8. Species richness of soil blocks collected under different Retama shrubs and growing under Retama shrubs of different canopy size. Different letters indicate significant differences among treatments after post-hoc comparisons at a significance level of 0.05.
1.7. DISCUSSION
Both soil origin and canopy size of the nurse shrub Retama sphaerocarpa affected, but with
independent effects on, total aboveground biomass and plant diversity. Total aboveground
biomass increased in communities growing under large Retama canopies and in soils collected
from under large Retama shrubs; however, plant diversity and species richness increased under
large Retama canopies but decreased in soils collected from large Retama shrubs. Soil origin
showed an overall larger effect than canopy size on species plant abundance and biomass.
1.7.1. Aboveground productivity and species abundance
We found an increase in plant productivity parallel to the increase in canopy size related to deeper
shade and overall better microclimatic conditions under the shrub canopy (Pugnaire et al. 1996b,
Moro et al. 1997, Callaway 2007). Bigger canopies promote a decrease in temperature and
irradiance at soil level (Moro et al. 1997, Yang et al. 2009, Jankju 2013) having a positive effect on
understorey plants. Many species from arid environments reach their maximum photosynthetic
rates at photosynthetically active radiation (PAR) levels far below the general natural maximum,
~2000 μmol m-2 s-1 (Callaway and Pugnaire 2007). Extreme temperatures typical of arid
environments limit plant productivity through negative effects on plant tissues (Fischer and Turner
Small Medium Large
Canopy
0
4
8
12
Spe
cies
ric
hnes
s
BB
A
C
B
A
C C
B
BB
A
C
B
A
C C
B
Título
Small
Medium
Large
Small Medium Large
Canopy
0.0
0.5
1.0
1.5
2.0
2.5
Sh
ann
on
in
dex
B
B
A
B
B
A
B
B
BB
B
A
B
B
A
B
B
B
Small
Medium
Large
Soil Origin
CHAPTER 1. SOILS AFFECT PLAN PRODUCTIVITY AND DIVERSITY INDEPENDENTLY OF THE CANOPY EFFECT
35
1978) and lead to greater water lost to transpiration as vapor pressure deficits increase with
temperature (Anderson 1936, Day 2000). Retama canopies decrease understorey temperatures
and daily amplitudes (Pugnaire et al. 2004) as well as soil water evaporation (Domingo et al.
1999), with an overall positive effect on aboveground biomass.
On the contrary, the poor aboveground biomass observed under small Retama shrubs was likely
due to the fact that their canopies do not have a shade as deep as large Retama canopies and
thus microclimatic conditions may be more similar to the dry, open spaces. Many species which
showed a suitable development with low shade, such as Stipa capensis or Paronychia argentea
(Pugnaire et al. 1996b, Boeken et al. 2004), increased their biomass when moved to better
microclimatic conditions such as medium and large Retama canopies. Previous studies under
Retama have also found higher mass of herbs under large Retama canopies than under small
Retama canopies also linked to a different plant composition (Pugnaire et al. 1996b, Schöb et al.
2013).
Although shade is considered a major facilitation factor in arid ecosystems (Moro et al. 1997,
Holmgren 2000), our results showed that soil effects on aboveground biomass of herbaceous plant
communities was independent of canopy effects. Total aboveground biomass was higher in soils
blocks collected under large Retama than in soils collected under small Retama shrubs. A recent
survey in the same Retama shrubs has shown an increase in soil nutrients, soil microbial biomass
and activity, as well as different soil microbial composition under large Retama than under small or
medium Retama shrubs (Hortal et al. 2013). This, added to the increase in soil moisture under
large shrubs (Pugnaire et al. 2004) and the increase in organic matter and nitrogen with age
(Pugnaire et al. 1996b), generate better soil conditions that promoted the highest total
aboveground biomass of understorey plants in soils from under large Retama shrubs.
Aboveground biomass and abundance per species were linked to soil origin rather than canopy
size. We observed that plant communities grown in soils from large Retama shrubs were clearly
different to plant communities grown in soils from medium and small Retama shrubs. For example,
Sisymbrium erysimoides, a species typical from low shade microhabitats (Pugnaire and Lázaro
2000) showed similar aboveground biomass under any Retama canopy size, but showed higher
aboveground biomass and abundance in soils from under small Retama than in soils from large
Retama shrubs; while Avena sterilis or Geranium molle, species typical from understorey
communities under Retama (Armas et al. 2011) were strongly facilitated by soil from large Retama
CHAPTER 1. SOILS AFFECT PLAN PRODUCTIVITY AND DIVERSITY INDEPENDENTLY OF THE CANOPY EFFECT
36
shrubs rather than Retama canopies. The soil origin effect could be explained because the
presence of Retama strongly modifies soil resources underneath its canopy (Pugnaire et al. 2004),
and soil characteristics such as the abundance and composition of soil seed bank (Aguiar and
Sala 1999, Díaz-Villa et al. 2003). It has positive effects on soil water holding capacity, soil
temperature (Moro et al. 1997, Pugnaire et al. 2004), porosity, aeration and buffering soil pH
(Porta-Casanellas et al. 2003) through the accumulation of soil organic matter. The presence of
Retama shrubs is also linked to an increase in soil nutrients (Rodríguez-Echeverría and Pérez-
Fernández 2003), soil microbial biomass and activity (Hortal et al. 2013) as well as an increase in
clay content (Sessitsch et al. 2001, Porta-Casanellas et al. 2003, Chapter II). All these factors
together could explain the observed increase in both aboveground biomass and abundance of
species in understorey plant communities irrespective of shrub canopy size.
1.7.2. Plant diversity and species richness
Similarly to different studies that have shown a positive relationship between canopy size and plant
diversity or species richness (Pugnaire et al. 1996b, Maestre and Cortina 2005) we also found that
plant diversity and richness significantly increased under large Retama canopies. However, we
found significantly lower diversity and richness in soil blocks collected from under large Retama
shrubs than in soil from under other origins. Our results showed that plant diversity was
independently affected by canopy size and soil origin while species richness was affected by the
interaction among them.
The increase in plant diversity and species richness under large Retama shrubs was linked to the
amelioration of microclimatic conditions under large Retama canopies. Under these large canopies
there are gradients of radiation and temperature that interact with gradients of litter accumulation
and nutrient distribution (Moro et al. 1997, Amarasekare and Possingham 2001) promoting
microhabitat heterogeneity and thus niche differentiation (Lambers et al. 2004). This phenomenon
may facilitate seed germination of more species and, thus, plant diversity and species richness
(Pugnaire et al. 1996b, Moro et al. 1997, Maestre and Cortina 2005). We suggest that seeds from
greater number of plant species might find their germination optimum under the more diverse
microhabitat conditions beneath large Retama shrubs leading to higher number of species that
germinate here compared to other more homogeneous microhabitats (smaller shrub canopy
sizes). In accordance, our results show that seeds of species such as Desmazeria rigida,
Diplotaxis virgata or Erodium cicutarium were present in soils from small or medium Retama
CHAPTER 1. SOILS AFFECT PLAN PRODUCTIVITY AND DIVERSITY INDEPENDENTLY OF THE CANOPY EFFECT
37
shrubs, which were much more diverse and species rich than soils from large Retama shrubs, but
they only germinated under large Retama shrubs. The positive canopy effect was also evident in
species richness of soils from medium Retama shrubs, which, unlike plant diversity, significantly
decreased under the hostile conditions of small Retama canopies compared to larger canopies.
Parallel to the increase in canopy size, the increase in microhabitat heterogeneity promoted seed
germination of both rare and abundant species and therefore a lower species evenness under
large canopies. Rare species such as Limonium lobatum, Valantua muralis, Calendula
tripterocarpa or Galium spurium as well abundant species such as Cerastium dichotomum,
Paronychia argentea or Medicago minima grew under better microhabitat conditions provided by
medium and large Retama shrubs. This low species evenness in soils from medium and large
Retama shrubs growing under medium and large Retama canopies was opposite to the observed
high species evenness in the same soils growing under small canopies. The more homogenous
microhabitat under small canopies promoted low species richness but high species evenness
explaining the similar plant diversity between small and medium Retama canopies.
Although we found high total aboveground biomass in soils collected under large Retama, plant
diversity and species richness showed an opposite pattern being lowest in soils from large Retama
shrubs. We expected that the better properties in soils from large Retama shrubs (higher soil
nutrient content, soil microbial biomass and activity) than in other soil origins (Pugnaire et al. 2004,
Hortal et al. 2013), should have promoted high plant diversity and species richness. However,
other factors linked to soil seed bank, seed dispersal, temporal climatic variation, conditions or
even soil biota may have caused the low levels of plant diversity and species richness in large
Retama soils.
It has been suggested that species composition of soil seed banks under Retama shrubs does not
change with shrub age (Pugnaire and Lázaro 2000). However, our results suggest the opposite.
We observed that species such as Hypochaeris glabra, Rumex bucephalophorus or Valantia
muralis and other 32 species (62% of total species richness) were not present in any of the soils
from large Retama shrubs as they did not germinate irrespective of microclimatic conditions (i.e,
Retama canopy size), whereas they germinated in soils from other origins. This suggests low
richness of soil seed bank from soil under large Retama shrubs, hostile conditions for seed
germination and, probably, positive plant-soil feedbacks with some dominant species. Soil seed
bank can sometimes show low similarity with aboveground plant diversity (Díaz-Villa et al. 2003)
CHAPTER 1. SOILS AFFECT PLAN PRODUCTIVITY AND DIVERSITY INDEPENDENTLY OF THE CANOPY EFFECT
38
since suitable places for seed deposition may not be suitable for seed germination and growth
(Rey and Alcántara 2000). However, in our system, the presence of large shrubs strongly modifies
seed dispersal patterns (Pulliam 1996, Aguiar and Sala 1999) hindering seed dispersal by wind
underneath large Retama shrubs. This would lead to a low species diversity and richness of the
soil seed bank under large Retama shrubs compared to a high diversity and richness in soils under
small and medium Retama shrubs that would translate into similar observed aboveground diversity
patterns.
We observed that some species increased their aboveground biomass and abundance in soils
from large Retama shrubs suggesting positive interactions with soil microorganisms (Bever 2003,
Van der Putten et al. 2013) or with soil nutrients (e.g., nitrophilous species Avena sterilis (Ruiz
Téllez et al. 2007)) that could cause competitive exclusion of other plant species (Callaway et al.
2002) reducing plant diversity and species richness. Finally, seed germination can also be affected
by a temporally variable environment (i.e., dry versus wet years) (Espigares and Peco 1993,
Pugnaire and Lázaro 2000). Our results suggest an important role of soil characteristics on seed
germination and plant recruitment, being this effect even greater than the canopy effect.
Overall these results suggest a parallel increase in plant productivity and diversity (Tilman et al.
1996) in relation to canopy size. Different microhabitat conditions under large Retama shrubs
(Moro et al. 1997) may have increased germination of more species and better conditions for plant
growth, increasing plant diversity and thus the likelihood that productive species were present (i.e.,
positive selection) (Loreau and Hector 2001, Lambers et al. 2004). However, our results also
showed an inverse relationship between plant productivity and diversity (Brooker and Callaghan
1998) in soils from different origin, which may happen in this nurse system as there is an
independent effect of the shrub canopy and soil on plant productivity and diversity. As discussed
above, total productivity in soils from large Retama increased due to the positive effects of soil
organic matter, nutrients, moisture, temperature and biota on productivity. However, limitations in
seed dispersal, temporally variable environment or competitive exclusion due to positive plant-soil
feedbacks with some species could explain the observed decrease in plant diversity in soils from
under large Retama shrubs.
CHAPTER 1. SOILS AFFECT PLAN PRODUCTIVITY AND DIVERSITY INDEPENDENTLY OF THE CANOPY EFFECT
39
1.8. CONCLUSIONS
We conclude that both canopy size and soil origin of the nurse shrub independently affected total
aboveground biomass, plant diversity and species richness of the understorey herbaceous
community. Total aboveground biomass increased under large Retama canopies and in soils from
under large Retama shrubs but, contrary to our expectations, plant diversity and species richness
decreased in soils collected from under large Retama shrubs. These results suggest both a
parallel and inverse relationship between productivity and diversity due to the independent effects
of canopy and soil on them. Nonetheless, soil origin had a larger influence than canopy size on
species aboveground biomass and abundance linked to soil seed bank composition, soil nutrients
and organic matter and soil biota. There is an array of complex processes that occur in the soil
matrix that need more attention to increase our understanding of the mechanisms that regulate
facilitation among plants.
1.9. APPENDIX
Effect Aboveground biomass Shannon index Species richness
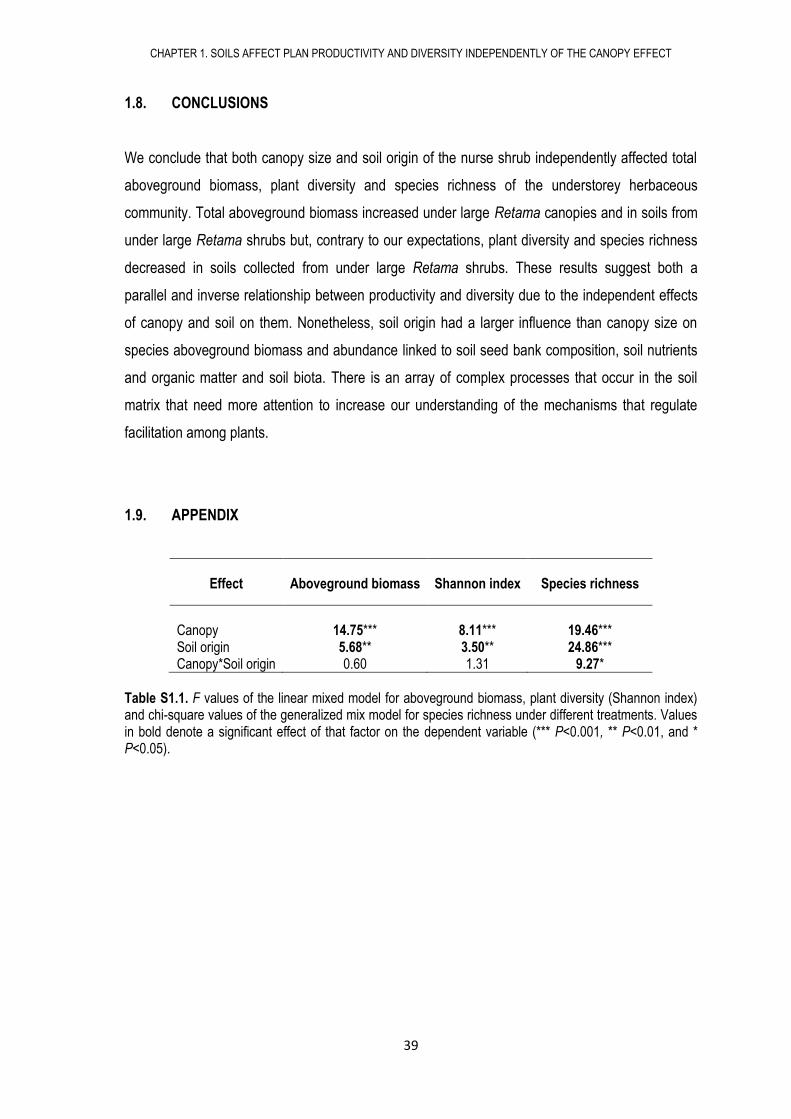
Canopy 14.75*** 8.11*** 19.46*** Soil origin 5.68** 3.50** 24.86*** Canopy*Soil origin 0.60 1.31 9.27*
Table S1.1. F values of the linear mixed model for aboveground biomass, plant diversity (Shannon index) and chi-square values of the generalized mix model for species richness under different treatments. Values in bold denote a significant effect of that factor on the dependent variable (*** P<0.001, ** P<0.01, and * P<0.05).
CHAPTER 1. SOILS AFFECT PLAN PRODUCTIVITY AND DIVERSITY INDEPENDENTLY OF THE CANOPY EFFECT
40
Aboveground biomass Abundance
Species E1 E2 E1 E2
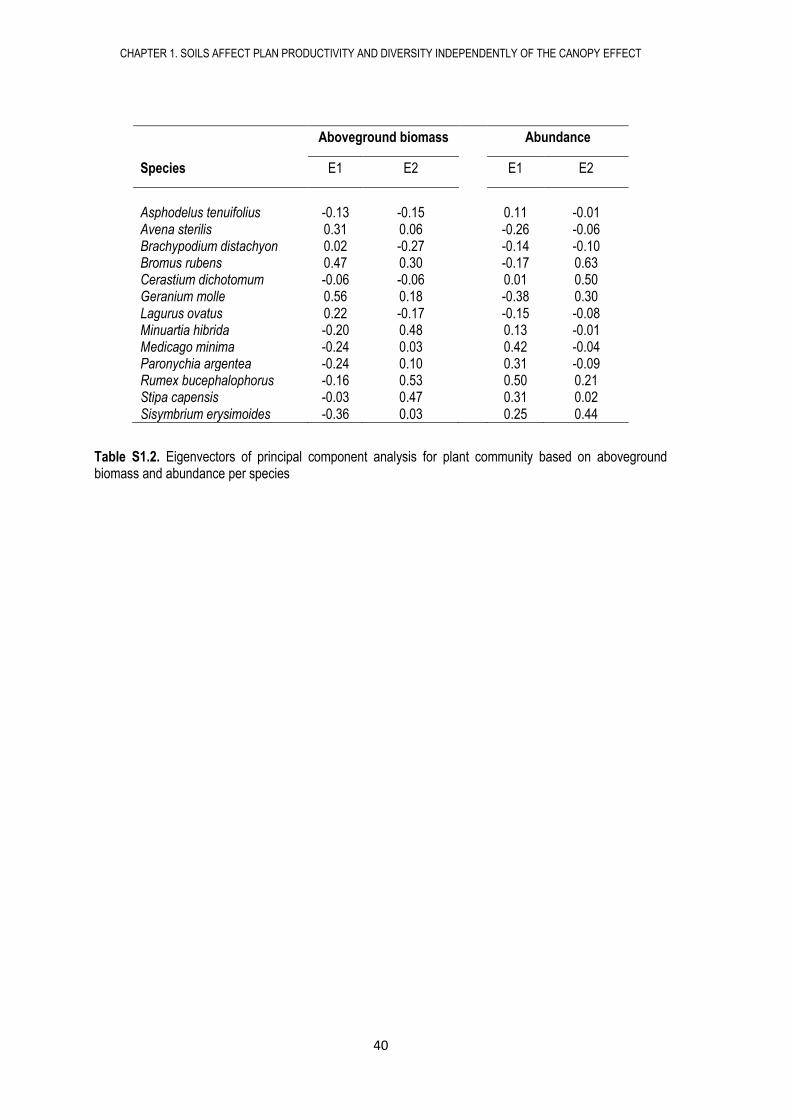
Asphodelus tenuifolius -0.13 -0.15 0.11 -0.01 Avena sterilis 0.31 0.06 -0.26 -0.06 Brachypodium distachyon 0.02 -0.27 -0.14 -0.10 Bromus rubens 0.47 0.30 -0.17 0.63 Cerastium dichotomum -0.06 -0.06 0.01 0.50 Geranium molle 0.56 0.18 -0.38 0.30 Lagurus ovatus 0.22 -0.17 -0.15 -0.08 Minuartia hibrida -0.20 0.48 0.13 -0.01 Medicago minima -0.24 0.03 0.42 -0.04 Paronychia argentea -0.24 0.10 0.31 -0.09 Rumex bucephalophorus -0.16 0.53 0.50 0.21 Stipa capensis -0.03 0.47 0.31 0.02 Sisymbrium erysimoides -0.36 0.03 0.25 0.44
Table S1.2. Eigenvectors of principal component analysis for plant community based on aboveground biomass and abundance per species
CHAPTER 1. SOILS AFFECT PLAN PRODUCTIVITY AND DIVERSITY INDEPENDENTLY OF THE CANOPY EFFECT
41
Small canopy (SC) Medium canopy (MC) Large canopy (LC)
Species /Soil Origin Small (SS)
Medium (MS)
Large (LS)
Small (SS)
Medium (MS)
Large (LS)
Small (SS)
Medium (MS)
Large (LS)
Andryala ragusina – – – 1 – – 1 1 – Asphodelus tenuifolius 3 2 2 2 2 1 3 2 1 Asterolinon linum-stellatum – – 1 1 1 1 – 1 – Avena sterilis 1 – 2 – 1 2 1 – 2 Brachypodium distachyon – – 2 – 1 1 1 2 3 Bromus diandrus 1 – 1 – – – 1 – 3 Bromus rubens 2 – – – 1 2 4 3 2 Calendula arvensis – – – – – – 1 1 – Calendula tripterocarpa – – – – – – 1 – – Campanula erinus 1 – – – – – – 2 – Centaurea melitensis – – – – – – 1 – – Cerastium dichotomum 2 1 – 1 1 1 3 2 1 Crucianella angustifolia 1 – – – – – – – – Desmazeria rigida – – – – – – 1 1 – Diplotaxis virgata – – – – – – – 2 – Erodium cicutarium – – – – – – – 2 – Galium spurium – – – – – – – 1 – Geranium molle 1 – 1 – 1 2 – 1 4 Hedypnois cretica 1 – – – – 1 2 1 – Hypochaeris glabra 1 – – – 2 – 3 1 – Lagurus ovatus – 1 – – 2 2 – 2 2 Leontodon hispidus – – – 1 1 1 1 2 – Leysera leyseroides – 1 – – – – 1 – – Limonium lobatum – – – – 1 – – – – Logfia minima 1 – – 1 – – 2 1 – Lolium rigidum 1 – – – – – 1 – – Malva parviflora – – – – – – – 1 – Medicago minima 2 – – 3 4 1 3 3 2 Medicago truncatula – – – 1 – – 3 1 – Minuartia funkii – – – 1 – – – – – Minuartia hybrida 2 – – 3 – – 3 2 – Paronychia argentea 2 – – 2 3 – 4 4 – Plantago albicans 2 – – 1 1 – 1 – 1 Plantago lagopus – – – – 1 – 2 3 – Polycarpon tetraphyllum – – – 1 – – 2 – – Reichardia intermedia – – 1 – 2 1 – – – Reichardia picroides – – – – – – – 1 – Reichardia tingitana – 2 – – – – 1 1 – Rostraria pumila – – – 2 1 – 1 – – Rumex bucephalophorus 1 1 – 2 1 – 2 2 – Silene decipiens 1 – – – – – 1 2 – Silene sclerocarpa 1 – – 1 – – – 1 – Sisymbrium erysimoides 4 3 1 3 3 – 3 3 2 Sonchus oleraceus – – 1 – – – – – – Sonchus tenerrimus – – 1 – – 1 – – 1 Spergularia rubra – 1 – – – – – – – Stipa capensis 2 – – 3 1 1 2 3 1 Trigonella monspeliaca – – – – – – 1 – – Trigonella polyceratia – – – 1 – – 1 – – Valantia muralis 1 – – – 1 – 1 1 – TOTAL SPECIES 22 8 10 19 21 14 33 32 13
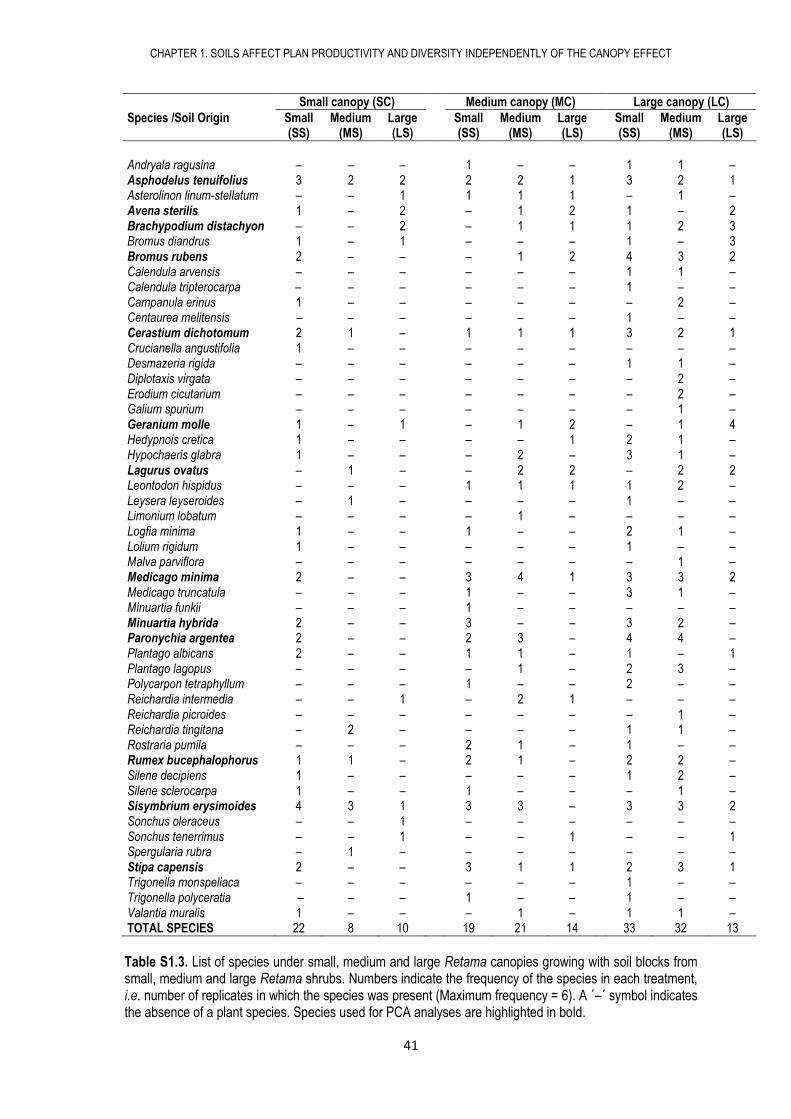
Table S1.3. List of species under small, medium and large Retama canopies growing with soil blocks from small, medium and large Retama shrubs. Numbers indicate the frequency of the species in each treatment, i.e. number of replicates in which the species was present (Maximum frequency = 6). A ´–´ symbol indicates the absence of a plant species. Species used for PCA analyses are highlighted in bold.
CHAPTER 2. FACILITATION MECHANISMS: EFFECTS OF SOIL MICROORGANISMS, MICROHABITAT AND SOIL PROPERTIES
42
2. ISOLATING NOVEL FROM WELL-KNOWN FACILITATION MECHANISMS:
EFFECTS OF SOIL MICROORGANISMS, MICROHABITAT AND SOIL PROPERTIES
IN A NURSE SYSTEM IN A SEMIARID ENVIRONMENT
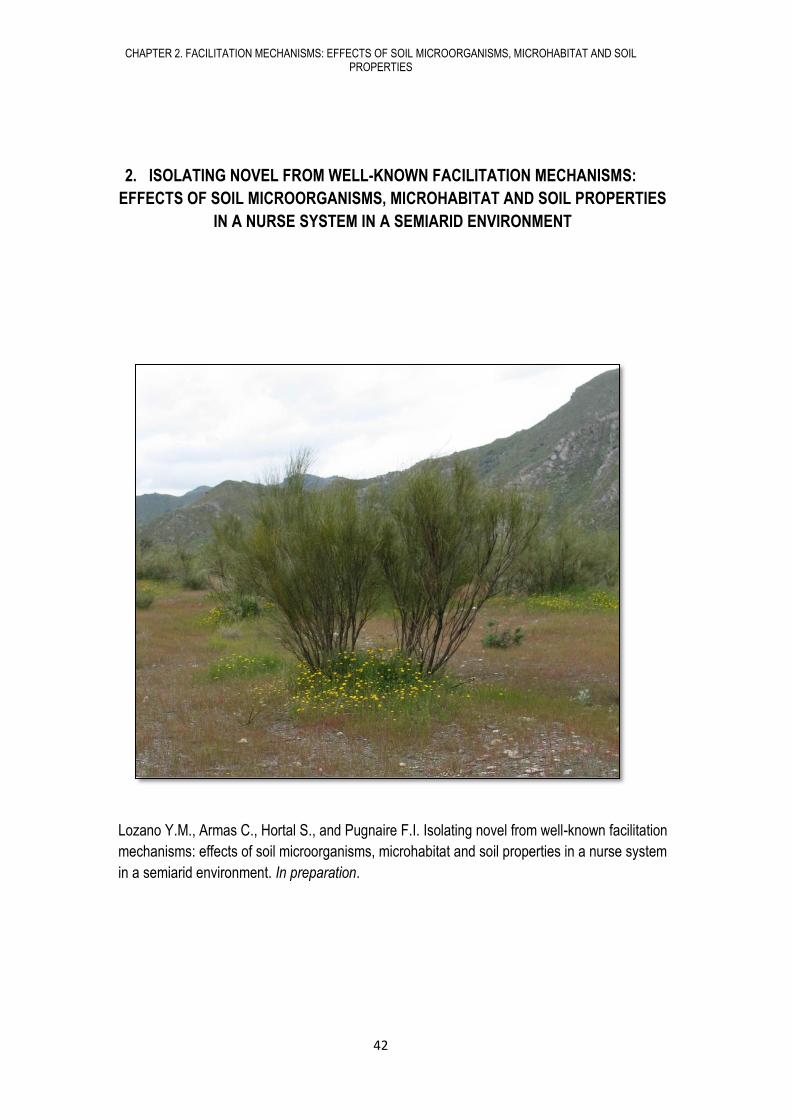
Lozano Y.M., Armas C., Hortal S., and Pugnaire F.I. Isolating novel from well-known facilitation
mechanisms: effects of soil microorganisms, microhabitat and soil properties in a nurse system
in a semiarid environment. In preparation.

43
CHAPTER 2. FACILITATION MECHANISMS: EFFECTS OF SOIL MICROORGANISMS, MICROHABITAT AND SOIL PROPERTIES
44
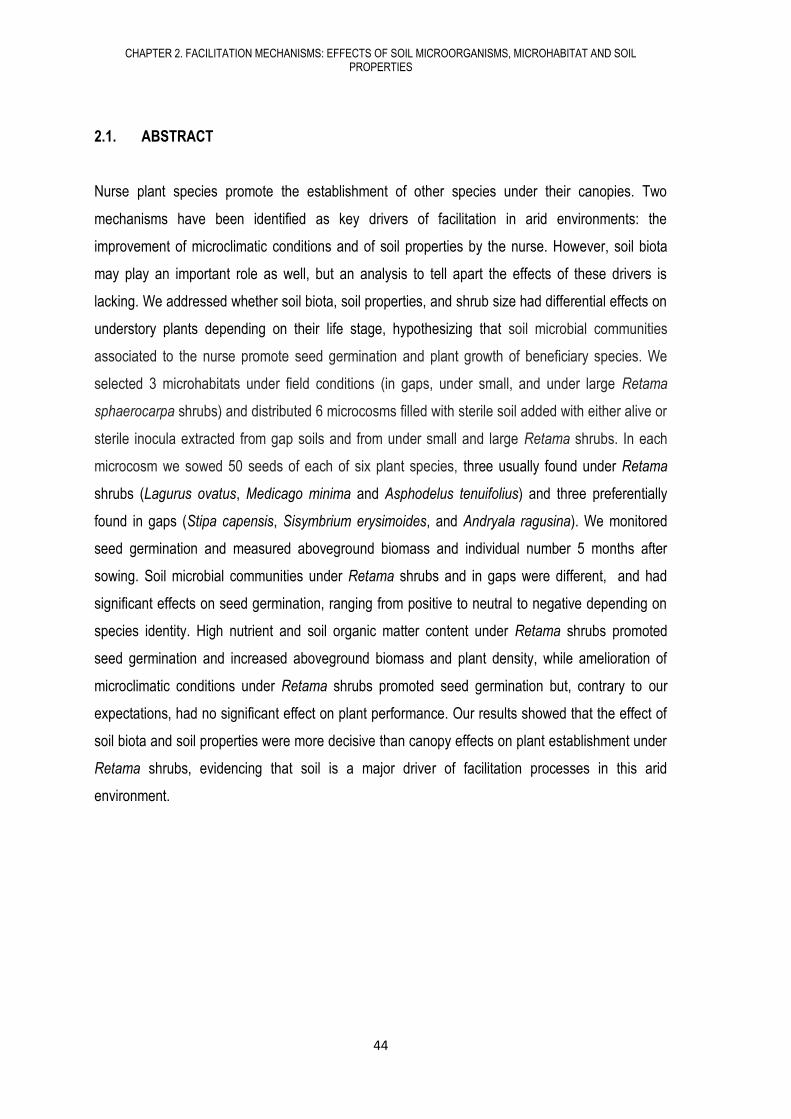
2.1. ABSTRACT
Nurse plant species promote the establishment of other species under their canopies. Two
mechanisms have been identified as key drivers of facilitation in arid environments: the
improvement of microclimatic conditions and of soil properties by the nurse. However, soil biota
may play an important role as well, but an analysis to tell apart the effects of these drivers is
lacking. We addressed whether soil biota, soil properties, and shrub size had differential effects on
understory plants depending on their life stage, hypothesizing that soil microbial communities
associated to the nurse promote seed germination and plant growth of beneficiary species. We
selected 3 microhabitats under field conditions (in gaps, under small, and under large Retama
sphaerocarpa shrubs) and distributed 6 microcosms filled with sterile soil added with either alive or
sterile inocula extracted from gap soils and from under small and large Retama shrubs. In each
microcosm we sowed 50 seeds of each of six plant species, three usually found under Retama
shrubs (Lagurus ovatus, Medicago minima and Asphodelus tenuifolius) and three preferentially
found in gaps (Stipa capensis, Sisymbrium erysimoides, and Andryala ragusina). We monitored
seed germination and measured aboveground biomass and individual number 5 months after
sowing. Soil microbial communities under Retama shrubs and in gaps were different, and had
significant effects on seed germination, ranging from positive to neutral to negative depending on
species identity. High nutrient and soil organic matter content under Retama shrubs promoted
seed germination and increased aboveground biomass and plant density, while amelioration of
microclimatic conditions under Retama shrubs promoted seed germination but, contrary to our
expectations, had no significant effect on plant performance. Our results showed that the effect of
soil biota and soil properties were more decisive than canopy effects on plant establishment under
Retama shrubs, evidencing that soil is a major driver of facilitation processes in this arid
environment.
CHAPTER 2. FACILITATION MECHANISMS: EFFECTS OF SOIL MICROORGANISMS, MICROHABITAT AND SOIL PROPERTIES
45
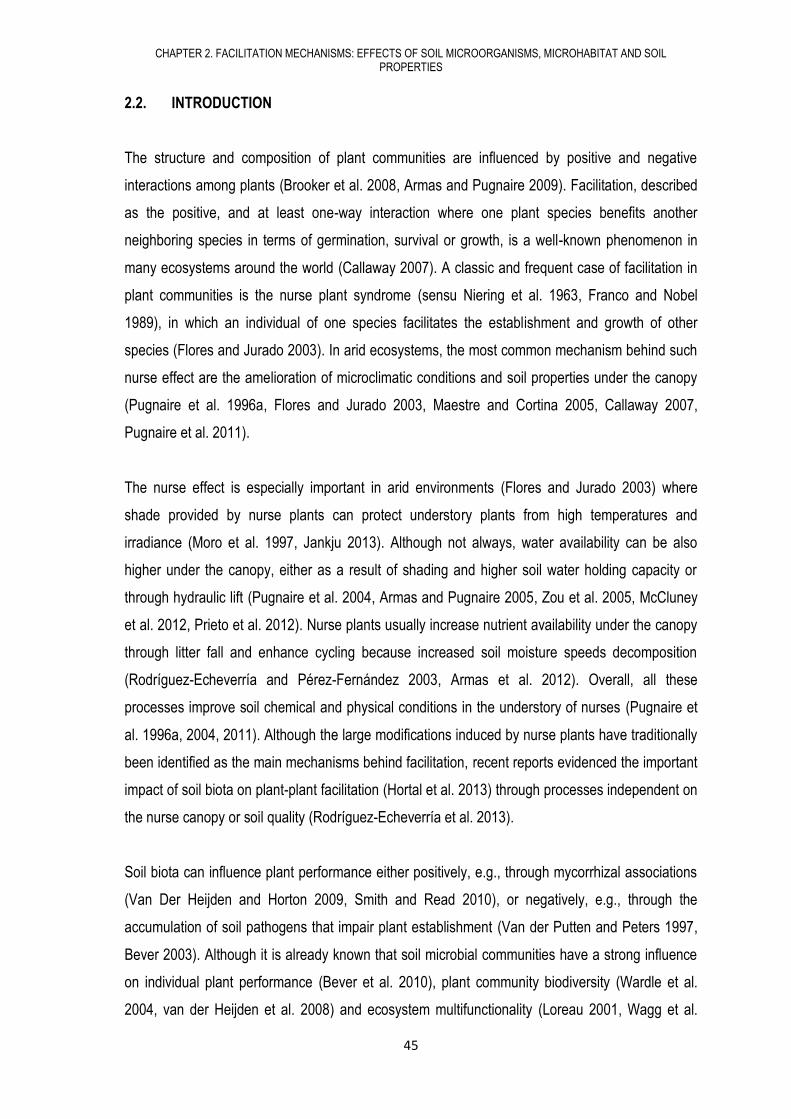
2.2. INTRODUCTION
The structure and composition of plant communities are influenced by positive and negative
interactions among plants (Brooker et al. 2008, Armas and Pugnaire 2009). Facilitation, described
as the positive, and at least one-way interaction where one plant species benefits another
neighboring species in terms of germination, survival or growth, is a well-known phenomenon in
many ecosystems around the world (Callaway 2007). A classic and frequent case of facilitation in
plant communities is the nurse plant syndrome (sensu Niering et al. 1963, Franco and Nobel
1989), in which an individual of one species facilitates the establishment and growth of other
species (Flores and Jurado 2003). In arid ecosystems, the most common mechanism behind such
nurse effect are the amelioration of microclimatic conditions and soil properties under the canopy
(Pugnaire et al. 1996a, Flores and Jurado 2003, Maestre and Cortina 2005, Callaway 2007,
Pugnaire et al. 2011).
The nurse effect is especially important in arid environments (Flores and Jurado 2003) where
shade provided by nurse plants can protect understory plants from high temperatures and
irradiance (Moro et al. 1997, Jankju 2013). Although not always, water availability can be also
higher under the canopy, either as a result of shading and higher soil water holding capacity or
through hydraulic lift (Pugnaire et al. 2004, Armas and Pugnaire 2005, Zou et al. 2005, McCluney
et al. 2012, Prieto et al. 2012). Nurse plants usually increase nutrient availability under the canopy
through litter fall and enhance cycling because increased soil moisture speeds decomposition
(Rodríguez-Echeverría and Pérez-Fernández 2003, Armas et al. 2012). Overall, all these
processes improve soil chemical and physical conditions in the understory of nurses (Pugnaire et
al. 1996a, 2004, 2011). Although the large modifications induced by nurse plants have traditionally
been identified as the main mechanisms behind facilitation, recent reports evidenced the important
impact of soil biota on plant-plant facilitation (Hortal et al. 2013) through processes independent on
the nurse canopy or soil quality (Rodríguez-Echeverría et al. 2013).
Soil biota can influence plant performance either positively, e.g., through mycorrhizal associations
(Van Der Heijden and Horton 2009, Smith and Read 2010), or negatively, e.g., through the
accumulation of soil pathogens that impair plant establishment (Van der Putten and Peters 1997,
Bever 2003). Although it is already known that soil microbial communities have a strong influence
on individual plant performance (Bever et al. 2010), plant community biodiversity (Wardle et al.
2004, van der Heijden et al. 2008) and ecosystem multifunctionality (Loreau 2001, Wagg et al.
CHAPTER 2. FACILITATION MECHANISMS: EFFECTS OF SOIL MICROORGANISMS, MICROHABITAT AND SOIL PROPERTIES
46
2014), the effect of soil microorganisms on the outcome of plant-plant interactions has been less
explored (Selosse et al. 2006, Kardol et al. 2007, Pendergast et al. 2013, Rodríguez-Echeverría et
al. 2013) and experiments in natural field conditions are just lacking.
In a recent observational study, Hortal et al. (2013) showed that soil microbial activity, along with
soil microbial biomass (fungi and bacteria) were much higher under the nurse shrub Retama
sphaerocarpa (L.) Boiss (hereafter Retama) than in open spaces without shrubs (hereafter gaps)
and that both soil microbial activity and biomass increased as the shrub aged. The relative
abundance of different microbial groups also changed with shrub age, with an increase in groups
such as Bacteroidetes and Proteobacteria and a decrease in Actinobacteria and Firmicutes. In
fact, the composition, activity and biomass of soil microbial communities in gaps and under the
canopy of large Retama shrubs were quite different (Hortal et al. 2013) and suggest that changes
are behind the great positive impact that large Retama shrubs have on their understory plant
community (Pugnaire et al. 1996b, Armas et al. 2011). In a greenhouse experiment, Rodríguez-
Echeverría et al. (2013) found that soil biota associated to Retama shrubs had a positive effect on
the biomass of an experimental plant community, as well as on the abundance and growth of
numerous plant species that usually grow in the understory of this nurse species. All this suggests
an important role of soil biota in addition to soil physico-chemical properties and canopy size on
plant-plant facilitation.
2.3. OBJECTIVES
In an experimental setup in field conditions we tried to disentangle the impact of each driver (soil
microorganisms, soil properties, and canopy) on the facilitation exerted by Retama on its
understory plant community.
Our main objectives were 1) to analyze whether seed germination, number of plants and plant
biomass were affected by soil microorganisms, soil properties or microhabitat; and 2) to determine
whether these drivers had different effects depending on the life stage of beneficiary plants.
CHAPTER 2. FACILITATION MECHANISMS: EFFECTS OF SOIL MICROORGANISMS, MICROHABITAT AND SOIL PROPERTIES
47
2.4. HYPOTHESIS
We hypothesized that soil microbial communities associated to the nurse shrub are integral part of
the facilitation effect of Retama, promoting seed germination and growth of understory plant
species, being as important as soil properties and microhabitat in this process.
2.5. METHODS
2.5.1. Field site and species
The field site was located in the Rambla del Saltador, a dry valley on the southern slope of the
Sierra de los Filabres mountain range, Almería, southeast Spain (37º08´N, º22´W; 630 m altitude).
The climate is semiarid Mediterranean, with a mean annual temperature of 16º C and mean annual
rainfall of 300 mm (Puigdefabregas et al. 1999). The soil is of alluvial origin, with a loamy sand
texture, characterized by low values of water holding capacity, electrical conductivity, cation
exchange capacity, organic matter, nutrient concentrations, and a moderate alkaline pH (Pugnaire
et al. 1996b, Puigdefábregas 1996)
The plant community is dominated by the leguminous shrub Retama sphaerocarpa, a tall shrub
with an open canopy with photosynthetic stems and a dimorphic root system with shallow lateral
roots and tap roots that can reach 30 m deep (Haase et al. 1996). Retama shrubs can lift water
from deep, wet soil layers and release it into shallow, dry soil layers (Prieto et al. 2010),
contributing to its nurse effect (Prieto et al. 2012). Retama shrub facilitates the establishment and
growth of many other plant species under their canopy (Pugnaire et al. 1996b) compared to gaps
among shrubs, having an overall positive impact on local community diversity in semiarid
environments (Armas et al. 2011, Schöb et al. 2013). Aboveground biomass and plant species
richness increase with Retama shrub size and age (Pugnaire et al. 1996b, Pugnaire and Lázaro
2000).
2.5.2. Soil sampling and inoculum preparation
In October 2011 we randomly selected 8 large Retama shrubs in a ~5 ha homogeneous plot. Near
each large shrub we selected one small Retama shrub and a gap in between (i.e., a total of 24
microhabitats). We collected soil from the top 10 cm in each microhabitat, combined the 8 samples
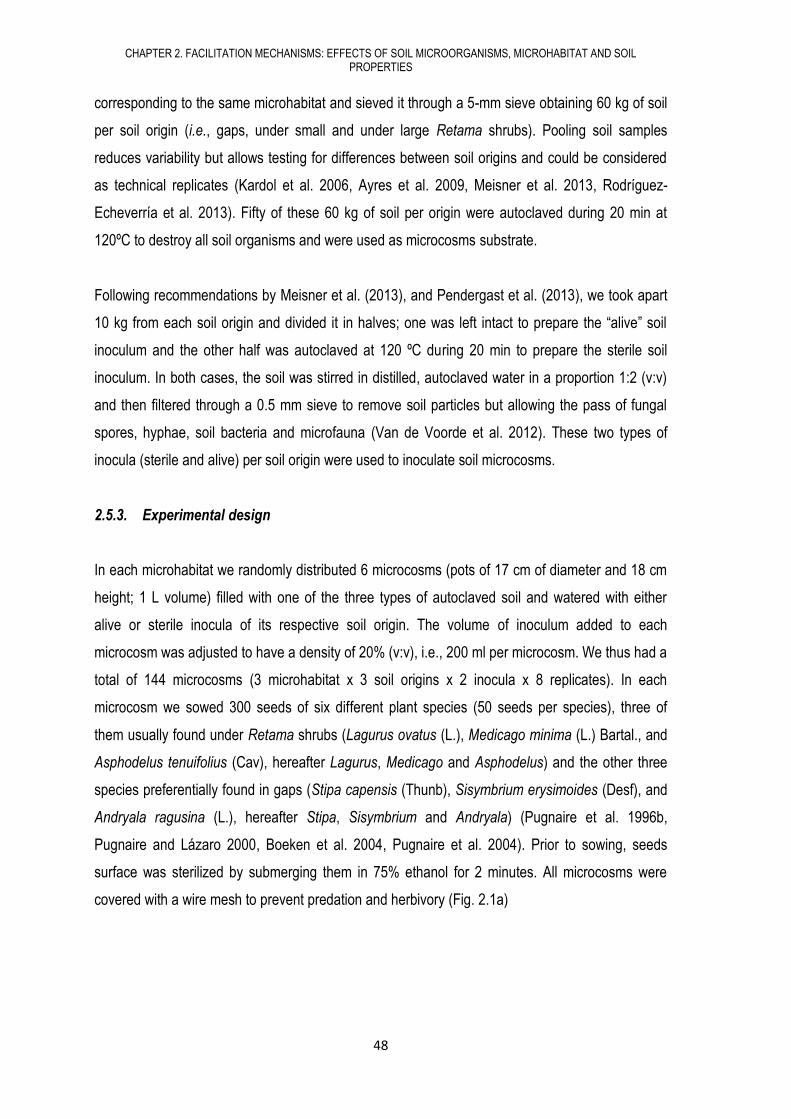
CHAPTER 2. FACILITATION MECHANISMS: EFFECTS OF SOIL MICROORGANISMS, MICROHABITAT AND SOIL PROPERTIES
48
corresponding to the same microhabitat and sieved it through a 5-mm sieve obtaining 60 kg of soil
per soil origin (i.e., gaps, under small and under large Retama shrubs). Pooling soil samples
reduces variability but allows testing for differences between soil origins and could be considered
as technical replicates (Kardol et al. 2006, Ayres et al. 2009, Meisner et al. 2013, Rodríguez-
Echeverría et al. 2013). Fifty of these 60 kg of soil per origin were autoclaved during 20 min at
120ºC to destroy all soil organisms and were used as microcosms substrate.
Following recommendations by Meisner et al. (2013), and Pendergast et al. (2013), we took apart
10 kg from each soil origin and divided it in halves; one was left intact to prepare the “alive” soil
inoculum and the other half was autoclaved at 120 ºC during 20 min to prepare the sterile soil
inoculum. In both cases, the soil was stirred in distilled, autoclaved water in a proportion 1:2 (v:v)
and then filtered through a 0.5 mm sieve to remove soil particles but allowing the pass of fungal
spores, hyphae, soil bacteria and microfauna (Van de Voorde et al. 2012). These two types of
inocula (sterile and alive) per soil origin were used to inoculate soil microcosms.
2.5.3. Experimental design
In each microhabitat we randomly distributed 6 microcosms (pots of 17 cm of diameter and 18 cm
height; 1 L volume) filled with one of the three types of autoclaved soil and watered with either
alive or sterile inocula of its respective soil origin. The volume of inoculum added to each
microcosm was adjusted to have a density of 20% (v:v), i.e., 200 ml per microcosm. We thus had a
total of 144 microcosms (3 microhabitat x 3 soil origins x 2 inocula x 8 replicates). In each
microcosm we sowed 300 seeds of six different plant species (50 seeds per species), three of
them usually found under Retama shrubs (Lagurus ovatus (L.), Medicago minima (L.) Bartal., and
Asphodelus tenuifolius (Cav), hereafter Lagurus, Medicago and Asphodelus) and the other three
species preferentially found in gaps (Stipa capensis (Thunb), Sisymbrium erysimoides (Desf), and
Andryala ragusina (L.), hereafter Stipa, Sisymbrium and Andryala) (Pugnaire et al. 1996b,
Pugnaire and Lázaro 2000, Boeken et al. 2004, Pugnaire et al. 2004). Prior to sowing, seeds
surface was sterilized by submerging them in 75% ethanol for 2 minutes. All microcosms were
covered with a wire mesh to prevent predation and herbivory (Fig. 2.1a)
CHAPTER 2. FACILITATION MECHANISMS: EFFECTS OF SOIL MICROORGANISMS, MICROHABITAT AND SOIL PROPERTIES
49
Fig. 2.1 Field experiment: Microcosms covered with a wire mesh distributed under large Retama shrub (a), and detail of the plants grown in a microcosm (b).
Sowing took place in November 2011 and the number of germinated seeds was tallied twenty days
later (Fig 2.1b). Microcosms were left in the field for 5 months, and then plants in each microcosm
were counted, harvested, and separated by species. Shoots were dried at 70ºC during 48 h and
weighted. Soil from each microcosm was also collected and divided in two halves; one was kept at
4ºC for physical and chemical analyses and another was kept at -80ºC for microbial analyses.
Although samples were stored a couple of months, we were more interested in analysing relative
differences among treatments than on the absolute values, we assumed these comparisons were
valid since all samples were stored in the same conditions.
2.5.4. Soil analyses
Soil properties were measured in soils from each origin after inoculation with either alive or sterile
inocula at the start of experiment (n=3). Soil electrical conductivity (EC) and pH were obtained
using an aqueous solution of 1:5 for EC and 1:2.5 for pH (w:v), with a conductivity- and pH-meters
(Crison, BA, Spain), respectively. Total soil carbon (C), organic C after removal of inorganic C with
HCL 2N (Schumacher 2002) and total nitrogen (N) content were determined using a C/N analyzer
(LECO Truspec, MI, USA). Anion phosphate (PO43-), nitrate (NO3
-), and sulphate (SO42-)
concentrations in water extract (1:10 soil:water) were analyzed by HPLC (Metrohm, HE,
Switzerland). Percentage of clay, sand and silt were measured by the Robinson method.
2.5.5. Soil microbial community composition
Molecular analyses were performed on autoclaved soil samples from gaps and from under large
Retama shrubs that were watered with their respective alive inoculum at the beginning of the
CHAPTER 2. FACILITATION MECHANISMS: EFFECTS OF SOIL MICROORGANISMS, MICROHABITAT AND SOIL PROPERTIES
50
experiment (2 soil origin x 1 inoculum x 3 replicates). Moreover, at the end of the experiment (five
months after sowing), we collected soil samples from gap soils placed in gaps and from large
Retama soils placed under large Retama canopies inoculated at the beginning of the experiment
with either alive or sterile inoculum (2 soil origin x 2 inocula x 3 replicates). DNA was extracted
from 0.25 g of homogenized soil from each of the 18 soil samples using the PowerSoil® DNA
Isolation Kit (MO BIO Laboratories, Inc., Carlsbad, USA) following the manufacturer’s directions. A
16S rDNA gene fragment corresponding to V3 to V6 regions was amplified using primers 357F
with Roche adaptor B (5`CTATCCCCTGTGTGCCTTGGCAGTCTCAGCCTACGGGAGGCAGCAG
3`) and 926 Rb (5` CCATCTCATCCCTGCGTGTCTCCGACTCAGNNNNNNNNNNNNCCGTCAAT
TYMTTTRAGT 3`) that included Roche adaptor A and 12 base-pair barcode (Sim et al. 2012).
Each sample was amplified in quadruplicate to reduce random mispriming bias (Polz and
Cavanaugh 1998). Amplicons were combined in a single tube in equimolar concentrations and the
pooled amplicon mixture was purified twice (AMPure XP kit, Agencourt, Takeley, United Kingdom).
DNA concentration was quantified using the PicoGreen® assay (Sim et al. 2012). This pool was
prepared and pyrosequenced in a Roche Genome Sequencer FLX System (Roche, Basel,
Switzerland) using 454 Titanium chemistry at Lifesequencing lab (Valencia, Spain).
Sequences were trimmed for primers, filtered and demultiplexed using the pyrosequencing pipeline
from the Ribosomal Database Project (RDP, Michigan State Univ., USA). Sequences shorter than
150 bp, with quality scores <20 or containing any unresolved nucleotides were removed from the
dataset. We used Acacia software version 1.52 (Bragg et al. 2012) for pyrosequencing noise
removal using default parameters for error correction. We established a minimum average quality
threshold of 30 and all sequences were trimmed to a maximum length of 570 bp. Chimeras were
identified using Uchime tool (Edgar et al. 2011) from RDP pipeline and removed from the dataset.
Retained sequences were aligned using the Aligner tool from the RDP pipeline and then were
clustered into operational taxonomic units (OTUs) defined at 97% similarity cutoff using the
complete linkage clustering tool of the RDP pipeline. Taxonomic assignation of sequences was
performed using the RDP naïve Bayesian classifier (Wang et al. 2007) at a confidence level of 80
%, and relative abundances of the different phyla, classes, subclasses, order and main genus per
each of the 18 samples were calculated.
CHAPTER 2. FACILITATION MECHANISMS: EFFECTS OF SOIL MICROORGANISMS, MICROHABITAT AND SOIL PROPERTIES
51
2.5.6. Statistical analyses
The experimental design was a split plot factorial design where each replicate of each microhabitat
was the main plot (a total of 24), and each microcosm (pots with one type of soil origin and one
respective soil inoculum) was the subplot (a total of 6). Microhabitat type (gaps, under small and
under large Retama shrubs), soil origin (from gaps, under small and under large Retama shrubs),
type of inoculum (alive and sterile), and plant species (Lagurus, Sisymbrium and Stipa; 3 out of the
6 initial species sown, see results) were considered as fixed factors, and main plots and subplots
where included as random effects. Aboveground biomass per plant was square root-transformed
(Ramette 2007) and analyzed using General Linear Mixed Models that included number of
neighbors as covariate. Spatial correlation was modeled with a compound symmetry correlation
structure (corCompSymm) that considers a uniform correlation among seeds within a pot (the 300
seeds within each pot were sown at random). We tested several variance structures to avoid
heteroscedasticity and selected the best one (varIdent) by comparison using the Akaike
information criterion (Akaike 1974). VarIdent represents a variance structure with different
variances for different strata (Gałecki and Burzykowski 2013). To select the most parsimonious
model with lowest AIC, we compared the models using the likelihood ratio test and performed a
graphical inspection of their residues distribution. The maximum likelihood estimation was
calculated using the restricted maximum likelihood (REML) criterion. The total number of plants
that survived at the end of the experiment with neighbors as covariate, the number of seeds that
germinated and the relative abundance of microbial groups were analyzed using Generalized
Linear Mixed Models with a binomial distribution, a logistic link function and the maximum
likelihood (ML) criterion. Significance was established at p<0.05. Post-hoc comparisons were
performed using DGC test (Di Rienzo et al. 2002). Differences in soil properties at the beginning of
the experiment were evaluated by using linear models. Analyses were done with InfoStat-
Statistical Software (Di Rienzo et al. 2013). Results shown throughout the text and figures are
mean values ± 1 SE.
Similarity among bacterial community composition (with OTUs showing at least 5 reads in the
overall dataset) were analyzed with principal coordinates analysis (PCoA) using Bray-Curtis
similarity index. Differences among treatments were evaluated performing a NPMANOVA with
9999 permutations using Past v 2.12 software (Hammer et al. 2001) and multivariate mean
comparisons (gDGC test) based on cluster analysis, using diagonal covariance matrix with a single
linkage and Monte Carlo simulation with 500 permutations (Valdano and Di Rienzo 2008).
CHAPTER 2. FACILITATION MECHANISMS: EFFECTS OF SOIL MICROORGANISMS, MICROHABITAT AND SOIL PROPERTIES
52
Shannon’s diversity index of OTUs per sample was calculated with Past software after excluding
singletons (OTUs only showing 1 read in the overall dataset) to reduce the overestimation of
diversity (Tedersoo et al. 2010).
2.6. RESULTS
2.6.1. Seed germination
There was no germination of Medicago or Andryala seeds in any of the microcosms 20 days after
sowing, and only few Asphodelus seeds germinated (less than 1.2 ± 0.1 seeds per pot with 52% of
pots lacking any germination). We thus discarded these three species from further analyses.
Alive soil inoculum (i.e., with soil microorganisms) had a significant effect on seed germination but
its effects were mediated by the other experimental factors (i.e., there was a significant “species x
microhabitat x soil origin x inoculum” interaction, Table S2.1). Germination was greatest in soils
from under Retama shrubs and lowest in soils from gaps (Figs. 2.2 and S2.1) in any microhabitat.
The number of germinated Lagurus and Sisymbrium seeds was higher with alive than with sterile
inocula irrespective of soil origin (Fig. 2.2a, b). On the contrary, alive inocula from gaps or from
small Retama soils had a negative effect on germination of Stipa seeds, whereas there were no
differences between sterile or alive inocula from soils collected under large Retama shrubs (Fig.
2.2c). Germination was also affected by microhabitat, being lowest in gaps for all plant species.
For both Lagurus and Sysimbrium, germination was highest under large Retama canopies and
intermediate under small Retama canopies (whit alive inocula) while Stipa germination was similar
under the two Retama canopies (Fig. S2.1).
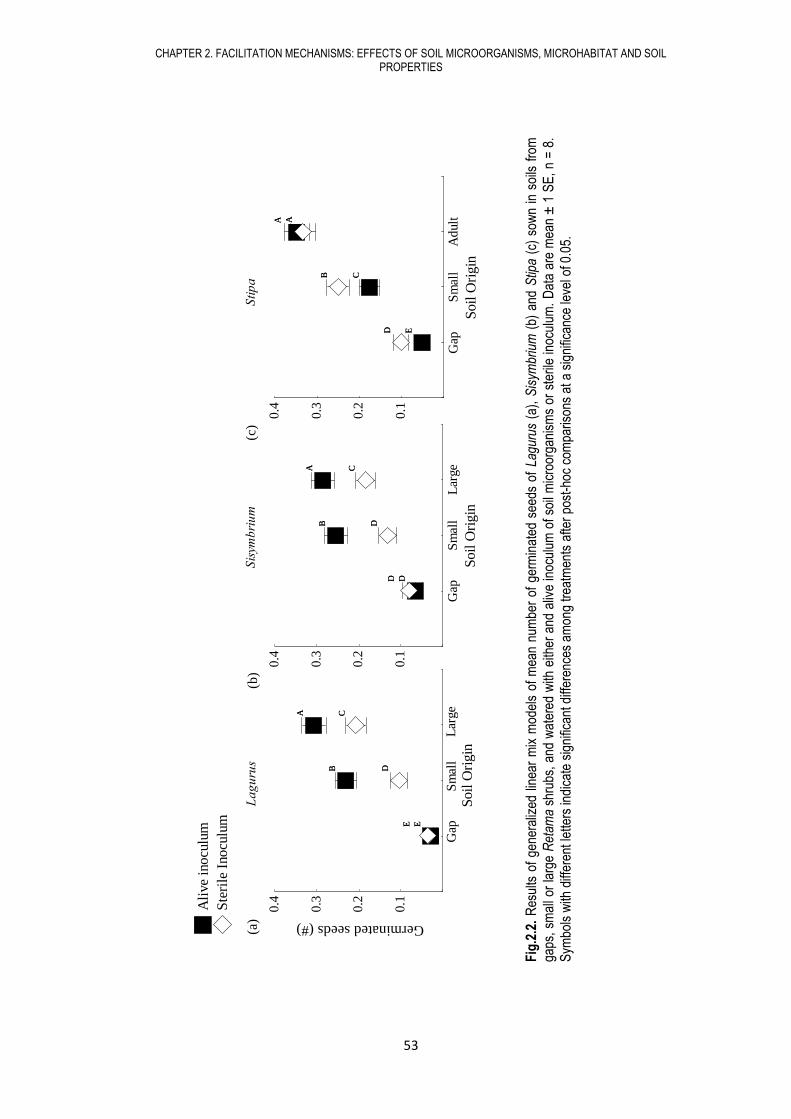
CHAPTER 2. FACILITATION MECHANISMS: EFFECTS OF SOIL MICROORGANISMS, MICROHABITAT AND SOIL PROPERTIES
53
(a)
(b)
(c)
La
gu
rus
Sis
ymb
riu
mS
tip
a
Gap
Sm
all
Lar
ge
Soil
Ori
gin
0.1
0.2
0.3
0.4
Germinated seeds (#)
D
A
B D
D
C
D
A
B D
D
C
Sis
ym_
25
74
Gap
Sm
all
Adult
Soil
Ori
gin
0.1
0.2
0.3
0.4
Germinated seeds (#)
E
A
C
A
B
D E
A
C
A
B
D
Stip
a-2
57
4
Gap
Sm
all
Lar
ge
Soil
Ori
gin
0.1
0.2
0.3
0.4
Germinated seeds (#)
B
E
A C
D
E
B
E
A C
D
E
Lag
_2
574
Ali
ve
inocu
lum
Ste
rile
Inocu
lum
Gap
Sm
all
Lar
ge
Soil
Ori
gin
0.1
0.2
0.3
0.4
Germinated seeds (#)
B
E
A C
D
E
B
E
A C
D
E
Lag
_2574
Ali
ve
inocu
lum
Ste
rile
Inocu
lum
Fig
.2.2
. R
esul
ts o
f ge
nera
lized
lin
ear
mix
mod
els
of m
ean
num
ber
of g
erm
inat
ed s
eeds
of
Lagu
rus
(a),
Sis
ymbr
ium
(b)
and
Stip
a (c
) so
wn
in s
oils
fro
m
gaps
, sm
all o
r la
rge
Ret
ama
shru
bs,
and
wat
ered
with
eith
er a
nd a
live
inoc
ulum
of
soil
mic
roor
gani
sms
or s
teril
e in
ocul
um.
Dat
a ar
e m
ean
± 1
SE
, n
= 8
.
Sym
bols
with
diff
eren
t let
ters
indi
cate
sig
nific
ant d
iffer
ence
s am
ong
trea
tmen
ts a
fter
post
-hoc
com
paris
ons
at a
sig
nific
ance
leve
l of 0
.05.
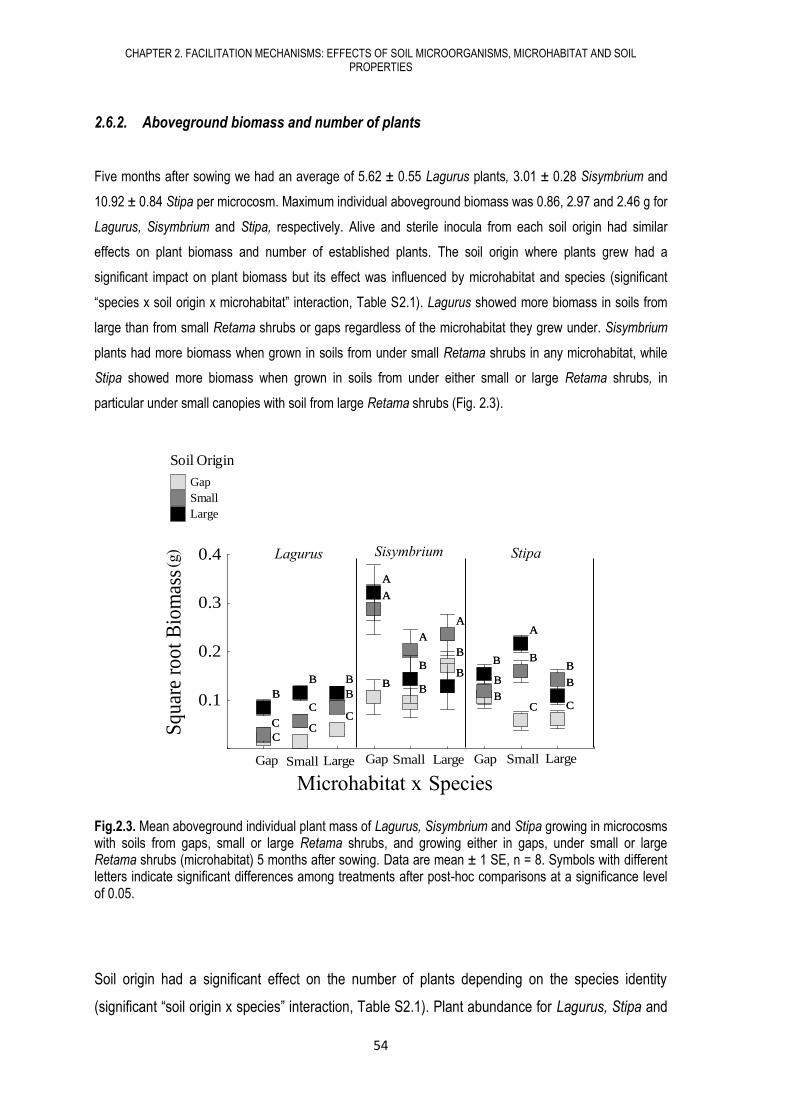
CHAPTER 2. FACILITATION MECHANISMS: EFFECTS OF SOIL MICROORGANISMS, MICROHABITAT AND SOIL PROPERTIES
54
2.6.2. Aboveground biomass and number of plants
Five months after sowing we had an average of 5.62 ± 0.55 Lagurus plants, 3.01 ± 0.28 Sisymbrium and
10.92 ± 0.84 Stipa per microcosm. Maximum individual aboveground biomass was 0.86, 2.97 and 2.46 g for
Lagurus, Sisymbrium and Stipa, respectively. Alive and sterile inocula from each soil origin had similar
effects on plant biomass and number of established plants. The soil origin where plants grew had a
significant impact on plant biomass but its effect was influenced by microhabitat and species (significant
“species x soil origin x microhabitat” interaction, Table S2.1). Lagurus showed more biomass in soils from
large than from small Retama shrubs or gaps regardless of the microhabitat they grew under. Sisymbrium
plants had more biomass when grown in soils from under small Retama shrubs in any microhabitat, while
Stipa showed more biomass when grown in soils from under either small or large Retama shrubs, in
particular under small canopies with soil from large Retama shrubs (Fig. 2.3).
Fig.2.3. Mean aboveground individual plant mass of Lagurus, Sisymbrium and Stipa growing in microcosms with soils from gaps, small or large Retama shrubs, and growing either in gaps, under small or large Retama shrubs (microhabitat) 5 months after sowing. Data are mean ± 1 SE, n = 8. Symbols with different letters indicate significant differences among treatments after post-hoc comparisons at a significance level of 0.05.
Soil origin had a significant effect on the number of plants depending on the species identity
(significant “soil origin x species” interaction, Table S2.1). Plant abundance for Lagurus, Stipa and
Gap
Small
Large
Gap Small Large Gap Small Large Gap Small Large
Microhabitat*Species
0.1
0.2
0.3
0.4
Sq
uar
e ro
ot
Bio
mas
s
B
B
BB
CCC
CC
A
A
A
BB
B
B
C
C
A
A
BB
BB B B
B
B
B
BB
CCC
CC
A
A
A
BB
B
B
C
C
A
A
BB
BB B B
B
3 sp (Raiz (Biomass/ind)
Gap
Small
Large
Lagurus Sisymbrium Stipa
(g)
Microhabitat x Species
Gap
Small
Large
Gap Small Large Gap Small Large Gap Small Large
Canopy*Specie
0.1
0.2
0.3
0.4
Sq
uar
e ro
ot
Bio
mas
s
B
BBB
CCC
C C
A
A
A
BB
B
B
C
C
A
A
BB
BB B B
B
B
BBB
CCC
C C
A
A
A
BB
B
B
C
C
A
A
BB
BB B B
B
3 sp (Raiz (Biomass/ind)
Gap
Small
Large
Soil Origin Gap Soil
Small Retama Soil
Large Retama Soil
Lagurus Sisymbrium Stipa
Species
0.1
0.2
0.3
Pla
nts
(#
)
CCC
BBB
A A
B
CCC
BBB
A A
B
1106-S*Sp
Gap Soil
Small Retama Soil
Large Retama Soil
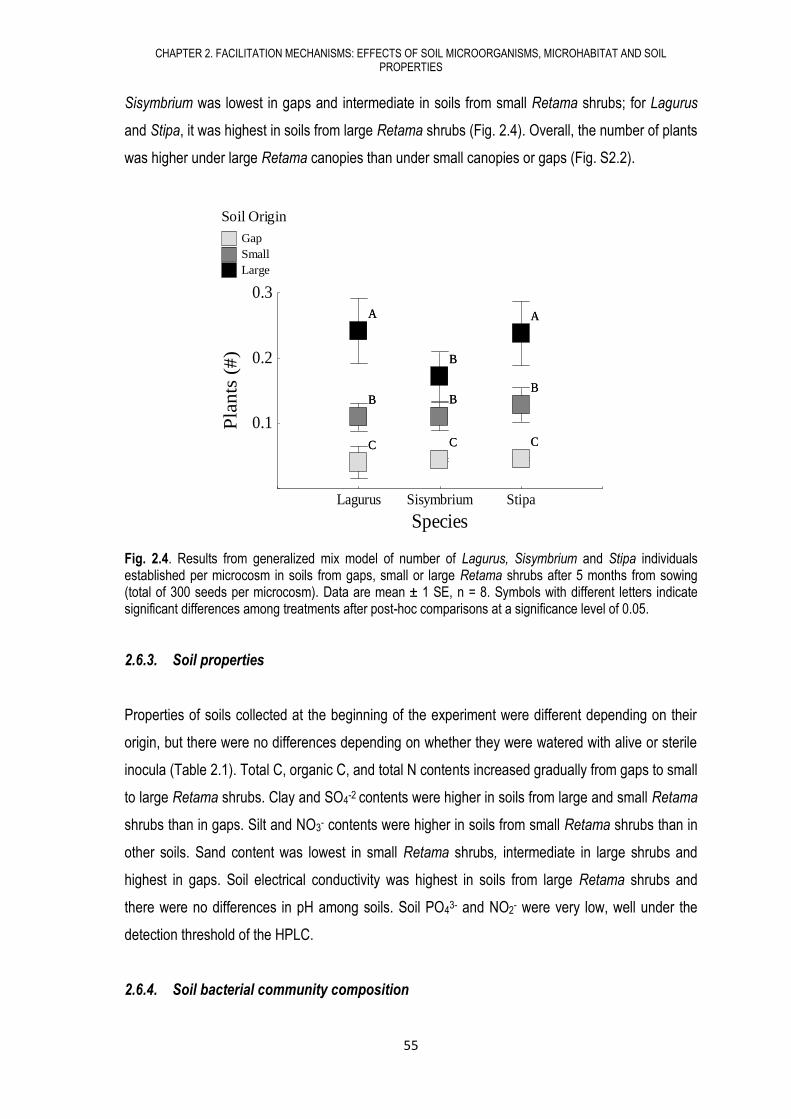
CHAPTER 2. FACILITATION MECHANISMS: EFFECTS OF SOIL MICROORGANISMS, MICROHABITAT AND SOIL PROPERTIES
55
Sisymbrium was lowest in gaps and intermediate in soils from small Retama shrubs; for Lagurus
and Stipa, it was highest in soils from large Retama shrubs (Fig. 2.4). Overall, the number of plants
was higher under large Retama canopies than under small canopies or gaps (Fig. S2.2).
Fig. 2.4. Results from generalized mix model of number of Lagurus, Sisymbrium and Stipa individuals established per microcosm in soils from gaps, small or large Retama shrubs after 5 months from sowing (total of 300 seeds per microcosm). Data are mean ± 1 SE, n = 8. Symbols with different letters indicate significant differences among treatments after post-hoc comparisons at a significance level of 0.05.
2.6.3. Soil properties
Properties of soils collected at the beginning of the experiment were different depending on their
origin, but there were no differences depending on whether they were watered with alive or sterile
inocula (Table 2.1). Total C, organic C, and total N contents increased gradually from gaps to small
to large Retama shrubs. Clay and SO4-2 contents were higher in soils from large and small Retama
shrubs than in gaps. Silt and NO3- contents were higher in soils from small Retama shrubs than in
other soils. Sand content was lowest in small Retama shrubs, intermediate in large shrubs and
highest in gaps. Soil electrical conductivity was highest in soils from large Retama shrubs and
there were no differences in pH among soils. Soil PO43- and NO2
- were very low, well under the
detection threshold of the HPLC.
2.6.4. Soil bacterial community composition
Gap
Small
Large
Gap Small Large Gap Small Large Gap Small Large
Canopy*Specie
0.1
0.2
0.3
0.4
Sq
uar
e ro
ot
Bio
mas
s
B
BBB
CCC
C C
A
A
A
BB
B
B
C
C
A
A
BB
BB B B
B
B
BBB
CCC
C C
A
A
A
BB
B
B
C
C
A
A
BB
BB B B
B
3 sp (Raiz (Biomass/ind)
Gap
Small
Large
Soil Origin Gap Soil
Small Retama Soil
Large Retama Soil
Lagurus Sisymbrium Stipa
Species
0.1
0.2
0.3
Pla
nts
(#
)
CCC
BBB
A A
B
CCC
BBB
A A
B
1106-S*Sp
Gap Soil
Small Retama Soil
Large Retama Soil
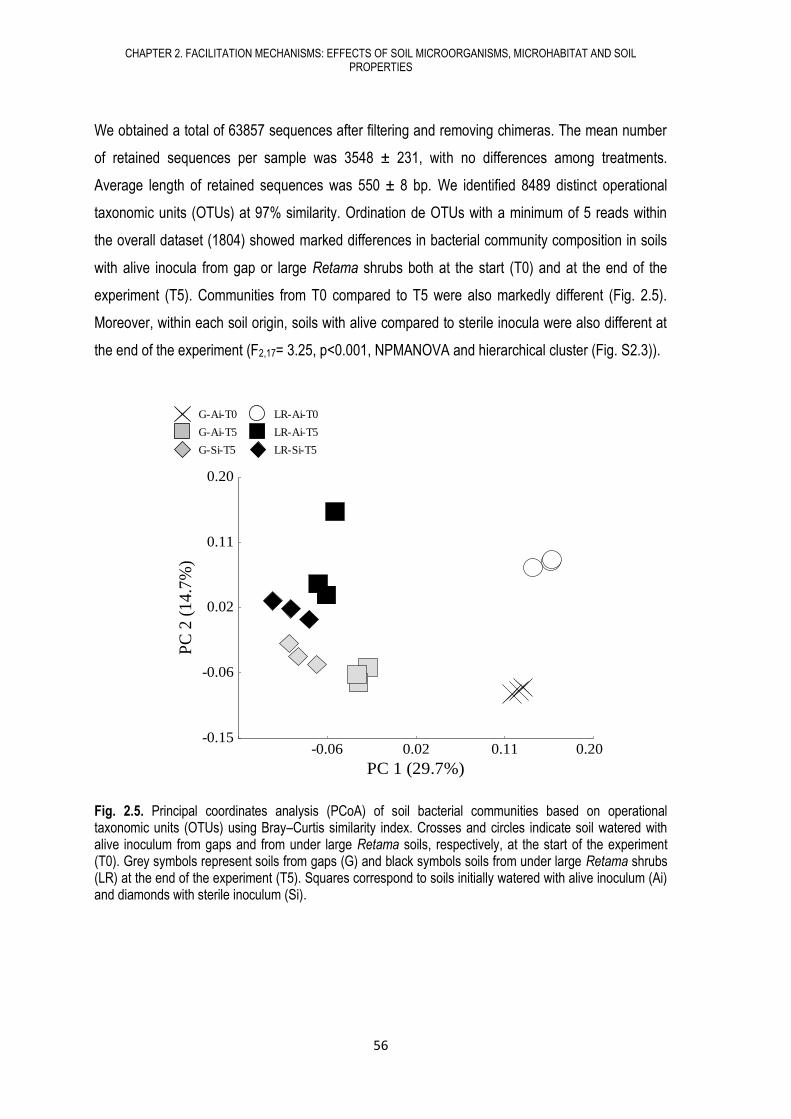
CHAPTER 2. FACILITATION MECHANISMS: EFFECTS OF SOIL MICROORGANISMS, MICROHABITAT AND SOIL PROPERTIES
56
We obtained a total of 63857 sequences after filtering and removing chimeras. The mean number
of retained sequences per sample was 3548 ± 231, with no differences among treatments.
Average length of retained sequences was 550 ± 8 bp. We identified 8489 distinct operational
taxonomic units (OTUs) at 97% similarity. Ordination de OTUs with a minimum of 5 reads within
the overall dataset (1804) showed marked differences in bacterial community composition in soils
with alive inocula from gap or large Retama shrubs both at the start (T0) and at the end of the
experiment (T5). Communities from T0 compared to T5 were also markedly different (Fig. 2.5).
Moreover, within each soil origin, soils with alive compared to sterile inocula were also different at
the end of the experiment (F2,17= 3.25, p<0.001, NPMANOVA and hierarchical cluster (Fig. S2.3)).
Fig. 2.5. Principal coordinates analysis (PCoA) of soil bacterial communities based on operational taxonomic units (OTUs) using Bray–Curtis similarity index. Crosses and circles indicate soil watered with alive inoculum from gaps and from under large Retama soils, respectively, at the start of the experiment (T0). Grey symbols represent soils from gaps (G) and black symbols soils from under large Retama shrubs (LR) at the end of the experiment (T5). Squares correspond to soils initially watered with alive inoculum (Ai) and diamonds with sterile inoculum (Si).
-0.06 0.02 0.11 0.20
PC 1 (29.7%)
-0.15
-0.06
0.02
0.11
0.20
PC
2 (
14
.7%
)
Título
G-Ai-T0 LR-Ai-T0
G-Ai-T5 LR-Ai-T5
G-Si-T5 LR-Si-T5
-0.02 0.05 0.13 0.20CP 1 (26.9%)
-0.10
-0.05
0.00
0.05
0.10
LR
-Si-T
5
Título
Distancia: (Bray-Curtis)
G-Ai-T0 LR-Ai-T0
G-Ai-T5 LR-Ai-T5
G-Si-T5 LR-Si-T5
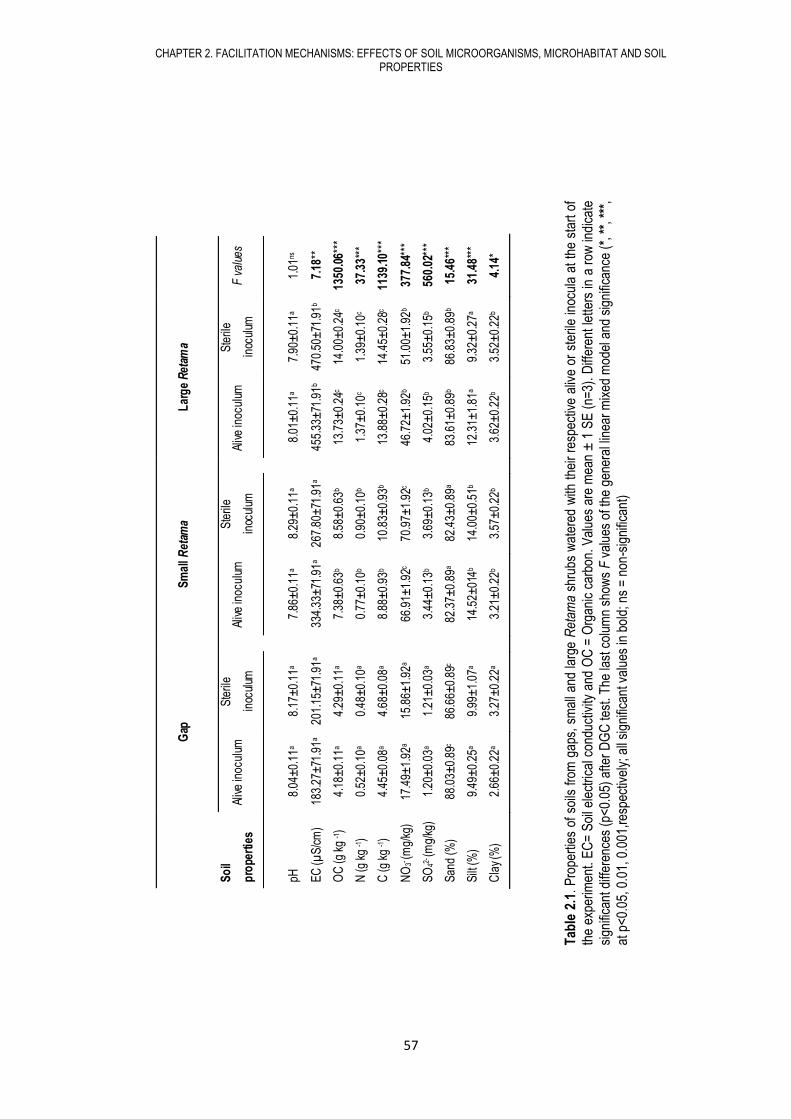
CHAPTER 2. FACILITATION MECHANISMS: EFFECTS OF SOIL MICROORGANISMS, MICROHABITAT AND SOIL PROPERTIES
57
Tab
le 2
.1.
Pro
pert
ies
of s
oils
fro
m g
aps,
sm
all a
nd la
rge
Ret
ama
shru
bs w
ater
ed w
ith t
heir
resp
ectiv
e al
ive
or s
teril
e in
ocul
a at
the
sta
rt o
f
the
expe
rimen
t. E
C=
Soi
l ele
ctric
al c
ondu
ctiv
ity a
nd O
C =
Org
anic
car
bon.
Val
ues
are
mea
n ±
1 S
E (
n=3)
. D
iffer
ent
lette
rs in
a r
ow in
dica
te
sign
ifica
nt d
iffer
ence
s (p
<0.
05)
afte
r D
GC
test
. The
last
col
umn
show
s F
val
ues
of th
e ge
nera
l lin
ear
mix
ed m
odel
and
sig
nific
ance
(*,
**,
***
,
at p
<0.
05, 0
.01,
0.0
01,r
espe
ctiv
ely;
all
sign
ifica
nt v
alue
s in
bol
d; n
s =
non
-sig
nific
ant)
Gap
Sm
all R
etam
a
Lar
ge
Ret
ama
So
il
pro
pert
ies
Aliv
e in
ocul
um
Ste
rile
inoc
ulum
Aliv
e in
ocul
um
Ste
rile
inoc
ulum
Aliv
e in
ocul
um
Ste
rile
inoc
ulum
F
val
ues
pH
8.04
±0.
11a
8.17
±0.
11a
7.
86±
0.11
a 8.
29±
0.11
a
8.01
±0.
11a
7.90
±0.
11a
1.01
ns
EC
(µS
/cm
) 18
3.27
±71
.91a
201.
15±
71.9
1a
334.
33±
71.9
1a 26
7.80
±71
.91a
45
5.33
±71
.91b
470.
50±
71.9
1b 7.
18**
OC
(g k
g -1)
4.18
±0.
11a
4.29
±0.
11a
7.
38±
0.63
b 8.
58±
0.63
b
13.7
3±0.
24c
14.0
0±0.
24c
1350
.06*
**
N (g
kg
-1)
0.52
±0.
10a
0.48
±0.
10a
0.
77±
0.10
b 0.
90±
0.10
b
1.37
±0.
10c
1.39
±0.
10c
37.3
3***
C (g
kg
-1)
4.45
±0.
08a
4.68
±0.
08a
8.
88±
0.93
b 10
.83±
0.93
b
13.8
8±0.
28c
14.4
5±0.
28c
1139
.10*
**
NO
3- (m
g/kg
) 17
.49±
1.92
a 15
.86±
1.92
a
66.9
1±1.
92c
70.9
7±1.
92c
46
.72±
1.92
b 51
.00±
1.92
b 37
7.84
***
SO
42- (m
g/kg
) 1.
20±
0.03
a 1.
21±
0.03
a
3.44
±0.
13b
3.69
±0.
13b
4.
02±
0.15
b 3.
55±
0.15
b 56
0.02
***
San
d (%
) 88
.03±
0.89
c 86
.66±
0.89
c
82.3
7±0.
89a
82.4
3±0.
89a
83
.61±
0.89
b 86
.83±
0.89
b 15
.46*
**
Silt
(%)
9.49
±0.
25a
9.99
±1.
07a
14
.52±
014b
14.0
0±0.
51b
12
.31±
1.81
a 9.
32±
0.27
a 31
.48*
**
Cla
y (%
) 2.
66±
0.22
a 3.
27±
0.22
a
3.21
±0.
22b
3.57
±0.
22b
3.
62±
0.22
b 3.
52±
0.22
b 4.
14*
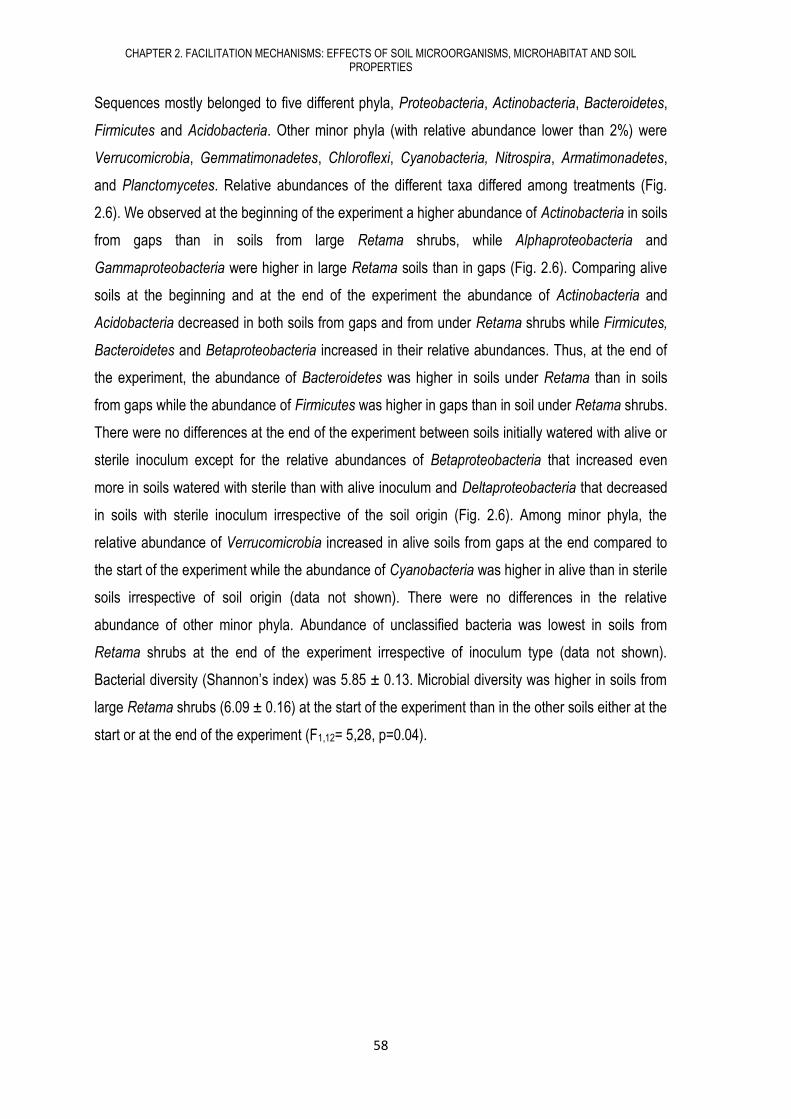
CHAPTER 2. FACILITATION MECHANISMS: EFFECTS OF SOIL MICROORGANISMS, MICROHABITAT AND SOIL PROPERTIES
58
Sequences mostly belonged to five different phyla, Proteobacteria, Actinobacteria, Bacteroidetes,
Firmicutes and Acidobacteria. Other minor phyla (with relative abundance lower than 2%) were
Verrucomicrobia, Gemmatimonadetes, Chloroflexi, Cyanobacteria, Nitrospira, Armatimonadetes,
and Planctomycetes. Relative abundances of the different taxa differed among treatments (Fig.
2.6). We observed at the beginning of the experiment a higher abundance of Actinobacteria in soils
from gaps than in soils from large Retama shrubs, while Alphaproteobacteria and
Gammaproteobacteria were higher in large Retama soils than in gaps (Fig. 2.6). Comparing alive
soils at the beginning and at the end of the experiment the abundance of Actinobacteria and
Acidobacteria decreased in both soils from gaps and from under Retama shrubs while Firmicutes,
Bacteroidetes and Betaproteobacteria increased in their relative abundances. Thus, at the end of
the experiment, the abundance of Bacteroidetes was higher in soils under Retama than in soils
from gaps while the abundance of Firmicutes was higher in gaps than in soil under Retama shrubs.
There were no differences at the end of the experiment between soils initially watered with alive or
sterile inoculum except for the relative abundances of Betaproteobacteria that increased even
more in soils watered with sterile than with alive inoculum and Deltaproteobacteria that decreased
in soils with sterile inoculum irrespective of the soil origin (Fig. 2.6). Among minor phyla, the
relative abundance of Verrucomicrobia increased in alive soils from gaps at the end compared to
the start of the experiment while the abundance of Cyanobacteria was higher in alive than in sterile
soils irrespective of soil origin (data not shown). There were no differences in the relative
abundance of other minor phyla. Abundance of unclassified bacteria was lowest in soils from
Retama shrubs at the end of the experiment irrespective of inoculum type (data not shown).
Bacterial diversity (Shannon’s index) was 5.85 ± 0.13. Microbial diversity was higher in soils from
large Retama shrubs (6.09 ± 0.16) at the start of the experiment than in the other soils either at the
start or at the end of the experiment (F1,12= 5,28, p=0.04).
CHAPTER 2. FACILITATION MECHANISMS: EFFECTS OF SOIL MICROORGANISMS, MICROHABITAT AND SOIL PROPERTIES
59
Fig. 2.6. Results from generalized linear mixed models of mean relative abundance (± 1 SE) of the most abundant bacterial taxonomic groups, i.e. phyla Actinobacteria, Bacteroidetes, Firmicutes, Acidobacteria, classes Alphaproteobacteria, Betaproteobacteria, Gammaproteobacteria and Deltaproteobacteria (within Proteobacteria phylum). Light grey bars represent soil collected from gaps (G) and dark grey bars represent soil from under large Retama shrubs (LR) watered with either alive (Ai) or sterile inoculum (Si). Soil was collected at the start (T0) and at the end of the experiment (T5). Different letters within a bacterial group indicate significant differences (p < 0.05) among treatments after DGC test; n = 3 microcosms.
2.7. DISCUSSION
Our data show once again that Retama sphaerocarpa shrubs are strong facilitators of plant
communities in their understory, and disentangle some of the mechanisms involved in the process.
We found that soil microorganisms affect seed germination, with effects ranging from positive to
negative depending on species identity, soil characteristics, and microhabitat. Both plant growth
and abundance were strongly affected by soil origin, with positive or neutral effects of microhabitat.
The effect of soil microorganisms on plant growth and abundance was no evident. Overall, our
results suggest that soil properties mediated facilitation in this system.
Actinob
acteria
Bac
tero
idetes
Firm
icutes
Acido
bacteria
Alpha
proteo
bacteria
Betap
roteob
acteria
Gam
map
roteob
acteria
Deltapr
oteo
bacteria
Rela
tive a
bu
ndan
ce (
%)
0.0
0.1
0.2
0.3
0.4
0.5
0.6
G-Ai-T0
G-Ai
G-Si
LR-Ai-T0
LR-Ai
LR-Si
A
CC
B
CC
C
B
B
C
AA
C
A
A
CB
B
A
B
B
A
BB
A
B
BBBB
C
B
B
A
A
C
AB
BBB
BA
B BA AA
-T5
-T5
-T5
-T5
Actin
obac
teria
Bac
tero
idetes
Firmicut
es
Acido
bacter
ia
Alp
hapr
oteo
bacter
ia
Betap
roteob
acteria
Gam
map
roteob
acteria
Deltapr
oteo
bacter
ia
Rela
tive a
bu
ndan
ce (
%)
0.0
0.1
0.2
0.3
0.4
0.5
0.6
G-Ai-T0
G-Ai
G-Si
LR-Ai-T0
LR-Ai
LR-Si
A
CC
B
CC
C
B
B
C
AA
C
A
A
CB
B
A
B
B
A
BB
A
B
BBBB
C
B
B
A
A
C
AB
BBB
BA
B BA AA
-T5
-T5
-T5
-T5
CHAPTER 2. FACILITATION MECHANISMS: EFFECTS OF SOIL MICROORGANISMS, MICROHABITAT AND SOIL PROPERTIES
60
2.7.1. The positive effect of Retama soils on seed germination and plant performance
Our data show that soil from under Retama shrubs positively affected seed germination, biomass,
and abundance of Lagurus, Sisymbrium and Stipa. Compared to gaps, soils from under Retama
shrubs usually show a higher moisture (Pugnaire et al. 2004), have higher organic matter and
nutrient content as well as higher silt and clay content. Accretion of soil organic matter under
Retama soils increases water holding capacity, buffer soil temperature changes (Moro et al. 1997,
Pugnaire et al. 2004), and increases soil oxygenation (Porta-Casanellas et al. 2003) which
promoted seed germination and plant growth. Moreover, different chemical properties from
Retama soils compared to gap soils also promoted seed germination and plant performance. For
example, an increase in soil N content related to active N fixation from Retama shrubs (Rodríguez-
Echeverría and Pérez-Fernández 2003) or changes in microbial activity that promote the release of
available N for plants (Tortora et al. 2007), as well as an increase in anion content (Roem et al.
2002) might have promoted seed germination and plant performance in Retama soils. Added to
this, the positive effect of Retama soil properties on plant performance at the end of the experiment
also included the effect of the particular soil microbial community that was established in these
soils along the experiment.
2.7.2. The effect of soil microorganisms on seed germination was species specific
Microbial communities associated to Retama soils and gaps were different, affecting seed
germination in different ways, and were critical to determine the emergence of a specific
understory community in each soil.
Germination of Lagurus, a species whose typical microhabitat is Retama understories (Pugnaire et
al. 1996b), was, accordingly to its preferred natural microhabitat, positively affected by Retama soil
microorganisms, while Sisymbrium, which prefers gaps (Pugnaire and Lázaro 2000), germinated
more in soils from under Retama with alive inoculum than in soils from gaps. Stipa is a species
mainly found in gaps (Boeken et al. 2004) but, interestingly, microorganisms from gap soils
negatively affected its germination. Differences in seed germination of each species were strongly
linked to differences between the microbial communities associated to soils from under Retama
shrubs or to gaps.
CHAPTER 2. FACILITATION MECHANISMS: EFFECTS OF SOIL MICROORGANISMS, MICROHABITAT AND SOIL PROPERTIES
61
Soils under Retama shrubs had, at the beginning of the experiment, higher abundance of
Alphaproteobacteria and Gammaproteobacteria than soils from gaps, as well as higher abundance
of key groups within these classes. For example, members of the abundant Rhizobium and
Bradyrhizobium genera (Alphaproteobacteria) establish symbiotic root associations with legumes,
as Retama, having a key role in atmospheric nitrogen fixation (Kersters et al. 2006). Similarly, free-
living nitrogen fixers such as Azomonas (Kersters et al. 2006) or Pseudomonas
(Gammaproteobacteria class) are known plant growth promoters (Saharan and Nehra 2011). On
the other hand, members of Actinobacteria, commonly found in gaps (Suela Silva et al. 2013) are
considered to be drought-resistant (Köberl et al. 2013), and in our experiment they were more
abundant in gaps than in Retama soils.
Although most research on the effect of soil microbial communities on plants has not analyzed the
effect of soil microorganisms on seed germination and the functions and identities of most seed-
associated bacteria are currently unknown (Lopez-Velasco et al. 2013), it is known that the seed
testa is affected by soil bacteria (Buyer et al. 1999). In turn, soil bacteria are affected by seed
exudates and their components (Nelson 2004). Soil microorganisms from under Retama shrubs
established positive seed-microbe interactions that promoted seed germination in Lagurus and
Sisymbrium, while soil microorganisms from under small Retama shrubs or from gaps established
negative seed-microbe interactions with Stipa, hindering its germination. This low germination of
Stipa with soil microorganisms from gaps, its preferred habitat, could be due to several reasons.
Among them, the presence of soil pathogens (Van der Putten et al. 2013), which produce enzymes
and phytotoxines that can kill seeds before germination (Kremer 1993) or inhibit germination of
viable seeds (Roberts and Feast 1972). In addition, some soil microorganisms promote seed
dormancy (Miransari and Smith 2014) allowing seeds to wait for better conditions to germinate.
Although data on seed-microbe interactions are still very scarce (Coombs and Franco 2003), our
results showed that these associations could range from positive to negative depending on species
identity and that these seed-microbe interactions were influenced by the particular properties of
each soil.
Apart from the role of interactions between plants and soil microorganisms in determining the
outcome of plant-plant interactions (Pendergast et al 2013; Rodriguez-Echeverría et al. 2013),
competitive interactions among plants are also important. Thus, although soil microorganisms from
under Retama shrubs facilitated germination of Sisymbrium, competition among species under
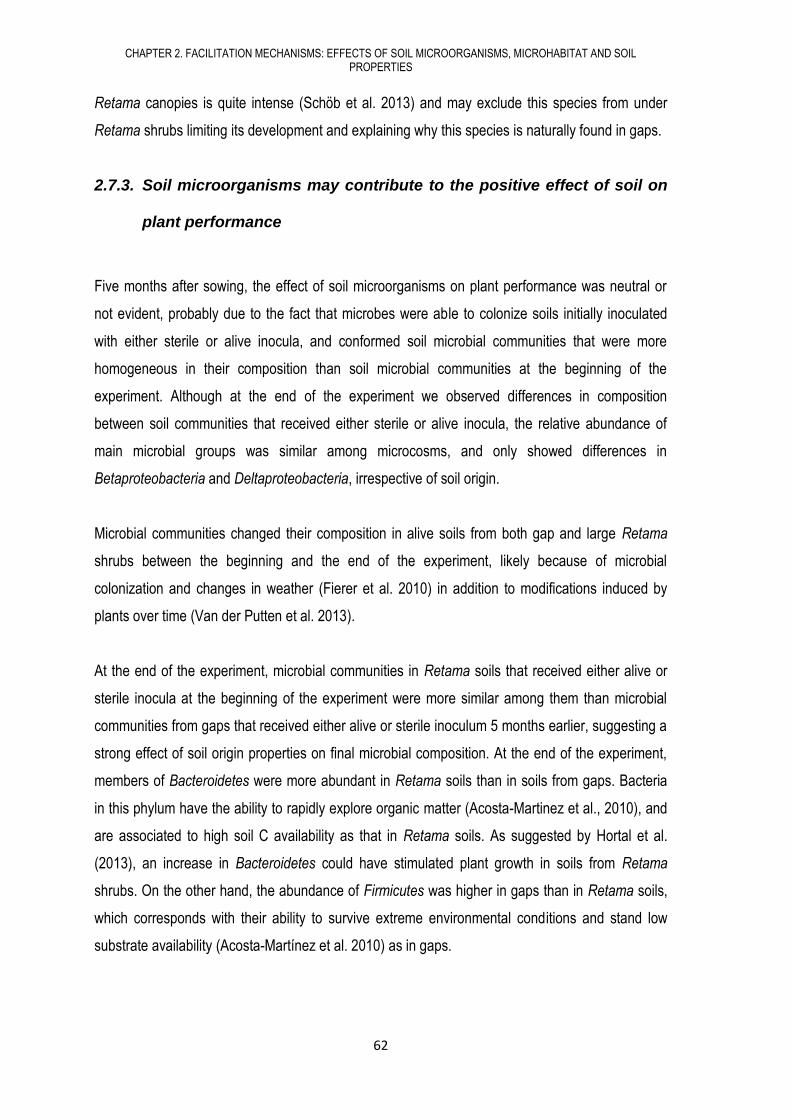
CHAPTER 2. FACILITATION MECHANISMS: EFFECTS OF SOIL MICROORGANISMS, MICROHABITAT AND SOIL PROPERTIES
62
Retama canopies is quite intense (Schöb et al. 2013) and may exclude this species from under
Retama shrubs limiting its development and explaining why this species is naturally found in gaps.
2.7.3. Soil microorganisms may contribute to the positive effect of soil on
plant performance
Five months after sowing, the effect of soil microorganisms on plant performance was neutral or
not evident, probably due to the fact that microbes were able to colonize soils initially inoculated
with either sterile or alive inocula, and conformed soil microbial communities that were more
homogeneous in their composition than soil microbial communities at the beginning of the
experiment. Although at the end of the experiment we observed differences in composition
between soil communities that received either sterile or alive inocula, the relative abundance of
main microbial groups was similar among microcosms, and only showed differences in
Betaproteobacteria and Deltaproteobacteria, irrespective of soil origin.
Microbial communities changed their composition in alive soils from both gap and large Retama
shrubs between the beginning and the end of the experiment, likely because of microbial
colonization and changes in weather (Fierer et al. 2010) in addition to modifications induced by
plants over time (Van der Putten et al. 2013).
At the end of the experiment, microbial communities in Retama soils that received either alive or
sterile inocula at the beginning of the experiment were more similar among them than microbial
communities from gaps that received either alive or sterile inoculum 5 months earlier, suggesting a
strong effect of soil origin properties on final microbial composition. At the end of the experiment,
members of Bacteroidetes were more abundant in Retama soils than in soils from gaps. Bacteria
in this phylum have the ability to rapidly explore organic matter (Acosta-Martinez et al., 2010), and
are associated to high soil C availability as that in Retama soils. As suggested by Hortal et al.
(2013), an increase in Bacteroidetes could have stimulated plant growth in soils from Retama
shrubs. On the other hand, the abundance of Firmicutes was higher in gaps than in Retama soils,
which corresponds with their ability to survive extreme environmental conditions and stand low
substrate availability (Acosta-Martínez et al. 2010) as in gaps.
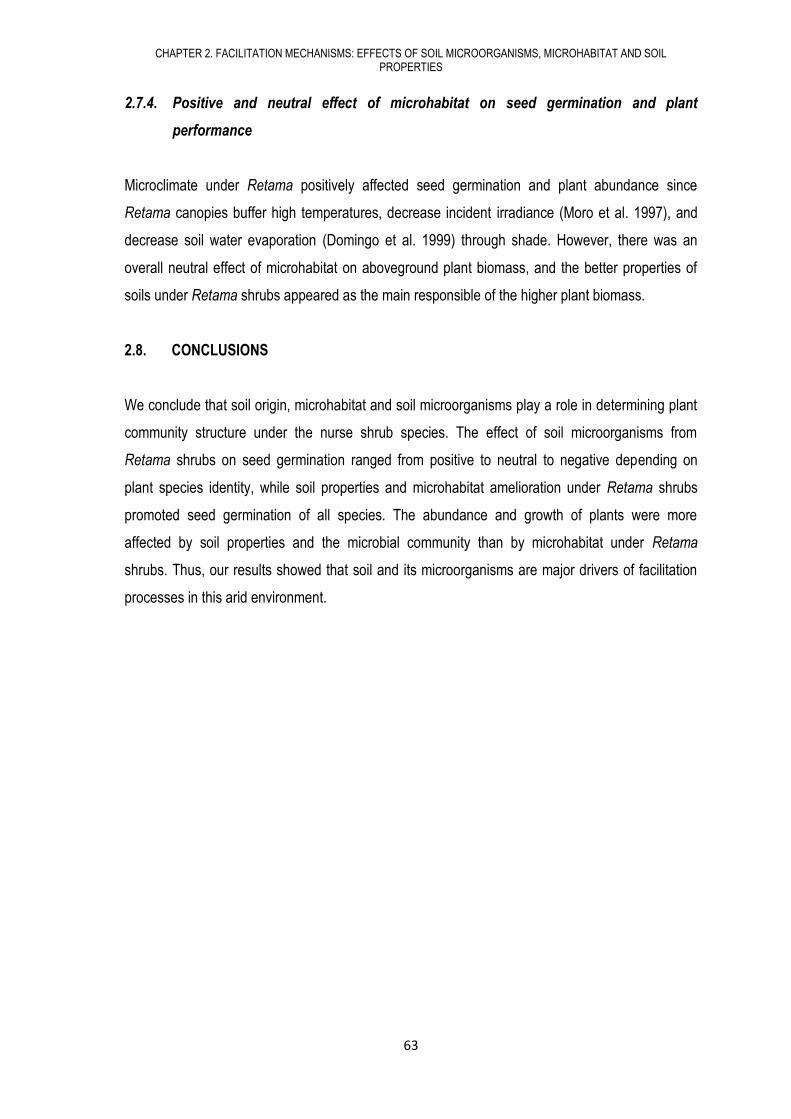
CHAPTER 2. FACILITATION MECHANISMS: EFFECTS OF SOIL MICROORGANISMS, MICROHABITAT AND SOIL PROPERTIES
63
2.7.4. Positive and neutral effect of microhabitat on seed germination and plant
performance
Microclimate under Retama positively affected seed germination and plant abundance since
Retama canopies buffer high temperatures, decrease incident irradiance (Moro et al. 1997), and
decrease soil water evaporation (Domingo et al. 1999) through shade. However, there was an
overall neutral effect of microhabitat on aboveground plant biomass, and the better properties of
soils under Retama shrubs appeared as the main responsible of the higher plant biomass.
2.8. CONCLUSIONS
We conclude that soil origin, microhabitat and soil microorganisms play a role in determining plant
community structure under the nurse shrub species. The effect of soil microorganisms from
Retama shrubs on seed germination ranged from positive to neutral to negative depending on
plant species identity, while soil properties and microhabitat amelioration under Retama shrubs
promoted seed germination of all species. The abundance and growth of plants were more
affected by soil properties and the microbial community than by microhabitat under Retama
shrubs. Thus, our results showed that soil and its microorganisms are major drivers of facilitation
processes in this arid environment.
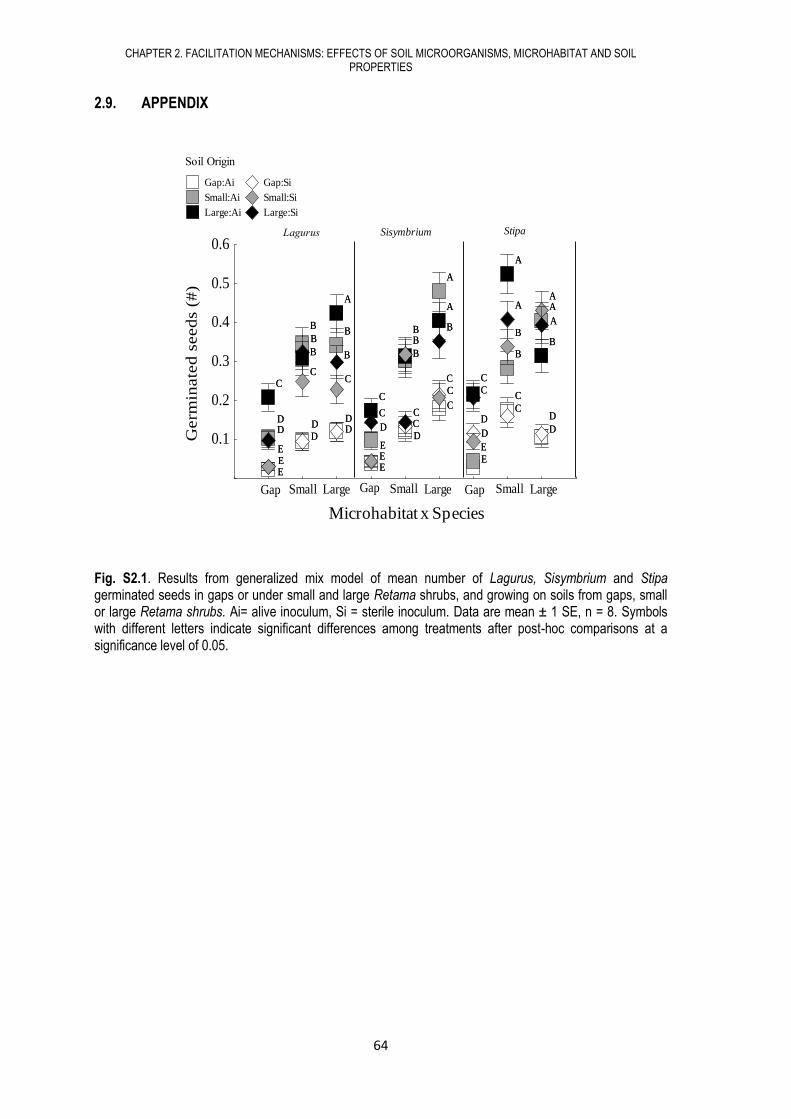
CHAPTER 2. FACILITATION MECHANISMS: EFFECTS OF SOIL MICROORGANISMS, MICROHABITAT AND SOIL PROPERTIES
64
2.9. APPENDIX
Fig. S2.1. Results from generalized mix model of mean number of Lagurus, Sisymbrium and Stipa germinated seeds in gaps or under small and large Retama shrubs, and growing on soils from gaps, small or large Retama shrubs. Ai= alive inoculum, Si = sterile inoculum. Data are mean ± 1 SE, n = 8. Symbols with different letters indicate significant differences among treatments after post-hoc comparisons at a significance level of 0.05.
Gap:LS Gap:SS
Small:LS Large:LS
Small:SS Large:SS
Gap Small Large Gap Small Large Gap Small Large
Canopy*Specie
0.1
0.2
0.3
0.4
0.5
0.6
Germ
inate
d s
eed
s (#
)
CC
D
DD
D
EEE
C
CC
DD D
D
E
E
A
A
BB
B B
DD
E
A
AA
B
B
B
CC
C
A
BB
CC
C
D
EE
A
AB
B
B
C
CC
D
CC
D
DD
D
EEE
C
CC
DD D
D
E
E
A
A
BB
B B
DD
E
A
AA
B
B
B
CC
C
A
BB
CC
C
D
EE
A
AB
B
B
C
CC
D
Título
Gap:LS Gap:SS
Small:LS Large:LS
Small:SS Large:SS
Lagurus Sisymbrium
Soil Origin
Gap:Ai Gap:Si
Small:Ai Small:Si
Large:Ai Large:Si
G:LagS:Lag L:Lag G:SisyS:Sisy L:Sisy G:Sti S:Sti L:Sti
Canopy*Specie
0.1
0.2
0.3
0.4
0.5
0.6
Sh
an
no
n in
de
z
CC
D
DD
D
EEE
C
CC
DD D
D
E
E
A
A
BB
B B
DD
E
A
BB
CC
C
D
EE
A
AA
B
B
B
CC
C
A
AB
B
B
C
CC
D
CC
D
DD
D
EEE
C
CC
DD D
D
E
E
A
A
BB
B B
DD
E
A
BB
CC
C
D
EE
A
AA
B
B
B
CC
C
A
AB
B
B
C
CC
D
Título
Gap:Ai Gap:Si
Small:Ai Small:Si
Large:Ai Large:Si
Microhabitat x Species
Stipa
CHAPTER 2. FACILITATION MECHANISMS: EFFECTS OF SOIL MICROORGANISMS, MICROHABITAT AND SOIL PROPERTIES
65
Fig. S2.2. Results of generalized mix model of mean number of plants established per microcosm in gaps and under small or large Retama shrubs after 5 months from sowing (total of 300 seeds per microcosm). Data are mean ± 1 SE, n = 8. Symbols with different letters indicate significant differences among treatments after post-hoc comparisons at a significance level of 0.05.
Fig. S2.3 Hierarchical cluster analysis of the OTUs of bacterial community in soils collected from gaps (G)
and from under large Retama shrubs (LR) watered with alive (Ai) or sterile (Si) inoculum at the beginning
(T0) and end of the experiment (T5) using multivariate mean comparisons. Cut off criterion obtained with
the gDGC test is indicated with a vertical line. Different letters indicate groups statistically differing at a
significance level of 0.05.
Gap Small Large
Microhabitat
-0.1
0.0
0.1
0.2
Pla
nts
(#
)
A
B
B
A
B
B
Título
G-Ai-T0
LR-Ai-T0
LR-Si-T5
LR-Ai-T5
G-Ai-T5
G-Si-T5
Hclu
st(*
, “si
ng
le”)
Distance
40 50 60 70 80 90
A
B
C
D
E
F
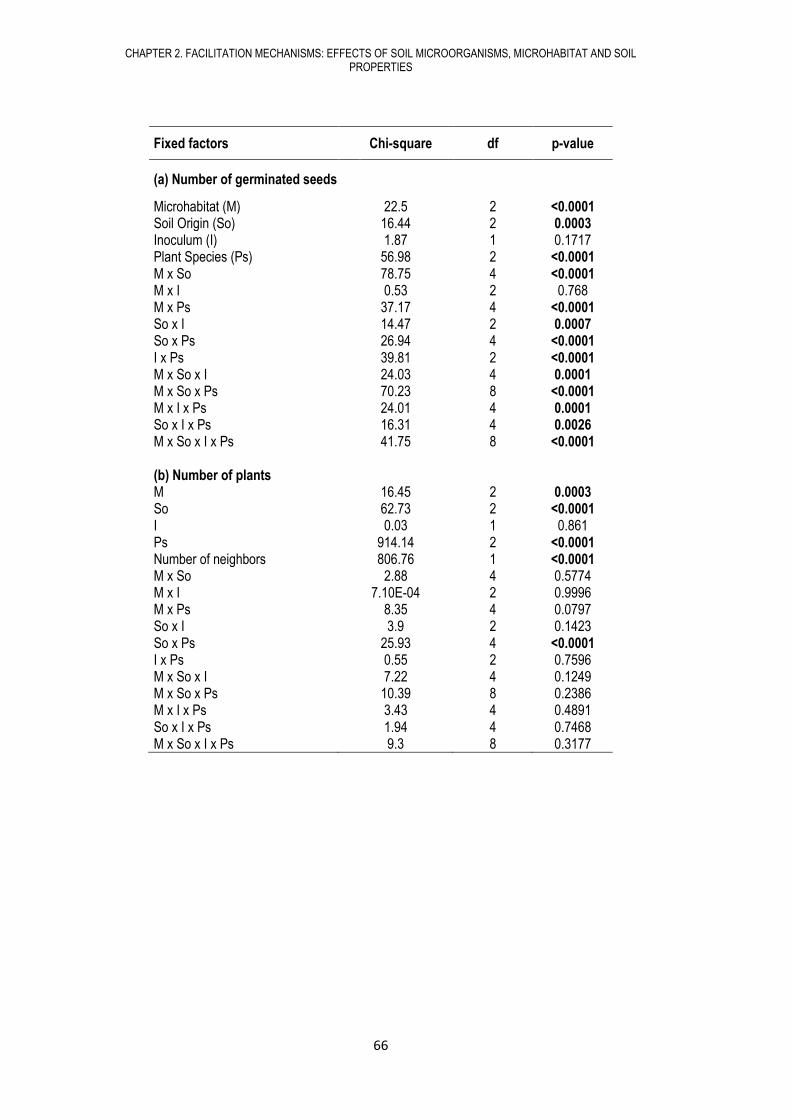
CHAPTER 2. FACILITATION MECHANISMS: EFFECTS OF SOIL MICROORGANISMS, MICROHABITAT AND SOIL PROPERTIES
66
Fixed factors Chi-square df p-value
(a) Number of germinated seeds
Microhabitat (M) 22.5 2 <0.0001 Soil Origin (So) 16.44 2 0.0003 Inoculum (I) 1.87 1 0.1717 Plant Species (Ps) 56.98 2 <0.0001 M x So 78.75 4 <0.0001 M x I 0.53 2 0.768 M x Ps 37.17 4 <0.0001 So x I 14.47 2 0.0007 So x Ps 26.94 4 <0.0001 I x Ps 39.81 2 <0.0001 M x So x I 24.03 4 0.0001 M x So x Ps 70.23 8 <0.0001 M x I x Ps 24.01 4 0.0001 So x I x Ps 16.31 4 0.0026 M x So x I x Ps 41.75 8 <0.0001 (b) Number of plants M 16.45 2 0.0003 So 62.73 2 <0.0001 I 0.03 1 0.861 Ps 914.14 2 <0.0001 Number of neighbors 806.76 1 <0.0001 M x So 2.88 4 0.5774 M x I 7.10E-04 2 0.9996 M x Ps 8.35 4 0.0797 So x I 3.9 2 0.1423 So x Ps 25.93 4 <0.0001 I x Ps 0.55 2 0.7596 M x So x I 7.22 4 0.1249 M x So x Ps 10.39 8 0.2386 M x I x Ps 3.43 4 0.4891 So x I x Ps 1.94 4 0.7468 M x So x I x Ps 9.3 8 0.3177
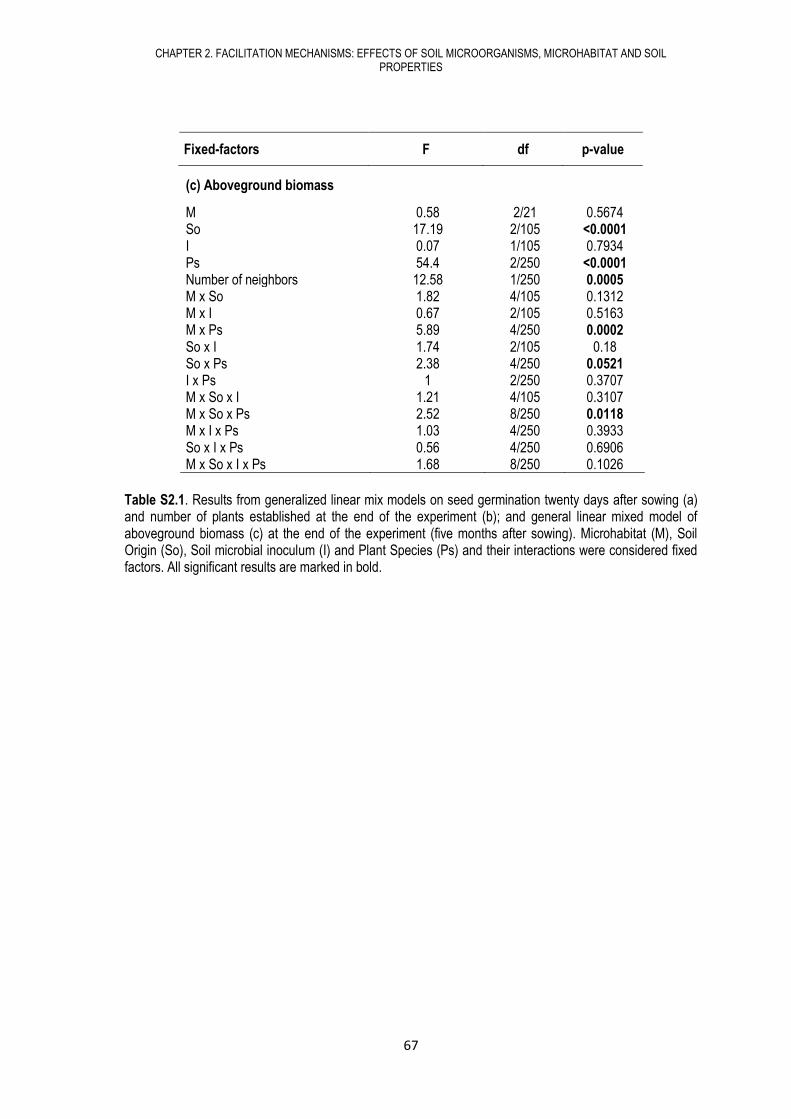
CHAPTER 2. FACILITATION MECHANISMS: EFFECTS OF SOIL MICROORGANISMS, MICROHABITAT AND SOIL PROPERTIES
67
Fixed-factors F df p-value
Table S2.1. Results from generalized linear mix models on seed germination twenty days after sowing (a) and number of plants established at the end of the experiment (b); and general linear mixed model of aboveground biomass (c) at the end of the experiment (five months after sowing). Microhabitat (M), Soil Origin (So), Soil microbial inoculum (I) and Plant Species (Ps) and their interactions were considered fixed factors. All significant results are marked in bold.
(c) Aboveground biomass
M 0.58 2/21 0.5674 So 17.19 2/105 <0.0001 I 0.07 1/105 0.7934 Ps 54.4 2/250 <0.0001 Number of neighbors 12.58 1/250 0.0005 M x So 1.82 4/105 0.1312 M x I 0.67 2/105 0.5163 M x Ps 5.89 4/250 0.0002 So x I 1.74 2/105 0.18 So x Ps 2.38 4/250 0.0521 I x Ps 1 2/250 0.3707 M x So x I 1.21 4/105 0.3107 M x So x Ps 2.52 8/250 0.0118 M x I x Ps 1.03 4/250 0.3933 So x I x Ps 0.56 4/250 0.6906 M x So x I x Ps 1.68 8/250 0.1026

68
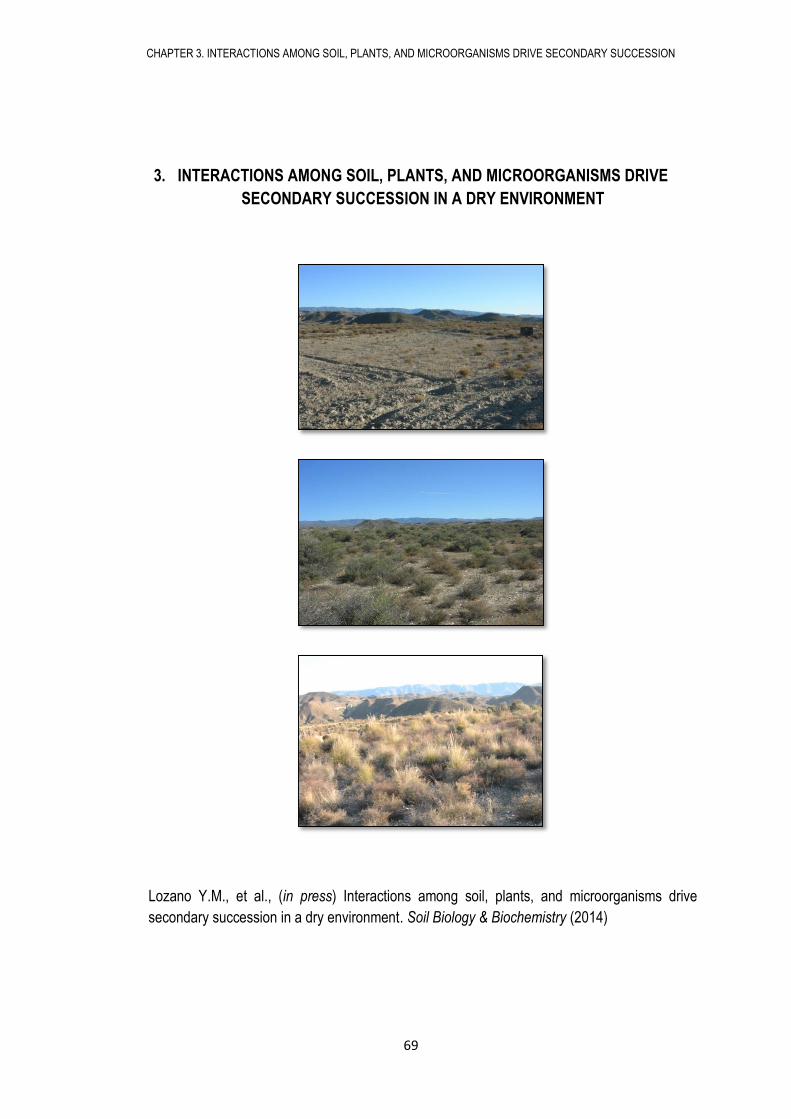
CHAPTER 3. INTERACTIONS AMONG SOIL, PLANTS, AND MICROORGANISMS DRIVE SECONDARY SUCCESSION
69
3. INTERACTIONS AMONG SOIL, PLANTS, AND MICROORGANISMS DRIVE
SECONDARY SUCCESSION IN A DRY ENVIRONMENT
Lozano Y.M., et al., (in press) Interactions among soil, plants, and microorganisms drive
secondary succession in a dry environment. Soil Biology & Biochemistry (2014)

70
CHAPTER 3. INTERACTIONS AMONG SOIL, PLANTS, AND MICROORGANISMS DRIVE SECONDARY SUCCESSION
71
3.1. ABSTRACT
Secondary succession studies have mainly focused on plants, but little is known about the fate of
soil microbial communities and their relationship with plant succession after disturbance,
particularly in dry ecosystems. We examined changes in soil properties and of plant and soil
microbial communities across a chronosequence of abandoned arable fields that included five
successional stages according to time of abandonment stretching near a century. We
hypothesized the existence of a parallel secondary succession above- and below-ground and
explored the possible linkages between plant and microbial communities as well as the role of
changes in soil properties over the successional gradient. Soil microbial communities were
characterized by PLFAs analysis, enzymatic activities, and pyrosequencing of the 16S rDNA. We
found clear patterns of plant and microbial secondary succession characterized by an increase in
organic C, NH4+, and silt content as well as in soil microbial biomass and activity along the
successional stages, linked to an increase in plant productivity and diversity. Plant and microbial
composition were significantly different among successional stages, although no distinct microbial
communities were observed in the two initial stages, suggesting that microbial succession may lag
behind plant succession. However, the degree of change in the composition of soil microbial
communities and plant communities across our chronosequence evidenced that above- and
below-ground secondary succession developed with similar patterns and correlated with changes
in multiple ecosystem functions such as increases in above-and below-ground productivity,
diversity and nutrient accumulation as plant and microbial succession progressed.
CHAPTER 3. INTERACTIONS AMONG SOIL, PLANTS, AND MICROORGANISMS DRIVE SECONDARY SUCCESSION
72
3.2. INTRODUCTION
Plant secondary succession has been considered as a process of little applicability in arid
environments (Cramer and Hobbs 2007) or even non-occurring (Rowlands 1980). Several reports
have shown that plant secondary succession does actually occur in these extreme habitats (e.g.
Bonet 2004, Scott and Morgan 2012) but our knowledge on secondary processes in arid
environments is still poor, especially in comparison to more temperate regions (Abella 2010) where
plant succession often shows a relatively rapid and predictable trajectory in species diversity and
composition (e.g., Foster and Tilman 2000).
Soil microbial communities also change over time as it has been shown in different environments,
from soils deglaciated only 20 years ago (Nemergut et al. 2007), to of ca. 77000 years old inland
dunes (Tarlera et al. 2008). Changes in microbial community composition with time are influenced
by factors such as carbon inputs, plant-microbial interactions (Tarlera et al. 2008) competition
(Nemergut et al. 2007), soil variables such as pH, C, N and P concentrations (Banning et al. 2011)
or land use history (Jangid et al. 2011). It has been suggested that plant community composition
and soil chemistry explain different parts of the variation in soil microbial communities (Mitchell et
al. 2012), but still little is known about the links between below-ground and above-ground
succession processes.
The few existing studies on secondary succession in arid ecosystems have almost exclusively
focused on the dynamics of plant communities, with little attention to soil microorganisms.
However, interactions between plants and soil microorganisms may have important consequences
for plant community dynamics, becoming key factors for community assemblage and ecosystem
functioning (Kardol et al. 2013). We know that soil organisms influence plant community
composition (Van der Putten et al. 2013), affecting plant performance either positively (Bever 2003,
Rodríguez-Echeverría et al. 2013) or negatively (Klironomos 2002); and that plants in turn
influence microbial communities and drive changes in physico-chemical soil properties (Van der
Putten et al. 2013). Published reports on soil microbial changes with time concerned temperate
ecosystems but never, to our knowledge, dry environments. Such reports, however, lacked enough
information (e.g., microbial biomass, activity and composition) to help explain such variations.
CHAPTER 3. INTERACTIONS AMONG SOIL, PLANTS, AND MICROORGANISMS DRIVE SECONDARY SUCCESSION
73
3.3. OBJECTIVES
Our specific objectives were 1) to characterize changes in plant communities, soil properties and
soil microbial communities at different times after agricultural abandonment, and evaluate whether
changes follow a successional pattern; 2) to elucidate whether changes in plant and microbial
community mirrored each other and; 3) to explore linkages among soil properties and plant and
microbial communities along the chronosequence.
3.4. HYPOTHESIS
We hypothesized the existence of a parallel secondary succession above- and below-ground and
we expected to find a process of succession in below-ground soil communities intimately linked to
above-ground plant succession in plants.
3.5. METHODS
3.5.1. Study area
The field site was located at Llanos de Rueda (37.05º N, 2.22º W, 503 m altitude) a flat piedmont
of approximately 120 ha in the Tabernas Basin, Almería, Spain. The climate is semiarid with a
mean annual precipitation of 235 mm, mild winter temperatures (mean minimum temperature of
4.1ºC) and hot summers (average maximum temperature of 34.7ºC) (Lázaro et al. 2001). Extreme
air temperatures above 45ºC and below freezing temperatures are not uncommon in the hottest
and coldest months, respectively (Spanish National Meteorological Institute 2012). Soil parent
material is a gypsum siltstone. Soils are orthic solonchacks with inclusions of calcic regosols,
characterized by very low water holding capacity, low organic matter content, moderately alkaline
pH (8.5) and low electrical conductivity (Pérez Pujalte et al. 1987).
The plant community is a sparse and short shrubland with low cover dominated by shrubs like
Artemisia barrelieri (Besser), Hammada articulata (Moq.) O. Bolòs & Vigo, Helianthemun
almeriense (Pau), Salsola oppositifolia (Desf.), Thymelaea hirsuta (L.) Endl, and perennial grasses
as Stipa tenacissima (L.) and Lygeum spartum (L.) Kunth (Peinado et al. 1992).
CHAPTER 3. INTERACTIONS AMONG SOIL, PLANTS, AND MICROORGANISMS DRIVE SECONDARY SUCCESSION
74
3.5.2. Chronosequence selection
To define the chronosequence we used information from three different sources, (i) land use maps
of the study area from 1928 (scale 1:25000) and 1949 (scale 1:5000) (Geographic and Cadastral
Institute of Spain); (ii) orthophotos from 1956, 2000 and 2009, registered in the Environmental
Information Network of Andalucía (REDIAM) with spatial reference ETRS89_30 and a geometric
resolution of 1.0 m (years 1956 and 2009) or 0.5 m (year 2000) (Fig. 3.1); and (iii) direct field
assessment performed in 2012.
Both land use maps and orthophotos were digitized with ArcGIS 10.0 (ESRI, Redlands, California,
USA) using clustering analysis to group objects with similar features. Objects were attributed to
land uses taking into account shadow tone, color, shape, texture features and geometric resolution
(Mitchell 1999). Attributed land uses were checked by field assessment, available information in
the literature, historical records from the Almería Historic Archive, and confirmed by interviews with
people with first-hand knowledge of the area.
All digitized maps were overlapped in order to identify changes in land use. We recorded areas
used as croplands anytime in the past and recorded their dates of abandonment (Fig. S3.1). Each
of the identified areas was assigned into one of the following five categories according to the date
of abandonment, i.e. the last 3, 12, 56, 63 years and >84 years or native grasslands. The most
recently abandoned fields were marginally cultivated to sustain game bird populations, while
traditional agricultural use consisted on non-irrigated crops for human subsistence. We considered
native grasslands as the endpoint of succession, and grouped in this category any areas not
cultivated after 1928 (i.e. areas abandoned more than 84 years ago).
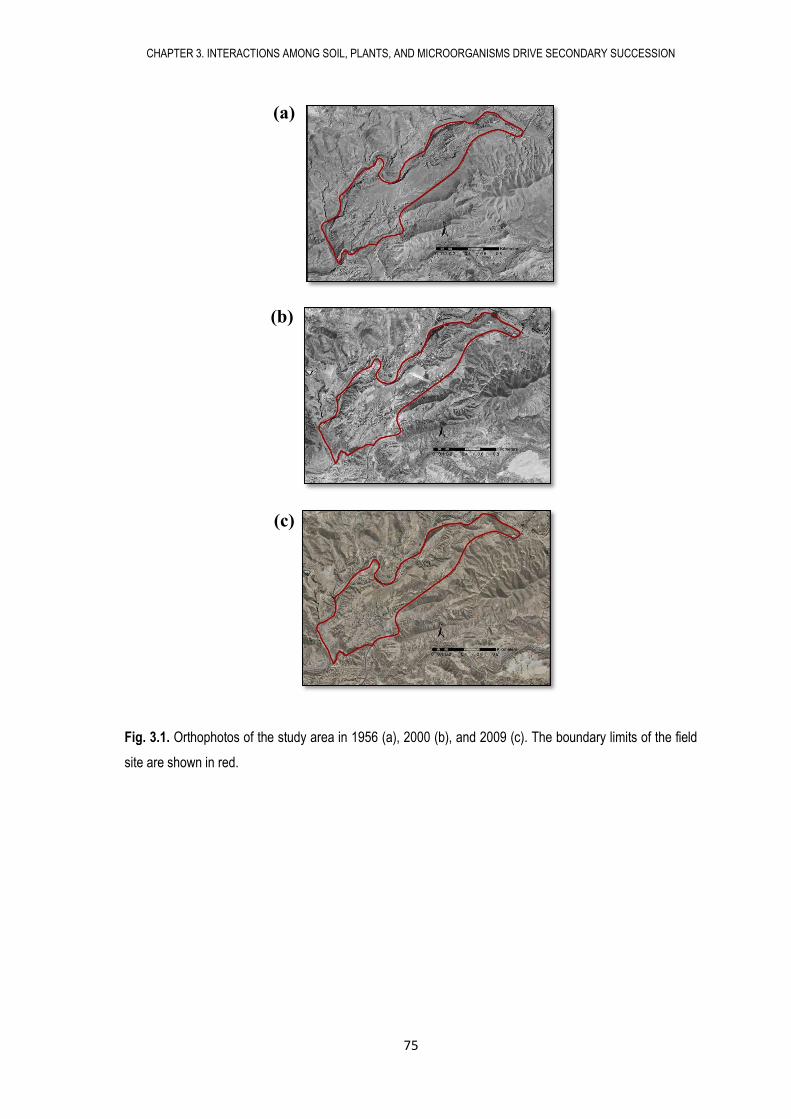
CHAPTER 3. INTERACTIONS AMONG SOIL, PLANTS, AND MICROORGANISMS DRIVE SECONDARY SUCCESSION
75
Fig. 3.1. Orthophotos of the study area in 1956 (a), 2000 (b), and 2009 (c). The boundary limits of the field
site are shown in red.
(a)
(b)
(c)
CHAPTER 3. INTERACTIONS AMONG SOIL, PLANTS, AND MICROORGANISMS DRIVE SECONDARY SUCCESSION
76
Five 30 m2 plots were randomly selected in each identified stage, giving a total of 25 plots. All plots
were located as close as possible (maximum distance of 1 Km), and shared similar soil, climatic
conditions and topographic position.
3.5.3. Plant community composition and soil sampling
We surveyed plant communities in May 2012 using transects. In each of the 25 plots we randomly
placed five transects 25 m in length. We identified species found along transects and measured
the length of intercepted segments (i.e. the transect length occupied by a given species). For each
perennial species we calculated the percent cover by transect and then the average percent cover
by plot. We also recorded the number of individuals for each perennial species in each plot as the
sum of individuals recorded in the five transects per plot, and assessed plant diversity using the
Shannon’s diversity index. All taxa were identified to species level.
Seven soil cores, 4.5 cm in diameter and 10 cm deep, were collected at regular distances along
each transect, combined, homogenized and sieved through 2 mm mesh to form one composite soil
sample per plot. Each of the 25 composite soil samples collected was divided in two subsamples,
one (approximately 100 g) was stored at -20ºC for soil microbial molecular analyses following and
Tscherko et al. (2005), Hortal et al. (2013), and the other (approximately 400 g) was kept at 4ºC for
physical and chemical analyses. Samples were processed within four weeks after collection.
3.5.4. Soil analyses
Soil electrical conductivity (EC) and pH were measured in each soil sample using a 1/10 (w/v)
aqueous solution with a conductivity- and pH-meters (Crison, BA, Spain), respectively. Total soil
carbon (C), organic C after removal of inorganic carbon with HCL 2N (Schumacher 2002), and
total nitrogen (N) content were determined using a C/N analyzer (LECO Truspec, MI, USA). Anion
phosphate (PO43-), nitrate (NO3
-), and sulphate (SO42-) concentrations in water extract (1:10
soil:water) were analized by HPLC (Metrohm, HE, Switzerland). Soil ammonium content (NH4+)
was calculated from the urease activity (below). Percentage of clay, sand and silt were measured
by granulometry.
CHAPTER 3. INTERACTIONS AMONG SOIL, PLANTS, AND MICROORGANISMS DRIVE SECONDARY SUCCESSION
77
3.5.5. Bacterial composition: pyrosequencing
DNA was extracted from 0.25 g of homogenized soil from each of the 25 soil samples using the
PowerSoil® DNA Isolation Kit (MO BIO Laboratories, Inc., Carlsbad, USA) following the
manufacturer’s directions. Following Hortal et al. (2013) a 16S rDNA gene fragment corresponding
to V1 and V2 regions was amplified. The forward primer (5´-
CCATCTCATCCCTGCGTGTCTCCGACTCAGNNNNNNNNNNAGAGTTTGATCMTGGCTCAG-3´)
contain Roche pyrosequencing adapter A (underlined), a Roche recommended 10 bp barcode
sequence (NNNNNNNNNN) used to tag each sample and the bacterial primer 27F. The reverse
primer (5´-CCTATCCCCTGTGTGCCTTGGCAGTCTCAGGCTGCCTCCCGTAGGAGT-3´)
contained the Roche pyrosequencing adapter B (underlined) and the primer 338R. Each sample
was amplified in triplicate, pooled, purified and DNA concentration determined following Hortal et
al. (2013). An equimolar pool was prepared and pyrosequenced in a Roche Genome Sequencer
FLX System (Roche, Basel, Switzerland) using 454 Titanium chemistry at Lifesequencing lab
(Valencia, Spain).
Sequences were trimmed for primers, quality filtered and demultiplexed using the pyrosequencing
pipeline tools from the Ribosomal Database Project (RDP, Michigan State Univ., USA). Sequences
shorter than 150 bp, with quality scores <20 or containing any unresolved nucleotides were
removed from the dataset. We used Acacia software version 1.52 (Bragg et al. 2012) for
pyrosequencing noise removal using default parameters for error correction. Chimeras were
identified using Decipher’s Find chimeras tool (Wright et al. 2012) and removed from the dataset.
Sequences were aligned using the Aligner tool from the RDP pipeline. Aligned sequences were
clustered into operational taxonomic units (OTUs) defined at 97% similarity cutoff using the
complete linkage clustering tool of the RDP pipeline. Taxonomic assignation of sequences was
performed using the RDP naïve Bayesian classifier trained on the 16S training set 9 (Wang et al.
2007) at a confidence level of 80 %, and relative abundances of the different phyla, classes,
subclasses and order per each of the 25 samples were calculated.
3.5.6. Microbial biomass and activity
Phospholipids fatty acids (PLFAs) were analyzed following Hortal et al. (2013). The Gram+ specific
fatty acids i15:0, i16:0, a15:0, i17:0, a17:0 and the Gram- specific fatty acids 16:1ω, 18:1ω9c,
18:1ω9t, cy17:0, cy19:0 were taken as a measure of the ratio between the Gram+ and Gram-
CHAPTER 3. INTERACTIONS AMONG SOIL, PLANTS, AND MICROORGANISMS DRIVE SECONDARY SUCCESSION
78
bacterial biomass. Fatty acids i15:0, i16:0, 18:1ω9c, 18:1ω9t, cy17:0 and cy19:0 were chosen to
represent the bacterial biomass and 18:2ω6 was taken to indicate fungal biomass (Dungait et al.
2011).
Soil basal microbial respiration was analyzed by placing 15 g of soil moistened to 40–50% of its
water holding capacity (water potential: -0.055 MPa) in hermetically sealed flasks and incubated
for 24 days at 28°C. We measured the CO2 accumulated in the air every day for the first 10 days
and then weekly using an infrared gas analyzer (Toray PG-100, Toray Engineering Co. Ltd.,
Japan). Results were added to give a cumulative amount of CO2 released after 24 days of
incubation, and basal respiration was expressed as mg CO2–C kg-1 soil day-1. Soil dehydrogenase
activity was determined on 1 g of soil, and the reduction of p-iodonitrotetrazolium chloride (INT) to
p-iodonitrotetrazolium formazan (INTF) was measured by a modification of the method reported by
Vonmersi and Schinner (1991) and was expressed as µg INTF g-1 soil h-1. Urease activity was
determined as the NH4+ released in the hydrolytic reaction using urea as substrate and borate
buffer (pH 10) (Kandeler and Gerber 1988). Alkaline phosphatase and β-glucosidase activities
were determined following methods modified by Lucas-Borja et al. (2011), adding 2 ml of modified
universal buffer (MUB) pH 11 and 0.5 ml of 0.115 M p-nitrophenyl phosphate (for the phosphatase
assay) or 2 ml of MUB pH 6 and 0.5 ml of 0.025 M p-nitrophenyl phosphate β-D-glucopiranoside
(for β-glucosidase assay) to 0.5 g of soil. The mixtures were then incubated at 37ºC for 1 h and,
after that; enzymatic reactions were stopped by cooling on ice for 15 min. Then, 0.5 ml of 0.5 M
CaCl2 and 2 ml of 0.5 M NaOH (for phosphatase) or 2 ml of 0.1 M Tris–
hydroxymethylaminomethane–sodium hydroxide (THAM-NaOH) pH 12 (for β-glucosidase) were
added. Substrates were added before (in samples) and after (in controls) the addition of CaCl2,
NaOH and THAM. Microbial activity per unit of biomass was calculated using the ratio of basal
respiration to total PLFAs.
3.5.7. Statistical analyses
Differences in plant cover, plant diversity, soil properties, microbial activity (basal respiration and
enzymatic activities), microbial biomass (PLFAs groups), bacterial diversity, and relative
abundance of bacterial taxa along successional stages were evaluated using general linear
models. Significance was established at p<0.05. Post-hoc comparisons were performed using
Fisher’s LSD test. Results are presented as mean values ±1 SE throughout the text. Similarity
among treatments in plant community composition (perennial plant species) or bacterial
CHAPTER 3. INTERACTIONS AMONG SOIL, PLANTS, AND MICROORGANISMS DRIVE SECONDARY SUCCESSION
79
community composition (with OTUs showing at least 5 reads in the overall dataset) were analyzed
with Non-metric multidimensional scaling (NMDS) using Bray-Curtis similarity index, and
differences among chronosequence stages were evaluated performing NPMANOVA with 9999
permutations using Past v 2.12 software (Hammer et al. 2001). The correlation between the first
coordinates of each NMDS on microbial and plant community composition was analysed using
Pearson’s coefficient. Shannon’s diversity index (H’) of OTUs per sample was calculated with Past
software after excluding singletons (OTUs only showing 1 read in the overall dataset) to reduce the
overestimation of diversity (Tedersoo et al. 2010). We performed hierarchical cluster analyses of
the relative abundance of bacterial community genera in each treatment using Bray-Curtis
similarity index. We also performed a principal component analysis (PCA) and correlation matrix
analysis of plant cover, soil properties, plant and microbial composition, microbial biomass and
activity. Data were analyzed with InfoStat (Di Rienzo et al. 2013).
3.6. RESULTS
3.6.1. Plant community composition
Plant cover significantly increased with increasing time of abandonment, ranging from 0.39% just
after agriculture cessation to 79.50% in native grasslands (Table 3.1). Diversity of perennial
species showed a similar trend, and increased with increasing time of abandonment (Table 3.1). A
total of 20 perennial species were found along the different stages. In each successional stage
(ranked in increasing time since abandonment) we found 4, 9, 12, 15 and 17 species, respectively
(Table 3.1).
The set of dominant perennial species changed over time (Table 3.1). Launaea fragilis and
Cynodon dactylon were the dominant species during the first successional stage (3 years). In the
second (12 years), Thymelaea hirsuta became dominant along with Artemisia barrelieri. In the 56
years stage, Artemisia barrelieri was highly dominant, covering 17.96%, which represented more
than half the total cover (25.92%). Salsola oppositifolia and Hammada articulata were the
dominant species in the 63 years stage. In native grasslands, the grass species Stipa tenacissima
and Lygeum spartum, and the shrub species Helianthemun almeriense and Anthyllis cytisoides
were dominant. Ordination of plant communities (Fig. 3.2a) showed clear differences among
successional stages in species composition (F4,20=17.46, p<0.001, NPMANOVA).
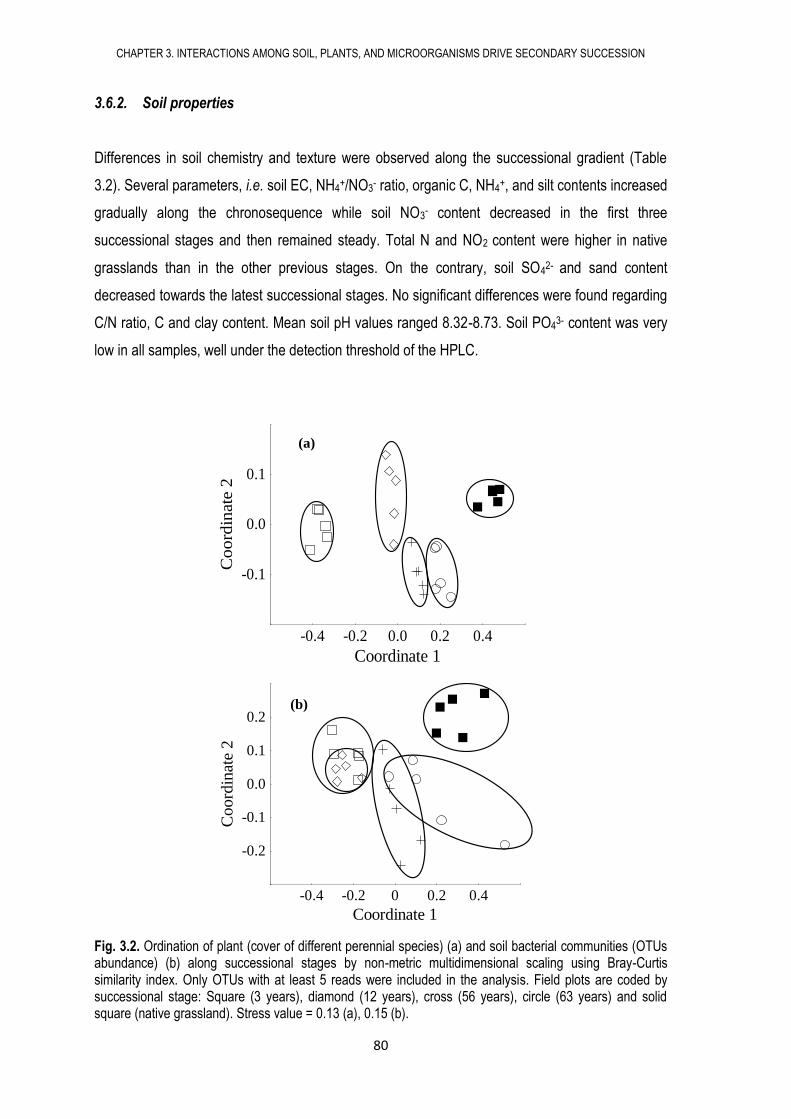
CHAPTER 3. INTERACTIONS AMONG SOIL, PLANTS, AND MICROORGANISMS DRIVE SECONDARY SUCCESSION
80
3.6.2. Soil properties
Differences in soil chemistry and texture were observed along the successional gradient (Table
3.2). Several parameters, i.e. soil EC, NH4+/NO3
- ratio, organic C, NH4+, and silt contents increased
gradually along the chronosequence while soil NO3- content decreased in the first three
successional stages and then remained steady. Total N and NO2 content were higher in native
grasslands than in the other previous stages. On the contrary, soil SO42- and sand content
decreased towards the latest successional stages. No significant differences were found regarding
C/N ratio, C and clay content. Mean soil pH values ranged 8.32-8.73. Soil PO43- content was very
low in all samples, well under the detection threshold of the HPLC.
Fig. 3.2. Ordination of plant (cover of different perennial species) (a) and soil bacterial communities (OTUs abundance) (b) along successional stages by non-metric multidimensional scaling using Bray-Curtis similarity index. Only OTUs with at least 5 reads were included in the analysis. Field plots are coded by successional stage: Square (3 years), diamond (12 years), cross (56 years), circle (63 years) and solid square (native grassland). Stress value = 0.13 (a), 0.15 (b).
-0.4 -0.2 0 0.2 0.4
Coordinate 1
-0.2
-0.1
0.0
0.1
0.2
Coord
inat
e 2
-0.4 -0.3 -0.2 -0.1 0.0 0.1 0.2 0.3
-0.16
-0.08
0.00
0.08
0.16 (a)
-0.24 -0.16 -0.08 0.00 0.08 0.16 0.24 0.32
Coordinate 1
-0.30
-0.24
-0.18
-0.12
-0.06
0.00
0.06
0.12
0.18
0.24
Coord
inate
2
(b)
-0.4 -0.2 0.0 0.2 0.4
Coordinate 1
-0.1
0.0
0.1
Co
ord
inate
2
Título
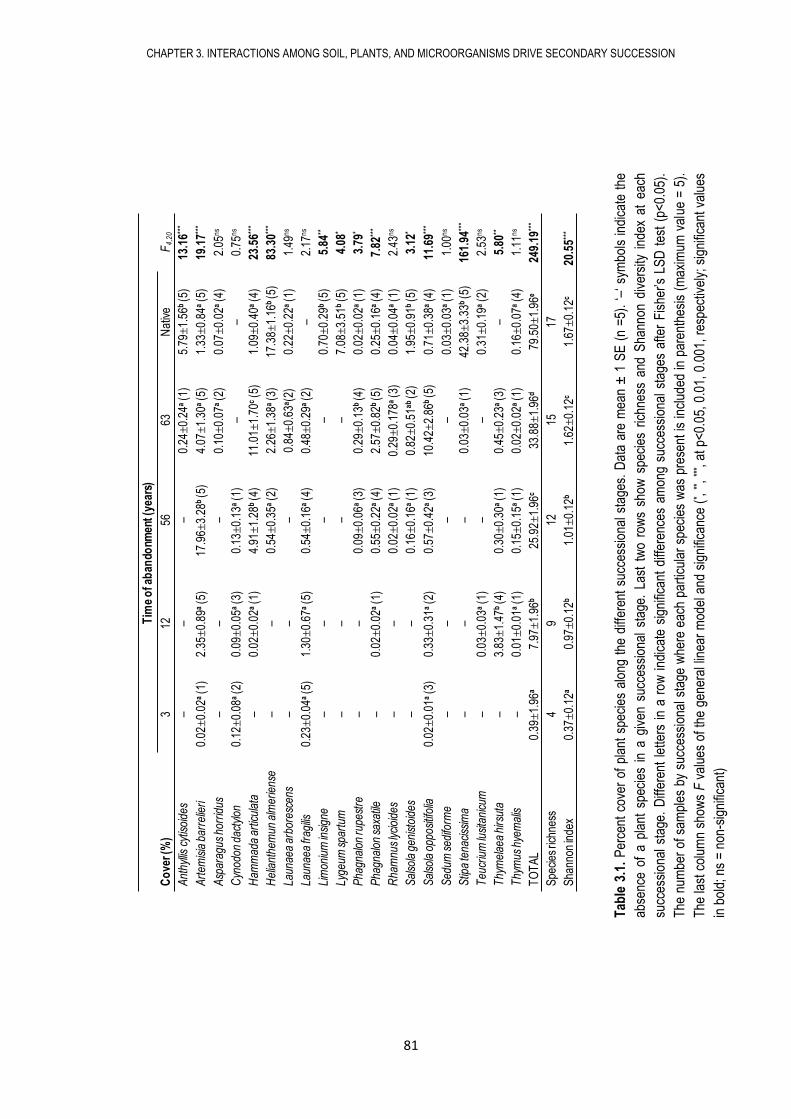
CHAPTER 3. INTERACTIONS AMONG SOIL, PLANTS, AND MICROORGANISMS DRIVE SECONDARY SUCCESSION
81
Tab
le 3
.1.
Per
cent
cov
er o
f pl
ant
spec
ies
alon
g th
e di
ffer
ent
succ
essi
onal
sta
ges.
Dat
a ar
e m
ean
± 1
SE
(n
=5)
. ‘–
‘ sy
mbo
ls in
dica
te t
he
abse
nce
of a
pla
nt s
peci
es i
n a
give
n su
cces
sion
al s
tage
. La
st t
wo
row
s sh
ow s
peci
es r
ichn
ess
and
Sha
nnon
div
ersi
ty i
ndex
at
each
succ
essi
onal
sta
ge.
Diff
eren
t le
tters
in
a ro
w i
ndic
ate
sign
ifica
nt d
iffer
ence
s am
ong
succ
essi
onal
sta
ges
afte
r F
ishe
r’s L
SD
tes
t (p
<0.
05).
The
num
ber
of s
ampl
es b
y su
cces
sion
al s
tage
whe
re e
ach
part
icul
ar s
peci
es w
as p
rese
nt is
incl
uded
in p
aren
thes
is (
max
imum
val
ue =
5).
The
last
col
umn
show
s F
val
ues
of t
he g
ener
al li
near
mod
el a
nd s
igni
fican
ce (
* , **,
*** ,
at p
<0.
05,
0.01
, 0.
001,
res
pect
ivel
y; s
igni
fican
t va
lues
in b
old;
ns
= no
n-si
gnifi
cant
)
Tim
e o
f ab
ando
nmen
t (ye
ars)
Co
ver (
%)
312
5663
Nat
ive
F4
,20
Ant
hyllis
cyt
isoi
des
––
–0.
24±
0.24
a (1
)5.
79±
1.56
b (5
)13
.16**
*
Art
emis
ia b
arre
lieri
0.02
±0.
02a
(1)
2.35
±0.
89a
(5)
17.9
6±3.
28b
(5)
4.07
±1.
30a
(5)
1.33
±0.
84a
(5)
19.1
7***
Asp
arag
us h
orrid
us–
––
0.10
±0.
07a
(2)
0.07
±0.
02a
(4)
2.05
ns
Cyn
odon
dac
tylo
n0.
12±
0.08
a (2
)0.
09±
0.05
a (3
)0.
13±
0.13
a (1
)–
–0.
75n
s
Ham
mad
aar
ticul
ata
–0.
02±
0.02
a (1
)4.
91±
1.28
b (4
)11
.01±
1.70
c (5
)1.
09±
0.40
a (4
)23
.56**
*
Hel
iant
hem
un a
lmer
iens
e–
–0.
54±
0.35
a (2
)2.
26±
1.38
a (3
)17
.38±
1.16
b (5
)83
.30**
*
Laun
aea
arbo
resc
ens
––
–0.
84±
0.63
a(2
)0.
22±
0.22
a (1
)1.
49n
s
Laun
aea
frag
ilis0.
23±
0.04
a (5
)1.
30±
0.67
a (5
)0.
54±
0.16
a (4
)0.
48±
0.29
a (2
)–
2.17
ns
Lim
oniu
m in
sign
e–
––
–0.
70±
0.29
b (5
)5.
84**
Lyge
um s
part
um–
––
–7.
08±
3.51
b (5
)4.
08*
Pha
gnal
on ru
pest
re–
–0.
09±
0.06
a (3
)0.
29±
0.13
b (4
)0.
02±
0.02
a (1
)3.
79*
Pha
gnal
onsa
xatil
e–
0.02
±0.
02a
(1)
0.55
±0.
22a
(4)
2.57
±0.
82b
(5)
0.25
±0.
16a
(4)
7.82
***
Rha
mnu
s ly
cioi
des
––
0.02
±0.
02a
(1)
0.29
±0.
178a
(3)
0.04
±0.
04a
(1)
2.43
ns
Sal
sola
gen
isto
ides
––
0.16
±0.
16a
(1)
0.82
±0.
51a
b (2
)1.
95±
0.91
b (5
)3.
12*
Sal
sola
opp
ositi
folia
0.02
±0.
01a
(3)
0.33
±0.
31a
(2)
0.57
±0.
42a
(3)
10.4
2±2.
86b
(5)
0.71
±0.
38a
(4)
11.6
9***
Sed
um s
edifo
rme
––
––
0.03
±0.
03a
(1)
1.00
ns
Stip
a te
naci
ssim
a–
––
0.03
±0.
03a
(1)
42.3
8±3.
33b
(5)
161.
94**
*
Teu
criu
m lu
sita
nicu
m–
0.03
±0.
03a
(1)
––
0.31
±0.
19a
(2)
2.53
ns
Thy
mel
aea
hirs
uta
–3.
83±
1.47
b (4
)0.
30±
0.30
a (1
)0.
45±
0.23
a (3
)–
5.80
**
Thy
mus
hye
mal
is–
0.01
±0.
01a
(1)
0.15
±0.
15a
(1)
0.02
±0.
02a
(1)
0.16
±0.
07a
(4)
1.11
ns
TO
TA
L0.
39±
1.96
a7.
97±
1.96
b25
.92±
1.96
c33
.88±
1.96
d79
.50±
1.96
e24
9.19
***
Spe
cies
rich
ness
49
1215
17
Sha
nnon
inde
x0.
37±
0.12
a0.
97±
0.12
b1.
01±
0.12
b1.
62±
0.12
c1.
67±
0.12
c20
.55**
*
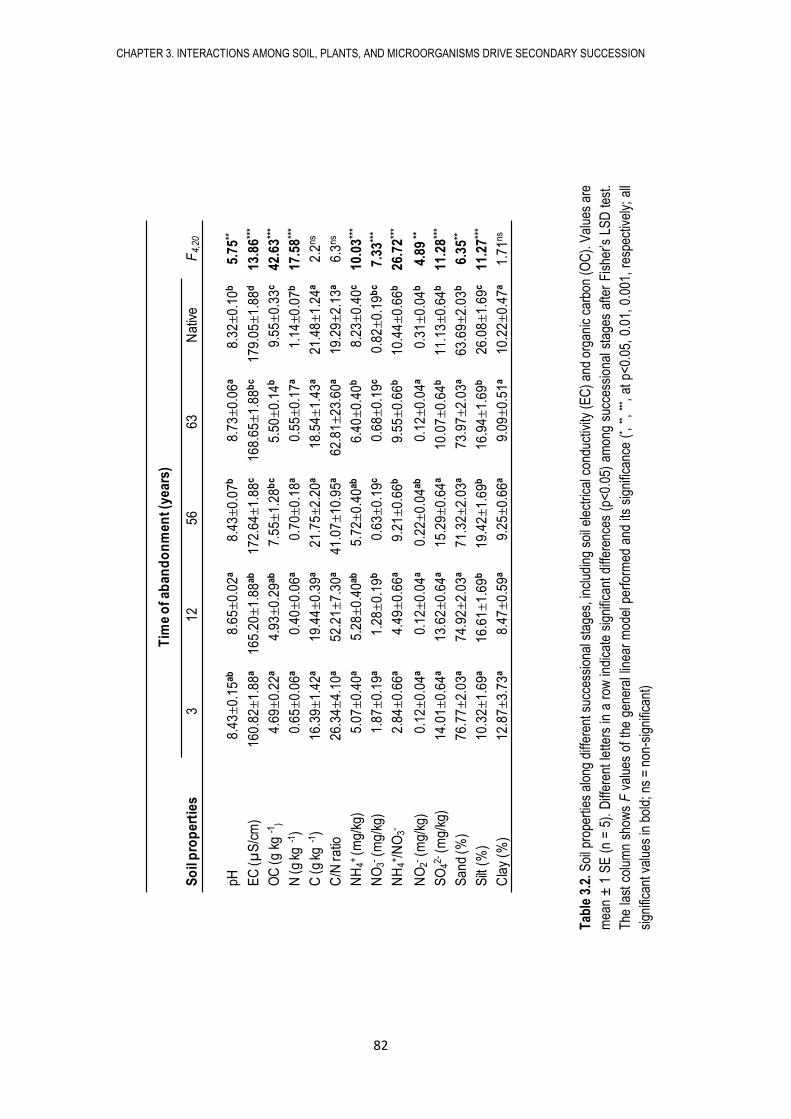
CHAPTER 3. INTERACTIONS AMONG SOIL, PLANTS, AND MICROORGANISMS DRIVE SECONDARY SUCCESSION
82
Tim
e o
f a
ba
nd
on
me
nt
(ye
ars
)
So
il p
rop
ert
ies
31
25
66
3N
ativ
eF
4,20
pH
8.4
3±
0.1
5ab
8.6
5±
0.0
2a
8.4
3±
0.0
7b
8.7
3±
0.0
6a
8.3
2±
0.1
0b
5.7
5**
EC
(µS
/cm
)1
60
.82±
1.8
8a
16
5.2
0±
1.8
8ab
17
2.6
4±
1.8
8c
16
8.6
5±
1.8
8b
c1
79
.05±
1.8
8d
13
.86
***
OC
(gkg
-1)
4.6
9±
0.2
2a
4.9
3±
0.2
9ab
7.5
5±
1.2
8b
c5
.50±
0.1
4b
9.5
5±
0.3
3c
42
.63
***
N(g
kg-1
)0
.65±
0.0
6a
0.4
0±
0.0
6a
0.7
0±
0.1
8a
0.5
5±
0.1
7a
1.1
4±
0.0
7b
17
.58
***
C(g
kg-1
)1
6.3
9±
1.4
2a
19
.44±
0.3
9a
21
.75±
2.2
0a
18
.54±
1.4
3a
21
.48±
1.2
4a
2.2
ns
C/N
ratio
26
.34±
4.1
0a
52
.21±
7.3
0a
41
.07±
10
.95
a6
2.8
1±
23
.60
a1
9.2
9±
2.1
3a
6.3
ns
NH
4+(m
g/k
g)
5.0
7±
0.4
0a
5.2
8±
0.4
0ab
5.7
2±
0.4
0ab
6.4
0±
0.4
0b
8.2
3±
0.4
0c
10
.03
***
NO
3-(m
g/k
g)
1.8
7±
0.1
9a
1.2
8±
0.1
9b
0.6
3±
0.1
9c
0.6
8±
0.1
9c
0.8
2±
0.1
9b
c7
.33
***
NH
4+/N
O3-
2.8
4±
0.6
6a
4.4
9±
0.6
6a
9.2
1±
0.6
6b
9.5
5±
0.6
6b
10
.44±
0.6
6b
26
.72
***
NO
2-(m
g/k
g)
0.1
2±
0.0
4a
0.1
2±
0.0
4a
0.2
2±
0.0
4ab
0.1
2±
0.0
4a
0.3
1±
0.0
4b
4.8
9**
SO
42-(m
g/k
g)
14
.01±
0.6
4a
13
.62±
0.6
4a
15
.29±
0.6
4a
10
.07±
0.6
4b
11
.13±
0.6
4b
11
.28
***
Sa
nd
(%)
76
.77±
2.0
3a
74
.92±
2.0
3a
71
.32±
2.0
3a
73
.97±
2.0
3a
63
.69±
2.0
3b
6.3
5**
Silt
(%)
10
.32±
1.6
9a
16
.61±
1.6
9b
19
.42±
1.6
9b
16
.94±
1.6
9b
26
.08±
1.6
9c
11
.27
***
Cla
y(%
)1
2.8
7±
3.7
3a
8.4
7±
0.5
9a
9.2
5±
0.6
6a
9.0
9±
0.5
1a
10
.22±
0.4
7a
1.7
1ns
Tab
le 3
.2. S
oil p
rope
rtie
s al
ong
diffe
rent
suc
cess
iona
l sta
ges,
incl
udin
g so
il el
ectr
ical
con
duct
ivity
(E
C)
and
orga
nic
carb
on (
OC
). V
alue
s ar
e
mea
n ±
1 S
E (
n =
5).
Diff
eren
t le
tters
in a
row
indi
cate
sig
nific
ant
diffe
renc
es (
p<0.
05)
amon
g su
cces
sion
al s
tage
s af
ter
Fis
her’s
LS
D t
est.
The
last
col
umn
show
s F
val
ues
of t
he g
ener
al li
near
mod
el p
erfo
rmed
and
its
sign
ifica
nce
(* , **,
*** ,
at p
<0.
05,
0.01
, 0.
001,
res
pect
ivel
y; a
ll
sign
ifica
nt v
alue
s in
bol
d; n
s =
non
-sig
nific
ant)
CHAPTER 3. INTERACTIONS AMONG SOIL, PLANTS, AND MICROORGANISMS DRIVE SECONDARY SUCCESSION
83
3.6.3. Microbial biomass and activity
We found an overall increase in microbial biomass with increasing time since abandonment (Table
3.3). Total microbial biomass showed the lowest values at the first (3 years) and second (12 years)
stages and constantly increased afterwards. Fungal PLFAs were intermediate at 3 years, low at 12
years stage and high after 56 years of abandonment. Lowest values of bacterial biomass were
also found at the 12 years stage, while the highest values were recorded in native grasslands. The
highest ratio of fungi/bacteria was recorded 56 years after abandonment while the lowest values
corresponded to the first two successional stages. There were no significant differences in the ratio
Gram+ / Gram- across successional stages. We also found an overall increase in soil microbial
activity with increasing time since abandonment, with the highest values of phosphatase, β-
glucosidase and urease activities recorded in native grasslands (Table 3.3). Soil basal respiration
was significantly higher after 56 years of abandonment than in the first 12 years of abandonment.
Dehydrogenase activity was similar across successional stages.
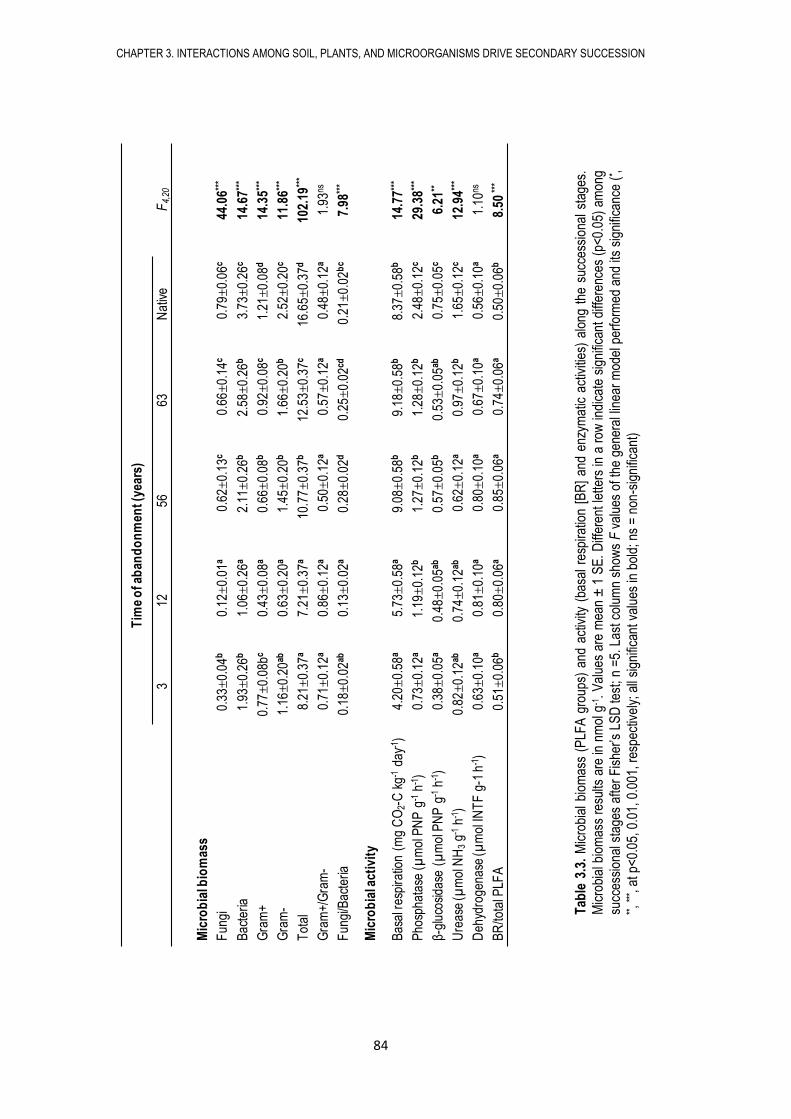
CHAPTER 3. INTERACTIONS AMONG SOIL, PLANTS, AND MICROORGANISMS DRIVE SECONDARY SUCCESSION
84
Tab
le 3
.3.
Mic
robi
al b
iom
ass
(PLF
A g
roup
s) a
nd a
ctiv
ity (
basa
l re
spira
tion
[BR
] an
d en
zym
atic
act
iviti
es)
alon
g th
e su
cces
sion
al s
tage
s.
Mic
robi
al b
iom
ass
resu
lts a
re in
nm
ol g
-1.
Val
ues
are
mea
n ±
1 S
E.
Diff
eren
t le
tters
in a
row
indi
cate
sig
nific
ant
diffe
renc
es (
p<0.
05)
amon
g
succ
essi
onal
sta
ges
afte
r F
ishe
r’s L
SD
test
; n
=5.
Las
t col
umn
show
s F
val
ues
of th
e ge
nera
l lin
ear
mod
el p
erfo
rmed
and
its
sign
ifica
nce
(* , **, **
* , at
p<
0.05
, 0.0
1, 0
.001
, res
pect
ivel
y; a
ll si
gnifi
cant
val
ues
in b
old;
ns
= n
on-s
igni
fican
t)
Tim
e o
f ab
and
on
men
t (ye
ars)
312
5663
Nat
ive
F4,
20
Mic
rob
ial b
iom
ass
Fun
gi0.
33±
0.04
b0.
12±
0.01
a0.
62±
0.13
c0.
66±
0.14
c0.
79±
0.06
c44
.06**
*
Bac
teria
1.93
±0.
26b
1.06
±0.
26a
2.11
±0.
26b
2.58
±0.
26b
3.73
±0.
26c
14.6
7***
Gra
m+
0.77
±0.
08bc
0.43
±0.
08a
0.66
±0.
08b
0.92
±0.
08c
1.21
±0.
08d
14.3
5***
Gra
m-
1.16
±0.
20ab
0.63
±0.
20a
1.45
±0.
20b
1.66
±0.
20b
2.52
±0.
20c
11.8
6***
Tot
al8.
21±
0.37
a7.
21±
0.37
a10
.77±
0.37
b12
.53±
0.37
c16
.65±
0.37
d10
2.19
***
Gra
m+/
Gra
m-
0.71
±0.
12a
0.86
±0.
12a
0.50
±0.
12a
0.57
±0.
12a
0.48
±0.
12a
1.93
ns
Fun
gi/B
acte
ria0.
18±
0.02
ab0.
13±
0.02
a0.
28±
0.02
d0.
25±
0.02
cd0.
21±
0.02
bc
7.98
***
Mic
rob
ial a
ctiv
ity
Bas
al r
espi
ratio
n (m
g C
O2-
C k
g-1da
y-1)
4.20
±0.
58a
5.73
±0.
58a
9.08
±0.
58b
9.18
±0.
58b
8.37
±0.
58b
14.7
7***
Pho
spha
tase
(µm
olP
NP
g-1
h-1)
0.73
±0.
12a
1.19
±0.
12b
1.27
±0.
12b
1.28
±0.
12b
2.48
±0.
12c
29.3
8***
β-gl
ucos
idas
e(µ
mol
PN
P g
-1h-1
)0.
38±
0.05
a0.
48±
0.05
ab0.
57±
0.05
b0.
53±
0.05
ab0.
75±
0.05
c6.
21**
Ure
ase
(µm
olN
H3
g-1h-1
)0.
82±
0.12
ab0.
74±
0.12
ab0.
62±
0.12
a0.
97±
0.12
b1.
65±
0.12
c12
.94**
*
Deh
ydro
gena
se(µ
mol
INT
F g
-1 h
-1)
0.63
±0.
10a
0.81
±0.
10a
0.80
±0.
10a
0.67
±0.
10a
0.56
±0.
10a
1.10
ns
BR
/tota
l PLF
A0.
51±
0.06
b0.
80±
0.06
a0.
85±
0.06
a0.
74±
0.06
a0.
50±
0.06
b8.
50**
*
CHAPTER 3. INTERACTIONS AMONG SOIL, PLANTS, AND MICROORGANISMS DRIVE SECONDARY SUCCESSION
85
3.6.4. Soil bacterial community composition
We obtained a total of 71524 sequences after filtering and removing chimeras. The mean number
of retained sequences per sample was 2860 ± 135 (mean ± SE), with no significant differences
among successional stages (F4,20=2.09, p=0.12, ANOVA). Average length of retained sequences
was 322 ± 0.23 bp. The slope of rarefaction curves was similar for all samples regardless of the
treatment (Fig. S3.1). Sequences mostly belonged to five different phyla, Actinobacteria,
Acidobacteria, Proteobacteria, Bacteroidetes and Gemmatimonadetes. Other minor phyla (with
relative abundance lower than 1%) were Chloroflexi, Firmicutes, Armatimonadetes, Cyanobacteria,
Nitrospira and TM7.
Relative abundances of the different taxa differed among successional stages (Fig. 3.3).
Actinobacteridae decreased in the last two successional stages and Bacteroidetes and
Deltaproteobacteria showed the lowest relative abundance in native grasslands. On the contrary,
Acidobacteria increased in the last two successional stages and Gemmatimonadetes showed the
highest relative abundance in native grasslands. Betaproteobacteria was higher at the intermediate
(56 years) stage than at the stages immediately before and after (12 and the 63 years). Among
minor phyla, Firmicutes decreased with time while relative abundance of both Cyanobacteria and
Armatimonadetes were significantly higher at the 12 and 63 years stage than at the others (data
not shown). There were no significant changes in the relative abundance of Acidimicrobidae,
Rubrobacteridae (subclasses within Actinobacteria), Alphaproteobacteria, Gammaproteobacteria,
Chloroflexi, Nitrospira, TM7 or unclassified bacteria. Bacterial diversity (Shannon’s index) was 6.68
± 0.02, without significant differences among successional stages.
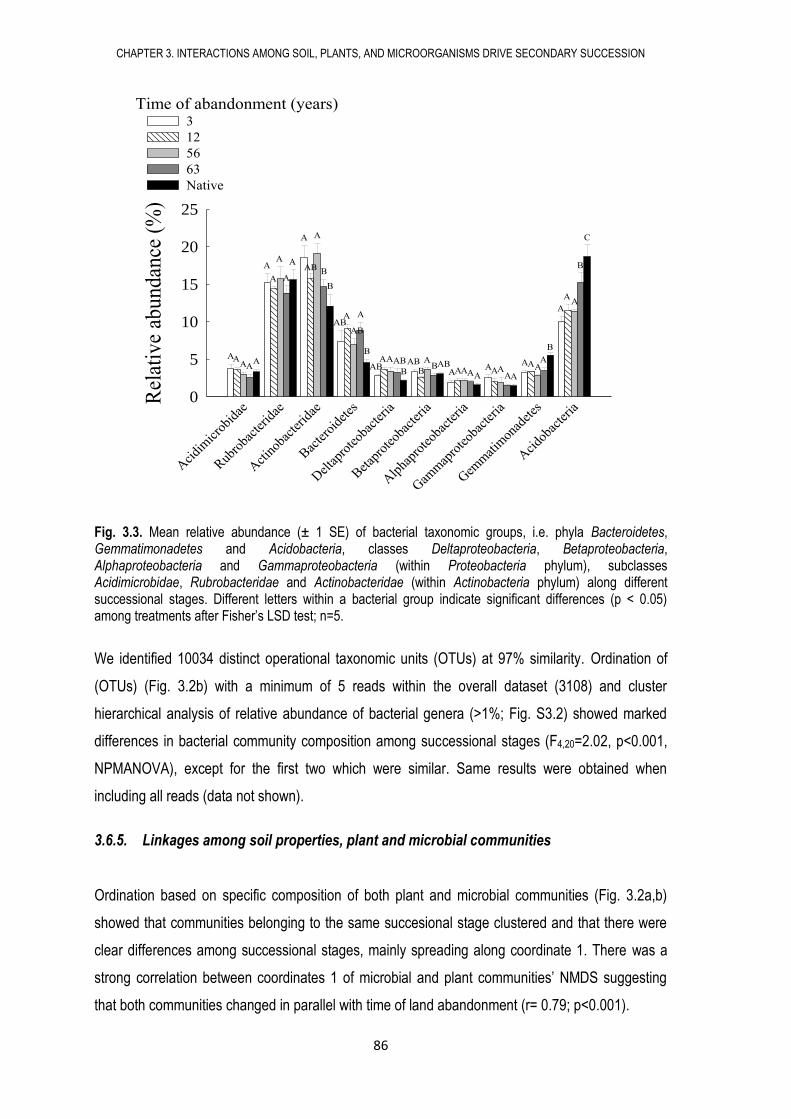
CHAPTER 3. INTERACTIONS AMONG SOIL, PLANTS, AND MICROORGANISMS DRIVE SECONDARY SUCCESSION
86
Fig. 3.3. Mean relative abundance (± 1 SE) of bacterial taxonomic groups, i.e. phyla Bacteroidetes, Gemmatimonadetes and Acidobacteria, classes Deltaproteobacteria, Betaproteobacteria, Alphaproteobacteria and Gammaproteobacteria (within Proteobacteria phylum), subclasses Acidimicrobidae, Rubrobacteridae and Actinobacteridae (within Actinobacteria phylum) along different successional stages. Different letters within a bacterial group indicate significant differences (p < 0.05) among treatments after Fisher’s LSD test; n=5.
We identified 10034 distinct operational taxonomic units (OTUs) at 97% similarity. Ordination of
(OTUs) (Fig. 3.2b) with a minimum of 5 reads within the overall dataset (3108) and cluster
hierarchical analysis of relative abundance of bacterial genera (>1%; Fig. S3.2) showed marked
differences in bacterial community composition among successional stages (F4,20=2.02, p<0.001,
NPMANOVA), except for the first two which were similar. Same results were obtained when
including all reads (data not shown).
3.6.5. Linkages among soil properties, plant and microbial communities
Ordination based on specific composition of both plant and microbial communities (Fig. 3.2a,b)
showed that communities belonging to the same succesional stage clustered and that there were
clear differences among successional stages, mainly spreading along coordinate 1. There was a
strong correlation between coordinates 1 of microbial and plant communities’ NMDS suggesting
that both communities changed in parallel with time of land abandonment (r= 0.79; p<0.001).
Time of abandonment (years)
Aci
dim
icro
bida
e
Rub
roba
cter
idae
Act
inob
acte
ridae
Bac
tero
idet
es
Del
tapr
oteo
bact
eria
Bet
apro
teob
acte
ria
Alp
hapr
oteo
bact
eria
Gam
map
rote
obac
teria
Gem
mat
imon
adet
es
Aci
doba
cter
ia
Rel
ativ
e ab
undan
ce (
%)
0
5
10
15
20
25
3
12
56
63
Native
AAAA
A
A
A
A
A
A
A
AB
A
B
B
ABA
AB
A
B
ABAAAB
BAB
B
ABAB
AAAAAAAA
AA
AAAA
B
A
AA
B
C
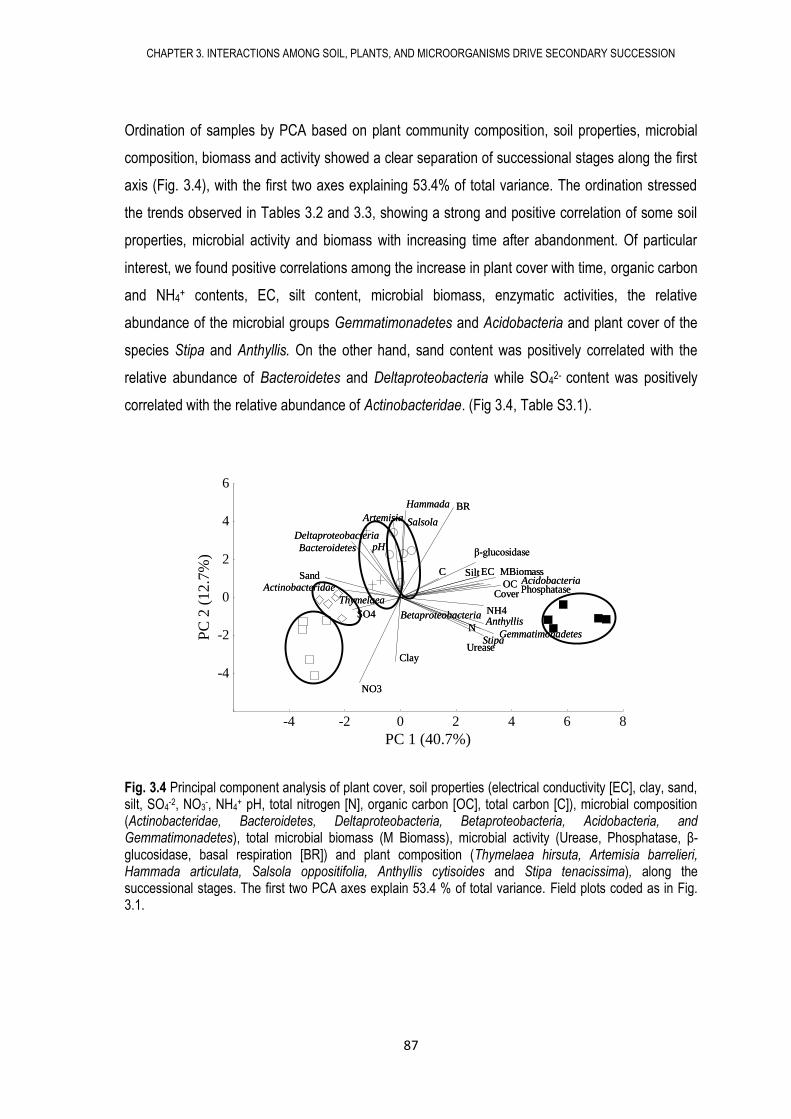
CHAPTER 3. INTERACTIONS AMONG SOIL, PLANTS, AND MICROORGANISMS DRIVE SECONDARY SUCCESSION
87
Ordination of samples by PCA based on plant community composition, soil properties, microbial
composition, biomass and activity showed a clear separation of successional stages along the first
axis (Fig. 3.4), with the first two axes explaining 53.4% of total variance. The ordination stressed
the trends observed in Tables 3.2 and 3.3, showing a strong and positive correlation of some soil
properties, microbial activity and biomass with increasing time after abandonment. Of particular
interest, we found positive correlations among the increase in plant cover with time, organic carbon
and NH4+ contents, EC, silt content, microbial biomass, enzymatic activities, the relative
abundance of the microbial groups Gemmatimonadetes and Acidobacteria and plant cover of the
species Stipa and Anthyllis. On the other hand, sand content was positively correlated with the
relative abundance of Bacteroidetes and Deltaproteobacteria while SO42- content was positively
correlated with the relative abundance of Actinobacteridae. (Fig 3.4, Table S3.1).
Fig. 3.4 Principal component analysis of plant cover, soil properties (electrical conductivity [EC], clay, sand, silt, SO4
-2, NO3-, NH4
+ pH, total nitrogen [N], organic carbon [OC], total carbon [C]), microbial composition (Actinobacteridae, Bacteroidetes, Deltaproteobacteria, Betaproteobacteria, Acidobacteria, and Gemmatimonadetes), total microbial biomass (M Biomass), microbial activity (Urease, Phosphatase, β-glucosidase, basal respiration [BR]) and plant composition (Thymelaea hirsuta, Artemisia barrelieri, Hammada articulata, Salsola oppositifolia, Anthyllis cytisoides and Stipa tenacissima), along the successional stages. The first two PCA axes explain 53.4 % of total variance. Field plots coded as in Fig. 3.1.
-4 -2 0 2 4 6 8
PC 1 (40.7%)
-4
-2
0
2
4
6
PC
2 (
12
.7%
)
Thymelaea
AcidobacteriaActinobacteridae
Betaproteobacteria
Deltaproteobacteria
Bacteroidetes
Gemmatimonadetes
MBiomass
BR
Urease
β-glucosidase
Phosphatase
pH
EC
N
C
OC
NO3
NH4 SO4
Sand Silt
Clay
Anthyllis
Artemisia Salsola
Hammada
Stipa
CoverThymelaea
AcidobacteriaActinobacteridae
Betaproteobacteria
Deltaproteobacteria
Bacteroidetes
Gemmatimonadetes
MBiomass
BR
Urease
β-glucosidase
Phosphatase
pH
EC
N
C
OC
NO3
NH4 SO4
Sand Silt
Clay
Anthyllis
Artemisia Salsola
Hammada
Stipa
Cover
CHAPTER 3. INTERACTIONS AMONG SOIL, PLANTS, AND MICROORGANISMS DRIVE SECONDARY SUCCESSION
88
3.7. DISCUSSION
Our results evidence that secondary succession in arid environments did occur both below- and
above-ground, in a process characterized by changes in soil microbial composition, biomass and
activity that mirrored changes in plant species composition, diversity and cover. Plant and
microbial communities changed with time of abandonment increasing ecosystem functions such as
above- and below-ground productivity, diversity and soil nutrient accumulation as succession
progressed.
3.7.1. Plant and microbial secondary succession
Plant communities in this semiarid environment undergo a secondary succession process
characterized by an increase in species richness, diversity and productivity. Our results show a
continuous increase in both species diversity and cover, in agreement with Bonet (2004). By
contrast, other studies in dry environments have reported an initial increase in species richness
and plant cover which remained steady or even decreased afterwards (e.g. Dana and Mota 2006,
Otto et al. 2006, Scott and Morgan 2012). The continuous increase recorded in our field site may
reflect that, although 84 years were enough to observe clear patterns of secondary succession,
most likely they were not enough to re-assemble the native community due to extreme climatic
conditions.
Our data also evidenced a clear pattern of succession in soil microbial communities including
changes in species composition, biomass and activity. While Kuramae et al. (2011) showed a large
overlap of microbial communities with no clear separation between successional stages in a
chronosequence in chalk grasslands, our data show changes with time in relative abundance of
several microbial groups. Microbial succession in our field site was also characterized by an
increase in both fungal and bacterial biomass as well as in microbial activity over time, as reported
for agricultural (Jangid et al. 2011) and moorland systems (Mitchell et al. 2012).
Our results showed that changes in composition of plant and microbial communities displayed a
similar pattern along the successional stages (the multidimensional space in the ordination
analyses). We found clear separation in plant and soil microbial communities among different
successional stages, suggesting a successional process in both plant and microbial communities,
and that both followed a similar path. Moreover, the set of 25 plot values in the first axes of the
CHAPTER 3. INTERACTIONS AMONG SOIL, PLANTS, AND MICROORGANISMS DRIVE SECONDARY SUCCESSION
89
nMDS of plant and soil communities were strongly correlated. That is, the degree of change in the
composition of the soil microbial community with time mirrored that of the plant community,
suggesting that plant and microbial successions might follow parallel processes.
3.7.2. Relationships among plant, microbial succession and soil properties
Our results showed that as both plant and microbial succession progressed, net primary
productivity (measured through plant cover), soil microbial biomass and activity, and C and N
content increased. In particular, plant and microbial succession in our field site were linked to an
increase in soil organic C, NH4+ and silt contents. The increase in plant cover with time enhances
the accretion of organic material such as litter and roots in soils, and consequently favours the
accumulation of soil organic C (Pugnaire et al. 2004, Yang et al. 2009). Soil organic C reduces soil
temperature amplitudes, increases soil water holding capacity and thus can enhance soil moisture
under perennial plants (Chancellor et al. 1994, Duchaufour 1995). In addition, the increase in plant
cover usually allows for better microclimatic conditions (temperature and soil moisture) under
shrub canopies (Pugnaire et al. 2004), overall improving soil conditions.
Better soil conditions, promoted by the increase in plant cover, positively affected microbial
communities in terms of biomass and activity, as reported for primary succession (Tscherko et al.
2005). Plant cover, through its effects on soil organic C and microclimatic conditions, promoted
microbial growth and hence microbial biomass (Tortora et al. 2007). Plant cover may have also
promoted higher soil respiration rates in later successional stages compared to initial stages where
cover was lowest, in agreement with Conant et al. (2004) who suggested that soil respiration in
semiarid areas is affected by temperature and soil moisture. The increase in phosphatase with
time could be attributable to soil microbes trying to obtain the scarce phosphorus from organic
sources (Tarafdar and Claassen 1988), while soil urease and β–glucosidase levels could be
explained by an increase in plant residues and organic carbon returned to soil along the
successional chronosequence.
Cover of dominant plant species in the last two successional stages, Stipa and Anthyillis, were
positively correlated with microbial biomass, enzymatic activities silt, organic C contents and an
abundance increase of Gemmatimonadetes and Acidobacteria. These results suggest that plant
identity affects microbial biomass and community composition by modifying soil properties.
Kowalchuk et al. (2002), and Martínez-García et al. (2011) found that plant species identity
CHAPTER 3. INTERACTIONS AMONG SOIL, PLANTS, AND MICROORGANISMS DRIVE SECONDARY SUCCESSION
90
determined the type of microorganisms found in the rhizosphere. Acidobacteria abundance
increased with successional time as reported elsewhere (Tarlera et al. 2008) and
Gemmatimonadetes were more abundant in native grasslands than in the other successional
stages, as in other undisturbed and non-grazed semiarid pastures (Acosta-Martínez et al. 2010).
Our results suggest that bacterial community composition and biomass were significantly affected
by soil particle size, as reported by Sessitsch et al. (2001) who found higher biomass and
abundance of Acidobacteria microbes in silt and clay than in sandy soils, while other microbial
groups such as Actinobacteria were negatively correlated with silt content, as in our case.
Agricultural practices may cause an accelerated loss of soil silt due to leaching (Urich 2002) and
thus may indirectly increase the amount of sand in soils. However, plant colonization during
secondary succession allows for an increase in soil retention thanks to a larger amount of roots
(Carrick and Krüger 2007) and soil organic carbon, overall promoting the accretion (and retention)
of silt particles in the soil.
Actinobacteria was the most abundant phylum across successional stages, and our results also
showed an abundance of Actinobacteridae higher in the initial stages than in the last ones.
Actinobacteria were positively correlated with SO4-2 as reported by Jiang et al. (2010) in freshwater
ecosystem. Members of Actinobacteria play an important role in cycling soil organic compounds
and have evident impact on soil N and C. Species of Streptomyces, for example, were commonly
found in our field site. They are known to be drought resistant (Köberl et al. 2013), can use many
organic carbon compounds (Schlatter et al. 2013), and, although their role is likely minor relative to
fungi (Rayner and Boddy 1988), they have a role in wood decomposition (Bontemps et al. 2013).
The dominance by Actinobacteria in the first and intermediate stages correlates with their ability to
colonize bare soil (Suela Silva et al. 2013), while their decrease at latter stages agrees with reports
showing that Actinobacteridae are less abundant under shrubs than in patches without vegetation
(Hortal et al. 2013).
On the contrary, Bacteroidetes and Deltaproteobacteria were less abundant in native grasslands
than in early successional stages. Although Bacteroidetes exhibit copiotrophic attributes (Fierer et
al. 2007) and Mixococcales (our most common Deltaproteobacteria order) inhabit soils on
decaying organic material (Kersters et al. 2006) we did not find any positive correlation with soil
organic carbon. Their abundance however was positively correlated with sand content. Soil texture
is determinant in bacterial community structure (Girvan et al. 2003) and could explain changes in
abundance of both groups here.
CHAPTER 3. INTERACTIONS AMONG SOIL, PLANTS, AND MICROORGANISMS DRIVE SECONDARY SUCCESSION
91
Agricultural practices (with large inputs of N into the system) also strongly affect biogeochemical
cycles (Austin et al. 2006a) and, consequently, the trajectory of secondary succession. We
recorded a decrease in NO3- content with successional time linked to land abandonment, with a
parallel increase in NH4+ content and plant cover. Although Austin et al. (2006b) negatively
correlated NH4+ with plant cover in arid Patagonia systems, our data show that larger levels of
NH4+ could potentially positively affect C storage by plants (increasing net primary productivity),
probably as many species prefer NH4+ as nitrogen source (Boudsocq et al. 2012). Opposite to
McLendon and Redente (1992), who suggested that in semiarid ecosystems succession could be
controlled by N limitation, our data show increasing N availability with time.
3.7.3. Microbial succession follows plant succession
Although our results suggest that plant and microbial succession processes developed in parallel,
they also suggest that plant succession proceeded faster than microbial succession. We recorded
changes in plant cover and diversity in the two first successional stages but not changes in soil
microbial composition, suggesting that microbial succession might lag behind plant succession.
Although it is assumed that plant and soil communities vary over similar time-scales (Bever 2003),
the starting point of plant and microbial communities differs in abandoned agricultural fields. While
plant secondary succession usually starts from disturbed, nude soil easy to colonize, microbial
secondary succession starts from an established microbial community already present in former
agricultural fields. Thus, the influence of plants on the established soil microbial community might
have been low during the first successional stages when plant cover was low. This result contrasts
to what happened in a temperate grassland (Kuramae et al. 2011), where the first stages but not
intermediate and late stages showed microbial variation. As argued above, the increase in plant
cover along the chronosequence would have influenced soil microbial community through the input
of soil nutrients and organic C, buffering of temperature, improved soil moisture conditions, and
accretion of small soil particles. As time since land abandonment increased, microbial communities
might also have influenced plant performance either positively (Rodríguez-Echeverría et al. 2013)
or negatively (Klironomos 2002) thereby establishing a feedback among plant and soil microbial
communities as succession progressed.
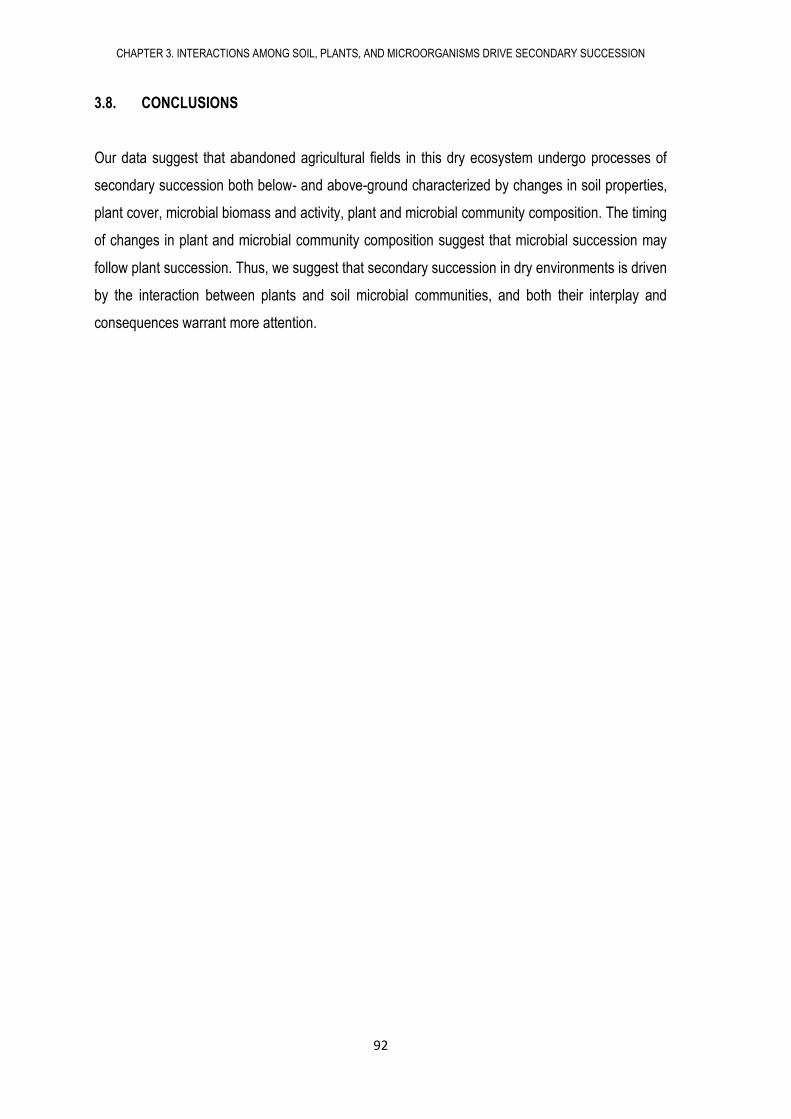
CHAPTER 3. INTERACTIONS AMONG SOIL, PLANTS, AND MICROORGANISMS DRIVE SECONDARY SUCCESSION
92
3.8. CONCLUSIONS
Our data suggest that abandoned agricultural fields in this dry ecosystem undergo processes of
secondary succession both below- and above-ground characterized by changes in soil properties,
plant cover, microbial biomass and activity, plant and microbial community composition. The timing
of changes in plant and microbial community composition suggest that microbial succession may
follow plant succession. Thus, we suggest that secondary succession in dry environments is driven
by the interaction between plants and soil microbial communities, and both their interplay and
consequences warrant more attention.
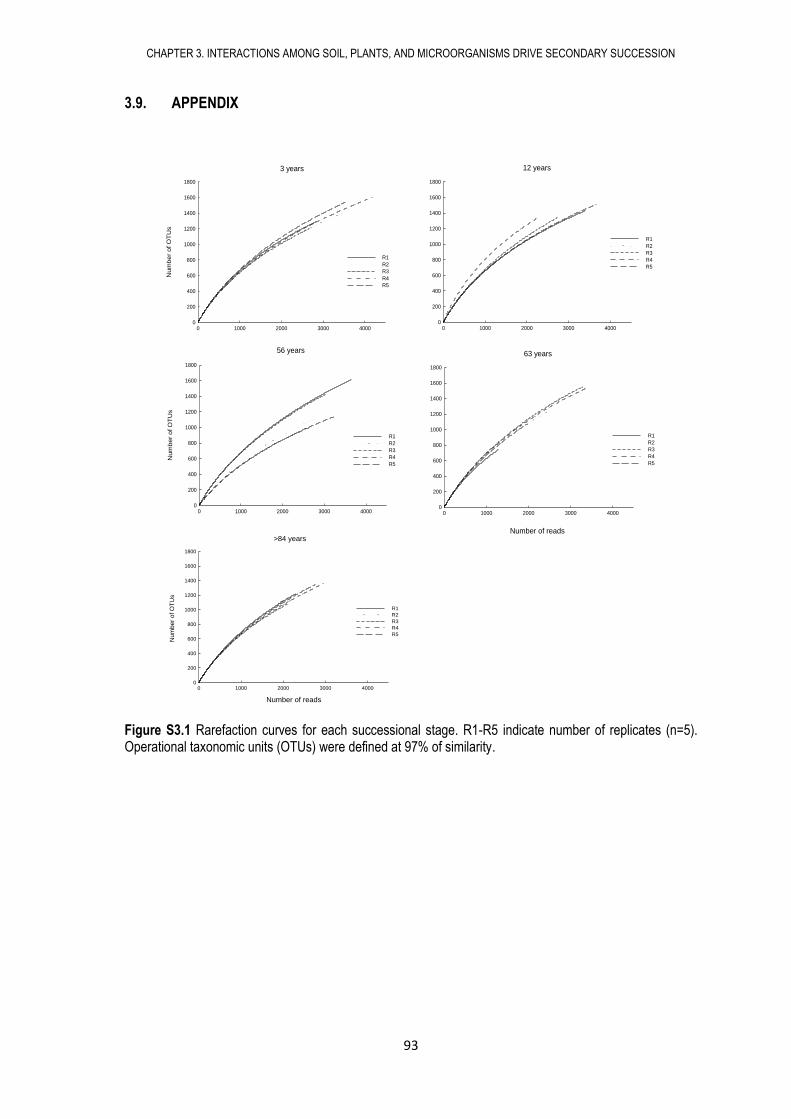
CHAPTER 3. INTERACTIONS AMONG SOIL, PLANTS, AND MICROORGANISMS DRIVE SECONDARY SUCCESSION
93
3.9. APPENDIX
Figure S3.1 Rarefaction curves for each successional stage. R1-R5 indicate number of replicates (n=5). Operational taxonomic units (OTUs) were defined at 97% of similarity.
56 years
0 1000 2000 3000 4000
Nu
mb
er
of O
TU
s
0
200
400
600
800
1000
1200
1400
1600
1800
R1
R2
R3
R4
R5
3 years
0 1000 2000 3000 4000
Num
be
r o
f O
TU
s
0
200
400
600
800
1000
1200
1400
1600
1800
R1
R2
R3
R4
R5
12 years
0 1000 2000 3000 40000
200
400
600
800
1000
1200
1400
1600
1800
R1
R2
R3
R4
R5
63 years
0 1000 2000 3000 40000
200
400
600
800
1000
1200
1400
1600
1800
R1
R2
R3
R4
R5
Number of reads>84 years
Number of reads
0 1000 2000 3000 40000
200
400
600
800
1000
1200
1400
1600
1800
R1
R2
R3
R4
R5
Nu
mber
of O
TU
s
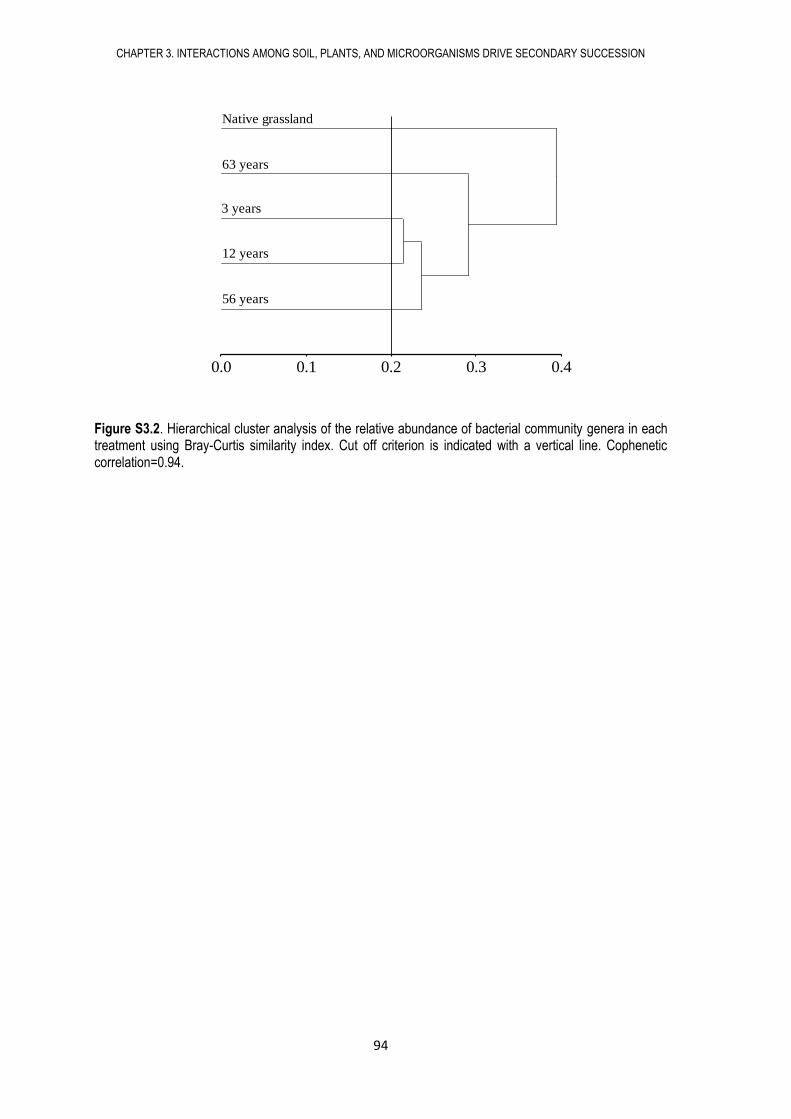
CHAPTER 3. INTERACTIONS AMONG SOIL, PLANTS, AND MICROORGANISMS DRIVE SECONDARY SUCCESSION
94
Figure S3.2. Hierarchical cluster analysis of the relative abundance of bacterial community genera in each treatment using Bray-Curtis similarity index. Cut off criterion is indicated with a vertical line. Cophenetic correlation=0.94.
0.0 0.1 0.2 0.3 0.4
56 years
12 years
3 years
63 years
Native grassland
Weighted average linkageDistancia: (Bray-Curtis)
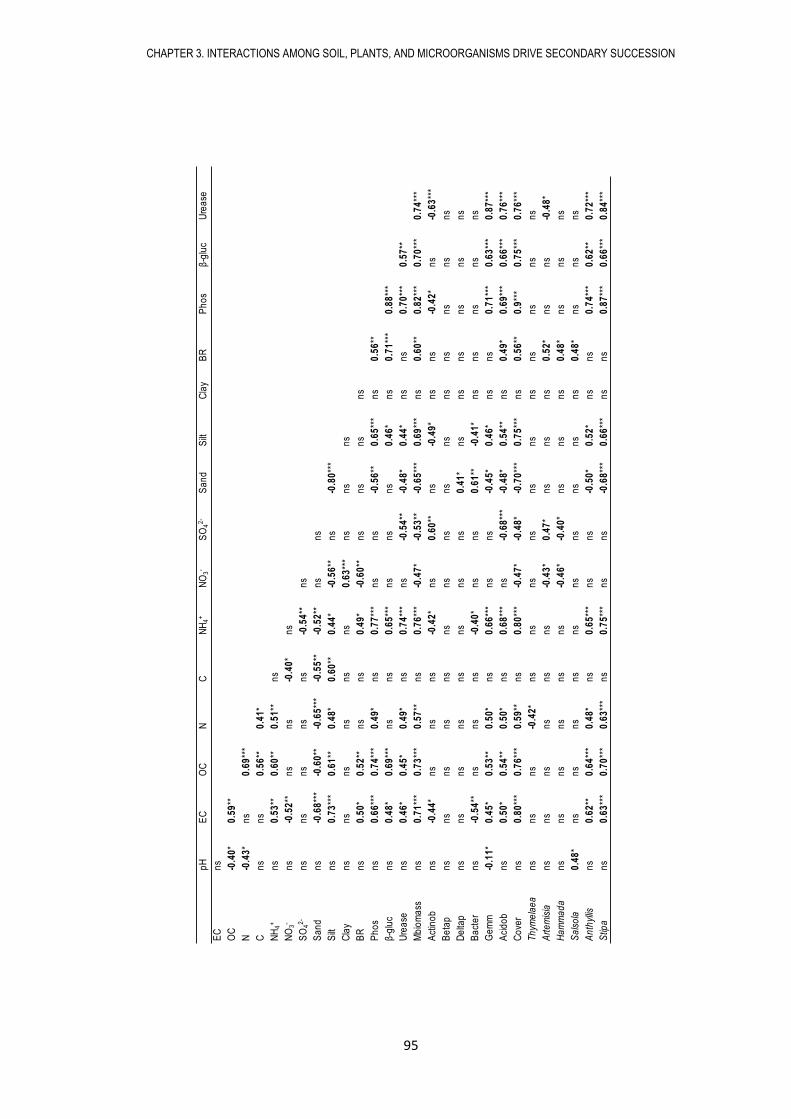
CHAPTER 3. INTERACTIONS AMONG SOIL, PLANTS, AND MICROORGANISMS DRIVE SECONDARY SUCCESSION
95
pH
EC
OC
NC
NH
4+
NO
3-
SO
42
-S
an
dS
iltC
lay
BR
Ph
os
β-g
luc
Ure
ase
EC
ns
OC
-0.4
0*
0.5
9**
N-0
.43
*n
s0
.69
***
Cn
sn
s0
.56
**0
.41
*
NH
4+
ns
0.5
3**
0.6
0**
0.5
1**
ns
NO
3-
ns
-0.5
2**
ns
ns
-0.4
0*
ns
SO
42
-n
sn
sn
sn
sn
s-0
.54
**n
s
Sa
nd
ns
-0.6
8**
*-0
.60
**-0
.65
***
-0.5
5**
-0.5
2**
ns
ns
Silt
ns
0.7
3**
*0
.61
**0
.48
*0
.60
**0
.44
*-0
.56
**n
s-0
.80
***
Cla
yn
sn
sn
sn
sn
sn
s0
.63
***
ns
ns
ns
BR
ns
0.5
0*
0.5
2**
ns
ns
0.4
9*
-0.6
0**
ns
ns
ns
ns
Ph
os
ns
0.6
6**
*0
.74
***
0.4
9*
ns
0.7
7**
*n
sn
s-0
.56
**0
.65
***
ns
0.5
6**
β-g
luc
ns
0.4
8*
0.6
9**
*n
sn
s0
.65
***
ns
ns
ns
0.4
6*
ns
0.7
1**
*0
.88
***
Ure
ase
ns
0.4
6*
0.4
5*
0.4
9*
ns
0.7
4**
*n
s-0
.54
**-0
.48
*0
.44
*n
sn
s0
.70
***
0.5
7**
Mb
iom
ass
ns
0.7
1**
*0
.73
***
0.5
7**
ns
0.7
6**
*-0
.47
*-0
.53
**-0
.65
***
0.6
9**
*n
s0
.60
**0
.82
***
0.7
0**
*0
.74
***
Act
ino
bn
s-0
.44
*n
sn
sn
s-0
.42
*n
s0
.60
**n
s-0
.49
*n
sn
s-0
.42
*n
s-0
.63
***
Be
tap
ns
ns
ns
ns
ns
ns
ns
ns
ns
ns
ns
ns
ns
ns
ns
De
ltap
ns
ns
ns
ns
ns
ns
ns
ns
0.4
1*
ns
ns
ns
ns
ns
ns
Ba
cte
rn
s-0
.54
**n
sn
sn
s-0
.40
*n
sn
s0
.61
**-0
.41
*n
sn
sn
sn
sn
s
Ge
mm
-0.1
1*
0.4
5*
0.5
3**
0.5
0*
ns
0.6
6**
*n
sn
s-0
.45
*0
.46
*n
sn
s0
.71
***
0.6
3**
*0
.87
***
Aci
do
bn
s0
.50
*0
.54
**0
.50
*n
s0
.68
***
ns
-0.6
8**
*-0
.48
*0
.54
**n
s0
.49
*0
.69
***
0.6
6**
*0
.76
***
Co
ver
ns
0.8
0**
*0
.76
***
0.5
9**
ns
0.8
0**
*-0
.47
*-0
.48
*-0
.70
***
0.7
5**
*n
s0
.56
**0
.9**
*0
.75
***
0.7
6**
*
Th
yme
lae
an
sn
sn
s-0
.42
*n
sn
sn
sn
sn
sn
sn
sn
sn
sn
sn
s
Art
em
isia
ns
ns
ns
ns
ns
ns
-0.4
3*
0.4
7*
ns
ns
ns
0.5
2*
ns
ns
-0.4
8*
Ha
mm
ad
an
sn
sn
sn
sn
sn
s-0
.46
*-0
.40
*n
sn
sn
s0
.48
*n
sn
sn
s
Sa
lso
la0
.48
*n
sn
sn
sn
sn
sn
sn
sn
sn
sn
s0
.48
*n
sn
sn
s
An
thyl
lisn
s0
.62
**0
.64
***
0.4
8*
ns
0.6
5**
*n
sn
s-0
.50
*0
.52
*n
sn
s0
.74
***
0.6
2**
0.7
2**
*
Stip
an
s0
.63
***
0.7
0**
*0
.63
***
ns
0.7
5**
*n
sn
s-0
.68
***
0.6
6**
*n
sn
s0
.87
***
0.6
6**
*0
.84
***
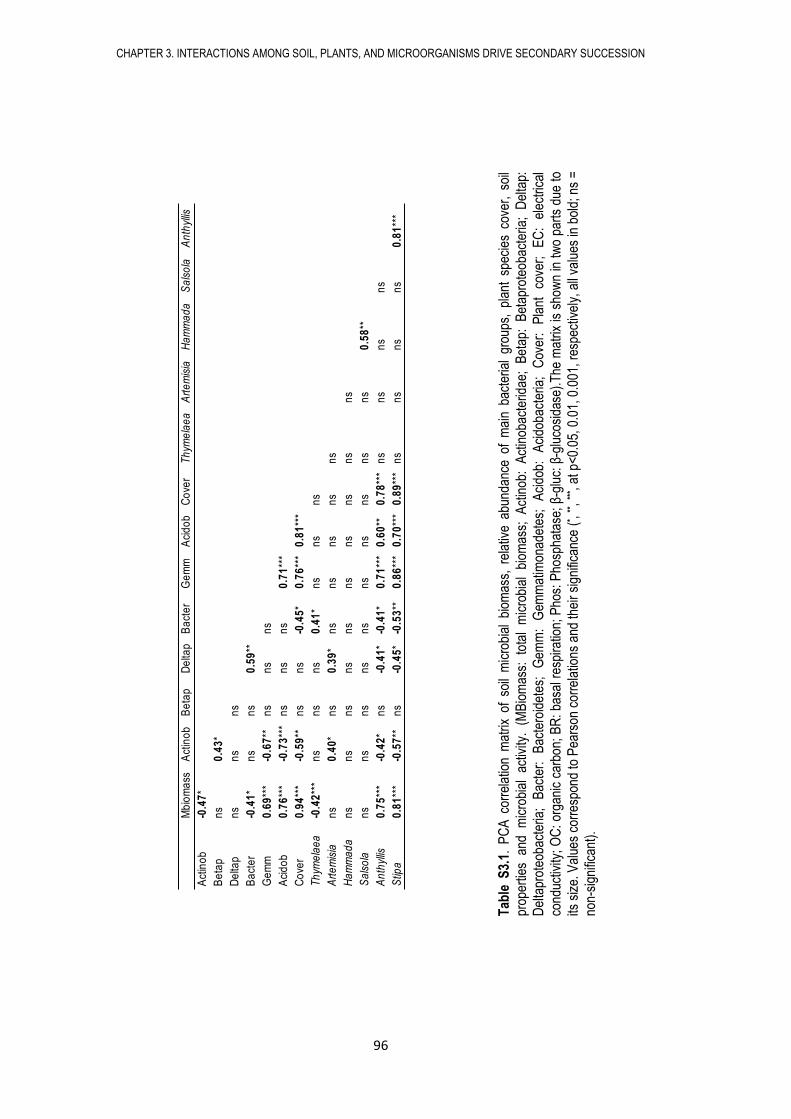
CHAPTER 3. INTERACTIONS AMONG SOIL, PLANTS, AND MICROORGANISMS DRIVE SECONDARY SUCCESSION
96
M
bio
ma
ssA
ctin
ob
Be
tap
De
ltap
Ba
cte
rG
em
mA
cid
ob
Co
ver
Th
yme
lae
aA
rte
mis
iaH
am
ma
da
Sa
lso
laA
nth
yllis
Act
ino
b-0
.47
*
Be
tap
ns
0.4
3*
De
ltap
ns
ns
ns
Ba
cte
r-0
.41
*n
sn
s0
.59
**
Ge
mm
0.6
9**
*-0
.67
**n
sn
sn
s
Aci
do
b0
.76
***
-0.7
3**
*n
sn
sn
s0
.71
***
Co
ver
0.9
4**
*-0
.59
**n
sn
s-0
.45
*0
.76
***
0.8
1**
*
Th
yme
lae
a-0
.42
***
ns
ns
ns
0.4
1*
ns
ns
ns
Art
em
isia
ns
0.4
0*
ns
0.3
9*
ns
ns
ns
ns
ns
Ha
mm
ad
an
sn
sn
sn
sn
sn
sn
sn
sn
sn
s
Sa
lso
lan
sn
sn
sn
sn
sn
sn
sn
sn
sn
s0
.58
**
An
thyl
lis0
.75
***
-0.4
2*
ns
-0.4
1*
-0.4
1*
0.7
1**
*0
.60
**0
.78
***
ns
ns
ns
ns
Stip
a0
.81
***
-0.5
7**
ns
-0.4
5*
-0.5
3**
0.8
6**
*0
.70
***
0.8
9**
*n
sn
sn
sn
s0
.81
***
Tab
le S
3.1.
PC
A c
orre
latio
n m
atrix
of
soil
mic
robi
al b
iom
ass,
rel
ativ
e ab
unda
nce
of m
ain
bact
eria
l gr
oups
, pl
ant
spec
ies
cove
r, s
oil
prop
ertie
s an
d m
icro
bial
ac
tivity
. (M
Bio
mas
s:
tota
l m
icro
bial
bi
omas
s;
Act
inob
: A
ctin
obac
terid
ae;
Bet
ap:
Bet
apro
teob
acte
ria;
Del
tap:
Del
tapr
oteo
bact
eria
; B
acte
r:
Bac
tero
idet
es;
Gem
m:
Gem
mat
imon
adet
es;
Aci
dob:
A
cido
bact
eria
; C
over
: P
lant
co
ver;
E
C:
elec
tric
al
cond
uctiv
ity; O
C:
orga
nic
carb
on;
BR
: ba
sal r
espi
ratio
n; P
hos:
Pho
spha
tase
; β
-glu
c: β
-glu
cosi
dase
).T
he m
atrix
is s
how
n in
tw
o pa
rts
due
to
its s
ize.
Val
ues
corr
espo
nd to
Pea
rson
cor
rela
tions
and
thei
r si
gnifi
canc
e (* ,
**, **
* , at
p<0
.05,
0.0
1, 0
.001
, res
pect
ivel
y, a
ll va
lues
in b
old;
ns
=
non-
sign
ifica
nt).
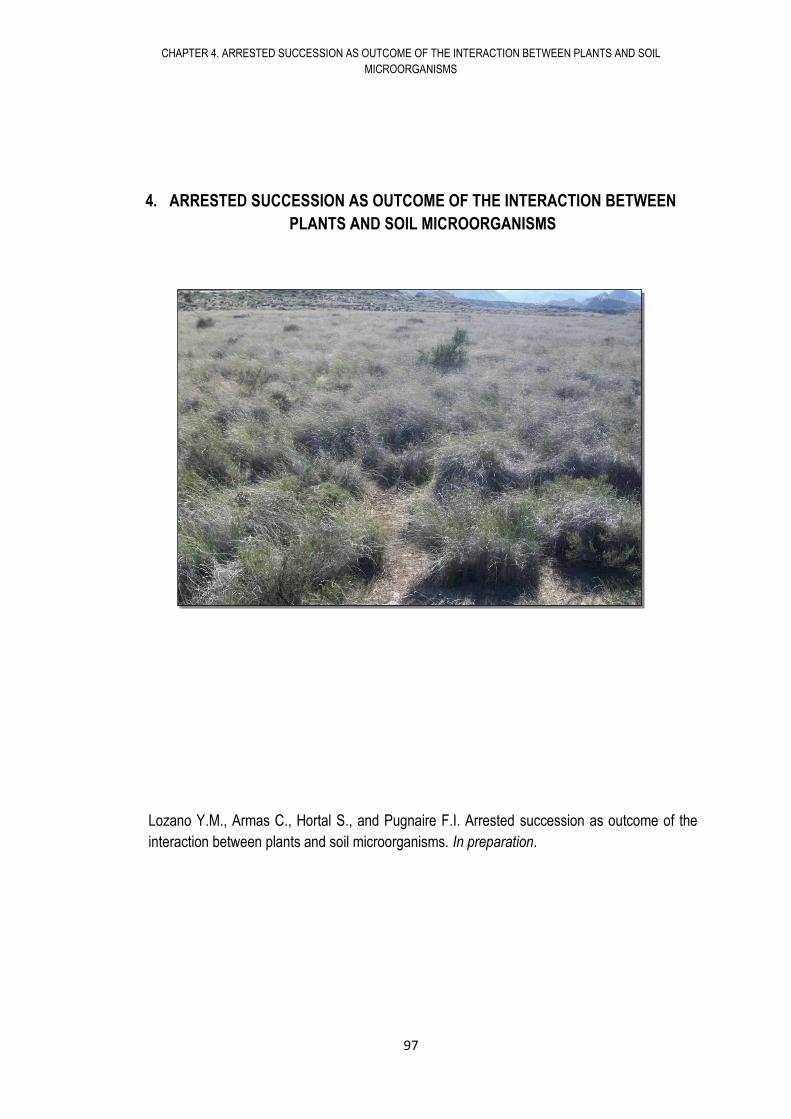
CHAPTER 4. ARRESTED SUCCESSION AS OUTCOME OF THE INTERACTION BETWEEN PLANTS AND SOIL
MICROORGANISMS
97
4. ARRESTED SUCCESSION AS OUTCOME OF THE INTERACTION BETWEEN
PLANTS AND SOIL MICROORGANISMS
Lozano Y.M., Armas C., Hortal S., and Pugnaire F.I. Arrested succession as outcome of the
interaction between plants and soil microorganisms. In preparation.

98
CHAPTER 4. ARRESTED SUCCESSION AS OUTCOME OF THE INTERACTION BETWEEN PLANTS AND SOIL
MICROORGANISMS
99
4.1. ABSTRACT
Causes of arrested succession, i.e., when few species dominate the community in such a way that
succession seems stopped or delayed beyond reasonable time periods, are still unclear although a
role for soil microbial communities is suspected in this phenomenon. The tussock grass Lygeum
spartum frequently dominates extensive areas of abandoned fields in what seems arrested
succession in an arid environment. We evaluated whether the competitive ability of this species is
linked to its associated soil microbial community and soil properties or whether it is a consequence
of the plant´s life strategy. We grew plants of this species along with individuals of Salsola
oppositifolia, a shrub dominant in late successional stages, to release intra- and inter-specific
interactions on sterile soil inoculated with either alive or sterile soil extracts collected under each of
the two species. We established three parallel experiments according to different life history stages
using seeds, saplings, and young adult individuals. At harvest, soil nutrient content and shoot
mass were determined and microbial communities were characterized by pyrosequencing of the
16S rDNA. We found that both soil microbial communities and soil properties associated to
Lygeum did not prevent but rather facilitated Salsola establishment. The competitive ability of
Lygeum was linked to a positive effect of its own soil extracts on saplings and adult individuals and
to a high and quick germination rate of Lygeum seeds in contrast to the slow pace and low
germination rate of Salsola seeds. In conclusion, soil properties and soil microbial communities
associated to Lygeum have an important influence on seed germination and initial growth of
Lygeum individuals. Added to its clonal growth strategy, positive feedbacks with soil
microroganisms allow for a quick dominance of this species and apparent arrested succession.
CHAPTER 4. ARRESTED SUCCESSION AS OUTCOME OF THE INTERACTION BETWEEN PLANTS AND SOIL
MICROORGANISMS
100
4.2. INTRODUCTION
Plant secondary succession takes place after disturbance, from tropical to temperate, and from
savanna to artic or desert ecosystems (De Mera and Orellana 2007). Although for years it was
thought that succession did not occur in arid environments due to extreme climatic conditions
(Muller 1940, Rowlands 1980), several reports have shown that plant succession does also occur
in such environments (Bonet 2004, Scott and Morgan 2012, Chapter III of this thesis). Arrested or
truncated succession, which occurs when some species dominate the community in such a way
that succession seems stopped or delayed beyond reasonable time periods (Young and Peffer
2010) has been described in tropical (Griscom and Ashton 2003, Boyes et al. 2011), temperate
(Hill and Silander 2001, Mallik 2003), Mediterranean (Acácio et al. 2007), and arid (Walker et al.
2007) ecosystems.
Although the causes of strong dominance of a species could be manifold, species that lead to
arrested succession show in most cases rapid vegetative spread (Royo and Carson 2006) and
long lifespan (Young and Peffer 2010) that help them to become dominant in the plant community
for long periods of time. Their dominance could also be enhanced as other species undergo
dispersal limitation (Jordano and Godoy 2002) or seedling mortality due to herbivory (Boyes et al.
2011). Soil microorganisms could also play a role in this process as they can promote or hinder
seed germination and plant performance (chapter II). While negative feedback associations,
influenced by the accumulation of soil pathogens, enhance succession (Van Der Putten et al.
1993) avoiding the extreme dominance of a few species, soil microorganisms could establish
positive feedback associations with plants contributing to their persistence over time (Bever 2003)
as with late successional species (Kardol et al. 2006). These and other factors facilitate the
extreme dominance of a single species and may cause arrested succession.
Different plant species are known to cause arrested succession in different ecosystems. For
example, ferns as Dennstaedtia punctilobula in temperate environments (Hill and Silander 2001),
bamboo species such as Guadua sarcocarpa in tropical systems (Griscom and Ashton 2003),
Cistus species in Mediterranean environments (Miranda et al. 2004) and many other herbaceous
and shrub species like Acanthus pubescens or Isoglossa woodii (Chapman et al. 1999, Griffiths et
al. 2007). In addition, species that exhibit clonal growth are often involved in arrested succession
(Royo and Carson 2006) as they form structures such as creeping stems, root suckers or rhizomes
(Stuefer et al. 2001). Such clonal growth promote high stem and foliage densities that reduce light
CHAPTER 4. ARRESTED SUCCESSION AS OUTCOME OF THE INTERACTION BETWEEN PLANTS AND SOIL
MICROORGANISMS
101
(Pugnaire and Haase 1996, Griffiths et al. 2007) which, added to their ability to invade space and
form dense thickets, prevent the establishment of other species.
Plant secondary succession in extreme conditions such as arid environments (Bonnet 2004, Scott
and Morgan 2012, Chapter III) is characterized by a change in species dominance. For example, in
arid SE Spain Thymelaea hirsuta (L.) dominates early successional stages, Artemisia barrelieri
(Besser), Salsola oppositifolia (Desf.) and Hammada articulata (Moq.) O. Bolòs & Vigo in
intermediate stages and Stipa tenacissima (L.) in late stages (Chapter III). However, there are also
abandoned fields that do not undergo secondary succession and are dominated by a single plant
species for long time periods. Although many factors could influence this phenomenon, we know
that high soil salinity (Hasegawa et al., 2000), low nutrient content (Roem et al. 2002), soil
microorganisms (Van der Putten 2013, Chapter II) as well as different competition strategies
(Tilman 1982, Went 1973) prevent survival of some species while favor other species leading to
arrested succession.
The perennial tussock grass, Lygeum spartum (L.) Kunth (Lygeum hereafter), is a species typically
abundant in areas of high soil salinity in SE Spain where frequently dominates extensive areas of
abandoned fields for long periods of time, decreasing plant diversity. This species is well adapted
to high soil salinity, high irradiance and temperatures, as well as to low water holding capacity and
organic matter content (Pérez Pujalte et al. 1987, Lázaro et al. 2001). Under similar microclimatic
conditions, the halophytic species Salsola oppositifolia (Salsola hereafter), a shrub dominant in late
successional stages (chapter III), can be found at some points growing along Lygeum individuals
(Peinado et al., 1992). Here, we evaluated whether the competitive ability of the dominant tussock
grass species, Lygeum spartum, in interaction with Salsola oppositifolia depends on soil
properties, on its associated soil microbial community, or is rather just a consequence of its
functional strategy.
4.3. OBJECTIVES
By growing Lygeum and Salsola from seeds and using saplings and young adults in either intra- or
inter-specific interaction we tested whether 1) the soil microbial community associated to Lygeum
positively affected seed germination and plant growth; 2) the soil microbial community associated
to Lygeum had a negative effect on Salsola germination and shoot mass; 3) factors such as soil
CHAPTER 4. ARRESTED SUCCESSION AS OUTCOME OF THE INTERACTION BETWEEN PLANTS AND SOIL
MICROORGANISMS
102
nutrients, salinity or texture promoted Lygeum establishment but prevented Salsola establishment;
and finally, 4) to what extent Lygeum life history strategies determined its competitive success.
4.4. HYPOTHESES
We hypothesized that soil properties and soil microorganisms naturally associated to Lygeum
would positively affect germination rate, establishment and growth of this species, and that they
would negatively affect individuals of other plant species such as Salsola. We also expected that
rapid seed germination mediated by soil microorganisms and clonal growth would explain the
extreme dominance of Lygeum in large patches of these arid environments. Ultimately, we
expected that both soil microorganisms and plant strategies would explain arrested succession in
this environment.
4.5. METHODS
4.5.1. Field site and species
We selected two native perennial species occurring in semiarid environments in south-east Spain.
Lygeum spartum (L.) Kunth is a rhizomatous tussock grass (Nedjimi 2013) well adapted to extreme
conditions of aridity, salinity, and high temperatures which is widespread over uncultivated land
and abandoned fields in these arid ecosystems (Pugnaire and Haase 1996, Nedjimi 2013). Salsola
oppositifolia (Desf.) is a succulent evergreen Chenopodiaceae shrub typical of the same extreme
conditions as Lygeum, which successfully colonizes disturbed areas (Peinado et al. 1992,
Pugnaire et al. 2004) and dominate advanced stages of succession (See chapter III). Seeds,
saplings, and young adult (hereafter adults) individuals of these species used in these experiments
were provided by Viveros Muzalé (Murcia, Spain).
4.5.2. Soil sampling and inoculum preparation
In March 2013 we collected soil from Llanos de Rueda (37.05º N, 2.22º W, 503 m altitude) in the
Tabernas Basin, Almería, Spain from the top 10 cm under the canopy of 30 randomly selected
Lygeum tussocks and 30 Salsola shrubs in a ~3 ha homogeneous plot. Soil samples collected
under the same plant species were combined, homogenised and sieved through 5-mm mesh to
give a 170 kg composite soil sample per soil origin (i.e. collected under Lygeum or under Salsola
CHAPTER 4. ARRESTED SUCCESSION AS OUTCOME OF THE INTERACTION BETWEEN PLANTS AND SOIL
MICROORGANISMS
103
canopies). Pooling soil samples within soil type reduces variability but allows testing for differences
between soil types, and could be considered as technical replicates (Kardol et al. 2006, Ayres et
al. 2009, Meisner et al. 2013, Rodríguez-Echeverría et al. 2013). 136 out of these 170 Kg were
autoclaved during 20 min at 120 ºC to kill all soil biota and then used as microcosms substrate.
Following standard procedures (Kardol et al. 2007, Meisner et al. 2013, Pendergast et al. 2013,
Gundale et al. 2014), we took apart the other 34 kg from each soil origin to prepare 2 types of
inoculum; 17 kg were left intact to prepare the “alive” soil inoculum and the remaining 17 kg were
autoclaved at 120 ºC during 20 min to prepare the sterile soil inoculum. Each soil subsample was
stirred in distilled, autoclaved water in a proportion 1:2 (v:v) and then filtered through a 0.5 mm
sieve to remove soil particles but allowing the passing of fungal spores, hyphae, soil bacteria and
microfauna (Van de Voorde et al. 2012). These two types of inocula (sterile and alive) per soil
origin (under Lygeum or Salsola canopies) were used to inoculate soil microcosms. Soil samples
were stored at 4 ºC for a maximum of 1 month for physical and chemical analyses (Cernohlavkova
et al. 2009) and at -80 ºC for soil microbial molecular analyses.
4.5.3. Experimental design
Growth chamber experiments: seeds and saplings
In March 2013, we established two similar experiments in a controlled growth chamber, one with
seeds and another with ca. 3-month old saplings (Fig. 4.1). For both experiments, we filled half the
microcosms (17 cm in diameter, 18 cm tall pots, 1 L in volume) with soil from each of the two
autoclaved soil origins (under Lygeum or Salsola) mixed with perlite in a proportion 1:1 (v:v) to
avoid soil compaction. We then supplied half the microcosms of each soil type with one of the two
inocula (alive or sterile). The volume of soil inoculum added to each microcosm was adjusted to
20% (v:v), i.e., 200 ml per microcosm. The design included two levels of plant-plant interaction per
species, intra- and inter-specific (i.e., Salsola+Salsola, Lygeum+Lygeum and Lygeum+Salsola)
totalling 96 microcosms (3 plant interaction levels x 2 soil origin x 2 inocula x 8 replicates) per
experiment.
For the seed experiment, we randomly sowed 11 seeds of each species in the inter-specific
interaction treatment and 22 seeds of the same species in the intra-specific interaction treatment to
keep constant the number of seeds per microcosm. Seeds were previously surface-sterilized with
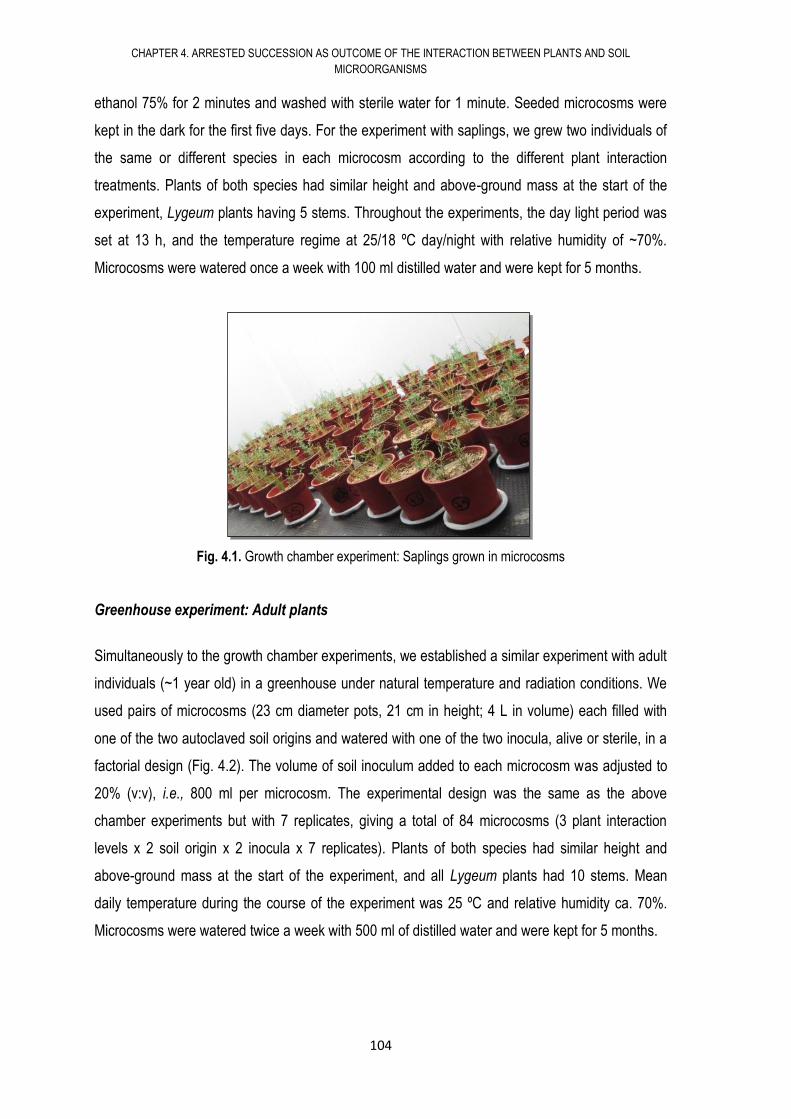
CHAPTER 4. ARRESTED SUCCESSION AS OUTCOME OF THE INTERACTION BETWEEN PLANTS AND SOIL
MICROORGANISMS
104
ethanol 75% for 2 minutes and washed with sterile water for 1 minute. Seeded microcosms were
kept in the dark for the first five days. For the experiment with saplings, we grew two individuals of
the same or different species in each microcosm according to the different plant interaction
treatments. Plants of both species had similar height and above-ground mass at the start of the
experiment, Lygeum plants having 5 stems. Throughout the experiments, the day light period was
set at 13 h, and the temperature regime at 25/18 ºC day/night with relative humidity of ~70%.
Microcosms were watered once a week with 100 ml distilled water and were kept for 5 months.
Fig. 4.1. Growth chamber experiment: Saplings grown in microcosms
Greenhouse experiment: Adult plants
Simultaneously to the growth chamber experiments, we established a similar experiment with adult
individuals (~1 year old) in a greenhouse under natural temperature and radiation conditions. We
used pairs of microcosms (23 cm diameter pots, 21 cm in height; 4 L in volume) each filled with
one of the two autoclaved soil origins and watered with one of the two inocula, alive or sterile, in a
factorial design (Fig. 4.2). The volume of soil inoculum added to each microcosm was adjusted to
20% (v:v), i.e., 800 ml per microcosm. The experimental design was the same as the above
chamber experiments but with 7 replicates, giving a total of 84 microcosms (3 plant interaction
levels x 2 soil origin x 2 inocula x 7 replicates). Plants of both species had similar height and
above-ground mass at the start of the experiment, and all Lygeum plants had 10 stems. Mean
daily temperature during the course of the experiment was 25 ºC and relative humidity ca. 70%.
Microcosms were watered twice a week with 500 ml of distilled water and were kept for 5 months.
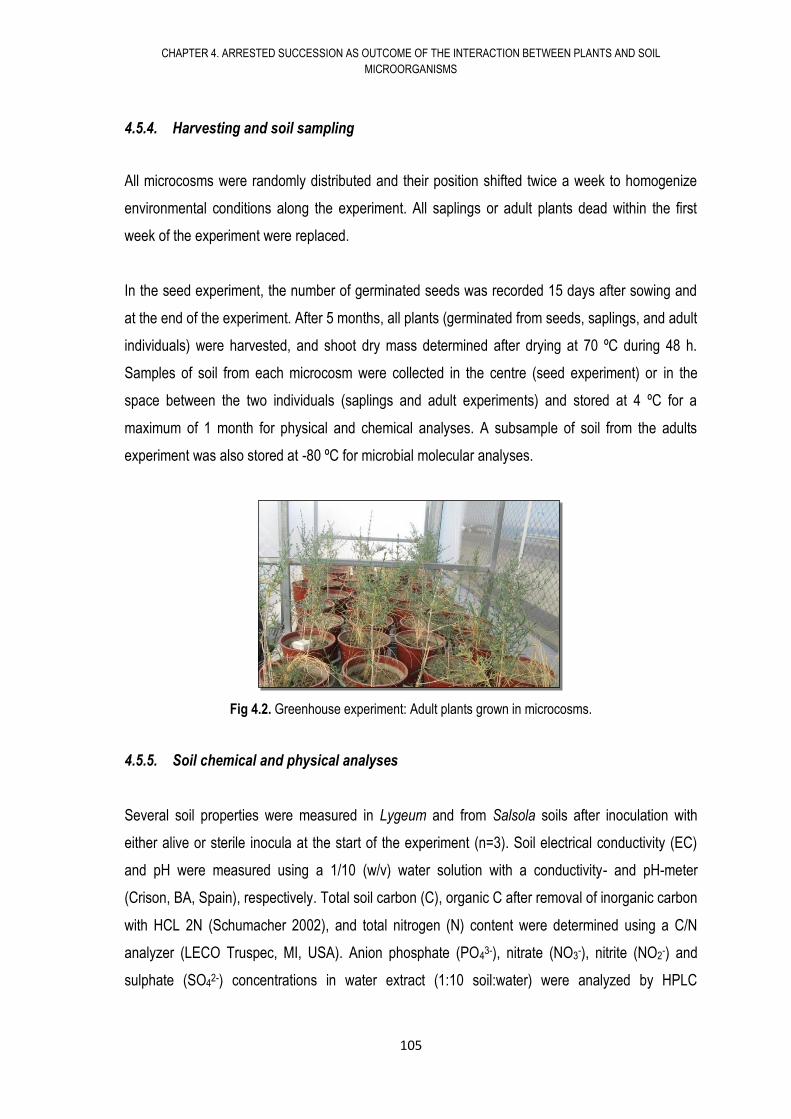
CHAPTER 4. ARRESTED SUCCESSION AS OUTCOME OF THE INTERACTION BETWEEN PLANTS AND SOIL
MICROORGANISMS
105
4.5.4. Harvesting and soil sampling
All microcosms were randomly distributed and their position shifted twice a week to homogenize
environmental conditions along the experiment. All saplings or adult plants dead within the first
week of the experiment were replaced.
In the seed experiment, the number of germinated seeds was recorded 15 days after sowing and
at the end of the experiment. After 5 months, all plants (germinated from seeds, saplings, and adult
individuals) were harvested, and shoot dry mass determined after drying at 70 ºC during 48 h.
Samples of soil from each microcosm were collected in the centre (seed experiment) or in the
space between the two individuals (saplings and adult experiments) and stored at 4 ºC for a
maximum of 1 month for physical and chemical analyses. A subsample of soil from the adults
experiment was also stored at -80 ºC for microbial molecular analyses.
Fig 4.2. Greenhouse experiment: Adult plants grown in microcosms.
4.5.5. Soil chemical and physical analyses
Several soil properties were measured in Lygeum and from Salsola soils after inoculation with
either alive or sterile inocula at the start of the experiment (n=3). Soil electrical conductivity (EC)
and pH were measured using a 1/10 (w/v) water solution with a conductivity- and pH-meter
(Crison, BA, Spain), respectively. Total soil carbon (C), organic C after removal of inorganic carbon
with HCL 2N (Schumacher 2002), and total nitrogen (N) content were determined using a C/N
analyzer (LECO Truspec, MI, USA). Anion phosphate (PO43-), nitrate (NO3
-), nitrite (NO2-) and
sulphate (SO42-) concentrations in water extract (1:10 soil:water) were analyzed by HPLC
CHAPTER 4. ARRESTED SUCCESSION AS OUTCOME OF THE INTERACTION BETWEEN PLANTS AND SOIL
MICROORGANISMS
106
(Metrohm, HE, Switzerland). Percent of clay, sand and silt were measured by the Robinson
method (Porta-Casanellas et al. 1985).
4.5.6. Soil bacterial community composition
Molecular analyses were performed on soil samples collected in the field under Lygeum or Salsola
individuals that were sterilized and then watered with their respective alive inoculum at the start of
the experiment (2 soil origin x 1 inoculum x 3 replicates) as well as on soil samples collected in the
microcosms 5 months after the inoculation and set up of the experiment (3 plant interaction levels
x 2 soil origin x 2 inocula x 3 replicates). DNA was extracted from 0.25 g of homogenized soil from
each of the 42 soil samples using the PowerSoil® DNA Isolation Kit (MO BIO Laboratories, Inc.,
Carlsbad, USA) following the manufacturer’s instructions. The V3-V6 regions of the bacterial 16S
rDNA gene were amplified using primers 357F with Roche adaptor B
(5`CTATCCCCTGTGTGCCTTGGCAGTCTCAGCCTACGGGAGGCAGCAG 3`) and 926 Rb (5`
CCATCTCATCCCTGCGTGTCTCCGACTCAGNNNNNNNNNNNNCCGTCAATTYMTTTRAGT 3`)
that included Roche adaptor A and 12 base-pair barcode (Sim et al. 2012). Each sample was
amplified in quadruplicate to reduce random mispriming bias (Polz and Cavanaugh 1998).
Amplicons were combined in a single tube in equimolar concentrations and the pooled amplicon
mixture was purified twice (AMPure XP kit, Agencourt, Takeley, United Kingdom). DNA
concentration was quantified using the PicoGreen® assay (Sim et al. 2012). This pool was
prepared and pyrosequenced in a Roche Genome Sequencer FLX System (Roche, Basel,
Switzerland) using 454 Titanium chemistry at Lifesequencing lab (Valencia, Spain).
Sequences were trimmed for primers, quality filtered and demultiplexed using the pyrosequencing
pipeline tools from the Ribosomal Database Project (RDP, Michigan State Univ., USA). Sequences
shorter than 150 bp, with quality scores <20 or containing any unresolved nucleotides were
removed from the dataset. We used Acacia software version 1.52 (Bragg et al., 2012) (Bragg et al.
2012)(Bragg et al. 2012)(Bragg et al. 2012)for pyrosequencing noise removal using default
parameters for error correction. We established a minimum average quality threshold of 30 and all
sequences were trimmed to a maximum length of 570 bp. Chimeras were identified using Uchime
tool (Edgar et al., 2011) from RDP pipeline and removed from the dataset. Retained sequences
were aligned using the Aligner tool from the RDP pipeline and then were clustered into operational
taxonomic units (OTUs) defined at 97% similarity cutoff using the complete linkage clustering tool
of the RDP pipeline. Taxonomic assignation of sequences was performed using the RDP naïve
CHAPTER 4. ARRESTED SUCCESSION AS OUTCOME OF THE INTERACTION BETWEEN PLANTS AND SOIL
MICROORGANISMS
107
Bayesian classifier (Wang et al., 2007) at a confidence level of 80 %, and relative abundances of
the different phyla, classes, subclasses, orders and main genera per each of the 42 samples were
calculated.
4.5.7. Statistical analyses
For each of the experiments (with seeds, saplings and adult individuals), differences among
treatments were analyzed using interaction (intra- and inter-specific), soil origin (from Lygeum and
Salsola) and inoculum (alive and sterile) as fixed effects. At the end of the seed experiment, shoot
mass was analyzed with General Linear Models using the ratio of germination (i.e., number of
seedlings at the end of experiment / number of sowed seeds) as covariate. For the experiments
with saplings and adult plants, we accounted for the spatial correlation between the two individuals
in the same microcosm and corrected the model using a compound symmetry correlation structure
(corCompSymm). Violations of normality and homoscedasticity were checked for the three
experiments. Heterocedasticity was corrected according to variance distribution using VarIdent for
saplings and VarExp for adult plants. VarIdent represents a variance structure with different
variances for different strata (Gałecki and Burzykowski 2013) while VarExp represents exponential
variation of the residual variance (Pinheiro and Bates 2000). To select the most parsimonious
model with the lowest AIC, we compared the models through likelihood ratio and graphical
inspection of their residues distribution. The model fit was calculated using the restricted maximum
likelihood (REML) criterion.
The number of germinated seeds and the total number of seedlings that survived till the end of the
seed germination experiment were analyzed using Generalized Linear Model (GLM) with a
binomial distribution with a logistic link function and the maximum likelihood criterion. Total number
of seeds sown (22) and number of Lygeum seeds sown (11) were used as trials for germination
and seedling survival analyses, respectively. The same GLM was used to check for differences in
the relative abundance of microbial groups using 100 as trial. Significance was established at
p<0.05. Post-hoc comparisons were performed using DGC (Di Rienzo et al. 2002) or Fisher test.
All data were analyzed for each plant species separately with InfoStat Statistical Software (Di
Rienzo et al. 2013). Results shown throughout the text and figures are mean values ± 1 SE.
Similarity on bacterial community composition among samples (with OTUs showing at least 5
reads in the overall dataset) was analyzed with principal coordinates analysis (PCoA) using Bray-
CHAPTER 4. ARRESTED SUCCESSION AS OUTCOME OF THE INTERACTION BETWEEN PLANTS AND SOIL
MICROORGANISMS
108
Curtis similarity index, and differences among treatments were evaluated performing NPMANOVA
with 9999 permutations using Past v 2.12 software (Hammer et al. 2001). Shannon’s diversity
index of OTUs per sample was calculated with Past software after excluding singletons (OTUs only
showing 1 read in the overall dataset) to reduce the overestimation of diversity (Tedersoo et al.
2010). We also performed a principal component analysis (PCA) and Pearson correlation
coefficient matrix analysis of soil properties and microbial composition.
4.6. RESULTS
4.6.1. Seed germination
Salsola seed germination either under intra- or inter-specific interaction was minimum. We
recorded less than 0.02 ± 0.2 and 0.08 ± 0.6 germinated seeds per pot, equivalent to 99-97% of
pots without any germinated seed (intra- and inter-specific, respectively). We thus did not consider
Salsola for further analyses on seed germination but took into account the presence of Salsola
seeds in microcosms to analyse germination rates of Lygeum seeds.
Fifteen days after sowing, Lygeum seed germination was highest in soils from Lygeum when only
seeds of Lygeum were present (intra-specific sowing) and in sterile Salsola soils under inter-
specific interaction. In contrast, the lowest Lygeum seed germination was found in alive Salsola
soils under inter-specific interaction (Fig. 4.3a). Five months after sowing, the highest number of
Lygeum individuals was again found on sterile Salsola soil under the inter-specific treatment while
no differences were found in other treatments (Fig 4.3b). Under inter-specific interaction, Lygeum
shoot mass was higher on Lygeum soil with alive inoculum than in other soils and inocula
combinations. However, under intra-specific interaction, Lygeum shoot mass was higher on sterile
than on alive Lygeum soil or any Salsola soil inocula (Fig 4.3c, Table S4.1).
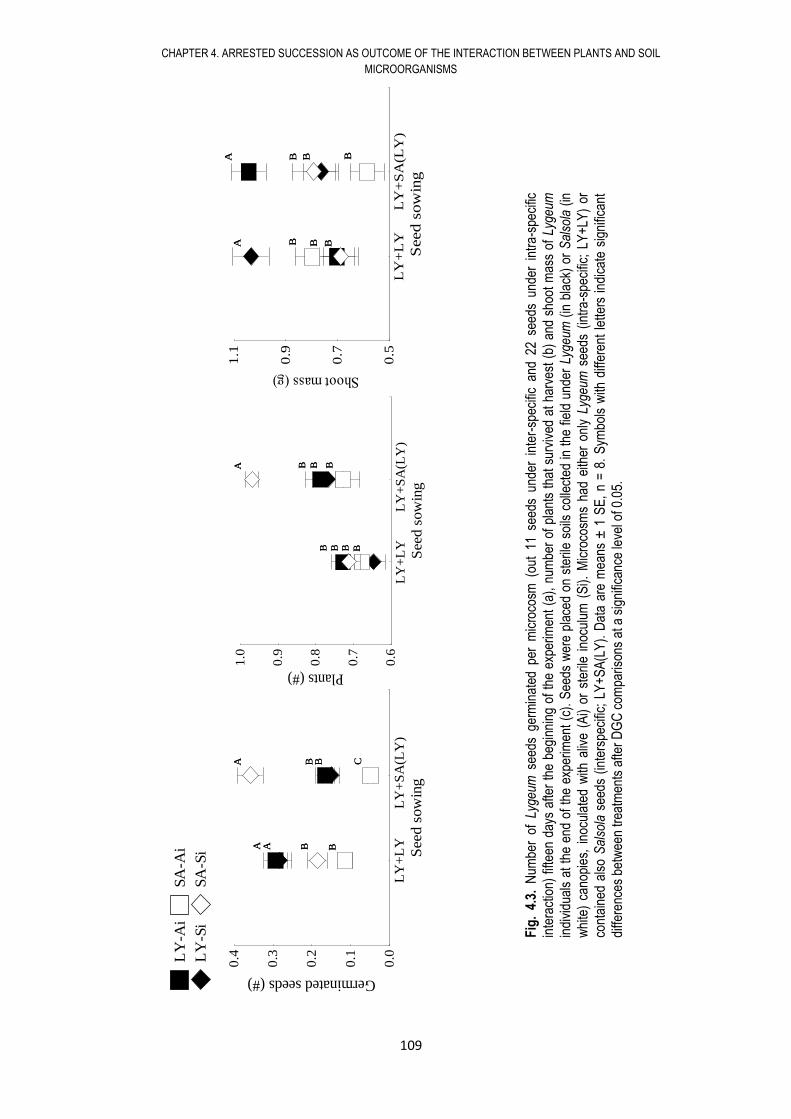
CHAPTER 4. ARRESTED SUCCESSION AS OUTCOME OF THE INTERACTION BETWEEN PLANTS AND SOIL
MICROORGANISMS
109
LY
-Ai
SA
-Ai
LY
-Si
SA
-Si
LY
+L
YL
Y+
SA
(LY
)
Com
pet
itio
n
0.3
0.6
0.9
1.2
Shoot biomass (g)
A
B
B
B
B
B
C
C
A
B
B
B
B
B
C
C
Título
LY
-Ai
SA
-Ai
LY
-Si
SA
-Si
LY
+L
YL
Y+
SA
(LY
)
Seed
sow
ing
0.0
0.1
0.2
0.3
0.4
Germinated seeds (#)
A
B
A
B
B
CA
BA
B
A
B
B
CA
B
aa
a
LY
+L
YL
Y+
SA
(LY
)
Seed
sow
ing
0.6
0.7
0.8
0.9
1.0
Plants (#)
B
BB
B
B
B
A
B
B
BB
B
B
B
A
B
Pla
nts
(#
)
LY
+L
YL
Y+
SA
(LY
)
Seed
sow
ing
0.5
0.7
0.9
1.1
Shoot biomass (g)
A
BA
B
B
BB
B
A
BA
B
B
BB
B
Título
Shootmass(g)
Fig
. 4.
3. N
umbe
r of
Lyg
eum
see
ds g
erm
inat
ed p
er m
icro
cosm
(ou
t 11
see
ds u
nder
int
er-s
peci
fic a
nd 2
2 se
eds
unde
r in
tra
-spe
cific
inte
ract
ion)
fift
een
days
afte
r th
e be
ginn
ing
of t
he e
xper
imen
t (a
), n
umbe
r of
pla
nts
that
sur
vive
d at
har
vest
(b)
and
sho
ot m
ass
of L
ygeu
m
indi
vidu
als
at t
he e
nd o
f th
e ex
perim
ent
(c).
See
ds w
ere
plac
ed o
n st
erile
soi
ls c
olle
cted
in t
he f
ield
und
er L
ygeu
m (
in b
lack
) or
Sal
sola
(in
whi
te)
cano
pies
, in
ocul
ated
with
aliv
e (A
i) or
ste
rile
inoc
ulum
(S
i). M
icro
cosm
s ha
d ei
ther
onl
y Ly
geum
see
ds (
intr
a-sp
ecifi
c; L
Y+
LY)
or
cont
aine
d al
so S
also
la s
eeds
(in
ters
peci
fic;
LY+
SA
(LY
). D
ata
are
mea
ns ±
1 S
E,
n =
8.
Sym
bols
with
diff
eren
t le
tters
ind
icat
e si
gnifi
cant
diffe
renc
es b
etw
een
trea
tmen
ts a
fter
DG
C c
ompa
rison
s at
a s
igni
fican
ce le
vel o
f 0.0
5.
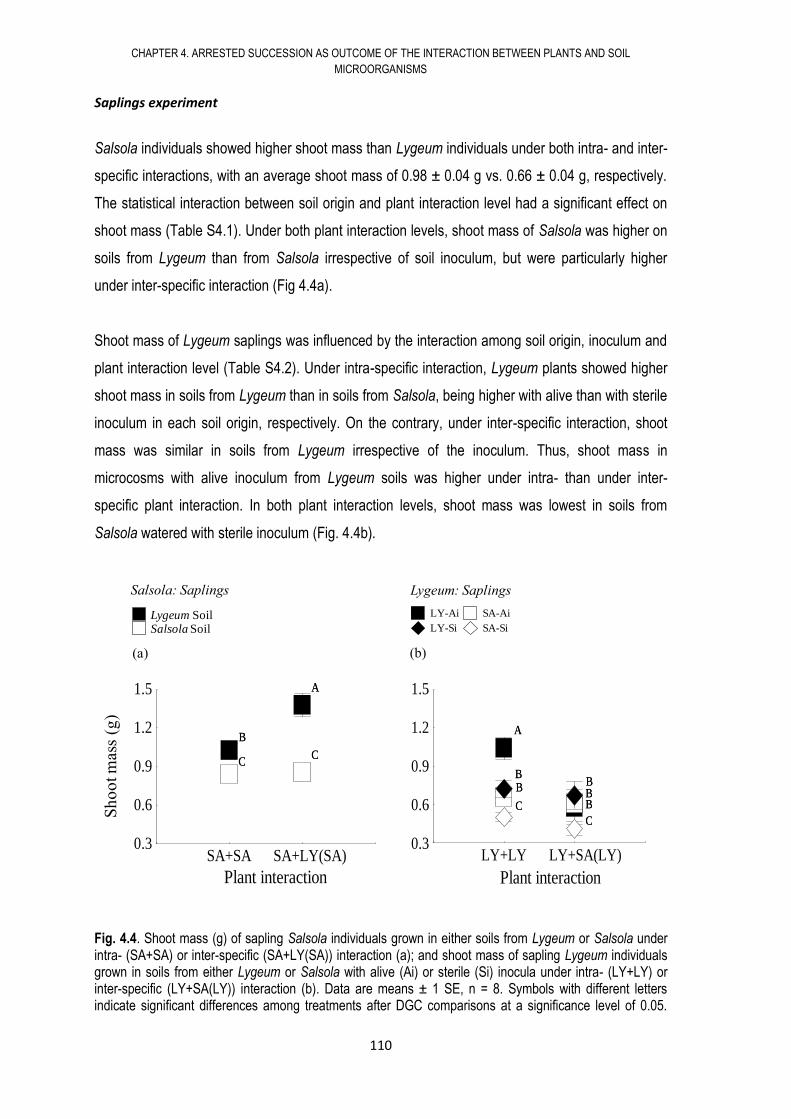
CHAPTER 4. ARRESTED SUCCESSION AS OUTCOME OF THE INTERACTION BETWEEN PLANTS AND SOIL
MICROORGANISMS
110
Saplings experiment
Salsola individuals showed higher shoot mass than Lygeum individuals under both intra- and inter-
specific interactions, with an average shoot mass of 0.98 ± 0.04 g vs. 0.66 ± 0.04 g, respectively.
The statistical interaction between soil origin and plant interaction level had a significant effect on
shoot mass (Table S4.1). Under both plant interaction levels, shoot mass of Salsola was higher on
soils from Lygeum than from Salsola irrespective of soil inoculum, but were particularly higher
under inter-specific interaction (Fig 4.4a).
Shoot mass of Lygeum saplings was influenced by the interaction among soil origin, inoculum and
plant interaction level (Table S4.2). Under intra-specific interaction, Lygeum plants showed higher
shoot mass in soils from Lygeum than in soils from Salsola, being higher with alive than with sterile
inoculum in each soil origin, respectively. On the contrary, under inter-specific interaction, shoot
mass was similar in soils from Lygeum irrespective of the inoculum. Thus, shoot mass in
microcosms with alive inoculum from Lygeum soils was higher under intra- than under inter-
specific plant interaction. In both plant interaction levels, shoot mass was lowest in soils from
Salsola watered with sterile inoculum (Fig. 4.4b).
Fig. 4.4. Shoot mass (g) of sapling Salsola individuals grown in either soils from Lygeum or Salsola under intra- (SA+SA) or inter-specific (SA+LY(SA)) interaction (a); and shoot mass of sapling Lygeum individuals grown in soils from either Lygeum or Salsola with alive (Ai) or sterile (Si) inocula under intra- (LY+LY) or inter-specific (LY+SA(LY)) interaction (b). Data are means ± 1 SE, n = 8. Symbols with different letters indicate significant differences among treatments after DGC comparisons at a significance level of 0.05.
LY-Ai SA-Ai
LY-Si SA-Si
LY+LY LY+SA(LY)
Competition
0.3
0.6
0.9
1.2
Sh
oo
t b
iom
ass
(g)
A
B
B
B
B
B
C
C
A
B
B
B
B
B
C
C
Título
LY-Ai SA-Ai
LY-Si SA-Si
Lygeum: Saplings
(b)
Salsola: Saplings
(a)
Lygeum SoilLygeum Soil
Salsola Soil
Intra Inter
Competition
0.8
1.0
1.2
1.4
1.6
Shoot
bio
mass (
g)
A
B
CC
A
B
CC
Lygeum Soil
Salsola SoilSalsola Soil
SA+SA SA+LY(SA)
Plant interaction
0.3
0.6
0.9
1.2
1.5
Shoot
bio
mass (
g)
A
B
CC
A
B
CC
Título
LY+LY LY+SA(LY)
Plant interaction
0.3
0.6
0.9
1.2
1.5
Sh
oo
t b
iom
ass (
g)
A
B
BB
BB
C
C
A
B
BB
BB
C
C
Título
Salsola: Young plants
Lygeum Soil
Salsola Soil
Intra Inter
Competition
0.8
1.0
1.2
1.4
1.6
Shoot
bio
mass (
g)
A
B
CC
A
B
CC
Lygeum Soil
Salsola Soil
LY-Ai SA-Ai
LY-Si SA-Si
LY+LY LY+SA(LY)
Competition
0.3
0.6
0.9
1.2
Shoot
bio
mass (
g)
A
B
B
B
B
B
C
C
A
B
B
B
B
B
C
C
Título
LY-Ai SA-Ai
LY-Si SA-Si
Lygeum: Young plants
(a) (b)
Salsola: Saplings Lygeum: Saplings
Sh
oo
tm
ass
(g)
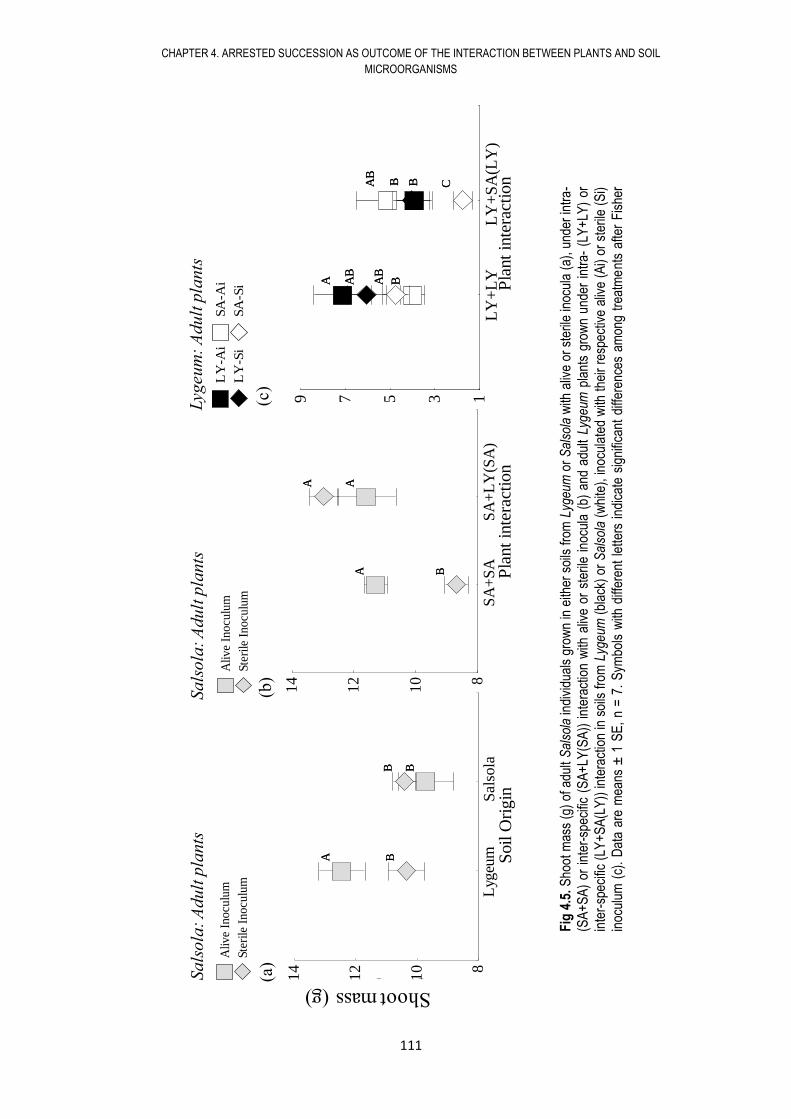
CHAPTER 4. ARRESTED SUCCESSION AS OUTCOME OF THE INTERACTION BETWEEN PLANTS AND SOIL
MICROORGANISMS
111
Sals
ola
: A
dult
pla
nts
Sals
ola
: A
dult
pla
nts
(a)
(b)
Ali
ve I
no
cu
lum
Ste
rile
In
ocu
lum
Lyg
eum
S
also
la
Soil O
rigin
8
10
12
14
Shoot biomass (g)
A
BBBA
BBB
Ali
ve I
no
cu
lum
Ste
rile
In
ocu
lum
Ali
ve
So
il
Ste
rile
So
il
SA
+S
AS
A+
LY
(SA
)
Com
pet
itio
n
8
10
12
14
Shoot biomass (g)
AA
A
B
AA
A
B
Ali
ve
So
il
Ste
rile
So
il
Ali
ve
Ino
culu
m
Ste
rile
In
ocu
lum
Lyg
eum
S
also
la
Soi
l O
rigin
8
10
12
14
Shoot biomass (g)
A
BBBA
BBB
Ali
ve
Ino
culu
m
Ste
rile
In
ocu
lum
LY
-LS
SA
-LS
LY
-SS
SA
-SS
LY
+L
YL
Y+
SA
(LY
)
Com
pet
itio
n
13579
Shoot biomass (g)
A
BAB
BAB
B
AB
C
A
BAB
BAB
B
AB
C
Título
LY
-LS
SA
-LS
LY
-SS
SA
-SS
LY
-Ai
SA
-Ai
LY
-Si
SA
-Si
LY
+L
YL
Y+
SA
(LY
)
Com
pet
itio
n
0.3
0.6
0.9
1.2
Shoot biomass (g)
A
B
B
B
B
B
C
C
A
B
B
B
B
B
C
C
Título
LY
-Ai
SA
-Ai
LY
-Si
SA
-Si
Lyg
eu
m:
Ad
ult
pla
nts
(c)
SA
+S
AS
A+
LY
(SA
)
Pla
nt
inte
ract
ion
0.3
0.6
0.9
1.2
1.5
Shoot biomass (g)
A
B
CC
A
B
CC
Título
SA
+S
AS
A+
LY
(SA
)
Pla
nt
inte
ract
ion
0.3
0.6
0.9
1.2
1.5
Shoot biomass (g)
A
B
CC
A
B
CC
Título
Ali
ve
Ino
culu
m
Ste
rile
In
ocu
lum
Lyg
eum
S
also
la
Soi
l O
rigin
8
10
12
14
Shoot biomass (g)
A
BBBA
BBB
Ali
ve
Ino
culu
m
Ste
rile
In
ocu
lum S
A+
SA
SA
+L
Y(S
A)
Pla
nt
inte
ract
ion
0.3
0.6
0.9
1.2
1.5
Shoot biomass (g)
A
B
CC
A
B
CC
Título
Shootmass(g)
Fig
4.5
. S
hoot
mas
s (g
) of
adu
lt S
also
la in
divi
dual
s gr
own
in e
ither
soi
ls fr
om L
ygeu
m o
r S
also
la w
ith a
live
or s
teril
e in
ocul
a (a
), u
nder
intr
a-
(SA
+S
A)
or i
nter
-spe
cific
(S
A+
LY(S
A))
int
erac
tion
with
aliv
e or
ste
rile
inoc
ula
(b)
and
adul
t Ly
geum
pla
nts
grow
n un
der
intr
a- (
LY+
LY)
or
inte
r-sp
ecifi
c (L
Y+
SA
(LY
)) in
tera
ctio
n in
soi
ls f
rom
Lyg
eum
(bl
ack)
or
Sal
sola
(w
hite
), in
ocul
ated
with
the
ir re
spec
tive
aliv
e (A
i) or
ste
rile
(Si)
inoc
ulum
(c)
. D
ata
are
mea
ns ±
1 S
E,
n =
7.
Sym
bols
with
diff
eren
t le
tters
ind
icat
e si
gnifi
cant
diff
eren
ces
amon
g tr
eatm
ent
s af
ter
Fis
her
com
paris
ons
at a
sig
nific
ance
leve
l of 0
.05.
CHAPTER 4. ARRESTED SUCCESSION AS OUTCOME OF THE INTERACTION BETWEEN PLANTS AND SOIL
MICROORGANISMS
112
4.6.2. Adult plants
Similar to the sapling experiment, adult Salsola plants showed a higher shoot mass than Lygeum
plants in either treatment, with average shoot mass of 10.59 ± 0.42 g and 4.53 ± 0.42 g in intra-
and inter-specific interaction, respectively. Soil inoculum and soil origin along with plant interaction
level significantly affected shoot mass of Salsola individuals (Table S4.2). Regarding soil origin,
shoot mass was higher in soils from Lygeum with alive inoculum than with sterile inoculum, and in
soils from Salsola with any inocula (Fig. 4.5a). Under intra-specific interaction, shoot mass was
higher with alive than with sterile inoculum while no differences between inocula were found under
inter-specific interaction (Fig. 4.5b).
Shoot mass of adult Lygeum individuals was influenced by the interaction among soil origin, soil
inoculum and interaction treatment (Table S4.2), showing higher shoot mass under intra-specific
than under inter-specific interaction. Under intra-specific interaction there were differences
between alive soil inocula so that shoot mass was higher in alive soil inoculum from Lygeum than
from Salsola soils, with intermediate values with sterile inocula. Under inter-specific interaction,
and similar to saplings individuals, the lowest shoot mass was observed in sterile soil inoculum
from Salsola soils with no differences among the other treatments (Fig. 4.5c).
In general, soils from Lygeum with either alive or sterile inoculum positively affected growth of
saplings and adult Lygeum individuals compared to soils from Salsola, with a positive effect of
alive soil inoculum being more evident in saplings than in adult plants and under intra-specific
interaction (Fig 4.4b, 4.5c). Alive Salsola inoculum also had a positive effect on shoot mass of
saplings and adult Lygeum individuals compared to sterile Salsola inoculum, in particular under
inter-specific interaction. On the contrary, in Salsola individuals the effect was opposite; i.e., shoot
mass of Salsola plants was higher in soils from Lygeum than in soils from Salsola and, in the later,
adult Salsola plants grew more with sterile than with alive Salsola inoculum (Fig S4.1).
4.6.3. Soil properties
We recorded differences in soil chemistry and texture between soils from Lygeum and from
Salsola irrespective of whether they were inoculated with alive or sterile inoculum (Table 4.1). Soil
C, organic C, total N, EC, SO4-2, and silt content were higher in Lygeum soils than in Salsola soils,
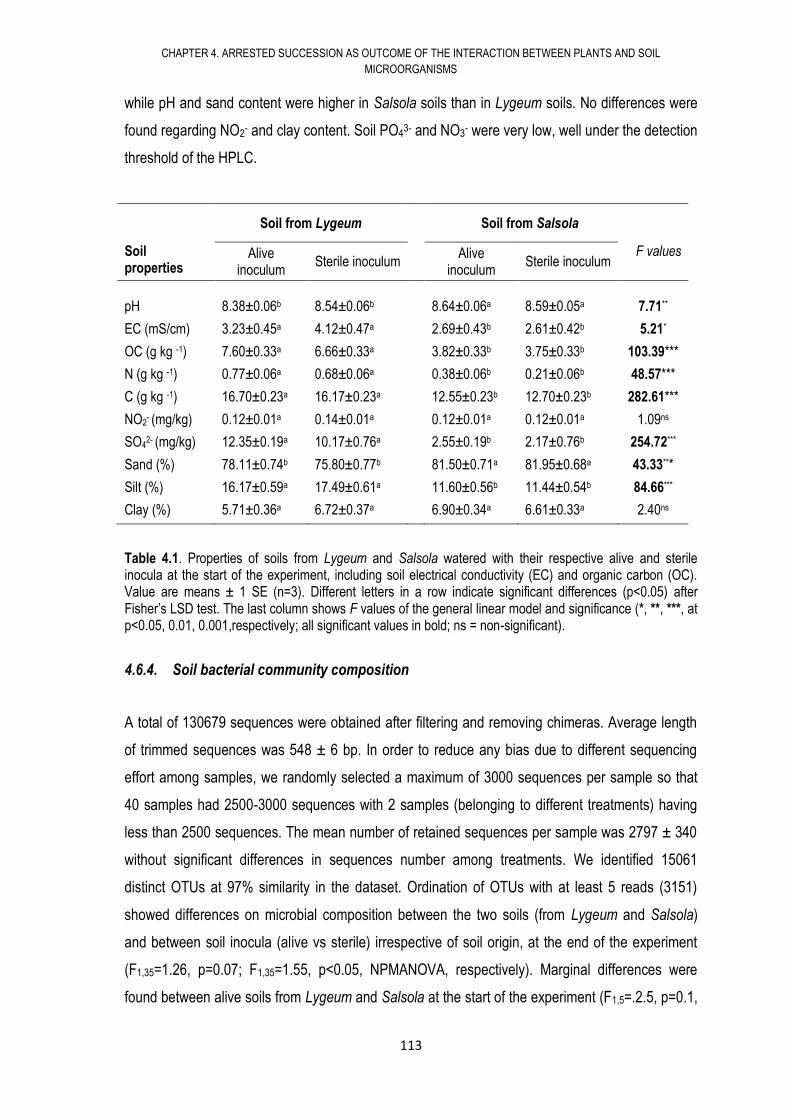
CHAPTER 4. ARRESTED SUCCESSION AS OUTCOME OF THE INTERACTION BETWEEN PLANTS AND SOIL
MICROORGANISMS
113
while pH and sand content were higher in Salsola soils than in Lygeum soils. No differences were
found regarding NO2- and clay content. Soil PO4
3- and NO3- were very low, well under the detection
threshold of the HPLC.
Soil from Lygeum
Soil from Salsola
Soil properties
Alive inoculum
Sterile inoculum Alive
inoculum Sterile inoculum
F values
pH 8.38±0.06b 8.54±0.06b 8.64±0.06a 8.59±0.05a 7.71**
EC (mS/cm) 3.23±0.45a 4.12±0.47a 2.69±0.43b 2.61±0.42b 5.21*
OC (g kg -1) 7.60±0.33a 6.66±0.33a 3.82±0.33b 3.75±0.33b 103.39***
N (g kg -1) 0.77±0.06a 0.68±0.06a 0.38±0.06b 0.21±0.06b 48.57***
C (g kg -1) 16.70±0.23a 16.17±0.23a 12.55±0.23b 12.70±0.23b 282.61***
NO2- (mg/kg) 0.12±0.01a 0.14±0.01a 0.12±0.01a 0.12±0.01a 1.09ns
SO42- (mg/kg) 12.35±0.19a 10.17±0.76a 2.55±0.19b 2.17±0.76b 254.72***
Sand (%) 78.11±0.74b 75.80±0.77b 81.50±0.71a 81.95±0.68a 43.33***
Silt (%) 16.17±0.59a 17.49±0.61a 11.60±0.56b 11.44±0.54b 84.66***
Clay (%) 5.71±0.36a 6.72±0.37a 6.90±0.34a 6.61±0.33a 2.40ns
Table 4.1. Properties of soils from Lygeum and Salsola watered with their respective alive and sterile inocula at the start of the experiment, including soil electrical conductivity (EC) and organic carbon (OC). Value are means ± 1 SE (n=3). Different letters in a row indicate significant differences (p<0.05) after Fisher’s LSD test. The last column shows F values of the general linear model and significance (*, **, ***, at p<0.05, 0.01, 0.001,respectively; all significant values in bold; ns = non-significant).
4.6.4. Soil bacterial community composition
A total of 130679 sequences were obtained after filtering and removing chimeras. Average length
of trimmed sequences was 548 ± 6 bp. In order to reduce any bias due to different sequencing
effort among samples, we randomly selected a maximum of 3000 sequences per sample so that
40 samples had 2500-3000 sequences with 2 samples (belonging to different treatments) having
less than 2500 sequences. The mean number of retained sequences per sample was 2797 ± 340
without significant differences in sequences number among treatments. We identified 15061
distinct OTUs at 97% similarity in the dataset. Ordination of OTUs with at least 5 reads (3151)
showed differences on microbial composition between the two soils (from Lygeum and Salsola)
and between soil inocula (alive vs sterile) irrespective of soil origin, at the end of the experiment
(F1,35=1.26, p=0.07; F1,35=1.55, p<0.05, NPMANOVA, respectively). Marginal differences were
found between alive soils from Lygeum and Salsola at the start of the experiment (F1,5=.2.5, p=0.1,
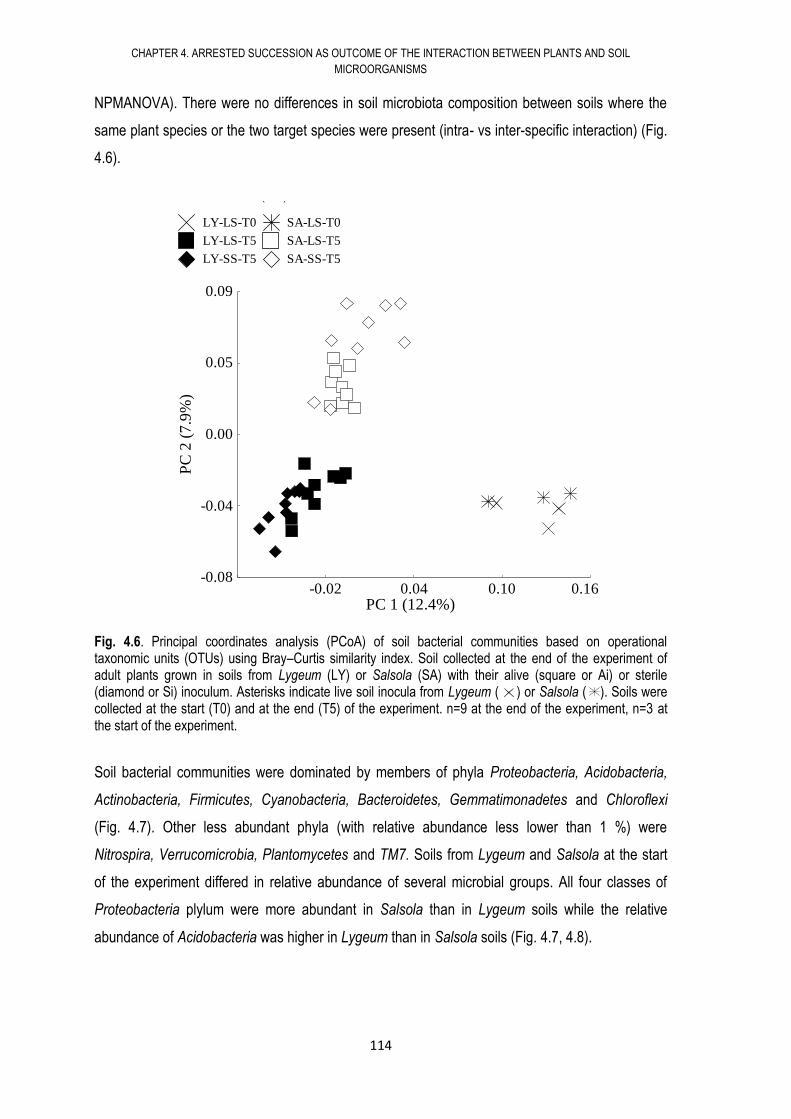
CHAPTER 4. ARRESTED SUCCESSION AS OUTCOME OF THE INTERACTION BETWEEN PLANTS AND SOIL
MICROORGANISMS
114
NPMANOVA). There were no differences in soil microbiota composition between soils where the
same plant species or the two target species were present (intra- vs inter-specific interaction) (Fig.
4.6).
Fig. 4.6. Principal coordinates analysis (PCoA) of soil bacterial communities based on operational taxonomic units (OTUs) using Bray–Curtis similarity index. Soil collected at the end of the experiment of adult plants grown in soils from Lygeum (LY) or Salsola (SA) with their alive (square or Ai) or sterile (diamond or Si) inoculum. Asterisks indicate live soil inocula from Lygeum ( ) or Salsola ( ). Soils were collected at the start (T0) and at the end (T5) of the experiment. n=9 at the end of the experiment, n=3 at the start of the experiment.
Soil bacterial communities were dominated by members of phyla Proteobacteria, Acidobacteria,
Actinobacteria, Firmicutes, Cyanobacteria, Bacteroidetes, Gemmatimonadetes and Chloroflexi
(Fig. 4.7). Other less abundant phyla (with relative abundance less lower than 1 %) were
Nitrospira, Verrucomicrobia, Plantomycetes and TM7. Soils from Lygeum and Salsola at the start
of the experiment differed in relative abundance of several microbial groups. All four classes of
Proteobacteria plylum were more abundant in Salsola than in Lygeum soils while the relative
abundance of Acidobacteria was higher in Lygeum than in Salsola soils (Fig. 4.7, 4.8).
LY-LS-T0 SA-LS-T0
LY-LS-T5 SA-LS-T5
LY-SS-T5 SA-SS-T5
-0.06 -0.03 0.01 0.05 0.08
CP 2 (7.9%)
-0.07
-0.03
0.00
0.04
0.08
SA
-SS
Título
Distancia: (Bray-Curtis)
LY-LS-T0 SA-LS-T0
LY-LS-T5 SA-LS-T5
LY-SS-T5 SA-SS-T5
-0.02 0.04 0.10 0.16PC 1 (12.4%)
-0.08
-0.04
0.00
0.05
0.09
PC
2 (
7.9
%)
Título
Distancia: (Bray-Curtis)
LY-Ai-T0 SA-Ai-T0
LY-Ai SA-Ai
LY-Si SA-Si
-0.06 -0.03 0.01 0.05 0.08
CP 2 (7.9%)
-0.07
-0.03
0.00
0.04
0.08
SA
-SS
Título
Distancia: (Bray-Curtis)
LY-Ai-T0 SA-Ai-T0
LY-Ai SA-Ai
LY-Si SA-Si
G-LS-T0 AR-LS-T0
G-LS AR-LS
G-SS AR-SS
-0.12 -0.05 0.02 0.09 0.16
CP 1 (29.7%)
-0.09
-0.03
0.03
0.09
0.15
CP
2 (
14
.7%
)
Título
Distancia: (Bray-Curtis)
G-LS-T0 AR-LS-T0
G-LS AR-LS
G-SS AR-SS
-0.06 0.02 0.11 0.20
CP 1 (29.7%)
-0.15
-0.06
0.02
0.11
0.20
CP
2 (
14.7
%)
Título
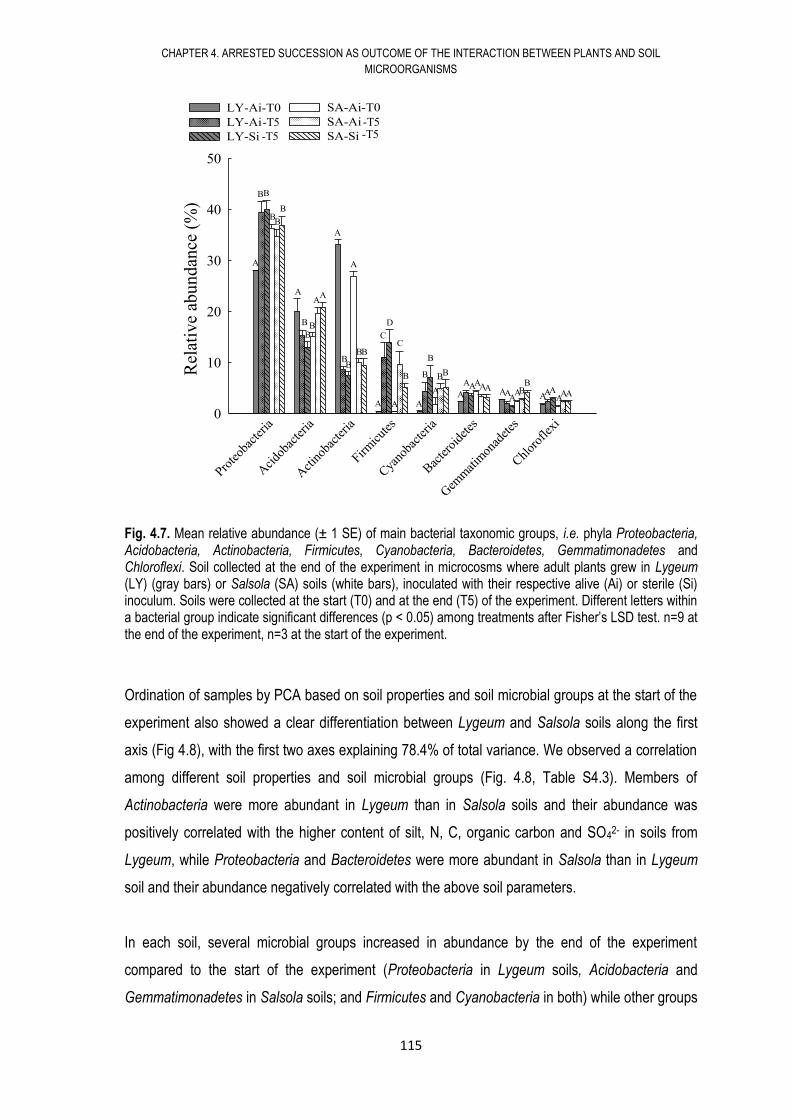
CHAPTER 4. ARRESTED SUCCESSION AS OUTCOME OF THE INTERACTION BETWEEN PLANTS AND SOIL
MICROORGANISMS
115
Fig. 4.7. Mean relative abundance (± 1 SE) of main bacterial taxonomic groups, i.e. phyla Proteobacteria, Acidobacteria, Actinobacteria, Firmicutes, Cyanobacteria, Bacteroidetes, Gemmatimonadetes and Chloroflexi. Soil collected at the end of the experiment in microcosms where adult plants grew in Lygeum (LY) (gray bars) or Salsola (SA) soils (white bars), inoculated with their respective alive (Ai) or sterile (Si) inoculum. Soils were collected at the start (T0) and at the end (T5) of the experiment. Different letters within a bacterial group indicate significant differences (p < 0.05) among treatments after Fisher’s LSD test. n=9 at the end of the experiment, n=3 at the start of the experiment.
Ordination of samples by PCA based on soil properties and soil microbial groups at the start of the
experiment also showed a clear differentiation between Lygeum and Salsola soils along the first
axis (Fig 4.8), with the first two axes explaining 78.4% of total variance. We observed a correlation
among different soil properties and soil microbial groups (Fig. 4.8, Table S4.3). Members of
Actinobacteria were more abundant in Lygeum than in Salsola soils and their abundance was
positively correlated with the higher content of silt, N, C, organic carbon and SO42- in soils from
Lygeum, while Proteobacteria and Bacteroidetes were more abundant in Salsola than in Lygeum
soil and their abundance negatively correlated with the above soil parameters.
In each soil, several microbial groups increased in abundance by the end of the experiment
compared to the start of the experiment (Proteobacteria in Lygeum soils, Acidobacteria and
Gemmatimonadetes in Salsola soils; and Firmicutes and Cyanobacteria in both) while other groups
Prote
obac
teria
Aci
doba
cter
ia
Act
inob
acte
ria
Firmic
utes
Cyanob
acte
ria
Bacte
roid
etes
Gem
mat
imon
adet
es
Chlor
ofle
xi
Rel
ativ
e ab
unda
nce
(%)
0
10
20
30
40
50
LY-Ai-T0
LY-Ai
LY-Si
SA-Ai-T0
SA-Ai
SA-Si
A
BB
BB
B
A
B
B
B
AA
A
A
BB
BB
A
C
D
A
C
B
A
B
B
A
BB
A
AAAAA
AAA
ABB
AAA
AAA
Prote
obac
teria
Aci
doba
cter
ia
Act
inob
acte
ria
Firmic
utes
Cyanob
acte
ria
Bacte
roid
etes
Gem
mat
imon
adet
es
Chlor
ofle
xi
Rel
ativ
e ab
unda
nce
(%)
0
10
20
30
40
50
LY-Ai-T0
LY-Ai
LY-Si
SA-Ai-T0
SA-Ai
SA-Si
A
BB
BB
B
A
B
B
B
AA
A
A
BB
BB
A
C
D
A
C
B
A
B
B
A
BB
A
AAAAA
AAA
ABB
AAA
AAA
Prote
obac
teria
Aci
doba
cter
ia
Act
inob
acte
ria
Firmic
utes
Cya
noba
cter
ia
Bac
tero
idet
es
Gem
mat
imon
adet
es
Chl
orof
lexi
Rel
ativ
e ab
undan
ce (
%)
0
10
20
30
40
50
LY-Ai-T0
LY-Ai
LY-Si
SA-Ai-T0
SA-Ai
SA-Si
A
BB
BB
B
A
B
BB
AA
A
A
BB
BB
A
C
D
A
C
B
A
B
B
A
BB
A
AAAAA AAA
ABB
AAAAAA
-T5-T5
-T5
-T5
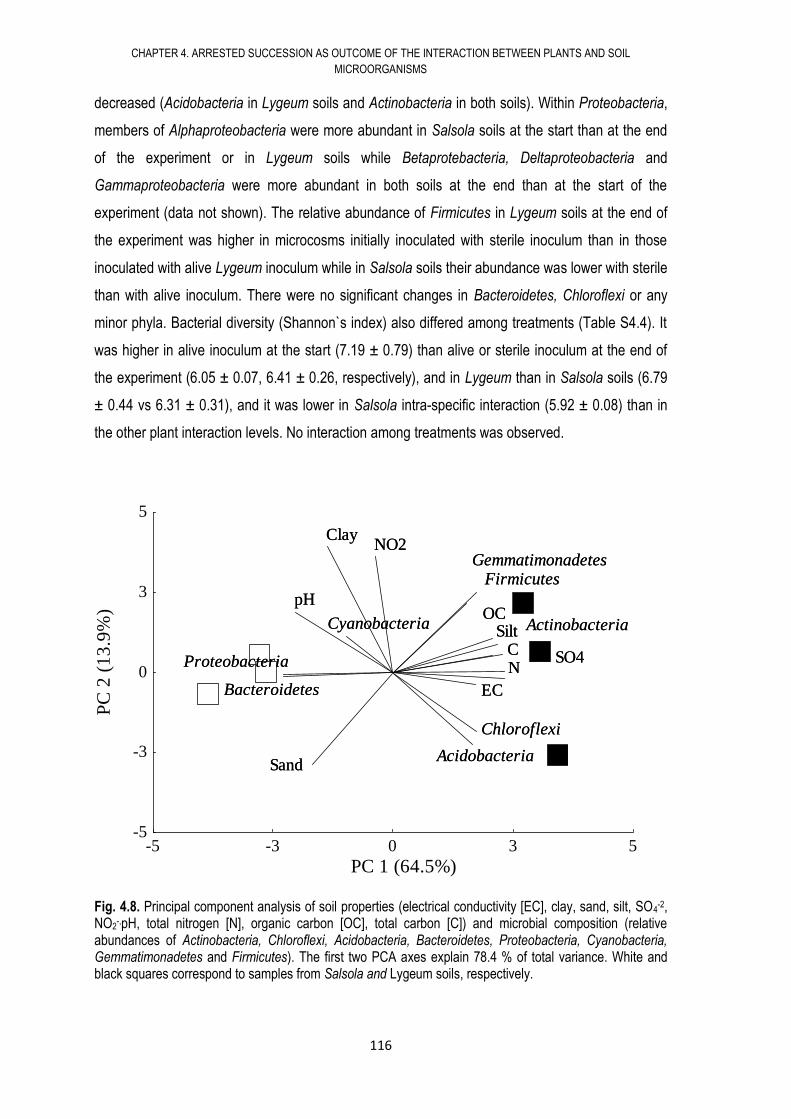
CHAPTER 4. ARRESTED SUCCESSION AS OUTCOME OF THE INTERACTION BETWEEN PLANTS AND SOIL
MICROORGANISMS
116
decreased (Acidobacteria in Lygeum soils and Actinobacteria in both soils). Within Proteobacteria,
members of Alphaproteobacteria were more abundant in Salsola soils at the start than at the end
of the experiment or in Lygeum soils while Betaprotebacteria, Deltaproteobacteria and
Gammaproteobacteria were more abundant in both soils at the end than at the start of the
experiment (data not shown). The relative abundance of Firmicutes in Lygeum soils at the end of
the experiment was higher in microcosms initially inoculated with sterile inoculum than in those
inoculated with alive Lygeum inoculum while in Salsola soils their abundance was lower with sterile
than with alive inoculum. There were no significant changes in Bacteroidetes, Chloroflexi or any
minor phyla. Bacterial diversity (Shannon`s index) also differed among treatments (Table S4.4). It
was higher in alive inoculum at the start (7.19 ± 0.79) than alive or sterile inoculum at the end of
the experiment (6.05 ± 0.07, 6.41 ± 0.26, respectively), and in Lygeum than in Salsola soils (6.79
± 0.44 vs 6.31 ± 0.31), and it was lower in Salsola intra-specific interaction (5.92 ± 0.08) than in
the other plant interaction levels. No interaction among treatments was observed.
Fig. 4.8. Principal component analysis of soil properties (electrical conductivity [EC], clay, sand, silt, SO4-2,
NO2-,pH, total nitrogen [N], organic carbon [OC], total carbon [C]) and microbial composition (relative
abundances of Actinobacteria, Chloroflexi, Acidobacteria, Bacteroidetes, Proteobacteria, Cyanobacteria, Gemmatimonadetes and Firmicutes). The first two PCA axes explain 78.4 % of total variance. White and black squares correspond to samples from Salsola and Lygeum soils, respectively.
-5 -3 0 3 5
PC 1 (64.5%)
-5
-3
0
3
5
PC
2 (
13
.9%
)
pH
EC
Sand
Silt
Clay
NC
OC
NO2
SO4Proteobacteria
Acidobacteria
Actinobacteria
Firmicutes
Cyanobacteria
Bacteroidetes
Gemmatimonadetes
Chloroflexi
pH
EC
Sand
Silt
Clay
NC
OC
NO2
SO4Proteobacteria
Acidobacteria
Actinobacteria
Firmicutes
Cyanobacteria
Bacteroidetes
Gemmatimonadetes
Chloroflexi
Título
CHAPTER 4. ARRESTED SUCCESSION AS OUTCOME OF THE INTERACTION BETWEEN PLANTS AND SOIL
MICROORGANISMS
117
4.7. DISCUSSION
Contrary to our expectations, soil properties and microbial communities associated to Lygeum
facilitated the development of both Lygeum and Salsola plants. Although Salsola individuals were
more competitive than Lygeum in the saplings and adult life stages, Lygeum individuals were more
competitive than Salsola in key initial life stages (seed germination and seedling growth). Our
results showed that soil properties and soil microbial communities associated to Lygeum had an
important influence on seed germination and initial growth of Lygeum individuals, playing perhaps
a role in Lygeum dominance and arrested succession throught positive plant-soil feedbacks.
4.7.1. Positive effect of Lygeum soil properties and microbial communities
Plant growth, especially at initial stages, and seed germination (for Lygeum only) were in general
higher in Lygeum than in Salsola soils. Lygeum soils were characterized by total C, organic C, N
and silt contents higher than Salsola soils, therefore contributing to the enhanced plant
performance in these soils. Lygeum soils also had higher salinity than Salsola soils but, although
high soil salinity can limit plant performance (Hasegawa et al. 2000), both Lygeum and Salsola, as
halophytic species, have developed survival strategies under these conditions. These strategies
include selective ion uptake or accumulation in vacuoles to keep homeostasis or low osmotic
potential (Flowers et al. 1977, Zhu 2001, Porta-Casanellas et al. 2003) or, in the case of Salsola,
by notably increasing rooting depth to access deep water storages (Padilla and Pugnaire 2007).
The soil microbial community associated to Lygeum positively affected Lygeum seed germination
and growth of saplings and adult plants. However, contrary to our hypothesis, Lygeum soil
microbes did not negatively affect, but instead promoted, Salsola growth. In fact, soil
microorganisms from Lygeum soils were more positive for Salsola individuals than soil
microorganisms from under Salsola shrubs. Soil microbial communities from Lygeum and Salsola
soils showed little differences in composition at the beginning of the experiment but still they
differed in the relative abundance of certain microbial groups and, most likely, in microbial activity
and biomass. Soil microbial composition was influenced by soil properties such as texture, soil
organic C and SO42- content. At the beginning of the experiment, Acidobacteria species were more
abundant in Lygeum than in Salsola soils while Proteobacteria were higher in Salsola than in
Lygeum soils, a pattern that could be related to soil silt content (Sessitsch et al. 2001). Members of
the Burkholderiales order (Betaproteobacteria), described as potential plant-growth promoters
CHAPTER 4. ARRESTED SUCCESSION AS OUTCOME OF THE INTERACTION BETWEEN PLANTS AND SOIL
MICROORGANISMS
118
(Acton 2012) were more abundant in Salsola than in Lygeum soils at the beginning of the
experiment but, like most members of Proteobacteria, increased their abundance with time in
Lygeum soils, suggesting positive feedbacks whith these microorganisms.
A similar increase with time in Lygeum soils was observed for members of the Rhodobacter order
(Alphaproteobacteria), known for their abundance in halophytic environments (Kersters et al.
2006). Several reports suggest that salinity affects microbial composition (Dupont et al. 2014) and
that microorganisms inhabiting roots and leaves of halophytic species may contribute significantly
to lower their stress and increase their salinity tolerance (Ruppel et al. 2013). In fact, halophytic
species as Salicornia brachiate or Halocnemum strobilaceum are associated with many
halotolerant microorganisms such as Mesorhizobium or Halomonas (Jha et al. 2012, Shi et al.
2012). We found that abundance of Mesorhizobium was higher in Lygeum than in Salsola soils,
and that Halomonas, Bacillus and Enterobacter, which can also be halotolerant (Upadhyay et al.
2011, Shi et al. 2012), were found only in Lygeum soils. On the contrary, the halotolerant
Litoribacter and Microbacterium (Upadhyay et al. 2011, Shi et al. 2012) were only found in Salsola
soils. Therefore, our results show that Salsola and Lygeum soils differ in composition of
halotolerant microbes, and that these are more abundant and show higher richness in Lygeum
than in Salsola soils, which may contribute to the better performance of Lygeum and Salsola plants
in Lygeum soils. Added to microbial composition, higher C and N content in Lygeum than in
Salsola soils suggested a higher microbial activity and biomass linked with increased nutrient
availability which may have positively influenced plant growth.
4.7.2. Soil microbes effects change with plant age and interactions
Our results showed that, overall, soil microorganisms (supplied via alive inocula) associated to
Lygeum positively affected plant growth in both species, while soil microbes associated to Salsola
had different effects on Lygeum plants depending on their life stage. Salsola inocula had a
negative effect on Lygeum seed germination while it had a neutral or positive effect on later stages
of Lygeum plant development. Therefore, Lygeum seeds germinated better when Salsola soil
microbes were not present while, later on, Lygeum plants often grew less when Salsola microbes
were removed.
On Lygeum soils the presence of Salsola seeds negatively affected Lygeum germination
compared to intra-specific interaction; while on sterile Salsola soils the effect was the opposite, and
CHAPTER 4. ARRESTED SUCCESSION AS OUTCOME OF THE INTERACTION BETWEEN PLANTS AND SOIL
MICROORGANISMS
119
the maximum Lygeum seed germination rate and establishment did occur under inter-specific
interaction. It has been suggested that seeds could recognize potential competitors presence and
defer germination (Renne et al. 2014) a process that may have influenced both Lygeum and
Salsola germination. Lygeum germination rate and establishment under inter-specific interaction
were negatively affected by Salsola soil microorganisms and positively by Lygeum soil
microorganisms, evidencing that changes in relative abundance of microbial groups affected initial
stages of plant development. Negative plant-soil interactions (Klironomos 2002) also influence
seed germination and initial growth stages. Contrary to what was found by (Pendergast et al.,
2013) who suggested that plant invasion is promoted by the better development of a species on
soil of its competitors, we found that both saplings and adult Lygeum individuals grew better on its
own soil than on Salsola soil. In fact, soil microorganisms associated to Lygeum also facilitated
Salsola growth evidencing a positive effect of Lygeum soil microorganisms on Salsola plants.
Thus, the invasive nature of Lygeum plants may be given by its growth strategy and positive plant-
soil feedbacks in own soils.
4.7.3. Soil microbial communities change with time
Although at the beginning of the experiment soil microbial communities associated to Lygeum and
Salsola soils were quite similar, differences between soil origins increased with time. In the field,
both soils were collected near the rhizosphere and both shared the same extreme semiarid
climatic conditions (i.e., high temperatures and irradiation, low precipitation) that likely tended to
homogenize microbial communities. After five months of experiment, the interactions among
plants, soil microorganisms, and soil properties led to a clear differentiation between soil microbial
communities. Most microbial groups increased their abundance with time, while other as
Acidobacteria in Lygeum soils, or Actinobacteria in both soils, decreased. Soil microbial
communities could change due to seasonal changes (Lipson et al. 2002) or due to new conditions.
Moreover, changes in microbial abundance over time could be linked to the plant ability to select
some microorganisms in the rhizosphere Kowalchuk et al. (2002), and Martínez-García et al.
(2011), and Rodríguez-Echeverría et al. (2013).
4.7.4. Soil microorganisms and arrested succession
Our results suggest that the lack of species such as Salsola in communities dominated by Lygeum
is linked to positive plant-soil feedbacks between soil microorganisms and Lygeum, even though
CHAPTER 4. ARRESTED SUCCESSION AS OUTCOME OF THE INTERACTION BETWEEN PLANTS AND SOIL
MICROORGANISMS
120
soil microbial communities in Lygeum soils and the presence of Lygeum individuals enhanced
performance of saplings and adult Salsola individuals in inter-specific interaction.
Although seed viability tests showed similar germination rates in both species, Lygeum
germination rate after 15 days of sowing far exceeded Salsola’s, and benefited more from Lygeum
than from Salsola soil extracts. We also observed that microorganisms from Salsola soils
negatively affected Lygeum germination, showing the determinant role of soil communities on the
initial life stages of plants. Salsola plants grew better in Lygeum than in its own soil, suggesting a
negative feedback with their own soil microorganisms (Klironomos 2002). Under inter-specific
competition, Salsola performed better in sterile than in alive soils, likely due to presence of
pathogens that negatively affected plant growth (Klironomos 2002). This is in agreement with the
fact that Salsola is a late-successional species (chapter III) and these negative interactions could
easily promote secondary succession as suggested in chapter III. On the contrary, the positive
feedbacks observed between Lygeum plants and their soil microbes are typical of late succession
species (Kardol et al., 2006). Results suggest that the negative effect of Lygeum soils on the
establishment of Salsola individuals is key to determine the later success of Lygeum individuals as
adult plants.
Salsola individuals were more competitive than Lygeum individuals under both intra- and inter-
specific interactions. C4 species (Salsola) can reduce photorespiration at high temperatures and
irradiance, therefore increasing photosynthetic efficiency (Padilla et al. 2009, González and
Chueca 2010) and water use efficiency above that of C3 species (Lygeum) (Sage 2004, González
and Chueca 2010). Although Lygeum showed a low competitive success with C4 species such as
Salsola or C3 species such as Limonium insigne (Armas and Pugnaire 2011), Lygeum success
ability in initial life stages, its clonal growth strategy and the positive feedbacks with soil
microorganisms combine to promote its local dominance and play a important role in arrested
succession.
4.8. CONCLUSIONS
Our results show that Lygeum competitive ability was linked to positive feedback effects of its own
soil microorganisms, which enhanced seed germination and establishment promoting early
occupation of space which, in addition to its clonal growth habit, may prompt its dominance over
time in a seemingly arrested succession.
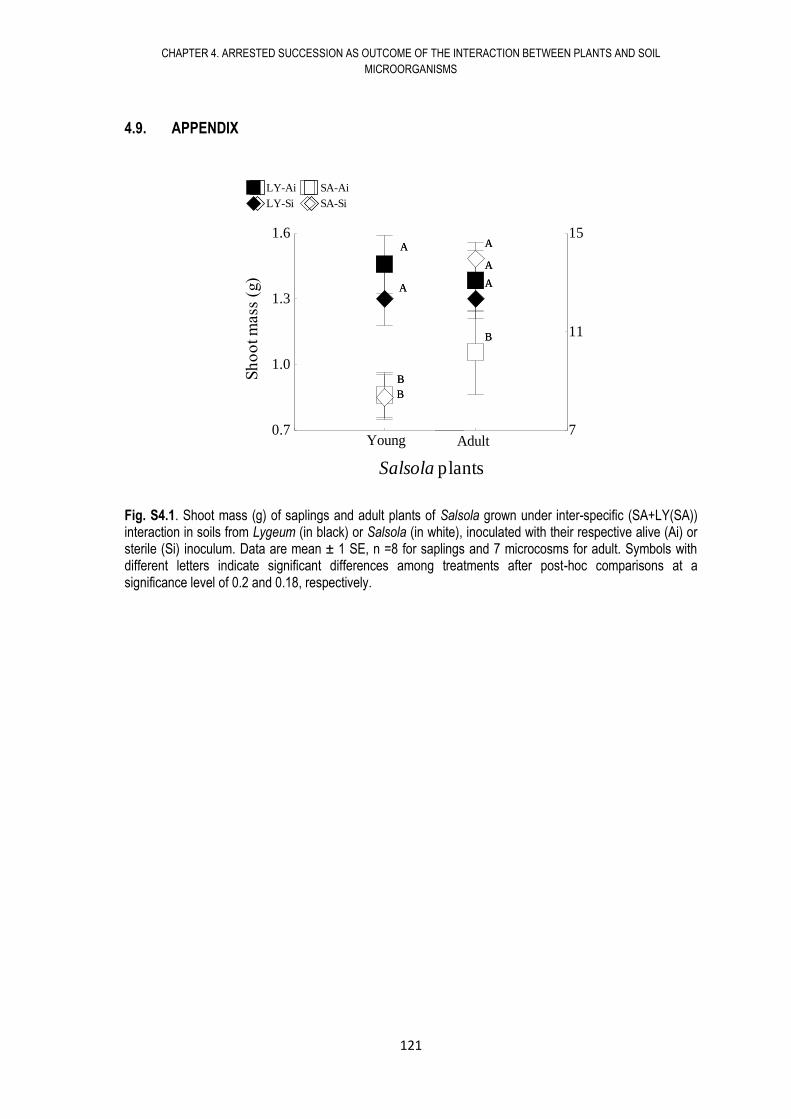
CHAPTER 4. ARRESTED SUCCESSION AS OUTCOME OF THE INTERACTION BETWEEN PLANTS AND SOIL
MICROORGANISMS
121
4.9. APPENDIX
Fig. S4.1. Shoot mass (g) of saplings and adult plants of Salsola grown under inter-specific (SA+LY(SA)) interaction in soils from Lygeum (in black) or Salsola (in white), inoculated with their respective alive (Ai) or sterile (Si) inoculum. Data are mean ± 1 SE, n =8 for saplings and 7 microcosms for adult. Symbols with different letters indicate significant differences among treatments after post-hoc comparisons at a significance level of 0.2 and 0.18, respectively.
LY-Ai SA-Ai
LY-Si SA-Si
LY+LY LY+SA(LY)
Competition
0.3
0.6
0.9
1.2
Shoot
bio
mas
s (g
)
A
B
B
B
B
B
C
C
A
B
B
B
B
B
C
C
Título
LY-Ai SA-Ai
LY-Si SA-Si
LY-Ai SA-Ai
LY-Si SA-Si
LY+LY LY+SA(LY)
Competition
0.3
0.6
0.9
1.2
Sh
oo
t b
iom
ass
(g)
A
B
B
B
B
B
C
C
A
B
B
B
B
B
C
C
Título
LY-Ai SA-Ai
LY-Si SA-Si
LY-LS SA-LS
LY-SS SA-SS
Young Young
Competition
0.7
1.0
1.3
1.6
Sh
oo
t b
iom
ass
(g)
A
B
BB
A
A
BB
A
B
BB
A
A
BB
Título
LY-LS SA-LS
LY-SS SA-SS
LY-LS SA-LS
LY-SS SA-SS
Sa+SA Adult
Competition
7
11
15
Sho
ot
bio
mas
s (g
)
A
A
BB
A
B
A
C
A
A
BB
A
B
A
C
Título
LY-LS SA-LS
LY-SS SA-SS
Salsola plants
Sh
oo
tm
ass
(g)
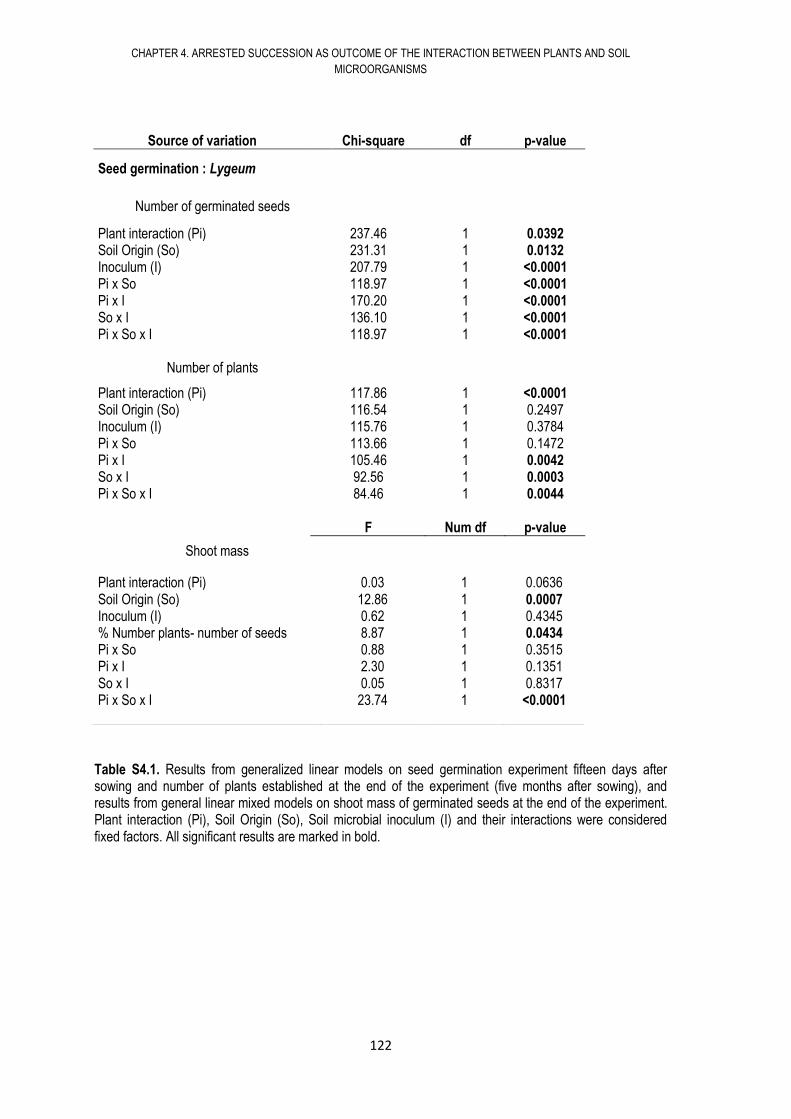
CHAPTER 4. ARRESTED SUCCESSION AS OUTCOME OF THE INTERACTION BETWEEN PLANTS AND SOIL
MICROORGANISMS
122
Source of variation Chi-square df p-value
Seed germination : Lygeum
Number of germinated seeds
Plant interaction (Pi) 237.46 1 0.0392 Soil Origin (So) 231.31 1 0.0132 Inoculum (I) 207.79 1 <0.0001 Pi x So 118.97 1 <0.0001 Pi x I 170.20 1 <0.0001 So x I 136.10 1 <0.0001 Pi x So x I 118.97 1 <0.0001
Number of plants
Plant interaction (Pi) 117.86 1 <0.0001 Soil Origin (So) 116.54 1 0.2497 Inoculum (I) 115.76 1 0.3784 Pi x So 113.66 1 0.1472 Pi x I 105.46 1 0.0042 So x I 92.56 1 0.0003 Pi x So x I 84.46 1 0.0044 F Num df p-value
Table S4.1. Results from generalized linear models on seed germination experiment fifteen days after sowing and number of plants established at the end of the experiment (five months after sowing), and results from general linear mixed models on shoot mass of germinated seeds at the end of the experiment. Plant interaction (Pi), Soil Origin (So), Soil microbial inoculum (I) and their interactions were considered fixed factors. All significant results are marked in bold.
Shoot mass
Plant interaction (Pi) 0.03 1 0.0636 Soil Origin (So) 12.86 1 0.0007 Inoculum (I) 0.62 1 0.4345 % Number plants- number of seeds 8.87 1 0.0434 Pi x So 0.88 1 0.3515 Pi x I 2.30 1 0.1351 So x I 0.05 1 0.8317 Pi x So x I 23.74 1 <0.0001
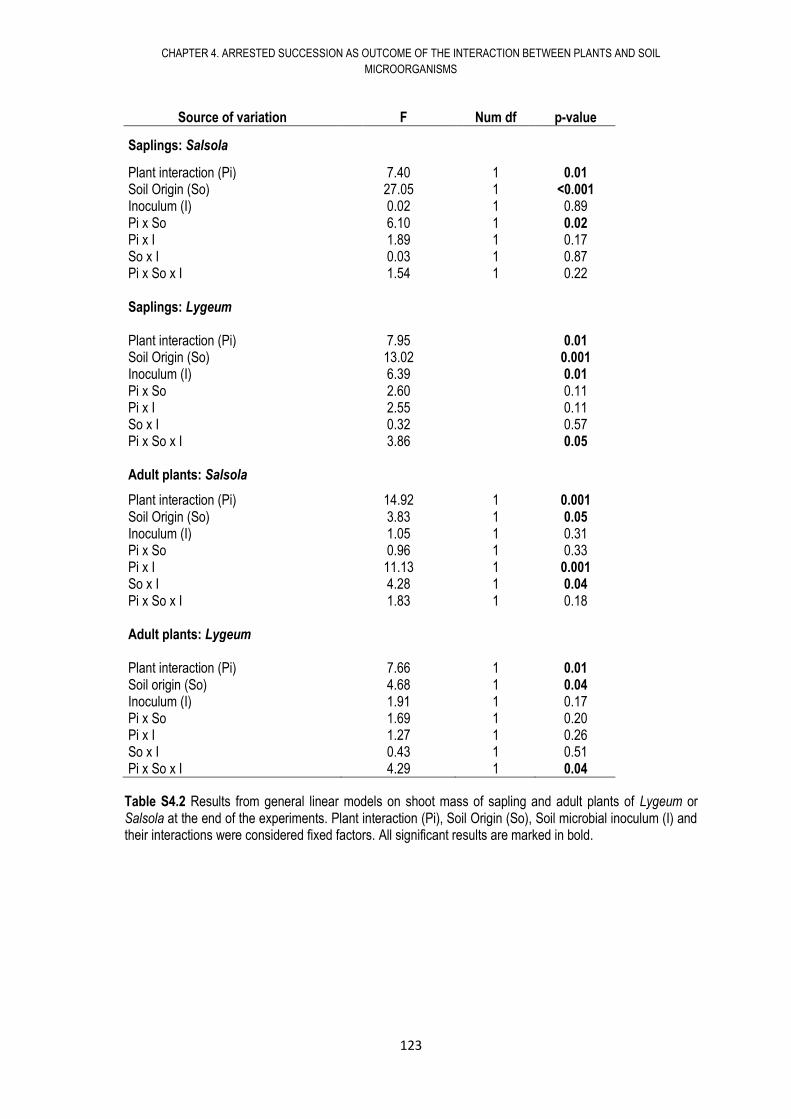
CHAPTER 4. ARRESTED SUCCESSION AS OUTCOME OF THE INTERACTION BETWEEN PLANTS AND SOIL
MICROORGANISMS
123
Source of variation F Num df p-value
Saplings: Salsola
Plant interaction (Pi) 7.40 1 0.01 Soil Origin (So) 27.05 1 <0.001 Inoculum (I) 0.02 1 0.89 Pi x So 6.10 1 0.02 Pi x I 1.89 1 0.17 So x I 0.03 1 0.87 Pi x So x I 1.54 1 0.22 Saplings: Lygeum Plant interaction (Pi) 7.95 0.01 Soil Origin (So) 13.02 0.001 Inoculum (I) 6.39 0.01 Pi x So 2.60 0.11 Pi x I 2.55 0.11 So x I 0.32 0.57 Pi x So x I 3.86 0.05 Adult plants: Salsola
Plant interaction (Pi) 14.92 1 0.001 Soil Origin (So) 3.83 1 0.05 Inoculum (I) 1.05 1 0.31 Pi x So 0.96 1 0.33 Pi x I 11.13 1 0.001 So x I 4.28 1 0.04 Pi x So x I 1.83 1 0.18 Adult plants: Lygeum Plant interaction (Pi) 7.66 1 0.01 Soil origin (So) 4.68 1 0.04 Inoculum (I) 1.91 1 0.17 Pi x So 1.69 1 0.20 Pi x I 1.27 1 0.26 So x I 0.43 1 0.51 Pi x So x I 4.29 1 0.04
Table S4.2 Results from general linear models on shoot mass of sapling and adult plants of Lygeum or Salsola at the end of the experiments. Plant interaction (Pi), Soil Origin (So), Soil microbial inoculum (I) and their interactions were considered fixed factors. All significant results are marked in bold.
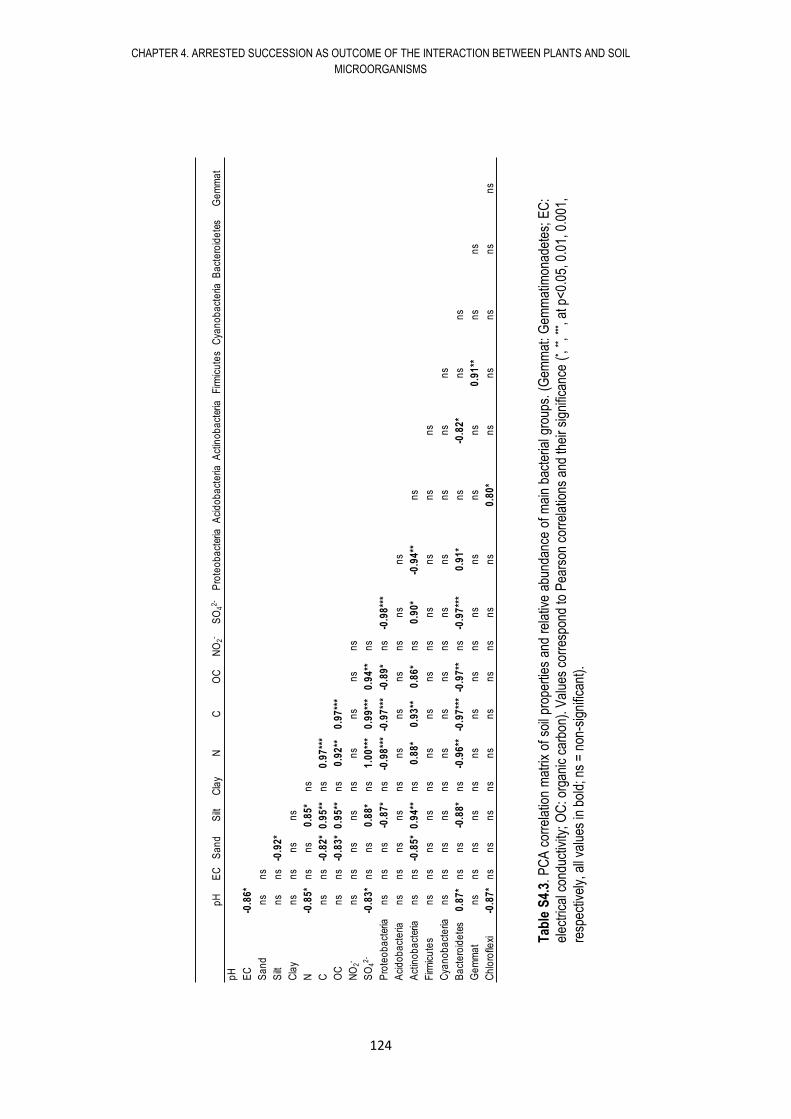
CHAPTER 4. ARRESTED SUCCESSION AS OUTCOME OF THE INTERACTION BETWEEN PLANTS AND SOIL
MICROORGANISMS
124
Tab
le S
4.3.
PC
A c
orre
latio
n m
atrix
of
soil
prop
ertie
s an
d re
lativ
e ab
unda
nce
of m
ain
bact
eria
l gro
ups.
(G
emm
at:
Gem
mat
imon
adet
es;
EC
:
elec
tric
al c
ondu
ctiv
ity; O
C: o
rgan
ic c
arbo
n). V
alue
s co
rres
pond
to P
ears
on c
orre
latio
ns a
nd th
eir
sign
ifica
nce
(* , **, **
* , at
p<
0.05
, 0.0
1, 0
.001
,
resp
ectiv
ely,
all
valu
es in
bol
d; n
s =
non
-sig
nific
ant)
.
pH
EC
Sa
nd
Silt
Cla
yN
CO
CN
O2
-S
O4
2-
Pro
teo
ba
cter
iaA
cid
ob
act
eria
Act
ino
ba
cter
iaF
irmic
ute
sC
yan
ob
act
eria
Ba
cte
roid
ete
sG
em
ma
t
pH
EC
-0.8
6*
Sa
nd
ns
ns
Silt
ns
ns
-0.9
2*
Cla
yn
sn
sn
sn
s
N
-0.8
5*
ns
ns
0.8
5*
ns
C
ns
ns
-0.8
2*
0.9
5**
ns
0.9
7**
*
OC
ns
ns
-0.8
3*
0.9
5**
ns
0.9
2**
0.9
7**
*
NO
2-
ns
ns
ns
ns
ns
ns
ns
ns
ns
SO
42
--0
.83
*n
sn
s0
.88
*n
s1
.00
***
0.9
9**
*0
.94
**n
s
Pro
teo
ba
cter
ian
sn
sn
s-0
.87
*n
s-0
.98
***
-0.9
7**
*-0
.89
*n
s-0
.98
***
Aci
do
ba
cte
rian
sn
sn
sn
sn
sn
sn
sn
sn
sn
sn
s
Act
ino
ba
cter
ian
sn
s-0
.85
*0
.94
**n
s0
.88
*0
.93
**0
.86
*n
s0
.90
*-0
.94
**n
s
Firm
icu
tes
ns
ns
ns
ns
ns
ns
ns
ns
ns
ns
ns
ns
ns
Cya
no
ba
cte
rian
sn
sn
sn
sn
sn
sn
sn
sn
sn
sn
sn
sn
sn
s
Ba
cte
roid
ete
s0
.87
*n
sn
s-0
.88
*n
s-0
.96
**-0
.97
***
-0.9
7**
ns
-0.9
7**
*0
.91
*n
s-0
.82
*n
sn
s
Ge
mm
at
ns
ns
ns
ns
ns
ns
ns
ns
ns
ns
ns
ns
ns
0.9
1**
ns
ns
Ch
loro
flexi
-0.8
7*
ns
ns
ns
ns
ns
ns
ns
ns
ns
ns
0.8
0*
ns
ns
ns
ns
ns
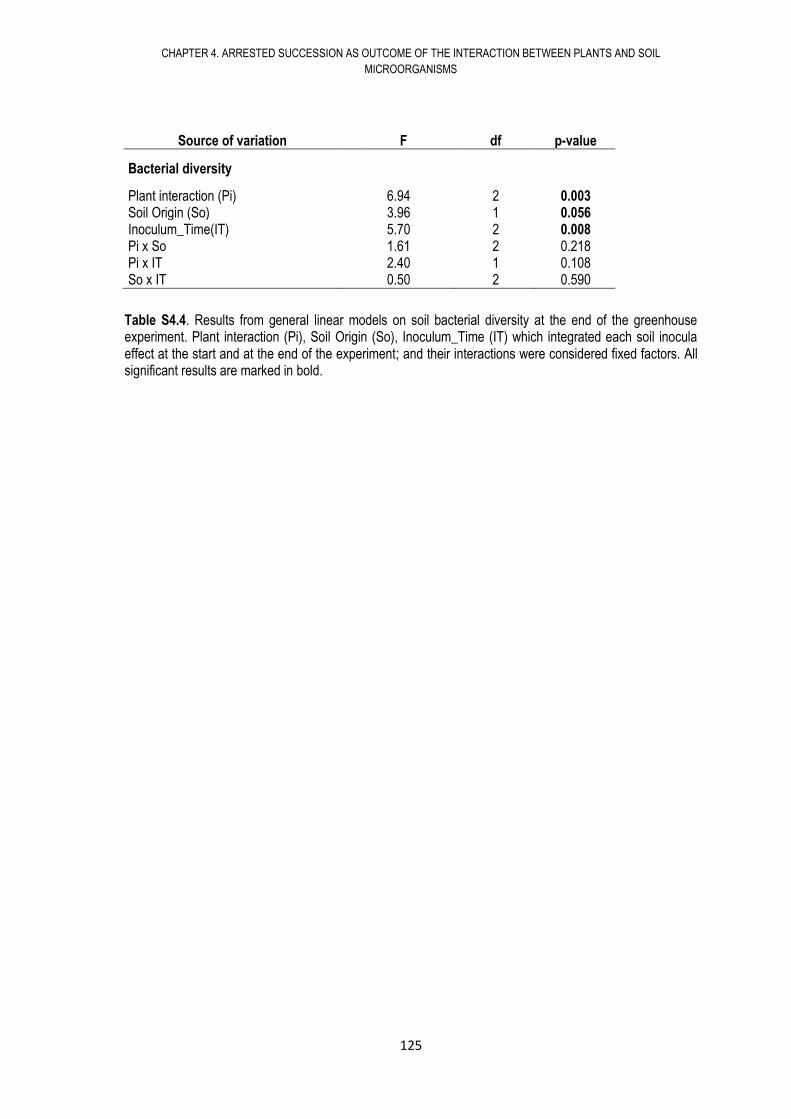
CHAPTER 4. ARRESTED SUCCESSION AS OUTCOME OF THE INTERACTION BETWEEN PLANTS AND SOIL
MICROORGANISMS
125
Source of variation F df p-value
Bacterial diversity
Plant interaction (Pi) 6.94 2 0.003 Soil Origin (So) 3.96 1 0.056 Inoculum_Time(IT) 5.70 2 0.008 Pi x So 1.61 2 0.218 Pi x IT 2.40 1 0.108 So x IT 0.50 2 0.590
Table S4.4. Results from general linear models on soil bacterial diversity at the end of the greenhouse experiment. Plant interaction (Pi), Soil Origin (So), Inoculum_Time (IT) which integrated each soil inocula effect at the start and at the end of the experiment; and their interactions were considered fixed factors. All significant results are marked in bold.

126
CONCLUSIONES
127
CONCLUSIONES GENERALES
El tamaño de copa del arbusto facilitador Retama sphaerocarpa¸ y el suelo bajo su copa
influyen de manera positiva en el desarrollo de la comunidad de herbáceas que crece a su
amparo, incrementándose tanto la biomasa como la abundancia de especies cuanto
mayor sea la copa del arbusto.
El origen del suelo (es decir, que provenga de arbustos de Retama grandes, medianos o
pequeños) determina en gran medida la diversidad y productividad de la comunidad de
especies facilitadas por Retama, siendo más decisivo que los efectos del microhabitat
generado por el arbusto.
La composición del banco de semillas, la disponibilidad de nutrientes y las interacciones
entre plantas y comunidades microbianas del suelo afectan el desarrollo de la comunidad
de herbáceas.
Los microorganismos del suelo, las características del suelo y el microhabitat creado por
la especie facilitadora arbustiva Retama, influyen tanto en la germinación de la comunidad
de herbáceas bajo la copa del arbusto como en su crecimiento.
El efecto de los microorganismos del suelo sobre las tasas de germinación de las
especies de herbáceas es específico para cada especie, influyendo de forma positiva,
neutra o negativa según la identidad de cada una. Las tasas de germinación también se
ven afectadas positivamente por el microhabitat generado por la copa del arbusto
facilitador y su suelo asociado.
El efecto positivo de los suelos bajo el arbusto facilitador sobre el desarrollo de la
comunidad de herbáceas se mantiene a lo largo del ciclo de vida de la especie
facilitadora, de modo que el suelo (propiedades físicas, contenido en nutrientes y
microbiota) es el principal promotor de los procesos de facilitación de Retama
sphaerocarpa en zonas semiáridas.
Tras el abandono de campos dedicados al cultivo, tanto las plantas como las
comunidades microbianas del suelo siguen un proceso paralelo de sucesión secundaria.
La sucesión secundaria en ecosistemas semiáridos está caracterizada por cambios en las
propiedades del suelo, la cobertura vegetal, la biomasa y la actividad microbiana, así
como por cambios en la composición de plantas y microorganismos del suelo.
CONCLUSIONES
128
Teniendo en cuenta la velocidad de cambio de la composición de las comunidades
vegetales y de las comunidades microbianas del suelo, los resultados sugieren que el
proceso de sucesión microbiana sigue al de la sucesión en plantas.
Respecto al proceso de sucesión detenida donde domina Lygeum spartum, la habilidad
competitiva de Lygeum está vinculada a un efecto positivo de los microorganismos y
nutrientes del suelo sobre su germinación y desarrollo.
La retroalimentación positiva planta-suelo promueve una temprana ocupación del espacio
que, sumada a la estrategia de crecimiento clonal de Lygeum, facilita su dominancia en el
tiempo, causando una interrupción del avance sucesional.
.
129
REFERENCES Abella, S. 2010. Disturbance and plant succession in the Mojave and Sonoran deserts of the
American southwest. International Journal of Environmental Research and Public Health 7:1248-1284.
Acácio, V., M. Holmgren, P. Jansen, and O. Schrotter. 2007. Multiple Recruitment Limitation
Causes Arrested Succession in Mediterranean Cork Oak Systems. Ecosystems 10:1220-1230.
Acosta-Martínez, V., S. E. Dowd, Y. Sun, D. Wester, and V. Allen. 2010. Pyrosequencing analysis for characterization of soil bacterial populations as affected by an integrated livestock-cotton production system. Applied Soil Ecology 45:13-25.
Acton, Q. A. 2012. Advances in Betaproteobacteria Research and Application. Scholarly Editions, Oxford.
Aerts, R. 1999. Interspecific competition in natural plant communities: mechanisms, trade-offs and plant-soil feedbacks. Journal of Experimental Botany 50:29-37.
Aguiar, M. n. R. and O. E. Sala. 1999. Patch structure, dynamics and implications for the functioning of arid ecosystems. Trends in Ecology & Evolution 14:273-277.
Akaike, H. 1974. A new look at the statistical model identification. Automatic Control, IEEE Transactions on 19:716-723.
Amarasekare, P. and H. Possingham. 2001. Patch dynamics and metapopulation theory: The case of successional species. Journal of Theoretical Biology 209:333-344.
Anderson, D. B. 1936. Relative Humidity or Vapor Pressure Deficit. Ecology 17:277-282. Armas, C., J. Kim, T. Bleby, and R. Jackson. 2012. The effect of hydraulic lift on organic matter
decomposition, soil nitrogen cycling, and nitrogen acquisition by a grass species. Oecologia 168:11-22.
Armas, C. and F. Pugnaire. 2009. Ontogenetic shifts in interactions of two dominant shrub species in a semi-arid coastal sand dune system. Journal of Vegetation Science 20:535-546.
Armas, C. and F. I. Pugnaire. 2005. Plant interactions govern population dynamics in a semi-arid plant community. Journal of Ecology 93:978-989.
Armas, C. and F. I. Pugnaire. 2011. Plant Neighbour Identity Matters to Belowground Interactions under Controlled Conditions. PLoS ONE 6: e27791.
Armas, C., S. Rodríguez-Echeverría, and F. I. Pugnaire. 2011. A field test of the stress-gradient hypothesis along an aridity gradient. Journal of Vegetation Science 22:818-827.
Austin, A., G. Piñeiro, and M. Gonzalez Polo. 2006a. More is less: agricultural impacts on the N cycle in Argentina. Biogeochemistry 79:45-60.
Austin, A., O. E. Sala, and R. B. Jackson. 2006b. Inhibition of nitrification alters carbon turnover in the Patagonian steppe. Ecosystems 9:1257-1265.
Ayres, E., H. Steltzer, S. Berg, and D. H. Wall. 2009. Soil biota accelerate decomposition in high-elevation forests by specializing in the breakdown of litter produced by the plant species above them. Journal of Ecology 97:901-912.
Banning, N. C., D. B. Gleeson, A. H. Grigg, C. D. Grant, G. L. Andersen, E. L. Brodie, and D. V. Murphy. 2011. Soil microbial community successional patterns during forest ecosystem restoration. Applied and Environmental Microbiology 77:6158-6164.
Bardgett, R. D., W. D. Bowman, R. Kaufmann, and S. K. Schmidt. 2005. A temporal approach to linking aboveground and belowground ecology. Trends in Ecology & Evolution 20:634-641.
Bever, J. D. 1994. Feeback between plants and their soil communities in an old field community. Ecology 75:1965-1977.
Bever, J. D. 2003. Soil community feedback and the coexistence of competitors: conceptual frameworks and empirical tests. New phytologist 157:465-473.
130
Bever, J. D., I. A. Dickie, E. Facelli, J. M. Facelli, J. Klironomos, M. Moora, M. C. Rillig, W. D. Stock, M. Tibbett, and M. Zobel. 2010. Rooting theories of plant community ecology in microbial interactions. Trends in Ecology & Evolution 25:468-478.
Bever, J. D., K. M. Westover, and J. Antonovics. 1997. Incorporating the soil community into plant population dynamics: the utility of the feedback approach. Journal of Ecology 85:561-573.
Boeken, B., C. Ariza, Y. Gutterman, and E. Zaady. 2004. Environmental factors affecting dispersal, germination and distribution of Stipa capensis in the Negev Desert, Israel. Ecological Research 19:533-540.
Bonanomi, G., F. Giannino, and S. Mazzoleni. 2005. Negative plant-soil feedback and species coexistence. Oikos 111:311-321.
Bonanomi, G. and S. Mazzoleni. 2005. Soil history affects plant growth and competitive ability in herbaceous species. Community ecology 6:23-28.
Bonet, A. 2004. Secondary succession of semi-arid Mediterranean old-fields in south-eastern Spain: insights for conservation and restoration of degraded lands. Journal of Arid Environments 56:213-233.
Bontemps, C., M. Toussaint, P.-V. Revol, L. Hotel, M. Jeanbille, S. Uroz, M.-P. Turpault, D. Blaudez, and P. Leblond. 2013. Taxonomic and functional diversity of Streptomyces in a forest soil. FEMS microbiology letters 342:157-167.
Boudsocq, S., A. Niboyet, J. C. Lata, X. Raynaud, N. Loeuille, J. Mathieu, M. Blouin, L. Abbadie, and S. Barot. 2012. Plant preference for ammonium versus nitrate: a neglected determinant of ecosystem functioning? American Naturalist 180:60-69.
Boyes, L., R. Gunton, M. Griffiths, and M. Lawes. 2011. Causes of arrested succession in coastal dune forest. Plant Ecology 212:21-32.
Bragg, L., G. Stone, M. Imelfort, P. Hugenholtz, and G. W. Tyson. 2012. Fast, accurate error-correction of amplicon pyrosequences using Acacia. Nature Methods 9:425-426.
Brooker, R. and T. Callaghan. 1998. The balance between positive and negative plant Interactions and its relationship to environmental gradients: A model. Oikos 81:196-207.
Brooker, R. W. 2006. Plant–plant interactions and environmental change. New Phytologist 171:271-284.
Brooker, R. W., F. T. Maestre, R. M. Callaway, C. L. Lortie, L. A. Cavieres, G. Kunstler, P. Liancourt, K. Tielboerger, J. M. J. Travis, F. Anthelme, C. Armas, L. Coll, E. Corcket, S. Delzon, E. Forey, Z. Kikvidze, J. Olofsson, F. I. Pugnaire, C. L. Quiroz, P. Saccone, K. Schiffers, M. Seifan, B. Touzard, and R. Michalet. 2008. Facilitation in plant communities: the past, the present, and the future. Journal of Ecology 96:18-34.
Buyer, J. S., D. P. Roberts, and E. Russek-Cohen. 1999. Microbial community structure and function in the spermosphere as affected by soil and seed type. Canadian Journal of Microbiology 45:138-144.
Callaway, R. M. 1995. Positive interactions among plants. Botanical Review 61:306-349. Callaway, R. M. 2007. Positive interactions and interdependence in plant communities. Springer,
Dordrecht. Callaway, R. M., R. W. Brooker, P. Choler, Z. Kikvidze, C. J. Lortie, R. Michalet, L. Paolini, F. I.
Pugnaire, B. Newingham, E. T. Aschehoug, C. Armas, D. Kikodze, and B. J. Cook. 2002. Positive interactions among alpine plants increase with stress. Nature 417:844-848.
Callaway, R. M. and F. I. Pugnaire. 2007. Facilitation in plant communities.in F. I. Pugnaire and F. Valladares, editors. Functional plant ecology. Taylor & Francis Group, New York.
Carrick, P. and R. Krüger. 2007. Restoring degraded landscapes in lowland Namaqualand: Lessons from the mining experience and from regional ecological dynamics. Journal of Arid Environments 70:767-781.
131
Cernohlavkova, J., J. Jarkovsky, M. Negporova, and J. Hofman. 2009. Variability of soil microbial properties: Effects of sampling, handling and storage. Ecotoxicology and Environmental Safety 72:2102-2108.
Conant, R. T., P. Dalla-Betta, C. C. Klopatek, and J. A. Klopatek. 2004. Controls on soil respiration in semiarid soils. Soil Biology & Biochemistry 36:945-951.
Coombs, J. T. and C. M. M. Franco. 2003. Visualization of an endophytic Streptomyces species in wheat seed. Applied and Environmental Microbiology 69:4260-4262.
Cramer, V. A. and R. J. Hobbs. 2007. Old Fields: Dynamics and Restoration of Abandoned Farmland. Island Press, Washington, DC, USA.
Chancellor, W., R. Schafer, W. Gill, R. Wismer, H. Bowen, T. Garner, and D. Vaughan. 1994. Advances in soil dynamics. American Society of Agricultural Engineers, St Joseph, MI, USA.
Chanway, C. P., R. Turkington, and F. B. Holl. 1991. Ecological implications of specificity between plants and rhizosphere microorganisms Advances in Ecological Research 21:121-169.
Chapman, C. A., L. J. Chapman, L. Kaufman, and A. E. Zanne. 1999. Potential causes of arrested succession in Kibale National Park, Uganda: growth and mortality of seedlings. African Journal of Ecology 37:81-92.
Dana, E. D. and J. F. Mota. 2006. Vegetation and soil recovery on gypsum outcrops in semi-arid Spain. Journal of Arid Environments 65:444-459.
Day, M. E. 2000. Influence of temperature and leaf-to-air vapor pressure deficit on net photosynthesis and stomatal conductance in red spruce (Picea rubens). Tree Physiology 20:57-63.
De Mera, A. G. and J. A. V. Orellana. 2007. Cronosequences of vegetation - a bioclimatic theory for interpreting the patterns of relict vegetation types. Phytocoenologia 37:471-494.
Di Rienzo, J. A., F. Casanoves, M. G. Balzarini, L. Gonzalez, M. Tablada, and C. W. Robledo. 2013. InfoStat, versión 2013
Di Rienzo, J. A., A. W. Guzmán, and F. Casanoves. 2002. A multiple-comparisons method based on the distribution of the root node distance of a binary tree. Journal of Agricultural, Biological, and Environmental Statistics 7:129-142.
Díaz-Villa, M. D., T. Marañón, J. Arroyo, and B. Garrido. 2003. Soil seed bank and floristic diversity in a forest-grassland mosaic in southern Spain. Journal of Vegetation Science 14:701-709.
Domingo, F., L. Villagarcıa, A. J. Brenner, and J. Puigdefábregas. 1999. Evapotranspiration model for semi-arid shrub-lands tested against data from SE Spain. Agricultural and Forest Meteorology 95:67-84.
Duchaufour, P. 1995. Pedology: soil, vegetation and environment. 4 edition. Masson, Paris, FR. Dungait, J. A. J., S. J. Kemmitt, L. Michallon, S. Guo, and Q. Wen. 2011. Variable responses of the
soil microbial biomass to trace concentrations of 13C-labelled glucose, using 13C-PLFA analysis. European journal of soil science 62:117-126.
Dupont, C. L., J. Larsson, S. Yooseph, K. Ininbergs, J. Goll, J. Asplund-Samuelsson, J. P. McCrow, N. Celepli, L. Z. Allen, M. Ekman, A. J. Lucas, Å. Hagström, M. Thiagarajan, B. Brindefalk, A. R. Richter, A. F. Andersson, A. Tenney, D. Lundin, A. Tovchigrechko, J. A. A. Nylander, D. Brami, J. H. Badger, A. E. Allen, D. B. Rusch, J. Hoffman, E. Norrby, R. Friedman, J. Pinhassi, J. C. Venter, and B. Bergman. 2014. Functional tradeoffs underpin salinity-driven divergence in microbial community composition. PLoS ONE 9:e89549.
Edgar, R. C., B. J. Haas, J. C. Clemente, C. Quince, and R. Knight. 2011. UCHIME improves sensitivity and speed of chimera detection. Bioinformatics 27:2194-2200.
Espigares, T. and B. Peco. 1993. Mediterranean pasture dynamics: the role of germination. Journal of Vegetation Science 4:189-194.
FAO. 2010. Land Degradation Assesment in Drylands-LADA. Fierer, N., M. A. Bradford, and R. B. Jackson. 2007. Toward an ecological classification of soil
bacteria. Ecology 88:1354-1364.
132
Fierer, N., D. Nemergut, R. Knight, and J. Craine. 2010. Changes through time: integrating microorganisms into the study of succession. Research in microbiology 161:635-642.
Fischer, R. and N. C. Turner. 1978. Plant productivity in the arid and semiarid zones. Annual Review of Plant Physiology 29:277-317.
Flores, J. and E. Jurado. 2003. Are nurse-protege interactions more common among plants from arid environments? Journal of Vegetation Science 14:911-916.
Flowers, T. J., P. F. Troke, and A. R. Yeo. 1977. The mechanism of salt tolerance in halophytes. Annual Review of Plant Physiology 28:89-121.
Foster, B. L. and D. Tilman. 2000. Dynamic and static views of succession: Testing the descriptive power of the chronosequence approach. Plant Ecology 146:1-10.
Franco, A. C. and P. S. Nobel. 1989. Effect of nurse plants on the microhabitat and growth of Cacti. Journal of Ecology 77:870-886.
Gałecki, A. and T. Burzykowski. 2013. Linear Mixed-Effects Models Using R: A Step-by-Step Approach. Springer.
Girvan, M., J. Bullimore, J. Pretty, A. M. Osborn, and A. Ball. 2003. Soil type is the primary determinant of the composition of the total and active bacterial communities in arable soils. Applied and Environmental Microbiology 69:1800-1809.
González, J. L. and A. Chueca. 2010. C4 y CAM: características generales y uso en programas de desarrollo de tierras áridas y semiáridas Consejo Superior de Investigaciones científicas. Fundación Ramón Areces, Madrid.
Griffiths, M., M. Lawes, and Z. Tsvuura. 2007. Understorey gaps influence regeneration dynamics in subtropical coastal dune forest. Plant Ecology 189:227-236.
Grime, J. P. 1983. Plant Strategies and Vegetation Processes. Books on Demand. Grime, J. P. 2002. Plant strategies, vegetation processes, and ecosystem properties. 2 edition.
Wiley, New Jersey. Griscom, B. W. and P. M. S. Ashton. 2003. Bamboo control of forest succession: Guadua
sarcocarpa in Southeastern Peru. Forest Ecology and Management 175:445-454. Gundale, M. J., P. Kardol, M.-C. Nilsson, U. Nilsson, R. W. Lucas, and D. A. Wardle. 2014.
Interactions with soil biota shift from negative to positive when a tree species is moved outside its native range. New phytologist 202:415-421.
Haase, P., F. Pugnaire, E. M. Fernandez, J. Puigdefabregas, E. Fernández, J. Puigdefábregas, S. C. Clark, and L. D. Incoll. 1996. An investigation of rooting depth of the semiarid shrub Retama sphaerocarpa (L.) Boiss. by labelling of ground water with a chemical tracer. Journal of Hydrology 177:23-31.
Hammer, Ø., D. A. T. Harper, and P. D. Ryan. 2001. PAST: Paleontological statistics software package for education and data analysis. Palaeontologia Electronica 4:9.
Hasegawa, P. M., R. A. Bressan, J. K. Zhu, and H. J. Bohnert. 2000. Plant cellular and molecular responses to high salinity. Annual Review of Plant Physiology and Plant Molecular Biology 51:463-499.
Hill, J. D. and J. A. Silander. 2001. Distribution and dynamics of two ferns: Dennstaedtia punctilobula (Dennstaedtiaceae) and Thelypteris noveboracensis (Thelypteridaceae) in a Northeast mixed hardwoods–hemlock forest. American Journal of Botany 88:894-902.
Holmgren, M. 2000. Combined effects of shade and drought tulip poplar seedlings: Trade-off in tolerance or facilitation? Oikos 90:67-78.
Hortal, S., F. Bastida, C. Armas, Y. M. Lozano, J. L. Moreno, C. García, and F. I. Pugnaire. 2013. Soil microbial community under a nurse-plant species changes in composition, biomass and activity as the nurse grows. Soil Biology & Biochemistry 64:139-146.
IPCC. 2007. Fourth assessment report of the intergovernmental panel on climate change. Cambridge University Press, Cambridge, United Kingdom
Jangid, K., M. A. Williams, A. J. Franzluebbers, T. M. Schmidt, D. C. Coleman, and W. B. Whitman. 2011. Land-use history has a stronger impact on soil microbial community composition
133
than aboveground vegetation and soil properties. Soil Biology & Biochemistry 43:2184-2193.
Jankju, M. 2013. Role of nurse shrubs in restoration of an arid rangeland: Effects of microclimate on grass establishment. Journal of Arid Environments 89:103-109.
Jha, B., I. Gontia, and A. Hartmann. 2012. The roots of the halophyte Salicornia brachiata are a source of new halotolerant diazotrophic bacteria with plant growth-promoting potential. Plant and Soil 356:265-277.
Jiang, H., Q. Huang, S. Deng, H. Dong, and B. Yu. 2010. Planktonic actinobacterial diversity along a salinity gradient of a river and five lakes on the Tibetan Plateau. Extremophiles 14:367-376.
Jordano, P. and J. A. Godoy. 2002. Frugivore-generated seed shadows: a landscape view of demographic and genetic effects. Cabi Publishing.
Kandeler, E. and H. Gerber. 1988. Short-term assay of soil urease activity using colorimetric determination of ammonium. Biology and Fertility of Soils 6:68-72.
Kardol, P., T. M. Bezemer, and W. H. Van der Putten. 2006. Temporal variation in plant-soil feedback controls succession. Ecology Letters 9:1080-1088.
Kardol, P., N. J. Cornips, M. M. L. Van Kempen, J. M. T. Bakx-Schotman, and W. H. Van der Putten. 2007. Microbe-mediated plant-soil feedback causes historical contingency effects in plant community assembly. Pages 147-162 Ecological Monographs.
Kardol, P., G. B. De Deyn, E. Laliberte, P. Mariotte, and C. V. Hawkes. 2013. Biotic plant-soil feedbacks across temporal scales. Journal of Ecology 101:309-315.
Keddy, P. A. 2001. Competition. Kluwer Academic, Dordrecht. Kersters, K., P. De Vos, M. Gillis, J. Swings, P. Vandamme, and E. Stackebrandt, editors. 2006.
Introduction to the Proteobacteria. Springer, New York. Klironomos, J. 2002. Feedback with soil biota contributes to plant rarity and invasiveness in
communities. Nature 417:67-70. Köberl, M., E. M. Ramadan, M. Adam, M. Cardinale, J. Hallmann, H. Heuer, K. Smalla, and G.
Berg. 2013. Bacillus and streptomyces were selected as broad-spectrum antagonists against soilborne pathogens from arid areas in Egypt. FEMS microbiology letters 342:168-178.
Kowalchuk, G. A., D. Buma, W. de Boer, P. L. Klinkhamer, and J. van Veen. 2002. Effects of above-ground plant species composition and diversity on the diversity of soil-borne microorganisms. Antonie van Leeuwenhoek 81:509-520.
Kremer, R. J. 1993. Management of weed seed banks with microorganisms. Ecological applications 3:42-52.
Kulmatiski, A. and K. H. Beard. 2008. Decoupling plant-growth from land-use legacies in soil microbial communities. Soil Biology & Biochemistry 40:1059-1068.
Kuramae, E., H. Gamper, J. Van Veen, and G. Kowalchuk. 2011. Soil and plant factors driving the community of soil-borne microorganisms across chronosequences of secondary succession of chalk grasslands with a neutral pH. FEMS Microbiology Ecology 77:285-294.
Lambers, J. H. R., W. S. Harpole, D. Tilman, J. Knops, and P. B. Reich. 2004. Mechanisms responsible for the positive diversity–productivity relationship in Minnesota grasslands. Ecology Letters 7:661-668.
Lasanta, T. 2012. Complex land cover change processes in semiarid Mediterranean regions: An approach using Landsat images in northeast Spain. Remote sensing of environment 124:1-14.
Lázaro, R., F. S. Rodrigo, L. Gutierrez, F. Domingo, and J. Puigdefabregas. 2001. Analysis of a 30-year rainfall record (1967-1997) in semi-arid SE Spain for implications on vegetation. Journal of Arid Environments 48:373-395.
134
Lipson, D. A., C. W. Schadt, and S. K. Schmidt. 2002. Changes in soil microbial community structure and function in an alpine dry meadow following spring snow melt. Microbial Ecology 43:307-314.
Lopez-Velasco, G., P. A. Carder, G. E. Welbaum, and M. A. Ponder. 2013. Diversity of the spinach (Spinacia oleracea) spermosphere and phyllosphere bacterial communities. FEMS microbiology letters 346:146-154.
Loreau, M. 2001. Microbial diversity, producer-decomposer interactions and ecosystem processes: a theoretical model. Proceedings of the Royal Society Biological Sciences 268:303-309.
Loreau, M. and A. Hector. 2001. Partitioning selection and complementarity in biodiversity experiments. Nature 412:72-76.
Lucas-Borja, M. E., C. Wic-Baena, J. L. Moreno, T. Dadi, and C. García. 2011. Microbial activity in soils under fast-growing Paulownia (Paulownia elongata x fortunei) plantations in Mediterranean areas. Applied Soil Ecology 51:42-51.
Maestre, F. T. and J. Cortina. 2005. Remnant shrubs in Mediterranean semi-arid steppes: effects of shrub size, abiotic factors and species identity on understorey richness and occurrence. Acta Oecologica-International Journal of Ecology 27:161-169.
Mallik, A. U. 2003. Conifer Regeneration Problems in Boreal and Temperate Forests with Ericaceous Understory: Role of Disturbance, Seedbed Limitation, and Keytsone Species Change. Critical Reviews in Plant Sciences 22:341-366.
Martínez-García, L. B., C. Armas, J. d. D. Miranda, F. M. Padilla, and F. I. Pugnaire. 2011. Shrubs influence arbuscular mycorrhizal fungi communities in a semi-arid environment. Soil Biology & Biochemistry 43:682-689.
McCluney, K. E., J. Belnap, S. L. Collins, A. L. González, E. M. Hagen, J. Nathaniel Holland, B. P. Kotler, F. T. Maestre, S. D. Smith, and B. O. Wolf. 2012. Shifting species interactions in terrestrial dryland ecosystems under altered water availability and climate change. Biological Reviews 87:563-582.
McLendon, T. and E. F. Redente. 1992. Effects of nitrogen limitation on species replacement dynamics during early secondary succession on a semiarid sagebrush site. Oecologia 91:312-317.
MEA. 2005. Ecosystems and human well-being: Desertification Synthesis. World Resources Institute, Washington, DC.
Meisner, A., G. De Deyn, W. de Boer, and W. H. Van der Putten. 2013. Soil biotic legacy effects of extreme weather events influence plant invasiveness. Proceedings of the National Academy of Sciences of the United States of America 110:9835-9838.
Miranda, J. D., F. M. Padilla, and F. I. Pugnaire. 2004. Sucesión y restauración en ambientes semiáridos. Ecosistemas 13:55-58.
Miransari, M. and D. L. Smith. 2014. Plant hormones and seed germination. Environmental and Experimental Botany 99:110-121.
Mitchell, A. 1999. The ESRI Guide to GIS Analysis: Geographic Patterns and Relationships. ESRI Press, Redlands, California, USA.
Mitchell, R. J., A. J. Hester, C. D. Campbell, S. J. Chapman, C. M. Cameron, R. L. Hewison, and J. M. Potts. 2012. Explaining the variation in the soil microbial community: Do vegetation composition and soil chemistry explain the same or different parts of the microbial variation? Plant and Soil 351:355-362.
Moro, M. J., F. I. Pugnaire, P. Haase, and J. Puigdefábregas. 1997. Mechanisms of interaction between a leguminous shrub and its understorey in a semi-arid environment. Ecography 20:175-184.
Muller, C. H. 1940. Plant succession in the Larrea-Flourensia climax. Ecology 21:206-212. Nedjimi, B. 2013. Effect of salinity and temperature on germination of Lygeum spartum.
Agricultural Research 2:340-345.
135
Nelson, E. B. 2004. Microbial dynamics and interactions in the spermosphere. Annual Review of Phytopathology 42:271-309.
Nemergut, D., S. Anderson, C. Cleveland, A. Martin, and A. Miller. 2007. Microbial community succession in an unvegetated, recently deglaciated soil. Microbial Ecology 53:110-122.
Niering, W. A., R. H. Whittaker, and C. H. Lowe. 1963. The Saguaro: A population in relation to environment. Science 142:15-23.
Otto, R., B. O. Krusi, C. A. Burga, and J. M. Fernandez Palacios. 2006. Old-field succession along a precipitation gradient in the semi-arid coastal region of Tenerife. Journal of Arid Environments 65:156-178.
Padilla, F. M., R. Ortega, J. Sanchez, and F. I. Pugnaire. 2009. Rethinking species selection for restoration of arid shrublands. Basic and applied ecology 10:640-647.
Padilla, F. M. and F. I. Pugnaire. 2007. Rooting depth and soil moisture control Mediterranean woody seedling survival during drought. Functional ecology 21:489-495.
Peinado, M., F. Alcaraz, and J. M. Martínez-Parra. 1992. Vegetation of Southeastern Spain. Cramer, J. , Berlin, Germany.
Pendergast, T. H. t., D. J. Burke, and W. P. Carson. 2013. Belowground biotic complexity drives aboveground dynamics: a test of the soil community feedback model. New phytologist 197:1300-1310.
Pérez Pujalte, A., C. Oyonarte, J. L. García-Chicano, R. Burgos, M. C. Quesada, J. L. Guirado, and J. L. Diaz. 1987. Mapa de Suelos de Tabernas a escala 1:100.000. Proyecto LUCDEME. Revisatlas, Madrid, Spain.
Pimm, S. L., G. J. Russell, J. L. Gittleman, and T. M. Brooks. 1995. The future of biodiversity. Science 269:347-350.
Pinheiro, J. C. and D. M. Bates. 2000. Mixed-Effects Models in S and S-PLUS. Springer, New York. Polz, M. F. and C. M. Cavanaugh. 1998. Bias in template-to-product ratios in multitemplate PCR.
Applied and Environmental Microbiology 64:3724-3730. Porta-Casanellas, J., M. Lopez-Acevedo, and R. Rodriguez-Ochoa. 1985. Técnicas y experimentos
en edafología. Universitat Politecnica de Catalunya, Lleida. Porta-Casanellas, J., M. López-Acevedo, and C. Roquero de Laburu. 2003. Edafología para la
agricultura y el medio ambiente. Ediciones Mundi Prensa, Madrid. Prieto, I., C. Armas, and F. I. Pugnaire. 2012. Water release through plant roots: new insights
into its consequences at the plant and ecosystem level. New phytologist 193:830-841. Prieto, I., Z. Kikvidze, and F. I. Pugnaire. 2010. Hydraulic lift: Soil processes and transpiration in
the Mediterranean leguminous shrub Retama sphaerocarpa (L.) Boiss. Plant and Soil 329:447-456.
Pugnaire, F. I., C. Armas, and F. T. Maestre. 2011. Positive plant interactions in the Iberian Southeast: Mechanisms, environmental gradients, and ecosystem function. Journal of Arid Environments 75:1310-1320.
Pugnaire, F. I., C. Armas, and F. Valladares. 2004. Soil as a mediator in plant-plant interactions in a semi-arid community. Journal of Vegetation Science 15:85-92.
Pugnaire, F. I. and P. Haase. 1996. Comparative physiology and growth of two perennial tussock grass species in a semi-arid environment. Annals of botany 77:81-86.
Pugnaire, F. I., P. Haase, and J. Puigdefábregas. 1996a. Facilitation between Higher Plant Species in a Semiarid Environment. Ecology 77:1420-1426.
Pugnaire, F. I., P. Haase, J. Puigdefabregas, M. Cueto, and S. C. Clark. 1996b. Facilitation and succession under the canopy of a leguminous shrub, Retama sphaerocarpa, in a semi-arid environment in south-east Spain. Oikos 76:455-464.
Pugnaire, F. I. and R. Lázaro. 2000. Seed bank and understorey species composition in a semi-arid environment: The effect of shrub age and rainfall. Annals of botany 86:807-813.
Puigdefabregas, J., A. Sole, L. Gutierrez, G. del Barrio, and M. Boer. 1999. Scales and processes of water and sediment redistribution in drylands: results from the Rambla Honda field site in Southeast Spain. Earth-Science Reviews 48:39-70.
136
Puigdefábregas, J. A., J. M.; Delgado, L.; Domingo, F.; Cueto, M.; Gutiérrez, L.; Lázaro, R.; Nicolau, J. M.; Sánchez, G.; Solé, A.; Vidal, S.; Aguilera, C.; Brenner, A.; Clark, S.; Incoll, L. 1996. The Rambla Honda field site: interactions of soil and vegetation along a catena in semi-arid Southeast Spain. Pages 137-168 in C. J. T. Brandt, J. B. , editor. Mediterranean desertification and land use.
Pulliam, H. R. 1996. Sources and sinks: empirical evidence and population consequences. University of Chicago Press.
Ramette, A. 2007. Multivariate analyses in microbial ecology. FEMS Microbiology Ecology 62:142-160.
Rayner, A. D. M. and L. Boddy. 1988. Fungal decomposition of wood: Its biology and ecology. Wiley.
Renne, I. J., B. T. Sinn, G. W. Shook, D. M. Sedlacko, J. R. Dull, D. Villarreal, and J. L. Hierro. 2014. Eavesdropping in plants: delayed germination via biochemical recognition. Journal of Ecology 102:86-94.
Rey, P. J. and J. M. Alcántara. 2000. Recruitment dynamics of a fleshy-fruited plant (Olea europaea): connecting patterns of seed dispersal to seedling establishment. Journal of Ecology 88:622-633.
Reynolds, J., D. M. Stafford Smith, E. Lambin, B. L. Turner, M. Mortimore, T. E. Downing, E. Huber-Sannwald, H. Dowlatabadi, R. Fernández, J. Herrick, E. Huber Sannwald, H. Jiang, R. Leemans, T. Lynam, F. Maestre, M. Ayarza, and B. Walker. 2007. Global desertification: building a science for dryland development. Science 316:847-851.
Roberts, H. A. and P. M. Feast. 1972. Fate of seeds of some annual weeds in different depths of cultivated and undisturbed soil Weed Research 12:316-324.
Rodríguez-Echeverría, S., C. Armas, N. Piston, S. Hortal, and F. I. Pugnaire. 2013.
A role for below-ground biota in plant-plant facilitation. Journal of Ecology 101:1420-1428. Rodríguez-Echeverría, S. and M. A. Pérez-Fernández. 2003. Soil fertility and herb facilitation
mediated by Retama sphaerocarpa. Journal of Vegetation Science 14:807-814. Roem, W. J., H. Klees, and F. Berendse. 2002. Effects of nutrient addition and acidification on
plant species diversity and seed germination in heathland. Journal of Applied Ecology 39:937-948.
Rowlands, P. G. 1980. Recovery, succession, and revegetation in the Mojave Desert. The Effects of disturbance on desert soils, vegetation, and community processes with emphasis on off-road vehicles: a critical review. Bureau of Land Management, California, USA.
Royo, A. A. and W. P. Carson. 2006. On the formation of dense understory layers in forests worldwide: consequences and implications for forest dynamics, biodiversity, and succession. Canadian Journal of Forest Research 36:1345-1362.
Rucks, L., F. García, A. Kaplán, J. Ponce de León, and M. Hill. 2004. Propiedades físicas del suelo. Facultad de Agronomía, Universidad de la República Montevideo.
Ruiz Téllez, T., P. Escobar García, and J. L. Pérez Chiscano. 2007. La Serena and surrounding mountains. Flora and vegetation Consejería de Agricultura, Desarrollo Rural, Medio Ambiente y Energía. Junta de Extremadura. www.extremambiente.es., Badajoz.
Ruppel, S., P. Franken, and K. Witzel. 2013. Properties of the halophyte microbiome and their implications for plant salt tolerance. Functional plant biology 40:940-951.
Sage, R. F. 2004. The evolution of C4 photosynthesis. New phytologist 161:341-370. Saharan, B. S. and V. Nehra. 2011. Plant growth promoting rhizobacteria: A critical review Life
Sciences and Medicine Research 2011: LSMR-21. http://astonjournals.com/lsmr. Sala, O. E., F. S. Chapin Iii, J. J. Armesto, E. Berlow, J. Bloomfield, R. Dirzo, E. Huber-Sanwald, L. F.
Huenneke, R. B. Jackson, A. Kinzig, R. Leemans, D. M. Lodge, H. A. Mooney, M. Oesterheld, N. L. Poff, M. T. Sykes, B. H. Walker, M. Walker, and D. H. Wall. 2000. Global biodiversity scenarios for the year 2100. Science 287:1770-1774.
137
Scott, A. J. and J. W. Morgan. 2012. Recovery of soil and vegetation in semi-arid Australian old fields. Journal of Arid Environments 76:61-71.
Schlatter, D. C., A. L. DavelosBaines, K. Xiao, and L. L. Kinkel. 2013. Resource use of soilborne Streptomyces varies with location, phylogeny, and nitrogen amendment. Microbial Ecology 66:961-971.
Schöb, C., C. Armas, and F. I. Pugnaire. 2013. Direct and indirect interactions co-determine species composition in nurse plant systems. Oikos 122:1371-1379.
Schumacher, B. A. 2002. Methods for the determination of total organic carbon (TOC) in soils and sediments. Ecological Risk Assessment Support Center Office of Research and Development US, Las vegas, USA.
Selosse, M.-A., F. Richard, X. He, and S. W. Simard. 2006. Mycorrhizal networks: des liaisons dangereuses? Trends in Ecology and Evolution 21:621-628.
Sessitsch, A., A. Weilharter, M. H. Gerzabek, H. Kirchmann, and E. Kandeler. 2001. Microbial population structures in soil particle size fractions of a long-term fertilizer field experiment. Applied and Environmental Microbiology 67:4215-4224.
Shi, W., T. Takano, and S. Liu. 2012. Isolation and characterization of novel bacterial taxa from extreme alkali-saline soil. World Journal of Microbiology and Biotechnology 28:2147-2157.
Sim, K., M. J. Cox, H. Wopereis, R. Martin, J. Knol, M.-S. Li, W. O. C. M. Cookson, M. F. Moffatt, and J. S. Kroll. 2012. Improved Detection of Bifidobacteria with Optimised 16S rRNA-Gene Based Pyrosequencing. PLoS ONE 7.
Smith, S. E. and D. J. Read. 2010. Mycorrhizal Symbiosis. Elsevier Science. Stuefer, J. F., B. Erschbamer, H. Huber, and J.-I. Suzuki. 2001. The ecology and evolutionary
biology of clonal plants: an introduction to the proceedings of Clone-2000. Evolutionary Ecology 15:223-230.
Suela Silva, M., A. Naves Sales, K. Teixeira Magalhaes-Guedes, D. Ribeiro Dias, and R. Schwan. 2013. Brazilian Cerrado soil Actinobacteria ecology. BioMed Research International 2013:503805.
Tarafdar, J. C. and N. Claassen. 1988. Organic phosphorus compounds as a phosphorus source for higher plants through the activity of phosphatases produced by plant roots and microorganisms. Biology and Fertility of Soils 5:308-312.
Tarlera, S., K. Jangid, A. Ivester, W. Whitman, and M. Williams. 2008. Microbial community succession and bacterial diversity in soils during 77,000 years of ecosystem development. FEMS Microbiology Ecology 64:129-140.
Tedersoo, L., R. H. Nilsson, K. Abarenkov, T. Jairus, A. Sadam, I. Saar, M. Bahram, E. Bechem, G. Chuyong, and U. Kõljalg. 2010. 454 Pyrosequencing and Sanger sequencing of tropical mycorrhizal fungi provide similar results but reveal substantial methodological biases. New phytologist 188:291-301.
Tilman, D. 1982. Resource competition and community structure. Princeton University Press, New Jersey.
Tilman, D. 1988. Plant Strategies and the Dynamics and Structure of Plant Communities. Princeton University Press.
Tilman, D., D. Wedin, and J. Knops. 1996. Productivity and sustainability influenced by biodiversity in grassland ecosystems. Nature 379:718-720.
Tirado, R. and F. I. Pugnaire. 2005. Community structure and positive interactions in constraining environments. Oikos 111:437-444.
Tortora, G. J., B. R. Funke, and C. L. Case. 2007. Introducción a la Microbiología. Editorial Médica Panamericana, Buenos Aires, Argentina.
Tscherko, D., U. Hammesfahr, G. Zeltner, E. Kandeler, and R. Bocker. 2005. Plant succession and rhizosphere microbial communities in a recently deglaciated alpine terrain. Basic and applied ecology 6:367-383.
138
Upadhyay, S. K., J. S. Singh, and D. P. Singh. 2011. Exopolysaccharide-producing plant growth-promoting rhizobacteria under salinity condition. Pedosphere 21:214-222.
Urich, P. B. 2002. Land use in karst terrain: review of impacts of primary activities on temperate karst ecosystems. Science Publishing, Wellington, New Zealand.
Valdano, S. and J. A. Di Rienzo. 2008. Discovering meaningful groups in hierarchical cluster analysis. An extension to the multivariate case of a multiple comparison method based on cluster analysis. InterStat. Available from http://interstat.statjournals.net/YEAR/2007/abstracts/0704002.php?Name=704002.
Van de Voorde, T. F. J., W. H. Van der Putten, and T. M. Bezemer. 2012. Soil inoculation method determines the strength of plant-soil interactions. Soil Biology & Biochemistry 55:1-6.
van der Heijden, M. G. A., R. D. Bardgett, and N. M. van Straalen. 2008. The unseen majority: soil microbes as drivers of plant diversity and productivity in terrestrial ecosystems. Ecology Letters 11:296-310.
Van Der Heijden, M. G. A. and T. R. Horton. 2009. Socialism in soil? the importance of mycorrhizal fungal networks for facilitation in natural ecosystems. Journal of Ecology 97:1139-1150.
Van der Putten, W. H. 2003. Plant defense belowground and spatiotemporal processes in natural vegetation. Ecology 84:2269-2280.
Van der Putten, W. H. 2009. A multitrophic perspective on functioning and evolution of facilitation in plant communities. Journal of Ecology 97:1131-1138.
Van der Putten, W. H., R. D. Bardgett, J. D. Bever, T. M. Bezemer, B. B. Casper, T. Fukami, P. Kardol, J. N. Klironomos, A. Kulmatiski, J. A. Schweitzer, K. N. Suding, T. F. J. Van de Voorde, and D. A. Wardle. 2013. Plant–soil feedbacks: the past, the present and future challenges. Journal of Ecology 101:265-276.
Van der Putten, W. H. and B. A. M. Peters. 1997. How soil-borne pathogens may affect plant competition. Ecology 78:1785-1795.
Van Der Putten, W. H., C. Van Dijk, and B. A. M. Peters. 1993. Plant-specific soil-borne diseases contribute to succession in foredune vegetation. Nature 362:53-56.
Vitousek, P. M. 1994. Beyond global warming: Ecology and global change Ecology 75:1861-1876. Vonmersi, W. and F. Schinner. 1991. An improved and accurate method for determining the
dehydrogenase-activity of soils with iodonitrotetrazolium chloride. Biology and Fertility of Soils 11:216-220.
Wagg, C., S. F. Bender, F. Widmer, and M. G. A. van der Heijden. 2014. Soil biodiversity and soil community composition determine ecosystem multifunctionality. Proceedings of the National Academy of Sciences.
Walker, L. R., J. Walker, and R. J. Hobbs. 2007. Linking restoration and ecological succession. Springer, New York.
Wang, Q., G. Garrity, J. Tiedje, and J. Cole. 2007. Naive Bayesian classifier for rapid assignment of rRNA sequences into the new bacterial taxonomy. Applied and Environmental Microbiology 73:5261-5267.
Wardle, D. A., R. D. Bardgett, J. N. Klironomos, H. Setälä, W. H. Van Der Putten, and D. H. Wall. 2004. Ecological linkages between aboveground and belowground biota. Science 304:1629-1633.
Went, F. W. 1973. Competition among plants. Proceedings of the National Academy of Sciences 70:585-590.
Wright, E., L. S. Yilmaz, and D. Noguera. 2012. DECIPHER, a search-based approach to chimera identification for 16S rRNA sequences. Applied and Environmental Microbiology 78:717-725.
Yang, L., N. Liu, H. Ren, and J. Wang. 2009. Facilitation by two exotic Acacia: Acacia auriculiformis and Acacia mangium as nurse plants in South China. Forest Ecology and Management 257:1786-1793.

139
Young, T. P. and E. Peffer. 2010. “Recalcitrant understory layers” revisited: arrested succession and the long life-spans of clonal mid-successional species. Canadian Journal of Forest Research 40:1184-1188.
Zhao, W. Z., H. L. Xiao, Z. M. Liu, and J. Li. 2005. Soil degradation and restoration as affected by land use change in the semiarid Bashang area, northern China. Catena 59:173-186.
Zhu, J.-K. 2001. Plant salt tolerance. Trends in Plant Science 6:66-71. Zou, C. B., P. W. Barnes, S. Archer, and C. R. McMurtry. 2005. Soil moisture redistribution as a
mechanism of facilitation in Savanna tree-shrub clusters. Oecologia 145:32-40.