Embed Size (px)
Citation preview
International Journal of Coal Geology 156 (2016) 25–35
Contents lists available at ScienceDirect
International Journal of Coal Geology
j ourna l homepage: www.e lsev ie r .com/ locate / i j coa lgeo
Predicting the proportion of free and adsorbed gas by isotopicgeochemical data: A case study from lower Permian shale in the southernNorth China basin (SNCB)
Yang Liu a, Jinchuan Zhang a,b,⁎, Xuan Tang a
a School of Energy Resources, China University of Geosciences, 29 Xueyuan Road, Beijing 100083, Chinab Key Laboratory of Shale Gas Exploration and Evaluation, Ministry of Land and Resources, China University of Geosciences, 29 Xueyuan Road, Beijing 100083, China
⁎ Corresponding author at: School of Energy ReGeosciences, 29 Xueyuan Road, Beijing 100083, China.
E-mail address: [email protected] (J. Zhang).
http://dx.doi.org/10.1016/j.coal.2016.01.0110166-5162/© 2016 Elsevier B.V. All rights reserved.
a b s t r a c t
a r t i c l e i n f oArticle history:Received 2 November 2015Received in revised form 22 January 2016Accepted 24 January 2016Available online 26 January 2016
The alternating marine-terrigenous shale facies of the Lower Permian Taiyuan (P1t) formation and the LowerPermian Shanxi (P1s) formation in the north margin of the southern North China basin (SNCB) are characterizedby their high TOC values (1.76–5.09%), types II and III organic matter, and high Ro values (N3.0%). Geochemicalparameters of 12 gas samples from the Lower Permian shale formations from well Weican-1 were analyzed inthis study. The gases are dominated by methane, with small amounts of ethane, without propane and butane.Wetness of the gas is only 0.25–0.58% reflecting extremely high maturity of the source rock. The δ13C1 valuesrange from −31.6 ‰ to −26.8 ‰ and the δ13C2 values range from −35.9 ‰ to −33.2 ‰, the δ2HCH4 valuesrange from −221.1 ‰ to −187 ‰. Furthermore, carbon isotopic compositions of the alkane gases from theLower Permian shale are characterized by δ13C1 N δ13C2, this indicates that the gases released from Permianshale are of thermogenic origin and mostly sourced from the continental shale and coal measures, with minorcontribution from oil cracked gas from marine mudstones. Geochemical fractionation during the adsorption/desorption process of the shale systemmay play a significant part in influencing δ13C1 values of shale gas. The re-sults show that the δ13C1 becomes heavier with increasing degree of gas desorption. Based on isotope fraction-ation during desorption of gas in shales, an equation was established to estimate the proportion of free andadsorbed gas in shales using δ13C1 of shale gas. In comparison with other equations, this equation is based onthe direct data of gas desorption experiment to avoid the adsorbed gas content often exhibit maxima fromexcesssorption isotherms experiment. This method provides efficient way to understand the gas storage behavior inshales and broaden the application of gas isotope.
© 2016 Elsevier B.V. All rights reserved.
Keywords:Shale gasCarbon isotopeHydrogen isotopeSouthern North China basin
1. Introduction
Shale gas is one of the most important unconventional hydrocarbonresources in which natural gas is found as absorbed gas within organicmatter and on inorganic minerals, free gas within fractures and inter-granular porosity, and as well as dissolved gas in kerogen, oil andwater (Schettler and Parmely, 1990; Martini et al., 1998). Adsorbedgas may account for 20–85% of total gas in shale reservoirs (Hill andNelson, 2000). Thus unlike conventional gas accumulations, in whichgas is present mainly as free gas, or coalbed methane accumulations,where gas is considered to be mainly adsorbed, both of free gas andadsorbed gas may attribute to gas production from shales.
To understand gas occurrence and storage mechanism in shales is akey question for shale gas reservoir engineering. One commonly usedmethod is to use reservoir simulation for representation, however, this
sources, China University of
will require a reservoir simulator that faithfully represents the shalegas storage and flow behaviors. Moreover, because adsorbed gasmay take a longer time to transport through the matrix than free gas(e.g. Yuan et al., 2014), the contribution of adsorbed and free gas maybe even more complex.
Different stages of basin evolution directly control the developmentand distribution of organic-rich shale (Li et al., 2009). According to thedepositional environment, organic-rich shale can be divided into ma-rine shale, marine-terrigenous coal bed carbonaceous shale and conti-nental lacustrine derived shales (Zou et al., 2010). Coal bed shale(shale derived from mixed marine-terrigenous sources) was formedinmarine-terrigenous transitional deltaic facies, such as the Carbonifer-ous Benxi Formation and the Lower Permian Shanxi Formation–TaiyuanFormation in Ordos Basin, the Carboniferous–Permian in Junggar Basin,the Carboniferous–Permian in Tarim Basin, the Carboniferous–Permianin Northern China, and the Permian Longtan Formation in SouthernChina. It can also be a major source rock for large-scale oil/gas fields.For example, the Upper Paleozoic carbonaceous shale in Ordos Basin isthe major gas source rock for Sulige and other large gas fields and its
26 Y. Liu et al. / International Journal of Coal Geology 156 (2016) 25–35
environment of deposition was deltaic facies. The Triassic–Jurassic andTertiary developed several sets of carbonaceous shale, whichwere asso-ciatedwith coalmeasures of deltaic facies (Zou et al., 2010). Since the oiland gas exploration in the southern North China basin, previous studiesconfirmed that the coal bed shale from the Lower Permian whichformed in alternating marine-terrigenous deltaic facies are widely dis-tributed in this area. But shale gas exploration in this region has notachieved commercial progress due to complex geological conditionssuch as structural deformation in the southern North China basin. In2014, the vertical drills (well Weican-1 and Mouye-1) in the Permianshale firstly found shale gas in this region, which marks a major break-through in the exploration of alternating marine-terrigenous deltaicfacies shale gas in north China.
Natural gas from marine shale (shale gas derived from marine or-ganic matter) has recently gained significant success in the USA, and ittriggered a worldwide fever for shale hydrocarbon resources (Curtis,2002; Tang et al., 2014a, 2014b). In contrast, there has been littlework done and less attention paid to alternating marine-terrigenousdeltaic facies shale. In this paper, we present stable carbon and hydro-gen isotopes of alkane gases as a means to understand the geochemicalcharacteristics of gases from the lower Permian alternating marine-terrigenous deltaic facies shale in the north margin of the southernNorth China basin. In addition, the generation of shale gas follows amechanism that is similar to that of conventional gas, which meansthe origins of shale gas can also be biogenic, thermogenic or a mixtureof the two. In conventional gas reservoirs, the variation of gas isotopecomposition ismainly determined by kerogen isotope composition,ma-turity and charging efficiency. For shale gas, residual oil in shale mayconvert to gas and water may involve in this conversion. Productsfrom different chemical processes make the isotope composition devi-ate from conventional models. Therefore, the reasons for the geochem-ical particularities of shale gas may be mainly related to the storagestage. We have studied dynamic changes in the geochemical character-istics of shale gas (on the basis of the process of desorption) in order toimprove our understanding on the isotope variability of shale gas.Moreover, a simple two-end member mass balance model was pro-posed to estimate the relative proportion of free gas and adsorbed gasin desorbed gas by using carbon isotope of methane in different stagesof the desorption experiment.
2. Geological setting
The southern North China basin (SNCB) is one of theMeso-Cenozoicsuperimposed basin which is located in the south of North China plat-form. It is on the western side of the Tan–Lu fault, the northern side ofthe Qinling–Dabie orogenic belt and the eastern side of the westernHenan uplift zone (Lin et al., 2011). The tectonic evolution of thisbasin is controlled by the Qinling–Dabie orogenic belt and the Tan–Lufault zone and thus showing the NW-WNW tectonic pattern. From thenorth to the south, the southern North China basin can be divided intofive secondary tectonic units: the Kaifeng depression, Taikang uplift,Zhoukou depression, Changshan uplift and Xinyang–Hefei depression(Fig. 1). In addition, the secondary tectonic units in the basin can bedivided into some episodes of subsidence and uplift, the total area ofthe basin is 150000 km2 (Diao et al., 2011; Lin et al., 2011).
The SNCB is a part of theNorth China Craton Basin formedduring thelate Paleozoic. Affected by the sea level rise in Late Carboniferous, thestudy area began to accept marine derived sedimentation from a trans-gression, and the evolution process of the epicontinental sea to the con-tinental basin was started (Diao et al., 2011). The depositional processwas controlled by regional tectonic movement, and can be dividedinto three processes. First, the North China platform re-subsided uponentering the Late Carboniferous, and seawater intruded from the north-east to the southwest under the paleotopography background (i.e., highin the south and low in the north), forming the vast North China epicon-tinental sea basin. The Taiyuan formation, which consists of black shale,
coal, limestone and quartzose sandstone, was deposited in this environ-ment during the early Permian, with a thickness ranging from 30 to175 m. Second, the collision between the North China plate and theSiberia plate caused largescale tectonic movement and amarine regres-sion from north to south. The river-dominated shallow water delta,which was transitioned from an epicontinental sea via marine regres-sion, was a major depositional environment during the early Permian.The Shanxi formation, which consists of shale, coal, quartzose sand-stone, was deposited in this environment with thicknesses rangingfrom 50 to 130 m. Finally, the North China plate was again uplifted bysqueezing action during the late Permian, causing seawater to fullywithdraw from the North China platform, forming terrestrial depositionenvironment (Diao et al., 2011; Duan et al., 2002; Liu et al., 1999; Yuet al., 2005; Zhou et al., 2010).
The organicmatter of the two set of source rocks are type II to type IIIkerogen and dominated by type III kerogen (Dai, 2000; Dang et al.,2016). The TOC of the black mudstones from P1t and P1s coal-bearingmeasures ranges from 0.92% to 4.24% and from 0.44% to 5.10%, respec-tively (Dang et al., 2016). The maturity of the source rocks in the eastand south of the basin is relatively low, the vitrinite reflectance (Ro)values range from0.5% to 1.0% and from0.7% to 1.2%, respectively. How-ever, the source rocks in the north of the basin are in the over maturestage with the vitrinite reflectance values over 3.0% (Sun et al., 2014).
3. Samples and methods
In this study, four shale core samples from a depth of 2730–2762 m(WC-1, WC-2, WC-4, WC-6) investigated here were collected fromshale gas well Weican-1 in the north margin of the SNCB. Amongthem, sample WC-1 (2730 m) and WC-2 (2731 m) were from Shanxiformation, and sampleWC-4 (2758m) andWC-6 (2762m) from Taiyu-an formation. The samples are of 10 cm diameter, 4.5 kg, 4.5 kg, 2.97 kgand 4.21 kg inweight respectively. The TOC values of the four shale coresamples were 2.27%, 2.78%, 3.62%, 2.15% respectively, and the Ro were3.2%, 3.2%, 3.5%, 3.7% respectively. The high vitrinite reflectance values(Ro) presented here are also supported by previous studies, which re-ported that abnormally high thermal maturities (N3.0%) occur in thisarea, mainly caused by thermal events (Cheng et al., 2011; Wu et al.,2015; Xu et al., 2005, 2011; Zhao et al., 2011). Twelve gas sampleswere collected from the desorption of the above four core samples,and we collected gas samples at 20 °C, 90 °C and 120 °C for the gasreleasing process of each core sample. The molecular compositionof gas was performed at the Key Laboratory of Marine Reservoir Evolu-tion and Hydrocarbon Abundance Mechanism, China University ofGeosciences, Beijing. The stable carbon and hydrogen isotopes analyseswere performed at the Nuclear Industry Beijing Geological ResearchAnalysis and Test Research Centre (http://www.briug.cn/).
Desorbed gas content was quantified after the core sample recov-ered at the drilling site. It was placed as quickly as possible inside a her-metically sealed canister using quartz sand fill gaps and the volumes ofgas released inside the canister were periodically measured using agraduated cylinder at atmospheric pressure (Mavor and Nelson, 1997;Ma et al., 2015). The gas releasing process can be divided into threestages (Fig. 2), the amounts of gas released at room temperature of20 °Cwere small (stage 1). However, the amounts of gas released at res-ervoir temperature of 90 °C rapidly increased and the final stabilized(stage 2). A high temperature of 120 °C was used to expedite theadsorbed gas completely released (stage 3). Gas content of each stagedetermination finished when the released gas fell below 5 ml in 2 h.
The molecular composition of the gas samples was determined byAgilent 6890 N gas chromatograph (GC) equipped with a flame ioniza-tion detector and a thermal conductivity detector. Individual hydrocar-bon gas components (C1–C2) were separated using a capillary column(PLOT Al2O3 50 m × 0.53 mm). Nonhydrocarbon gases were separatedusing two capillary columns (PLOT Molsieve 5 Å 30 m × 0.53 mm,PLOT Q 30 m × 0.53 mm). The GC oven temperature was initially set
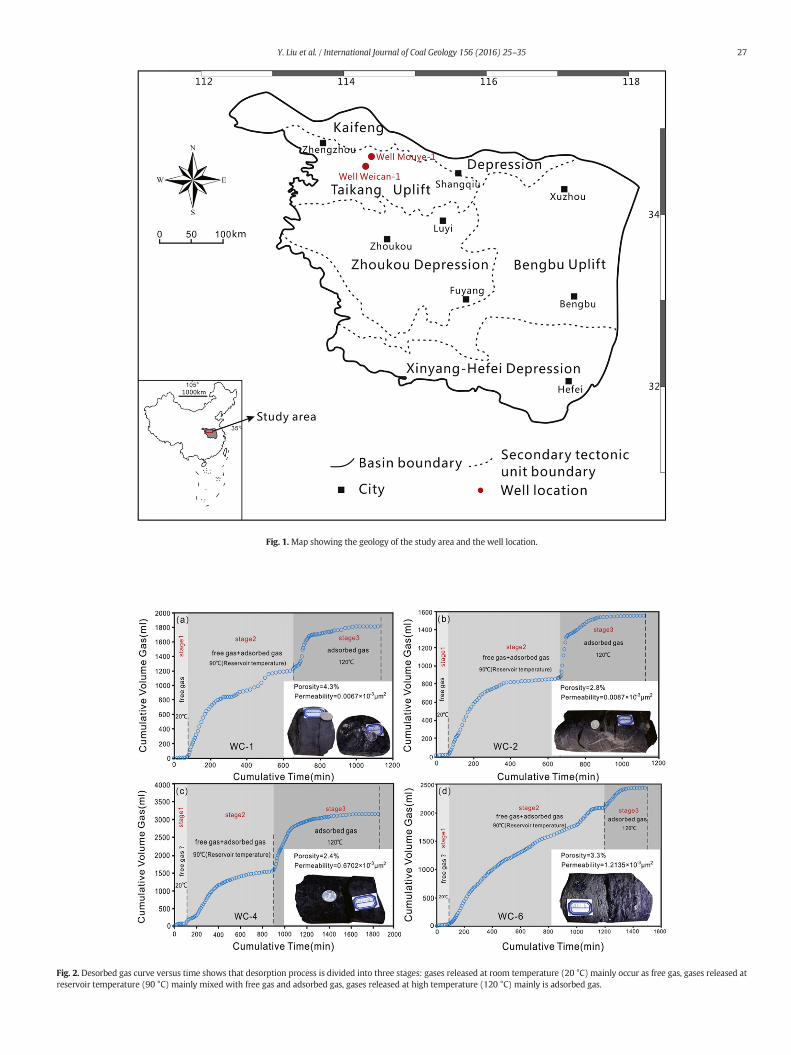
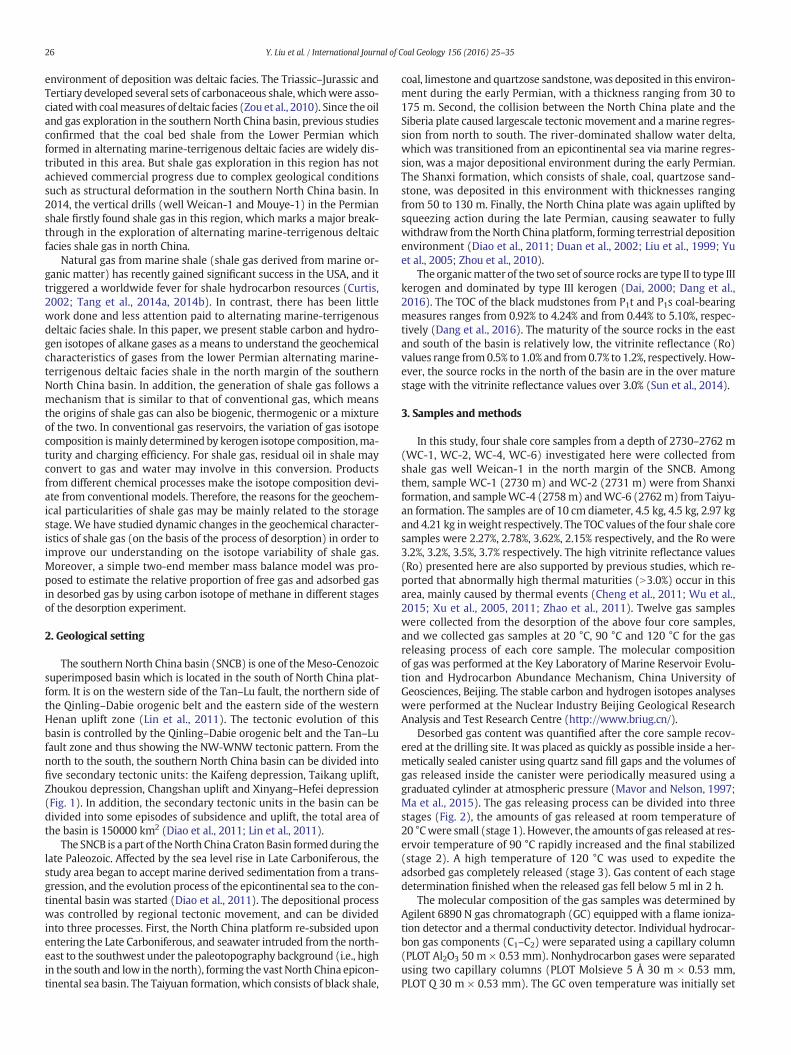
Fig. 1.Map showing the geology of the study area and the well location.
Fig. 2. Desorbed gas curve versus time shows that desorption process is divided into three stages: gases released at room temperature (20 °C) mainly occur as free gas, gases released atreservoir temperature (90 °C) mainly mixed with free gas and adsorbed gas, gases released at high temperature (120 °C) mainly is adsorbed gas.
27Y. Liu et al. / International Journal of Coal Geology 156 (2016) 25–35
Table 1Geochemical characteristics of shale gases released in the desorption experiments from the Lower Permian shale in the well Weican-1.
Sample Formation Depth(m) Desorption stage Temperature Gas composition (%) Wetness (%) δ13C(‰)VPDB δ2H(‰)VSMOW
CH4 C2H6 CO2 N2 CH4 C2H6 CH4
WC-1 P1s 2730 1 20 °C 84.60 n.d. 15.40 n.d. −31 n.d. −2112 90 °C 67.15 0.39 8.93 23.53 0.58 −30.2 −33.2 −2103 120 °C 47.75 0.28 34.24 17.74 0.58 −27.7 −33.2 −207
WC-2 P1s 2731 1 20 °C 67.31 n.d. 32.69 n.d. −31.6 n.d. −2212 90 °C 63.53 n.d. 12.50 23.96 −29.2 n.d. −2033 120 °C 51.93 0.22 33.63 14.22 0.42 −26.8 n.d. −199
WC-4 P1t 2758 1 20 °C 63.02 n.d. 11.87 25.10 −31.6 n.d. −1962 90 °C 76.22 0.27 9.18 14.33 0.35 −30.5 −35.9 −1953 120 °C 77.09 0.34 17.40 5.16 0.44 −29.7 −34.8 −187
WC-6 P1t 2762 1 20 °C 82.38 0.21 6.28 11.13 0.25 −29.9 −34.8 −1992 90 °C 88.59 0.26 7.63 3.52 0.29 −29.8 −34.1 −1953 120 °C 76.18 0.29 20.57 2.96 0.38 −29 −34.7 −192
Notes1. n.d. means not detected.2. P1S = Shanxi formation (Fm); P1t = Taiyuan Fm3. All the gas compositions (CH4, C2H6, N2, CO2) have made correction to eliminate the influence of the air.
Table 2Measured methane adsorption capacity for shale samples at 30 °C.
Sample Formation Depth(m) VL(m3/t) PL(MPa)
WC-1 P1s 2730 1.42 1.25WC-2 P1s 2731 1.52 1.71WC-4 P1t 2758 1.96 1.97WC-6 P1t 2762 1.10 1.64
28 Y. Liu et al. / International Journal of Coal Geology 156 (2016) 25–35
at 30 °C for 10 min, and then increased to 180 °C at 10 °C/min and heldat this temperature for 20–30 min. All the gas compositions have madeoxygen-free correction and the corresponding correction for nitrogen(Ni et al., 2013). Nitrogen was corrected for the presence of traces ofoxygen using the area ratio of nitrogen to oxygen peaks measured onair (Jenden et al., 2015).
Stable carbon isotope values were determined on a Finnigan MatDelta Plus mass spectrometer interfaced with a HP 5890II chromato-graph. Individual hydrocarbon gas components (C1–C4) and CO2 wereseparated on a gas chromatograph using a fused silica capillary column(PLOT Q 30m× 0.32mm). The GC ovenwas ramped from 35 °C to 80 °Cat 8 °C/min, then to 260 °C at 5 °C/min, andmaintained at the final tem-perature for 10 min. Stable carbon isotopic values are reported in theδ-notation in permil (‰) relative to VPDB. The measurement precisionwas estimated to be ±0.5 ‰ for δ13C (Ni et al., 2013; Dai et al., 2014a,2014b).
Stable hydrogen isotopes were measured on a Finnigan GC/TC/IRMSmass spectrometer, which consists of TraceGCUltra gas chromatograph(GC) interfaced with a micropyrolysis furnace (1450 °C) in line with aFinnigan MAT253 isotope ratio mass spectrometer. Gas componentswere separated on a HP-PLOT Q column (30 m × 0.32 mm × 20 μm)with a helium carrier gas at 1.5 ml/min. A split injection was used formethane with a split ratio of 1:7 at 40 °C. The sample introduction forethane and propane used non-split injectionmode. The GC oven temper-ature was initially set to 40 °C for 4 min, increases to 80 °C at 10 °C/min,then to 140 °C at 5 °C/min, and finally to 260 °C at 30 °C/min. The stablehydrogen isotopic values are reported in the δ-notation in permil (‰)relative to the international standard Vienna Standard Mean OceanWater (VSMOW). Precision for individual components in the molecularδ2H analysis is ±3 ‰ (Ni et al., 2013; Dai et al., 2014a, 2014b).
The methane adsorption isotherm was obtained at 30 °C and a hu-midity of 2.31% using the Schlumberger Terra Tek ISO-300 isothermalapparatus, with 99.99% methane as a carrier gas. The shale sampleswere crushed and sieved to less than 60 mesh particle size. Themoisture-equilibrated condition was achieved in an evacuated desicca-tor under controlled relative humidity (RH) conditions using saturatedsalt solutions of K2SO4 (97% RH). The detailed methane adsorptionexperimental procedure was described in detail by Ji et al. (2014).
4. Results
4.1. Molecular composition of shale gas
As shown in Table 1, all of the natural gases liberated in the desorp-tion experiments are dominated by methane, and small amounts of
ethane without propane and butane were detected. The non-hydrocarbon gases are mainly carbon dioxide and nitrogen without hy-drogen sulfide. For sample WC-1, the content of methane and ethanevaries from 84.60% to 47.75% and from 0% to 0.39%, respectively. Thecontents of carbon dioxide and nitrogen are from 8.93% to 34.24% andfrom0% to 23.53%, respectively. For sampleWC-2, the contents ofmeth-ane and ethane are from 51.93% to 67.31% and from 0% to 0.22%, respec-tively. The contents of carbon dioxide and nitrogen are from 12.50% to33.63% and from 0% to 23.96%, respectively. For sample WC-4, the con-tents of methane and ethane are from 63.02% to 77.09% and from 0% to0.34%, respectively. The contents of carbon dioxide and nitrogen arefrom9.18% to 17.40% and from5.16% to 25.10%, respectively. For sampleWC-6, the contents of methane and ethane are from 76.18% to 88.59%and from 0.21% to 0.29%, respectively. The contents of carbon dioxideand nitrogen are from 6.28% to 20.57% and from 2.96% to 11.13%,respectively.
4.2. Stable carbon and hydrogen isotopes
The stable carbon and hydrogen isotopic compositions of alkanesare also shown in Table 1. The δ13C1 values range from −31.6 ‰ to−26.8 ‰ (average − 29.8 ‰) while the δ13C2 values range from−35.9 ‰ to −33.2 ‰ (average −34.4 ‰). The δ2HCH4 values rangefrom −221.1 ‰ to −187 ‰ (average −201.3 ‰). Because of the lowconcentration of ethane, the δ2HC2H6 values cannot be detected.
4.3. Methane adsorption isotherm
The fitted Langmuir parameters for all 30 °C isotherms are listed inTable 2. VL ranges from 1.10 to 1.96 m3/t with an average of 1.50 m3/tand PL at that temperature ranges from 1.25 to 1.97 MPa with an aver-age of 1.64 MPa.
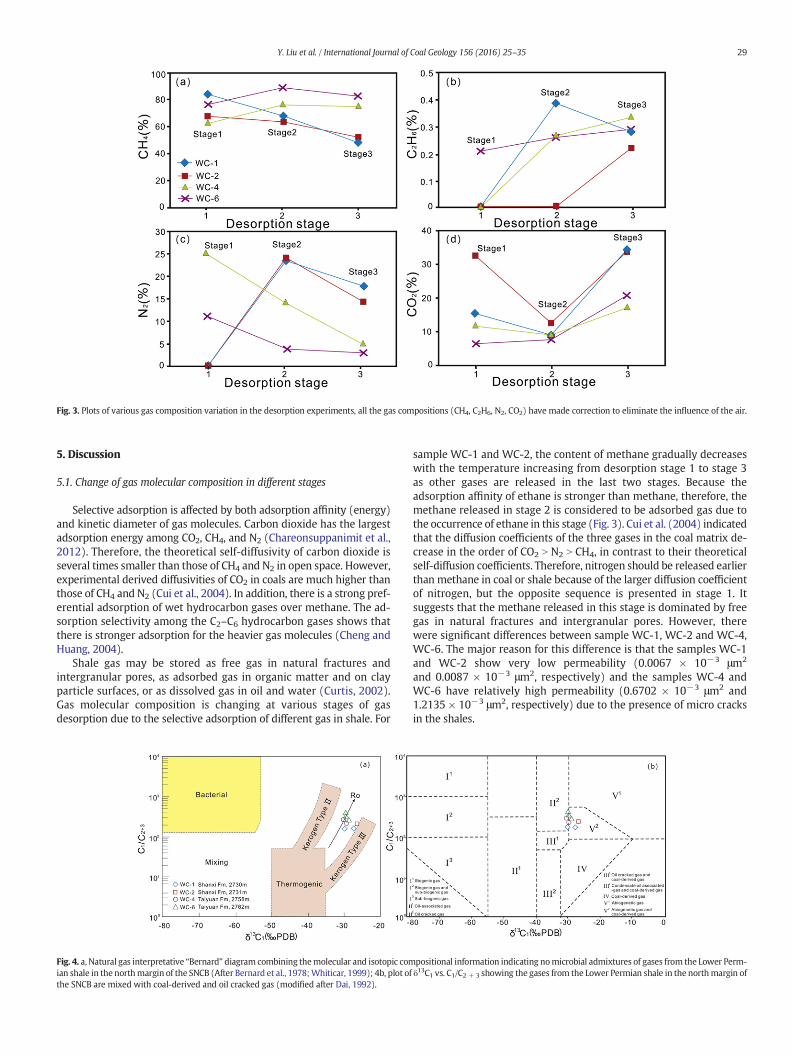
Fig. 3. Plots of various gas composition variation in the desorption experiments, all the gas compositions (CH4, C2H6, N2, CO2) have made correction to eliminate the influence of the air.
29Y. Liu et al. / International Journal of Coal Geology 156 (2016) 25–35
5. Discussion
5.1. Change of gas molecular composition in different stages
Selective adsorption is affected by both adsorption affinity (energy)and kinetic diameter of gas molecules. Carbon dioxide has the largestadsorption energy among CO2, CH4, and N2 (Chareonsuppanimit et al.,2012). Therefore, the theoretical self-diffusivity of carbon dioxide isseveral times smaller than those of CH4 and N2 in open space. However,experimental derived diffusivities of CO2 in coals are much higher thanthose of CH4 and N2 (Cui et al., 2004). In addition, there is a strong pref-erential adsorption of wet hydrocarbon gases over methane. The ad-sorption selectivity among the C2–C6 hydrocarbon gases shows thatthere is stronger adsorption for the heavier gas molecules (Cheng andHuang, 2004).
Shale gas may be stored as free gas in natural fractures andintergranular pores, as adsorbed gas in organic matter and on clayparticle surfaces, or as dissolved gas in oil and water (Curtis, 2002).Gas molecular composition is changing at various stages of gasdesorption due to the selective adsorption of different gas in shale. For
Fig. 4. a, Natural gas interpretative “Bernard” diagram combining themolecular and isotopic comian shale in the northmargin of the SNCB (After Bernard et al., 1978;Whiticar, 1999); 4b, plot ofthe SNCB are mixed with coal-derived and oil cracked gas (modified after Dai, 1992).
sample WC-1 and WC-2, the content of methane gradually decreaseswith the temperature increasing from desorption stage 1 to stage 3as other gases are released in the last two stages. Because theadsorption affinity of ethane is stronger than methane, therefore, themethane released in stage 2 is considered to be adsorbed gas due tothe occurrence of ethane in this stage (Fig. 3). Cui et al. (2004) indicatedthat the diffusion coefficients of the three gases in the coal matrix de-crease in the order of CO2 N N2 N CH4, in contrast to their theoreticalself-diffusion coefficients. Therefore, nitrogen should be released earlierthan methane in coal or shale because of the larger diffusion coefficientof nitrogen, but the opposite sequence is presented in stage 1. Itsuggests that the methane released in this stage is dominated by freegas in natural fractures and intergranular pores. However, therewere significant differences between sample WC-1, WC-2 and WC-4,WC-6. The major reason for this difference is that the samples WC-1and WC-2 show very low permeability (0.0067 × 10⁻³ μm2
and 0.0087 × 10⁻³ μm2, respectively) and the samples WC-4 andWC-6 have relatively high permeability (0.6702 × 10⁻³ μm2 and1.2135 × 10−3 μm2, respectively) due to the presence of micro cracksin the shales.
positional information indicating nomicrobial admixtures of gases from the Lower Perm-δ13C1 vs. C1/C2 + 3 showing the gases from the Lower Permian shale in the northmargin of
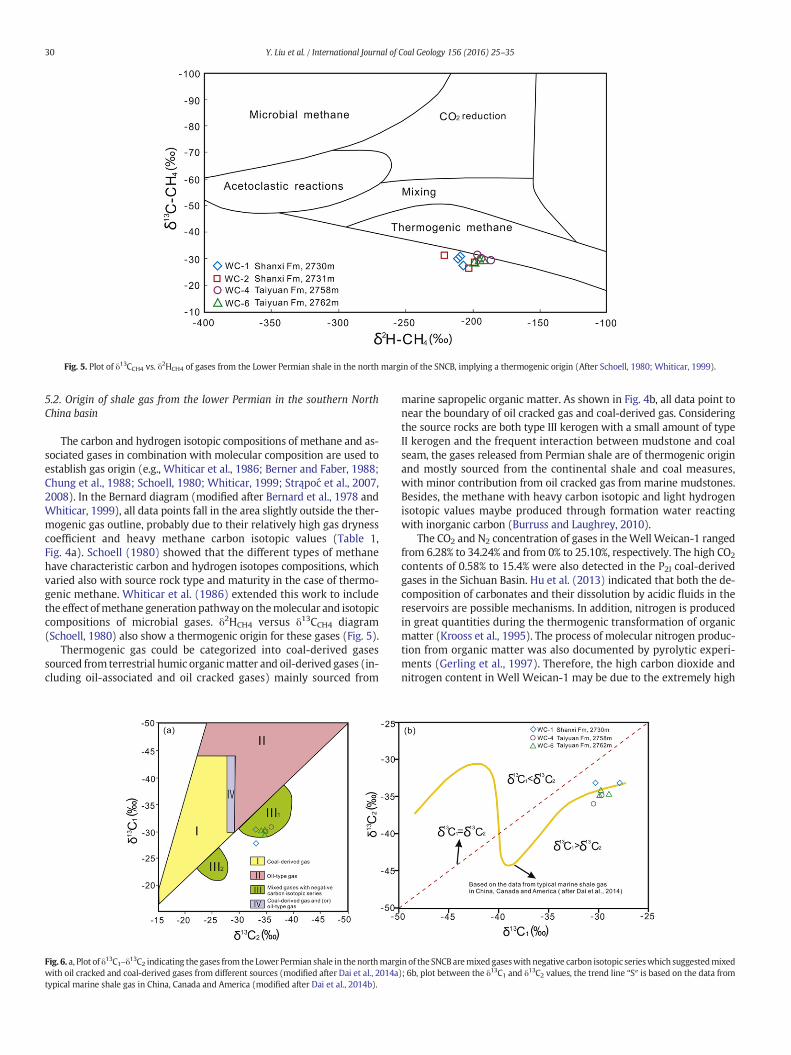
Fig. 5. Plot of δ13CCH4 vs. δ2HCH4 of gases from the Lower Permian shale in the north margin of the SNCB, implying a thermogenic origin (After Schoell, 1980; Whiticar, 1999).
30 Y. Liu et al. / International Journal of Coal Geology 156 (2016) 25–35
5.2. Origin of shale gas from the lower Permian in the southern NorthChina basin
The carbon and hydrogen isotopic compositions of methane and as-sociated gases in combination with molecular composition are used toestablish gas origin (e.g., Whiticar et al., 1986; Berner and Faber, 1988;Chung et al., 1988; Schoell, 1980; Whiticar, 1999; Strąpoć et al., 2007,2008). In the Bernard diagram (modified after Bernard et al., 1978 andWhiticar, 1999), all data points fall in the area slightly outside the ther-mogenic gas outline, probably due to their relatively high gas drynesscoefficient and heavy methane carbon isotopic values (Table 1,Fig. 4a). Schoell (1980) showed that the different types of methanehave characteristic carbon and hydrogen isotopes compositions, whichvaried also with source rock type and maturity in the case of thermo-genic methane. Whiticar et al. (1986) extended this work to includethe effect ofmethane generation pathway on themolecular and isotopiccompositions of microbial gases. δ2HCH4 versus δ13CCH4 diagram(Schoell, 1980) also show a thermogenic origin for these gases (Fig. 5).
Thermogenic gas could be categorized into coal-derived gasessourced from terrestrial humic organicmatter and oil-derived gases (in-cluding oil-associated and oil cracked gases) mainly sourced from
Fig. 6. a, Plot of δ13C1–δ13C2 indicating the gases from the Lower Permian shale in thenorthmargwith oil cracked and coal-derived gases from different sources (modified after Dai et al., 2014atypical marine shale gas in China, Canada and America (modified after Dai et al., 2014b).
marine sapropelic organic matter. As shown in Fig. 4b, all data point tonear the boundary of oil cracked gas and coal-derived gas. Consideringthe source rocks are both type III kerogen with a small amount of typeII kerogen and the frequent interaction between mudstone and coalseam, the gases released from Permian shale are of thermogenic originand mostly sourced from the continental shale and coal measures,with minor contribution from oil cracked gas from marine mudstones.Besides, the methane with heavy carbon isotopic and light hydrogenisotopic values maybe produced through formation water reactingwith inorganic carbon (Burruss and Laughrey, 2010).
The CO2 and N2 concentration of gases in theWell Weican-1 rangedfrom 6.28% to 34.24% and from 0% to 25.10%, respectively. The high CO2
contents of 0.58% to 15.4% were also detected in the P2I coal-derivedgases in the Sichuan Basin. Hu et al. (2013) indicated that both the de-composition of carbonates and their dissolution by acidic fluids in thereservoirs are possible mechanisms. In addition, nitrogen is producedin great quantities during the thermogenic transformation of organicmatter (Krooss et al., 1995). The process of molecular nitrogen produc-tion from organic matter was also documented by pyrolytic experi-ments (Gerling et al., 1997). Therefore, the high carbon dioxide andnitrogen content in Well Weican-1 may be due to the extremely high
in of the SNCBaremixed gaseswith negative carbon isotopic serieswhich suggestedmixed); 6b, plot between the δ13C1 and δ13C2 values, the trend line “S″ is based on the data from
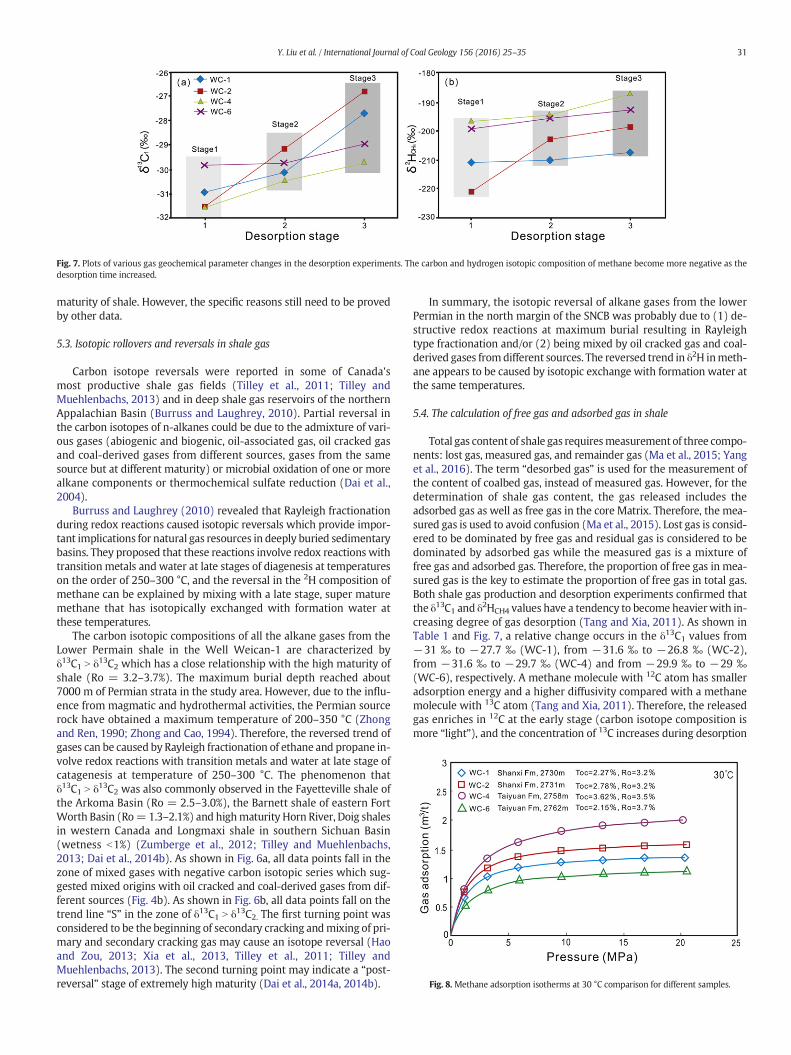
Fig. 7. Plots of various gas geochemical parameter changes in the desorption experiments. The carbon and hydrogen isotopic composition of methane become more negative as thedesorption time increased.
Fig. 8.Methane adsorption isotherms at 30 °C comparison for different samples.
31Y. Liu et al. / International Journal of Coal Geology 156 (2016) 25–35
maturity of shale. However, the specific reasons still need to be provedby other data.
5.3. Isotopic rollovers and reversals in shale gas
Carbon isotope reversals were reported in some of Canada'smost productive shale gas fields (Tilley et al., 2011; Tilley andMuehlenbachs, 2013) and in deep shale gas reservoirs of the northernAppalachian Basin (Burruss and Laughrey, 2010). Partial reversal inthe carbon isotopes of n-alkanes could be due to the admixture of vari-ous gases (abiogenic and biogenic, oil-associated gas, oil cracked gasand coal-derived gases from different sources, gases from the samesource but at different maturity) or microbial oxidation of one or morealkane components or thermochemical sulfate reduction (Dai et al.,2004).
Burruss and Laughrey (2010) revealed that Rayleigh fractionationduring redox reactions caused isotopic reversals which provide impor-tant implications for natural gas resources in deeply buried sedimentarybasins. They proposed that these reactions involve redox reactions withtransition metals and water at late stages of diagenesis at temperatureson the order of 250–300 °C, and the reversal in the 2H composition ofmethane can be explained by mixing with a late stage, super maturemethane that has isotopically exchanged with formation water atthese temperatures.
The carbon isotopic compositions of all the alkane gases from theLower Permain shale in the Well Weican-1 are characterized byδ13C1 N δ13C2 which has a close relationship with the high maturity ofshale (Ro = 3.2–3.7%). The maximum burial depth reached about7000 m of Permian strata in the study area. However, due to the influ-ence from magmatic and hydrothermal activities, the Permian sourcerock have obtained a maximum temperature of 200–350 °C (Zhongand Ren, 1990; Zhong and Cao, 1994). Therefore, the reversed trend ofgases can be caused by Rayleigh fractionation of ethane and propane in-volve redox reactions with transition metals and water at late stage ofcatagenesis at temperature of 250–300 °C. The phenomenon thatδ13C1 N δ13C2 was also commonly observed in the Fayetteville shale ofthe Arkoma Basin (Ro = 2.5–3.0%), the Barnett shale of eastern FortWorth Basin (Ro=1.3–2.1%) and highmaturity Horn River, Doig shalesin western Canada and Longmaxi shale in southern Sichuan Basin(wetness b1%) (Zumberge et al., 2012; Tilley and Muehlenbachs,2013; Dai et al., 2014b). As shown in Fig. 6a, all data points fall in thezone of mixed gases with negative carbon isotopic series which sug-gested mixed origins with oil cracked and coal-derived gases from dif-ferent sources (Fig. 4b). As shown in Fig. 6b, all data points fall on thetrend line “S” in the zone of δ13C1 N δ13C2. The first turning point wasconsidered to be the beginning of secondary cracking andmixing of pri-mary and secondary cracking gas may cause an isotope reversal (Haoand Zou, 2013; Xia et al., 2013, Tilley et al., 2011; Tilley andMuehlenbachs, 2013). The second turning point may indicate a “post-reversal” stage of extremely high maturity (Dai et al., 2014a, 2014b).
In summary, the isotopic reversal of alkane gases from the lowerPermian in the north margin of the SNCB was probably due to (1) de-structive redox reactions at maximum burial resulting in Rayleightype fractionation and/or (2) being mixed by oil cracked gas and coal-derived gases fromdifferent sources. The reversed trend in δ2H inmeth-ane appears to be caused by isotopic exchange with formation water atthe same temperatures.
5.4. The calculation of free gas and adsorbed gas in shale
Total gas content of shale gas requiresmeasurement of three compo-nents: lost gas, measured gas, and remainder gas (Ma et al., 2015; Yanget al., 2016). The term “desorbed gas” is used for the measurement ofthe content of coalbed gas, instead of measured gas. However, for thedetermination of shale gas content, the gas released includes theadsorbed gas as well as free gas in the core Matrix. Therefore, the mea-sured gas is used to avoid confusion (Ma et al., 2015). Lost gas is consid-ered to be dominated by free gas and residual gas is considered to bedominated by adsorbed gas while the measured gas is a mixture offree gas and adsorbed gas. Therefore, the proportion of free gas in mea-sured gas is the key to estimate the proportion of free gas in total gas.Both shale gas production and desorption experiments confirmed thatthe δ13C1 and δ2HCH4 values have a tendency to become heavierwith in-creasing degree of gas desorption (Tang and Xia, 2011). As shown inTable 1 and Fig. 7, a relative change occurs in the δ13C1 values from−31 ‰ to −27.7 ‰ (WC-1), from −31.6 ‰ to −26.8 ‰ (WC-2),from −31.6 ‰ to −29.7 ‰ (WC-4) and from −29.9 ‰ to −29 ‰(WC-6), respectively. A methane molecule with 12C atom has smalleradsorption energy and a higher diffusivity compared with a methanemolecule with 13C atom (Tang and Xia, 2011). Therefore, the releasedgas enriches in 12C at the early stage (carbon isotope composition ismore “light”), and the concentration of 13C increases during desorption
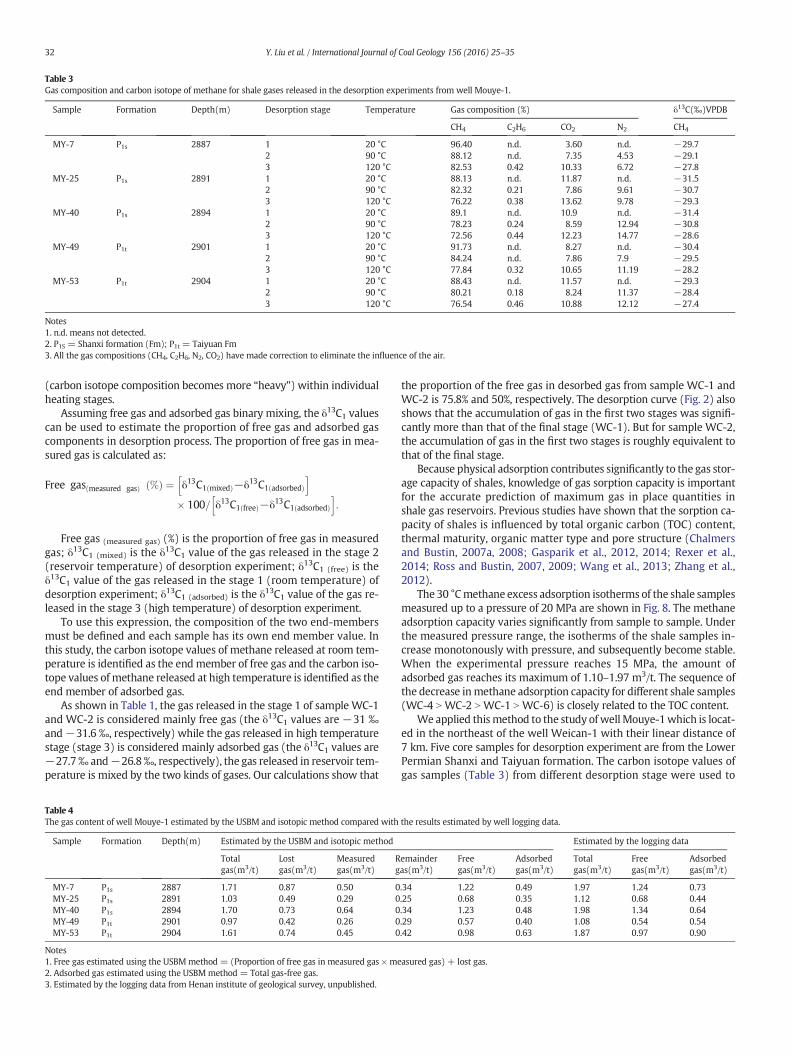
Table 3Gas composition and carbon isotope of methane for shale gases released in the desorption experiments from well Mouye-1.
Sample Formation Depth(m) Desorption stage Temperature Gas composition (%) δ13C(‰)VPDB
CH4 C2H6 CO2 N2 CH4
MY-7 P1s 2887 1 20 °C 96.40 n.d. 3.60 n.d. −29.72 90 °C 88.12 n.d. 7.35 4.53 −29.13 120 °C 82.53 0.42 10.33 6.72 −27.8
MY-25 P1s 2891 1 20 °C 88.13 n.d. 11.87 n.d. −31.52 90 °C 82.32 0.21 7.86 9.61 −30.73 120 °C 76.22 0.38 13.62 9.78 −29.3
MY-40 P1s 2894 1 20 °C 89.1 n.d. 10.9 n.d. −31.42 90 °C 78.23 0.24 8.59 12.94 −30.83 120 °C 72.56 0.44 12.23 14.77 −28.6
MY-49 P1t 2901 1 20 °C 91.73 n.d. 8.27 n.d. −30.42 90 °C 84.24 n.d. 7.86 7.9 −29.53 120 °C 77.84 0.32 10.65 11.19 −28.2
MY-53 P1t 2904 1 20 °C 88.43 n.d. 11.57 n.d. −29.32 90 °C 80.21 0.18 8.24 11.37 −28.43 120 °C 76.54 0.46 10.88 12.12 −27.4
Notes1. n.d. means not detected.2. P1S = Shanxi formation (Fm); P1t = Taiyuan Fm3. All the gas compositions (CH4, C2H6, N2, CO2) have made correction to eliminate the influence of the air.
32 Y. Liu et al. / International Journal of Coal Geology 156 (2016) 25–35
(carbon isotope composition becomes more “heavy”) within individualheating stages.
Assuming free gas and adsorbed gas binary mixing, the δ13C1 valuescan be used to estimate the proportion of free gas and adsorbed gascomponents in desorption process. The proportion of free gas in mea-sured gas is calculated as:
Free gas measured gasð Þ %ð Þ ¼ δ13C1 mixedð Þ−δ13C1 adsorbedð Þh i
� 100= δ13C1 freeð Þ−δ13C1 adsorbedð Þh i
:
Free gas (measured gas) (%) is the proportion of free gas in measuredgas; δ13C1 (mixed) is the δ13C1 value of the gas released in the stage 2(reservoir temperature) of desorption experiment; δ13C1 (free) is theδ13C1 value of the gas released in the stage 1 (room temperature) ofdesorption experiment; δ13C1 (adsorbed) is the δ13C1 value of the gas re-leased in the stage 3 (high temperature) of desorption experiment.
To use this expression, the composition of the two end-membersmust be defined and each sample has its own end member value. Inthis study, the carbon isotope values of methane released at room tem-perature is identified as the end member of free gas and the carbon iso-tope values of methane released at high temperature is identified as theend member of adsorbed gas.
As shown in Table 1, the gas released in the stage 1 of sample WC-1and WC-2 is considered mainly free gas (the δ13C1 values are −31 ‰and−31.6‰, respectively) while the gas released in high temperaturestage (stage 3) is considered mainly adsorbed gas (the δ13C1 values are−27.7‰ and−26.8‰, respectively), the gas released in reservoir tem-perature is mixed by the two kinds of gases. Our calculations show that
Table 4The gas content of well Mouye-1 estimated by the USBM and isotopic method compared with
Sample Formation Depth(m) Estimated by the USBM and isotopic method
Totalgas(m3/t)
Lostgas(m3/t)
Measuredgas(m3/t)
Rg
MY-7 P1s 2887 1.71 0.87 0.50 0MY-25 P1s 2891 1.03 0.49 0.29 0MY-40 P1s 2894 1.70 0.73 0.64 0MY-49 P1t 2901 0.97 0.42 0.26 0MY-53 P1t 2904 1.61 0.74 0.45 0
Notes1. Free gas estimated using the USBMmethod = (Proportion of free gas in measured gas × me2. Adsorbed gas estimated using the USBMmethod = Total gas-free gas.3. Estimated by the logging data from Henan institute of geological survey, unpublished.
the proportion of the free gas in desorbed gas from sample WC-1 andWC-2 is 75.8% and 50%, respectively. The desorption curve (Fig. 2) alsoshows that the accumulation of gas in the first two stages was signifi-cantly more than that of the final stage (WC-1). But for sample WC-2,the accumulation of gas in the first two stages is roughly equivalent tothat of the final stage.
Because physical adsorption contributes significantly to the gas stor-age capacity of shales, knowledge of gas sorption capacity is importantfor the accurate prediction of maximum gas in place quantities inshale gas reservoirs. Previous studies have shown that the sorption ca-pacity of shales is influenced by total organic carbon (TOC) content,thermal maturity, organic matter type and pore structure (Chalmersand Bustin, 2007a, 2008; Gasparik et al., 2012, 2014; Rexer et al.,2014; Ross and Bustin, 2007, 2009; Wang et al., 2013; Zhang et al.,2012).
The 30 °Cmethane excess adsorption isotherms of the shale samplesmeasured up to a pressure of 20 MPa are shown in Fig. 8. The methaneadsorption capacity varies significantly from sample to sample. Underthe measured pressure range, the isotherms of the shale samples in-crease monotonously with pressure, and subsequently become stable.When the experimental pressure reaches 15 MPa, the amount ofadsorbed gas reaches its maximum of 1.10–1.97 m3/t. The sequence ofthe decrease inmethane adsorption capacity for different shale samples(WC-4 N WC-2 N WC-1 N WC-6) is closely related to the TOC content.
We applied thismethod to the study ofwellMouye-1which is locat-ed in the northeast of the well Weican-1 with their linear distance of7 km. Five core samples for desorption experiment are from the LowerPermian Shanxi and Taiyuan formation. The carbon isotope values ofgas samples (Table 3) from different desorption stage were used to
the results estimated by well logging data.
Estimated by the logging data
emainderas(m3/t)
Freegas(m3/t)
Adsorbedgas(m3/t)
Totalgas(m3/t)
Freegas(m3/t)
Adsorbedgas(m3/t)
.34 1.22 0.49 1.97 1.24 0.73
.25 0.68 0.35 1.12 0.68 0.44
.34 1.23 0.48 1.98 1.34 0.64
.29 0.57 0.40 1.08 0.54 0.54
.42 0.98 0.63 1.87 0.97 0.90
asured gas) + lost gas.
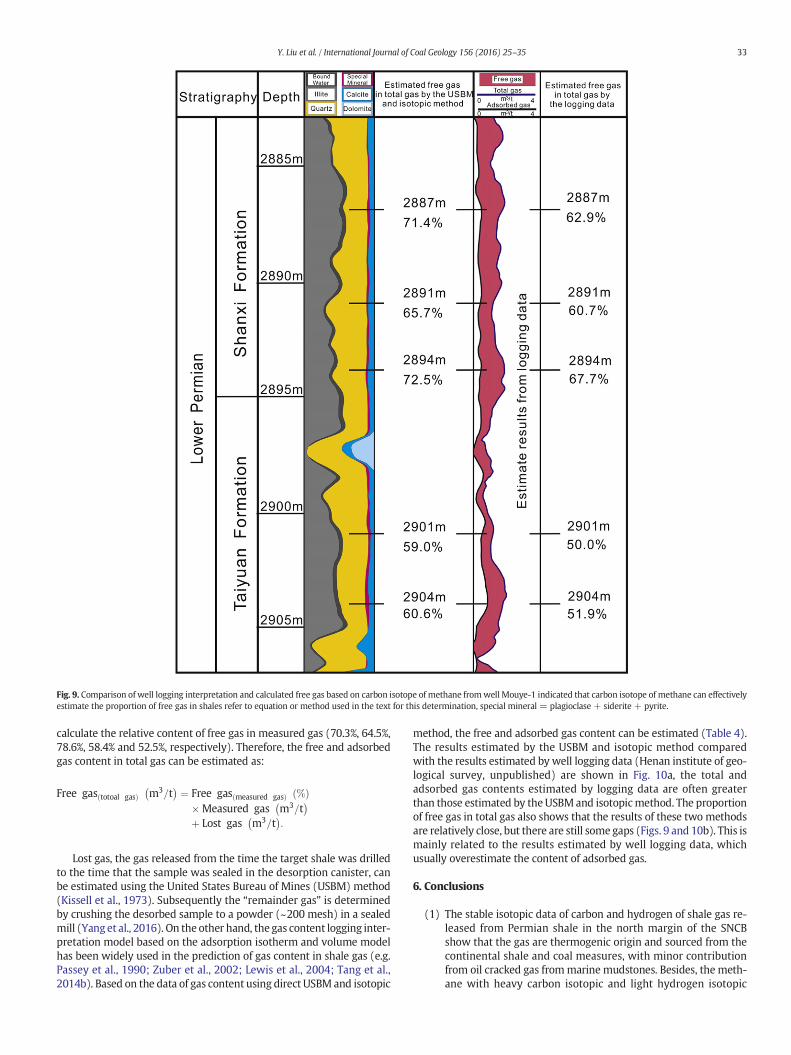
Fig. 9. Comparison of well logging interpretation and calculated free gas based on carbon isotope of methane fromwell Mouye-1 indicated that carbon isotope of methane can effectivelyestimate the proportion of free gas in shales refer to equation or method used in the text for this determination, special mineral = plagioclase + siderite + pyrite.
33Y. Liu et al. / International Journal of Coal Geology 156 (2016) 25–35
calculate the relative content of free gas in measured gas (70.3%, 64.5%,78.6%, 58.4% and 52.5%, respectively). Therefore, the free and adsorbedgas content in total gas can be estimated as:
Free gas totoal gasð Þ m3=t� � ¼ Free gas measured gasð Þ %ð Þ
�Measured gas m3=t� �
þ Lost gas m3=t� �
:
Lost gas, the gas released from the time the target shale was drilledto the time that the sample was sealed in the desorption canister, canbe estimated using the United States Bureau of Mines (USBM) method(Kissell et al., 1973). Subsequently the “remainder gas” is determinedby crushing the desorbed sample to a powder (~200 mesh) in a sealedmill (Yang et al., 2016). On the other hand, the gas content logging inter-pretation model based on the adsorption isotherm and volume modelhas been widely used in the prediction of gas content in shale gas (e.g.Passey et al., 1990; Zuber et al., 2002; Lewis et al., 2004; Tang et al.,2014b). Based on the data of gas content using direct USBM and isotopic
method, the free and adsorbed gas content can be estimated (Table 4).The results estimated by the USBM and isotopic method comparedwith the results estimated by well logging data (Henan institute of geo-logical survey, unpublished) are shown in Fig. 10a, the total andadsorbed gas contents estimated by logging data are often greaterthan those estimated by theUSBMand isotopicmethod. The proportionof free gas in total gas also shows that the results of these two methodsare relatively close, but there are still some gaps (Figs. 9 and 10b). This ismainly related to the results estimated by well logging data, whichusually overestimate the content of adsorbed gas.
6. Conclusions
(1) The stable isotopic data of carbon and hydrogen of shale gas re-leased from Permian shale in the north margin of the SNCBshow that the gas are thermogenic origin and sourced from thecontinental shale and coal measures, with minor contributionfrom oil cracked gas frommarine mudstones. Besides, the meth-ane with heavy carbon isotopic and light hydrogen isotopic
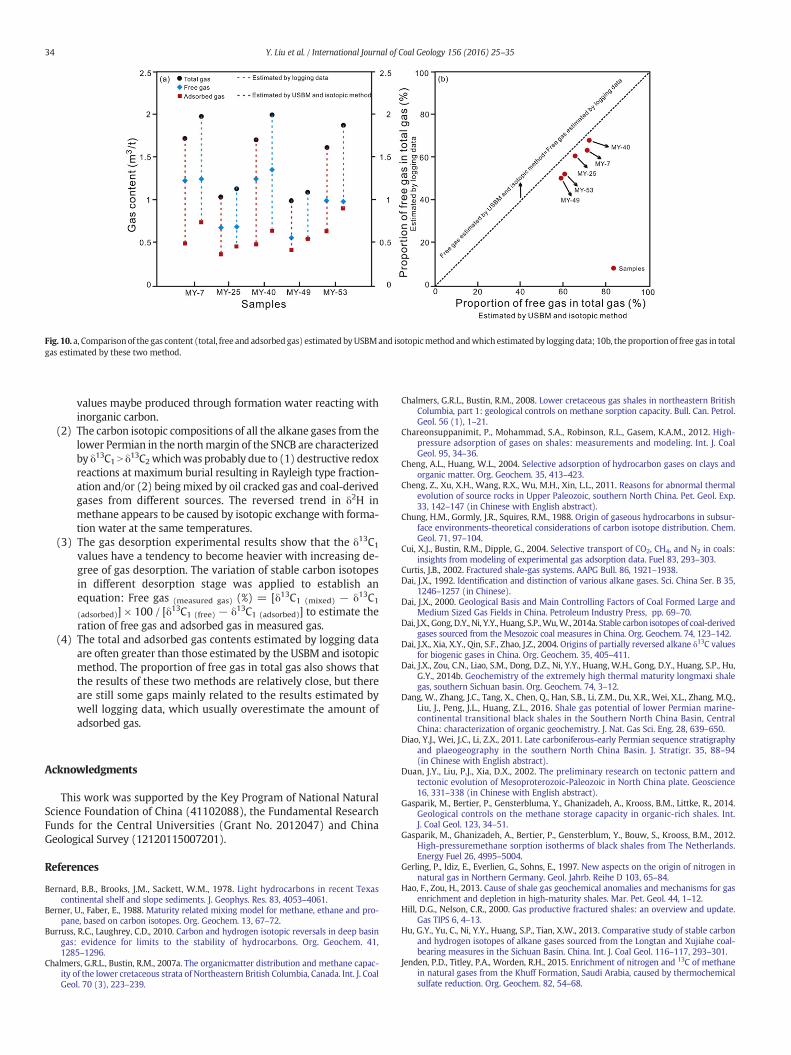
Fig. 10. a, Comparison of the gas content (total, free and adsorbed gas) estimated byUSBMand isotopicmethod andwhich estimated by logging data; 10b, the proportion of free gas in totalgas estimated by these two method.
34 Y. Liu et al. / International Journal of Coal Geology 156 (2016) 25–35
values maybe produced through formation water reacting withinorganic carbon.
(2) The carbon isotopic compositions of all the alkane gases from thelower Permian in the northmargin of the SNCB are characterizedby δ13C1 N δ13C2whichwas probably due to (1) destructive redoxreactions at maximum burial resulting in Rayleigh type fraction-ation and/or (2) beingmixed by oil cracked gas and coal-derivedgases from different sources. The reversed trend in δ2H inmethane appears to be caused by isotopic exchange with forma-tion water at the same temperatures.
(3) The gas desorption experimental results show that the δ13C1
values have a tendency to become heavier with increasing de-gree of gas desorption. The variation of stable carbon isotopesin different desorption stage was applied to establish anequation: Free gas (measured gas) (%) = [δ13C1 (mixed) − δ13C1
(adsorbed)] × 100 / [δ13C1 (free) − δ13C1 (adsorbed)] to estimate theration of free gas and adsorbed gas in measured gas.
(4) The total and adsorbed gas contents estimated by logging dataare often greater than those estimated by the USBM and isotopicmethod. The proportion of free gas in total gas also shows thatthe results of these two methods are relatively close, but thereare still some gaps mainly related to the results estimated bywell logging data, which usually overestimate the amount ofadsorbed gas.
Acknowledgments
This work was supported by the Key Program of National NaturalScience Foundation of China (41102088), the Fundamental ResearchFunds for the Central Universities (Grant No. 2012047) and ChinaGeological Survey (12120115007201).
References
Bernard, B.B., Brooks, J.M., Sackett, W.M., 1978. Light hydrocarbons in recent Texascontinental shelf and slope sediments. J. Geophys. Res. 83, 4053–4061.
Berner, U., Faber, E., 1988. Maturity related mixing model for methane, ethane and pro-pane, based on carbon isotopes. Org. Geochem. 13, 67–72.
Burruss, R.C., Laughrey, C.D., 2010. Carbon and hydrogen isotopic reversals in deep basingas: evidence for limits to the stability of hydrocarbons. Org. Geochem. 41,1285–1296.
Chalmers, G.R.L., Bustin, R.M., 2007a. The organicmatter distribution and methane capac-ity of the lower cretaceous strata of Northeastern British Columbia, Canada. Int. J. CoalGeol. 70 (3), 223–239.
Chalmers, G.R.L., Bustin, R.M., 2008. Lower cretaceous gas shales in northeastern BritishColumbia, part 1: geological controls on methane sorption capacity. Bull. Can. Petrol.Geol. 56 (1), 1–21.
Chareonsuppanimit, P., Mohammad, S.A., Robinson, R.L., Gasem, K.A.M., 2012. High-pressure adsorption of gases on shales: measurements and modeling. Int. J. CoalGeol. 95, 34–36.
Cheng, A.L., Huang, W.L., 2004. Selective adsorption of hydrocarbon gases on clays andorganic matter. Org. Geochem. 35, 413–423.
Cheng, Z., Xu, X.H., Wang, R.X., Wu, M.H., Xin, L.L., 2011. Reasons for abnormal thermalevolution of source rocks in Upper Paleozoic, southern North China. Pet. Geol. Exp.33, 142–147 (in Chinese with English abstract).
Chung, H.M., Gormly, J.R., Squires, R.M., 1988. Origin of gaseous hydrocarbons in subsur-face environments-theoretical considerations of carbon isotope distribution. Chem.Geol. 71, 97–104.
Cui, X.J., Bustin, R.M., Dipple, G., 2004. Selective transport of CO2, CH4, and N2 in coals:insights from modeling of experimental gas adsorption data. Fuel 83, 293–303.
Curtis, J.B., 2002. Fractured shale-gas systems. AAPG Bull. 86, 1921–1938.Dai, J.X., 1992. Identification and distinction of various alkane gases. Sci. China Ser. B 35,
1246–1257 (in Chinese).Dai, J.X., 2000. Geological Basis and Main Controlling Factors of Coal Formed Large and
Medium Sized Gas Fields in China. Petroleum Industry Press, pp. 69–70.Dai, J.X., Gong, D.Y., Ni, Y.Y., Huang, S.P.,Wu,W., 2014a. Stable carbon isotopes of coal-derived
gases sourced from the Mesozoic coal measures in China. Org. Geochem. 74, 123–142.Dai, J.X., Xia, X.Y., Qin, S.F., Zhao, J.Z., 2004. Origins of partially reversed alkane δ13C values
for biogenic gases in China. Org. Geochem. 35, 405–411.Dai, J.X., Zou, C.N., Liao, S.M., Dong, D.Z., Ni, Y.Y., Huang, W.H., Gong, D.Y., Huang, S.P., Hu,
G.Y., 2014b. Geochemistry of the extremely high thermal maturity longmaxi shalegas, southern Sichuan basin. Org. Geochem. 74, 3–12.
Dang, W., Zhang, J.C., Tang, X., Chen, Q., Han, S.B., Li, Z.M., Du, X.R., Wei, X.L., Zhang, M.Q.,Liu, J., Peng, J.L., Huang, Z.L., 2016. Shale gas potential of lower Permian marine-continental transitional black shales in the Southern North China Basin, CentralChina: characterization of organic geochemistry. J. Nat. Gas Sci. Eng. 28, 639–650.
Diao, Y.J., Wei, J.C., Li, Z.X., 2011. Late carboniferous-early Permian sequence stratigraphyand plaeogeography in the southern North China Basin. J. Stratigr. 35, 88–94(in Chinese with English abstract).
Duan, J.Y., Liu, P.J., Xia, D.X., 2002. The preliminary research on tectonic pattern andtectonic evolution of Mesoproterozoic-Paleozoic in North China plate. Geoscience16, 331–338 (in Chinese with English abstract).
Gasparik, M., Bertier, P., Gensterbluma, Y., Ghanizadeh, A., Krooss, B.M., Littke, R., 2014.Geological controls on the methane storage capacity in organic-rich shales. Int.J. Coal Geol. 123, 34–51.
Gasparik, M., Ghanizadeh, A., Bertier, P., Gensterblum, Y., Bouw, S., Krooss, B.M., 2012.High-pressuremethane sorption isotherms of black shales from The Netherlands.Energy Fuel 26, 4995–5004.
Gerling, P., Idiz, E., Everlien, G., Sohns, E., 1997. New aspects on the origin of nitrogen innatural gas in Northern Germany. Geol. Jahrb. Reihe D 103, 65–84.
Hao, F., Zou, H., 2013. Cause of shale gas geochemical anomalies and mechanisms for gasenrichment and depletion in high-maturity shales. Mar. Pet. Geol. 44, 1–12.
Hill, D.G., Nelson, C.R., 2000. Gas productive fractured shales: an overview and update.Gas TIPS 6, 4–13.
Hu, G.Y., Yu, C., Ni, Y.Y., Huang, S.P., Tian, X.W., 2013. Comparative study of stable carbonand hydrogen isotopes of alkane gases sourced from the Longtan and Xujiahe coal-bearing measures in the Sichuan Basin. China. Int. J. Coal Geol. 116–117, 293–301.
Jenden, P.D., Titley, P.A., Worden, R.H., 2015. Enrichment of nitrogen and 13C of methanein natural gases from the Khuff Formation, Saudi Arabia, caused by thermochemicalsulfate reduction. Org. Geochem. 82, 54–68.
35Y. Liu et al. / International Journal of Coal Geology 156 (2016) 25–35
Ji, W., Song, Y., Jiang, Z., Wang, X., Bai, Y., Xing, J., 2014. Geological controls and estimationalgorithms of lacustrine shale gas adsorption capacity: a case study of the Triassicstrata in the southeastern ordos basin, China. Int. J. Coal Geol. 134, 61–73.
Kissell, F.N., McCulloch, C.M., Elder, C.H., 1973. The directmethod of determiningmethanecontent of coal beds for ventilation design. US Bureau of Mines, Report of Investiga-tions 7767, 1–17.
Krooss, B.M., Littke, R., Müller, B., Frielingsdorf, J., Schwochau, K., Idiz, E.F., 1995. Genera-tion of nitrogen and methane from sedimentary organic matter: implications on thedynamics of natural gas accumulations. Chem. Geol. 126, 291–318.
Lewis, R., Ingraham, D., Sawyer, W., 2004. New evaluation techniques for gas shale reser-voirs. www.sipeshouston.org.
Li, Y.X., Nie, H.K., Long, P.Y., 2009. Development characteristics of rich organic shale andstrategic selection of shale gas exploration area in China. Nat. Gas Ind. 29, 115–118(in Chinese with English abstract).
Lin, X.Y., Chen, Q.L., Li, J., 2011. Distribution and geochemical characteristics of Permiansource rocks in the southern North China. Mar. Geol. Front. 27, 21–26 (in Chinesewith English abstract).
Liu, B., Qian, X.L., Wang, Y.H., 1999. Tectonic-sedimentary evolution of North China platein early Paleozoic. Acta Geol. Sin. 34, 347.
Ma, Y., Zhong, N.N., Li, D.H., Pan, Z.J., Cheng, L.J., Liu, K.Y., 2015. Organic matter/clay min-eral intergranular pores in the lower Cambrian lujiaping shale in the north-easternpart of the upper Yangtze area, China: A possible microscopic mechanism for gaspreservation. Int. J. Coal Geol. 137, 38–54.
Martini, A.M., Walter, L.M., Budai, J.M., Ku, T.C.W., Kaiser, C.J., Schoell, M., 1998. Geneticand temporal relations between formation waters and biogenic methane upperDevonian Antrim shale, Michigan basin, USA. Geochim. Cosmochim. Acta 62,1699–1720.
Mavor, M., Nelson, C., 1997. Coalbed Reservoir Gas-In-Place Analysis: GRI-97/0263. GasResearch Institute, Chicago, Illinois, USA.
Ni, Y.Y., Dai, J.X., Zhu, G.Y., Zhang, S.C., Zhang, D.J., Su, J., Tao, X.W., Liao, F.R., Wu,W., Gong,D.Y., Liu, Q.Y., 2013. Stable hydrogen and carbon isotopic ratios of coal-derived andoil-derived gases: a case study in the tarim basin, NW China. Int. J. Coal Geol.116–117, 302–313.
Passey, Q.R., Moretti, F.J., Kulla, J.B., Stroud, J.B., 1990. A practial model for organic richnessfrom porosity and resistivity logs. AAPG Bull. 74, 1777–1794.
Rexer, T.F.T., Mathia, E.J., Aplin, A.C., Thomas, K.M., 2014. High-pressure methane adsorp-tion and characterization of pores in posidonia shales and isolated kerogens. EnergyFuel 28, 2886–2901.
Ross, D.J.K., Bustin, R.M., 2007. Shale gas potential of the lower JurassicGordondaleMember, northeastern British Columbia, Canada. Bull. Can. Petrol. Geol.55, 51–75.
Ross, D.J.K., Bustin, R.M., 2009. The importance of shale composition and pore structureupon gas storage potential of shale gas reservoirs. Mar. Pet. Geol. 26, 916–927.
Schettler, P.D., Parmely, C.R., 1990. The measurement of gas desorption isotherms forDevonian shale. Gas Shales Technol. Rev. 7, 4–9.
Schoell, M., 1980. The hydrogen and carbon isotopic composition of methane from natu-ral gases of various origins. Geochim. Cosmochim. Acta 44, 649–661.
Strąpoć, D., Mastalerz, M., Eble, C., Schimmelmann, A., 2007. Characterization of the originof coalbed gases in southeastern Illinois basin by compound-specific carbon and hy-drogen stable isotope ratios. Org. Geochem. 38, 267–287.
Strąpoć, D., Mastalerz, M., Schimmelmann, A., Drobniak, A., Hedges, S., 2008. Variability ofgeochemical properties in a microbially dominated coalbed gas system from the east-ern margin of the Illinois Basin, USA. Int. J. Coal Geol. 76, 98–110.
Sun, J., Zheng, Q.G., Wen, Z.H., Hou, F.H., Xiao, R., Ren, J.Z., 2014. Shale gas reservoir-forming conditions and exploration prospect in permian Shanxi formation of thesouthern North China Basin. Mar. Geol. Front. 30, 20–27 (in Chinese with Englishabstract).
Tang, Y., Li, L.Z., Jiang, S.X., 2014a. A logging interpretation methodology of gas content inshale reservoirs and its application. Nat. Gas Ind. 34, 46–54 (in Chinese with Englishabstract).
Tang, Y., Xia, D., 2011. Predicting original gas in place and optimizing productivity by iso-tope geochemistry of shale gas. AAPG Hedberg Research Conference-Natural GasGeochemistry: Recent Developments, Applications and Technologies, May 9–12,2011 Beijing, China (Extended Abstract, 1 pp.).
Tang, X., Zhang, J.C., Wang, X.Z., Yu, B.S., Ding, W.L., Xiong, J.Y., Yang, Y.T., Wang, L., Yang,C., 2014b. Shale characteristics in the Southeastern Ordos Basin, China: implicationsfor hydrocarbon accumulation conditions and the potential of Continental shales.Int. J. Coal Geol. 128, 32–46.
Tilley, B., Muehlenbachs, K., 2013. Isotope reversals and universal stages and trends of gasmaturation in sealed, self-contained petroleum systems. Chem. Geol. 339, 194–204.
Tilley, B., McLellan, S., Hiebert, S., Quartero, B., Veilleux, B., Muehlenbachs, K., 2011. Gasisotope reversals in fractured gas reservoirs of thewestern Canadian foothills: matureshale gases in disguise. Am. Assoc. Pet. Geol. Bull. 95, 1399–1422.
Wang, S.B., Song, Z.G., Cao, T.T., Song, X., 2013. Themethane sorption capacity of Paleozoicshales from the Sichuan Basin, China. Mar. Pet. Geol. 44, 112–119.
Whiticar, M.J., 1999. Carbon and hydrogen isotope systematic of microbial formation andoxidation of methane. Chem. Geol. 161, 291–314.
Whiticar, M.J., Faber, E., Schoell, M., 1986. Biogenic methane production in marine andfreshwater environments: CO2 reduction vs. acetate fermentation-isotope evidence.Geochim. Cosmochim. Acta 50, 693–709.
Wu,W.,Wang, Y.H., Cao, G.S., Huang, X.F., Liu,W.Q., 2015. The geochemical characteristicsof the carboniferous and Permian Source Rocks in the Western Henan, the southernNorth China Basin. Nat. Gas. Geosci. 26, 128–136 (in Chinese with English abstract).
Xia, X., Chen, J., Braun, R., Tang, Y., 2013. Isotopic reversals with respect tomaturity trendsdue to mixing of primary and secondary products in source rocks. Chem. Geol. 339,205–212.
Xu, H.Z., Hu, Z.Q., Zhou, X.K., Wang, C.G., 2005. Lower Paleozoic hydrocarbon generationhistory in the mid-south of North China Basin. Acta Pet. Sin. 26, 31–37 (in Chinesewith English abstract).
Xu, X.H., Chen, X.J., Lei, M., Li, S.J., Zhou, X.J., Wu, M.H., 2011. Exploration prospects of theCarboniferous and Permian in the southern North China. Pet. Geol. Exp. 33, 148–154(in Chinese with English abstract).
Yang, F., Ning, Z.F., Wang, Q., Zhang, R., Bernhard, M.K., 2016. Pore Structure Characteris-tics of Lower Silurian Shales in the Southern Sichuan Basin, China: Insights to poredevelopment and gas storage mechanism. Int. J. Coal Geol. 156, 12–24.
Yu, H.Z., Lv, F.L., Guo, Q.X., Lu, W.Z., Wu, J.Y., Han, S.H., 2005. Proto-sediment basin typesand tectonic evolution in the southern edge of North China plate. Pet. Geol. Exp. 27,111–117 (in Chinese with English abstract).
Yuan, W., Pan, Z., Li, X., Yang, Y., Zhao, C., Connell, L.D., Li, S., He, J., 2014. Experimentalstudy and modelling of methane adsorption and diffusion in shale. Fuel 117,509–519.
Zhang, T.W., Ellis, G.S., Ruppel, S.C., Milliken, K., Yang, R., 2012. Effect of organic-mattertype and thermal maturity on methane adsorption in shale-gas systems. Org.Geochem. 47, 120–131.
Zhao, J.F., Liu, C.Y., Liu, Y.T., He, Z.G., Mao,W., Zhu, B., 2011. Reconstruction of thermal evo-lutionary history of the Upper Paleozoic in the southern North China. Oil Gas Geol. 32,64–74 (in Chinese with English abstract).
Zhong, N.N., Cao, D.Y., 1994. Genesis of coal metamorphism of late Paleozoic coals in thesouth of North China-A further approach to the effects of thermal groundwater oncoal metamorphism. Acta Geol. Sin. 68, 348–356.
Zhong, N.N., Ren, D.Y., 1990. The alteration of the permo-carboniferous coal-bearingseries in Henan resulting from the coal thermal metamorphism-A preliminaryapproach to the influences of thermal groundwater on coal metamorphism. Geol.Rev. 36, 130–139.
Zhou, X.J., Ni, C.H., Yang, F., 2010. The Paleozoic prototype basins and their tectonic defor-mation in North China and their controlling effects upon hydrocarbon accumulation.Oil Gas Geol. 31, 779–794 (in Chinese with English abstract).
Zou, C.N., Dong, D.Z., Wang, S.J., Li, J.Z., Li, X.J., Wang, Y.M., Li, D.H., Cheng, K.M., 2010.Geological characteristics, formation mechanism and resource potential of shale gasin China. Pet. Explor. Dev. 37, 641–653.
Zuber, M.D., Williamson, J.R., Hill, D.U., Sawyer, W.K., Frantz, J.H., 2002. A comprehensivereservoir evaluation of a shale reservoir-the new Albany shale. SPE, p. 77469.
Zumberge, J., Ferworn, K., Brown, S., 2012. Isotopic reversal (‘rollover’) in shale gasesproduced from the Mississippian Barnett and Fayetteville formations. Mar. Pet.Geol. 31, 43–52.