Embed Size (px)
Citation preview
Introduction and valuation basics
Tano Santos
David L. and Elsie M. Dodd Professor of Finance
Columbia Business School
Heilbrunn Center for Graham & Dodd Investment
Value Investing
ACPM September, 2017 - New York City
October 2017
…………………………………………………………………………………………………………………………………………
INTRODUCTION
…………………………………………………………………………………………………………………………………………
Approaches to Investing
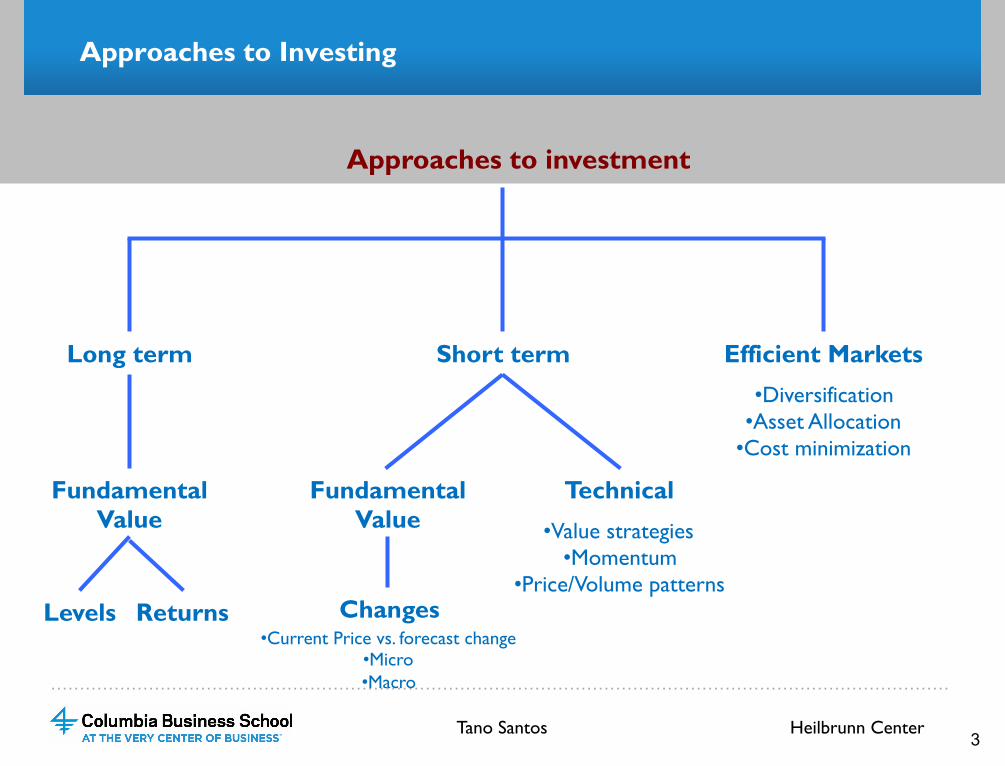
Approaches to investment
Efficient Markets Short term Long term
Fundamental Value
Levels
• Diversification • Asset Allocation
• Cost minimization
Fundamental Value
Changes • Current Price vs. forecast change
• Micro • Macro
Technical
• Value strategies • Momentum
• Price/Volume patterns
3 Tano Santos Heilbrunn Center
Returns
…………………………………………………………………………………………………………………………………………
What is value investing? Premises and an operational definition
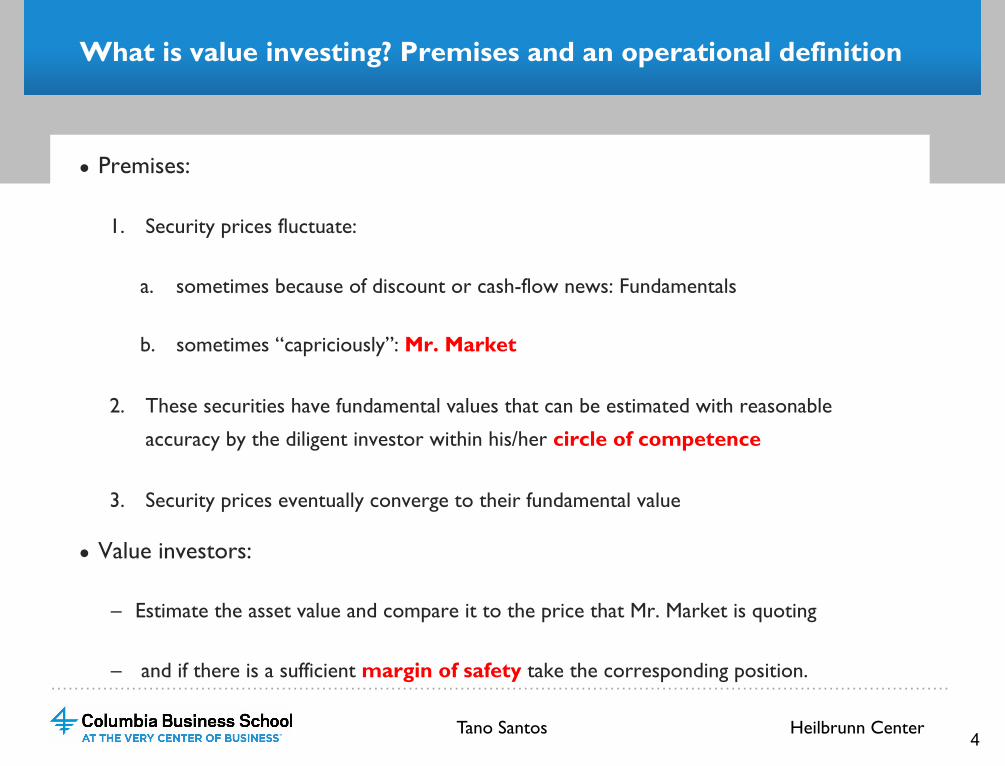
● Premises:
1. Security prices fluctuate:
a. sometimes because of discount or cash-flow news: Fundamentals
b. sometimes “capriciously”: Mr. Market
2. These securities have fundamental values that can be estimated with reasonable
accuracy by the diligent investor within his/her circle of competence
3. Security prices eventually converge to their fundamental value
● Value investors:
– Estimate the asset value and compare it to the price that Mr. Market is quoting
– and if there is a sufficient margin of safety take the corresponding position.
4
Heilbrunn Center Tano Santos
…………………………………………………………………………………………………………………………………………
Why Value Investing?
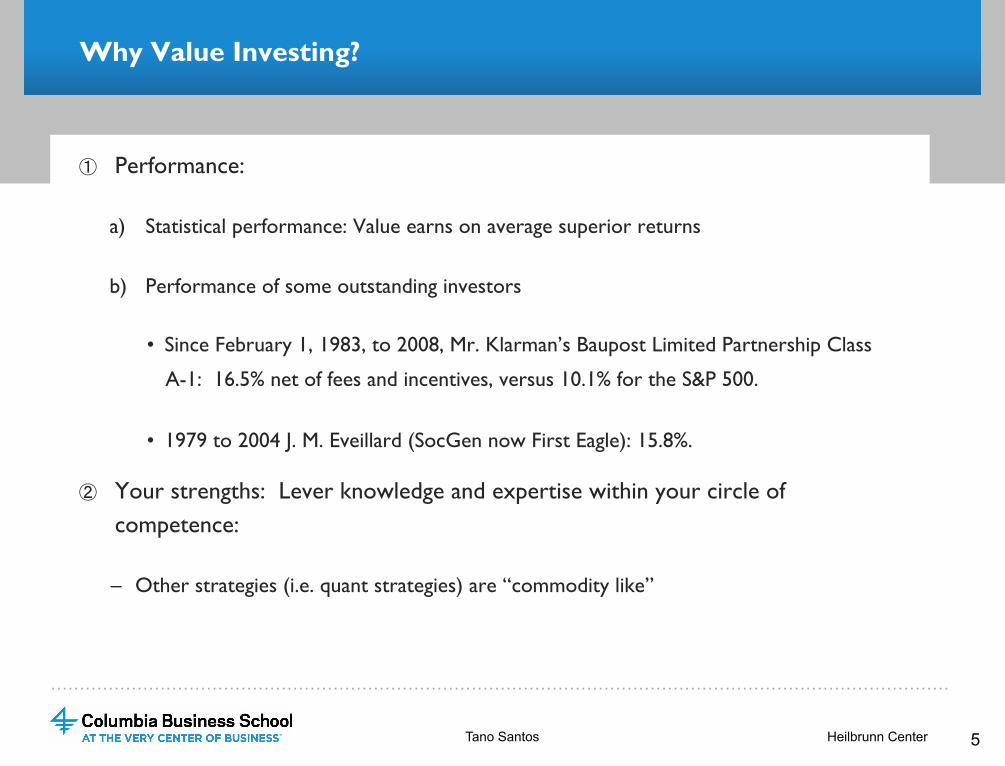
① Performance:
a) Statistical performance: Value earns on average superior returns
b) Performance of some outstanding investors
• Since February 1, 1983, to 2008, Mr. Klarman’s Baupost Limited Partnership Class
A-1: 16.5% net of fees and incentives, versus 10.1% for the S&P 500.
• 1979 to 2004 J. M. Eveillard (SocGen now First Eagle): 15.8%.
② Your strengths: Lever knowledge and expertise within your circle of competence:
– Other strategies (i.e. quant strategies) are “commodity like”
5 Heilbrunn Center Tano Santos
…………………………………………………………………………………………………………………………………………
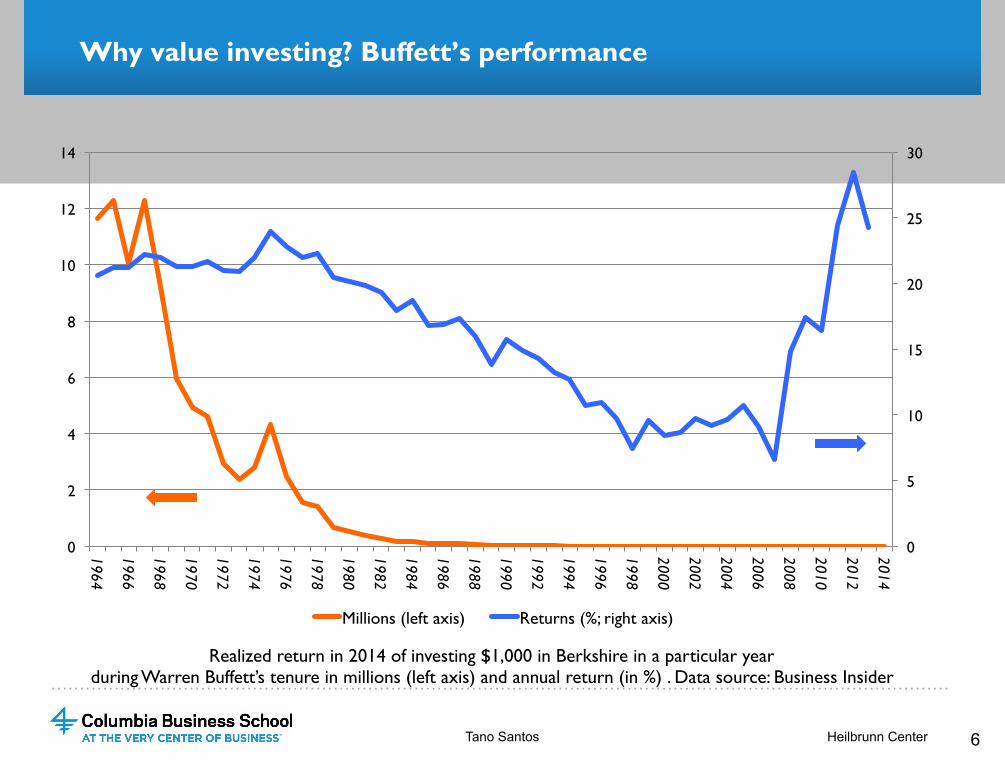
Why value investing? Buffett’s performance
6
0
5
10
15
20
25
30
0
2
4
6
8
10
12
14
1964
1966
1968
1970
1972
1974
1976
1978
1980
1982
1984
1986
1988
1990
1992
1994
1996
1998
2000
2002
2004
2006
2008
2010
2012
2014
Millions (left axis) Returns (%; right axis)
Tano Santos Heilbrunn Center
Realized return in 2014 of investing $1,000 in Berkshire in a particular year during Warren Buffett’s tenure in millions (left axis) and annual return (in %) . Data source: Business Insider
…………………………………………………………………………………………………………………………………………
Why Isn’t Everyone a Value Investor?
● Value investing is psychologically unnatural:
① It requires looking at the ugly, despised firms.
② It requires investing when (March 2009) and where nobody is (in car-related
companies, for example).
③ It requires patience and inaction.
④ It requires holding positions for an extended period of time: Low turnover compared
with mutual fund managers.
⑤ It requires holding cash in the presence of roaring markets.
⑥ Most importantly value investing requires discipline and humility, coming to terms with
one’s psychological flaws and a constant process of review
7 Heilbrunn Center Tano Santos
…………………………………………………………………………………………………………………………………………
What value investing is not: Speculation
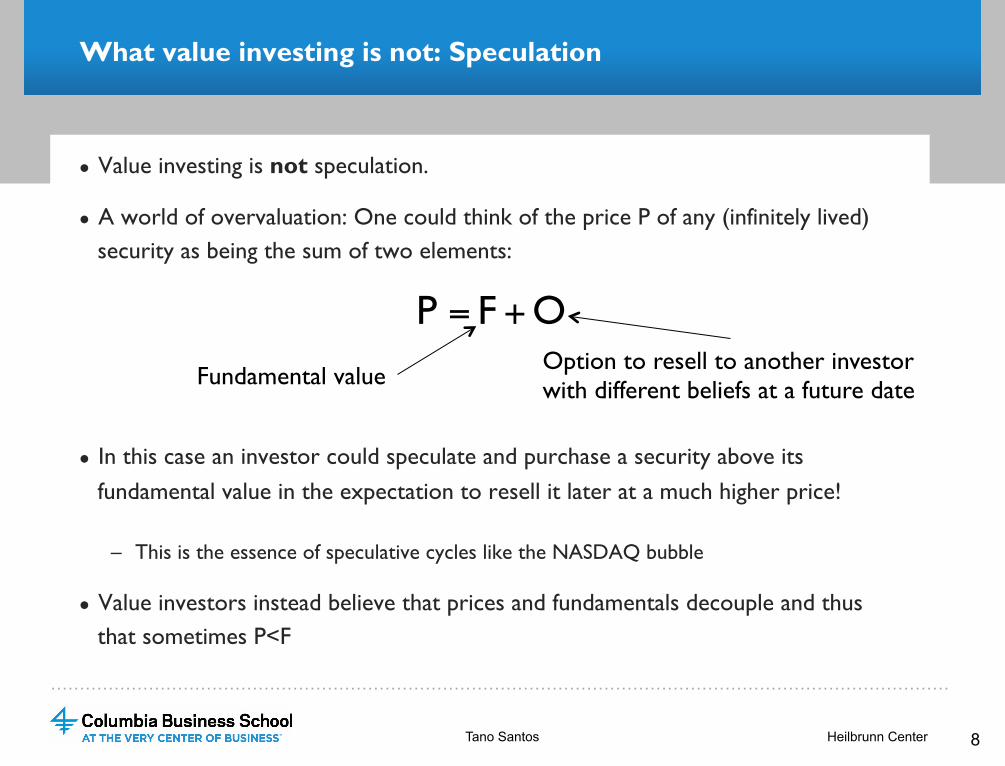
● Value investing is not speculation.
● A world of overvaluation: One could think of the price P of any (infinitely lived) security as being the sum of two elements:
● In this case an investor could speculate and purchase a security above its fundamental value in the expectation to resell it later at a much higher price!
– This is the essence of speculative cycles like the NASDAQ bubble
● Value investors instead believe that prices and fundamentals decouple and thus that sometimes P<F
8
OFP +=
Fundamental value Option to resell to another investor with different beliefs at a future date
Heilbrunn Center Tano Santos
…………………………………………………………………………………………………………………………………………
Value investing: Two ideas
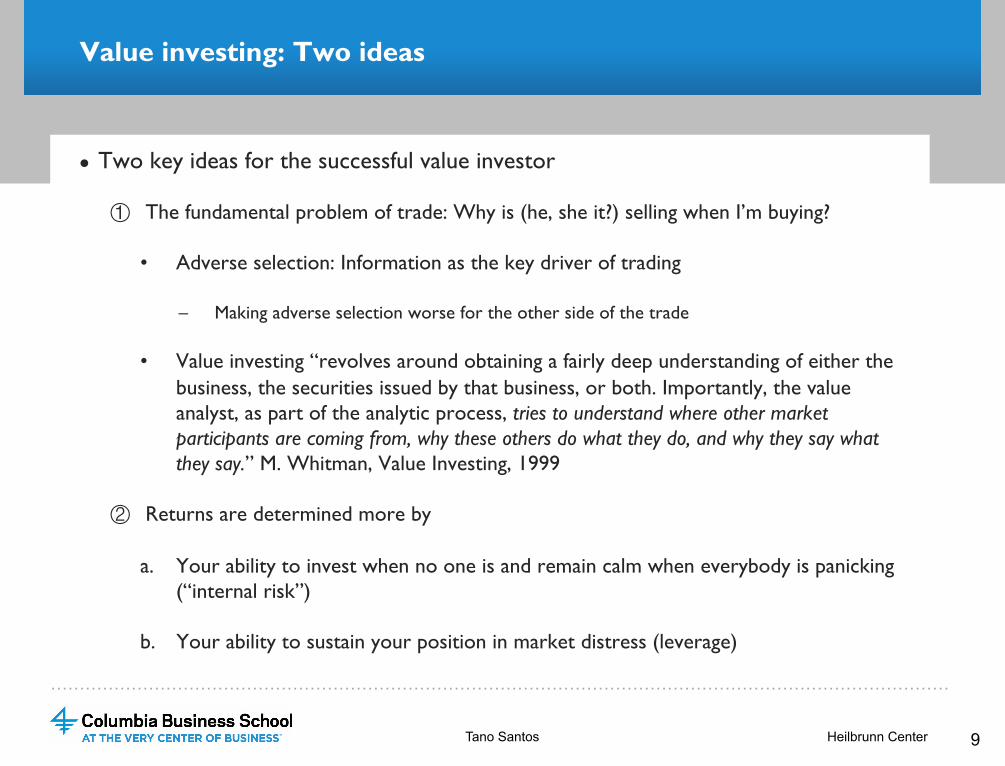
● Two key ideas for the successful value investor
① The fundamental problem of trade: Why is (he, she it?) selling when I’m buying?
• Adverse selection: Information as the key driver of trading
– Making adverse selection worse for the other side of the trade
• Value investing “revolves around obtaining a fairly deep understanding of either the business, the securities issued by that business, or both. Importantly, the value analyst, as part of the analytic process, tries to understand where other market participants are coming from, why these others do what they do, and why they say what they say.” M. Whitman, Value Investing, 1999
② Returns are determined more by
a. Your ability to invest when no one is and remain calm when everybody is panicking (“internal risk”)
b. Your ability to sustain your position in market distress (leverage)
9 Tano Santos Heilbrunn Center
…………………………………………………………………………………………………………………………………………
Value investing: The psychological makeup of the value investor
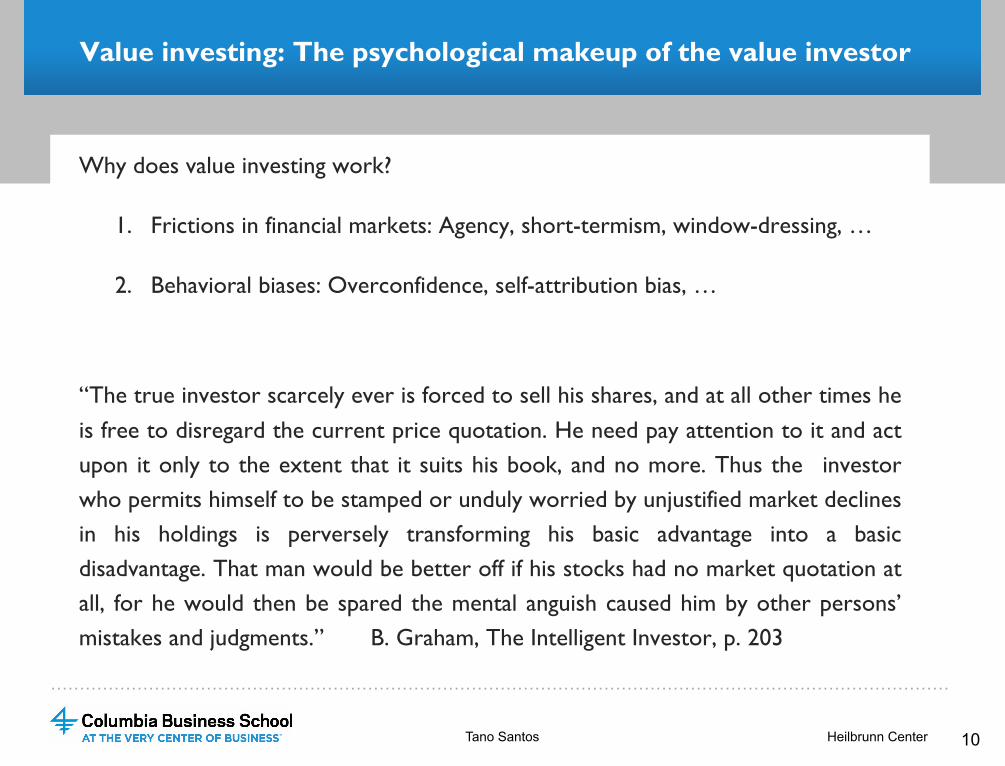
Why does value investing work?
1. Frictions in financial markets: Agency, short-termism, window-dressing, …
2. Behavioral biases: Overconfidence, self-attribution bias, …
“The true investor scarcely ever is forced to sell his shares, and at all other times he is free to disregard the current price quotation. He need pay attention to it and act upon it only to the extent that it suits his book, and no more. Thus the investor who permits himself to be stamped or unduly worried by unjustified market declines in his holdings is perversely transforming his basic advantage into a basic disadvantage. That man would be better off if his stocks had no market quotation at all, for he would then be spared the mental anguish caused him by other persons’ mistakes and judgments.” B. Graham, The Intelligent Investor, p. 203
10 Heilbrunn Center Tano Santos
…………………………………………………………………………………………………………………………………………
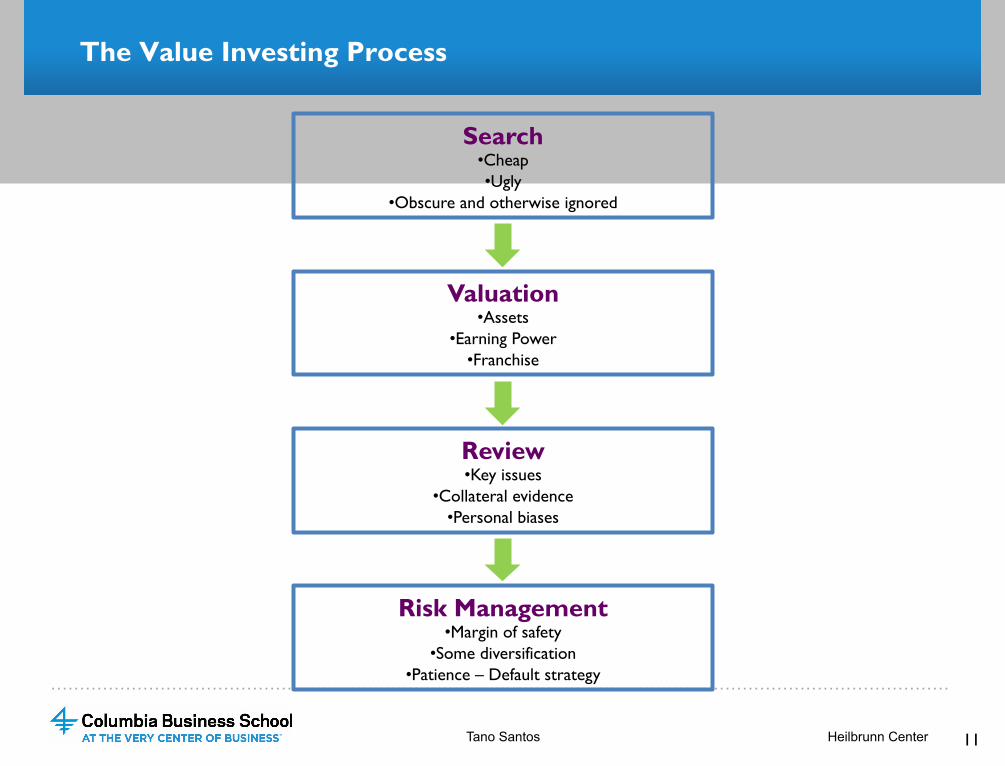
Risk Management • Margin of safety
• Some diversification • Patience – Default strategy
The Value Investing Process
Search • Cheap • Ugly
• Obscure and otherwise ignored
Valuation • Assets
• Earning Power • Franchise
Review • Key issues
• Collateral evidence • Personal biases
11 Tano Santos Heilbrunn Center
…………………………………………………………………………………………………………………………………………
The main idea: Asset, earnings power and franchise values
● A firm is a collection of assets, tangible and intangible, and liabilities.
● Out of these assets flow earnings which are determined by:
– Management’s ability to deploy these assets efficiently
– The firm’s competitive position in the (viable) industry in which it operates
– The investment opportunities available to the firm
● If assets are used efficiently and the firm operates in a competitive environment:
– Valuing the firm by valuing the assets (AV) or
– Valuing the firm by pricing the stream of sustainable earnings that it generates (EPV)
should yield approximately the same number.
12 Heilbrunn Center Tano Santos
…………………………………………………………………………………………………………………………………………
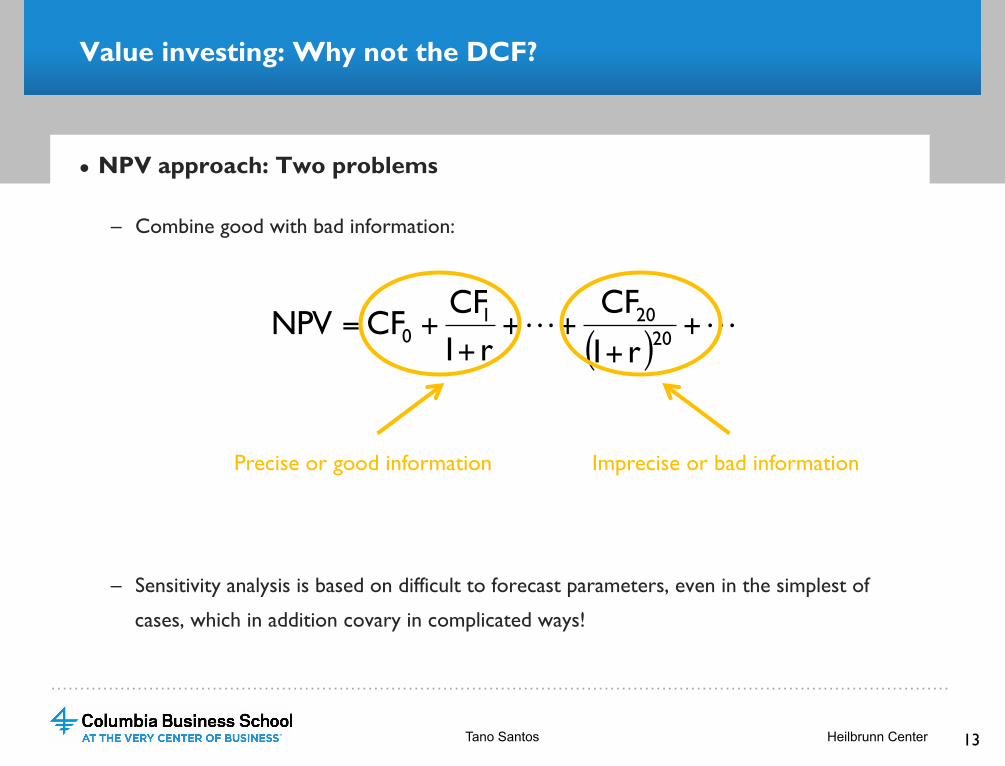
Value investing: Why not the DCF?
● NPV approach: Two problems
– Combine good with bad information:
– Sensitivity analysis is based on difficult to forecast parameters, even in the simplest of
cases, which in addition covary in complicated ways!
( )!! +
+++
++= 20
2010 r1
CFr1CF
CFNPV
Precise or good information Imprecise or bad information
13 Tano Santos Heilbrunn Center
…………………………………………………………………………………………………………………………………………
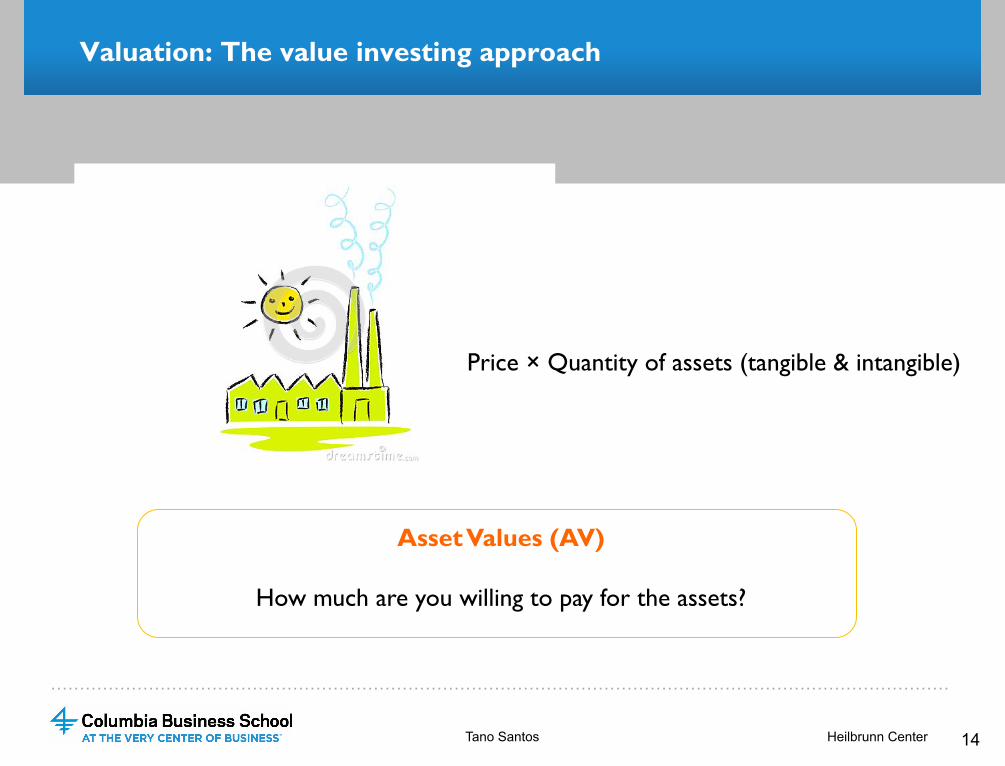
Valuation: The value investing approach
14
Asset Values (AV)
How much are you willing to pay for the assets?
Price × Quantity of assets (tangible & intangible)
Tano Santos Heilbrunn Center
…………………………………………………………………………………………………………………………………………
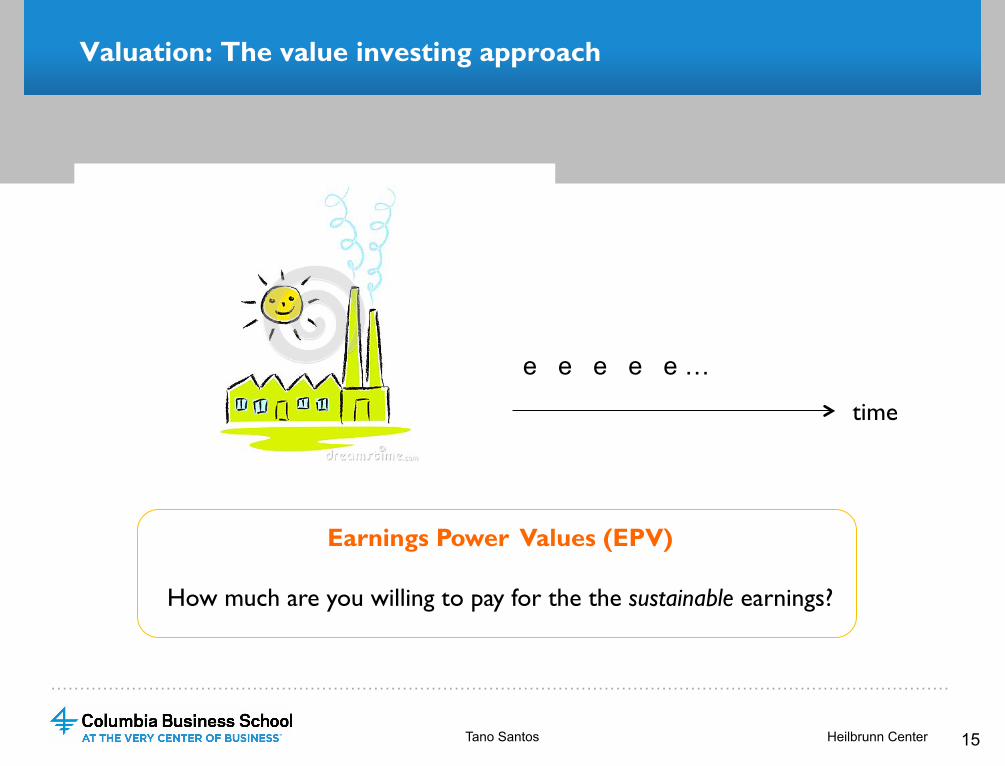
Valuation: The value investing approach
15
Earnings Power Values (EPV)
How much are you willing to pay for the the sustainable earnings?
e e e e e …
Tano Santos Heilbrunn Center
time
…………………………………………………………………………………………………………………………………………
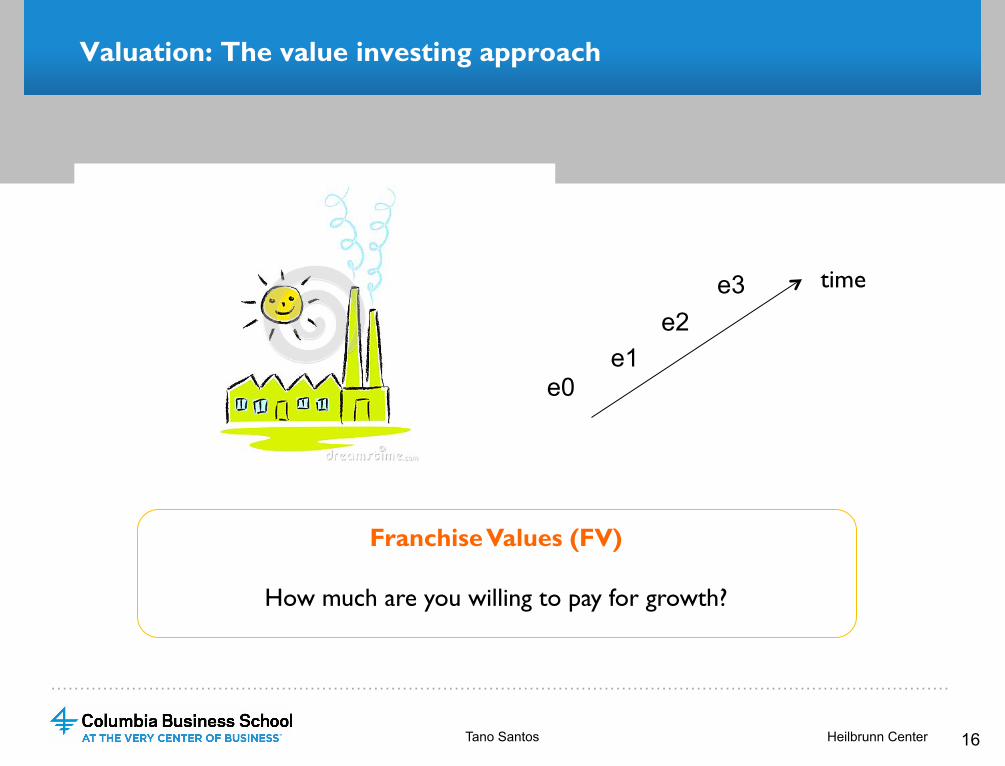
Valuation: The value investing approach
16
Franchise Values (FV)
How much are you willing to pay for growth?
e0 e1
e2 e3
Tano Santos Heilbrunn Center
time

…………………………………………………………………………………………………………………………………………
VALUATION: ASSET VALUES
…………………………………………………………………………………………………………………………………………
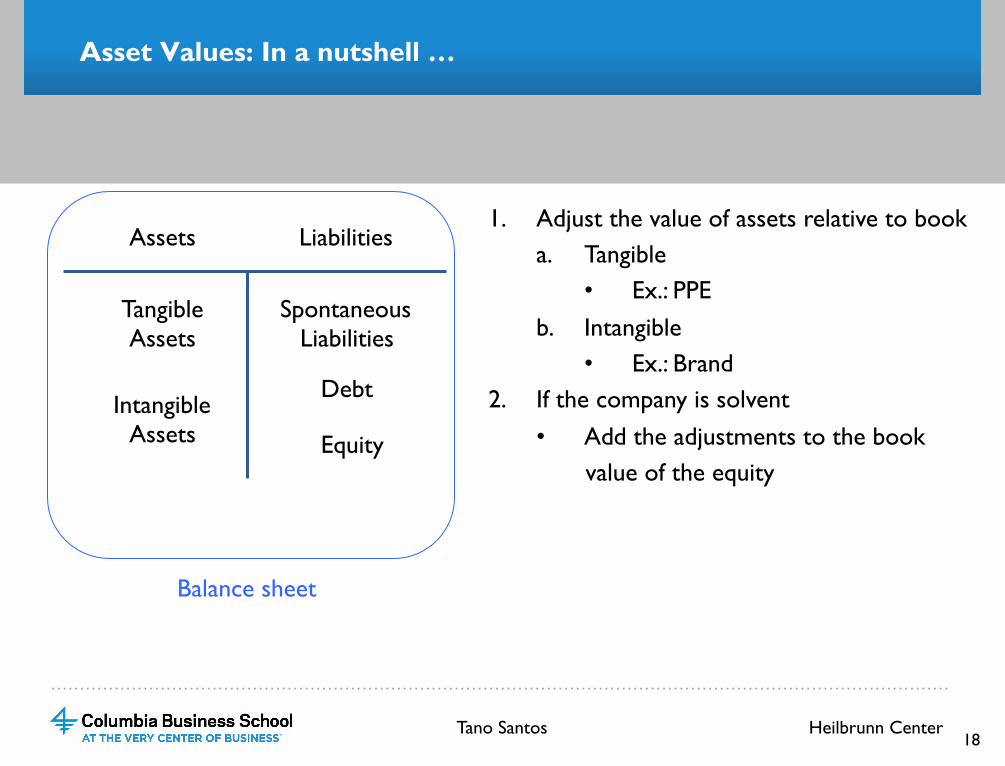
Asset Values: In a nutshell …
18
Tangible Assets
Intangible Assets
Assets Liabilities
Spontaneous Liabilities
Debt
Equity
1. Adjust the value of assets relative to book a. Tangible
• Ex.: PPE b. Intangible
• Ex.: Brand 2. If the company is solvent
• Add the adjustments to the book value of the equity
Tano Santos Heilbrunn Center
Balance sheet
…………………………………………………………………………………………………………………………………………
Asset values
● Question: What does the firm own?
– Valuation of the assets and liabilities of the company
● Focus on the stocks rather than the flows
– Inputs
a. Balance Sheet
– Tangible and intangible assets
– On and off balance sheet liabilities
b. Public and private market transactions, reproduction
19 Tano Santos Heilbrunn Center
…………………………………………………………………………………………………………………………………………
Asset values
● Strategic considerations
① Liquidation values
• Is the industry in decline?
• Are the business operations sustainable?
• Is the firm close to insolvency?
② Reproduction value
• The firm is sustainable
• How much would it take to reproduce the assets and liabilities the firm has?
● Small differences in valuation between both approaches but non material
Tano Santos Heilbrunn Center 20
…………………………………………………………………………………………………………………………………………
Asset values
● AV of equity:
– Book equity
– Plus adjustments to current assets
– Plus adjustments to PPE
– Plus adjustments to goodwill
– Plus adjustment to affiliates reported under the equity method
– Plus missing intangibles:
• Product portfolio, customers & workers
Tano Santos Heilbrunn Center 21
…………………………………………………………………………………………………………………………………………
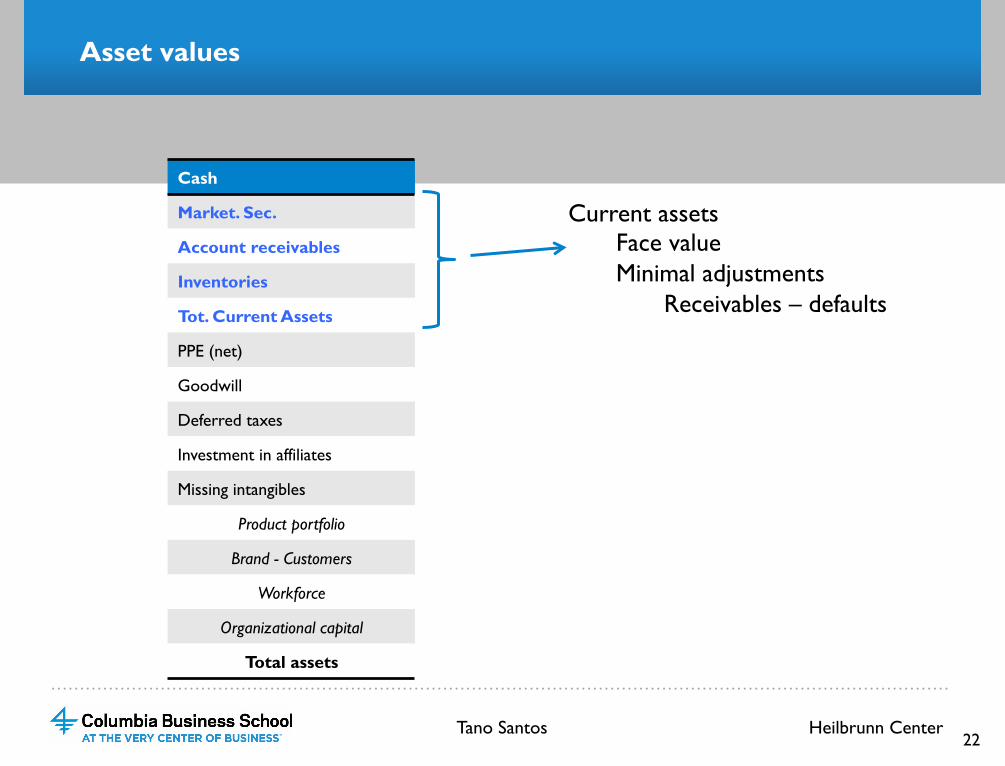
Asset values
Cash
Market. Sec.
Account receivables
Inventories
Tot. Current Assets
PPE (net)
Goodwill
Deferred taxes
Investment in affiliates
Missing intangibles
Product portfolio
Brand - Customers
Workforce
Organizational capital
Total assets
Current assets Face value Minimal adjustments
Receivables – defaults
Tano Santos Heilbrunn Center 22
…………………………………………………………………………………………………………………………………………
Asset values
Cash
Market. Sec.
Account receivables
Inventories
Tot. Current Assets
PPE (net)
Goodwill
Deferred taxes
Investment in affiliates
Missing intangibles
Product portfolio
Brand - Customers
Workforce
Organizational capital
Total assets
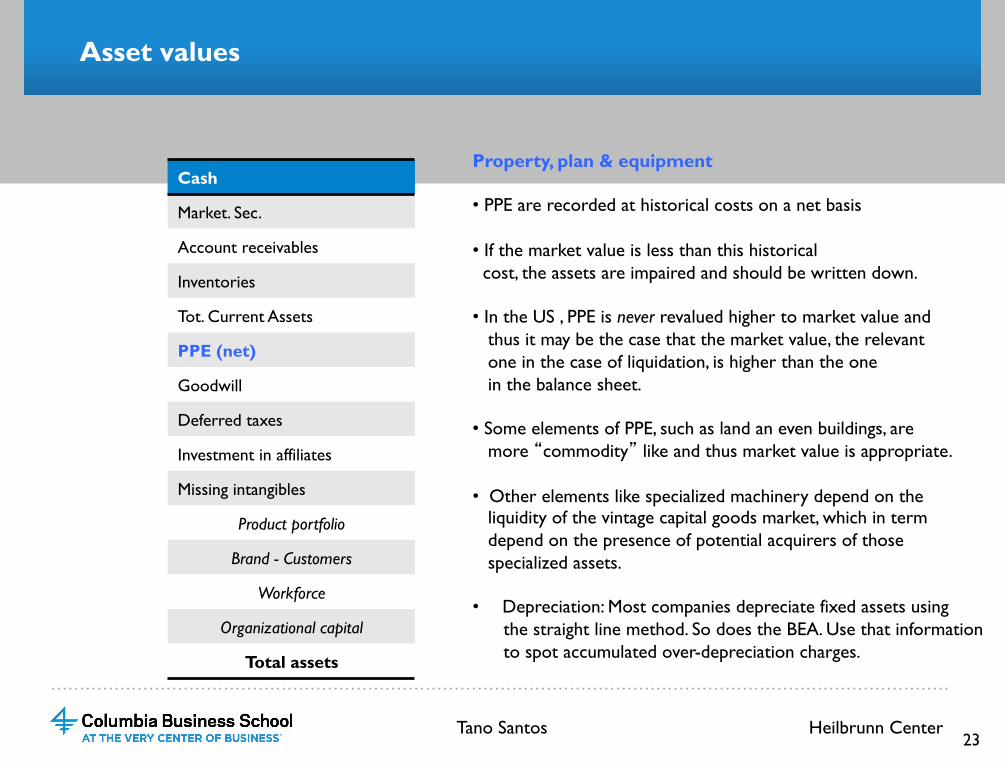
Property, plan & equipment
• PPE are recorded at historical costs on a net basis • If the market value is less than this historical cost, the assets are impaired and should be written down. • In the US , PPE is never revalued higher to market value and thus it may be the case that the market value, the relevant one in the case of liquidation, is higher than the one in the balance sheet. • Some elements of PPE, such as land an even buildings, are more “commodity” like and thus market value is appropriate. • Other elements like specialized machinery depend on the liquidity of the vintage capital goods market, which in term depend on the presence of potential acquirers of those specialized assets. • Depreciation: Most companies depreciate fixed assets using the straight line method. So does the BEA. Use that information to spot accumulated over-depreciation charges.
Tano Santos Heilbrunn Center 23
…………………………………………………………………………………………………………………………………………
Asset values
Cash
Market. Sec.
Account receivables
Inventories
Tot. Current Assets
PPE (net)
Goodwill
Deferred taxes
Investment in affiliates
Missing intangibles
Product portfolio
Brand - Customers
Workforce
Organizational capital
Total assets
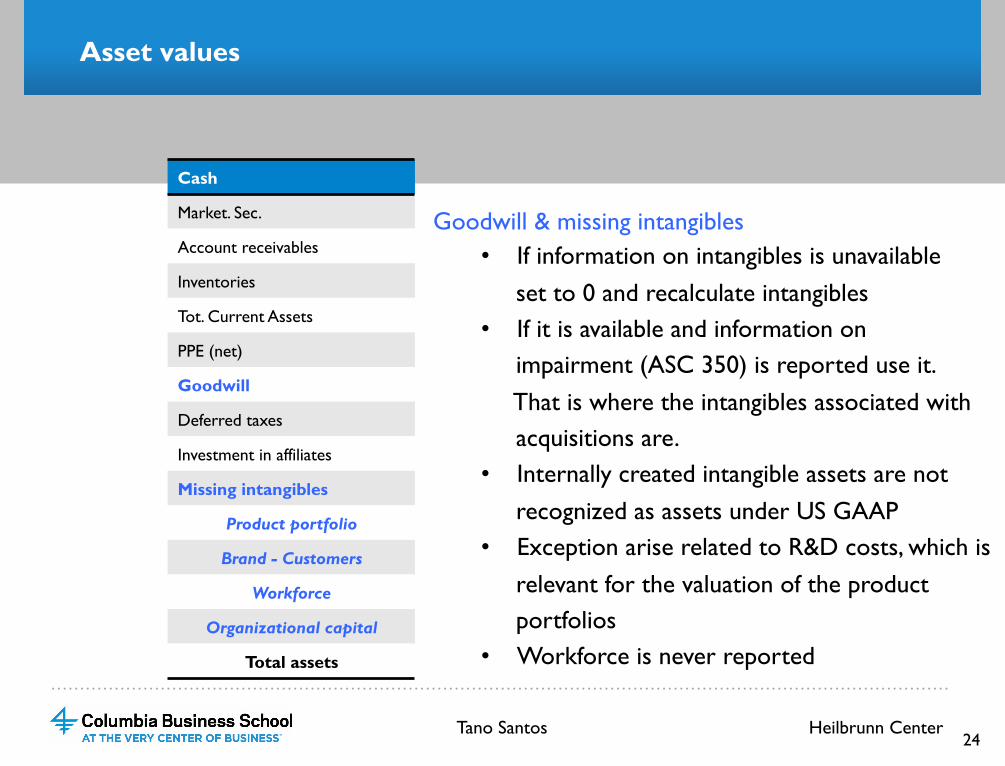
Goodwill & missing intangibles • If information on intangibles is unavailable set to 0 and recalculate intangibles • If it is available and information on impairment (ASC 350) is reported use it. That is where the intangibles associated with acquisitions are. • Internally created intangible assets are not recognized as assets under US GAAP • Exception arise related to R&D costs, which is relevant for the valuation of the product portfolios • Workforce is never reported
Tano Santos Heilbrunn Center 24
…………………………………………………………………………………………………………………………………………
Asset values
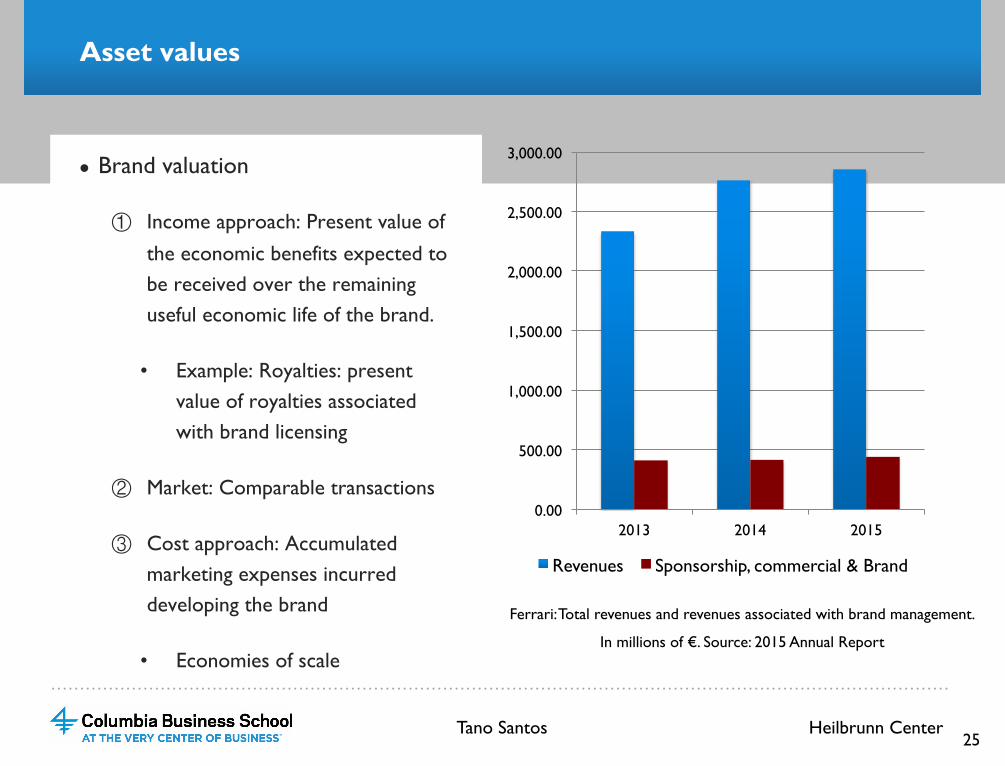
● Brand valuation
① Income approach: Present value of the economic benefits expected to be received over the remaining useful economic life of the brand.
• Example: Royalties: present value of royalties associated with brand licensing
② Market: Comparable transactions
③ Cost approach: Accumulated marketing expenses incurred developing the brand
• Economies of scale
0.00
500.00
1,000.00
1,500.00
2,000.00
2,500.00
3,000.00
2013 2014 2015
Revenues Sponsorship, commercial & Brand
Ferrari: Total revenues and revenues associated with brand management.
In millions of €. Source: 2015 Annual Report
Tano Santos Heilbrunn Center 25
…………………………………………………………………………………………………………………………………………
Asset values
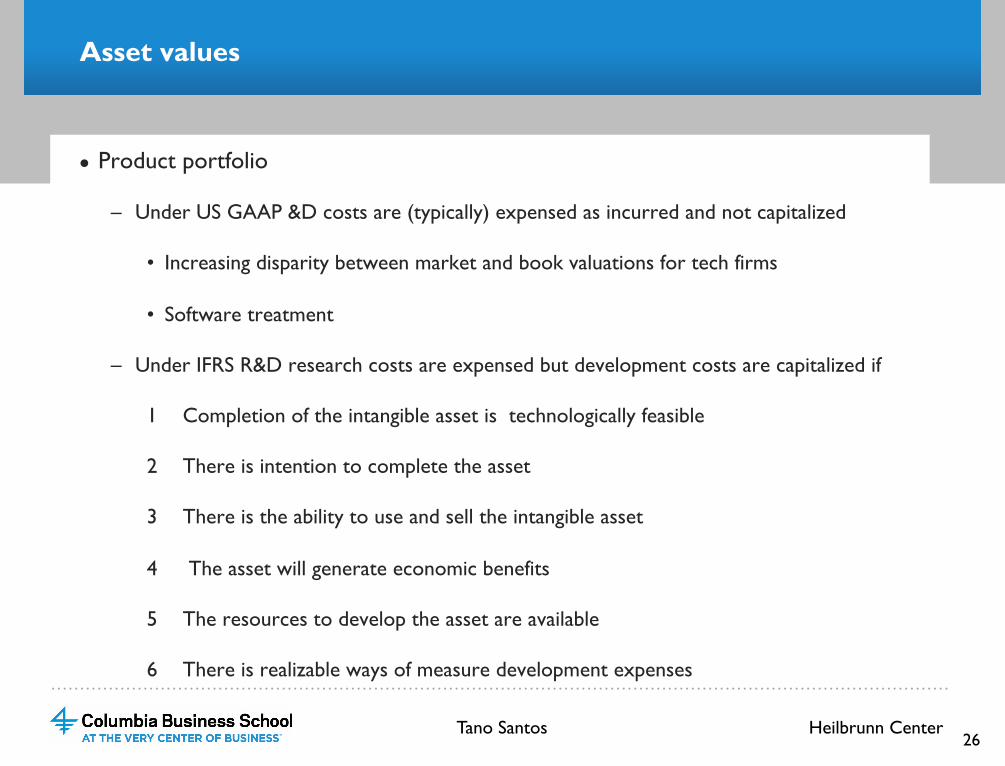
● Product portfolio
– Under US GAAP &D costs are (typically) expensed as incurred and not capitalized
• Increasing disparity between market and book valuations for tech firms
• Software treatment
– Under IFRS R&D research costs are expensed but development costs are capitalized if
1 Completion of the intangible asset is technologically feasible
2 There is intention to complete the asset
3 There is the ability to use and sell the intangible asset
4 The asset will generate economic benefits
5 The resources to develop the asset are available
6 There is realizable ways of measure development expenses
Tano Santos Heilbrunn Center 26
…………………………………………………………………………………………………………………………………………
Asset values
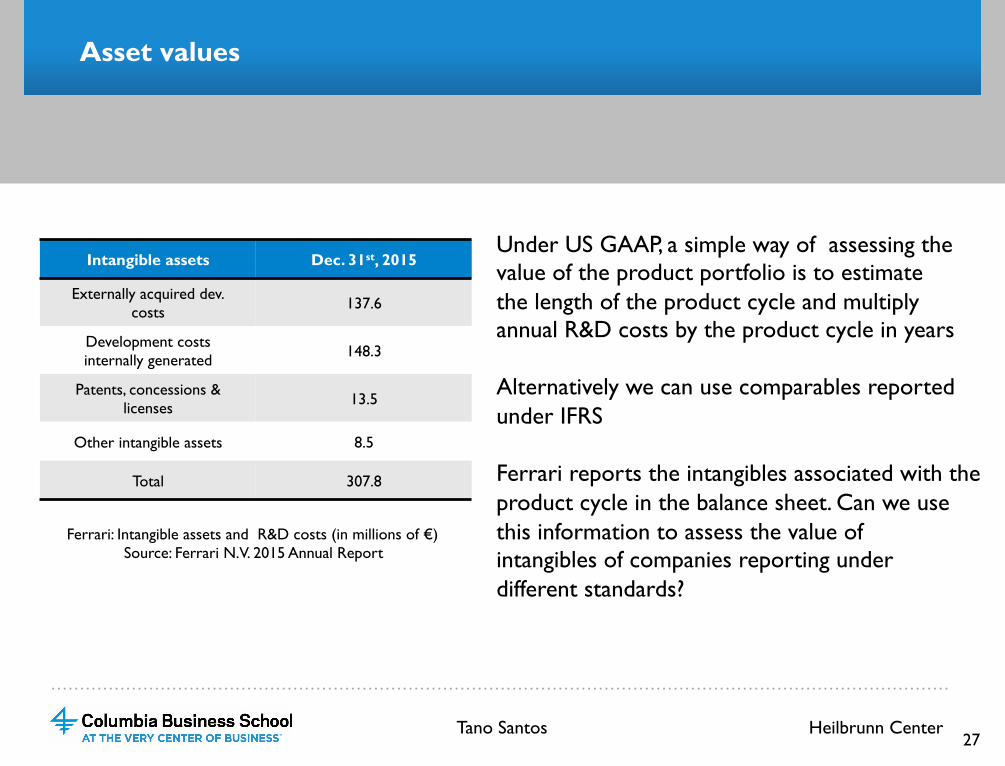
Intangible assets Dec. 31st, 2015
Externally acquired dev. costs 137.6
Development costs internally generated 148.3
Patents, concessions & licenses 13.5
Other intangible assets 8.5
Total 307.8
Ferrari: Intangible assets and R&D costs (in millions of €) Source: Ferrari N.V. 2015 Annual Report
Under US GAAP, a simple way of assessing the value of the product portfolio is to estimate the length of the product cycle and multiply annual R&D costs by the product cycle in years Alternatively we can use comparables reported under IFRS Ferrari reports the intangibles associated with the product cycle in the balance sheet. Can we use this information to assess the value of intangibles of companies reporting under different standards?
Tano Santos Heilbrunn Center 27
…………………………………………………………………………………………………………………………………………
Asset values
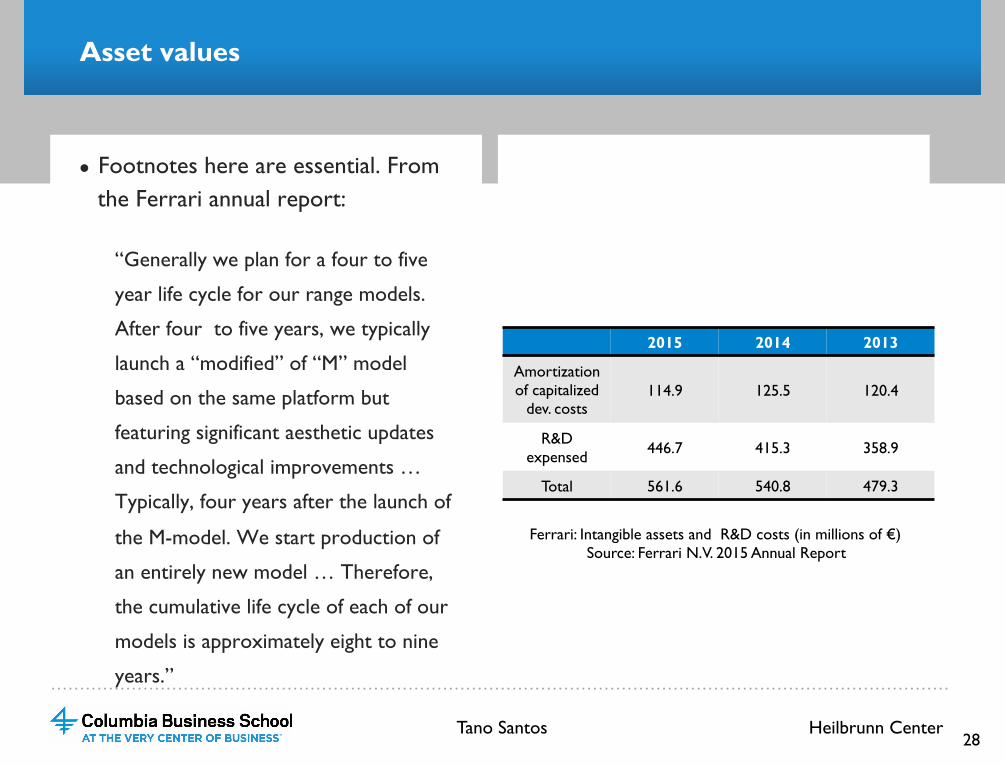
● Footnotes here are essential. From the Ferrari annual report:
“Generally we plan for a four to five
year life cycle for our range models.
After four to five years, we typically
launch a “modified” of “M” model
based on the same platform but
featuring significant aesthetic updates
and technological improvements …
Typically, four years after the launch of
the M-model. We start production of
an entirely new model … Therefore,
the cumulative life cycle of each of our
models is approximately eight to nine
years.”
2015 2014 2013
Amortization of capitalized
dev. costs 114.9 125.5 120.4
R&D expensed 446.7 415.3 358.9
Total 561.6 540.8 479.3
Ferrari: Intangible assets and R&D costs (in millions of €) Source: Ferrari N.V. 2015 Annual Report
Tano Santos Heilbrunn Center 28
…………………………………………………………………………………………………………………………………………
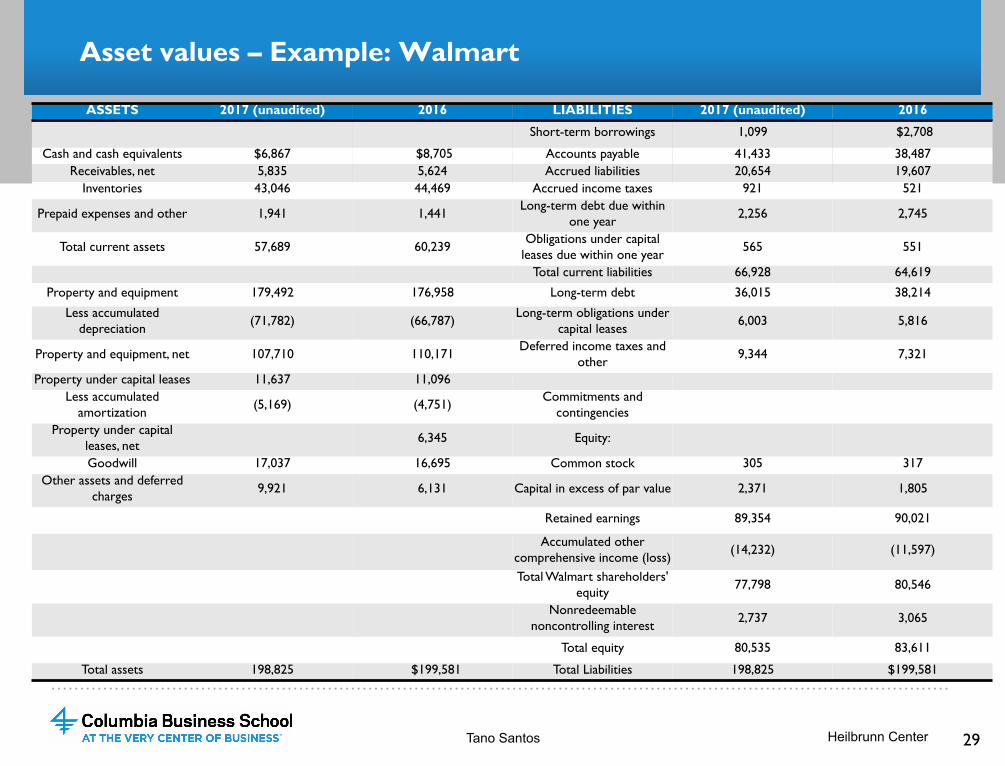
Asset values – Example: Walmart
ASSETS 2017 (unaudited) 2016 LIABILITIES 2017 (unaudited) 2016
Short-term borrowings 1,099 $2,708
Cash and cash equivalents $6,867 $8,705 Accounts payable 41,433 38,487 Receivables, net 5,835 5,624 Accrued liabilities 20,654 19,607
Inventories 43,046 44,469 Accrued income taxes 921 521
Prepaid expenses and other 1,941 1,441 Long-term debt due within one year 2,256 2,745
Total current assets 57,689 60,239 Obligations under capital leases due within one year 565 551
Total current liabilities 66,928 64,619
Property and equipment 179,492 176,958 Long-term debt 36,015 38,214
Less accumulated depreciation (71,782) (66,787) Long-term obligations under
capital leases 6,003 5,816
Property and equipment, net 107,710 110,171 Deferred income taxes and other 9,344 7,321
Property under capital leases 11,637 11,096 Less accumulated
amortization (5,169) (4,751) Commitments and contingencies
Property under capital leases, net 6,345 Equity:
Goodwill 17,037 16,695 Common stock 305 317 Other assets and deferred
charges 9,921 6,131 Capital in excess of par value 2,371 1,805
Retained earnings 89,354 90,021
Accumulated other comprehensive income (loss) (14,232) (11,597)
Total Walmart shareholders' equity 77,798 80,546
Nonredeemable noncontrolling interest 2,737 3,065
Total equity 80,535 83,611
Total assets 198,825 $199,581 Total Liabilities 198,825 $199,581
29 Tano Santos Heilbrunn Center
…………………………………………………………………………………………………………………………………………
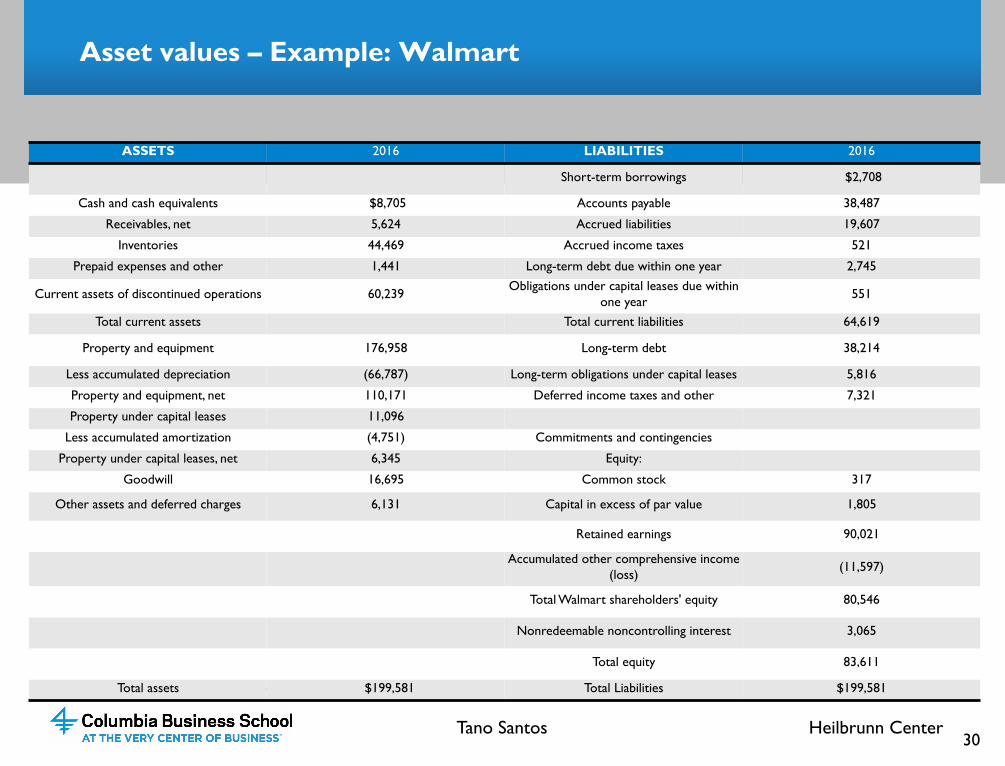
Asset values – Example: Walmart
ASSETS 2016 LIABILITIES 2016
Short-term borrowings $2,708
Cash and cash equivalents $8,705 Accounts payable 38,487
Receivables, net 5,624 Accrued liabilities 19,607
Inventories 44,469 Accrued income taxes 521
Prepaid expenses and other 1,441 Long-term debt due within one year 2,745
Current assets of discontinued operations 60,239 Obligations under capital leases due within one year 551
Total current assets Total current liabilities 64,619
Property and equipment 176,958 Long-term debt 38,214
Less accumulated depreciation (66,787) Long-term obligations under capital leases 5,816
Property and equipment, net 110,171 Deferred income taxes and other 7,321
Property under capital leases 11,096
Less accumulated amortization (4,751) Commitments and contingencies
Property under capital leases, net 6,345 Equity:
Goodwill 16,695 Common stock 317
Other assets and deferred charges 6,131 Capital in excess of par value 1,805
Retained earnings 90,021
Accumulated other comprehensive income (loss) (11,597)
Total Walmart shareholders' equity 80,546
Nonredeemable noncontrolling interest 3,065
Total equity 83,611
Total assets $199,581 Total Liabilities $199,581
30 Tano Santos Heilbrunn Center
…………………………………………………………………………………………………………………………………………
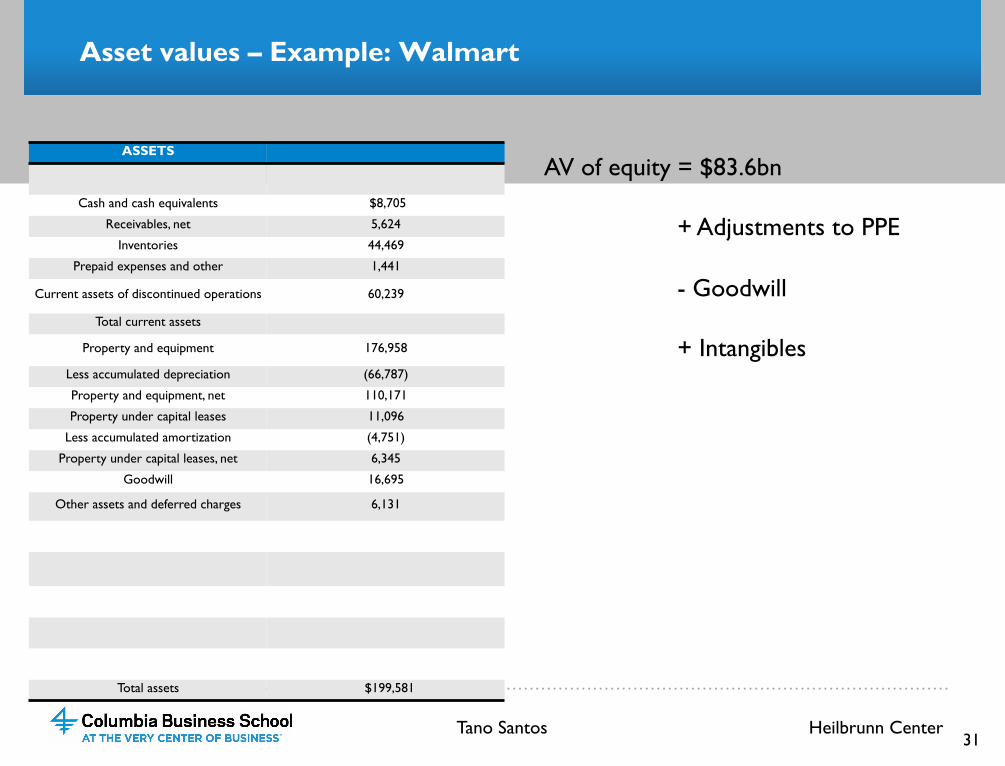
Asset values – Example: Walmart
ASSETS
Cash and cash equivalents $8,705
Receivables, net 5,624
Inventories 44,469
Prepaid expenses and other 1,441
Current assets of discontinued operations 60,239
Total current assets
Property and equipment 176,958
Less accumulated depreciation (66,787)
Property and equipment, net 110,171
Property under capital leases 11,096
Less accumulated amortization (4,751)
Property under capital leases, net 6,345
Goodwill 16,695
Other assets and deferred charges 6,131
Total assets $199,581
31
AV of equity = $83.6bn + Adjustments to PPE - Goodwill + Intangibles
Tano Santos Heilbrunn Center
…………………………………………………………………………………………………………………………………………
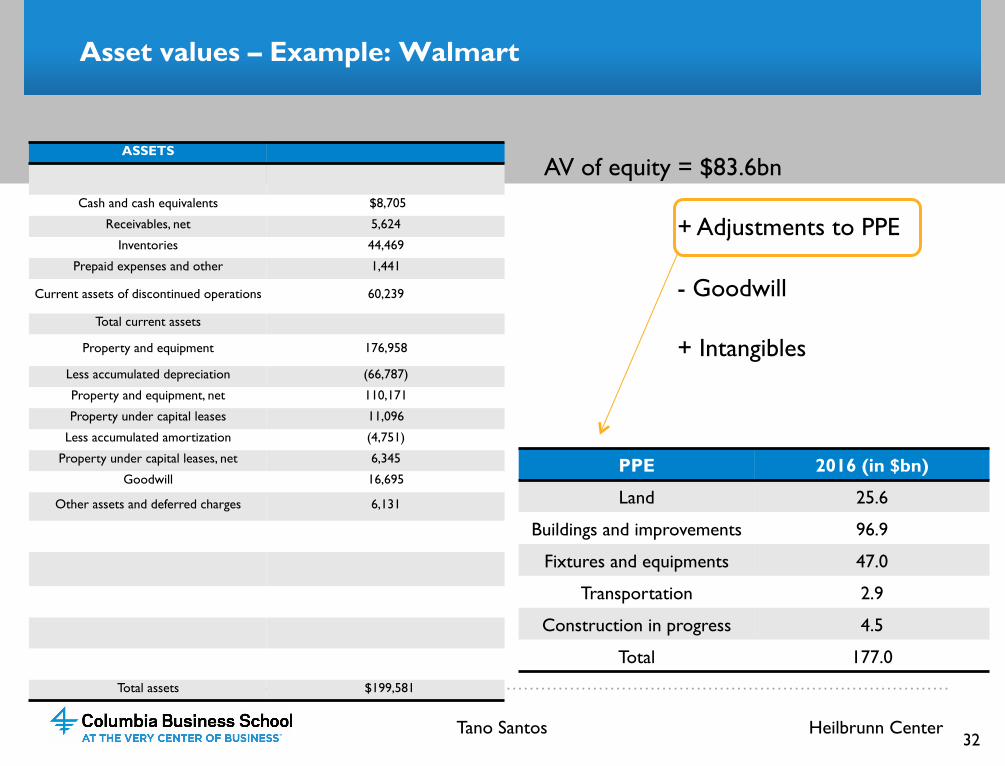
Asset values – Example: Walmart
ASSETS
Cash and cash equivalents $8,705
Receivables, net 5,624
Inventories 44,469
Prepaid expenses and other 1,441
Current assets of discontinued operations 60,239
Total current assets
Property and equipment 176,958
Less accumulated depreciation (66,787)
Property and equipment, net 110,171
Property under capital leases 11,096
Less accumulated amortization (4,751)
Property under capital leases, net 6,345
Goodwill 16,695
Other assets and deferred charges 6,131
Total assets $199,581
32
AV of equity = $83.6bn + Adjustments to PPE - Goodwill + Intangibles PPE 2016 (in $bn)
Land 25.6
Buildings and improvements 96.9
Fixtures and equipments 47.0
Transportation 2.9
Construction in progress 4.5
Total 177.0
Tano Santos Heilbrunn Center
…………………………………………………………………………………………………………………………………………
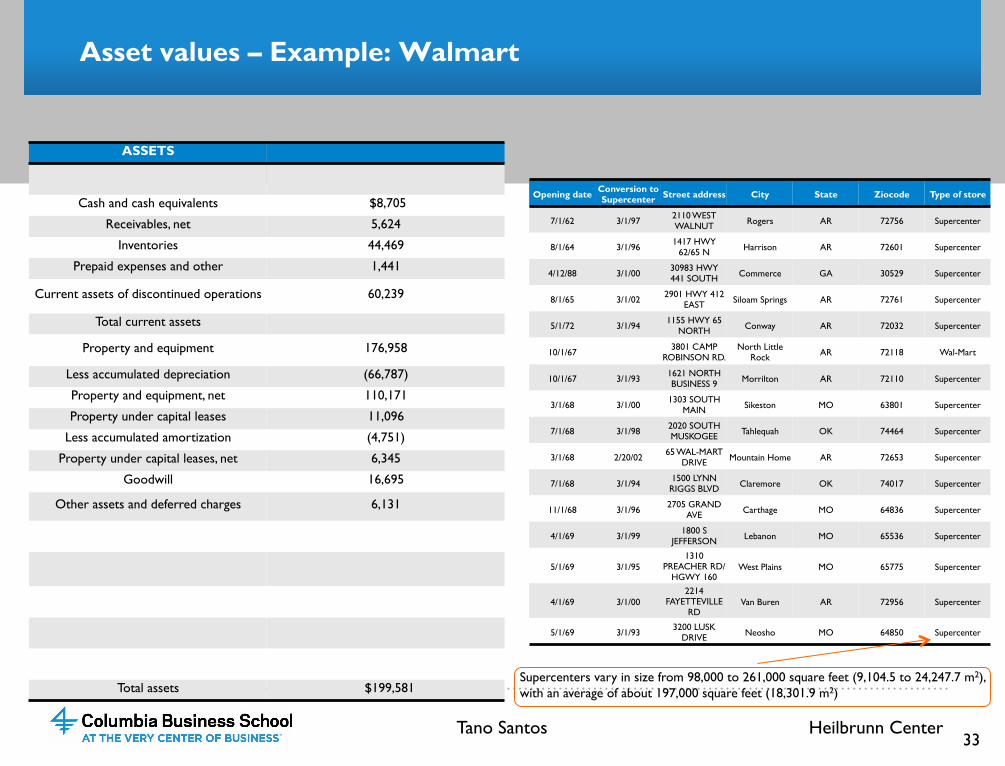
Asset values – Example: Walmart
33
Opening date Conversion to Supercenter Street address City State Ziocode Type of store
7/1/62 3/1/97 2110 WEST WALNUT Rogers AR 72756 Supercenter
8/1/64 3/1/96 1417 HWY
62/65 N Harrison AR 72601 Supercenter
4/12/88 3/1/00 30983 HWY 441 SOUTH Commerce GA 30529 Supercenter
8/1/65 3/1/02 2901 HWY 412
EAST Siloam Springs AR 72761 Supercenter
5/1/72 3/1/94 1155 HWY 65
NORTH Conway AR 72032 Supercenter
10/1/67 3801 CAMP ROBINSON RD.
North Little Rock AR 72118 Wal-Mart
10/1/67 3/1/93 1621 NORTH BUSINESS 9 Morrilton AR 72110 Supercenter
3/1/68 3/1/00 1303 SOUTH MAIN Sikeston MO 63801 Supercenter
7/1/68 3/1/98 2020 SOUTH MUSKOGEE Tahlequah OK 74464 Supercenter
3/1/68 2/20/02 65 WAL-MART DRIVE Mountain Home AR 72653 Supercenter
7/1/68 3/1/94 1500 LYNN RIGGS BLVD Claremore OK 74017 Supercenter
11/1/68 3/1/96 2705 GRAND AVE Carthage MO 64836 Supercenter
4/1/69 3/1/99 1800 S JEFFERSON Lebanon MO 65536 Supercenter
5/1/69 3/1/95 1310
PREACHER RD/HGWY 160
West Plains MO 65775 Supercenter
4/1/69 3/1/00 2214
FAYETTEVILLE RD
Van Buren AR 72956 Supercenter
5/1/69 3/1/93 3200 LUSK DRIVE Neosho MO 64850 Supercenter
Supercenters vary in size from 98,000 to 261,000 square feet (9,104.5 to 24,247.7 m2), with an average of about 197,000 square feet (18,301.9 m2)
ASSETS
Cash and cash equivalents $8,705
Receivables, net 5,624
Inventories 44,469
Prepaid expenses and other 1,441
Current assets of discontinued operations 60,239
Total current assets
Property and equipment 176,958
Less accumulated depreciation (66,787)
Property and equipment, net 110,171
Property under capital leases 11,096
Less accumulated amortization (4,751)
Property under capital leases, net 6,345
Goodwill 16,695
Other assets and deferred charges 6,131
Total assets $199,581
Tano Santos Heilbrunn Center
…………………………………………………………………………………………………………………………………………
Asset values – Example: Walmart
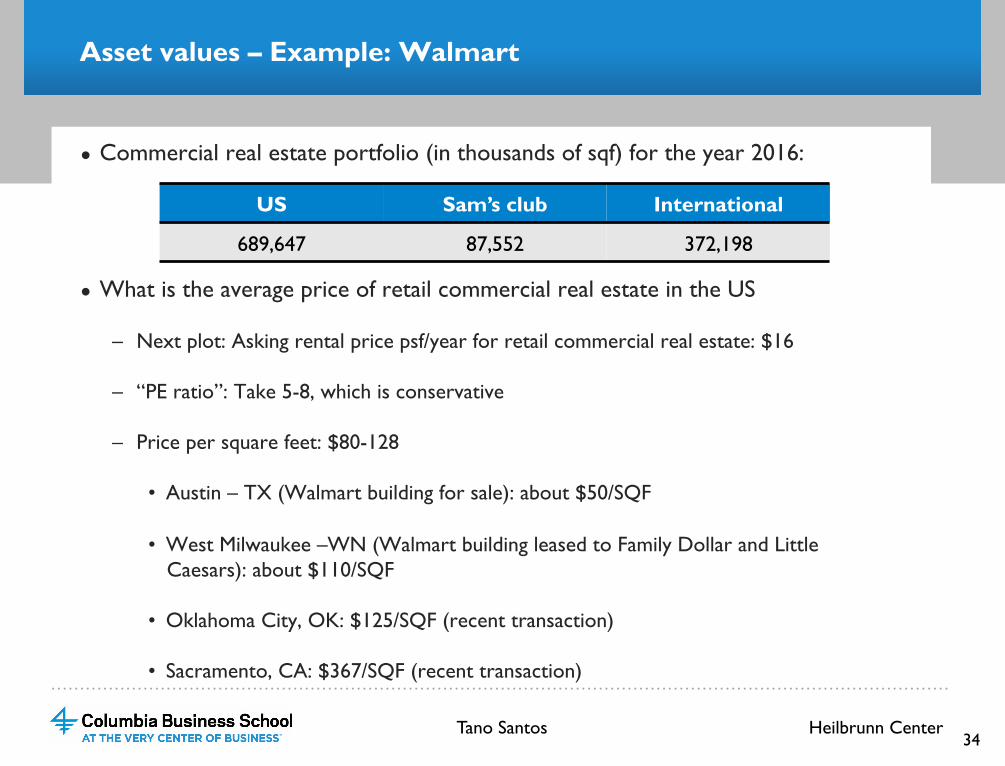
● Commercial real estate portfolio (in thousands of sqf) for the year 2016:
● What is the average price of retail commercial real estate in the US
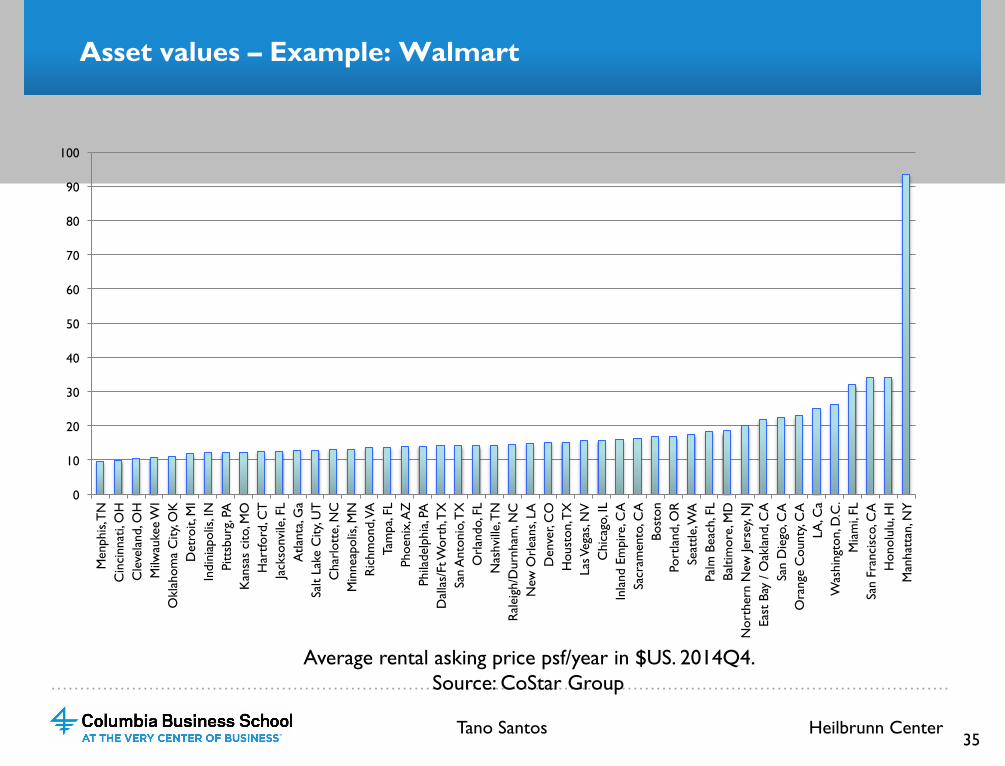
– Next plot: Asking rental price psf/year for retail commercial real estate: $16
– “PE ratio”: Take 5-8, which is conservative
– Price per square feet: $80-128
• Austin – TX (Walmart building for sale): about $50/SQF
• West Milwaukee –WN (Walmart building leased to Family Dollar and Little Caesars): about $110/SQF
• Oklahoma City, OK: $125/SQF (recent transaction)
• Sacramento, CA: $367/SQF (recent transaction)
34
US Sam’s club International
689,647 87,552 372,198
Tano Santos Heilbrunn Center
…………………………………………………………………………………………………………………………………………
Asset values – Example: Walmart
35
0
10
20
30
40
50
60
70
80
90
100
Men
phis
, TN
C
inci
nnat
i, O
H
Cle
vela
nd, O
H
Milw
auke
e W
I O
klah
oma
City
, OK
D
etro
it, M
I In
dini
apol
is, I
N
Pitt
sbur
g, PA
K
ansa
s ci
to, M
O
Har
tford
, CT
Ja
ckso
nvile
, FL
Atla
nta,
Ga
Salt
Lake
City
, UT
C
harl
otte
, NC
M
inne
apol
is, M
N
Ric
hmon
d, V
A
Tam
pa, F
L Ph
oeni
x, A
Z
Phila
delp
hia,
PA
Dal
las/
Ft W
orth
, TX
Sa
n A
nton
io, T
X
Orl
ando
, FL
Nas
hvill
e, T
N
Ral
eigh
/Dur
nham
, NC
N
ew O
rlea
ns, L
A
Den
ver,
CO
H
oust
on, T
X
Las V
egas
, NV
C
hica
go, I
L In
land
Em
pire
, CA
Sa
cram
ento
, CA
Bo
ston
Po
rtla
nd, O
R
Seat
tle, W
A
Palm
Bea
ch, F
L Ba
ltim
ore,
MD
N
orth
ern
New
Jers
ey, N
J Ea
st B
ay /
Oak
land
, CA
Sa
n D
iego
, CA
O
rang
e C
ount
y, C
A
LA, C
a W
ashi
ngto
n, D
.C.
Mia
mi,
FL
San
Fran
cisc
o, C
A
Hon
olul
u, H
I M
anha
ttan
, NY
Average rental asking price psf/year in $US. 2014Q4. Source: CoStar Group
Tano Santos Heilbrunn Center
…………………………………………………………………………………………………………………………………………
Asset values – Example: Walmart
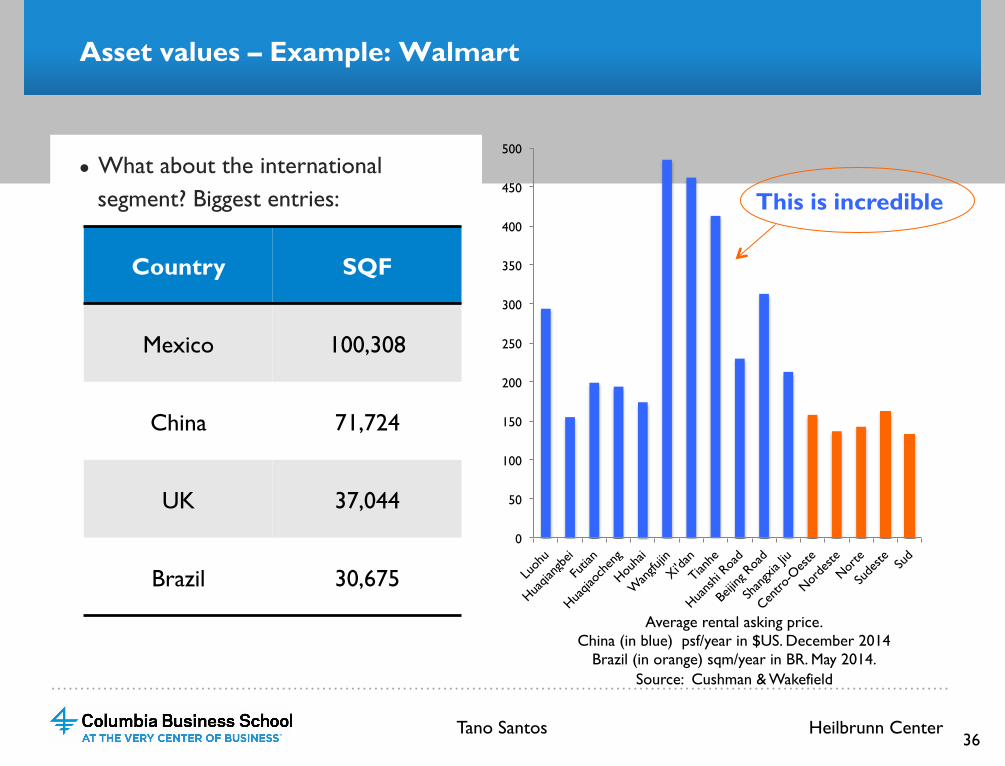
● What about the international segment? Biggest entries:
36
0
50
100
150
200
250
300
350
400
450
500
Country SQF
Mexico 100,308
China 71,724
UK 37,044
Brazil 30,675
Average rental asking price. China (in blue) psf/year in $US. December 2014
Brazil (in orange) sqm/year in BR. May 2014. Source: Cushman & Wakefield
This is incredible
Tano Santos Heilbrunn Center
…………………………………………………………………………………………………………………………………………
Asset values – Example: Walmart
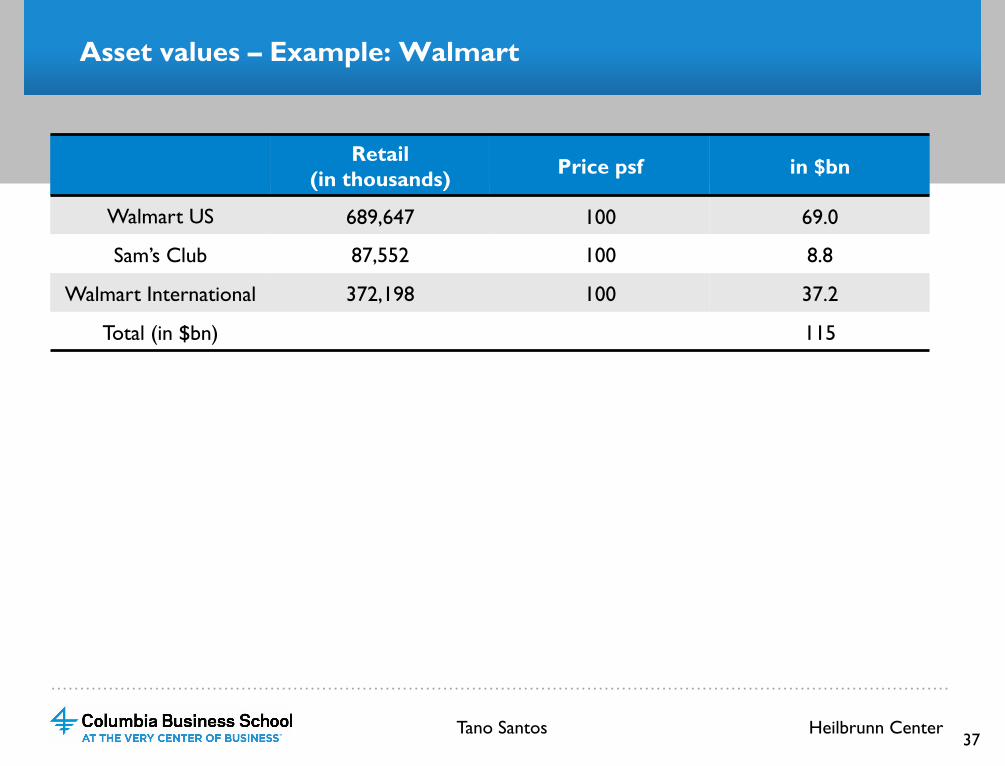
Retail (in thousands) Price psf in $bn
Walmart US 689,647 100 69.0
Sam’s Club 87,552 100 8.8
Walmart International 372,198 100 37.2
Total (in $bn) 115
37 Tano Santos Heilbrunn Center
…………………………………………………………………………………………………………………………………………
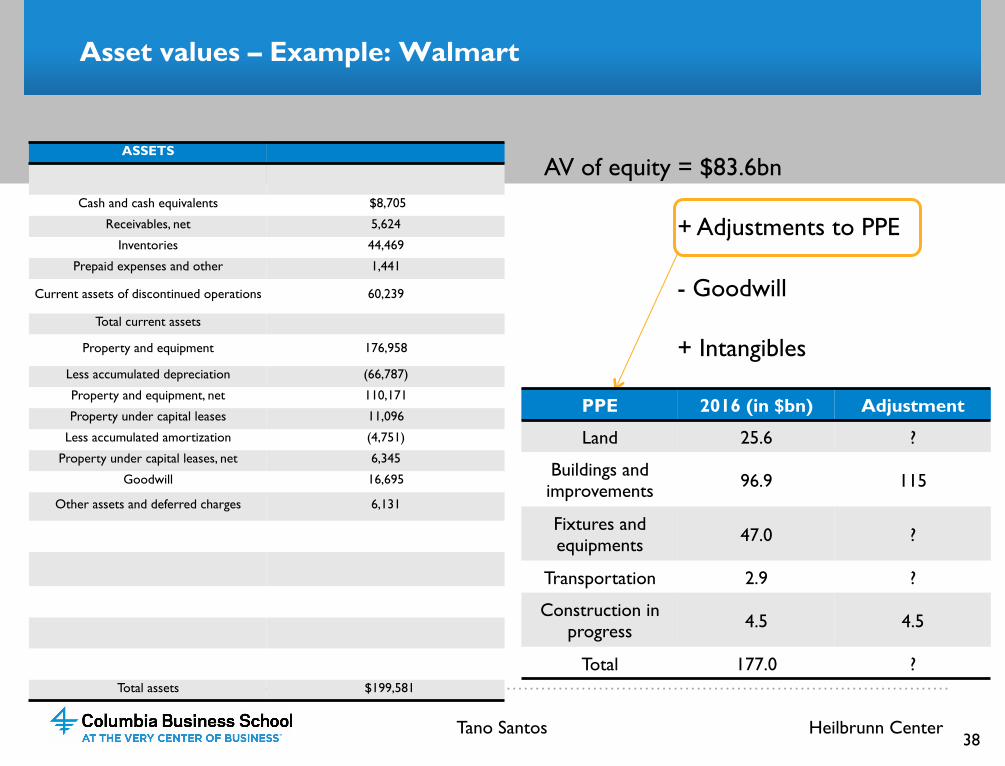
Asset values – Example: Walmart
ASSETS
Cash and cash equivalents $8,705
Receivables, net 5,624
Inventories 44,469
Prepaid expenses and other 1,441
Current assets of discontinued operations 60,239
Total current assets
Property and equipment 176,958
Less accumulated depreciation (66,787)
Property and equipment, net 110,171
Property under capital leases 11,096
Less accumulated amortization (4,751)
Property under capital leases, net 6,345
Goodwill 16,695
Other assets and deferred charges 6,131
Total assets $199,581
38
AV of equity = $83.6bn + Adjustments to PPE - Goodwill + Intangibles
PPE 2016 (in $bn) Adjustment
Land 25.6 ?
Buildings and improvements 96.9 115
Fixtures and equipments 47.0 ?
Transportation 2.9 ?
Construction in progress 4.5 4.5
Total 177.0 ?
Tano Santos Heilbrunn Center
…………………………………………………………………………………………………………………………………………
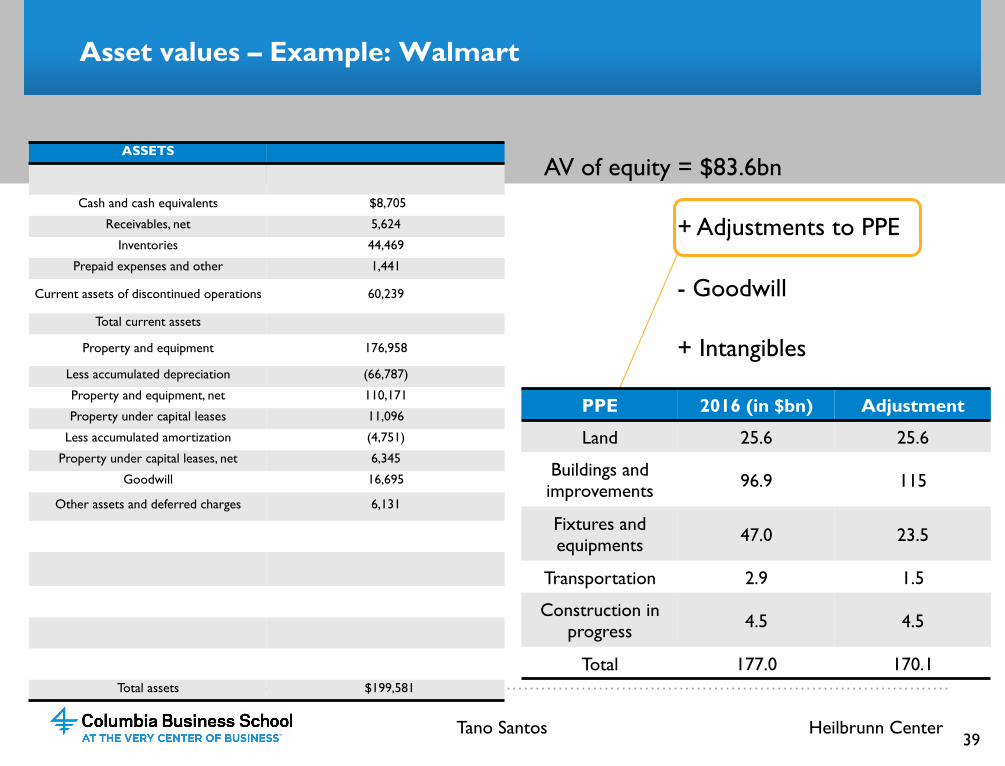
Asset values – Example: Walmart
ASSETS
Cash and cash equivalents $8,705
Receivables, net 5,624
Inventories 44,469
Prepaid expenses and other 1,441
Current assets of discontinued operations 60,239
Total current assets
Property and equipment 176,958
Less accumulated depreciation (66,787)
Property and equipment, net 110,171
Property under capital leases 11,096
Less accumulated amortization (4,751)
Property under capital leases, net 6,345
Goodwill 16,695
Other assets and deferred charges 6,131
Total assets $199,581
39
AV of equity = $83.6bn + Adjustments to PPE - Goodwill + Intangibles
PPE 2016 (in $bn) Adjustment
Land 25.6 25.6
Buildings and improvements 96.9 115
Fixtures and equipments 47.0 23.5
Transportation 2.9 1.5
Construction in progress 4.5 4.5
Total 177.0 170.1
Tano Santos Heilbrunn Center
…………………………………………………………………………………………………………………………………………
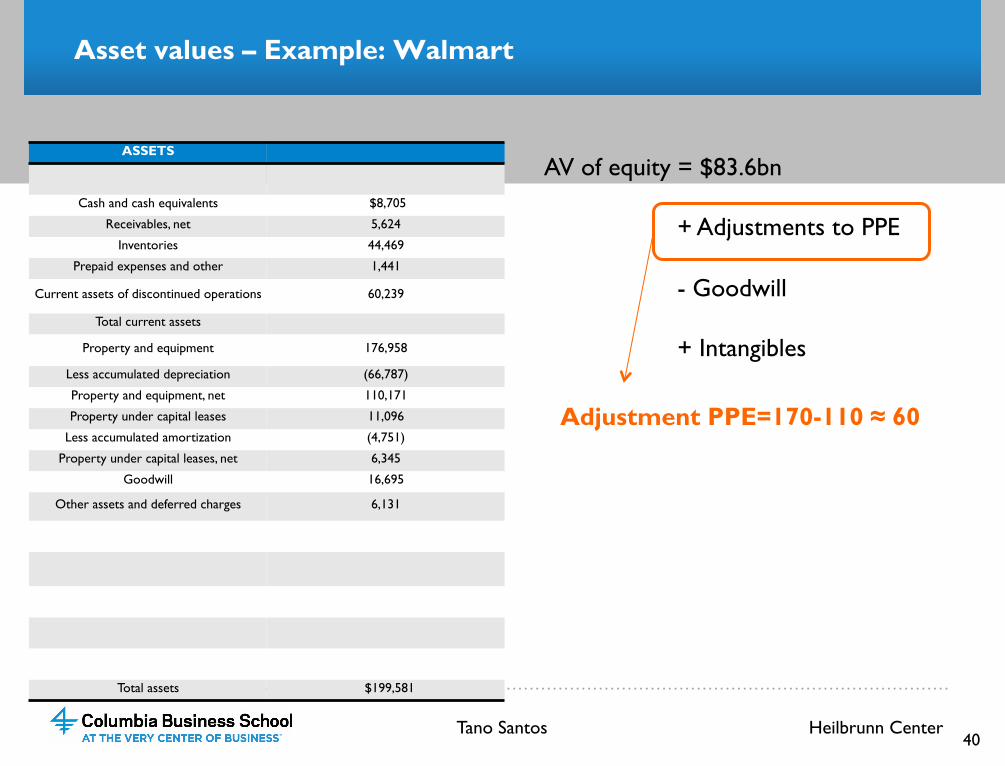
40
Asset values – Example: Walmart
AV of equity = $83.6bn + Adjustments to PPE - Goodwill + Intangibles
Adjustment PPE=170-110 ≈ 60
ASSETS
Cash and cash equivalents $8,705
Receivables, net 5,624
Inventories 44,469
Prepaid expenses and other 1,441
Current assets of discontinued operations 60,239
Total current assets
Property and equipment 176,958
Less accumulated depreciation (66,787)
Property and equipment, net 110,171
Property under capital leases 11,096
Less accumulated amortization (4,751)
Property under capital leases, net 6,345
Goodwill 16,695
Other assets and deferred charges 6,131
Total assets $199,581
Tano Santos Heilbrunn Center
…………………………………………………………………………………………………………………………………………
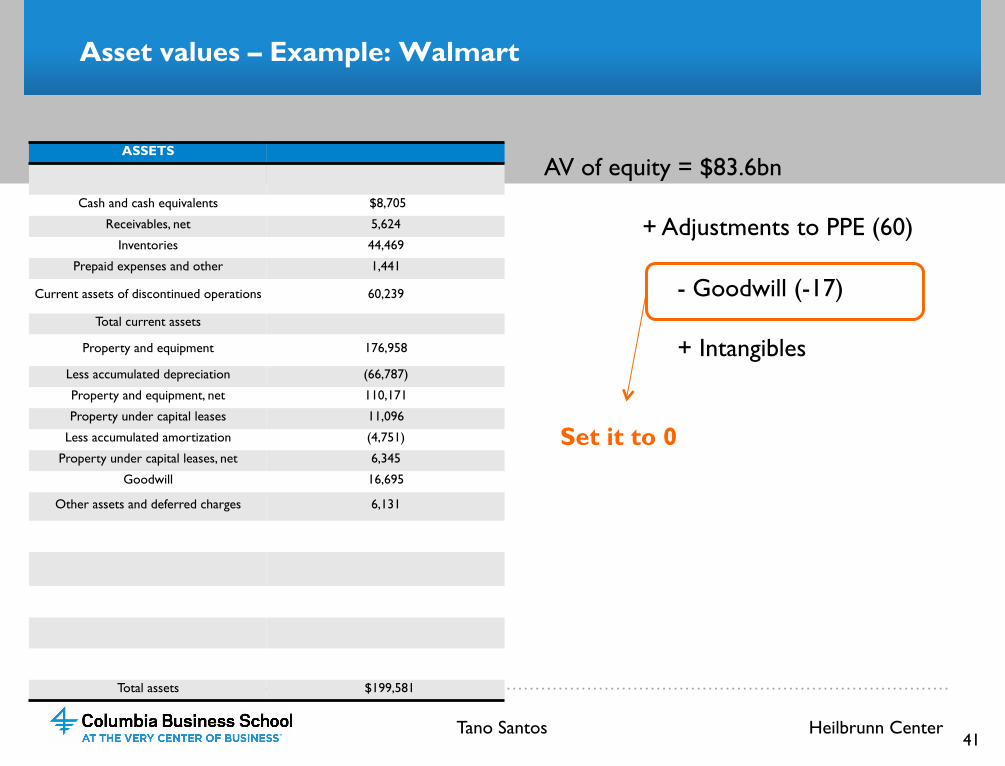
Asset values – Example: Walmart
41
AV of equity = $83.6bn + Adjustments to PPE (60) - Goodwill (-17) + Intangibles
Set it to 0
ASSETS
Cash and cash equivalents $8,705
Receivables, net 5,624
Inventories 44,469
Prepaid expenses and other 1,441
Current assets of discontinued operations 60,239
Total current assets
Property and equipment 176,958
Less accumulated depreciation (66,787)
Property and equipment, net 110,171
Property under capital leases 11,096
Less accumulated amortization (4,751)
Property under capital leases, net 6,345
Goodwill 16,695
Other assets and deferred charges 6,131
Total assets $199,581
Tano Santos Heilbrunn Center
…………………………………………………………………………………………………………………………………………
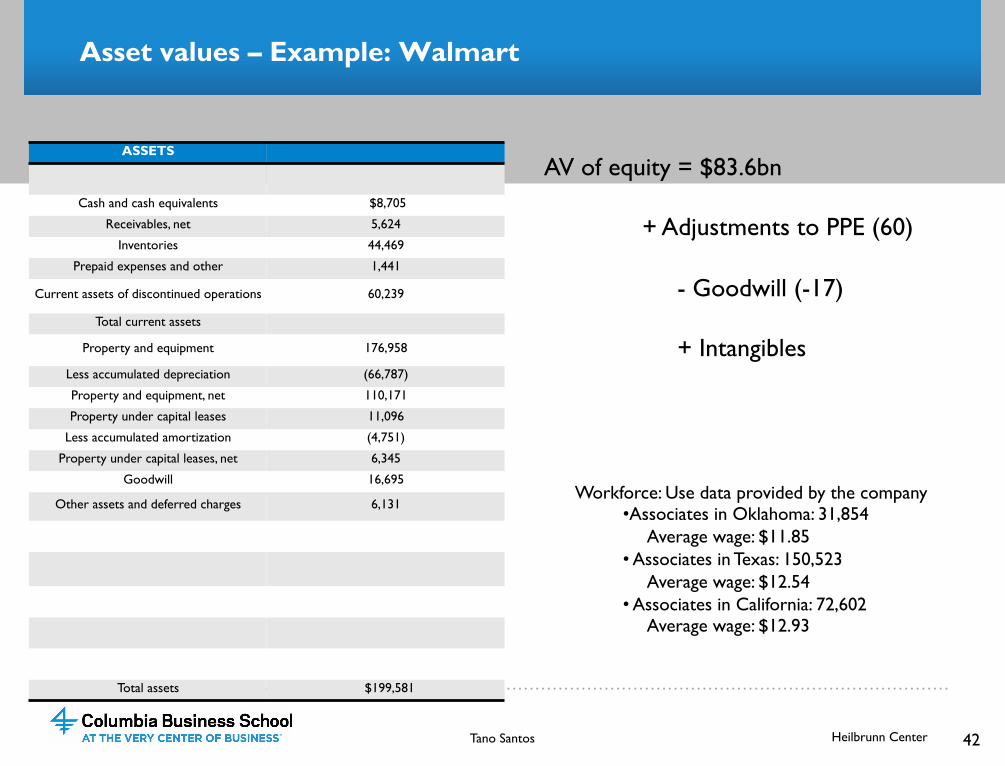
Asset values – Example: Walmart
42 Tano Santos Heilbrunn Center
AV of equity = $83.6bn + Adjustments to PPE (60) - Goodwill (-17) + Intangibles
ASSETS
Cash and cash equivalents $8,705
Receivables, net 5,624
Inventories 44,469
Prepaid expenses and other 1,441
Current assets of discontinued operations 60,239
Total current assets
Property and equipment 176,958
Less accumulated depreciation (66,787)
Property and equipment, net 110,171
Property under capital leases 11,096
Less accumulated amortization (4,751)
Property under capital leases, net 6,345
Goodwill 16,695
Other assets and deferred charges 6,131
Total assets $199,581
Workforce: Use data provided by the company • Associates in Oklahoma: 31,854 Average wage: $11.85 • Associates in Texas: 150,523 Average wage: $12.54 • Associates in California: 72,602 Average wage: $12.93
…………………………………………………………………………………………………………………………………………
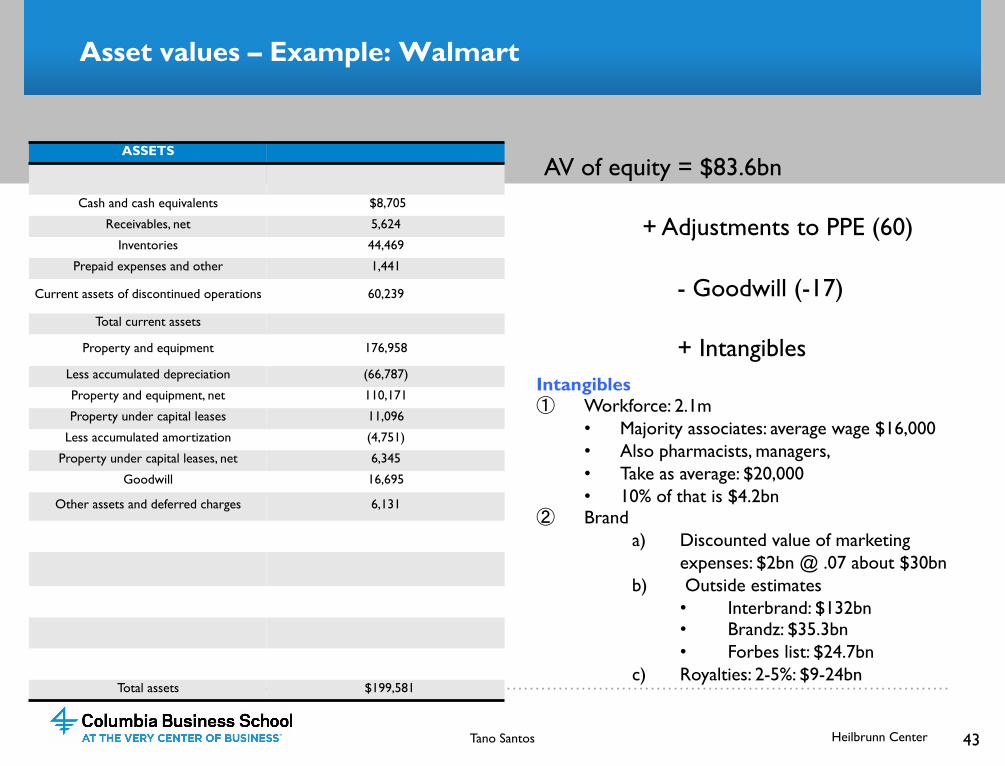
Asset values – Example: Walmart
43 Tano Santos Heilbrunn Center
AV of equity = $83.6bn + Adjustments to PPE (60) - Goodwill (-17) + Intangibles
ASSETS
Cash and cash equivalents $8,705
Receivables, net 5,624
Inventories 44,469
Prepaid expenses and other 1,441
Current assets of discontinued operations 60,239
Total current assets
Property and equipment 176,958
Less accumulated depreciation (66,787)
Property and equipment, net 110,171
Property under capital leases 11,096
Less accumulated amortization (4,751)
Property under capital leases, net 6,345
Goodwill 16,695
Other assets and deferred charges 6,131
Total assets $199,581
Intangibles ① Workforce: 2.1m
• Majority associates: average wage $16,000 • Also pharmacists, managers, • Take as average: $20,000 • 10% of that is $4.2bn
② Brand a) Discounted value of marketing
expenses: $2bn @ .07 about $30bn b) Outside estimates
• Interbrand: $132bn • Brandz: $35.3bn • Forbes list: $24.7bn
c) Royalties: 2-5%: $9-24bn
…………………………………………………………………………………………………………………………………………
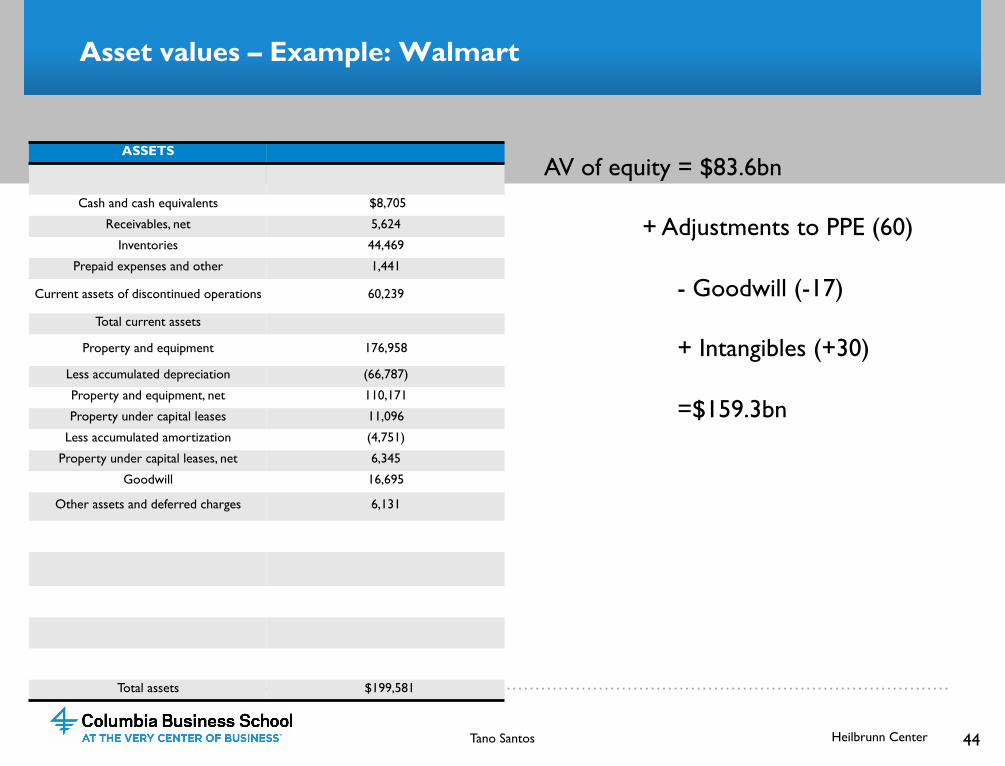
Asset values – Example: Walmart
44 Tano Santos Heilbrunn Center
AV of equity = $83.6bn + Adjustments to PPE (60) - Goodwill (-17) + Intangibles (+30) =$159.3bn
ASSETS
Cash and cash equivalents $8,705
Receivables, net 5,624
Inventories 44,469
Prepaid expenses and other 1,441
Current assets of discontinued operations 60,239
Total current assets
Property and equipment 176,958
Less accumulated depreciation (66,787)
Property and equipment, net 110,171
Property under capital leases 11,096
Less accumulated amortization (4,751)
Property under capital leases, net 6,345
Goodwill 16,695
Other assets and deferred charges 6,131
Total assets $199,581
…………………………………………………………………………………………………………………………………………
VALUATION: EARNINGS POWER VALUES
…………………………………………………………………………………………………………………………………………
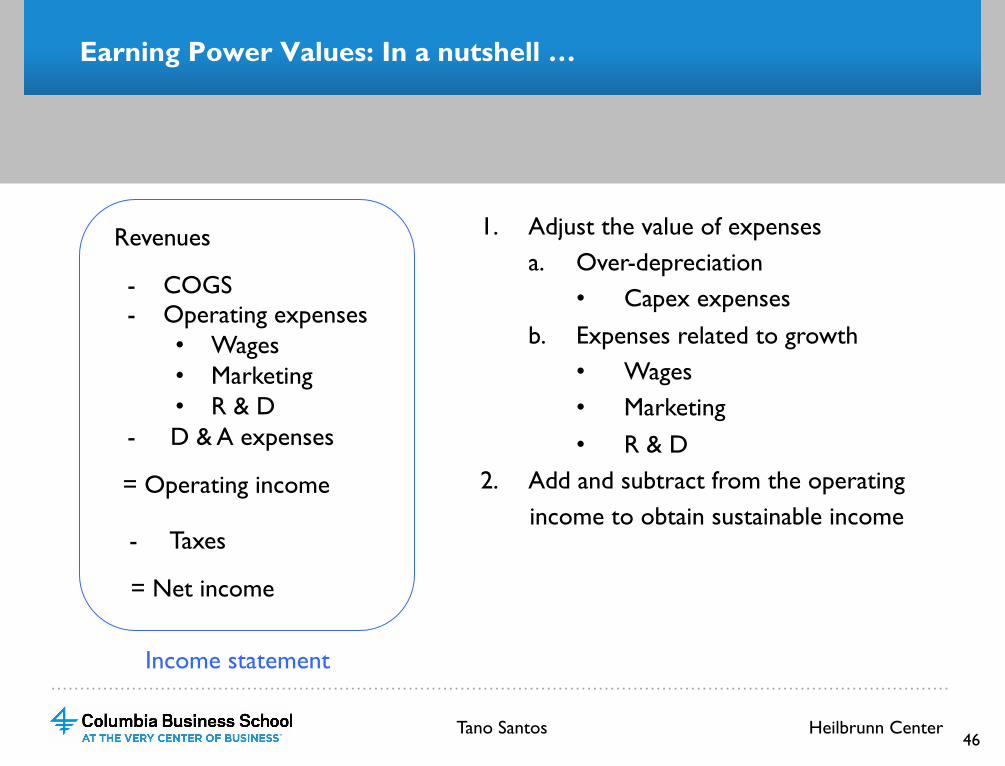
Earning Power Values: In a nutshell …
46
- COGS - Operating expenses
• Wages • Marketing • R & D
- D & A expenses
Revenues 1. Adjust the value of expenses a. Over-depreciation
• Capex expenses b. Expenses related to growth
• Wages • Marketing • R & D
2. Add and subtract from the operating income to obtain sustainable income
Tano Santos Heilbrunn Center
= Operating income
- Taxes
= Net income
Income statement
…………………………………………………………………………………………………………………………………………
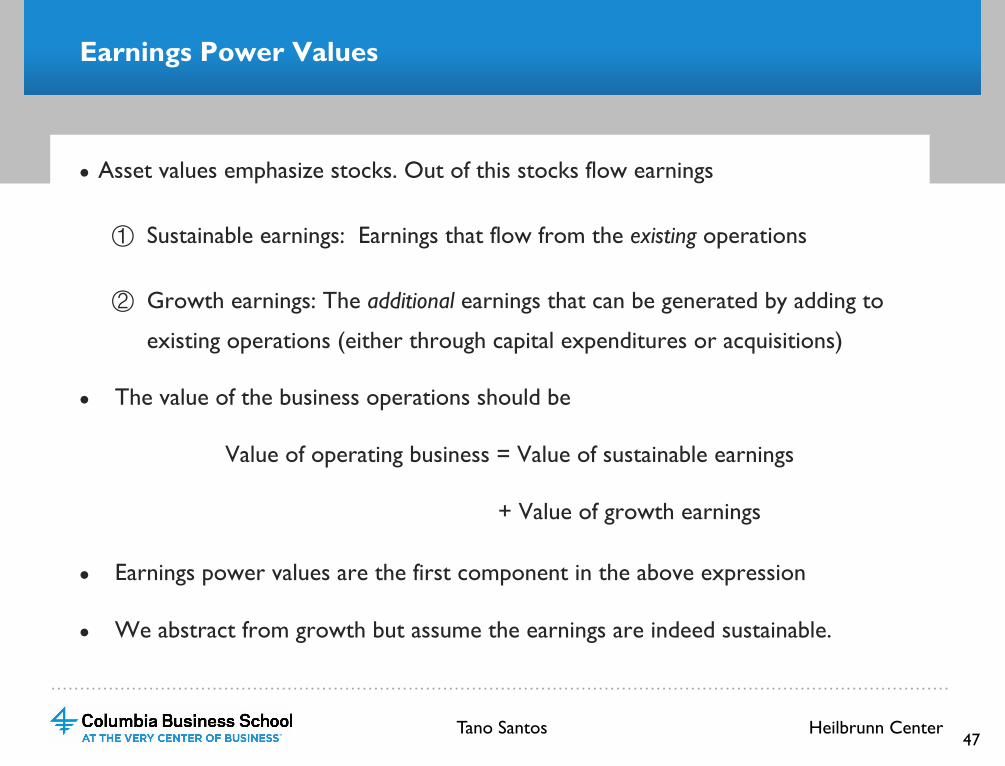
Earnings Power Values
● Asset values emphasize stocks. Out of this stocks flow earnings
① Sustainable earnings: Earnings that flow from the existing operations
② Growth earnings: The additional earnings that can be generated by adding to
existing operations (either through capital expenditures or acquisitions)
● The value of the business operations should be
Value of operating business = Value of sustainable earnings
+ Value of growth earnings
● Earnings power values are the first component in the above expression
● We abstract from growth but assume the earnings are indeed sustainable.
Tano Santos Heilbrunn Center 47
…………………………………………………………………………………………………………………………………………
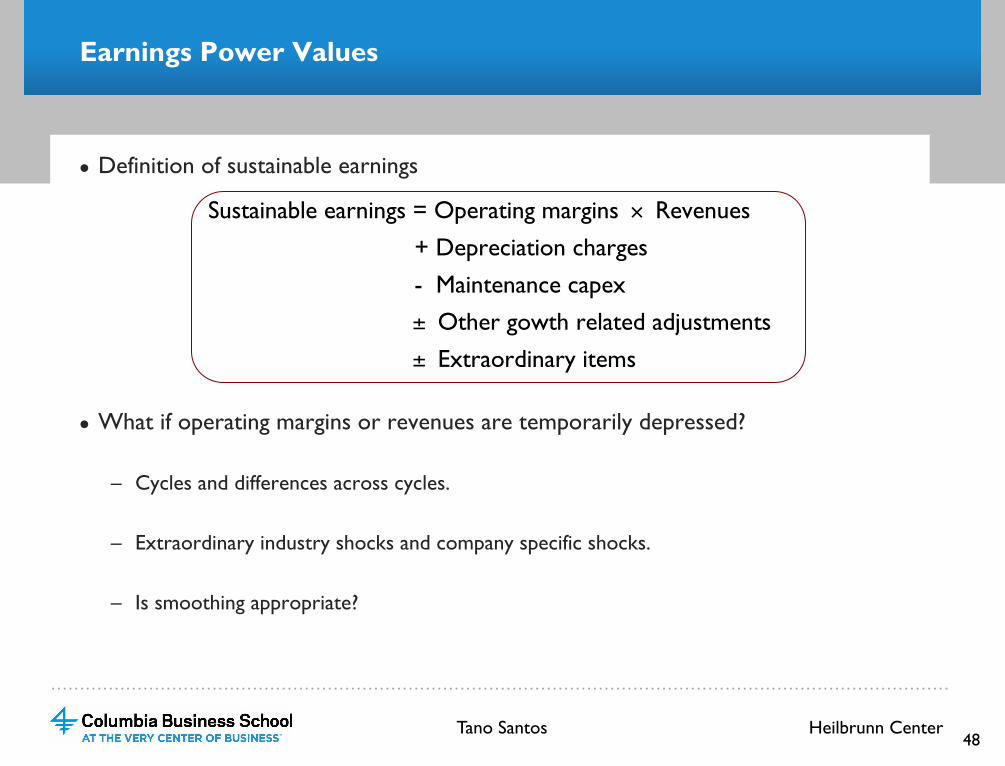
Earnings Power Values
● Definition of sustainable earnings
● What if operating margins or revenues are temporarily depressed?
– Cycles and differences across cycles.
– Extraordinary industry shocks and company specific shocks.
– Is smoothing appropriate?
Sustainable earnings = Operating margins × Revenues
+ Depreciation charges
- Maintenance capex
± Other gowth related adjustments
± Extraordinary items
Tano Santos Heilbrunn Center 48
…………………………………………………………………………………………………………………………………………
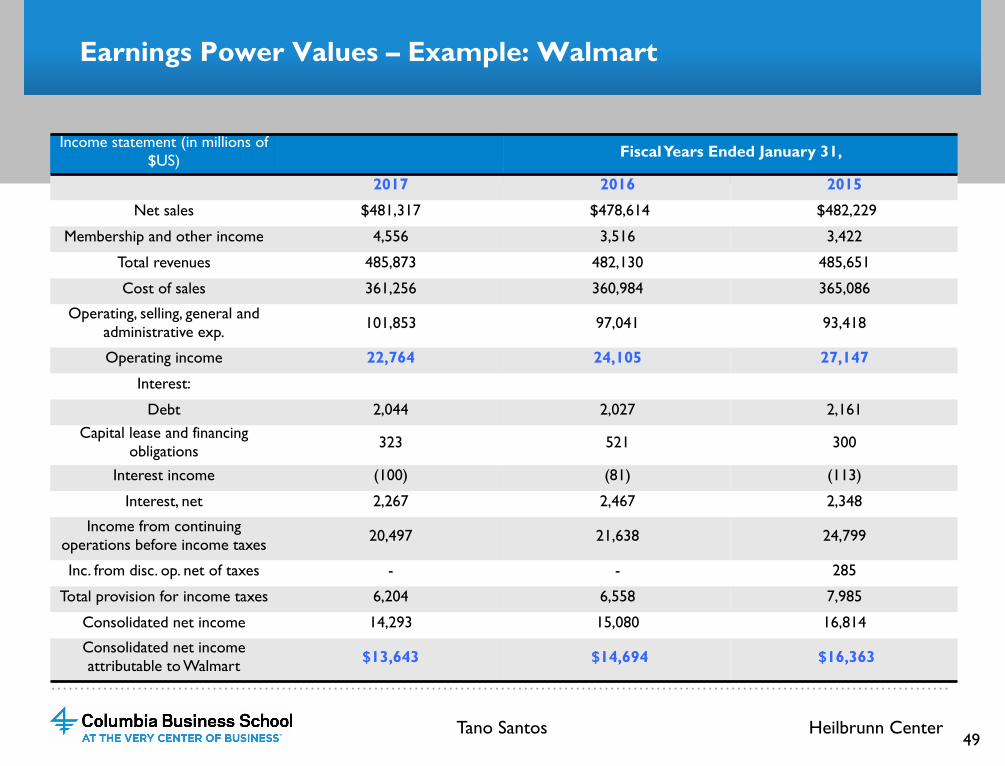
Earnings Power Values – Example: Walmart
Income statement (in millions of $US) Fiscal Years Ended January 31,
2017 2016 2015
Net sales $481,317 $478,614 $482,229
Membership and other income 4,556 3,516 3,422
Total revenues 485,873 482,130 485,651
Cost of sales 361,256 360,984 365,086
Operating, selling, general and administrative exp. 101,853 97,041 93,418
Operating income 22,764 24,105 27,147
Interest:
Debt 2,044 2,027 2,161 Capital lease and financing
obligations 323 521 300
Interest income (100) (81) (113)
Interest, net 2,267 2,467 2,348
Income from continuing operations before income taxes 20,497 21,638 24,799
Inc. from disc. op. net of taxes - - 285
Total provision for income taxes 6,204 6,558 7,985
Consolidated net income 14,293 15,080 16,814
Consolidated net income attributable to Walmart $13,643 $14,694 $16,363
Tano Santos Heilbrunn Center 49
…………………………………………………………………………………………………………………………………………
Earnings Power Values – Example: Walmart
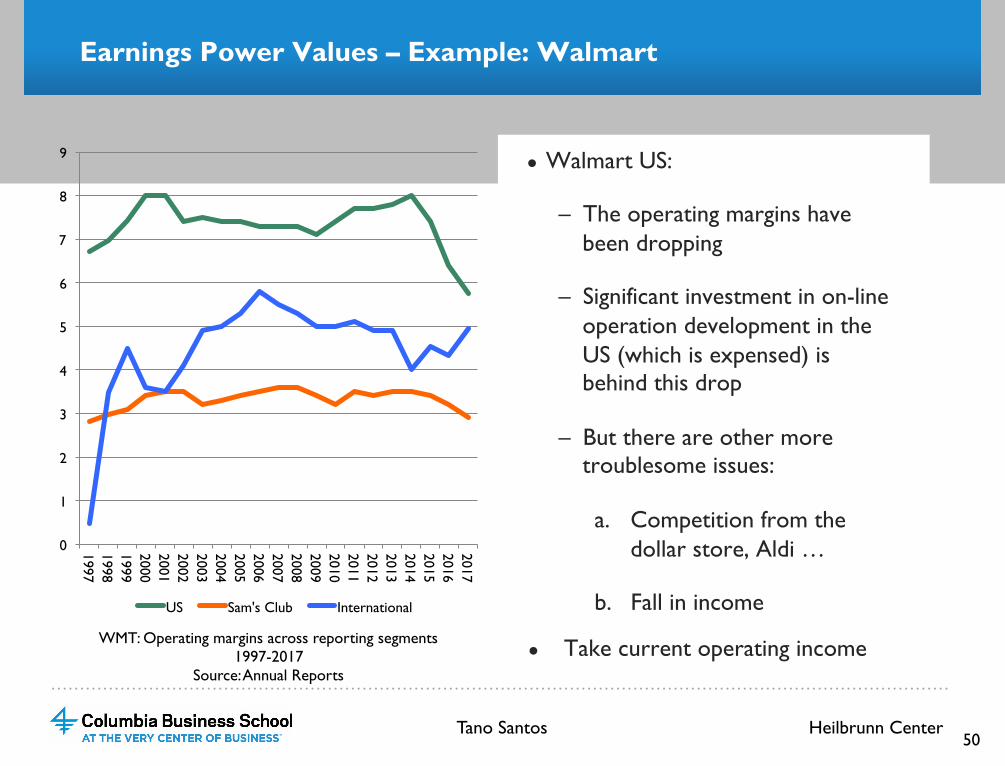
● Walmart US:
– The operating margins have been dropping
– Significant investment in on-line operation development in the US (which is expensed) is behind this drop
– But there are other more troublesome issues:
a. Competition from the dollar store, Aldi …
b. Fall in income
● Take current operating income WMT: Operating margins across reporting segments 1997-2017
Source: Annual Reports
Tano Santos Heilbrunn Center 50
0
1
2
3
4
5
6
7
8
9
1997 1998 1999 2000 2001 2002 2003 2004 2005 2006 2007 2008 2009 2010 2011 2012 2013 2014 2015 2016 2017
US Sam's Club International
…………………………………………………………………………………………………………………………………………
Earnings Power Values – Example: Walmart
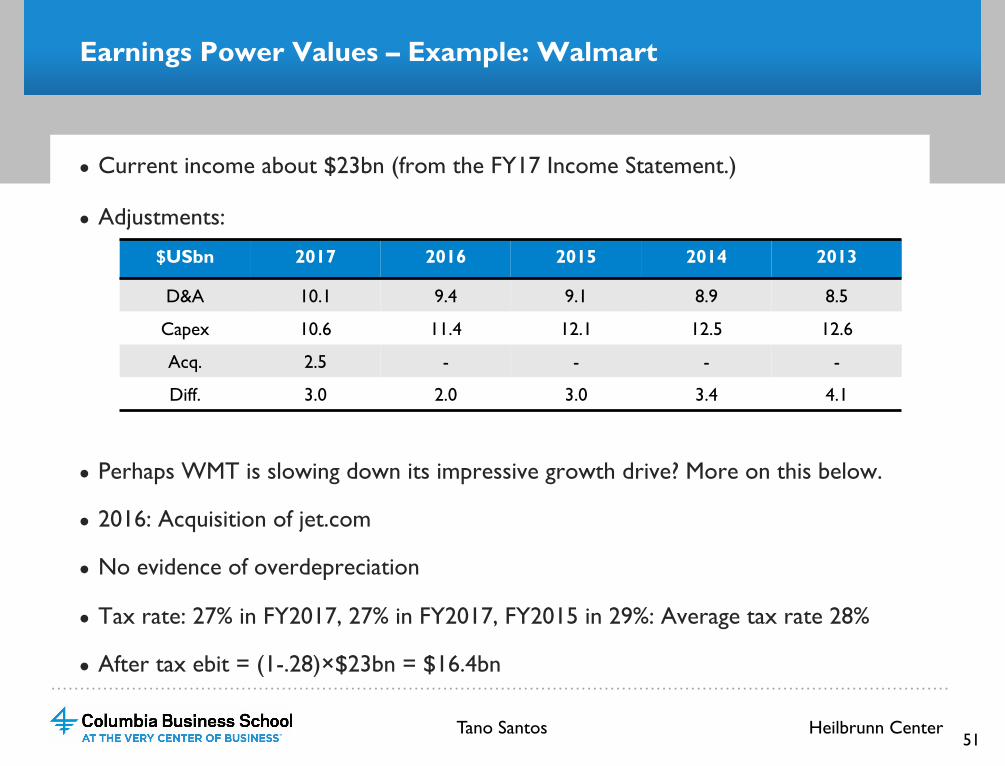
● Current income about $23bn (from the FY17 Income Statement.)
● Adjustments:
● Perhaps WMT is slowing down its impressive growth drive? More on this below.
● 2016: Acquisition of jet.com
● No evidence of overdepreciation
● Tax rate: 27% in FY2017, 27% in FY2017, FY2015 in 29%: Average tax rate 28%
● After tax ebit = (1-.28)×$23bn = $16.4bn
51
Tano Santos Heilbrunn Center
$USbn 2017 2016 2015 2014 2013
D&A 10.1 9.4 9.1 8.9 8.5
Capex 10.6 11.4 12.1 12.5 12.6
Acq. 2.5 - - - -
Diff. 3.0 2.0 3.0 3.4 4.1
…………………………………………………………………………………………………………………………………………
Earnings Power Values – Example: Walmart
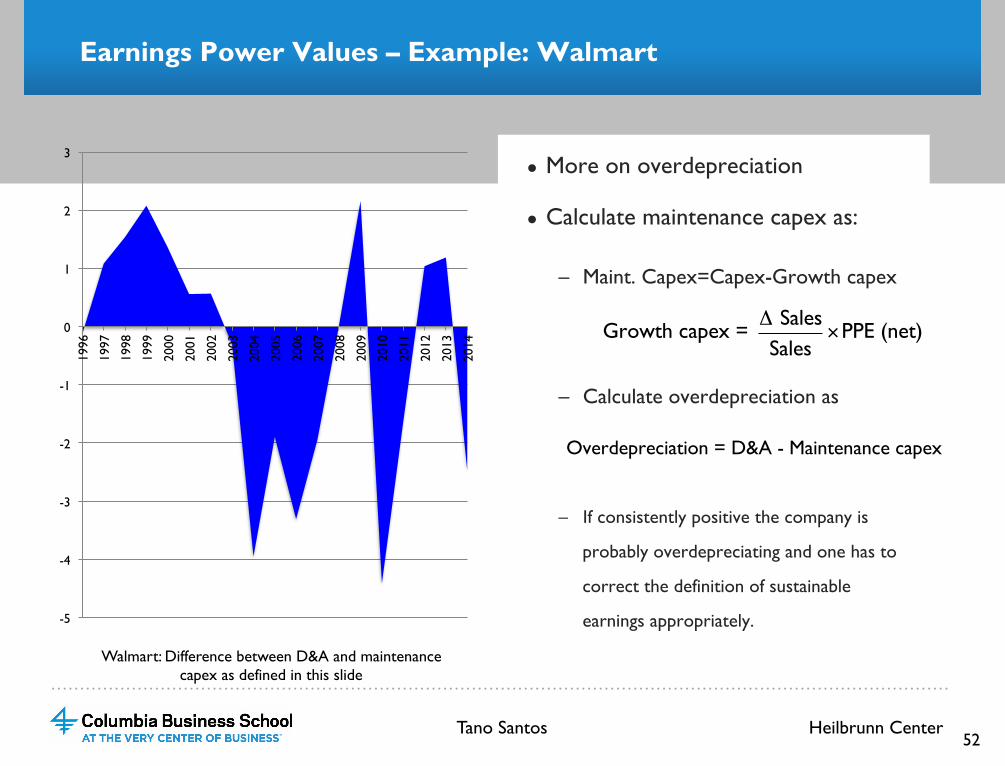
● More on overdepreciation
● Calculate maintenance capex as:
– Maint. Capex=Capex-Growth capex
– Calculate overdepreciation as
– If consistently positive the company is
probably overdepreciating and one has to
correct the definition of sustainable
earnings appropriately.
52
-5
-4
-3
-2
-1
0
1
2
3
1996
1997
1998
1999
2000
2001
2002
2003
2004
2005
2006
2007
2008
2009
2010
2011
2012
2013
2014
Growth capex = Δ SalesSales
×PPE (net)
Overdepreciation = D&A - Maintenance capex
Walmart: Difference between D&A and maintenance capex as defined in this slide
Tano Santos Heilbrunn Center
…………………………………………………………………………………………………………………………………………
Earnings Power Values – Example: Walmart
53
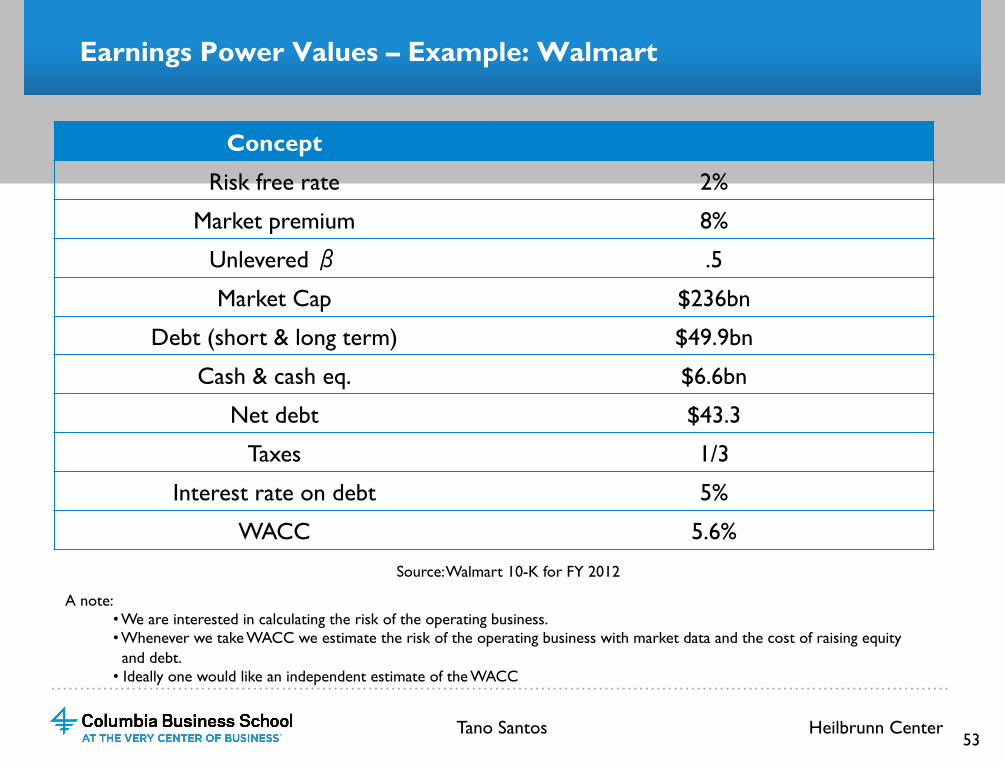
Concept
Risk free rate 2%
Market premium 8%
Unlevered β .5
Market Cap $236bn
Debt (short & long term) $49.9bn
Cash & cash eq. $6.6bn
Net debt $43.3
Taxes 1/3
Interest rate on debt 5%
WACC 5.6%
Source: Walmart 10-K for FY 2012
A note: • We are interested in calculating the risk of the operating business. • Whenever we take WACC we estimate the risk of the operating business with market data and the cost of raising equity and debt. • Ideally one would like an independent estimate of the WACC
Tano Santos Heilbrunn Center
…………………………………………………………………………………………………………………………………………
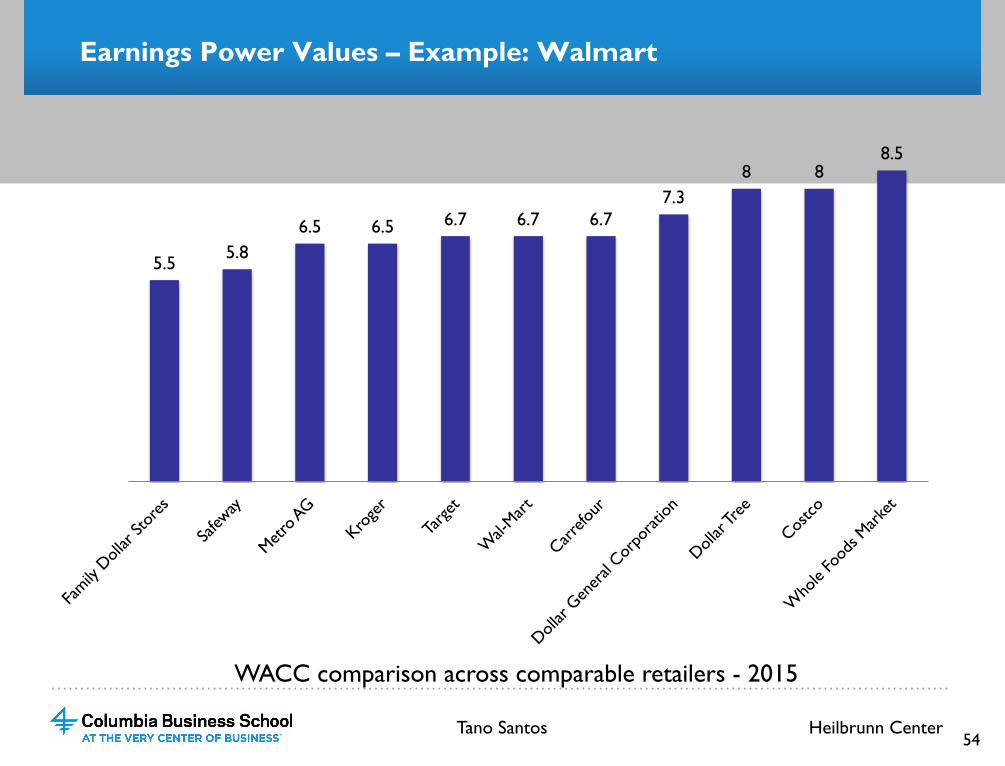
Earnings Power Values – Example: Walmart
54
5.5 5.8 6.5 6.5 6.7 6.7 6.7
7.3 8 8
8.5
WACC comparison across comparable retailers - 2015
Tano Santos Heilbrunn Center
…………………………………………………………………………………………………………………………………………
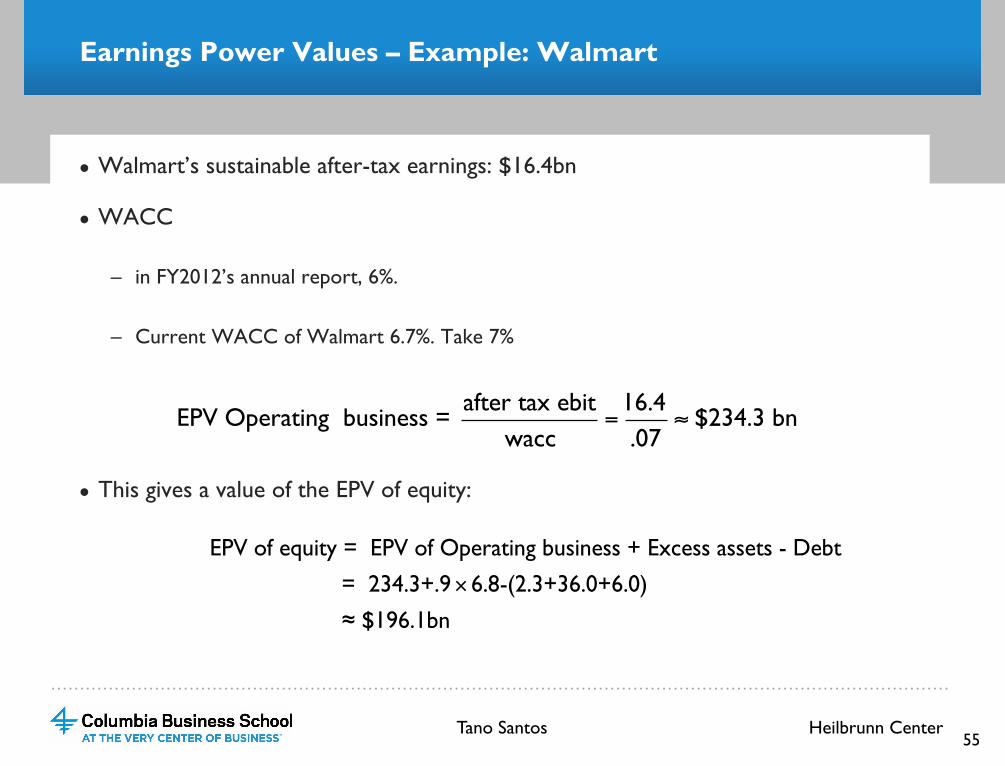
Earnings Power Values – Example: Walmart
● Walmart’s sustainable after-tax earnings: $16.4bn
● WACC
– in FY2012’s annual report, 6%.
– Current WACC of Walmart 6.7%. Take 7%
● This gives a value of the EPV of equity:
55
EPV of equity = EPV of Operating business + Excess assets - Debt
= 234.3+.9× 6.8-(2.3+36.0+6.0)
≈ $196.1bn
EPV Operating business = after tax ebit
wacc=
16.4.07
≈ $234.3 bn
Tano Santos Heilbrunn Center
…………………………………………………………………………………………………………………………………………
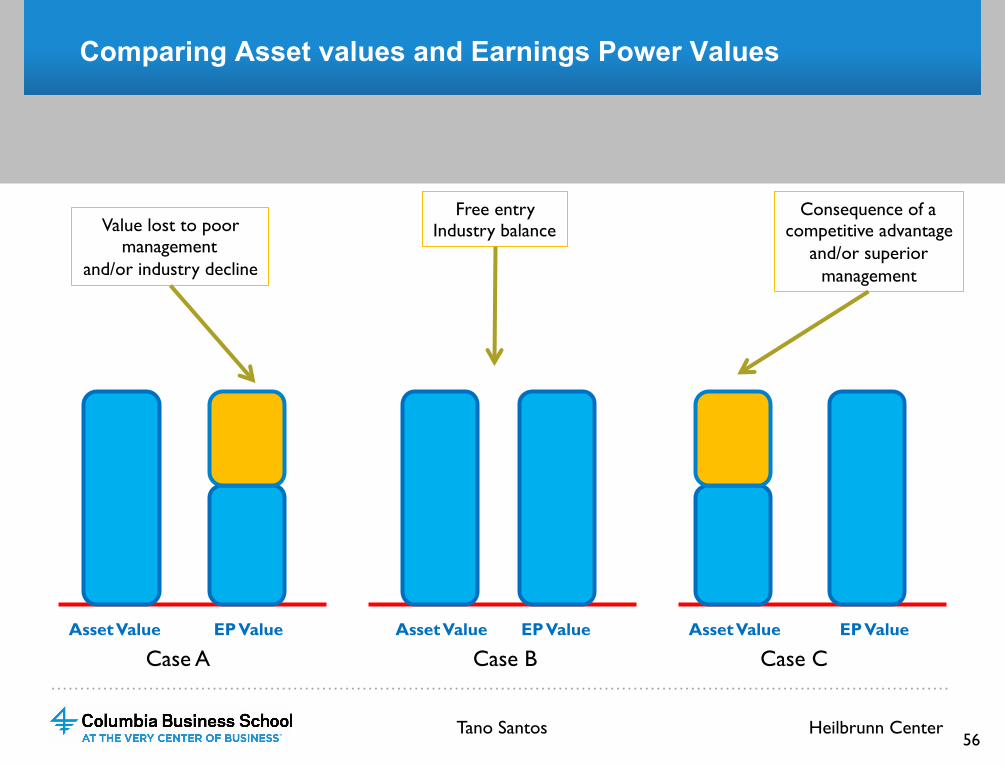
Comparing Asset values and Earnings Power Values
Asset Value Asset Value Asset Value EP Value EP Value EP Value
Value lost to poor management
and/or industry decline
Free entry Industry balance
Consequence of a competitive advantage
and/or superior management
Case A Case B Case C
56 Tano Santos Heilbrunn Center
…………………………………………………………………………………………………………………………………………
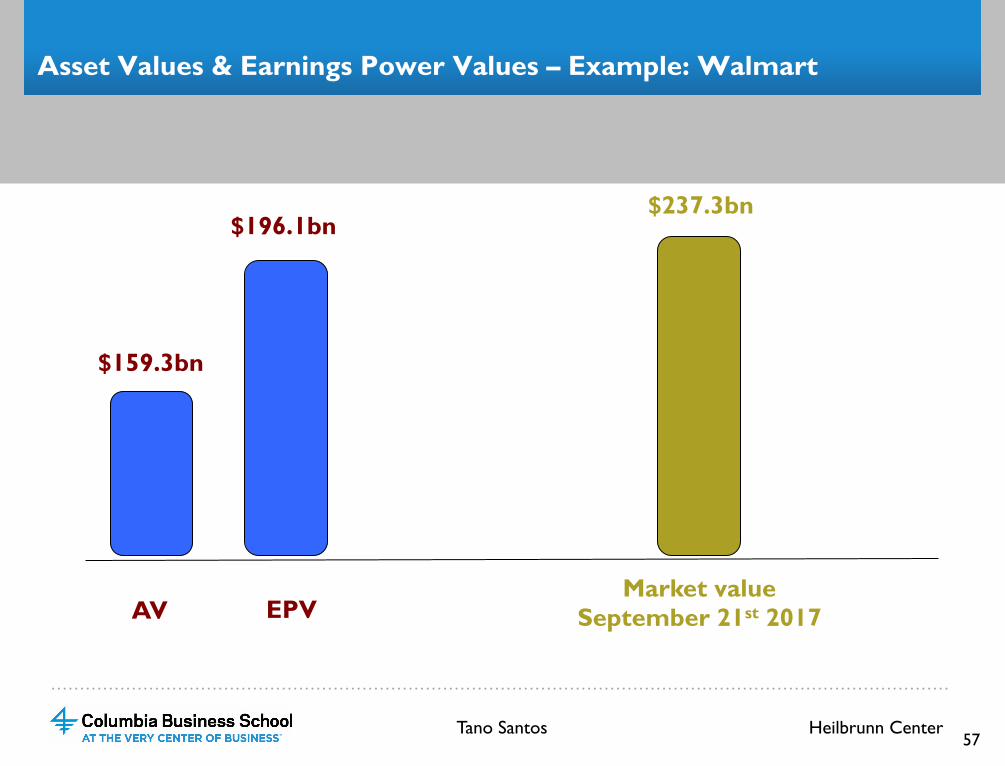
57
Asset Values & Earnings Power Values – Example: Walmart
AV EPV
$159.3bn
$196.1bn
Market value September 21st 2017
$237.3bn
Tano Santos Heilbrunn Center
…………………………………………………………………………………………………………………………………………
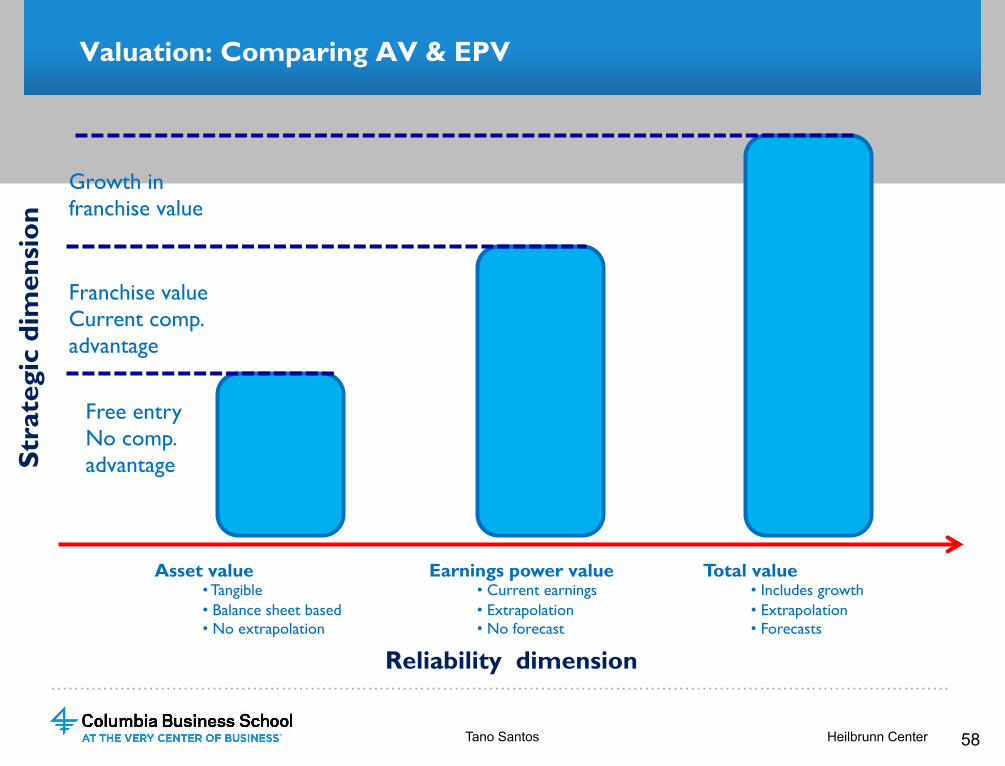
Valuation: Comparing AV & EPV
Asset value • Tangible • Balance sheet based • No extrapolation
Earnings power value • Current earnings • Extrapolation • No forecast
Total value • Includes growth • Extrapolation • Forecasts
Reliability dimension
Free entry No comp. advantage
Franchise value Current comp. advantage
Growth in franchise value
Stra
tegi
c di
men
sion
58 Tano Santos Heilbrunn Center
…………………………………………………………………………………………………………………………………………
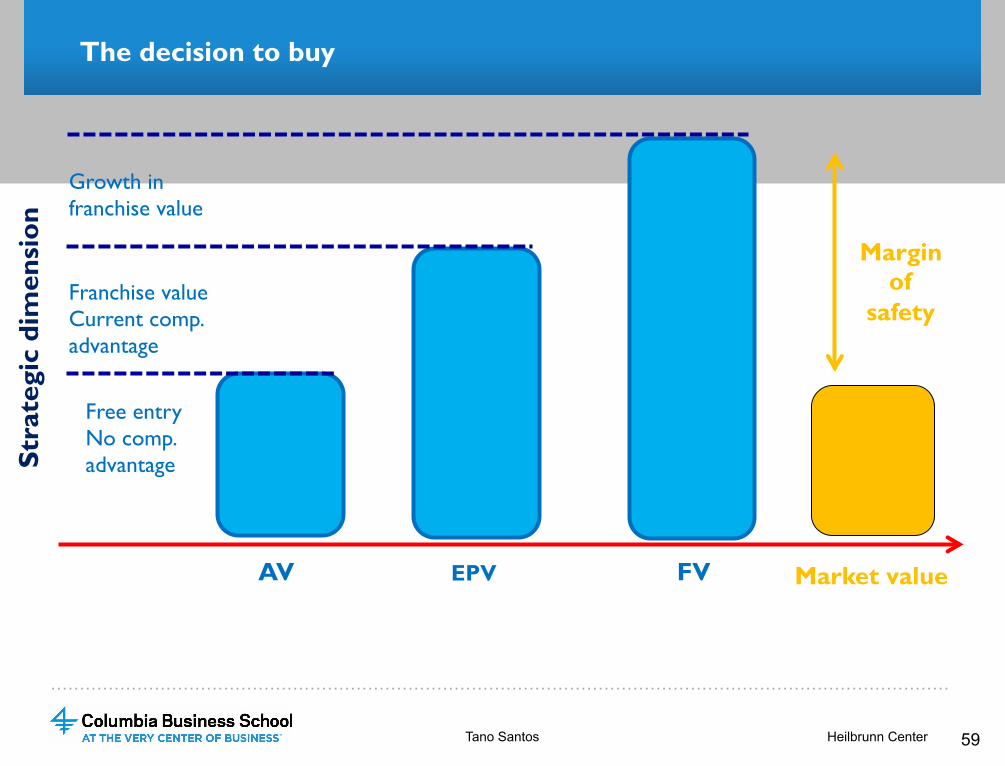
The decision to buy
AV EPV FV
Free entry No comp. advantage
Franchise value Current comp. advantage
Growth in franchise value
Stra
tegi
c di
men
sion
59 Tano Santos Heilbrunn Center
Market value
Margin of
safety
…………………………………………………………………………………………………………………………………………
VALUATION: GROWTH

…………………………………………………………………………………………………………………………………………
The valuation process
Asset Values AV
Earnings Power Values EPV
Franchise Values FV>0
Barriers to entry?
yes
no
Franchise Values FV≤0
Growth creates value
Growth destroys value
Tano Santos Heilbrunn Center 61
…………………………………………………………………………………………………………………………………………
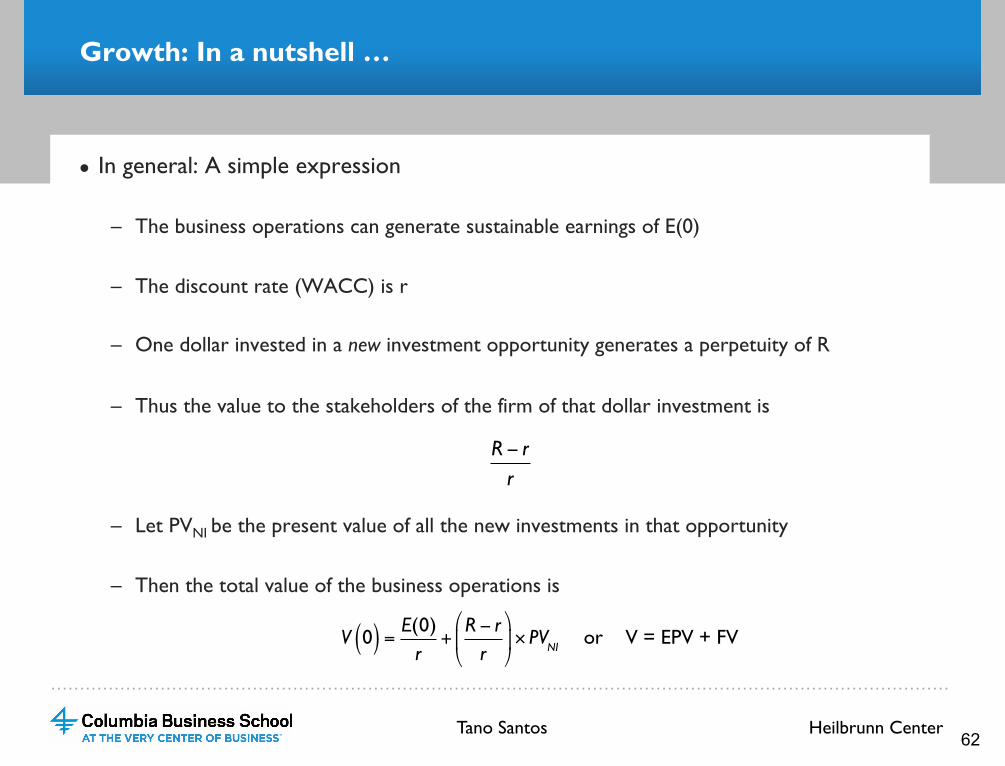
Growth: In a nutshell …
● In general: A simple expression
– The business operations can generate sustainable earnings of E(0)
– The discount rate (WACC) is r
– One dollar invested in a new investment opportunity generates a perpetuity of R
– Thus the value to the stakeholders of the firm of that dollar investment is
– Let PVNI be the present value of all the new investments in that opportunity
– Then the total value of the business operations is
R − rr
V 0( ) = E(0)r
+R − rr
⎛
⎝⎜
⎞
⎠⎟× PVNI or V = EPV + FV
Heilbrunn Center Tano Santos 62
…………………………………………………………………………………………………………………………………………
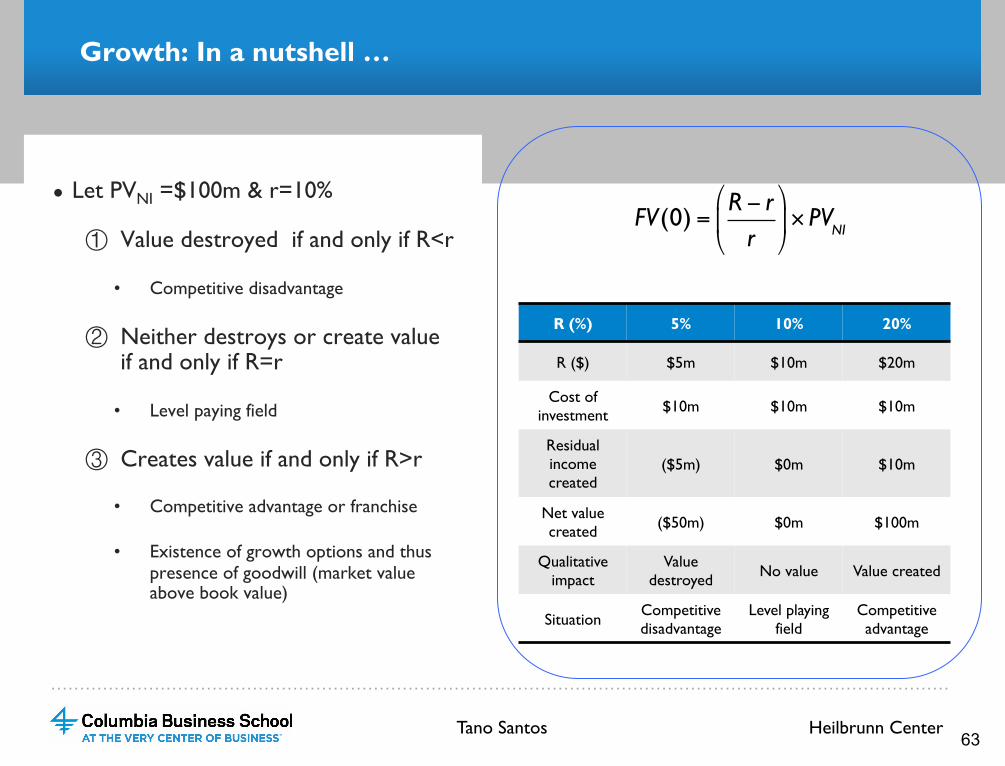
Growth: In a nutshell …
● Let PVNI =$100m & r=10%
① Value destroyed if and only if R<r
• Competitive disadvantage
② Neither destroys or create value if and only if R=r
• Level paying field
③ Creates value if and only if R>r
• Competitive advantage or franchise
• Existence of growth options and thus presence of goodwill (market value above book value)
R (%) 5% 10% 20%
R ($) $5m $10m $20m
Cost of investment $10m $10m $10m
Residual income created
($5m) $0m $10m
Net value created ($50m) $0m $100m
Qualitative impact
Value destroyed No value Value created
Situation Competitive disadvantage
Level playing field
Competitive advantage
FV(0) =R − rr
⎛
⎝⎜
⎞
⎠⎟× PVNI
Heilbrunn Center Tano Santos 63
…………………………………………………………………………………………………………………………………………
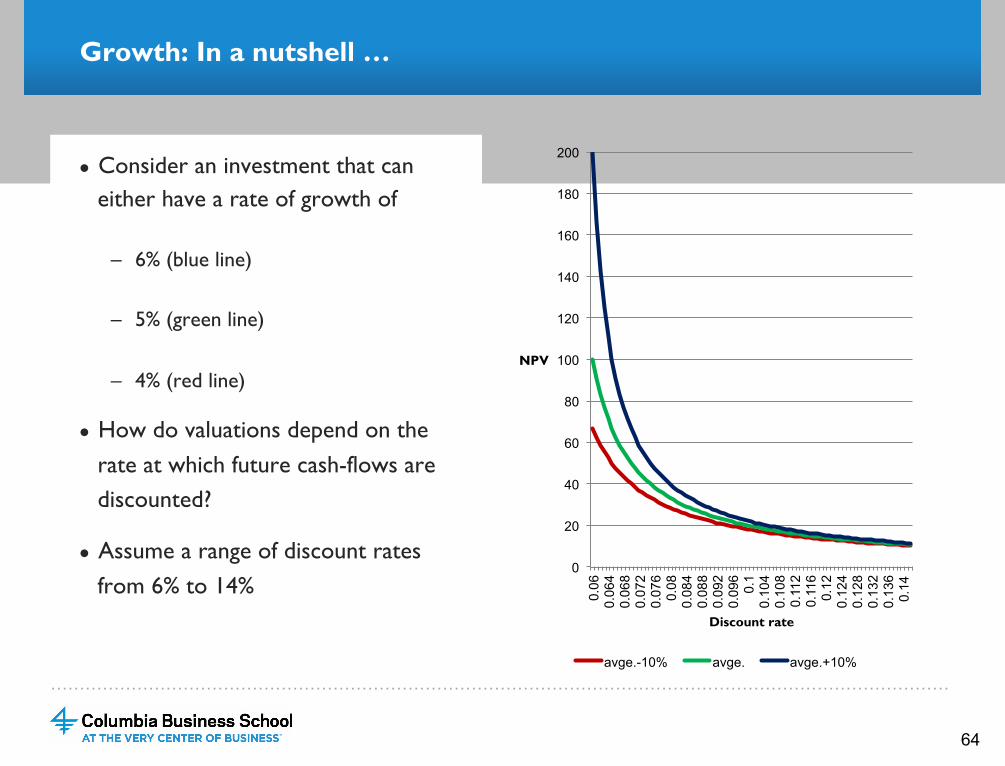
Growth: In a nutshell …
● Consider an investment that can either have a rate of growth of
– 6% (blue line)
– 5% (green line)
– 4% (red line)
● How do valuations depend on the rate at which future cash-flows are discounted?
● Assume a range of discount rates from 6% to 14%
64
0
20
40
60
80
100
120
140
160
180
200
0.06
0.
064
0.06
8 0.
072
0.07
6 0.
08
0.08
4 0.
088
0.09
2 0.
096
0.1
0.10
4 0.
108
0.11
2 0.
116
0.12
0.
124
0.12
8 0.
132
0.13
6 0.
14
NPV
Discount rate
avge.-10% avge. avge.+10%
…………………………………………………………………………………………………………………………………………
Growth: Returns instead of prices
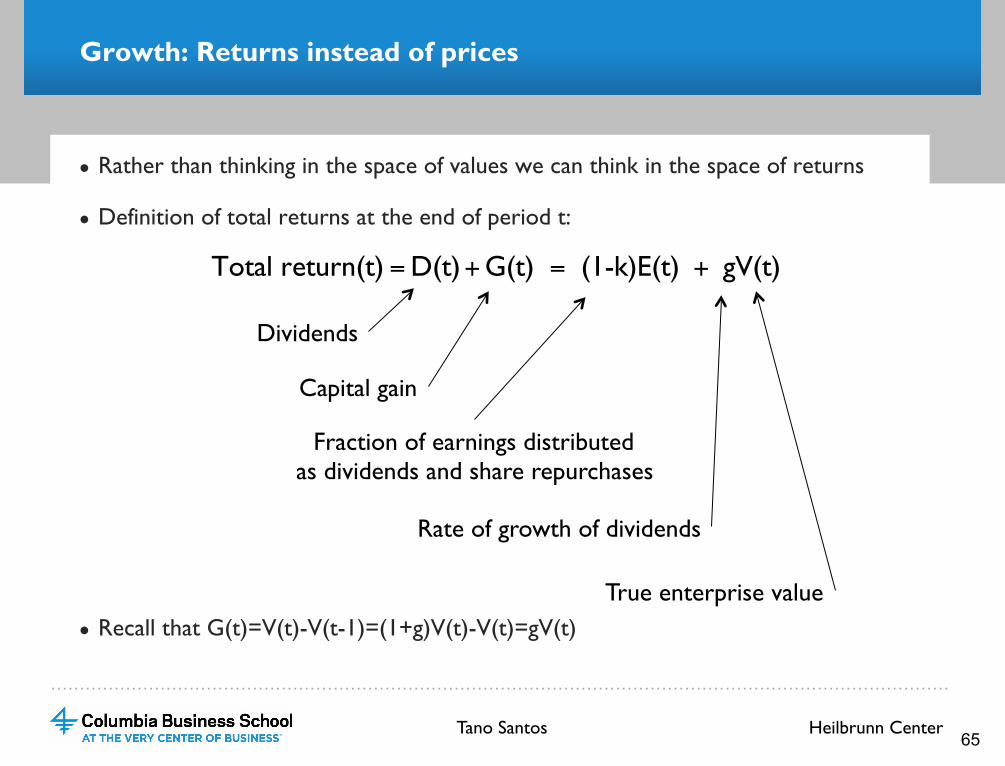
● Rather than thinking in the space of values we can think in the space of returns
● Definition of total returns at the end of period t:
● Recall that G(t)=V(t)-V(t-1)=(1+g)V(t)-V(t)=gV(t)
Total return(t) =D(t)+G(t) = (1-k)E(t) + gV(t)
Fraction of earnings distributed as dividends and share repurchases
Dividends
Capital gain
Rate of growth of dividends
True enterprise value
Heilbrunn Center Tano Santos 65
…………………………………………………………………………………………………………………………………………
Growth: Returns instead of prices
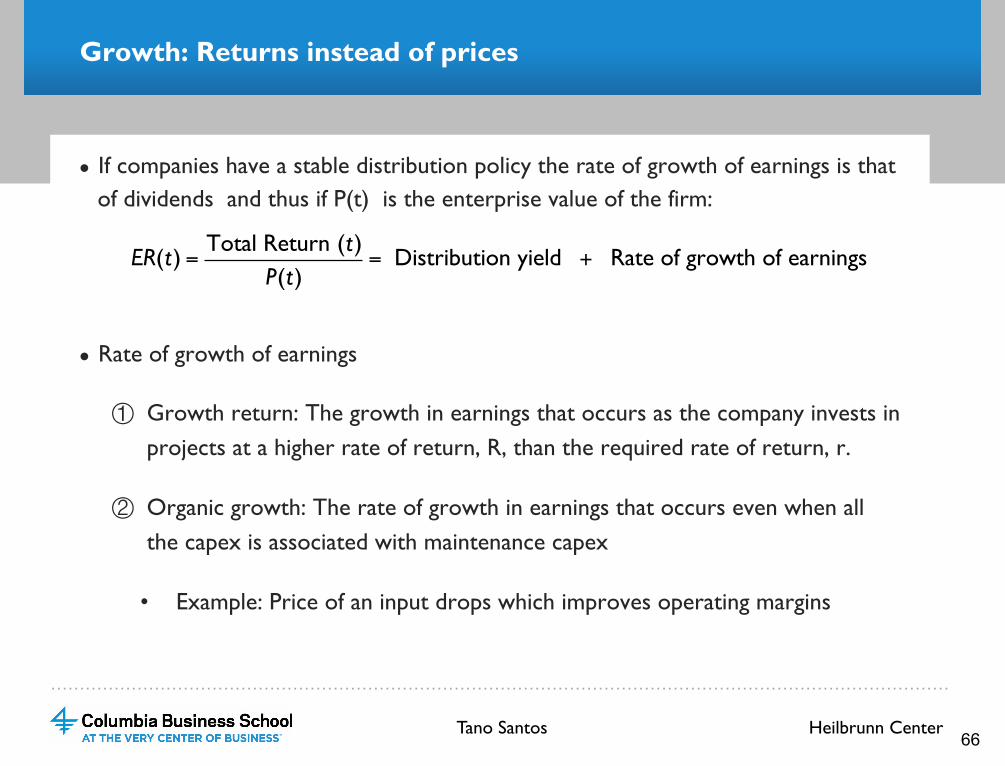
● If companies have a stable distribution policy the rate of growth of earnings is that of dividends and thus if P(t) is the enterprise value of the firm:
● Rate of growth of earnings
① Growth return: The growth in earnings that occurs as the company invests in projects at a higher rate of return, R, than the required rate of return, r.
② Organic growth: The rate of growth in earnings that occurs even when all the capex is associated with maintenance capex
• Example: Price of an input drops which improves operating margins
ER(t) =Total Return (t)
P(t)= Distribution yield + Rate of growth of earnings
Heilbrunn Center Tano Santos 66
…………………………………………………………………………………………………………………………………………
Growth: Returns instead of prices
● Two steps
1. Distribution yield: Earnings distributed as a percentage of enterprise value (market cap plus debt)
• Dividends, share repurchases, coupons, net debt issuance
2. Earnings growth rate: Two methods
A. Historical earnings growth
B. Calculating future earnings growth
a. Calculate ROIC for each of the segments
b. Calculate capital allocation across segments
c. Calculate organic growth
Heilbrunn Center Tano Santos 67
…………………………………………………………………………………………………………………………………………
Growth - Example: Walmart
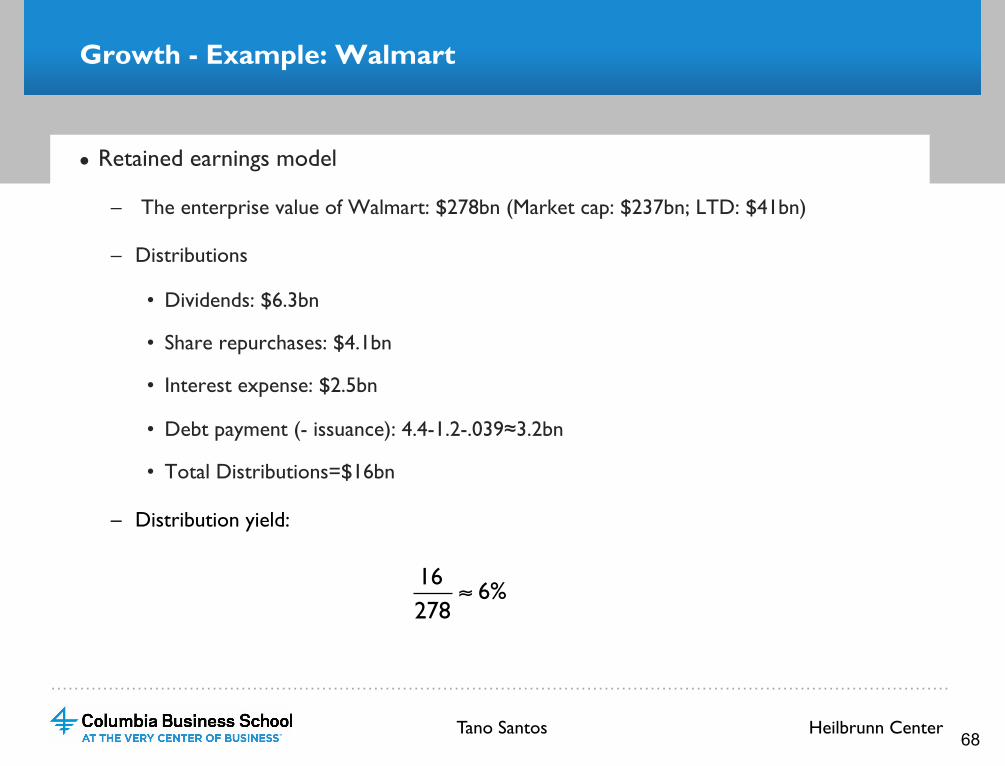
● Retained earnings model
– The enterprise value of Walmart: $278bn (Market cap: $237bn; LTD: $41bn)
– Distributions
• Dividends: $6.3bn
• Share repurchases: $4.1bn
• Interest expense: $2.5bn
• Debt payment (- issuance): 4.4-1.2-.039≈3.2bn
• Total Distributions=$16bn
– Distribution yield:
16278
≈ 6%
Heilbrunn Center Tano Santos 68
…………………………………………………………………………………………………………………………………………
Growth - Example: Walmart
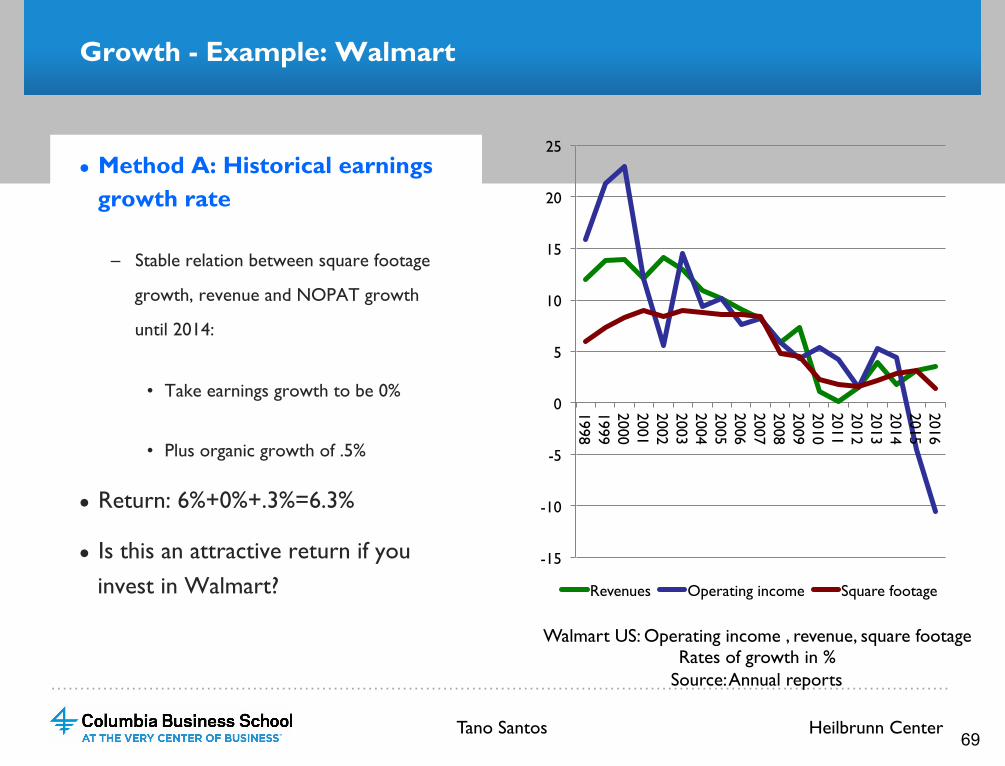
● Method A: Historical earnings growth rate
– Stable relation between square footage
growth, revenue and NOPAT growth
until 2014:
• Take earnings growth to be 0%
• Plus organic growth of .5%
● Return: 6%+0%+.3%=6.3%
● Is this an attractive return if you invest in Walmart?
Walmart US: Operating income , revenue, square footage Rates of growth in %
Source: Annual reports
-15
-10
-5
0
5
10
15
20
25
1998 1999 2000 2001 2002 2003 2004 2005 2006 2007 2008 2009 2010 2011 2012 2013 2014 2015 2016
Revenues Operating income Square footage
Heilbrunn Center Tano Santos 69
…………………………………………………………………………………………………………………………………………
Growth - Example: Walmart
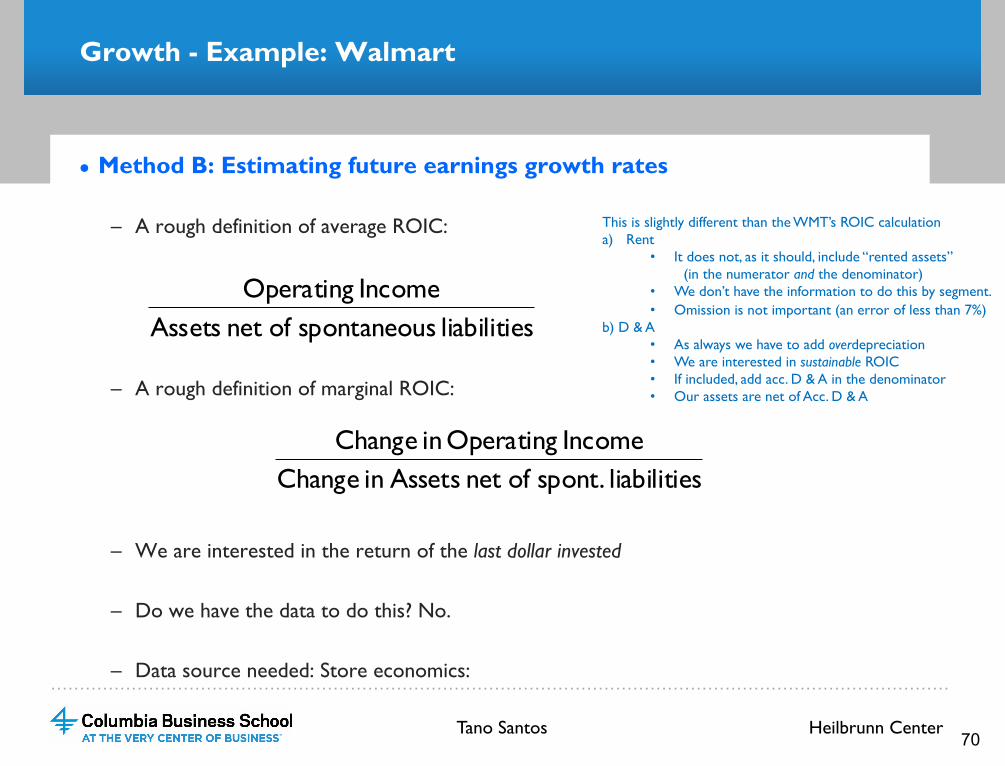
● Method B: Estimating future earnings growth rates
– A rough definition of average ROIC:
– A rough definition of marginal ROIC:
– We are interested in the return of the last dollar invested
– Do we have the data to do this? No.
– Data source needed: Store economics:
sliabilitie sspontaneou ofnet AssetsIncomeOperating
sliabilitie spont. ofnet Assetsin ChangeIncomeOperating in Change
This is slightly different than the WMT’s ROIC calculation a) Rent
• It does not, as it should, include “rented assets” (in the numerator and the denominator)
• We don’t have the information to do this by segment. • Omission is not important (an error of less than 7%)
b) D & A • As always we have to add overdepreciation • We are interested in sustainable ROIC • If included, add acc. D & A in the denominator • Our assets are net of Acc. D & A
Heilbrunn Center Tano Santos 70
…………………………………………………………………………………………………………………………………………
Growth - Example: Walmart
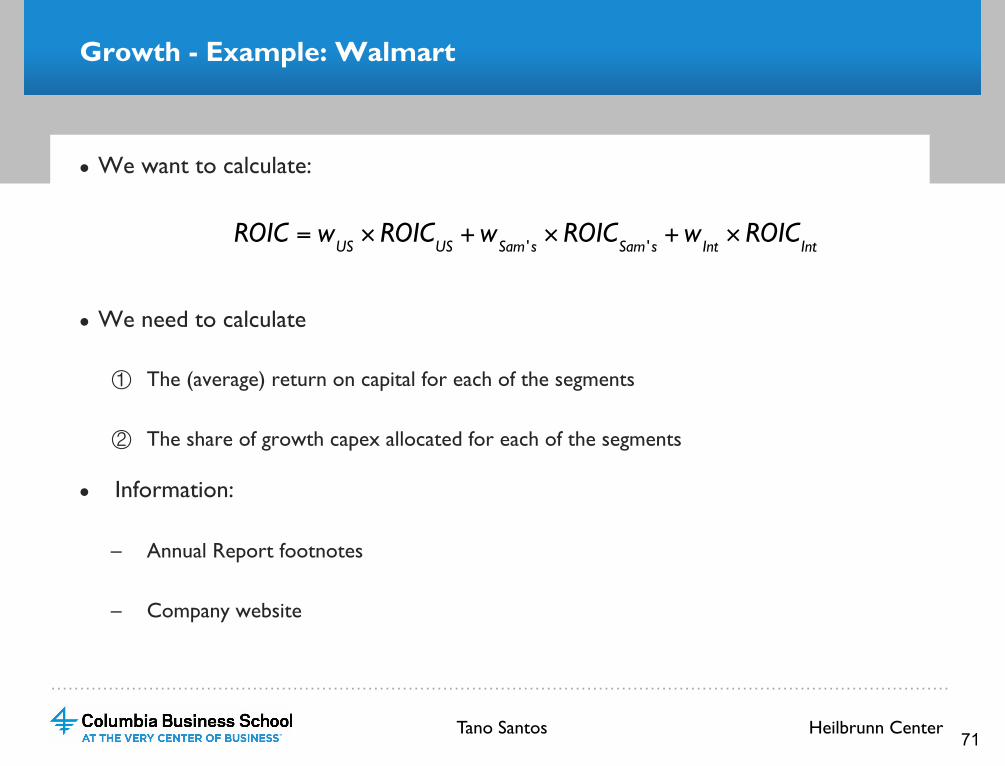
● We want to calculate:
● We need to calculate
① The (average) return on capital for each of the segments
② The share of growth capex allocated for each of the segments
● Information:
– Annual Report footnotes
– Company website
ROIC = wUS× ROIC
US+w
Sam ' s× ROIC
Sam ' s+w
Int× ROIC
Int
Heilbrunn Center Tano Santos 71
…………………………………………………………………………………………………………………………………………
Growth - Example: Walmart
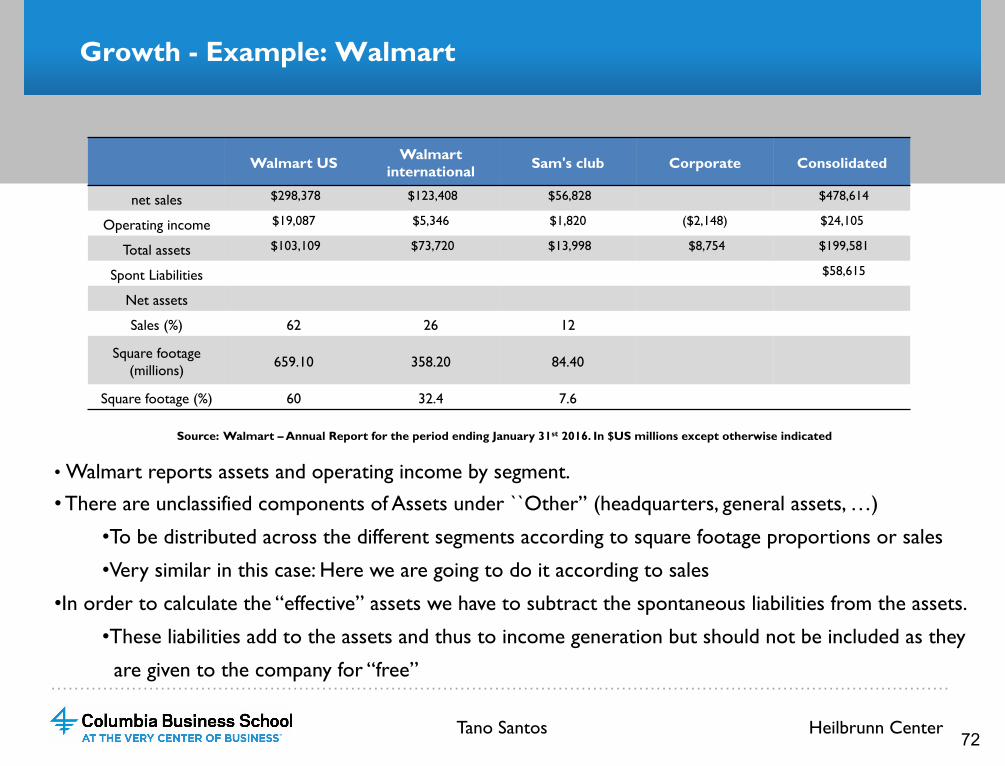
Source: Walmart – Annual Report for the period ending January 31st 2016. In $US millions except otherwise indicated
• Walmart reports assets and operating income by segment.
• There are unclassified components of Assets under ``Other’’ (headquarters, general assets, …)
• To be distributed across the different segments according to square footage proportions or sales
• Very similar in this case: Here we are going to do it according to sales
• In order to calculate the “effective” assets we have to subtract the spontaneous liabilities from the assets.
• These liabilities add to the assets and thus to income generation but should not be included as they
are given to the company for “free”
Walmart US Walmart international Sam's club Corporate Consolidated
net sales $298,378 $123,408 $56,828 $478,614
Operating income $19,087 $5,346 $1,820 ($2,148) $24,105
Total assets $103,109 $73,720 $13,998 $8,754 $199,581
Spont Liabilities $58,615
Net assets
Sales (%) 62 26 12
Square footage (millions) 659.10 358.20 84.40
Square footage (%) 60 32.4 7.6
Heilbrunn Center Tano Santos 72
…………………………………………………………………………………………………………………………………………
Growth - Example: Walmart
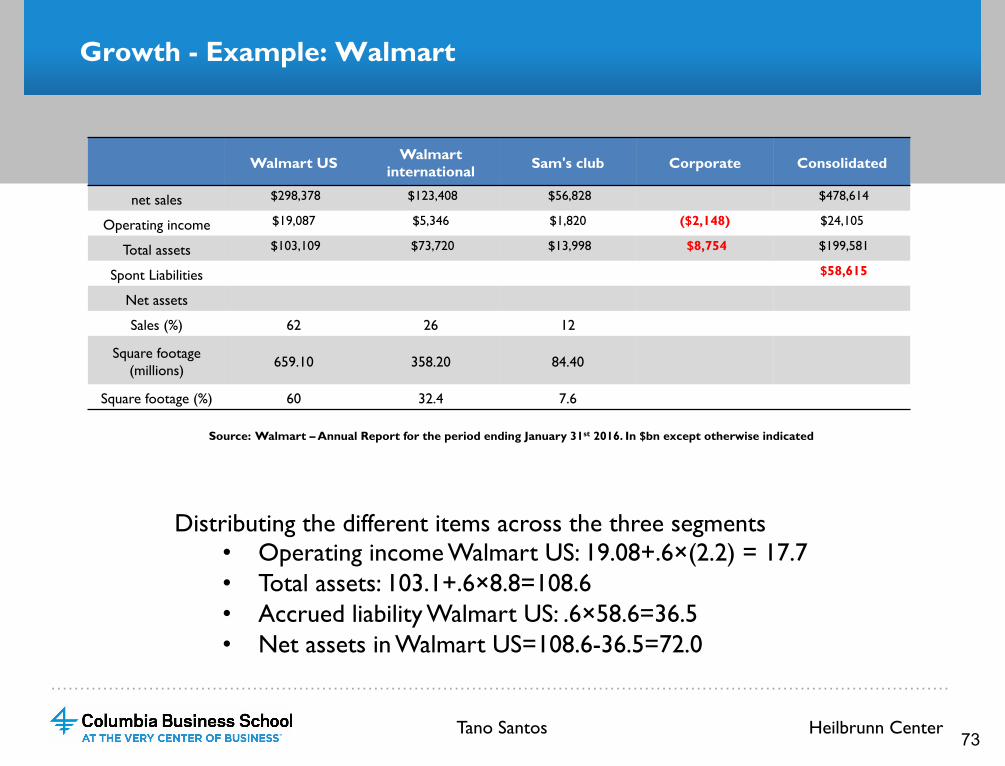
Source: Walmart – Annual Report for the period ending January 31st 2016. In $bn except otherwise indicated
Distributing the different items across the three segments • Operating income Walmart US: 19.08+.6×(2.2) = 17.7 • Total assets: 103.1+.6×8.8=108.6 • Accrued liability Walmart US: .6×58.6=36.5 • Net assets in Walmart US=108.6-36.5=72.0
Walmart US Walmart international Sam's club Corporate Consolidated
net sales $298,378 $123,408 $56,828 $478,614
Operating income $19,087 $5,346 $1,820 ($2,148) $24,105
Total assets $103,109 $73,720 $13,998 $8,754 $199,581
Spont Liabilities $58,615
Net assets
Sales (%) 62 26 12
Square footage (millions) 659.10 358.20 84.40
Square footage (%) 60 32.4 7.6
Heilbrunn Center Tano Santos 73
…………………………………………………………………………………………………………………………………………
Growth - Example: Walmart
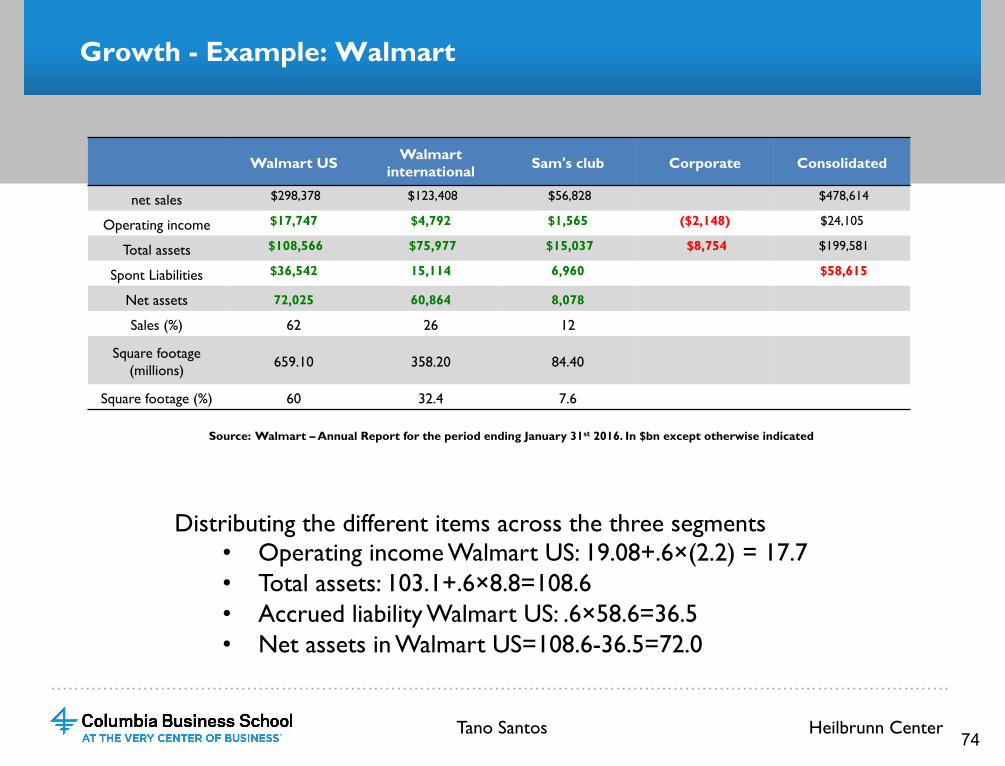
Source: Walmart – Annual Report for the period ending January 31st 2016. In $bn except otherwise indicated
Distributing the different items across the three segments • Operating income Walmart US: 19.08+.6×(2.2) = 17.7 • Total assets: 103.1+.6×8.8=108.6 • Accrued liability Walmart US: .6×58.6=36.5 • Net assets in Walmart US=108.6-36.5=72.0
Walmart US Walmart international Sam's club Corporate Consolidated
net sales $298,378 $123,408 $56,828 $478,614
Operating income $17,747 $4,792 $1,565 ($2,148) $24,105
Total assets $108,566 $75,977 $15,037 $8,754 $199,581
Spont Liabilities $36,542 15,114 6,960 $58,615
Net assets 72,025 60,864 8,078
Sales (%) 62 26 12
Square footage (millions) 659.10 358.20 84.40
Square footage (%) 60 32.4 7.6
Heilbrunn Center Tano Santos 74
…………………………………………………………………………………………………………………………………………
Growth - Example: Walmart
● When calculating ROIC we are using total assets net of accrued liabilities not the market value of the assets, which we used for AV calculation
● Why?
– The reason is that we are trying to estimate the return associated with the actual capital
invested, which is better reflected by the (net) book value at which those assets are
carried.
– Recall that this is a backward looking measure (historical assets and ebit)
– An important issue is that of goodwill
• Subtracting goodwill increases ROIC
• Brands are an important driver of ROIC
Heilbrunn Center Tano Santos 75
…………………………………………………………………………………………………………………………………………
Growth - Example: Walmart
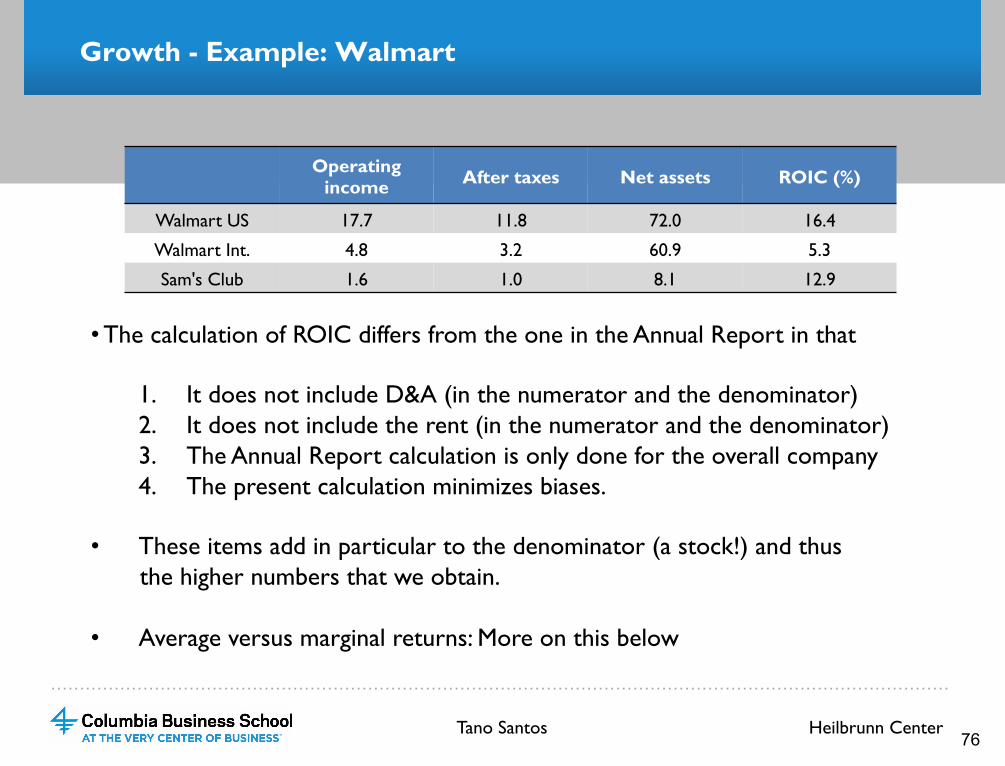
• The calculation of ROIC differs from the one in the Annual Report in that
1. It does not include D&A (in the numerator and the denominator) 2. It does not include the rent (in the numerator and the denominator) 3. The Annual Report calculation is only done for the overall company 4. The present calculation minimizes biases.
• These items add in particular to the denominator (a stock!) and thus the higher numbers that we obtain.
• Average versus marginal returns: More on this below
Operating income After taxes Net assets ROIC (%)
Walmart US 17.7 11.8 72.0 16.4
Walmart Int. 4.8 3.2 60.9 5.3
Sam's Club 1.6 1.0 8.1 12.9
Heilbrunn Center Tano Santos 76
…………………………………………………………………………………………………………………………………………
Growth - Example: Walmart
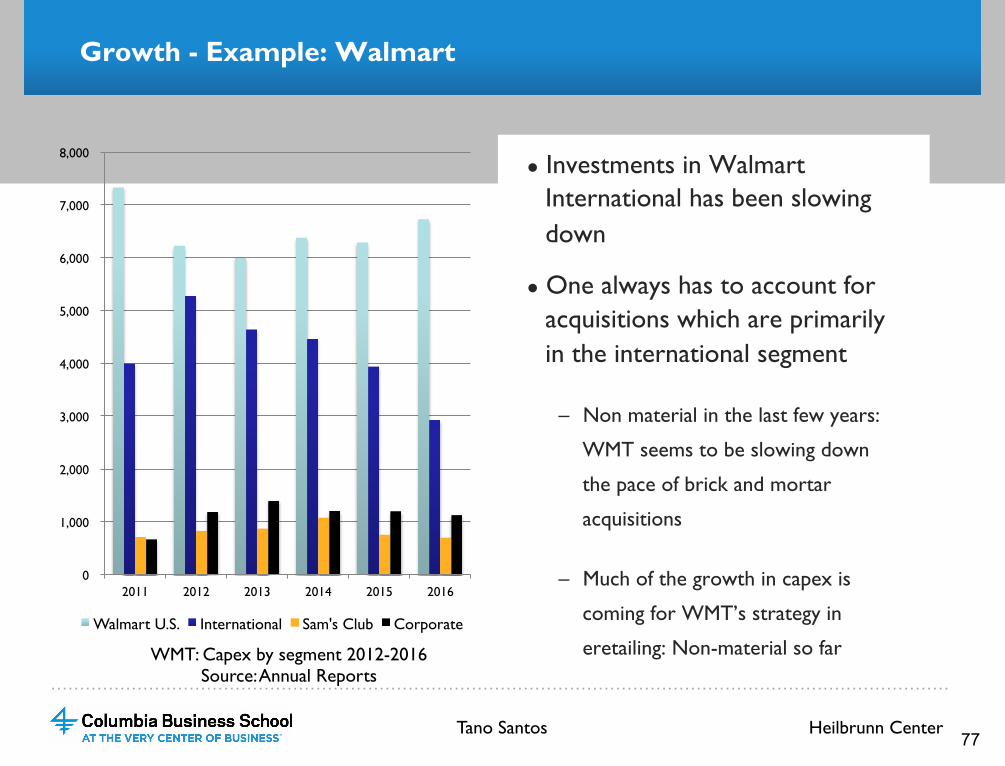
● Investments in Walmart International has been slowing down
● One always has to account for acquisitions which are primarily in the international segment
– Non material in the last few years:
WMT seems to be slowing down
the pace of brick and mortar
acquisitions
– Much of the growth in capex is
coming for WMT’s strategy in
eretailing: Non-material so far WMT: Capex by segment 2012-2016 Source: Annual Reports
0
1,000
2,000
3,000
4,000
5,000
6,000
7,000
8,000
2011 2012 2013 2014 2015 2016
Walmart U.S. International Sam's Club Corporate
Heilbrunn Center Tano Santos 77
…………………………………………………………………………………………………………………………………………
Growth - Example: Walmart
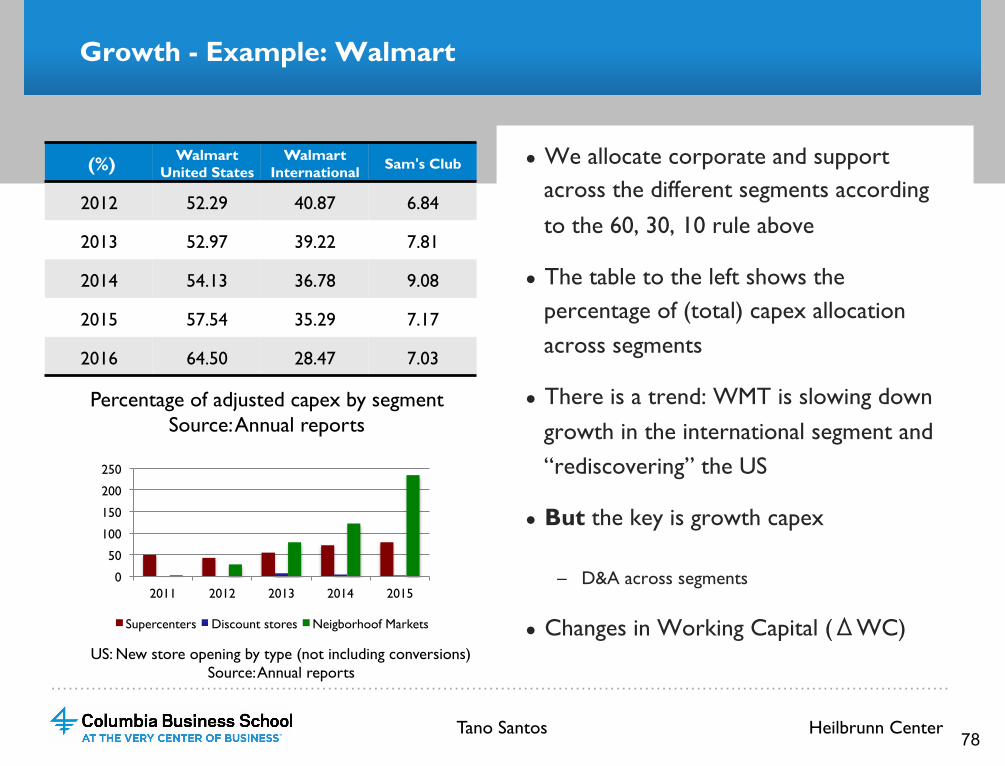
(%) Walmart United States
Walmart International Sam's Club
2012 52.29 40.87 6.84
2013 52.97 39.22 7.81
2014 54.13 36.78 9.08
2015 57.54 35.29 7.17
2016 64.50 28.47 7.03
● We allocate corporate and support across the different segments according to the 60, 30, 10 rule above
● The table to the left shows the percentage of (total) capex allocation across segments
● There is a trend: WMT is slowing down growth in the international segment and “rediscovering” the US
● But the key is growth capex
– D&A across segments
● Changes in Working Capital (ΔWC)
Percentage of adjusted capex by segment Source: Annual reports
0
50
100
150
200
250
2011 2012 2013 2014 2015
Supercenters Discount stores Neigborhoof Markets
US: New store opening by type (not including conversions) Source: Annual reports
Heilbrunn Center Tano Santos 78
…………………………………………………………………………………………………………………………………………
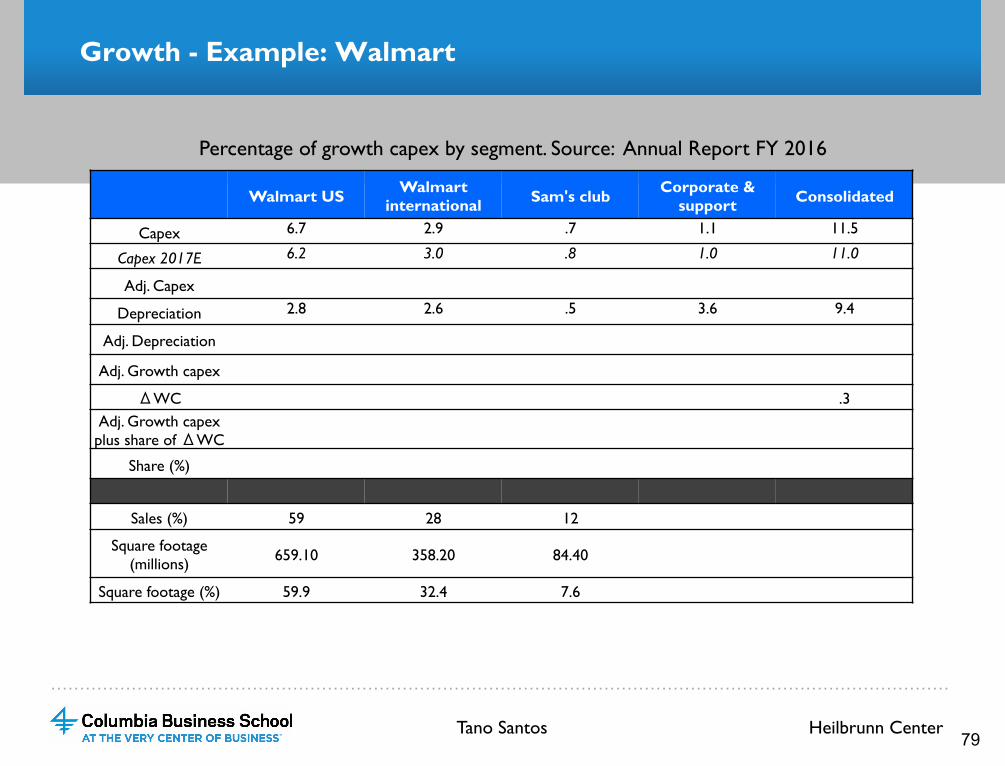
Growth - Example: Walmart
Walmart US Walmart international Sam's club Corporate &
support Consolidated
Capex 6.7 2.9 .7 1.1 11.5
Capex 2017E 6.2 3.0 .8 1.0 11.0
Adj. Capex
Depreciation 2.8 2.6 .5 3.6 9.4
Adj. Depreciation
Adj. Growth capex
ΔWC .3 Adj. Growth capex plus share of ΔWC
Share (%)
Sales (%) 59 28 12
Square footage (millions) 659.10 358.20 84.40
Square footage (%) 59.9 32.4 7.6
Percentage of growth capex by segment. Source: Annual Report FY 2016
Heilbrunn Center Tano Santos 79
…………………………………………………………………………………………………………………………………………
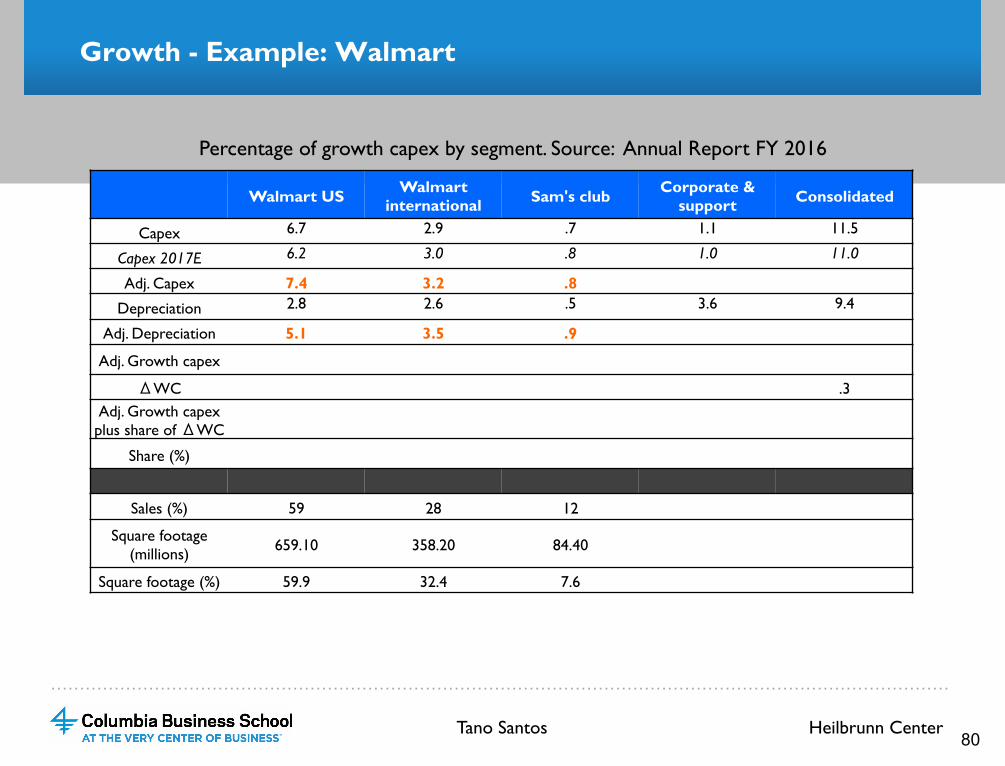
Growth - Example: Walmart
Walmart US Walmart international Sam's club Corporate &
support Consolidated
Capex 6.7 2.9 .7 1.1 11.5
Capex 2017E 6.2 3.0 .8 1.0 11.0
Adj. Capex 7.4 3.2 .8 Depreciation 2.8 2.6 .5 3.6 9.4
Adj. Depreciation 5.1 3.5 .9
Adj. Growth capex
ΔWC .3 Adj. Growth capex plus share of ΔWC
Share (%)
Sales (%) 59 28 12
Square footage (millions) 659.10 358.20 84.40
Square footage (%) 59.9 32.4 7.6
Percentage of growth capex by segment. Source: Annual Report FY 2016
Heilbrunn Center Tano Santos 80
…………………………………………………………………………………………………………………………………………
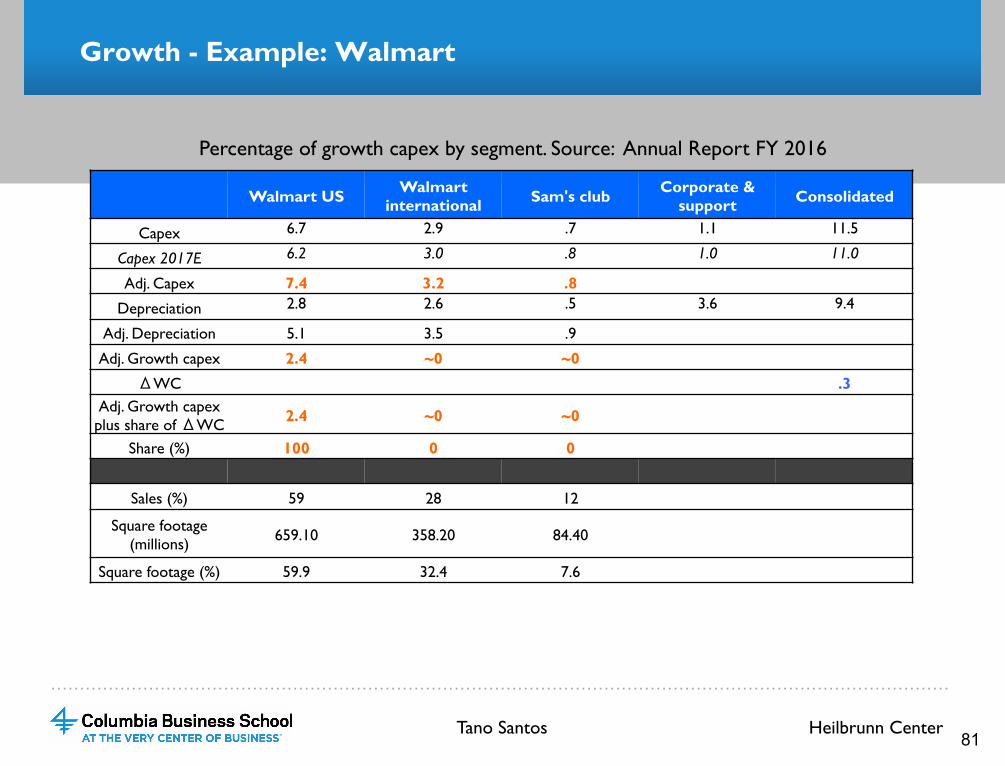
Growth - Example: Walmart
Walmart US Walmart international Sam's club Corporate &
support Consolidated
Capex 6.7 2.9 .7 1.1 11.5
Capex 2017E 6.2 3.0 .8 1.0 11.0
Adj. Capex 7.4 3.2 .8 Depreciation 2.8 2.6 .5 3.6 9.4
Adj. Depreciation 5.1 3.5 .9
Adj. Growth capex 2.4 ~0 ~0 ΔWC .3
Adj. Growth capex plus share of ΔWC 2.4 ~0 ~0
Share (%) 100 0 0
Sales (%) 59 28 12
Square footage (millions) 659.10 358.20 84.40
Square footage (%) 59.9 32.4 7.6
Percentage of growth capex by segment. Source: Annual Report FY 2016
Heilbrunn Center Tano Santos 81
…………………………………………………………………………………………………………………………………………
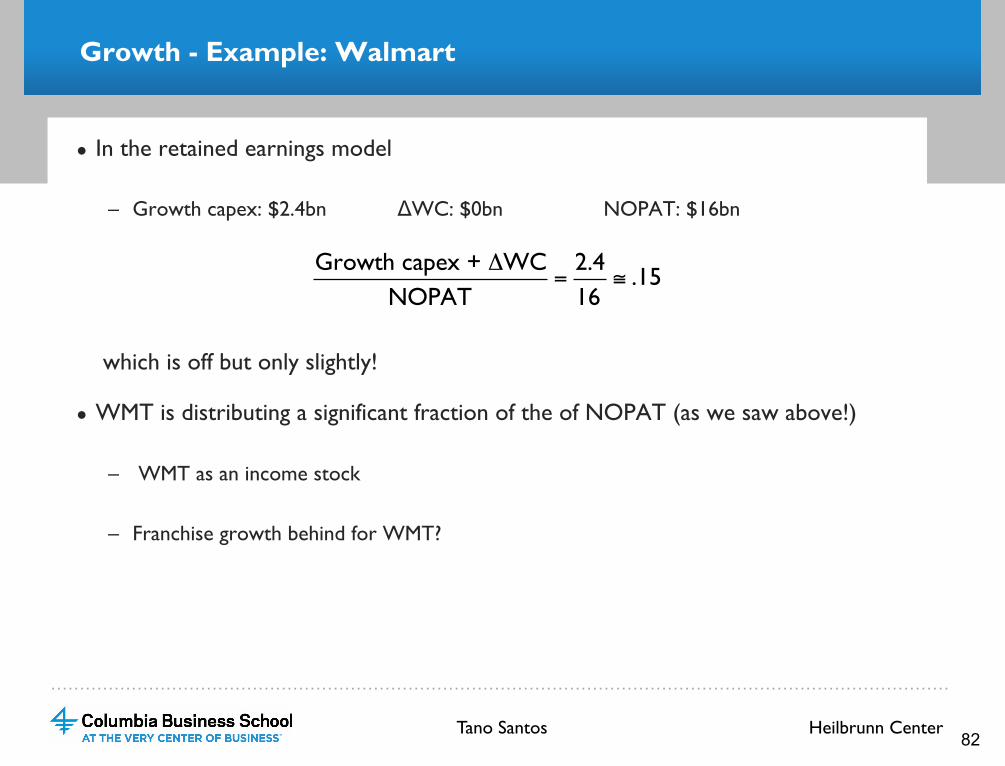
Growth - Example: Walmart
● In the retained earnings model
– Growth capex: $2.4bn ΔWC: $0bn NOPAT: $16bn
which is off but only slightly!
● WMT is distributing a significant fraction of the of NOPAT (as we saw above!)
– WMT as an income stock
– Franchise growth behind for WMT?
Growth capex + ΔWCNOPAT
=2.416
≅ .15
Heilbrunn Center Tano Santos 82
…………………………………………………………………………………………………………………………………………
Growth - Example: Walmart
● Caveats
a. History of capital allocation, trends, acquisitions, working capital, issuance, …
b. Corrections in WC:
• Current assets: Subtract from current assets non operating cash
• Current liabilities: Subtract short term borrowings
c. Part of the growth capex is expensed:
• Example: Marketing expenses to grow the brand:
– $2bn of marketing expenses;
– calculate the component of growth and assign across segments;
– small adjustment
– Other examples: R&D (not relevant for WMT)
Heilbrunn Center Tano Santos 83
…………………………………………………………………………………………………………………………………………
Growth - Example: Walmart
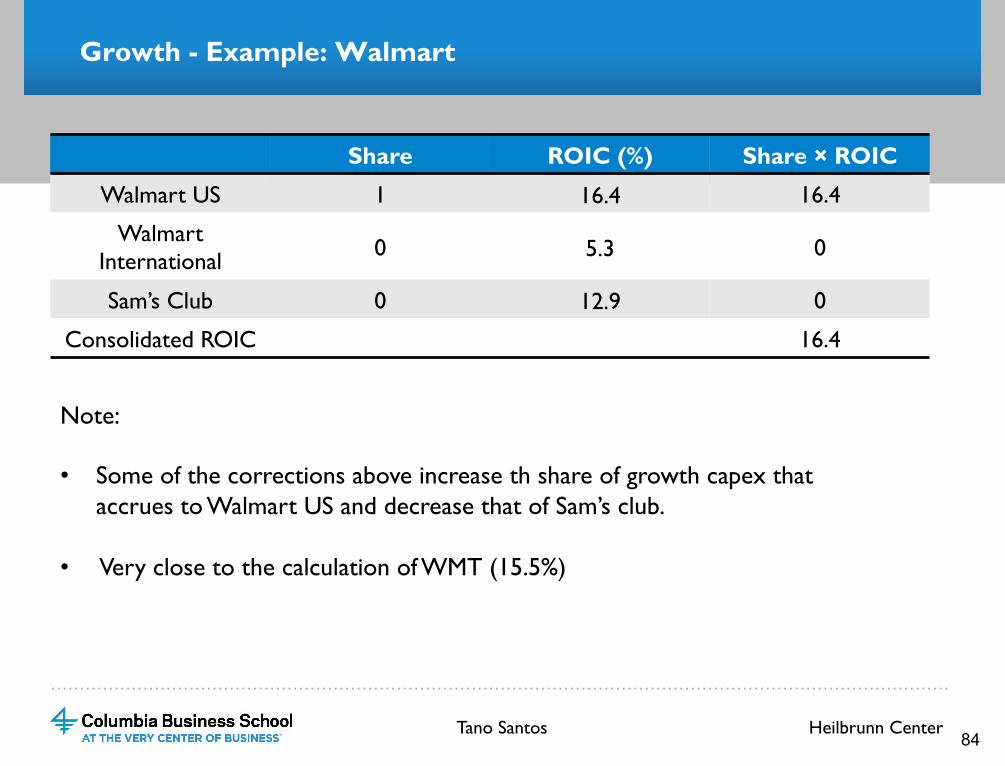
Share ROIC (%) Share × ROIC
Walmart US 1 16.4 16.4
Walmart International 0 5.3 0
Sam’s Club 0 12.9 0
Consolidated ROIC 16.4
Note: • Some of the corrections above increase th share of growth capex that
accrues to Walmart US and decrease that of Sam’s club.
• Very close to the calculation of WMT (15.5%)
Heilbrunn Center Tano Santos 84
…………………………………………………………………………………………………………………………………………
Growth - Example: Walmart
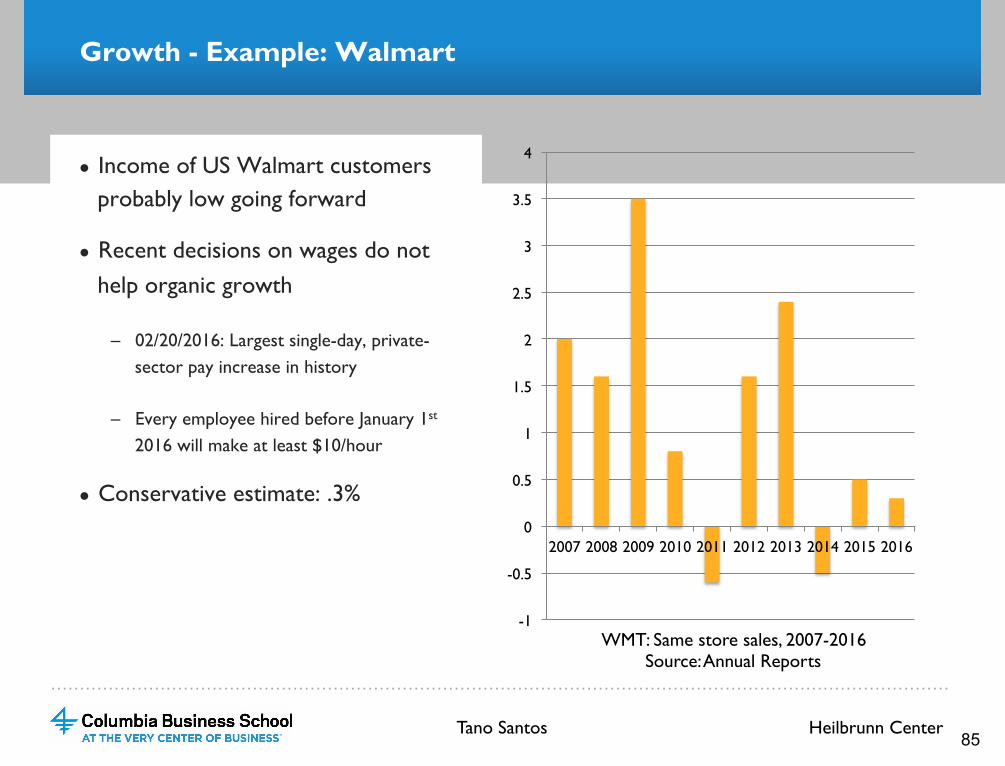
● Income of US Walmart customers probably low going forward
● Recent decisions on wages do not help organic growth
– 02/20/2016: Largest single-day, private-sector pay increase in history
– Every employee hired before January 1st 2016 will make at least $10/hour
● Conservative estimate: .3%
WMT: Same store sales, 2007-2016 Source: Annual Reports
-1
-0.5
0
0.5
1
1.5
2
2.5
3
3.5
4
2007 2008 2009 2010 2011 2012 2013 2014 2015 2016
Heilbrunn Center Tano Santos 85
…………………………………………………………………………………………………………………………………………
Growth - Example: Walmart
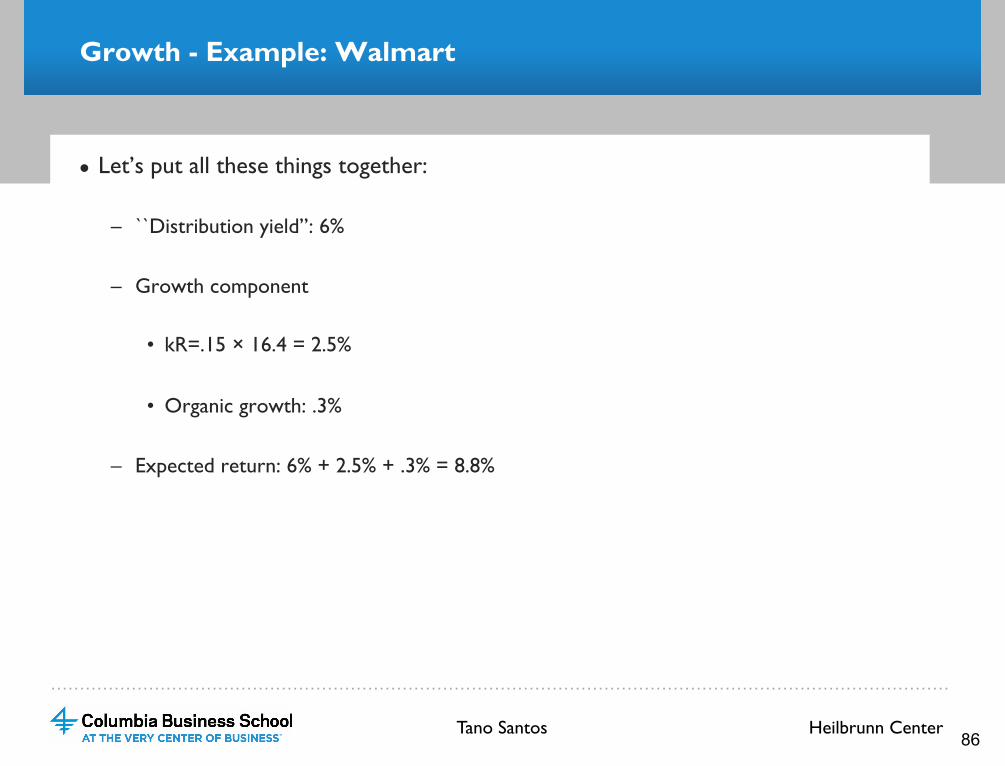
● Let’s put all these things together:
– ``Distribution yield’’: 6%
– Growth component
• kR=.15 × 16.4 = 2.5%
• Organic growth: .3%
– Expected return: 6% + 2.5% + .3% = 8.8%
Heilbrunn Center Tano Santos 86
…………………………………………………………………………………………………………………………………………
Growth - Example: Walmart
● If we take as an estimate of the growth component past earnings growth we get 6.3%
● If we take as an estimate of the growth component the growth accounting calculation we get about 9%
– Biases: Average ROIC
– Past capital allocation
● The expected return should be between 6% and 9%
– Average: 7.5%
● Is this good enough?
Heilbrunn Center Tano Santos 87
…………………………………………………………………………………………………………………………………………
Growth - Example: Walmart
● Leverage (Debt/Equity)=44/229≈.2
● Net interest costs: Most recent issuance 3.3%
● Recall
● Expected return on equity: 9%+.2×(9%-3.3%) ≈10%
● Taking the more conservative estimate of 6% we get 6.5%
● Is this enough?
ERequity t( )=ER t( )+FLEV ER t( )-NBC⎡⎣
⎤⎦
Heilbrunn Center Tano Santos 88