Embed Size (px)
Citation preview
Introduction to NMR Spectroscopy and Imaging
Lecture 09 Applications of Solid State NMR
(Spring Term, 2011)
Department of ChemistryNational Sun Yat-sen University
核磁共振光譜與影像導論
• Polymers
• Glasses
• Porous materials
• Liquid crystals
Applications of Solid State NMR
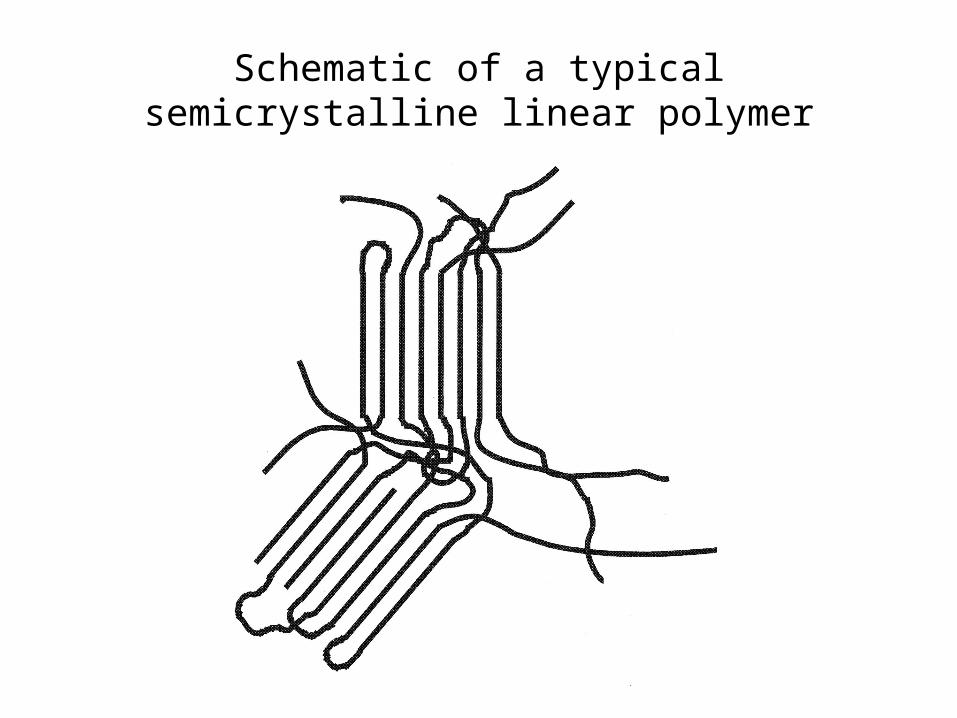
Schematic of a typical semicrystalline linear polymer
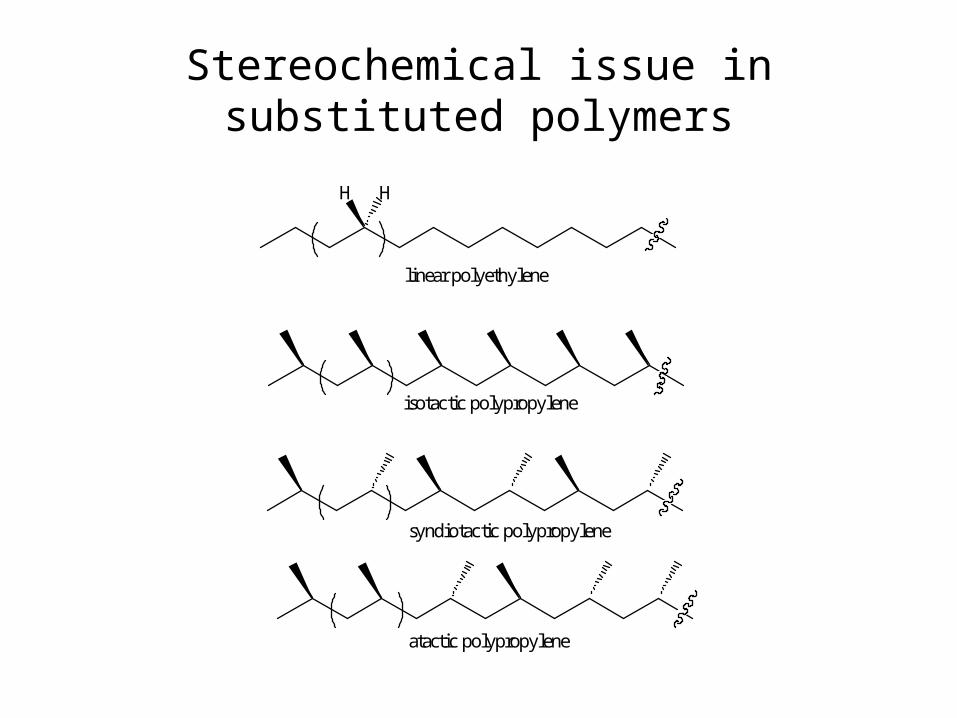
Stereochemical issue in substituted polymers
H H
linear polyethylene
isotactic polypropylene
syndiotactic polypropylene
atactic polypropylene
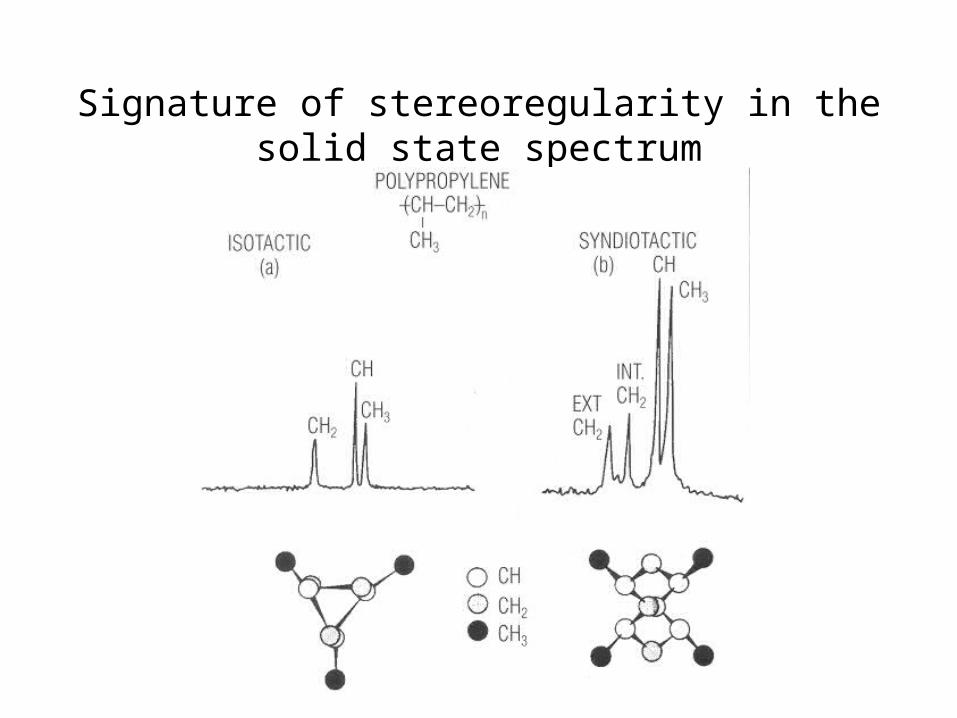
Signature of stereoregularity in the solid state spectrum
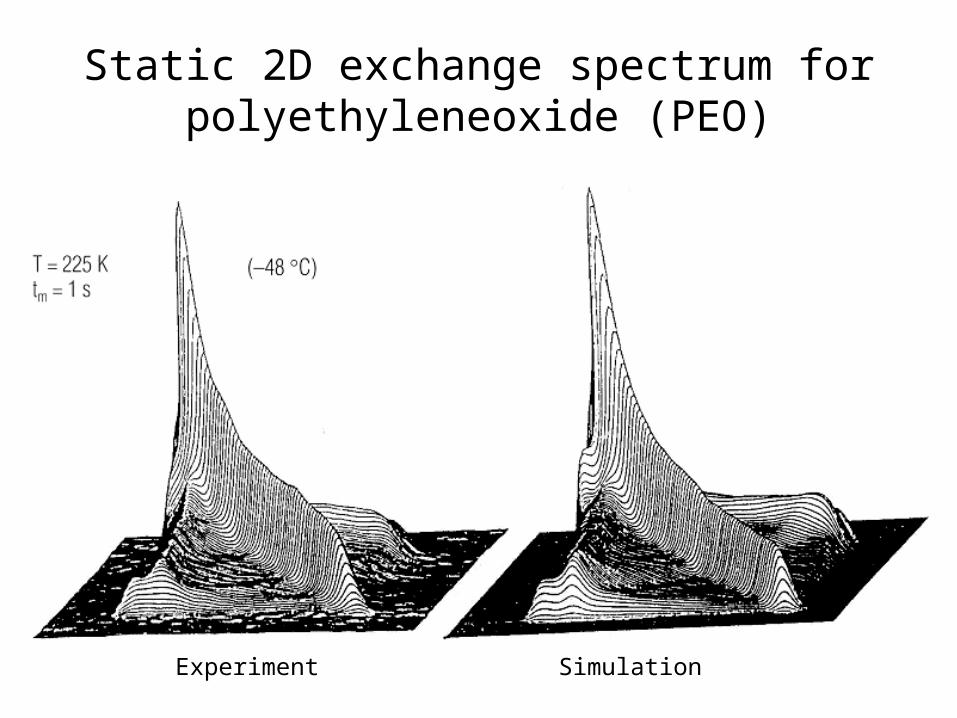
Static 2D exchange spectrum for polyethyleneoxide (PEO)
Experiment Simulation
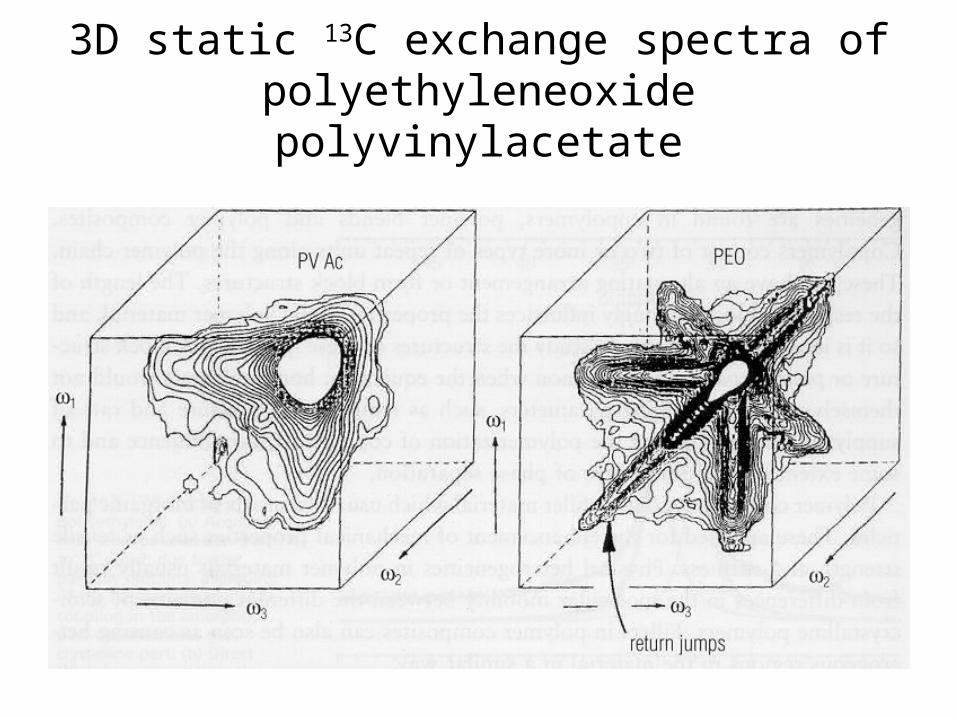
3D static 13C exchange spectra of polyethyleneoxide polyvinylacetate
Applications
• Polymers
• Glasses
• Porous materials
• Liquid crystals

Static whole-echo 207Pb NMR spectrain Pb-silicate glasses
mol %PbO6650.531
4000 0 -4000 ppm
Linewidth ~400 kHz @ 9.4 T—> signals of 6 experiments summed up
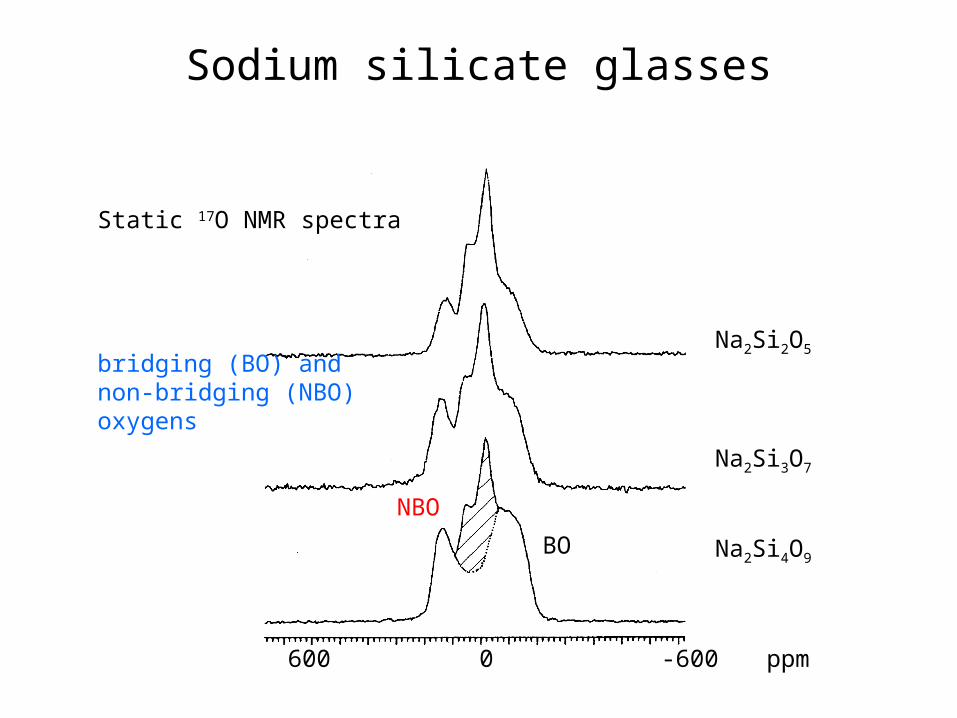
Sodium silicate glasses
BO
NBO
Na2Si2O5
Na2Si3O7
Na2Si4O9
600 0 -600 ppm
Static 17O NMR spectra
bridging (BO) andnon-bridging (NBO)oxygens
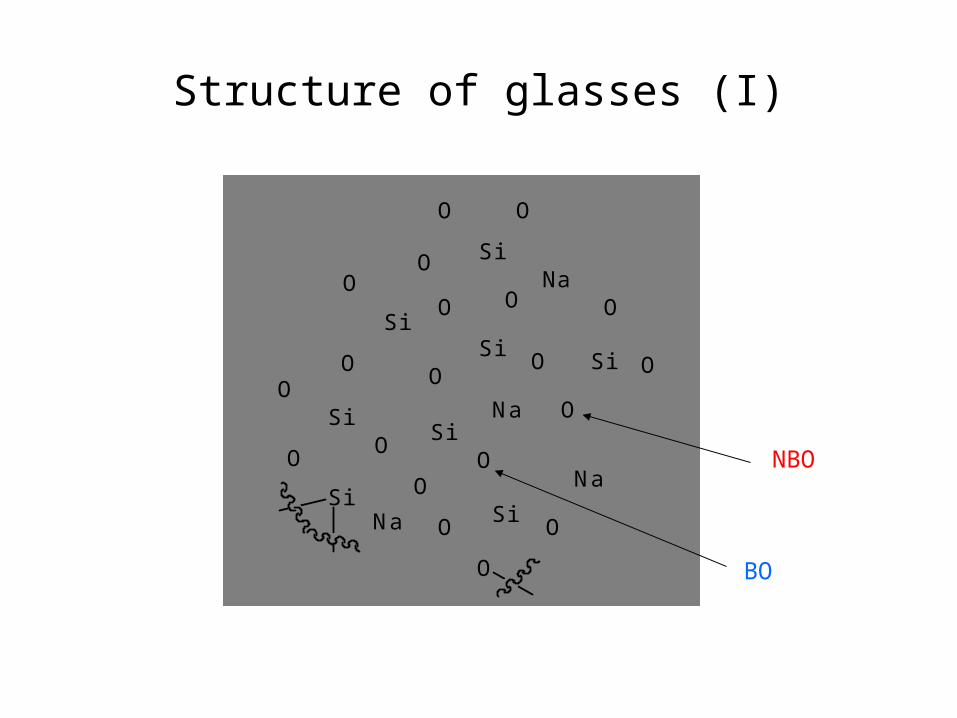
Structure of glasses (I)
OSi
OO
OSi
O
O O
SiOO
O
Si
Si
Si
O
Si O
O
O
O
OO
OO
O
Na
Na
Na
NaSi
BO
NBO
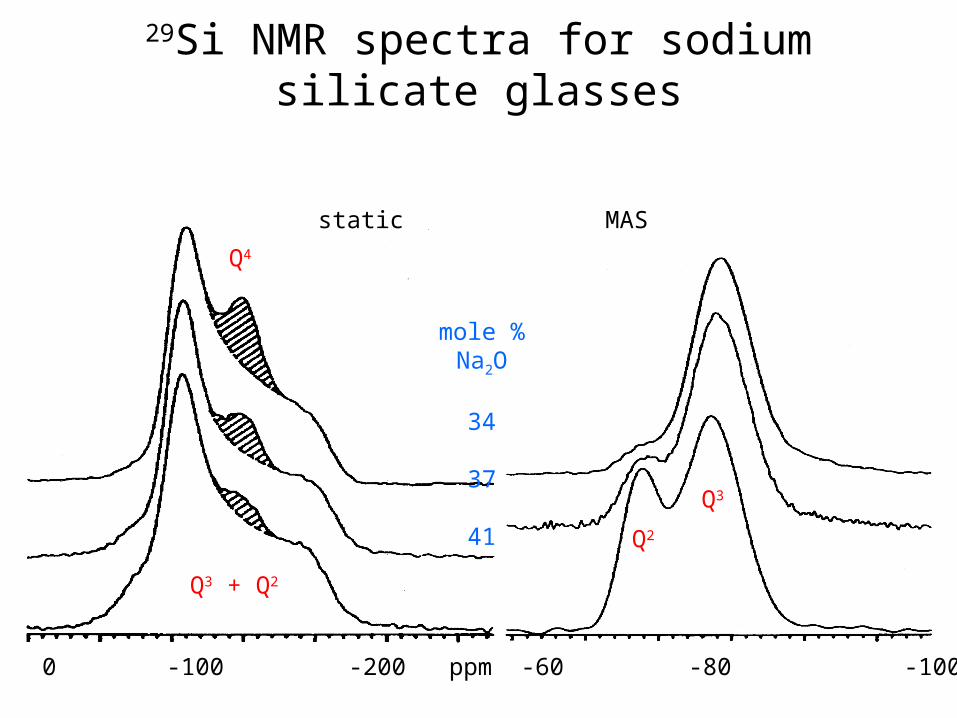
29Si NMR spectra for sodium silicate glasses
static MAS
Q4
Q3 + Q2
0 -100 -200 ppm -60 -80 -100
mole %Na2O
34
37
41 Q2
Q3
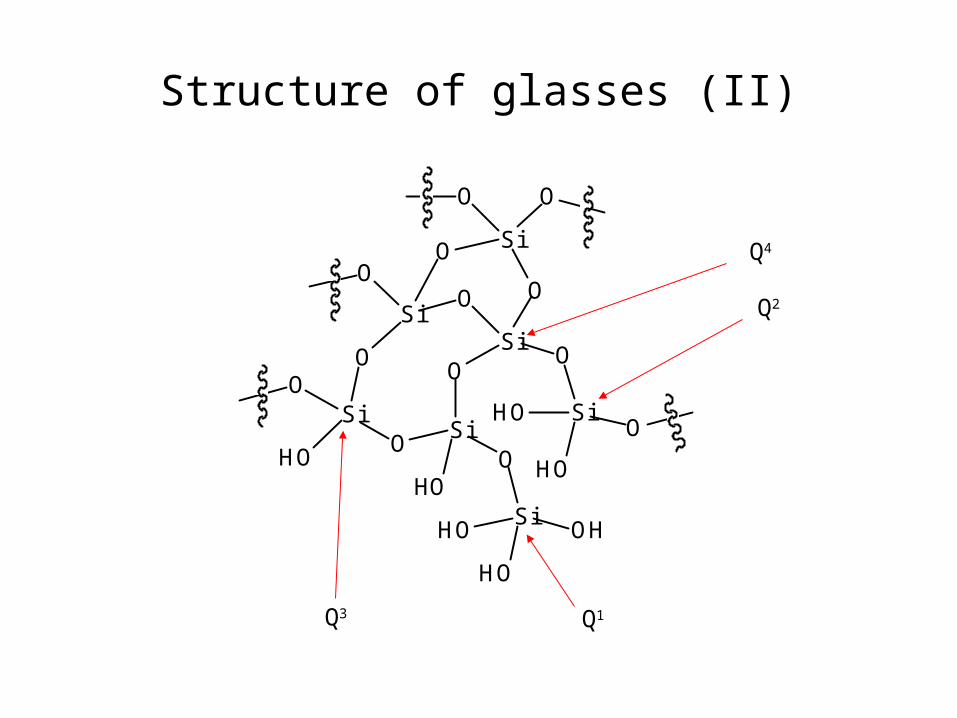
Structure of glasses (II)
Q4
Q2
Q1Q3
OSi
HOO
OSi
O
O O
SiOHHO
HO
Si
Si
Si
O
SiO
HO
HO
HO
OO
OO
O
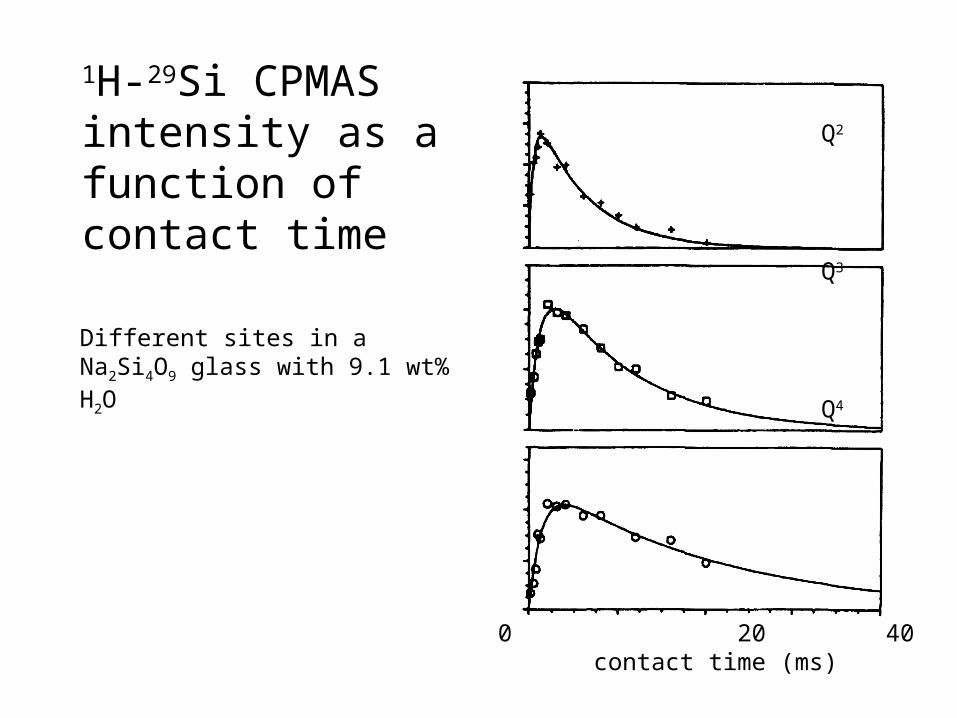
1H-29Si CPMAS intensity as a function of contact time
Different sites in a Na2Si4O9 glass with 9.1 wt% H2O
Q2
Q3
Q4
0 20 40contact time (ms)
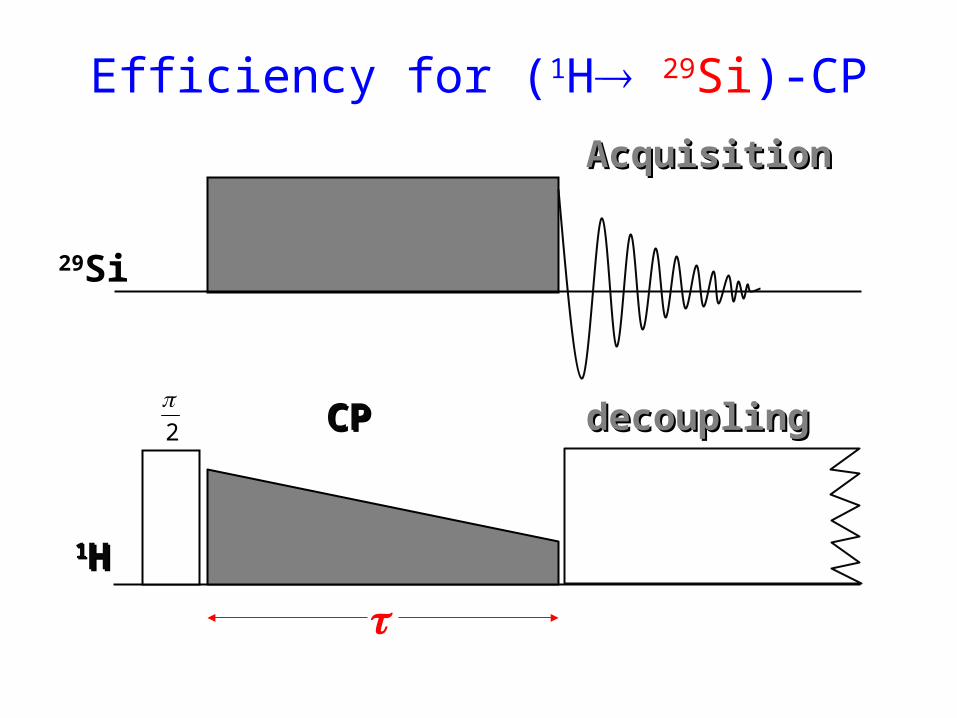
Efficiency for (1H 29Si)-CP
2
CPCP decouplingdecoupling
11HH
29Si
AcquisitionAcquisition
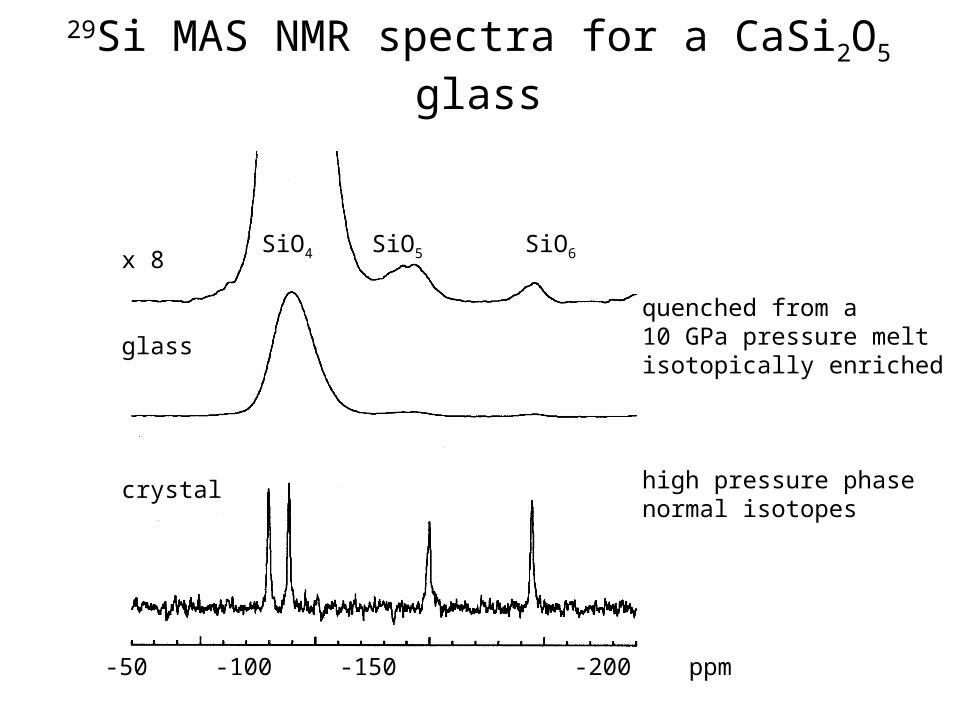
29Si MAS NMR spectra for a CaSi2O5 glass
x 8
glass
crystal
SiO4 SiO5 SiO6
-50 -100 -150 -200 ppm
quenched from a10 GPa pressure meltisotopically enriched
high pressure phasenormal isotopes
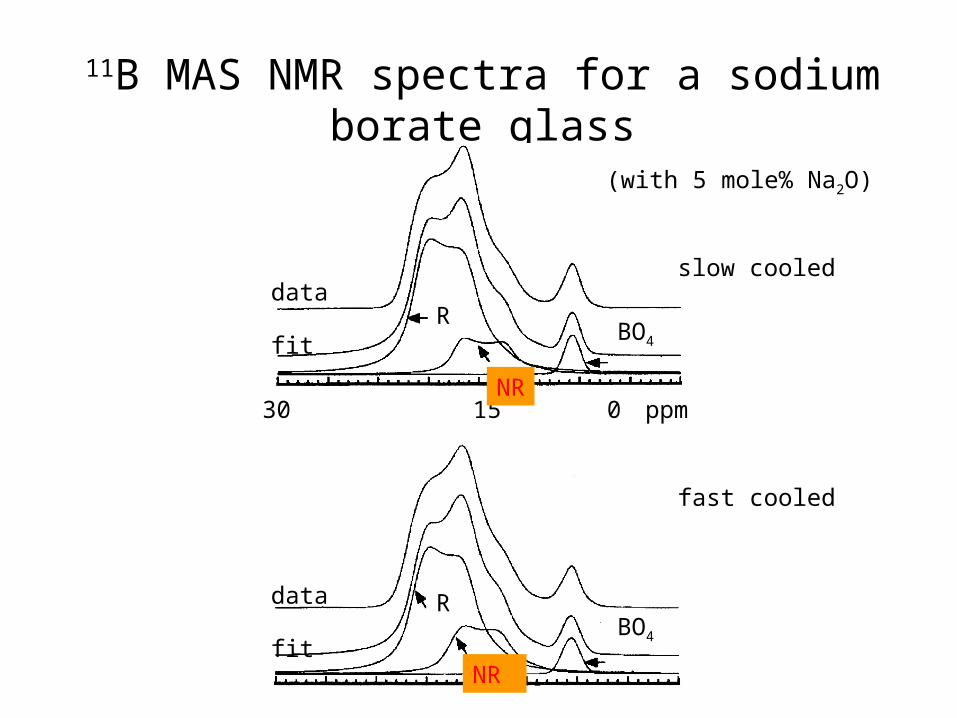
11B MAS NMR spectra for a sodium borate glass
30 15 0 ppm
data
fit
data
fit
RBO4
BO4
NR
NR
R
slow cooled
fast cooled
(with 5 mole% Na2O)
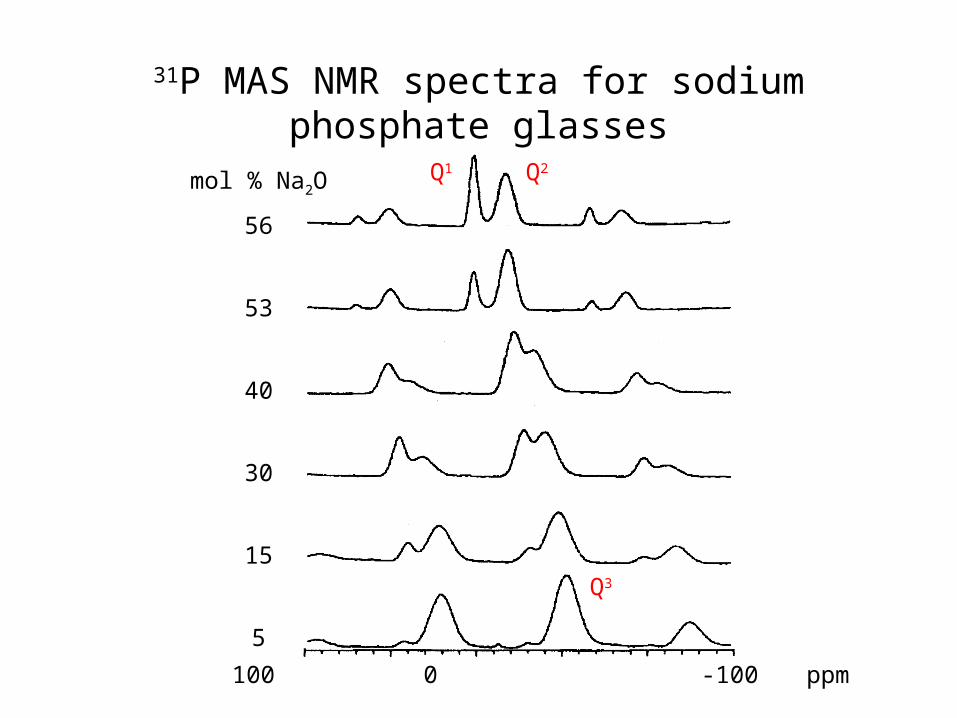
31P MAS NMR spectra for sodium phosphate glasses
mol % Na2O
56
53
40
30
15
5
100 0 -100 ppm
Q1 Q2
Q3
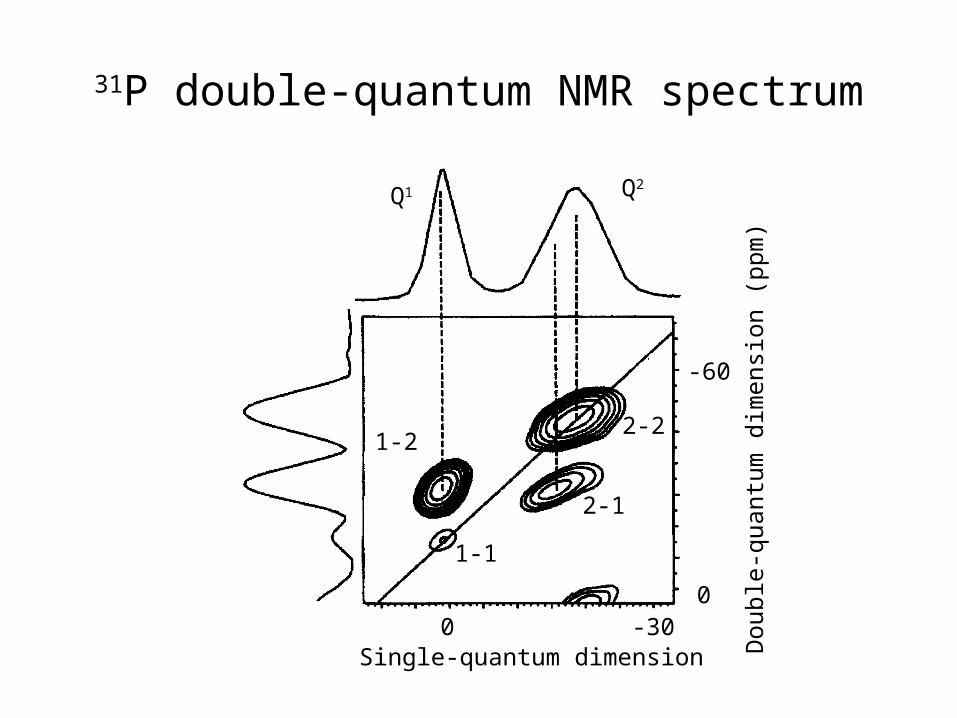
31P double-quantum NMR spectrum
Dou
ble-
quan
tum
dim
ensi
on (
ppm
)
0
-60
0 -30Single-quantum dimension
1-1
1-2
2-1
2-2
Q1 Q2
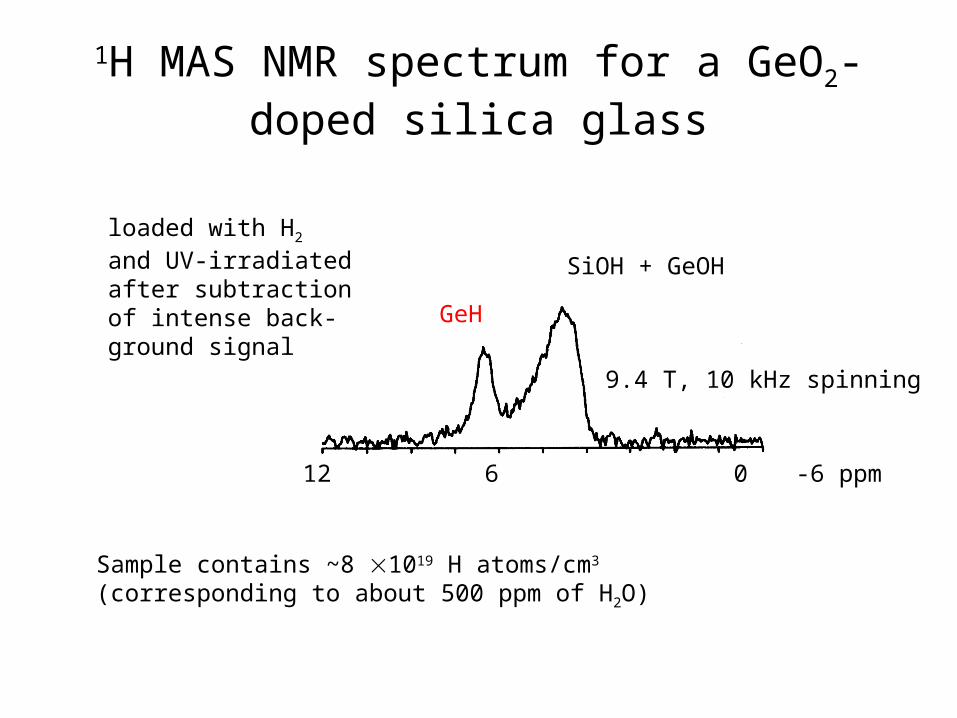
1H MAS NMR spectrum for a GeO2-doped silica glass
loaded with H2 and UV-irradiatedafter subtractionof intense back-ground signal
GeH
SiOH + GeOH
12 6 0 -6 ppm
Sample contains ~8 1019 H atoms/cm3
(corresponding to about 500 ppm of H2O)
9.4 T, 10 kHz spinning
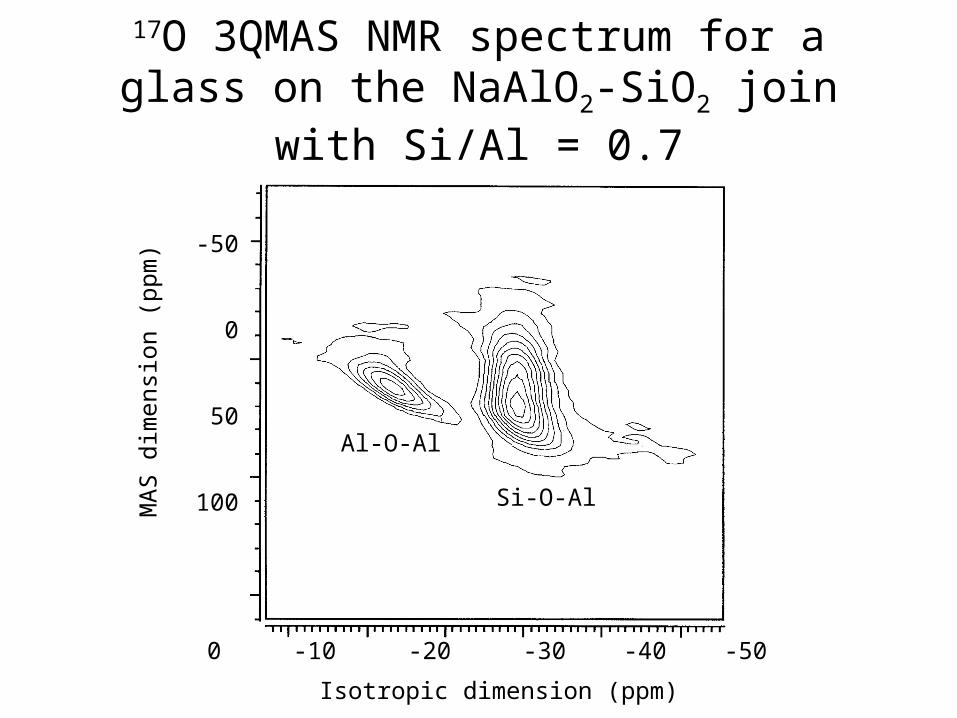
17O 3QMAS NMR spectrum for a glass on the NaAlO2-SiO2 join with Si/Al = 0.7
MA
S d
imen
sion
(pp
m)
Isotropic dimension (ppm)
-50
0
50
100
0 -10 -20 -30 -40 -50
Al-O-Al
Si-O-Al
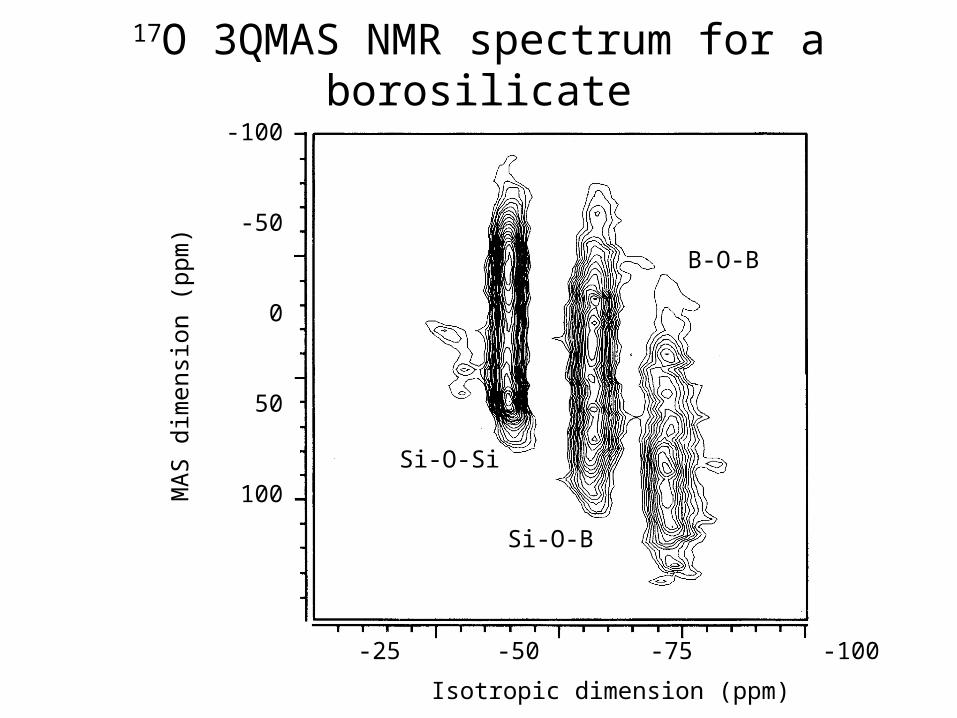
17O 3QMAS NMR spectrum for a borosilicate
Si-O-Si
Si-O-B
B-O-B
MA
S d
imen
sion
(pp
m)
Isotropic dimension (ppm)
-25 -50 -75 -100
-100
-50
0
50
100
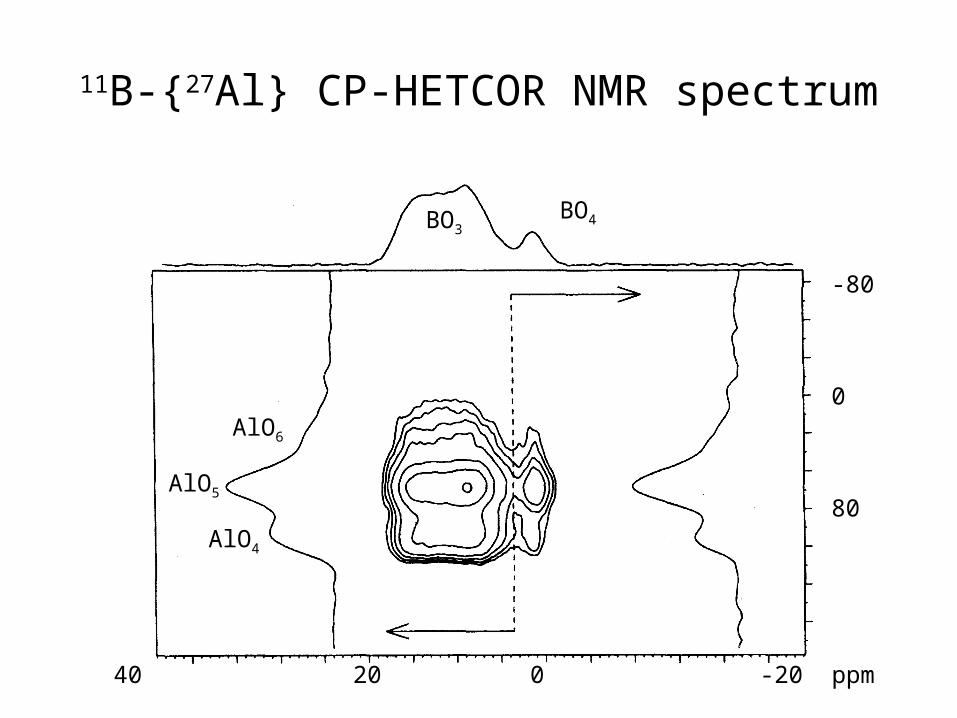
11B-{27Al} CP-HETCOR NMR spectrum
BO4BO3
AlO6
AlO4
AlO5
40 20 0 -20 ppm
-80
0
80
Applications
• Polymers
• Glasses
• Porous materials
• Liquid crystals
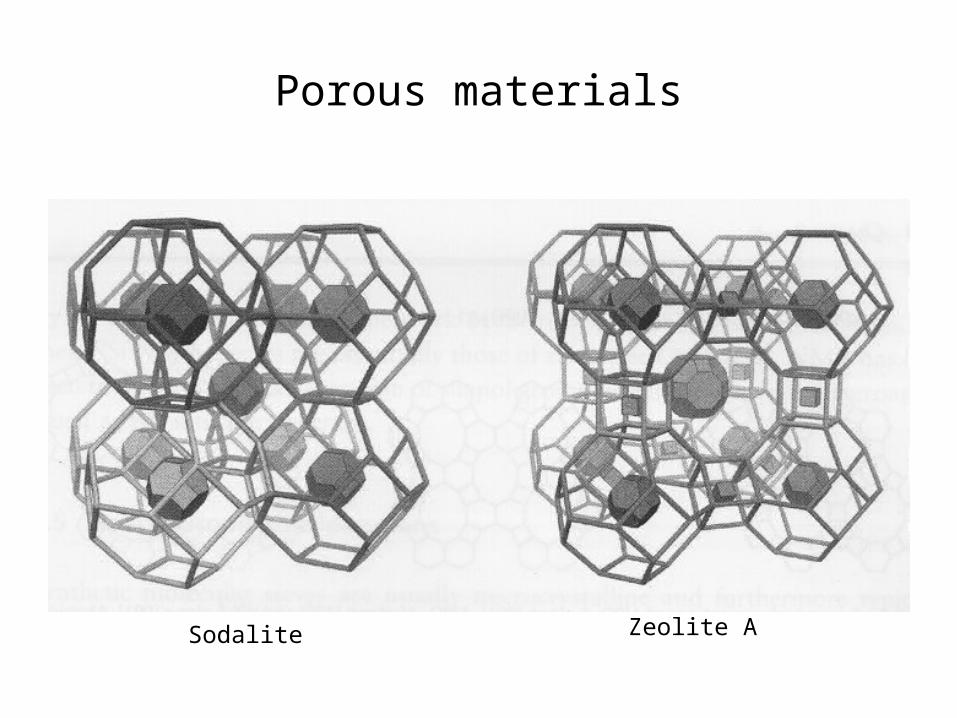
Porous materials
Sodalite Zeolite A
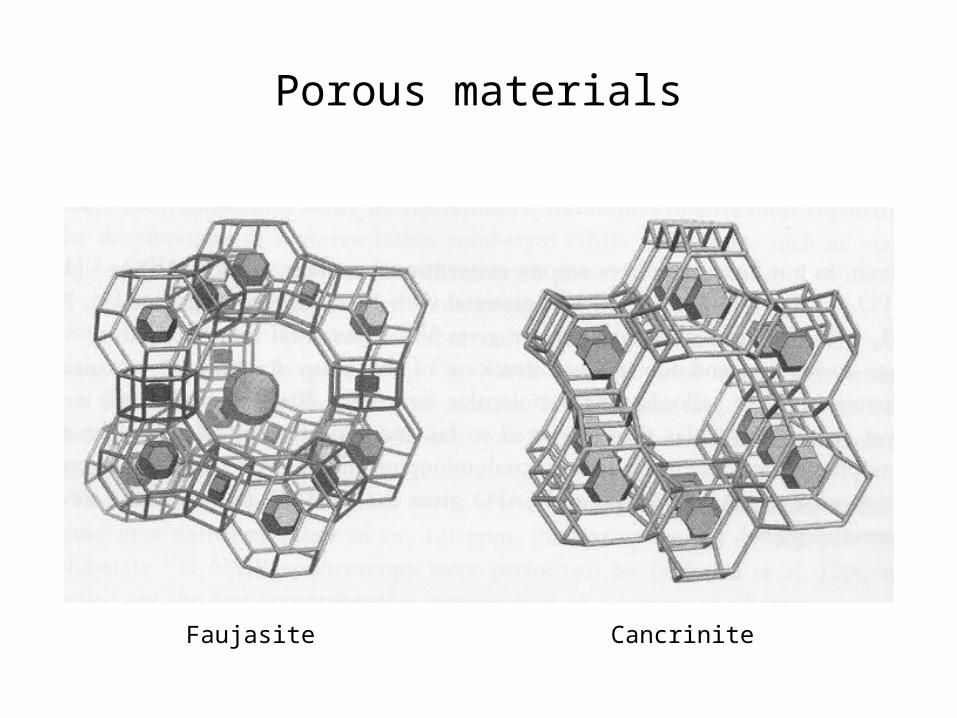
Porous materials
Faujasite Cancrinite
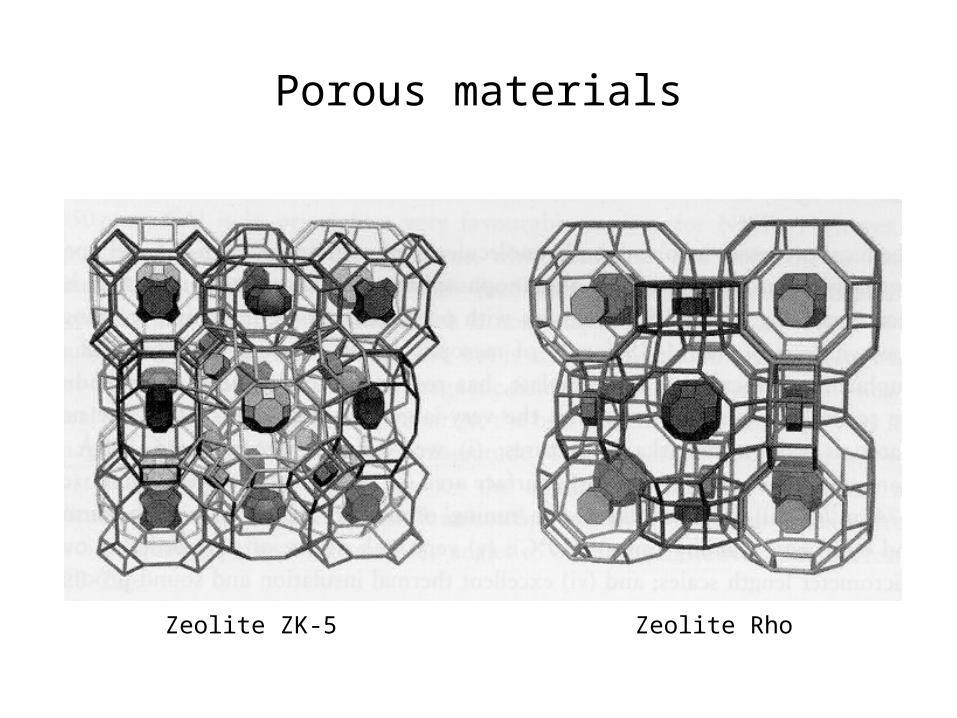
Porous materials
Zeolite ZK-5 Zeolite Rho
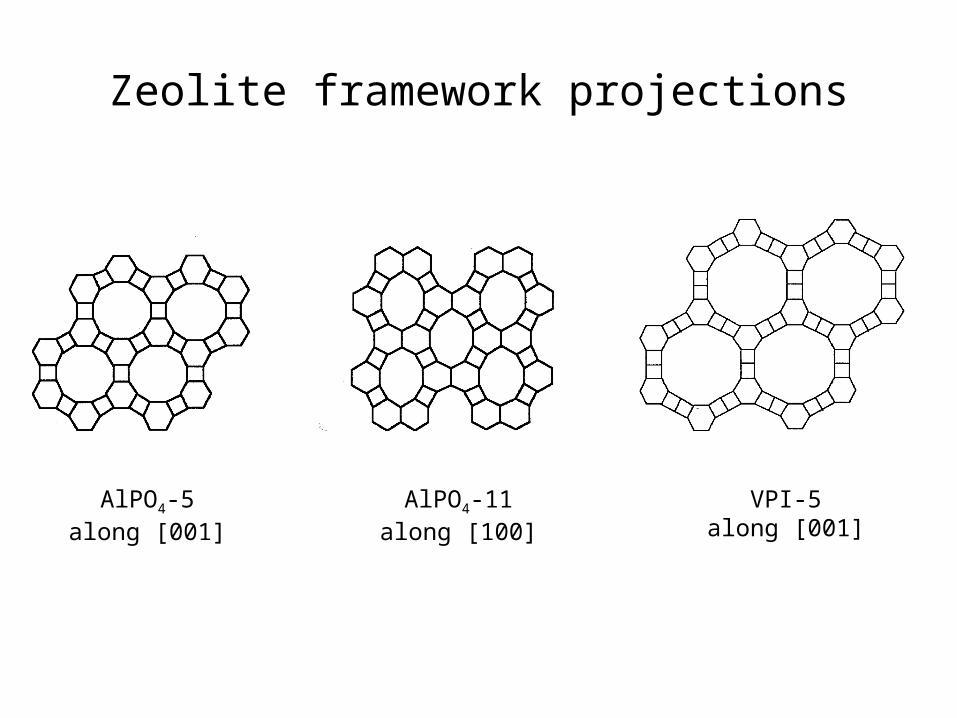
Zeolite framework projections
AlPO4-5along [001]
AlPO4-11along [100]
VPI-5along [001]
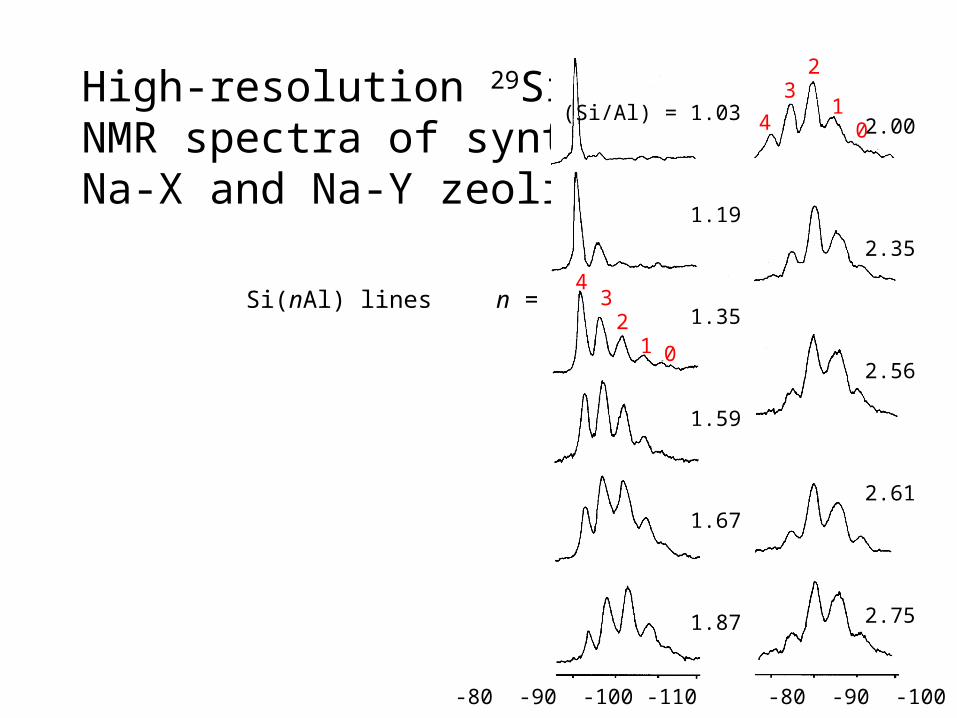
High-resolution 29Si MASNMR spectra of syntheticNa-X and Na-Y zeolites
-80 -90 -100 -110 -80 -90 -100 -110
(Si/Al) = 1.03
1.19
1.35
1.59
1.67
1.87
2.00
2.35
2.56
2.61
2.75
43
21 0
4
32
10
n =Si(nAl) lines
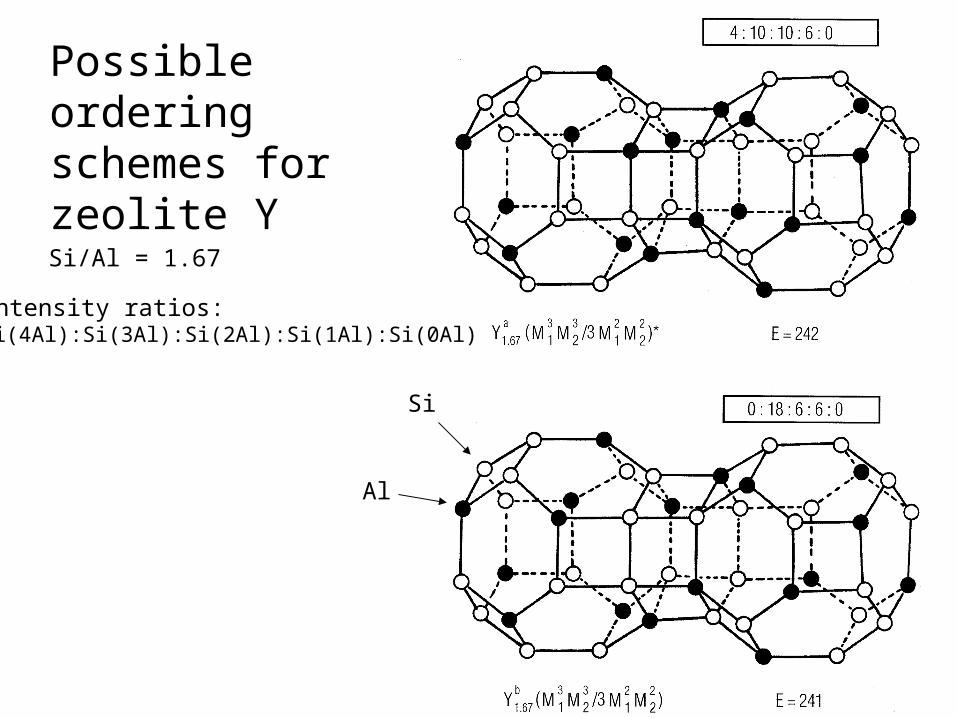
Possible ordering schemes for zeolite Y
Si/Al = 1.67
Si
Al
Intensity ratios:Si(4Al):Si(3Al):Si(2Al):Si(1Al):Si(0Al)
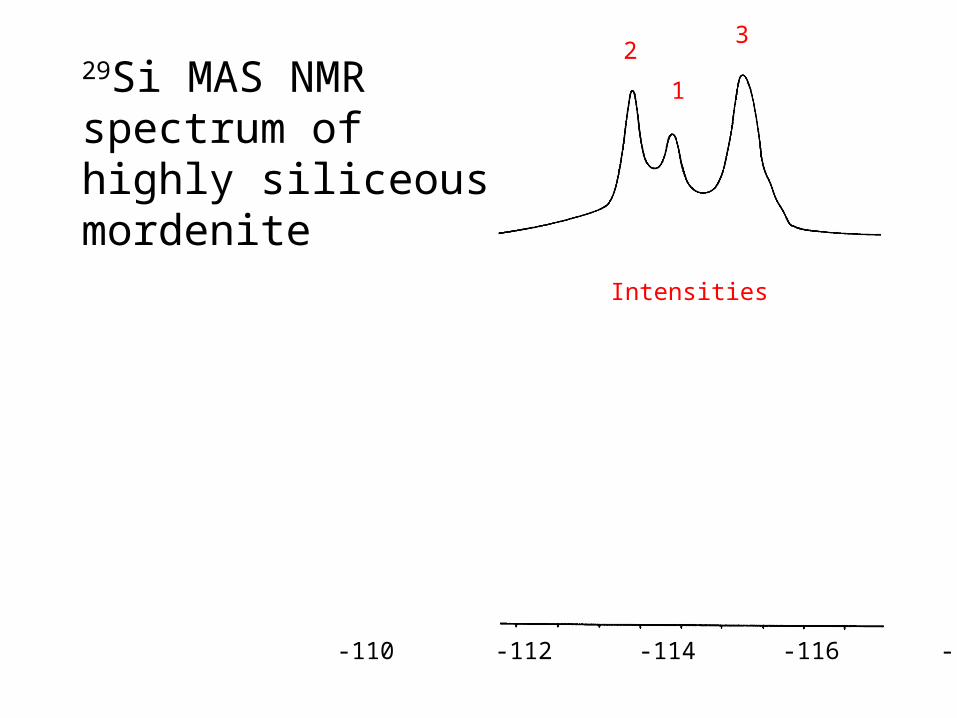
29Si MAS NMR spectrum of highly siliceous mordenite
-110 -112 -114 -116 -118 ppm
2
1
3
Intensities
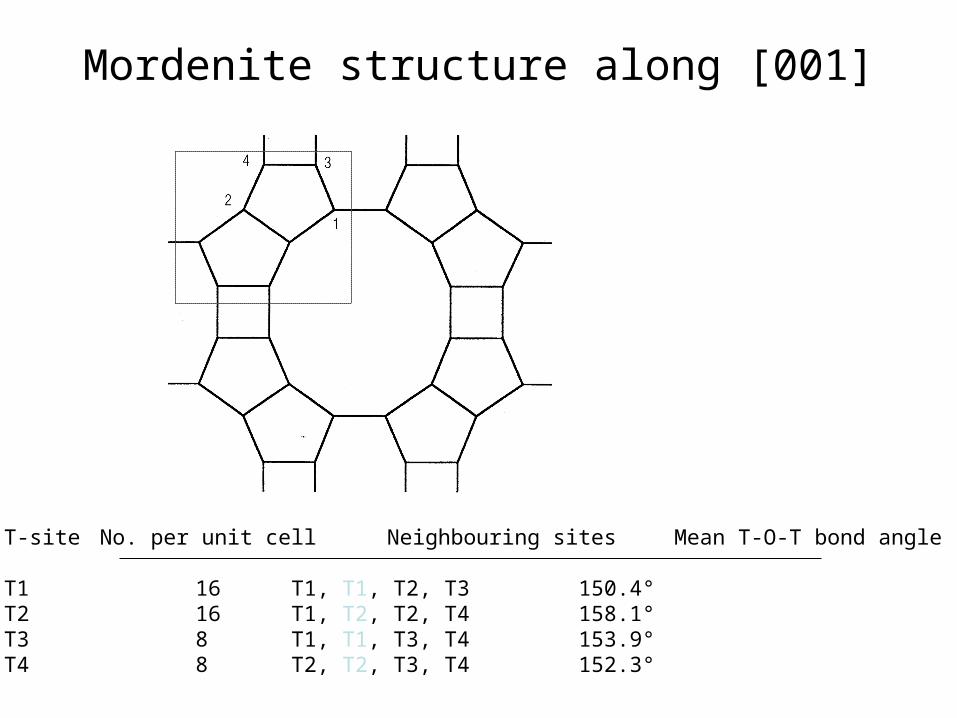
Mordenite structure along [001]
T-site No. per unit cell Neighbouring sites Mean T-O-T bond angle
T1 16 T1, T1, T2, T3 150.4°T2 16 T1, T2, T2, T4 158.1°T3 8 T1, T1, T3, T4 153.9°T4 8 T2, T2, T3, T4 152.3°
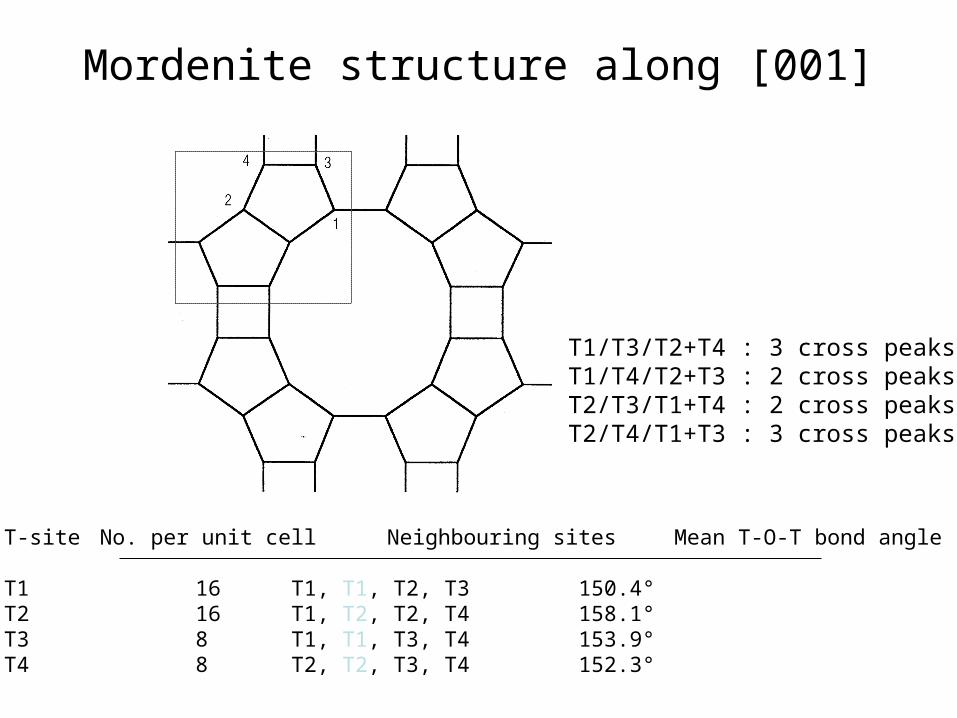
Mordenite structure along [001]
T-site No. per unit cell Neighbouring sites Mean T-O-T bond angle
T1 16 T1, T1, T2, T3 150.4°T2 16 T1, T2, T2, T4 158.1°T3 8 T1, T1, T3, T4 153.9°T4 8 T2, T2, T3, T4 152.3°
T1/T3/T2+T4 : 3 cross peaksT1/T4/T2+T3 : 2 cross peaksT2/T3/T1+T4 : 2 cross peaksT2/T4/T1+T3 : 3 cross peaks
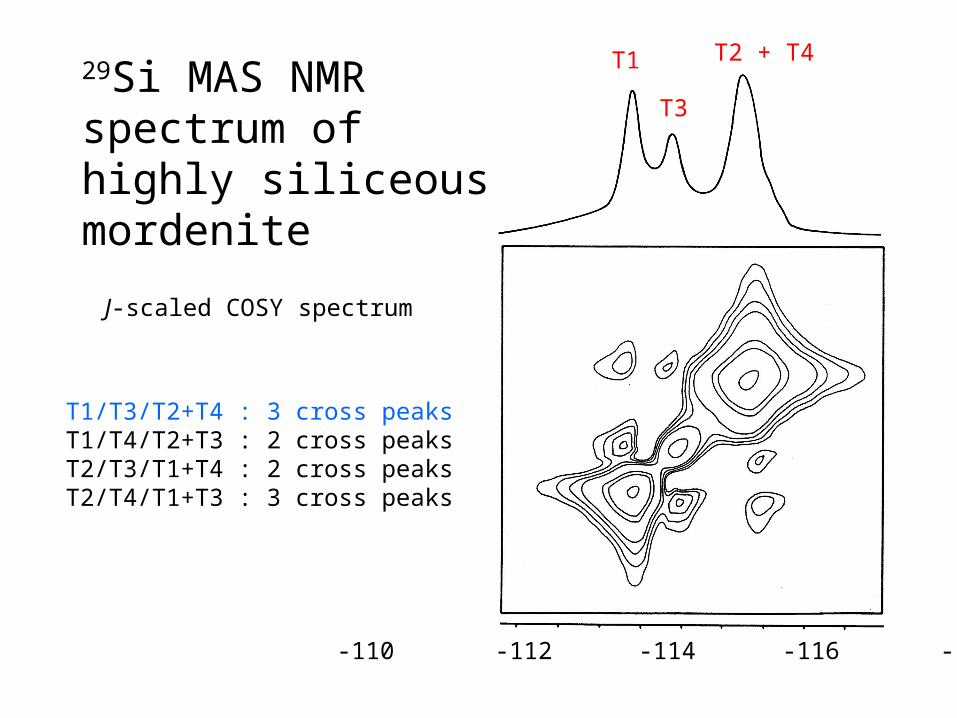
29Si MAS NMR spectrum of highly siliceous mordenite
J-scaled COSY spectrum
-110 -112 -114 -116 -118 ppm
T1
T3
T2 + T4
T1/T3/T2+T4 : 3 cross peaksT1/T4/T2+T3 : 2 cross peaksT2/T3/T1+T4 : 2 cross peaksT2/T4/T1+T3 : 3 cross peaks
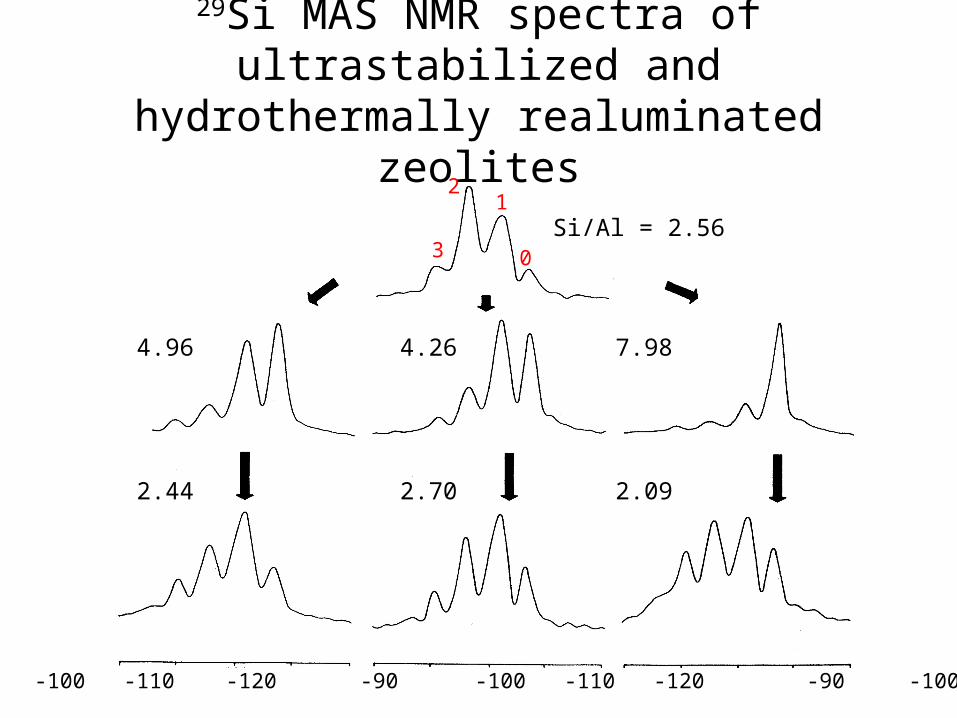
29Si MAS NMR spectra of ultrastabilized and hydrothermally realuminated zeolites
3
21
0Si/Al = 2.56
4.96 4.26 7.98
2.44 2.70 2.09
-80 -90 -100 -110 -120 -90 -100 -110 -120 -90 -100 -110 ppm
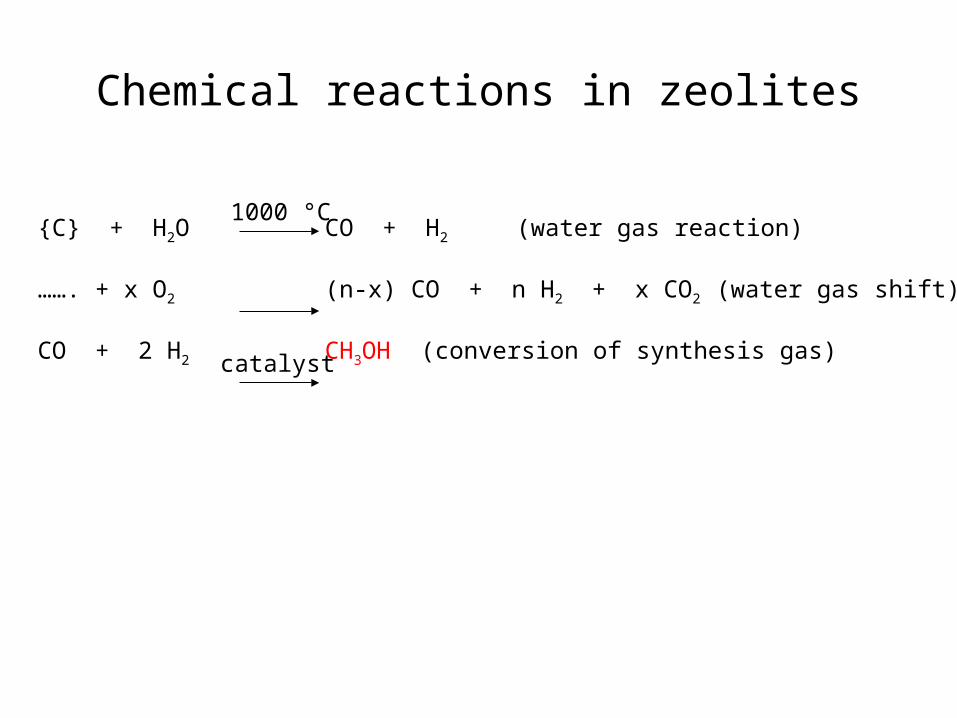
Chemical reactions in zeolites
{C} + H2O CO + H2 (water gas reaction)1000 °C
Chemical reactions in zeolites
{C} + H2O CO + H2 (water gas reaction)
……. + x O2 (n-x) CO + n H2 + x CO2 (water gas shift)
1000 °C
Chemical reactions in zeolites
{C} + H2O CO + H2 (water gas reaction)
……. + x O2 (n-x) CO + n H2 + x CO2 (water gas shift)
CO + 2 H2 CH3OH (conversion of synthesis gas)
1000 °C
catalyst
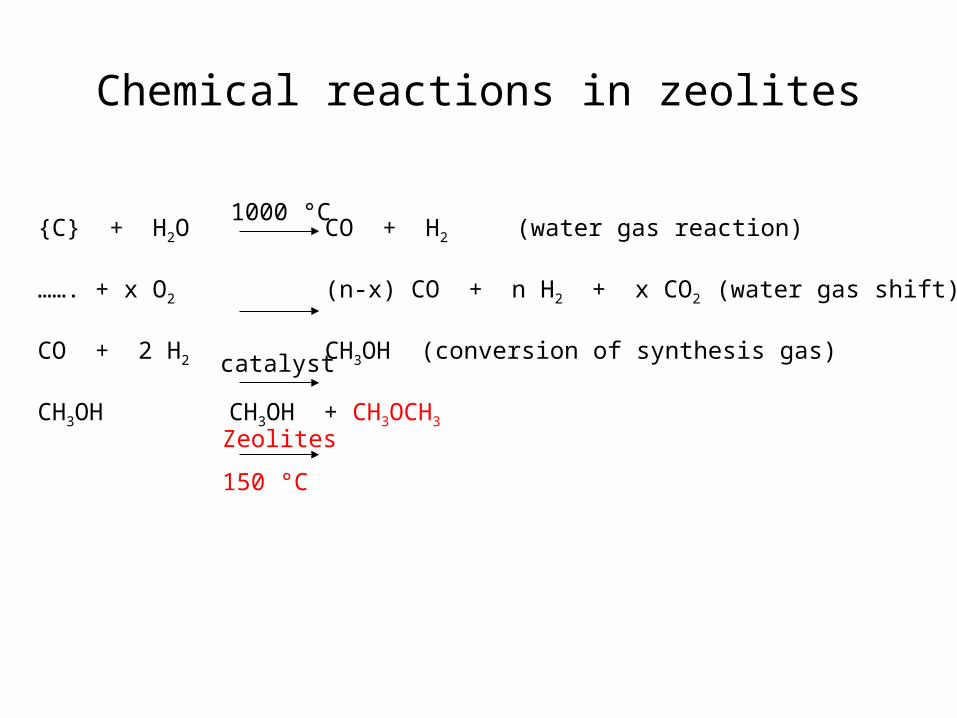
Chemical reactions in zeolites
{C} + H2O CO + H2 (water gas reaction)
……. + x O2 (n-x) CO + n H2 + x CO2 (water gas shift)
CO + 2 H2 CH3OH (conversion of synthesis gas)
CH3OH CH3OH + CH3OCH3
1000 °C
catalyst
Zeolites
150 °C
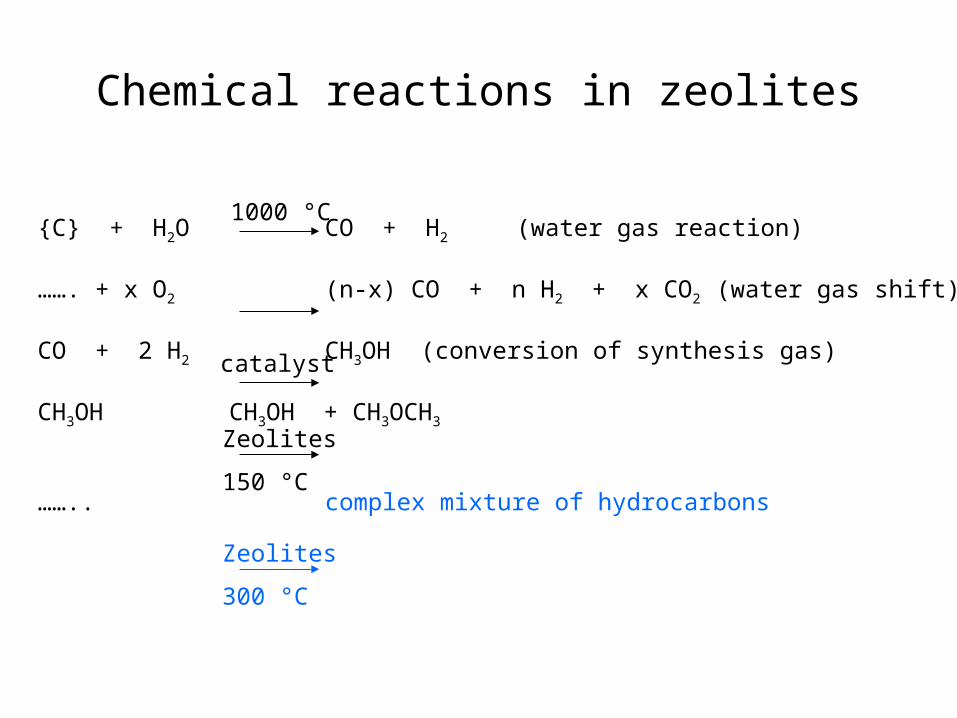
Chemical reactions in zeolites
{C} + H2O CO + H2 (water gas reaction)
……. + x O2 (n-x) CO + n H2 + x CO2 (water gas shift)
CO + 2 H2 CH3OH (conversion of synthesis gas)
CH3OH CH3OH + CH3OCH3
…….. complex mixture of hydrocarbons
1000 °C
catalyst
Zeolites
150 °C
Zeolites
300 °C

Chemical reactions in zeolites
{C} + H2O CO + H2 (water gas reaction)
……. + x O2 (n-x) CO + n H2 + x CO2 (water gas shift)
CO + 2 H2 CH3OH (conversion of synthesis gas)
CH3OH CH3OH + CH3OCH3
…….. complex mixture of hydrocarbons
1000 °C
catalyst
Zeolites
150 °C
Zeolites
300 °C
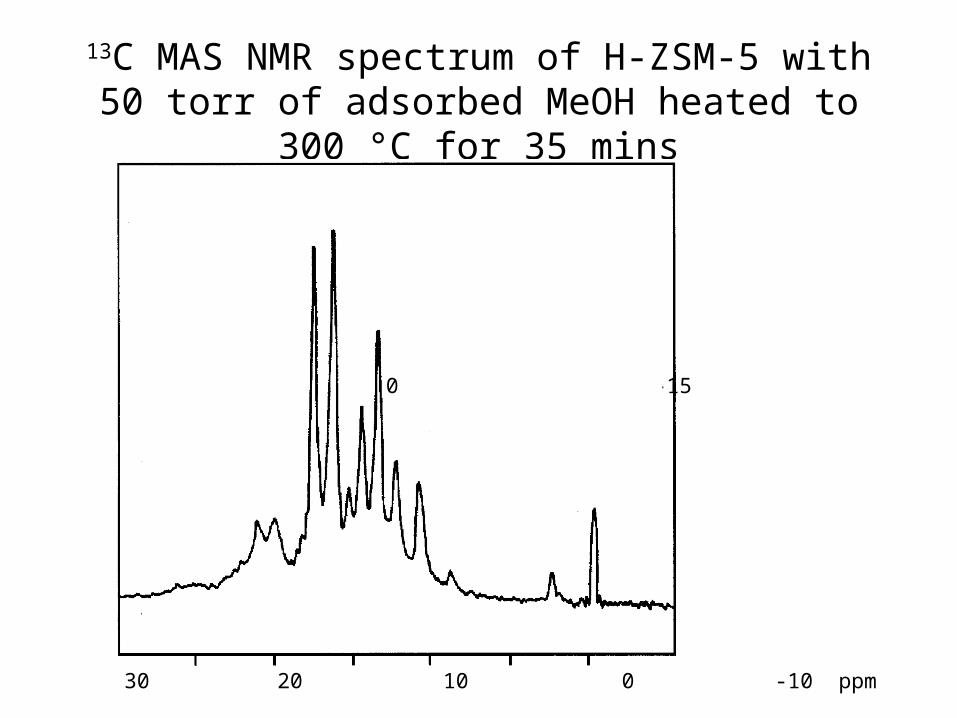
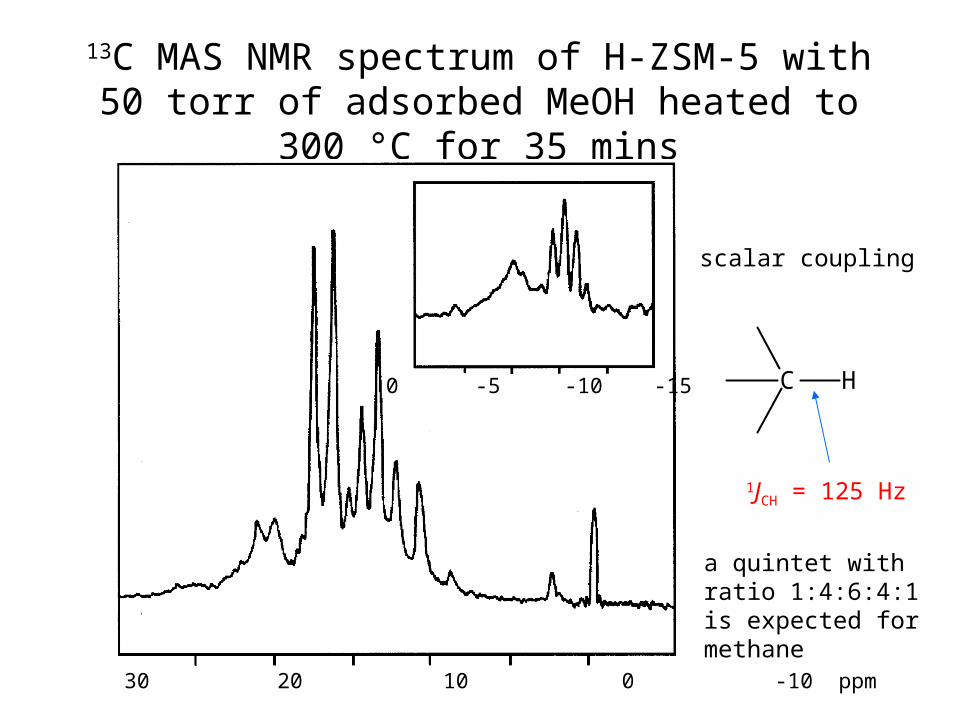
13C MAS NMR spectrum of H-ZSM-5 with 50 torr of adsorbed MeOH heated to 300 °C for 35
mins
40 30 20 10 0 -10 ppm
0 -5 -10 -15
13C MAS NMR spectrum of H-ZSM-5 with 50 torr of adsorbed MeOH heated to 300 °C for 35
mins
40 30 20 10 0 -10 ppm
0 -5 -10 -15 C H
scalar coupling
1JCH = 125 Hz
a quintet with ratio 1:4:6:4:1 is expected for methane
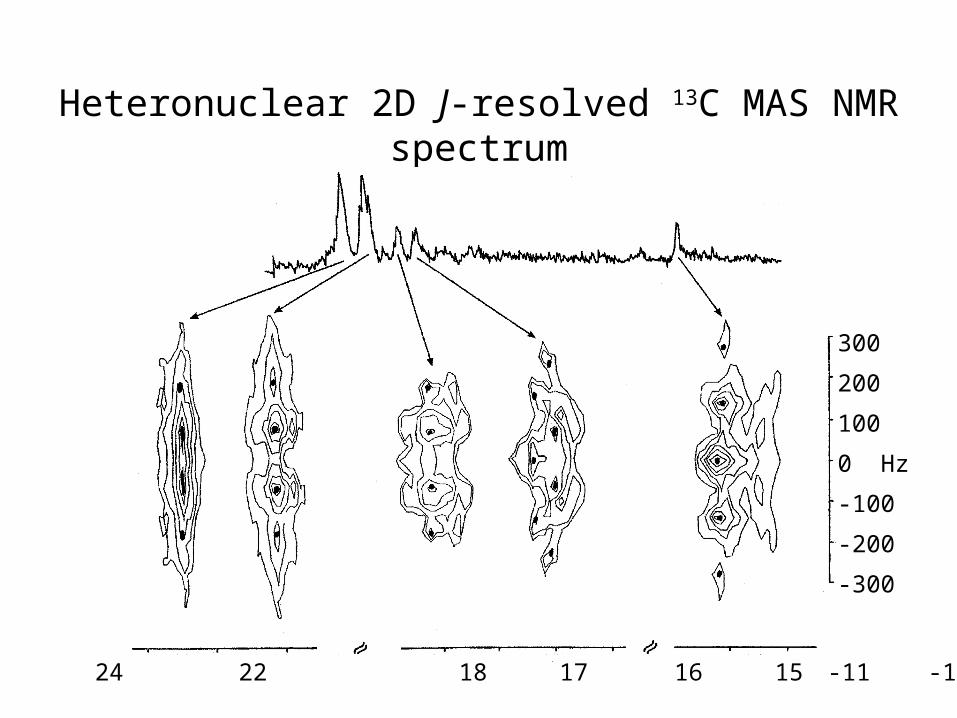
Heteronuclear 2D J-resolved 13C MAS NMR spectrum
26 24 22 18 17 16 15 -11 -12 ppm
300
200
100
0 Hz
-100
-200
-300
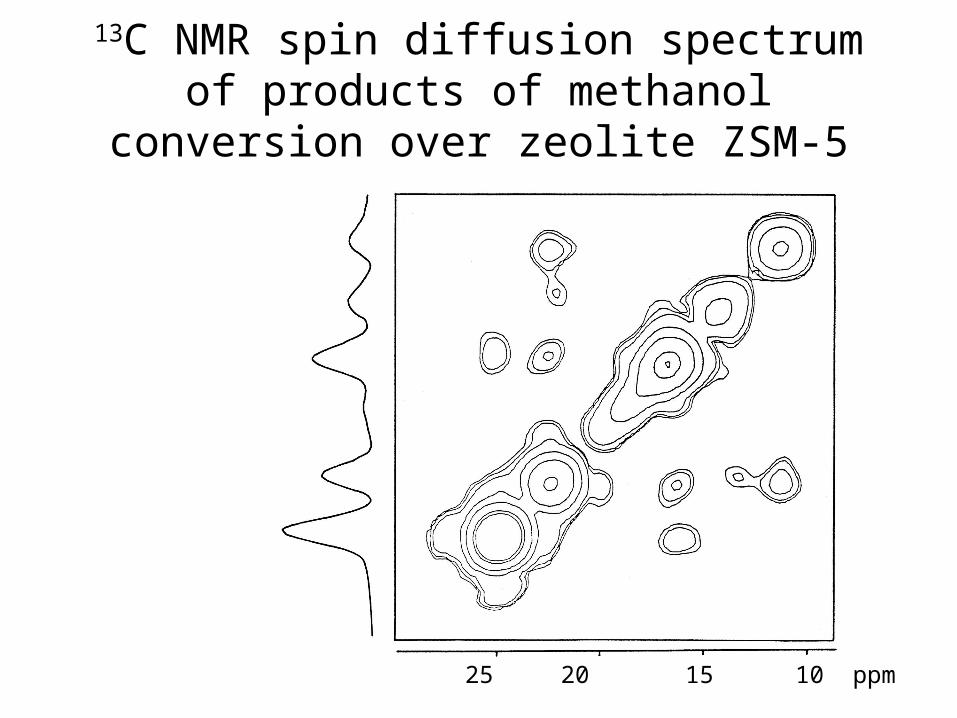
13C NMR spin diffusion spectrum of products of methanol conversion over zeolite ZSM-5
25 20 15 10 ppm
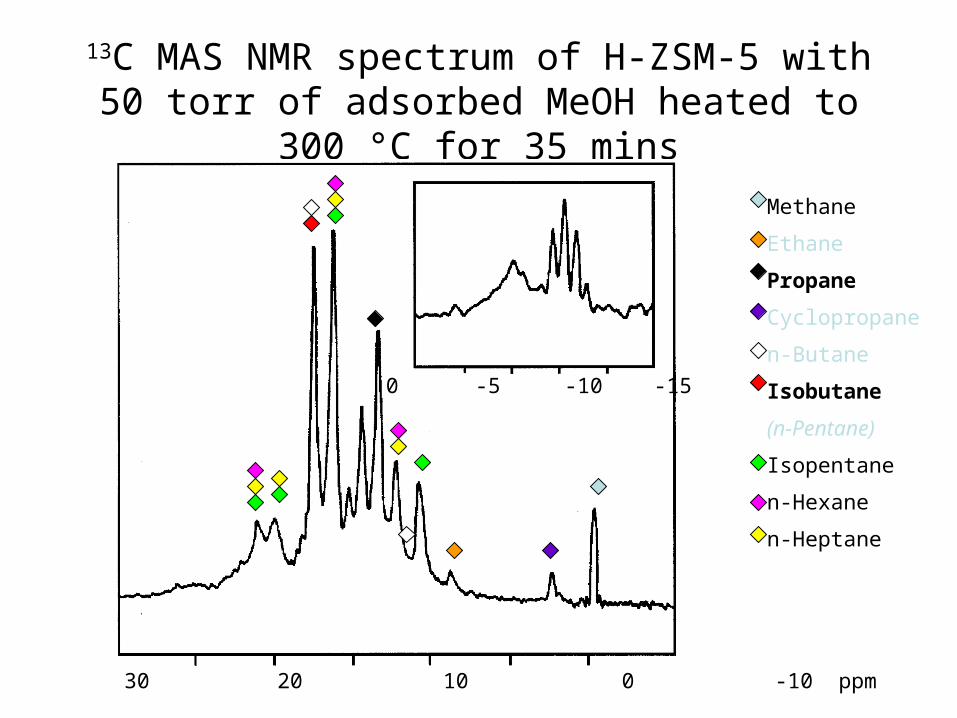
13C MAS NMR spectrum of H-ZSM-5 with 50 torr of adsorbed MeOH heated to 300 °C for 35
mins
40 30 20 10 0 -10 ppm
0 -5 -10 -15
Methane
Ethane
Propane
Cyclopropane
n-Butane
Isobutane
(n-Pentane)
Isopentane
n-Hexane
n-Heptane
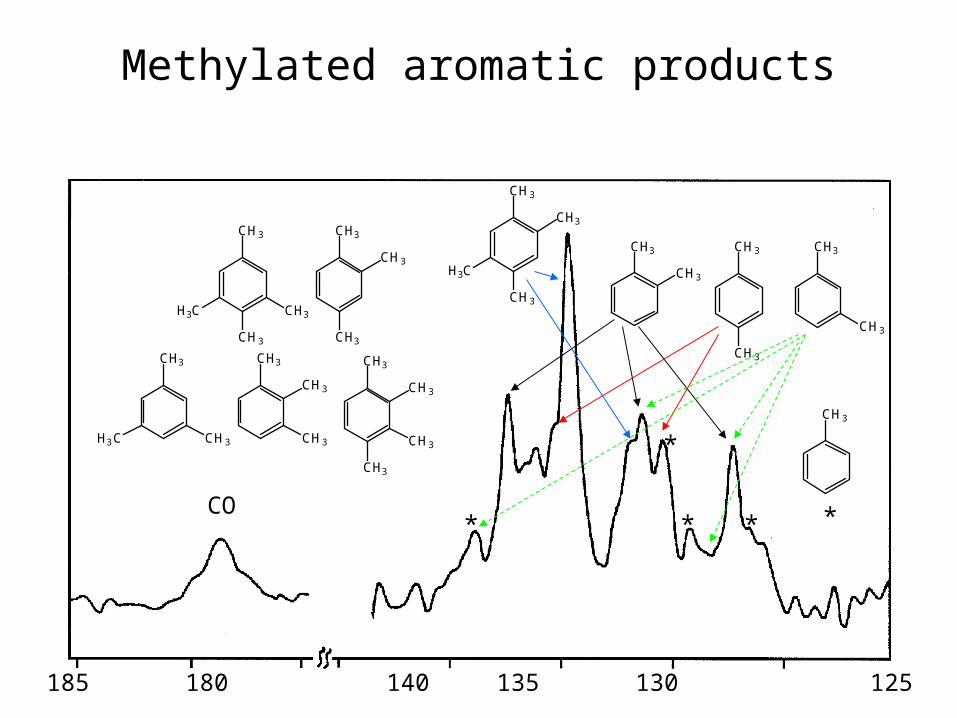
Methylated aromatic products
190 185 180 140 135 130 125 ppm
CO
CH3
CH3
CH3
CH3
CH3
CH3
CH3
CH3
CH3
H3C
CH3CH3
CH3
CH3
CH3
CH3
H3C CH3
CH3
CH3H3C
CH3
CH3
CH3
CH3
CH3
CH3
CH3
*
* * * *
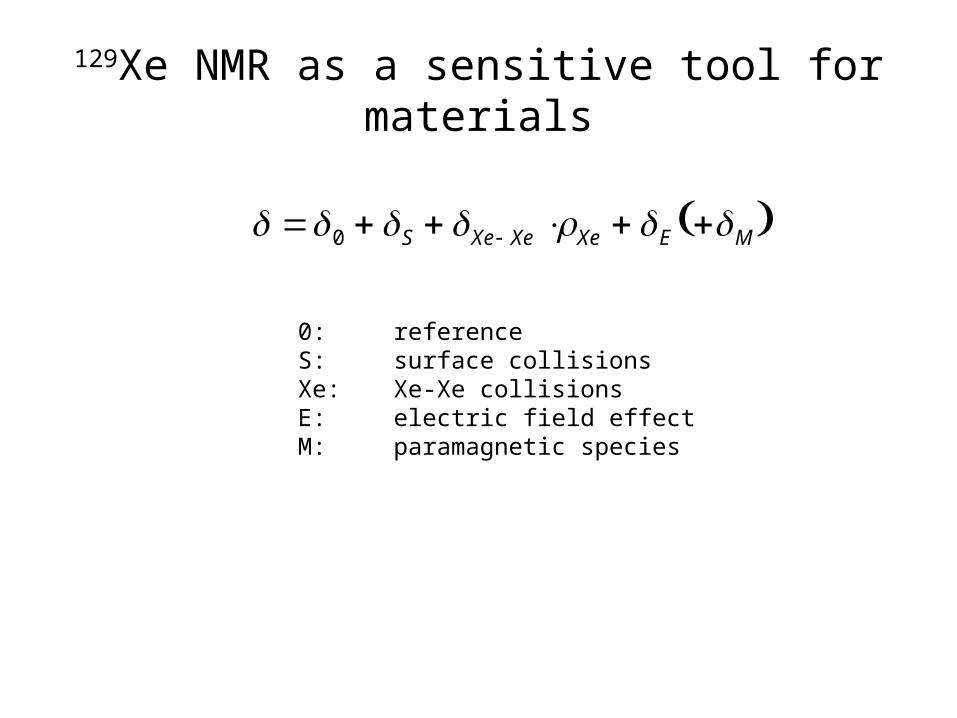
129Xe NMR as a sensitive tool for materials
0 S Xe Xe Xe E M
0: referenceS: surface collisionsXe: Xe-Xe collisionsE: electric field effectM: paramagnetic species
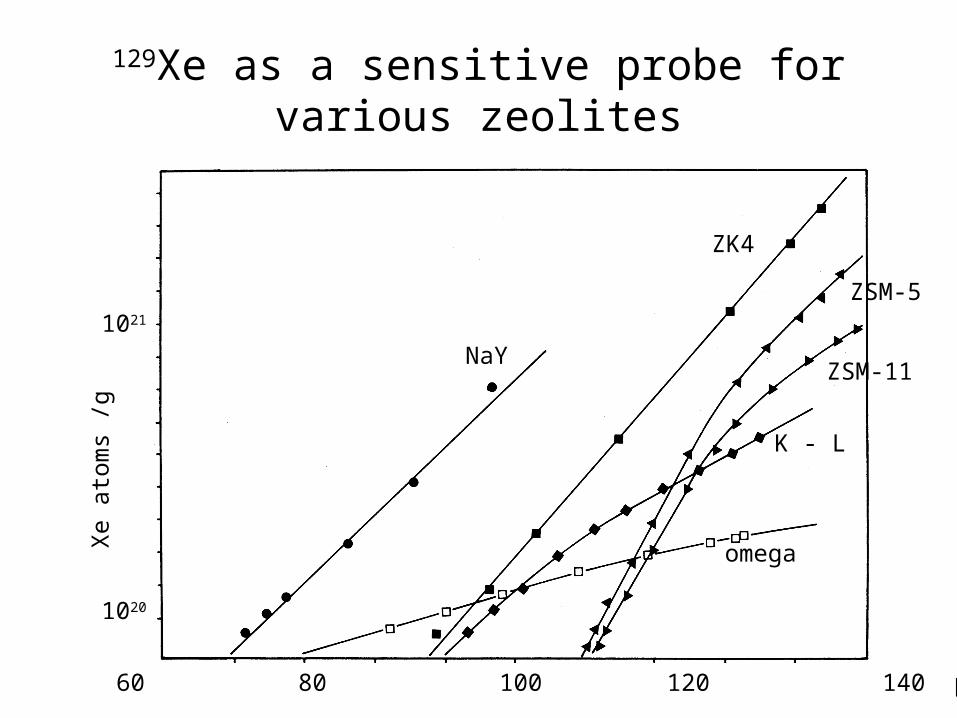
129Xe as a sensitive probe for various zeolites
Xe
atom
s /g
1020
1021
60 80 100 120 140 ppm
omega
NaY
ZK4
K - L
ZSM-11
ZSM-5
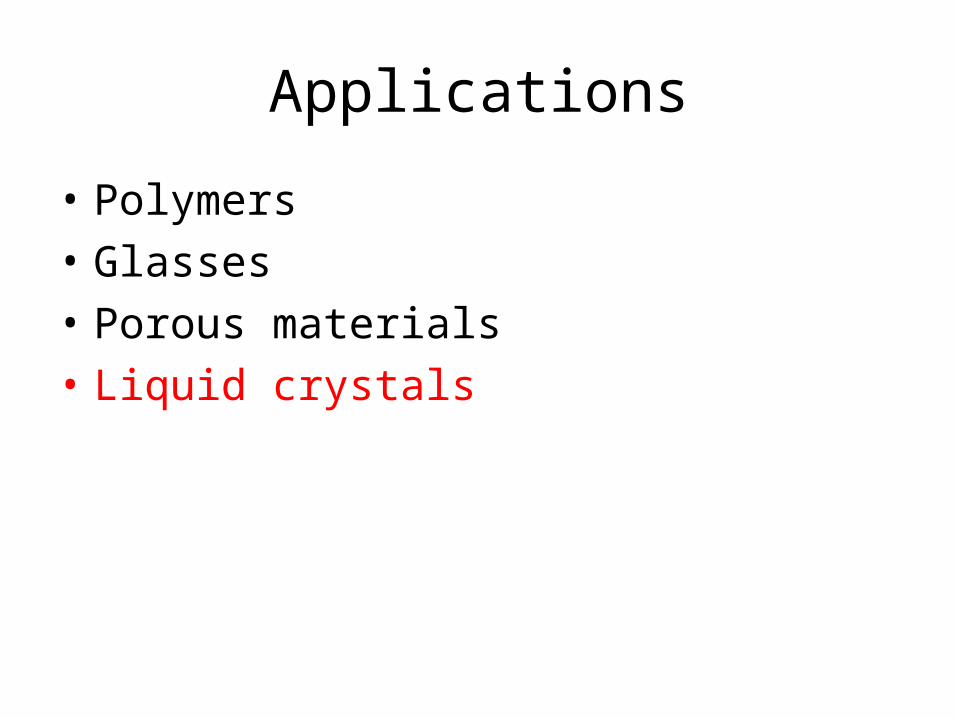
Applications
• Polymers
• Glasses
• Porous materials
• Liquid crystals
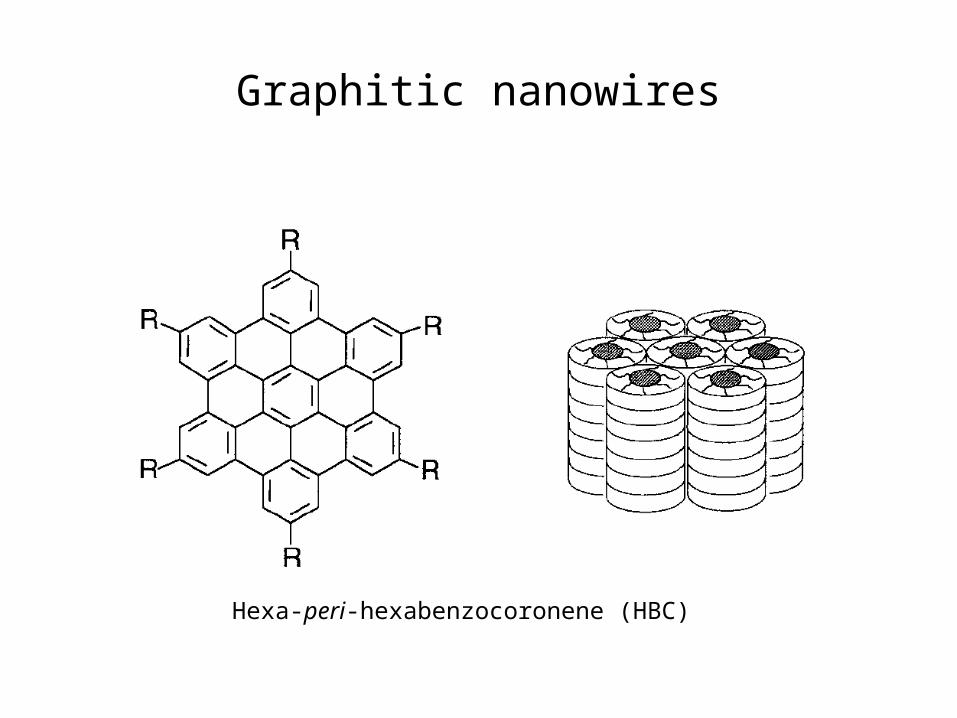
Graphitic nanowires
Hexa-peri-hexabenzocoronene (HBC)
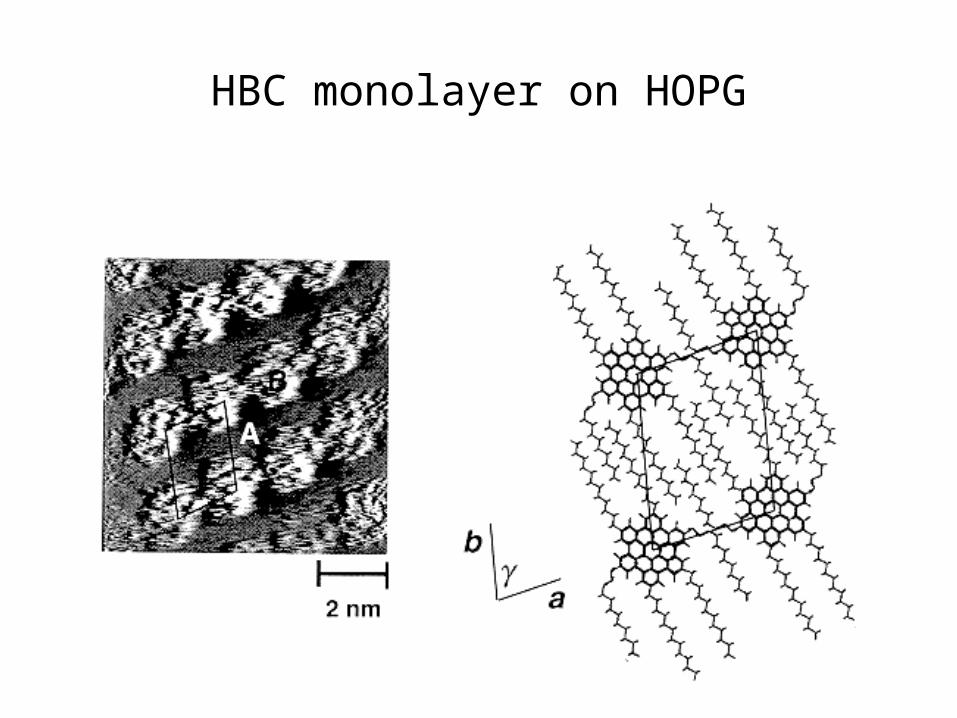
HBC monolayer on HOPG
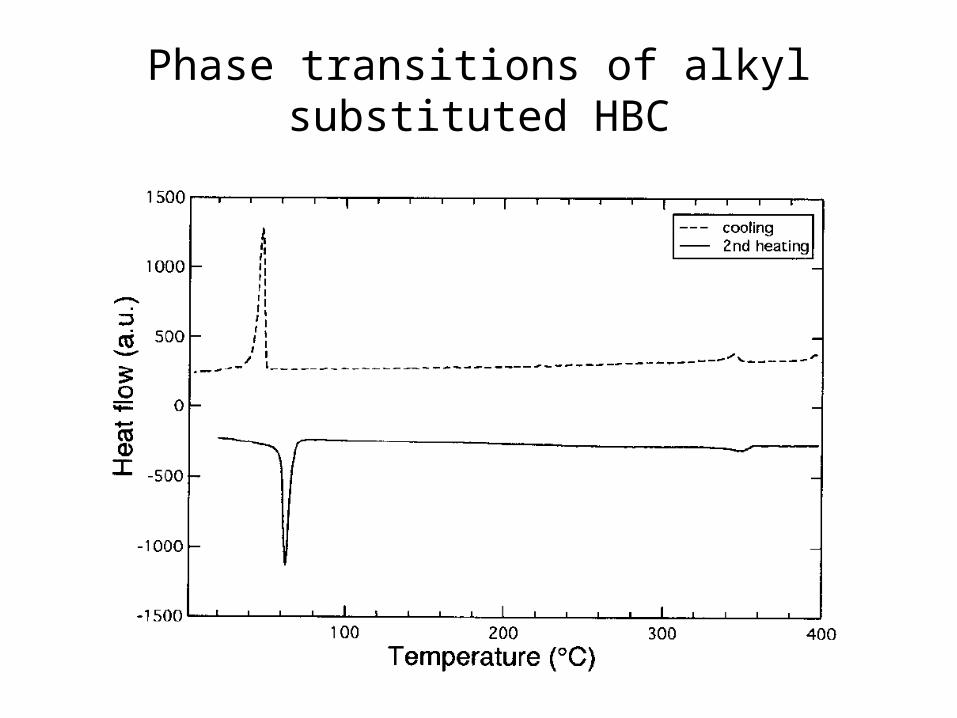
Phase transitions of alkyl substituted HBC
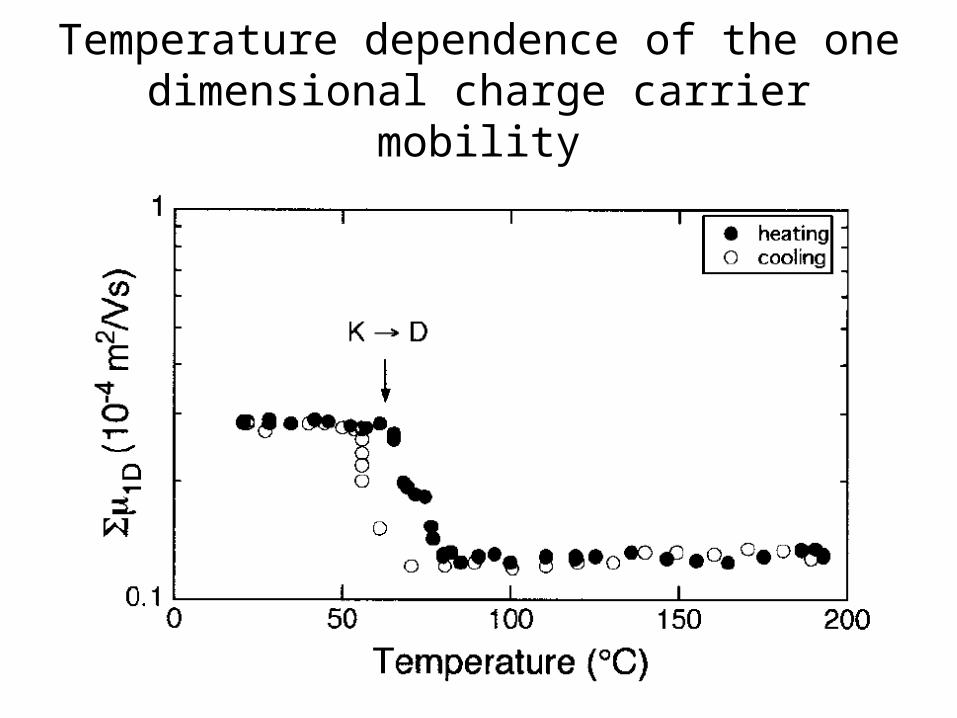
Temperature dependence of the one dimensional charge carrier mobility
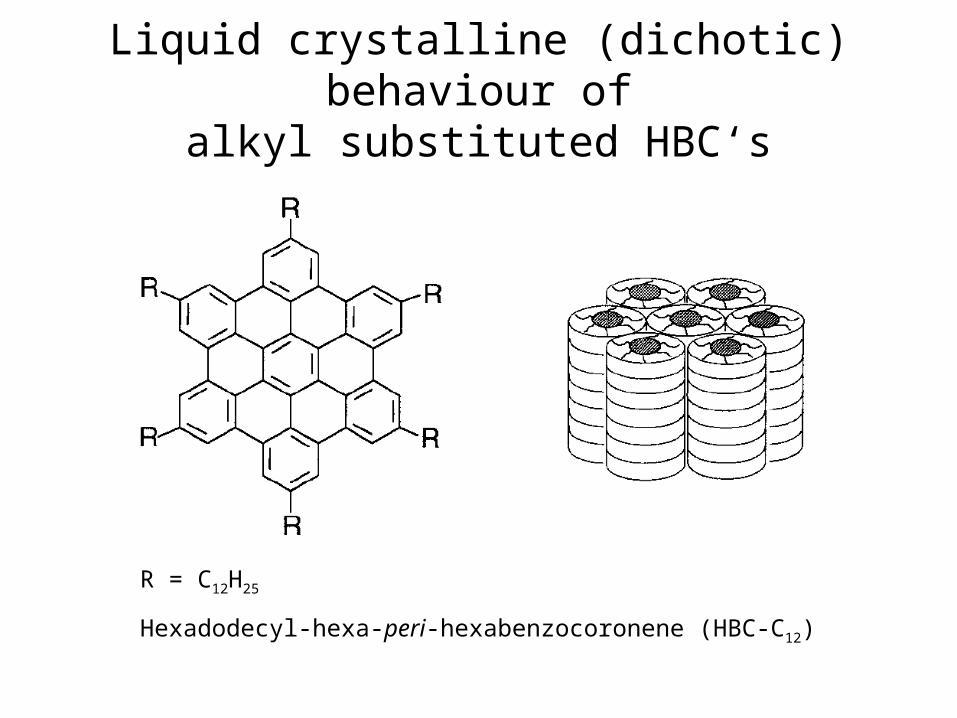
Liquid crystalline (dichotic) behaviour ofalkyl substituted HBC‘s
R = C12H25
Hexadodecyl-hexa-peri-hexabenzocoronene (HBC-C12)
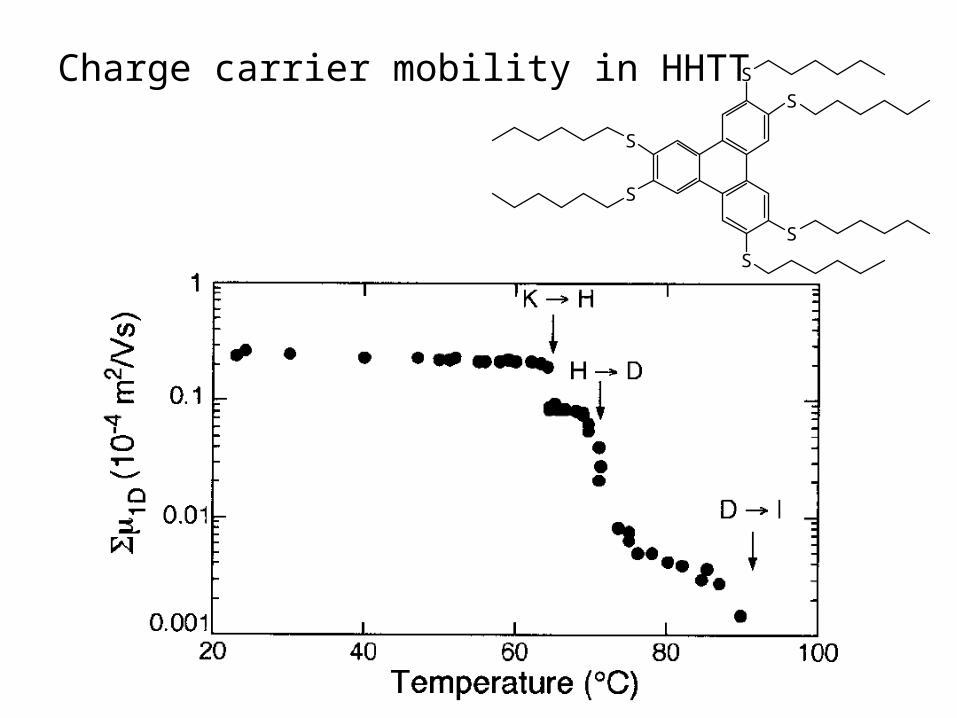
Charge carrier mobility in HHTT S
S
S
S
S
S
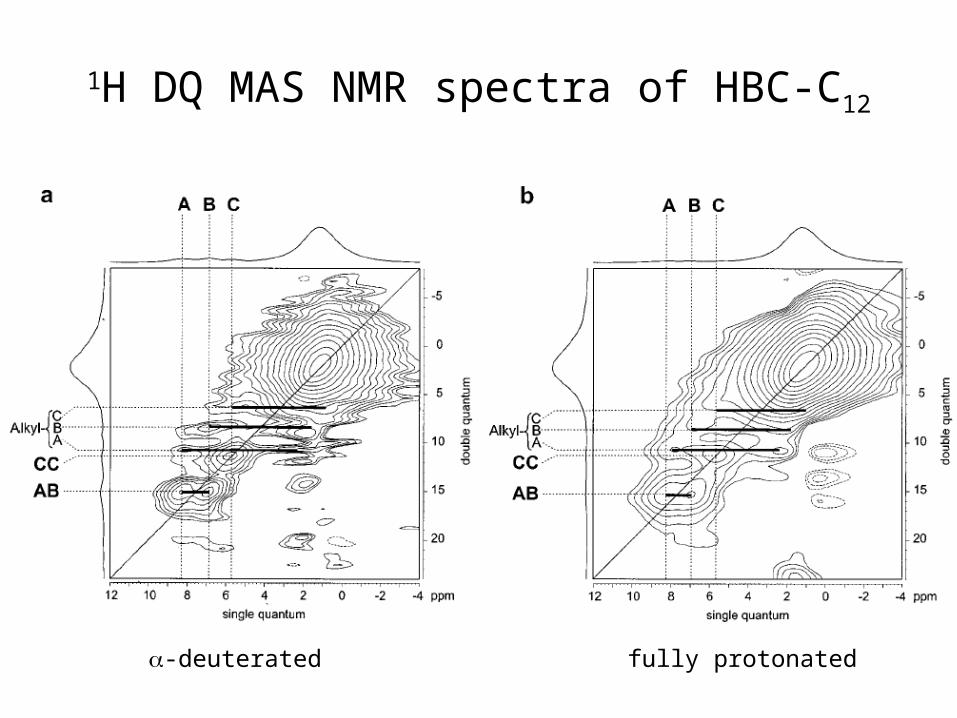
1H DQ MAS NMR spectra of HBC-C12
-deuterated fully protonated
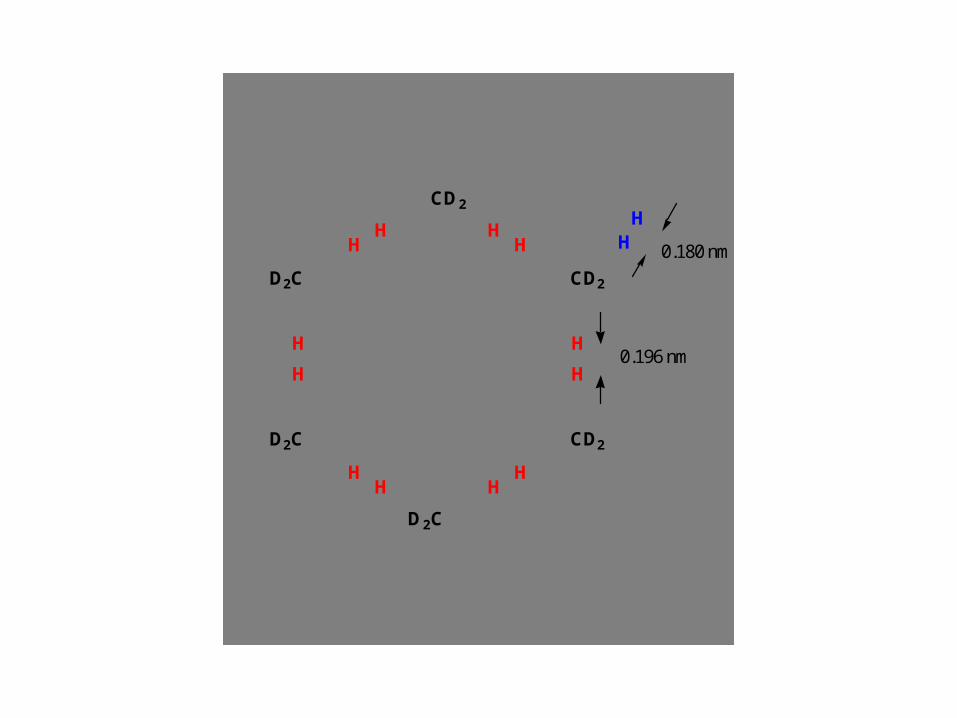
CD2
CD2
CD2
D2C
D2C
D2C
HH H
H
H
H
HH
HH
H
H
HH
0.180 nm
0.196 nm

Proposed stacking model based on solid state NMR
HH H
H
H
H
HHH
H
H
H
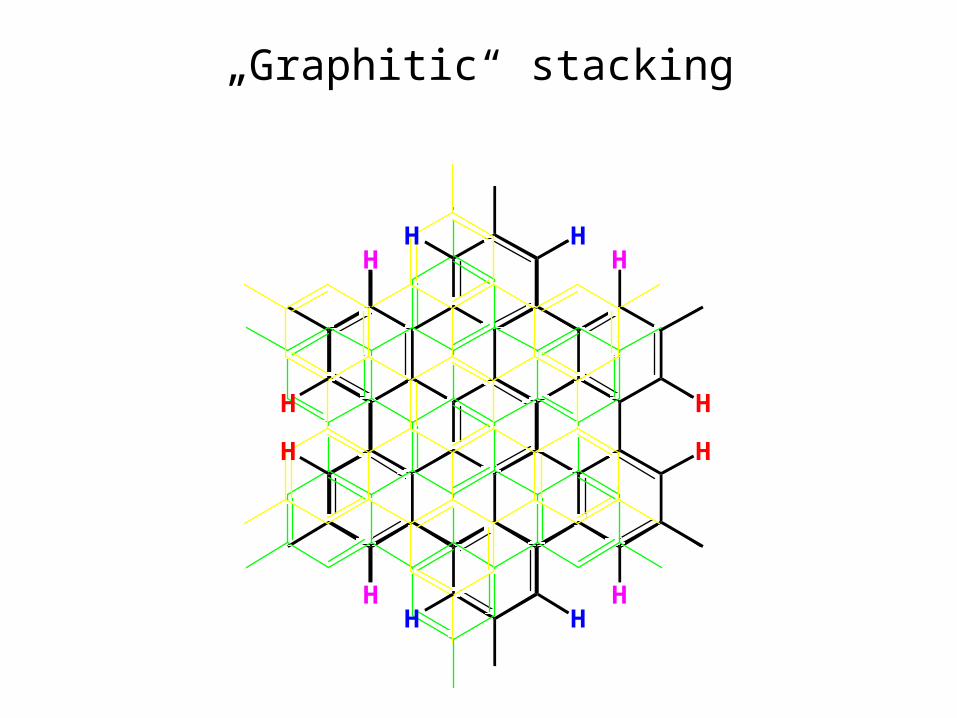
„Graphitic“ stacking
HH H
H
H
H
HHH
H
H
H
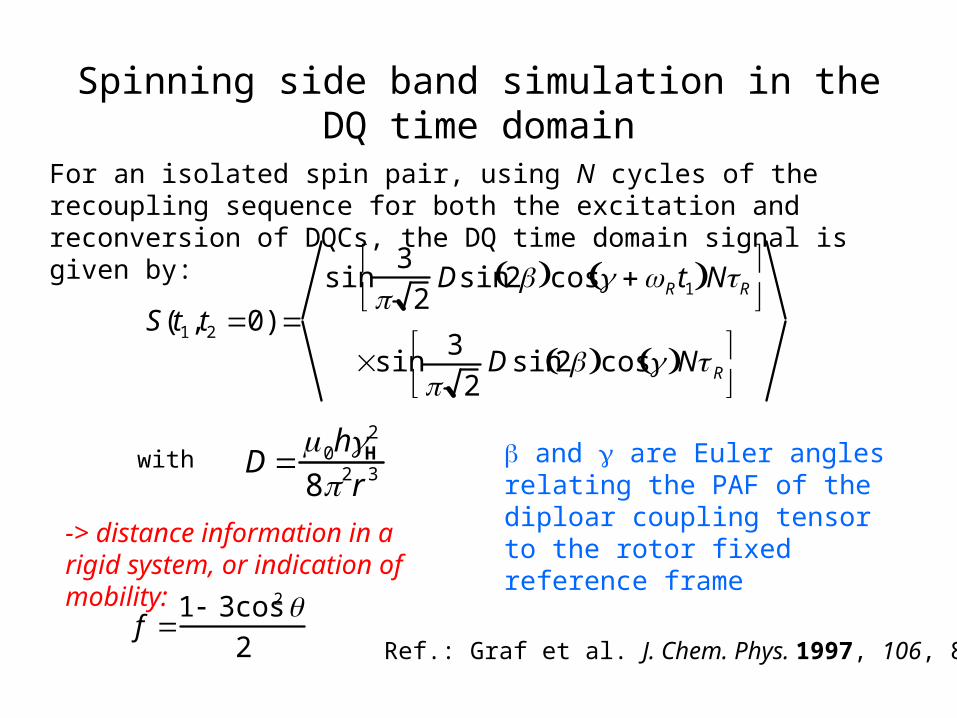
Spinning side band simulation in the DQ time domain
For an isolated spin pair, using N cycles of the recoupling sequence for both the excitation and reconversion of DQCs, the DQ time domain signal is given by:
S(t1, t2 0) sin
3
2Dsin 2 cos Rt1 NR
sin3
2Dsin 2 cos N R
D 0hH
2
82r 3with
Ref.: Graf et al. J. Chem. Phys. 1997, 106, 885
and are Euler angles relating the PAF of the diploar coupling tensor to the rotor fixed reference frame
-> distance information in a rigid system, or indication of mobility:
f 1 3cos2
2
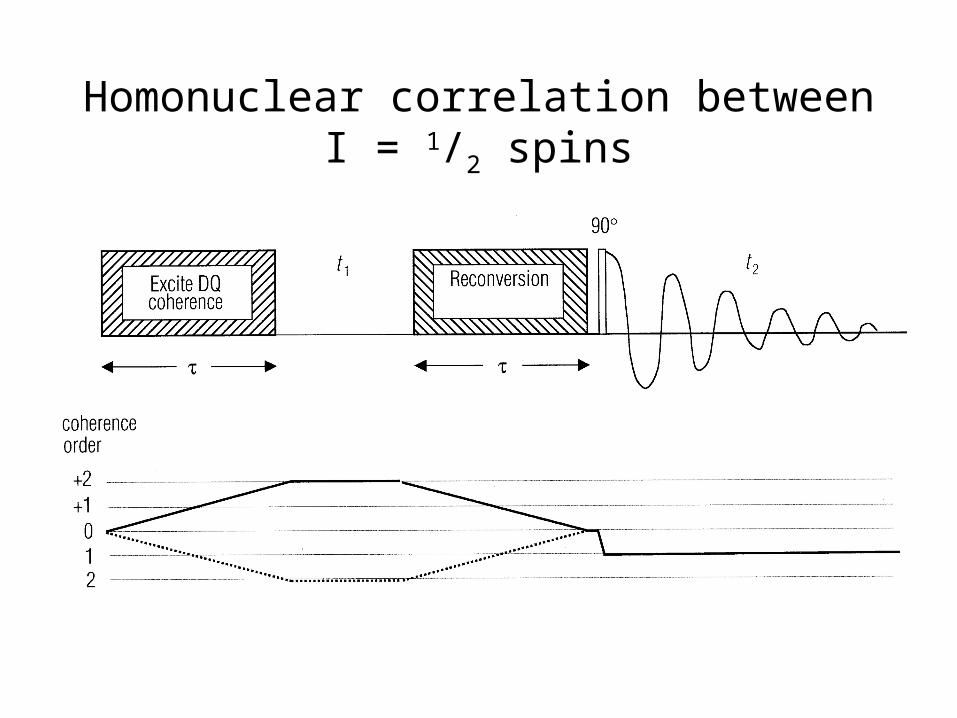
Homonuclear correlation between I = 1/2 spins
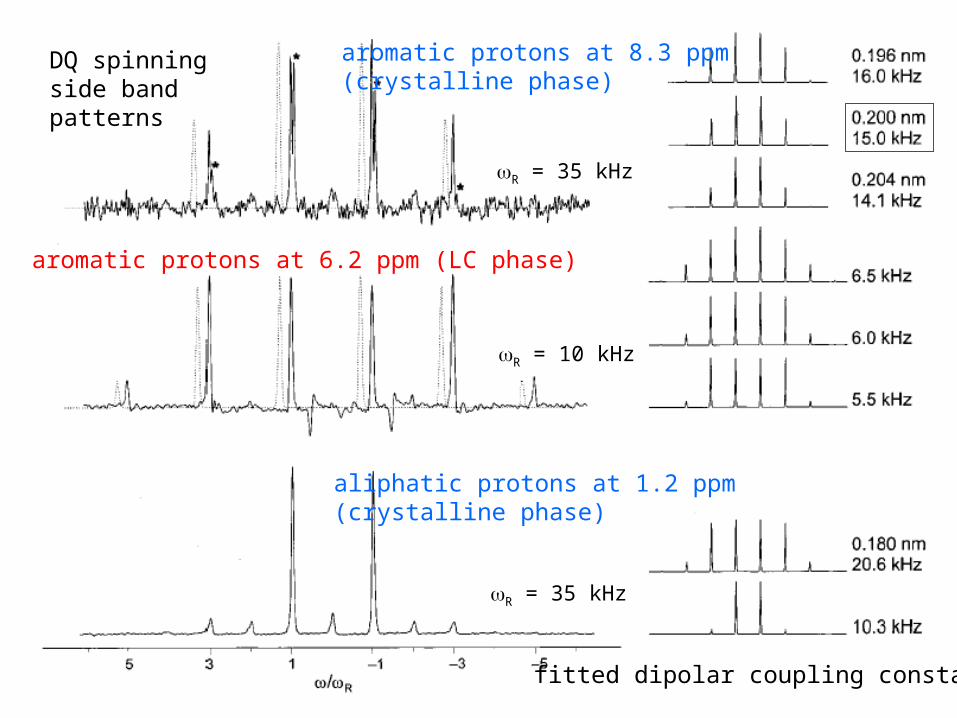
aromatic protons at 8.3 ppm(crystalline phase)
aromatic protons at 6.2 ppm (LC phase)
aliphatic protons at 1.2 ppm(crystalline phase)
fitted dipolar coupling constants
DQ spinning side band patterns
R = 35 kHz
R = 10 kHz
R = 35 kHz
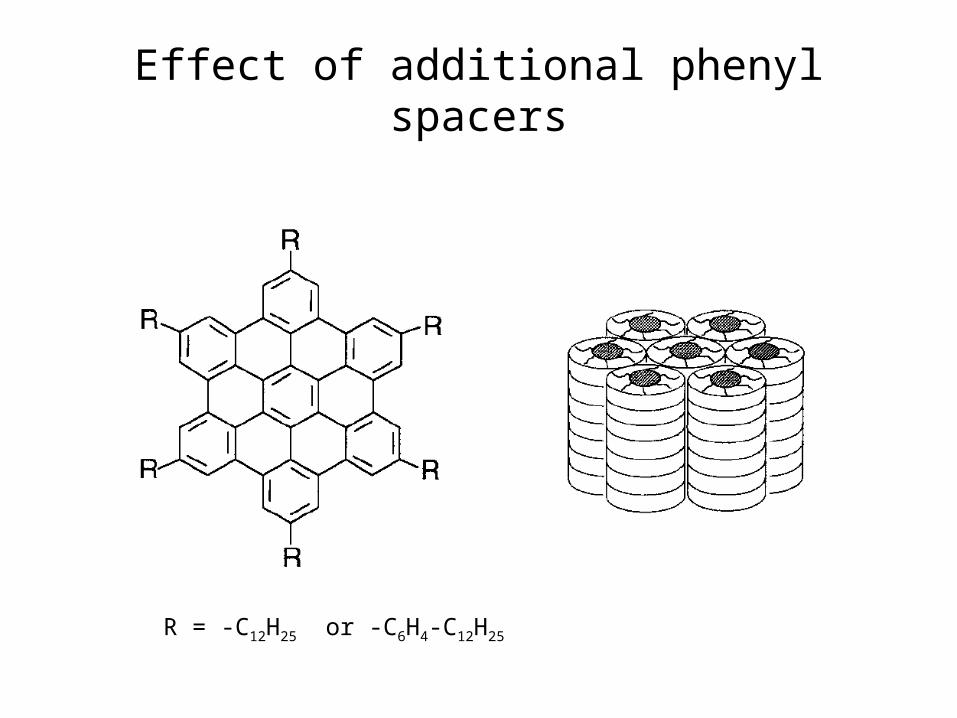
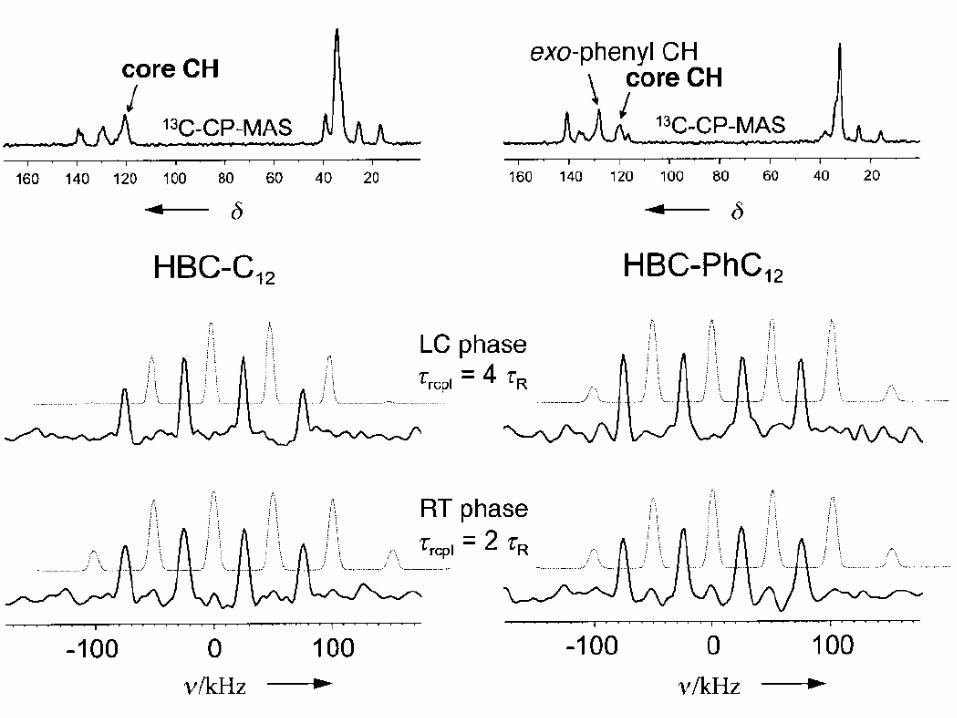
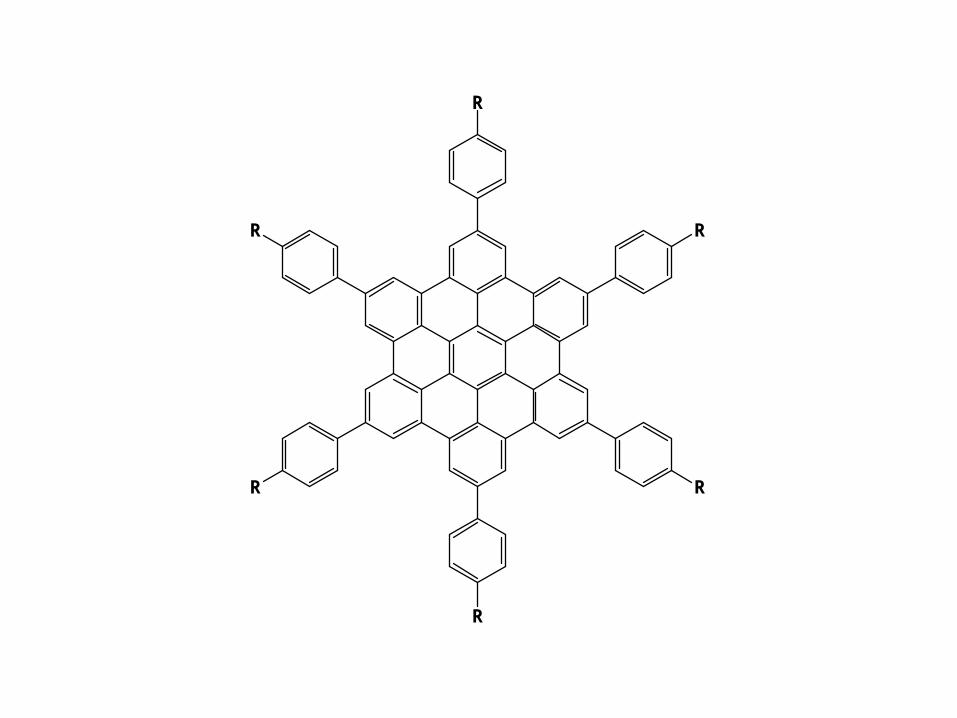
Effect of additional phenyl spacers
R = -C12H25 or -C6H4-C12H25
R
R
R
R
R
R
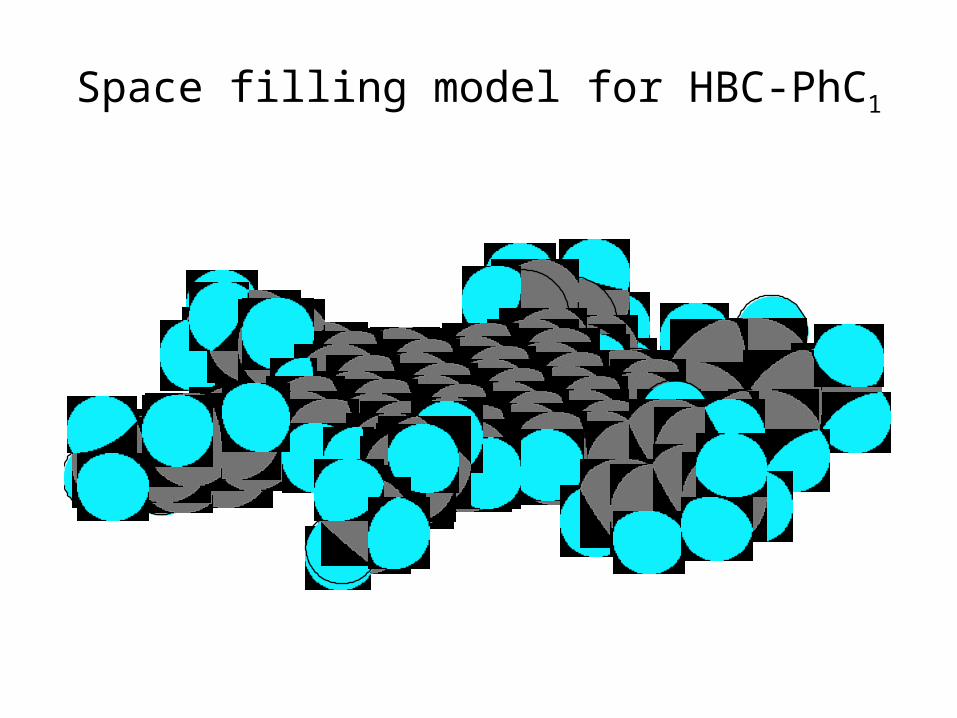
Space filling model for HBC-PhC1
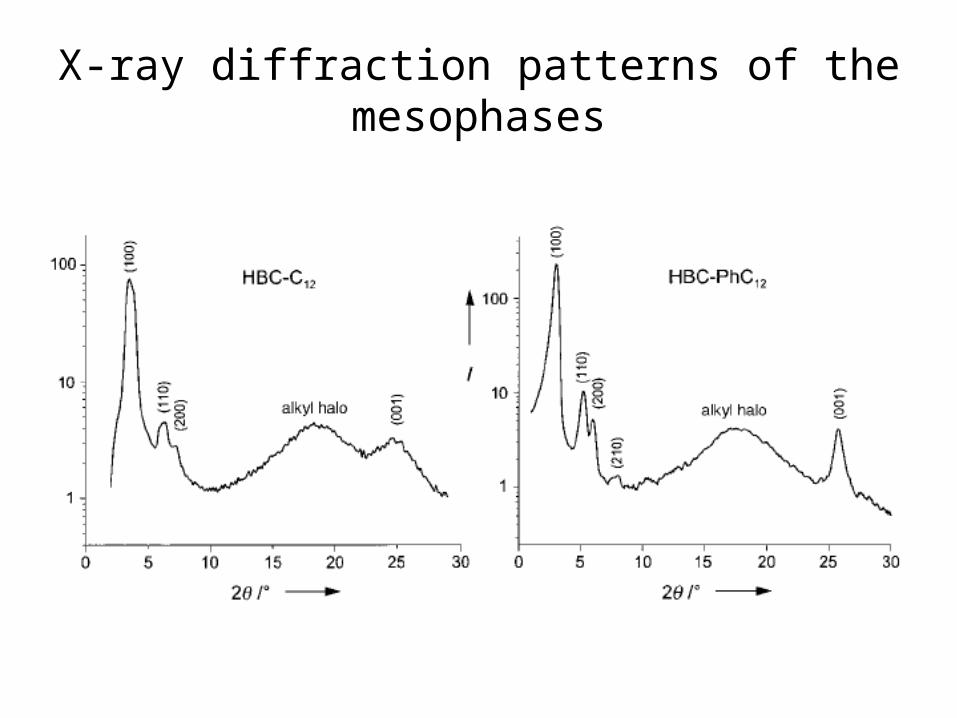
X-ray diffraction patterns of the mesophases