Embed Size (px)
Citation preview
Email: [email protected]
Volume 9 September 2015
ISSN (prINt): 1110-9750 publIShed by
Faculty oF VeterINary medIcINe uNIVerSIty oF Sadat cIty
egypt
Minufiya Veterinary Journal ISSN: 1110-9750
مجلس إدارة المجلة
ةرئیس مجلس إدارة المجل الصفة الوظیفة اإلسم مدارة اإلرئیس مجلس عمید الكلیة ا.د/ شعبان محمد جاد هللا ۱
ھیئة التحریر الصفة الوظیفة اإلسم م
رئیس تحریر المجلة األمراض الباطنة والمعدیةأستاذ .د/ أحمد عبد المنعم زغاوةأ ۱
عضواً الخلیة و األنسجةأستاذ .د/ سعد عبد الفتاح عمارهأ ۲
عضواً الحیوانیة الثروة وتنمیة الرعایةأستاذ ا.د/ محمد عاطف ھالل ۳
عضواً الحیوانیة الثروة وتنمیة الرعایةأستاذ ا.د/ حماده ضاحي حسین ٤
عضواً اإلكلینیكیةأستاذ التغذیة والتغذیة أ.د/ خالد محمود محمد جعفر ٥
عضواً لید والتناسل والتلقیح االصطناعيأستاذ مساعد التو د/ عماد محمود محمد عبد الرازق ٦
عضواً المشتركة واألمراض الصحةأستاذ مساعد بقسم د. شریف عبد هللا زیدان ۷
عضواً الكیمیاء الحیویة وكیمیاء التغذیةمدرس د/ مبروك عطیة عبد الدایم ۸
عضواً األمراض الباطنة والمعدیةمدرس د/ محمد أبو العز نایل ۹
عضواً األمراض الباطنة والمعدیةمدرس عبد الواحد الصیفي محمود د/ أحمد ۱۰
عضواً األمراض الباطنة والمعدیةمدرس حسنین سالمةأحمد د/ أكرم ۱۱
عضواً الباثولوجیامدرس د/ مصطفى عبد الجابر ۱۲
عضواً الرقابة الصحیة على األغذیةمدرس ي امباركد/ ربیع الحسین ۱۳
عضواً الجراحة والتخدیر واألشعةمعید مصري / عباس فتحي عباس بط. ۱٤
عضواً الباثولوجیا اإلكلینیكیةمعید عبد الفتاح الفتاح محمدط.ب/ عبد ۱٥
سكرتیراً موظف إدارى عبد الحمیدأ. شیماء ۱٦
Minufiya Veterinary Journal ISSN: 1110-9750
Vol. 9; September 2015
Chairman of Journal Board
Prof. Dr. Shaaban Gad Allah
Chief Editor
Prof. Dr. Ahmed A. Zaghawa
Associate Editors
Prof. Dr. Hamada D.H. Mahboub
Dr. Ahmed M. Elsify
Dr. Rabee A. Ombarak
Minufiya Veterinary Journal ISSN: 1110-9750
Vol. 9; September 2015
Contents
S. No Title and authors Page 1
Molecular Diagnosis and Genotyping of Bovine Viral Diarrhea Virus Bazid A. I., Nayel M. A., Ahmed M. Elsify, Khalil S. A. and Zaghloul A. H.
1
2 A Study on Antiviral Efficacy of Brucella abortus Ether Extract Against Experimental Rabies Infection in Mice Nermeen, G. Shafik, Hanan, I. Mahmoud, Albehwar, A. M. and Hemmat, S. El-Emam.
14
3 Efficacy of Combined Local Prepared Vaccine Against Mannheimia Haemolytica and Clostridial Diseases Hanan A. Ahmed, Sayed, M. L., Hala, EL-Sawy, Eman M. Elrawy, Mohamed A. Abdelfatah, and Makharita M. Ali.
23
4 Preparation and Conjugation of Staphylococcal Protein A “SPA” and Streptococcal Protein G “SG” with Fluorescein Isothiocyanate as Non-Species Specific Diagnostic Kits Omnia, F. H., Khodeir, M. H., and Saad, M. A. M.
32
5 Clinicopathological Studies on Chicken Infectious Anemia Disease Live Virus Vaccines Tamer S. Allam, Nahed S. Saleh, Salah S. El-Ballal and Hesham A. Sultan. 40
6 Microscopical Identification and Seasonal Dynamics of Gastrointestinal Nematodes in Small Ruminants at Menoufia Province Nasr M. Elbahy, Ahmed O. Elkhtam, Mahmoud AbouLaila, and Amer R. Abdelaziz
58
7 Prevalence of Different Flatworms Infecting Ruminants in Menoufia Governorate Nasr M. Elbahy, Ahmed O. Elkhtam, Mahmoud AbouLaila, and Amer R. Abdelaziz. 66
8 Prevalence of Clinical and Subclinical Mastitis in Menoufia Governorate with Reference of PCR Walid S. Mousa , Ahmed A. Zaghawa , Mohammed A. Nayel, Eman E. Abdeen , Ahmed M. Elsify, Akram A. Salama and Mahmoud A. Aly.
78
9 Clostridium perfringens Toxins With Special Reference to Beta 2 Toxin Ahmed M. Elsify 85
10 Bacteriological Quality and Safety of Raw Cow’s and Buffalo’s Milk Sold in Menoufia Governorate, Egypt Rabee A. Ombarak and Abdel-Rahman M. Elbagory
101
11 Studies on The Potential Protective Effect of Curcumin and Zinc against Nickel- Induced Nephrotoxicity in Rats Salah S. El-Ballal, Ashraf M. Morgan and Nermeen B. EL-Borai.
114
12 Effects of Feeding Rates on Behavior and Growth Performance of Nile Tilapia (Oreochromis Niloticus) Hamada D. H. Mahboub, Sameh G. A. Ramadan, Mohamed A.Y. Helal, Walaa S. H. Ahmed
132
Minufiya Veterinary Journal ISSN: 1110-9750
Vol. 9; September 2015
1
Molecular diagnosis and genotyping of Bovine viral diarrhea virus
Bazid A.I. a, Nayel M.A. b, Ahmed M. Elsify b*, Zaghloul A.H. c, Khalil S.A. d
a Department of Virology- Faculty of veterinary medicine – University of Sadat City- Egypt. b Department of animal medicine and infectious diseases - Faculty of veterinary medicine - University of Sadat City- Egypt. c Department of Theriogenology - Faculty of veterinary medicine - University of Sadat City- Egypt. d Department of Microbiology - Faculty of veterinary medicine - Alexandria University – Egypt. * Corresponding Author: [email protected] Accepted: 11/8/2015
Abstract:
In the present study isolation, biotyping, antigenic and genomic characterization of BVDV
isolates was carried out on buffy coat samples obtained from apparently healthy cattle. The samples were
inoculated in MDBK cells for three successive passages and the CPE was recorded indicating that 48%,
62% and 52% were positive CPE in the 1st, 2nd and 3rd passages respectively. The viral antigen was
detected in cell culture after propagation also by direct FAT and reveled that (62%) showed positive
result. The mean virus titer was recorded after each passage showing values of <102,102 and 104
TCID50/ml by 1st, 2nd and 3rd passages respectively. The virus was identified by VNT using the reference
anti-BVDV-1 serum on cell cultures infected fluids at the third passage. It was found that all samples
showed a characteristic CPE of BVDV were neutralized by the used antiserum confirming that they are
BVDV-1. Nine buffy coat samples were selected to carry out the nested RT-PCR for detection and
genotyping of suspected BVDV. The results indicated the presence of BVDV genotype-I. The positive
samples for FAT, VNT and RT- PCR in infected cell culture were stained by H&E for biotyping
indicating the presence of the two biotypes (CP& NCP) in the samples. The SNT was carried out on
serum samples from the same animals indicating the prevalence of antibodies in 62% by mean titer
ranged from < ½ to 1/8. In conclusion, the present study reports the identification of BVDV genotype –
I in apparently healthy cattle and presence of P.I. animals.
Keywords: Bovine viral diarrhea virus, biotyping, reverse transcriptase polymerase chain reaction (RT-
PCR).
Minufiya Veterinary Journal ISSN: 1110-9750
Bazid et al. / Minufiya Vet. J. 2015, 9: 1-13
2
Introduction: Bovine viral diarrhea (BVD) is one of the most
imperative worldwide diseases in domestic and
wild ruminants, leading to substantial damage in
infected herds as well as extensive economic
losses for the cattle industry (Goyal and Ridpatb,
2005; Ah- med and Zaher, 2008). Causing
multiple disease and clinical syndromes including
embryonic mortalities, abortion, fetal
mummification, stillbirths, congenital deformities,
respiratory disease (Flores et al., 2002) and
hemorrhagic syndrome (Walz et al., 1999).
An important condition for maintenance of BVDV
in bovine populations is the immunotolerant and
persistent infection (PI) that result from
transplacental infection of the fetus before onset of
immunological maturity. Animals persistently
infected with BVDV not only transmit the virus
effectively to susceptible in-contact animals, but
they harbour clones of BVDV which through
serial transplacental passages may be able to
replicate for years without immunological
selective pressure (Toplak et al., 2004). It is well
established that persistently vireamic animals may
later succumb to fatal mucosal disease (Brownlie,
1985).
BVDV is a small enveloped RNA virus which
together with classical Swine fever virus (CSFV)
and Border disease virus (BDV) form the genus
pestivirus in the family Flaviviridae (Pringle,
1999). BVDV consists of a single stranded
positive-sense RNA genome, of approximately
12.5Kb long (Collett, 1992).
BVDV strains have two biotypes, cytopathic (cp)
and non-cytopathic (ncp) which can be
distinguished on the basis of their effect on
cultured bovine cells (Gillespie et al., 1960). The
two biotypes are important for the occurrence of
MD. The MD is either induced by super infection
of persistently infected animals with an
antigenically closely related cp BVDV or by
generation of a cp mutant from the persisting ncp
virus (McClurkin et al., 1985).
According to the analysis of the basis of the 5'
UTR, BVDV was segregated into two genotypes,
BVDV-1and BVDV-2. Sequence homology
within each genotype was over 93%, while
between genotype 1 and 2 it dropped to 74 %
(Ridpath et al., 1994).
According to the phylogenetic tree constructed
from 420 nt of the E2 glycoprotein gene fragment;
the BVDV-1 can be subdivided into BVDV-1 a, c,
d, e, f, g and 1 b which is divided into 1b1 and 1b2
and the BVDV-2 is subdivided into BVDV-2a ,2b
and 2c. (Motoshi et al., 2001)
Due to the complex pathogenesis of BVDV
infections and presence of many genovares,
laboratory diagnosis of BVDV becomes important
in the strategy of control and prevention BVDV
infections. Moreover, the knowledge of the type of
strains occurring in the field can help to establish
effective vaccine and effective control (Kabango,
2005).
There are several methods used for diagnosis of
BVDV infection which include virus isolation
(Dubovi, 1990), virus neutralization (Brock 1995),
immunoperoxidase (Castro et al., 1997), ELISA
Bazid et al. / Minufiya Vet. J. 2015, 9: 1-13
3
(Chu et al., 1985), FAT (Dubovi, 1990) and
AGPT (Gutekunst and Malmquist, 1963) but all
these tests suffer several disadvantages where
virus isolation may requires as long as three weeks
especially when more than one passage in cell
culture is required to recover the virus. It’s
expensive and unsuccessful when antibodies are
present in the examined samples. Moreover, cell
cultures in many laboratories are contaminated
with low levels of BVDV which interferes with the
recovery of field strains of the virus (Bolin et al.,
1985).
FAT and IP detection are rapid but their specificity
and sensitivity are dependent on the quality of the
reagents used. Although reagents used in the
immunoassays apparently react with group
specific antigens, some strains may be missed
(Bolin et al., 1985).
The results of virus neutralization test may vary
widely depending on the strains of the virus used
(Hassan and Scott, 1986).
The use of molecular techniques has been
increased because of the existing rapidity and
accuracy. The nucleic acid based techniques are
useful tools for detecting and simultaneously
genotyping of BVDV without isolation and
propagation in cell cultures. Several researchers
reported the use of reverse transcriptase
polymerase chain reaction (RT-PCR) (Hooft et al.,
1992), multiplex RT-PCR (Gilbert et al., 1999)
and nested RT-PCR (Sullivan and Akkina, 1995)
for detection and typing of BVDV.
Materials and methods: Animals: -
A total of 750 apparently healthy Friesian cattle
housed under bad conditions in two farms present
in Behera Governorate were investigated.
Samples: -
Two sets of blood samples were collected from 50
randomly selected cattle by jagular vein puncture
under sterile conditions. One set with EDTA and
another set without EDTA for separation of the
buffy coat according to Rossmanith et al. (2001)
and sera according to Lannette (1964),
respectively.
BVD virus isolation:-
The obtained buffy coat samples were inoculated
on BVDV free cell line of Madine Darby Bovine
Kidney (MDBK) supplied by Veterinary Serum
and Vaccine Research Institute, Abassia, Cairo,
Egypt according to Marcus and Moll (1968).
These cells were used in virus isolation, virus
titration, SNT, and FAT.
Direct fluorescent antibody technique (FAT): -
Fluorescent antibody technique was applied on the
buffy coat and on cell culture infected with the 3rd
viral passage according to Fernelius and Ritche
(1964).
Detection of viral RNA and genotyping of BVDV
by nested RT-PCR.
This technique was applied on 9 buffy coat
samples from the 50 collected samples. Total RNA
was extracted from both reference strain (Iman
Strain) and field samples (Buffy coat) using
commercial total RNA extraction kit according to
the instruction of the manufacturer. Reverse
transcription and nested polymerase chain reaction
Bazid et al. / Minufiya Vet. J. 2015, 9: 1-13
4
was carried out according to Sullivan and Akkina
(1995).
The nested-PCR oligoprimer sequences are
presented in Table 1.
The RT/PCR was performed with ready to Go
RT/PCR beads (Amersham Pharmacia Biotech)
according to the manufactures instruction.
The first round of PCR was performed in a 50 µl
reaction mix containing 5 µl of P1 primer, 5 µl of
P2 primer, 5 µl of ready to go RT-PCR beads and
35 µl RNAse free water. Reactions were also
performed in Biometra personal cycler.
Conditions for thermal cycler were as follows: one
cycle at 94°C for 1 min, thirty cycles in 3
continous phases which included: 94ºC for 30 sec,
55ºC for 30 sec, and 72ºC for 30 sec, a final
extention at 72ºC for 10 min. The PCR products
were then stored at 4ºC
The second round of PCR was performed also in a
50 µl reaction mix containing 5 µl of product of
the first round (diluted 1 in 100 µl distilled water),
5 µl of P2 primer, 5 µl of TS1 primer, 5 µl of TS2
primer, 5 µl of TS3 primer, and 22 µl RNAse free
water. Reactions were also performed in the same
automated thermal cycler. Conditions for thermal
cycler were as follows: one cycle at 94°C for 30
sec, twenty five cycles in 3 continous phases
which included: 94ºC for 30 sec, 55ºC for 30 sec,
and 72ºC for 30 sec, a final extention at 72ºC for
10 min. The PCR products were then stored at 4ºC
until gel electrophoresis were performed. The
nested PCR products were separated on 3%
agarose gel. The agarose gels contained 10 µg/ml
of ethidum bromide to allow visualization of the
products under an ultraviolet transiluminator.
Results: BVDV isolation:-
The buffy coat samples were inoculated into
MDBK cell culture. Three successive passages
were done in the same cells. It was noticed that 24
samples induced CPE by the first passage, 31
samples induced CPE by the second passage, and
26 samples induced CPE by the third passage. As
shown in table (2).
The observed CPE was characterized by onset on
second day post infection. The signs of CPE were
early rounding and granulation of the infected cells
in scattered areas of monolayer then vaculation
and foamy appearance were observed in 90% of
the cells followed by complete detachment of the
monolayer.
Detection of BVDV in infected cell using the
direct FAT:-
Direct FAT was applied on 50 infected cell
cultures with the 3rd viral passage using anti-
BVDV antibodies conjugated with FITC. The
results of this technique revealed that 31 samples
showed specific fluorescent green reaction
Bazid et al. / Minufiya Vet. J. 2015, 9: 1-13
5
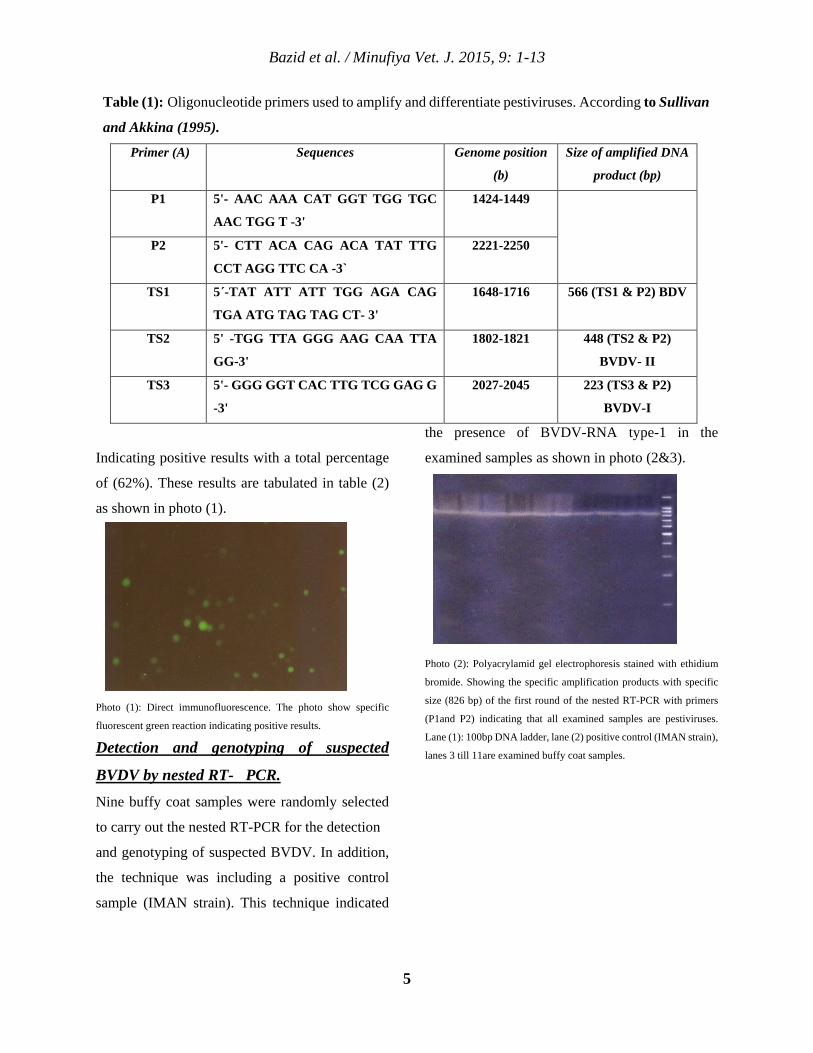
Indicating positive results with a total percentage
of (62%). These results are tabulated in table (2)
as shown in photo (1).
Photo (1): Direct immunofluorescence. The photo show specific
fluorescent green reaction indicating positive results.
Detection and genotyping of suspected
BVDV by nested RT- PCR. Nine buffy coat samples were randomly selected
to carry out the nested RT-PCR for the detection
and genotyping of suspected BVDV. In addition,
the technique was including a positive control
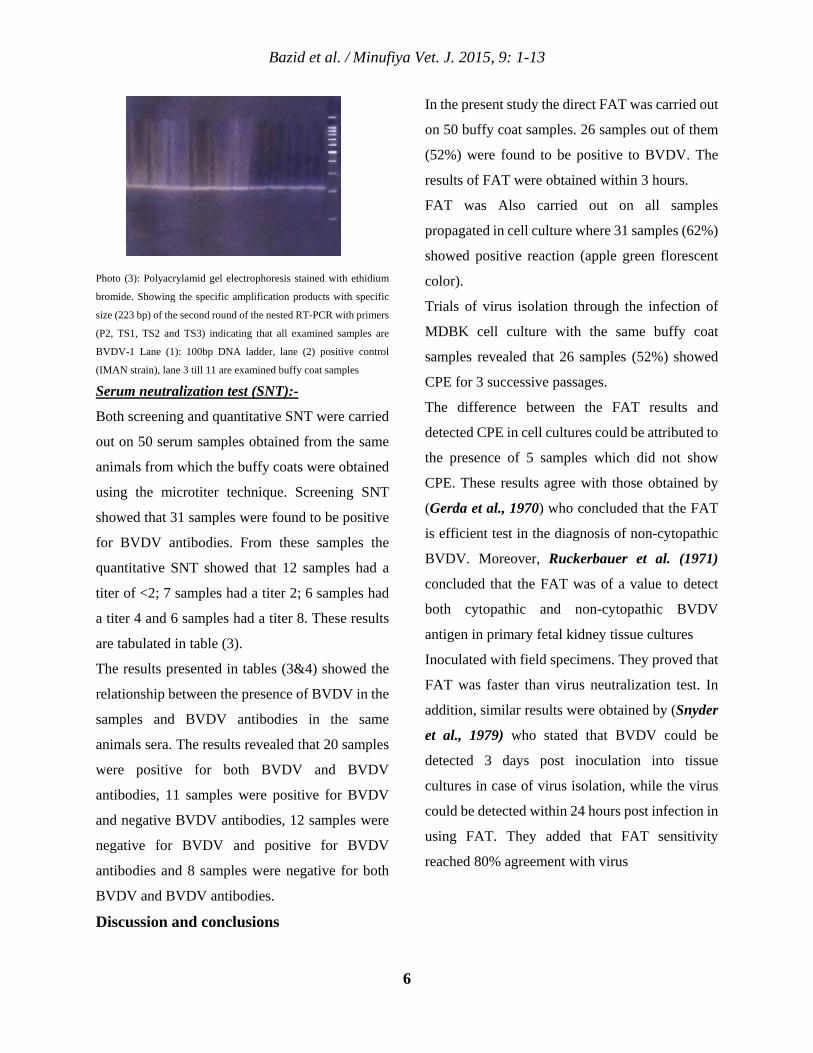
sample (IMAN strain). This technique indicated
the presence of BVDV-RNA type-1 in the
examined samples as shown in photo (2&3).
Photo (2): Polyacrylamid gel electrophoresis stained with ethidium
bromide. Showing the specific amplification products with specific
size (826 bp) of the first round of the nested RT-PCR with primers
(P1and P2) indicating that all examined samples are pestiviruses.
Lane (1): 100bp DNA ladder, lane (2) positive control (IMAN strain),
lanes 3 till 11are examined buffy coat samples.
Table (1): Oligonucleotide primers used to amplify and differentiate pestiviruses. According to Sullivan
and Akkina (1995).
Primer (A) Sequences Genome position
(b)
Size of amplified DNA
product (bp)
P1 5'- AAC AAA CAT GGT TGG TGC
AAC TGG T -3'
1424-1449
P2 5'- CTT ACA CAG ACA TAT TTG
CCT AGG TTC CA -3`
2221-2250
TS1 5΄-TAT ATT ATT TGG AGA CAG
TGA ATG TAG TAG CT- 3'
1648-1716 566 (TS1 & P2) BDV
TS2 5' -TGG TTA GGG AAG CAA TTA
GG-3'
1802-1821 448 (TS2 & P2)
BVDV- II
TS3 5'- GGG GGT CAC TTG TCG GAG G
-3'
2027-2045 223 (TS3 & P2)
BVDV-I
Bazid et al. / Minufiya Vet. J. 2015, 9: 1-13
6
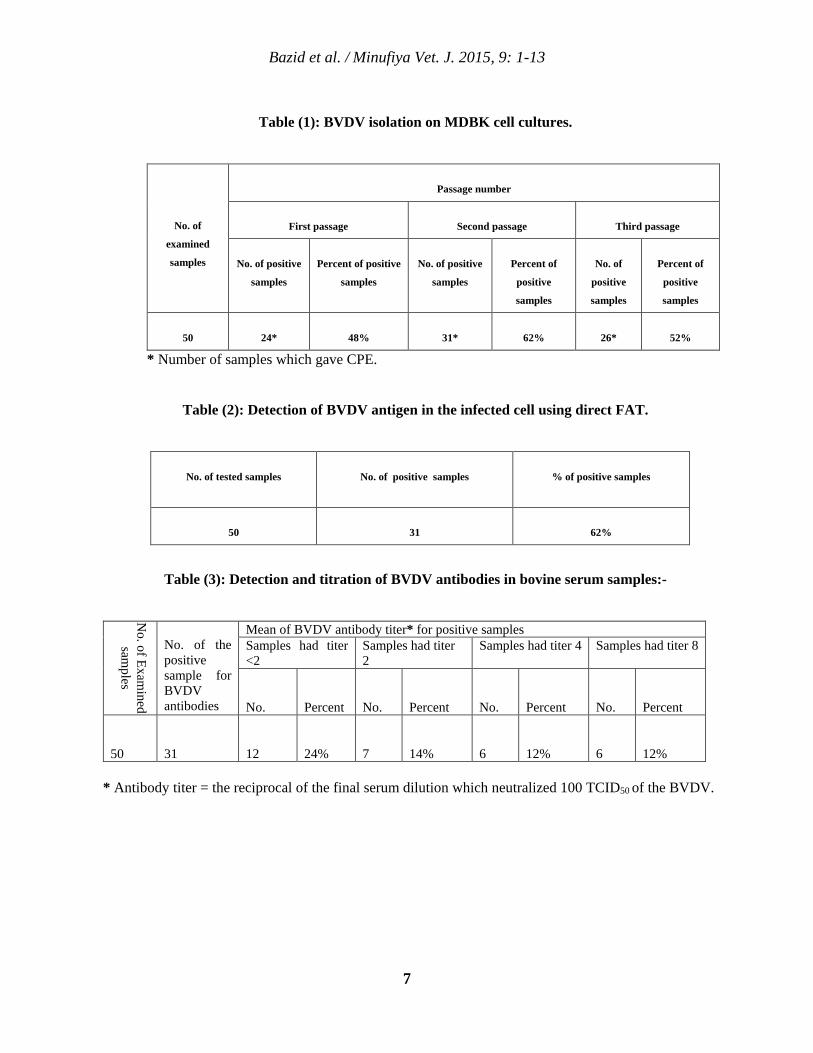
Photo (3): Polyacrylamid gel electrophoresis stained with ethidium
bromide. Showing the specific amplification products with specific
size (223 bp) of the second round of the nested RT-PCR with primers
(P2, TS1, TS2 and TS3) indicating that all examined samples are
BVDV-1 Lane (1): 100bp DNA ladder, lane (2) positive control
(IMAN strain), lane 3 till 11 are examined buffy coat samples
Serum neutralization test (SNT):-
Both screening and quantitative SNT were carried
out on 50 serum samples obtained from the same
animals from which the buffy coats were obtained
using the microtiter technique. Screening SNT
showed that 31 samples were found to be positive
for BVDV antibodies. From these samples the
quantitative SNT showed that 12 samples had a
titer of <2; 7 samples had a titer 2; 6 samples had
a titer 4 and 6 samples had a titer 8. These results
are tabulated in table (3).
The results presented in tables (3&4) showed the
relationship between the presence of BVDV in the
samples and BVDV antibodies in the same
animals sera. The results revealed that 20 samples
were positive for both BVDV and BVDV
antibodies, 11 samples were positive for BVDV
and negative BVDV antibodies, 12 samples were
negative for BVDV and positive for BVDV
antibodies and 8 samples were negative for both
BVDV and BVDV antibodies.
Discussion and conclusions
In the present study the direct FAT was carried out
on 50 buffy coat samples. 26 samples out of them
(52%) were found to be positive to BVDV. The
results of FAT were obtained within 3 hours.
FAT was Also carried out on all samples
propagated in cell culture where 31 samples (62%)
showed positive reaction (apple green florescent
color).
Trials of virus isolation through the infection of
MDBK cell culture with the same buffy coat
samples revealed that 26 samples (52%) showed
CPE for 3 successive passages.
The difference between the FAT results and
detected CPE in cell cultures could be attributed to
the presence of 5 samples which did not show
CPE. These results agree with those obtained by
(Gerda et al., 1970) who concluded that the FAT
is efficient test in the diagnosis of non-cytopathic
BVDV. Moreover, Ruckerbauer et al. (1971)
concluded that the FAT was of a value to detect
both cytopathic and non-cytopathic BVDV
antigen in primary fetal kidney tissue cultures
Inoculated with field specimens. They proved that
FAT was faster than virus neutralization test. In
addition, similar results were obtained by (Snyder
et al., 1979) who stated that BVDV could be
detected 3 days post inoculation into tissue
cultures in case of virus isolation, while the virus
could be detected within 24 hours post infection in
using FAT. They added that FAT sensitivity
reached 80% agreement with virus
Bazid et al. / Minufiya Vet. J. 2015, 9: 1-13
7
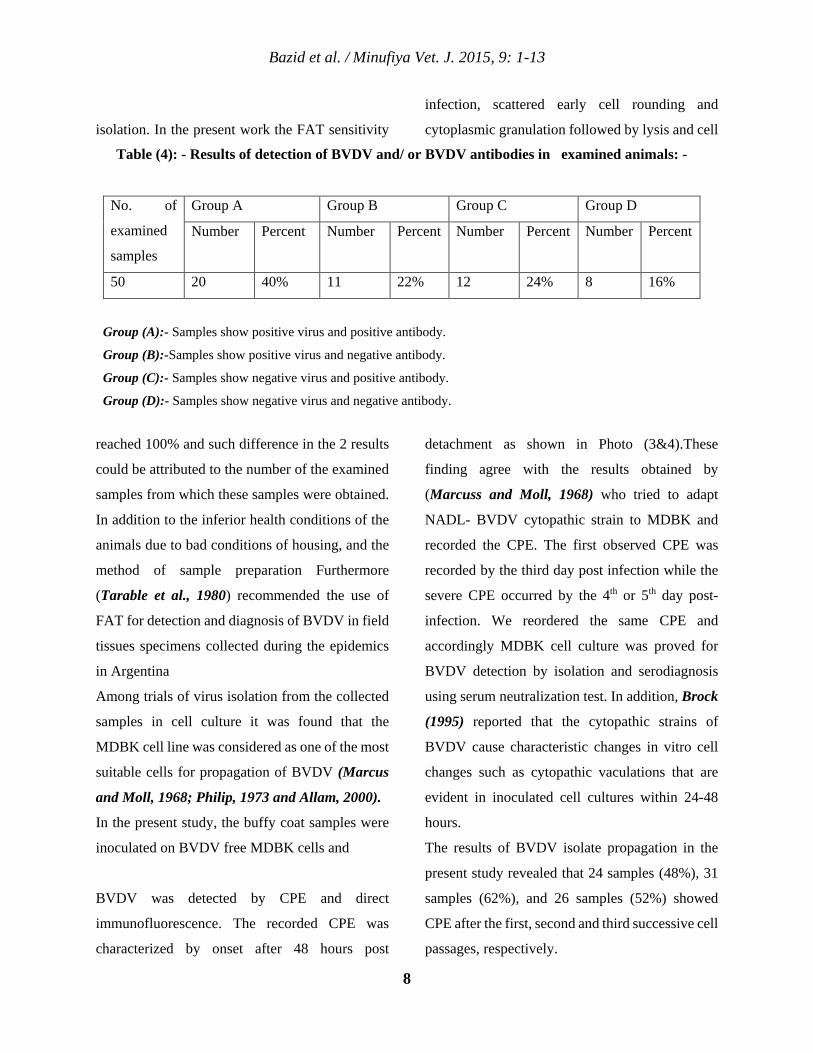
Table (1): BVDV isolation on MDBK cell cultures.
No. of
examined
samples
Passage number
First passage
Second passage
Third passage
No. of positive
samples
Percent of positive
samples
No. of positive
samples
Percent of
positive
samples
No. of
positive
samples
Percent of
positive
samples
50
24*
48%
31*
62%
26*
52%
* Number of samples which gave CPE.
Table (2): Detection of BVDV antigen in the infected cell using direct FAT.
No. of tested samples
No. of positive samples
% of positive samples
50
31
62%
Table (3): Detection and titration of BVDV antibodies in bovine serum samples:-
No. of Exam
ined sam
ples
No. of the positive sample for BVDV antibodies
Mean of BVDV antibody titer* for positive samples Samples had titer <2
Samples had titer 2
Samples had titer 4 Samples had titer 8
No.
Percent
No.
Percent
No.
Percent
No.
Percent
50
31
12
24%
7
14%
6
12%
6
12%
* Antibody titer = the reciprocal of the final serum dilution which neutralized 100 TCID50 of the BVDV.
Bazid et al. / Minufiya Vet. J. 2015, 9: 1-13
8
isolation. In the present work the FAT sensitivity
reached 100% and such difference in the 2 results
could be attributed to the number of the examined
samples from which these samples were obtained.
In addition to the inferior health conditions of the
animals due to bad conditions of housing, and the
method of sample preparation Furthermore
(Tarable et al., 1980) recommended the use of
FAT for detection and diagnosis of BVDV in field
tissues specimens collected during the epidemics
in Argentina
Among trials of virus isolation from the collected
samples in cell culture it was found that the
MDBK cell line was considered as one of the most
suitable cells for propagation of BVDV (Marcus
and Moll, 1968; Philip, 1973 and Allam, 2000).
In the present study, the buffy coat samples were
inoculated on BVDV free MDBK cells and
BVDV was detected by CPE and direct
immunofluorescence. The recorded CPE was
characterized by onset after 48 hours post
infection, scattered early cell rounding and
cytoplasmic granulation followed by lysis and cell
detachment as shown in Photo (3&4).These
finding agree with the results obtained by
(Marcuss and Moll, 1968) who tried to adapt
NADL- BVDV cytopathic strain to MDBK and
recorded the CPE. The first observed CPE was
recorded by the third day post infection while the
severe CPE occurred by the 4th or 5th day post-
infection. We reordered the same CPE and
accordingly MDBK cell culture was proved for
BVDV detection by isolation and serodiagnosis
using serum neutralization test. In addition, Brock
(1995) reported that the cytopathic strains of
BVDV cause characteristic changes in vitro cell
changes such as cytopathic vaculations that are
evident in inoculated cell cultures within 24-48
hours.
The results of BVDV isolate propagation in the
present study revealed that 24 samples (48%), 31
samples (62%), and 26 samples (52%) showed
CPE after the first, second and third successive cell
passages, respectively.
Table (4): - Results of detection of BVDV and/ or BVDV antibodies in examined animals: -
No. of
examined
samples
Group A Group B Group C Group D
Number Percent Number Percent Number Percent Number Percent
50 20 40% 11 22% 12 24% 8 16%
Group (A):- Samples show positive virus and positive antibody.
Group (B):-Samples show positive virus and negative antibody.
Group (C):- Samples show negative virus and positive antibody.
Group (D):- Samples show negative virus and negative antibody.
Bazid et al. / Minufiya Vet. J. 2015, 9: 1-13
9
The delay of CPE appearance in the third passage
of 26 samples less than in the second passage (31)
samples may be due to some factors as suggested
by (Fernelius et al., 1969) who stated that such
delaying may be due to an abortive infection or
incomplete multiplication of the isolates on
MDBK cells or incomplete adaptation of the
isolates to MDBK cells, Johnson et al. (1990)
stated that such delaying may be due to an absence
of the intracellular secretion which is responsible
of CPE evolution. Moreover, Farmer and Frazier
(1986) stated that such delaying may be due to
sudden reduction in virus titer and/or replication
schedule and subsequently BVDV quantity.
Petkova et al.(1982) stated that such delaying may
be due to repeated freezing and thawing of the
viral harvest could leads to denaturation of the
viral proteins and reducing the viral titers and viral
RNA yields, while Kweon et al.( 1997) stated that
such delaying may be due to long preservation
time of harvest at -70 ºC between successive
passages could lower the infectivity titer and ice
crystals formed could have damage effect on the
cell membrane and harmfully affect viral RNA
copies, and finally Xue and Minocha (1994) and
Xue et al.(1997) stated that such delaying may be
due to inhibition of the viral attachment to the
MDBK cell membrane due to the presence of
receptor blocking substrates.
For detection of BVDV antibodies, the serum
neutralization test was carried out on a total 50
serum samples from the same animals (apparently
healthy). The results revealed that 31 samples
(62%) were positive. These results corresponded
to those reported by Baule and Banze (1994) who
reported BVDV antibodies prevalence from 7-
92% and those reported by David et al. (1994)
where they reported that the highest BVDV
morbidity was 40% and those reported by
Radostits and Littlejohnes (1988) where they
reported that the prevalence of BVD antibodies
might be as high as 80%-90%.
Regarding the serum neutralization test applied on
the collected serum samples, it was found that 12
samples (24%) have a mean titer of <2, 7 samples
(14%) have a mean titer 2, 6 samples (12%) have
a mean titer 4 and 6 samples (12%) have a mean
titer 8. So, it seems that the recorded mean titer of
BVDV antibodies was ranged from (<2 to 8) and
this result is agree with that of Hopkinson et
al.(1979) who detected BVDV neutralizing
antibodies in the bovine sera by serum
neutralization test showing a titer of 1:4. Also
similar results were obtained by McClurkin et al.
(1979) who applied serum neutralization test to
estimate the seroconversion of cows after mating
with persistent infected bulls. The neutralizing
antibodies recorded titer was 1:128.
The presence BVDV antibodies in relation to the
virus isolation are illustrated in table (10). The
animals were classified into four groups. The first
group (A): includes animals that were positive
toBVD virus isolation and positive antibody. In
this case the presence of virus and antibodies is an
indication of acute pestivirus infection, as
suggested by Brownlie, (1991).
The second group (B): includes animals that were
positive to BVD virus and negative antibodies. It
Bazid et al. / Minufiya Vet. J. 2015, 9: 1-13
10
is the group of persistently infected animals, which
in most conditions are immune, tolerant and
generally lack antiviral antibodies as described by
Wolf and Buttner (1994).
The third group (C) includes animals that were
negative to BVD virus and positive to its
antibodies. These animals were defined as the
immune competent ones, which have cleared the
virus after infection. The presence of BVD
antibodies without virus could be attributed to
previous infection or vaccination. Assessment of
rise and persistence of neutralizing antibodies to
bovine diarrhea virus ( BVDV) and border disease
virus (BDV) after a two step vaccination using
inactivated BVDV/BDV(Mucobovin) and a
modified live BVDV vaccine ( Vacoviron) was
recorded by Oguzoglu, et al .(2001).
The fourth group (D): includes animals that were
negative to BVD virus and negative to its
antibodies. It is clear that these animals has not
exposed to neither pestivirus infection nor
vaccination. This group can be considered as basis
for a clean herd free from pestivirus infection,
which is the basis for control of pestivirus
infection Radostitis et al. (2000).
The present study can confirm the presence of the
persistent BVDV infection in the tested animals.
The persistently infected animals act as reservoir
of virus and shed the virus for life exposing other
animals in the herd to infection. The same finding
was reported by Sozan (2002) who confirmed the
presence of persistent infected animals in Egypt.
Moreover, RT-PCR provides a new method for
rapid detection and genotyping BVDV.
References Ahmed, W.M. and Zaher, K.S. (2008): “A field
contribution on the relation between reproductive
disorders and bovine viral diarrhea virus infection
in buffalo-cow.” American-Eurasian J. Agric. And
Environ. Sci.; 3 (5): 736-742.
Allam, N. (2000): Growth behavior of BVDV-
Iman strain on the level of RNA synthesis and
genotyping of its viral RNA. Msc.thesis, Fac. vet.
Med. Cairo University.
Baule, C. and Banze, J. (1994): BVDV infection
in calves from selected farms in Mozambique.
Bull. Anim. Health and Reprod. In Africa 42 (4):
279-286.
Bolin, S. R.; McClurkin, A. W.; Cutlip, R. C.
and Coria, M. F. (1985): Severe clinical disease
induced in cattle persistently infected with non-
cytopathic BVDV by super infection with
cytopathic BVDV. Am. J. Vet. Res.46: 573-576.
Brock, K. V. (1995): Diagnosis of BVDV
infections. Veterinary Clinics of North America:
Food Animal practice II: 549-561.
Brownlie, J. (1985): Clinical aspects of the BVD-
MDV in cattle.In Practice, 7: 195-202.
Brownlie, J. (1991): The pathway for BVDV in
the pathogenesis of disease. Arch. Virol, 3: 79-96.
Castro, M. D.; Stoffiegen, W. C.; Brigman, G.
P. and Hillard, K. A. (1997): A method to detect
BVDV contamination in cell cultures using
immunoperoxidase staining. Journal of Veterinary
Diagnostic Investigation 9: 427-431.
Chu, H. L.; Zee, Y. C.; Ardans, A. A. and DAI,
K. (1985): Enzyme-linked immunosorbent assay
Bazid et al. / Minufiya Vet. J. 2015, 9: 1-13
11
for the detection of antibodies to BVDV in bovine
sera. Veterinary Microbiology 10:325-333.
Collett, M. S. (1992): Molecular genetics of
pestiviruses. Comparative Immunology
Microbiology and Infectious Disease 15: 145-154.
David, G. P.; Crawshaw, T. R.; Gunnig, R. F.;
Hibberd, R. C.; Lioyd, G. M. and Marsh, P.
R.(1994): severe disease in adult dairy cattle in
three U.K. dairy herds associated with BVDV
infection. Vet. Rec.134: 468-472.
Dubovi, E. J. (1990): The diagnosis of BVDV
infections: A laboratory view. Veterinary
Medicine 85: 1133-1139.
Farmer, H. and Frazier, J. A. (1986): Presence
of togavirus-like agent in cell cultures from SPF
chick embryos Vet. Rec., 199(10): 243-244.
Fernelius, A. L.; Lambert, G. and Hemmes, G.
J. (1969): BVDV – host cell interactions:
Adaptation and growth of virus in cell lines. Am.
J. Vet. Res. 30: 1561.
Fischer, A. and Glende, W. (1982): Diagnosis of
BVDV infection in the living animal. Tieraztliche
Umschau.37 (1): 27-28 and 30-31.
Flores,E.F.;Weiblen,R.;Scherer,C.F.C.;Gil,L.
H.V.G.; Pilati ,C.; Driemeier, D. ; Moojen, V.
and Wendelstein, A. C. (2000b): Identification of
BVDV type 2 in southern Brazil Pesquisa
Veterinaria Brasileira 20(2): 85-89.
Gerda, M.; Buckerbauer, A.; Cirari, G. L.
Bannister and Boulnger. (1970): Studies on
BVD serum neutralization, complement fixation
and immunofluorescence. Canad. J. Comp. Med.;
15:230-238.
Gilbert, S. A.; Burton, K. M.; Prins, S. E., and
Deregt. (1999): Typing of BVDV directly from
blood of persistently infected cattle by Multiplex
PCR. Journal of clinical Microbiology
37(6):2020-2023.
Gillespie, J. H.; Baker, J. A and Mcentee, K.
(1960): A cytopathogenic strain of virus diarrhea
virus. Cornell.Vet.50: 73-79.
Goyal S.M. and Ridpath, J. F. (2005): Bovine
viral diar- rhea virus; Diagnosis, Mangment and
control. 1st Edition. Blackwell publishing.
Gutekunst, D. E. and Malmquist, W. A. (1963):
Separation of a soluble antigen and infectious
particles of BVDV and their relationship to hog
cholera. Canadian Journal of Comparative
Medicine and Veterinary Science 27: 121-123.
Hafez, S. M. (1973): Isolation and Identification
of BVD-MDV in Egypt. Egypt .J. Vet. Med. Ass.,
35(1): 1-9.
Hassan, A. K. M. and Scott, G. R. (1986): A
technique to obviate the risk of inadvertent
infection of cell cultures with BVDV. J. Comp.
Pathology. 96: 241-246.
Hooft van Iddeking B. J. L.; van Wamel, J. L.
B.; van Gennip H. G. P. and Moorman R. J. M.
(1992): Application of the PCR to the detection of
BVDV infections in cattle. Vet. Microbiol, 30:21-
34.
Hopkinson, M. F.; Hart; L. T.; Seger, G. L.;
Larson, A. D. and Fulton, R. W. (1979): An
immunodiffusion test for detection of BVDV
antibodies in bovine serum. Vet. Microbiol. 107:
403-409.
Bazid et al. / Minufiya Vet. J. 2015, 9: 1-13
12
Johnson, J; Aiken, J. and Rosenbusch, S. D.
(1990): Detection of BVDV genome in leukocytes
from persistently infected cattle by RNA –cDNA
hybridization. Can.J Vet. Res.54 (2): 256-259.
Kabongo, P. N. (2005): The isolation and
characterization of BVDV from cattle in South
Africa Msc. thesis, University of Pretoria etd-
Kabongo.
Kweon, C. H.; Yoon, Y. D.; An S. H. and lee, Y.
S. (1997): Expression of envelope protein (E2) of
BVDV in insect cells. J. Vet. Med. Sci. 59(5): 415-
419.
Lannette, E. H. (1964): Diagnostic procedure for
viral and Richettsial Diseases 3rd Ed. Ann. Public
Health Assoc. Inc., Broadway.
Marcus, S. J. and moll, T. (1968): Adaptation of
BVDv to MDBK cell line. Amer.J.Vet.Res. 29(4):
817-819.
McClurkin, A. W.; Pirtle, E. C.; Coria, M.
F.and Smith, R. L. (1974): Comparison of low
and high passage of B.T. cells for assay of BVDV.
Archiv. Fur dies gesamte Virus for., 45(3): 285-
289.
McClurkin, A. W.; Coria, M. F.and Cutlip, R.
C. (1979): Reproductive performance of
apparently healthy cattle persistently infected with
BVDV J.Am.Vet. Med. Assoc.; 174: 1116-1119.
McClurkin, A. W.; Bolin S. R. and Coria. M. F.
(1985): Isolation of cytopathic and non-cytopathic
BVDV from the spleen of cattle acutely and
chronically affected with bovine viral diarrhea. J.
Am. Vet. Med. Assoc. 186: 568-569.
Motoshi, T.; Hans-Richard, F.; Osamu, Y.;
Yoshimitsu, M.; Volker, M.; Henner, S. and
Irene G. W. (2001): prevalence of genotype 1and
2 of BVDV in Lower Saxony, Germany. Virus
Research 76: 31-42.
Oguzoglu, T. C.; Floegel-Niesmann, G.; Frey,
H. R. and Moennig, V. (2001): Differential
diagnosis of classical swine fever virus and border
disease virus seroepidemiological investigation of
a pestivirus infection on a mixed sheep and swine
farm Dtsch Tierarztl Wochenschr may, 108(5):
210-213.
Petkova, K.; Tsvetkov, P. and Gancheva, P.
(1982): Attempts to produce a precipitating
antigen of cell-cultured virus of viral diarrhea-
mucosal disease in cattle. Vet. Sci., X, 1(2): 72-76.
Phillip, J. I. H. (1973): A study of viruses of the
ovine viral diarrhea group. Ph.D. Thesis,
University of Landon -252pp. Central vet. Lab.
Weybridge. UK.
Pringle, C. R. (1999): The universal system of
virus taxonomy, update to induce new proposals
ratified by the international committee on
taxonomy of viruses during 1998. Arch.Virol,
177(2): 421-429.
Radostitis, O. M. and Littlejohnes R. I. (1988):
New concepts in the pathogenesis, diagnosis and
control of diseases caused by the BVDV. Can. Vet.
J.29: 513-528
Radostitis, O. M.; D.C. Blood and C. C. Gay
(2000): Veterinary medicine: A textbook of the
disease of cattle, sheep, pigs, goats, and horses.
Bailliere Tindal, London, 9th edition.
Ridpath, J. F.; Bolin, S. R. and Dubovi, E. J.
(1994): Segregation of BVDV into genotypes.
Virology, 205: 66-74.
Bazid et al. / Minufiya Vet. J. 2015, 9: 1-13
13
Rossmanith, W.; Vilcek, S.; Wenzl, H.;
Rossmanith, E.; Loitsch, A.; Durkovic, B.;
Strojny, L. and Paton, D.J. (2001): Improved
antigen and nucleic acid detection in a BVDV
eradication program.81: 207-218.
Ruckerbauer, G. M.; Girard, A.; Bannister, G.
L. and Baulanger. P. (1971): Studies on BVD
serum neutralization complement fixation and
immuno- fluorescence. Canad. J. Comp. Med.,
35(3): 230-238.
Snyder, M. L.; Gustafson, G. A. and Stewart,
W.C. (1979): A comparison of virus isolation and
tissue section immunofluorescent technique in
BVDV diagnosis. Proc. of the Amer. Ass. of Vet.
Lab. Diag. 22:303-314.
Sullivan, D.G. and Akkina, R.K. (1995): A
nested polymerase chain reaction assay to
differentiate pestiviruses. Virus Res. 38(2-3): 231-
239.
Tarable, H. D.; Votero, D. A. J.; Lager, I. A.;
Sadir, A. M. and Schudel, A. A. (1980):
Serological diagnosis and epidemiological
characteristics of two outbreaks of BVD-MD in
Argenting. Gaceta Veterinaria, 42(354): 588-593.
Toplak, I.; Sandvik, T.; Barlic-Maganja, D.;
Grom, J. and David, J.P. (2004): Genetic typing
of BVDV: most Slovenian isolates are of
genotypes 1d and 1f. Vet. Microbiol. 99: 175-185.
Walz, P. H.; Baker, J. C.; Mullaney, T. P.;
Kaneene. J. B. and Maes, R. K. (1999):
Comparison of type I and type II BVDV infection
in swine. Can. J. Vet. Res. 63 (2): 119-123.
Wolf, G. and Buttner, M. (1994): Clinical
aspects and diagnosis of border disease virus.
Tierarztl Prax, 22(1): 35-38.
Woodard, L. F. (1994): BVDV associated with
outbreaks of abortion, stillbirths and weak calves.
Vet. Med.: 379-384.
Xue, W. and Minocha, H. C. (1994): Immune
response to BVDV induced by anti-idiotypic
antibodies. Clin. Diag. Lab. Immunol. 1(1): 95-
98.
14
Introduction
Rabies is a viral disease that affects the central
nervous system (CNS) of mammals and has an
extremely high case fatality rate. Once clinical
signs develop, there are very few survivors.
Vaccines can protect pets, as well as people
exposed to rabid animals, but the maintenance
of rabies virus in wildlife complicates its
control.
Rabies is a life threatening disease caused by
RNA virus in the genus lyssavirus that is
usually transmitted to human and animals
through bites from rabid animals, scratch
wounds or licking of the mucous membranes
(Nigg and Walker, 2009)
In Egypt, rabies is enzootic in jackals and
common in dogs as reported by (Thomas and
Rivers, 1952) and ( El-Kanawati et al.,2000)
who concluded that dogs and wolves are the
primary vector animals for transmission of
rabies to cattle in the Middle East. It was
recommended that all unvaccinated
individuals with animal bites receive
A study on antiviral efficacy of Brucella abortus ether extract against experimental rabies infection in mice
Nermeen, G. Shafika; Hanan, I. Mahmouda; Albehwar, A. M.b* and Hemmat, S. El-Emamb
a Central Laboratory for Evaluation of Veterinary Biologics, Abassia Cairo. b Veterinary Serum and Vaccine Research Institute, Abassia Cairo.
*Corresponding Author: [email protected] Accepted: 14/7/2015
Abstract: The present work deals with Bru-Pel extract in a trial to investigate its effect against rabies virus.
The obtained results revealed that Bru-pel has the affinity to induce the highest level of interferon when
inoculated 8 hours pre-exposure to rabies infection. However it has no antiviral effect against rabies virus
in mice when administrated pre and post-exposure to experimental infection even on zero time. So, it
could not be used as post-exposure treatment in case of rabies infection. It was preferable to use specific
antiserum with rabies vaccine in emergency cases (post-exposure) for providing the highest rate of
protection when administrated on the suitable time (0 to 3 days post-exposure).
Keywords: Bru-Pel extract; Brucella; Rabies vaccine and Mice.
Minufiya Veterinary Journal ISSN: 1110-9750
Shafik et al. / Minufiya Vet. J. 2015, 9: 14-21
15
immediate treatment with human rabies
immunoglobulins (HRIG) injected into and
around the wound followed by rabies vaccine.
Usually a great attention directed toward
protection of animals against infectious
diseases especially the fatal of them as rabies
infection. Many trials were carried out in this
aspect including prophylactic vaccination
using specific potent vaccine and post
exposure treatment using specific antiserum
and immunoglobulin. (Khodeir and Daoud,
2008) Some workers studied the antiviral
effect of bacterial extracts such as Brucella
abortus (strain 19) ether extract which
produced a non-viable, insoluble residue (Bru-
Pel) aiming to limit the severity or treat viral
infections (Youngner et al. 1974)
It was reported that intravenous injection of
living cells of Brucella abortus into mice
induced high titers of interferon in the
circulation (Stinebring and Youngner,
1964). The peak of serum interferon appeared
6-8 hours after injection of bacteria, a
characteristic indicative of the so called virus
type of interferon response (Youngner,
1970). Non-viable Brucella cells are also
capable of inducing interferon production in
mice (Billiau et al. 1970)
It was found that extraction of living Brucella
abortus (strain 456) with aqueous ether
yielded a non-viable, insoluble residue (Bru-
Pel). When injected into mice, Bru-Pel was
found to be effective non-toxic interferon
stimulus. The antiviral activity may be
associated not only with the production of
interferon, but also with a general increase in
the level of non-specific resistance in animals
(Youngner et al. 1974).
The present work is a trial to find an
alternative way of intervention in post
exposure to rabies infection using Brucella
abortus ether extract and detecting its
efficiency in animal protection.
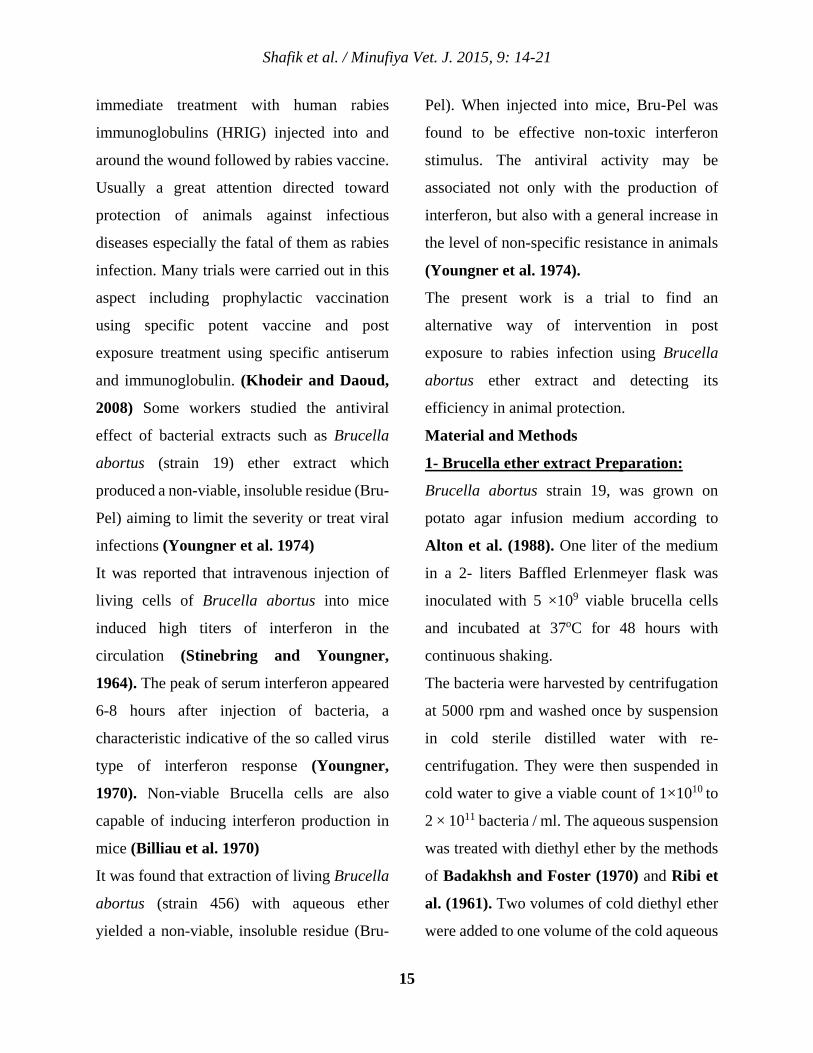
Material and Methods
1- Brucella ether extract Preparation:
Brucella abortus strain 19, was grown on
potato agar infusion medium according to
Alton et al. (1988). One liter of the medium
in a 2- liters Baffled Erlenmeyer flask was
inoculated with 5 ×10⁹ viable brucella cells
and incubated at 37oC for 48 hours with
continuous shaking.
The bacteria were harvested by centrifugation
at 5000 rpm and washed once by suspension
in cold sterile distilled water with re-
centrifugation. They were then suspended in
cold water to give a viable count of 1×10¹⁰ to
2 × 10¹¹ bacteria / ml. The aqueous suspension
was treated with diethyl ether by the methods
of Badakhsh and Foster (1970) and Ribi et
al. (1961). Two volumes of cold diethyl ether
were added to one volume of the cold aqueous
Shafik et al. / Minufiya Vet. J. 2015, 9: 14-21
16
suspension of Brucella, and the mixture was
shaken for 60 s in a separatory funnel and then
allowed to stand at 25oC overnight. The ether
layer was discarded and the aqueous phase
containing the extracted bacteria was retained.
Nitrogen was bubbled through the aqueous
cell suspension until the odor of ether was
undetectable. The extracted cells were
removed by centrifugation, washed with
distilled water, and heated at 100oC for 5 min.
in a water bath to destroy the viability of any
bacteria that may have survived the extraction
process. This heating did not change the
biological activity of the material. The
aqueous material remaining after removal of
the bacteria contained a significant amount of
crude Brucella lipopolysaccharide (LPS)
2- Cell culture adapted rabies virus:
Evelyn Rokitincki Abelesth (ERA) strain of
rabies virus adapted to BHK-21 cells of a titer
7 log10TCID50/ml was supplied by DPAVR
and used to determine the antiviral effect of
Bru-pel in infecting BHK cell culture.
3- Cell line:
Baby hamster kidney cell line (BHK-21)
established by Mackpherson and Stocker
(1962) was used for investigating the safety
and the invitro antiviral effect of the Bru-pel
extract in cell culture.
4-Challenge virus strain (CVS):
CVS mice brain adapted rabies virus with a
titer of 106 MLD50/ml was supplied by the
Department of Pet Animal Vaccine Research
(DPAVR); Veterinary Serum and Vaccine
Research Institute, Abassia, Cairo. It was used
for experimental rabies infection in mice.
5-Inactivated rabies vaccine:
Inactivated cell culture rabies vaccine was
supplied by DPAVR and used for post-
exposure treatment of experimentally infected
mice. Each mouse was injected
intraperitoneally with 0.5ml.
6-Rabies antiserum:
Rabies hyper immune serum (Khodeir and
Daoud, 2008) was used for post-exposure
treatment of experimentally infected mice. It
had a titer of 130 IU/ml and used at a dose of
30 IU/mouse.
7-Mice:
A total of two hundreds and eighty weaned
Swiss albino mice were supplied by DPAVR
and used in the different experiments included
in the present work.
8-Safety test:
The safety of Bru-pel extract was investigated
in-vitro through its inoculation in BHK cell
culture to determine any abnormal cellular
changes and in-vivo through its inoculation in
a group of 10 mice where each mouse received
0.5 ml intraperitoneal and all mice were kept
Shafik et al. / Minufiya Vet. J. 2015, 9: 14-21
17
under observation for any clinical signs or
mortalities for two weeks.
9-The effect of pre-exposure administration
of Bru-pel against rabies virus infection:
A total number of 30 mice were divided into 6
groups each of 5 mice. Five 10 fold dilutions
of Bru-Pel in normal saline started from the
undiluted up to 1/10000. Each mouse from the
first 5 groups was injected through the
intraperitoneal route with a dose of 0.5 ml of
each Bru-Pel dilution. The sixth group was
kept as control and all animals were subjected
for daily observation. After 7 days each mouse
of the first 5 groups was injected by CVS
intramuscular in a dose of 0.3ml/ mouse, while
the 6th group was kept as control with daily
observation for all the mice for any clinical
signs or mortalities for two weeks.
10- Investigation of the in-vitro antiviral
effect of Bru-pel on rabies:
Such investigation was carried out by
inoculation of Bru-pel extract (25µl/well) at
the same time with the cell culture adapted
rabies virus (100TCID50/well) on BHK cells;
the test included normal cells and virus
infected cells as controls and subjected to
daily microscopic examination.
11-Testing the post-exposure antiviral
efficacy of Bru-Pel extract versus rabies
vaccine and antiserum against rabies virus
infection
One hundred and eighty mice were divided
into 18 groups (10mice/group). The first 17
groups were experimentally infected with
0.3ml of CVS/ mouse through the
intramuscular route. The first 8 groups
received 0.5ml (25mg) of Bru-Pel/mouse
through intraperitoneal route on 0 time; 1; 2;
3; 4; 5; 6 and 7 days post infection. While the
second 8 groups received 0.5 ml of rabies
vaccine and 0.25 ml of rabies
antiserum/mouse through intraperitoneal
route on 0 time; 1; 2; 3; 4; 5; 6 and 7 days post
infection. The 17th group did not receive any
treatment (Positive control, received CVS
only). The 18th subgroup was kept without
infection and without treatment as test control
(Negative control).
12-Detection of induced interferon by Bru-
Pel extract:
A forty mice was injected with Bru-pel in the
same manner as above, these mice were
divided into 4 subgroups (10 mice in each) the
first 3 subgroups; were infected with CVS in
the same dose and route as above 2; 4 and 8
hours after treatment with Bru-Pel extract
respectively while the 4th subgroup was
infected without pre-infection treatment.
RESULTS AND DISCUSSION:
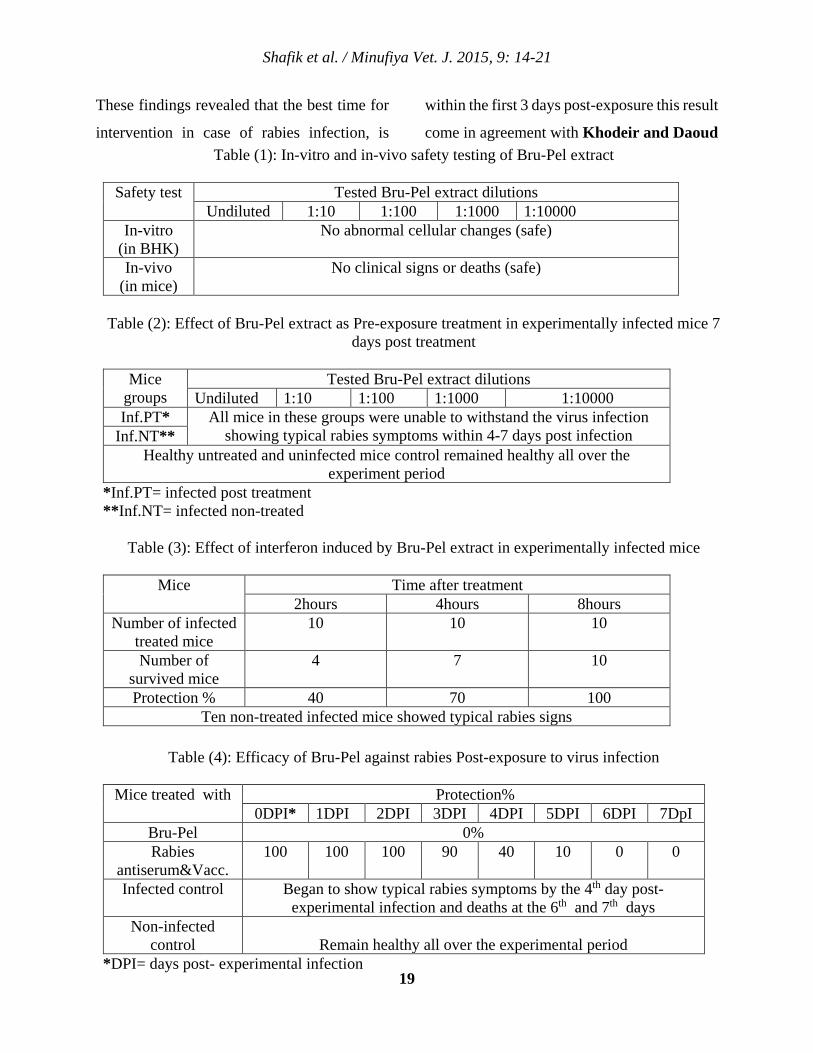
Table (1) demonstrates in-vitro safety test
which indicated that Bru-Pel ether extract did
not induce any cellular changes in the
Shafik et al. / Minufiya Vet. J. 2015, 9: 14-21
18
inoculated BHK cell culture in comparison
with the normal cell culture. Also mice
inoculated with Bru-Pel did not show any
abnormal clinical signs or mortalities all over
the experimental period (two weeks)
confirming its safety, this results come in
agreement with the findings of Youngner et
al. (1974) who concluded that Bru-Pel was
found to be effective non-toxic for mice. It
was found that pre-exposure treatment of mice
with Bru-Pel extract, 7 days pre rabies virus
infection (table-2) did not protect mice against
the disease induction. This finding disagrees
with Youngner et al. (1974) who suggested
that antiviral activity may be associated not
only with the production of interferon, but
with a general increase in the level of non-
specific resistance in animals. This
disagreement could be attributed to the virus
class; where they used Semliki Forest virus of
genus Alpha virus, family Togaviridae which
is a positive-sense RNA virus while rabies is a
negative-sense RNA virus belonging to genus
Lyssa virus in the family Rhabdoviridae in
addition to the virus tropism where rabies
virus has its special pathogenesis. Cell culture
assay showed that Bru-Pel extract was unable
to inhibit the virus replication. There are no
available data discuss the invitro antiviral
effect of Bru-Pel in cell culture. The interferon
activity of Bru-Pel as shown in (table-3)
revealed that it induced 40, 70 and 100%
protection against rabies infection 2, 4 and 8
hours respectively after Bru-Pel inoculation.
Such investigation showed that antiviral effect
of Bru-Pel could be attributed to the induction
of interferon as stated by Stinebring and
Youngner (1964) who found that intravenous
injection of living cells of Brucella abortus
into mice induced high titers of interferon in
the circulation. These obtained results agree
with Youngner (1970) who stated that the
peak of serum interferon appeared 6-8 hours
after injection of bacteria, which is
characteristic indicative of the so called virus
type of interferon response In this aspect it
could be suggested that induction of interferon
as pre-exposure treatment in case of rabies
infection is unpractical. Table (4) showed that
post-exposure treatment with Bru-Pel extract
of infected mice was non-protective where all
infected mice were unable to overcome the
virus infection even with the treatment on the
time of infection. On the other hand, mice
treated with the antirabies serum and vaccine
were able to withstand the virus infection
showing protection rates 100; 100; 100; 90;
40; 10 and 0% on the 0 day; 1st; 2nd ;3rd ; 4th;
5th and 6-7 days post infection respectively.
Shafik et al. / Minufiya Vet. J. 2015, 9: 14-21
19
These findings revealed that the best time for
intervention in case of rabies infection, is
within the first 3 days post-exposure this result
come in agreement with Khodeir and Daoud Table (1): In-vitro and in-vivo safety testing of Bru-Pel extract
Safety test Tested Bru-Pel extract dilutions
Undiluted 1:10 1:100 1:1000 1:10000 In-vitro
(in BHK) No abnormal cellular changes (safe)
In-vivo (in mice)
No clinical signs or deaths (safe)
Table (2): Effect of Bru-Pel extract as Pre-exposure treatment in experimentally infected mice 7
days post treatment
Mice groups
Tested Bru-Pel extract dilutions Undiluted 1:10 1:100 1:1000 1:10000
Inf.PT* All mice in these groups were unable to withstand the virus infection showing typical rabies symptoms within 4-7 days post infection Inf.NT**
Healthy untreated and uninfected mice control remained healthy all over the experiment period
*Inf.PT= infected post treatment **Inf.NT= infected non-treated
Table (3): Effect of interferon induced by Bru-Pel extract in experimentally infected mice
Mice Time after treatment
2hours 4hours 8hours Number of infected
treated mice 10 10 10
Number of survived mice
4 7 10
Protection % 40 70 100 Ten non-treated infected mice showed typical rabies signs
Table (4): Efficacy of Bru-Pel against rabies Post-exposure to virus infection
Mice treated with Protection%
0DPI* 1DPI 2DPI 3DPI 4DPI 5DPI 6DPI 7DpI Bru-Pel 0% Rabies
antiserum&Vacc. 100 100 100 90 40 10 0 0
Infected control Began to show typical rabies symptoms by the 4th day post-experimental infection and deaths at the 6th and 7th days
Non-infected control
Remain healthy all over the experimental period
*DPI= days post- experimental infection
Shafik et al. / Minufiya Vet. J. 2015, 9: 14-21
20
(2008) and Albehwar (2009 and 2011). Who
stated that earlier proper treatment of rabies
infection result in the highest protection rate.
So, it could be concluded that Bru-Pel extract
has no reliable antiviral effect against rabies
virus infection and could not be used as post
exposure treatment and it is preferable to use
specific antiserum or immunoglobulin with
emergency vaccination for providing the
highest rate of protection that overcome the
virus infection especially when administrated
on the suitable time (0 to 3 days post
exposure).
REFERENCES
Albehwar, A. M. (2009): Studies on
prophylactic and emergency vaccination of
farm animals against rabies,
Ph.D.V.Sc.Thesis, Cairo Univ.
Albehwar, A. M. (2011): The use of immune
globulin in rabies infection simulated in mice,
29th Arab Vet. Med. Congress, 28-30 Nov.,
Cairo, Egypt.
Alton, G. C.; Jones, L. M.; Angus, R. D.
and Verger, J. M. (1988):
Techniques for the brucellosis laboratory Inst.
Nat. de la Rech. Agro. 147, Rue de la Univ.
75007 Paris
Badakhsh, F.F. and Foster, J.W. (1970):
Endotoxin-containing preparations of
Brucella abortus: Chemical studies. Amer. J.
Vet. Res. (31): 359- 363.
Billiau, A.; Schonne, E.; Eyckmans, L. and
De Somer, P. (1970): Interferon induction
and resistance to virus infection in mice
infected with Brucella abortus. Infect.
Immun. (2): 698-704.
El-Kanawati, Z.R.; Ikram, A. Karim; Afaf,
Amin and El-Ebeedy, A.A. (2000):
Occurrence of rabies in Egypt during 1997-
1999. J. Egypt. Vet. Med. Ass. (60): 47-54.
Khodeir, M.H. and Daoud, A.M. (2008):
Preparation of antirabies hyperimmune serum
for emergency immunization of farm animals.
4th Int. Sci. Conf. NRC, 1-9.
Mackpherson, L.A. and Stocker, M.G.P.
(1962): Polyoma transformation of hamster
cell colonies, an investigation of genetic
factors affecting cell competence. Virology,
16:147
Nigg, A.J. and Walker, P.L. (2009):
Overview on prevention and treatment of
rabies pharmacotherapy.29 (10): 1182-1185.
Ribi, E.; Haskins W. T.; Landy, M. and
Milner K. C. (1961): Preparation and host-
reactive properties of endotoxin with low
content of nitrogen and lipid. J. Exp. Med.
(114): 647-663.
Stinebring, W. R. and J. S. Youngner.
(1964): Patterns of interferon in mice injected
with bacteria or bacterial endotoxin. Nature
(London) 204:712.
Shafik et al. / Minufiya Vet. J. 2015, 9: 14-21
21
Thomas, M. and Rivers, A. (1952): Viral and
Rickettsial infection J.B. LIPPI, N. Cott
comp.2nd ed. USA: 267-296.
Youngner, J. S. (1970): Interferon production
by non –viral stimuli of microbial origin. J.
Gen. Physiol. 56 (Suppl.): 25-40.
Youngner, J. S.; Keleti, G. and Feingold, D.
S. (1974): Antiviral activity of an Ether-
Extracted Nonviable preparation of Brucella
abortus. Infect. Immun. 10 (6): 1202.
22
INTRODUCTION
Among the bacterial diseases of ruminants,
infection with Mannheimia haemolytica,
Pasteurella trehalosi and Clostridial strains
represent a major bacterial causative agents of
highly pathogenic importance causing sever
morbidity and mortality rate affecting the
meat industries all over the world (Confer,
2009;Griffin, 2010 and Manteca et.al,
2001).
Mannheimia haemolytica and Pasteurella
trehalosi are well-known pathogens of
ruminants found worldwide (Kodjo et al.,
1999). These two species were formerly
included in the single species Pasteurella
haemolytica, with the two biochemical types
Efficacy of Combined Local Prepared Vaccine Against Mannheimia haemolytica and Clostridial
Diseases Hanan A. Ahmeda, Sayed, M. La., Hala, EL-Sawyb, Eman M. Elrawy b, Mohamed A. Abdelfatah b, and Makharita M. Alia
a Central Laboratory for Evaluation of Veterinary Biologics, Abassia Cairo. P.O.B.131 b Veterinary Serum and Vaccine Research Institute, Abassia Cairo. P.O.B.131 *Corresponding Author: [email protected] Accepted: 2/8/2015
Abstract:
The present work aimed to study the protective effect of a locally prepared combined freeze-dried
vaccine of M. haemolytica, P. trehalosi and polyvalent Clostridial vaccine. Evaluation of such
preparation following the quality control tests revealed that, it was stable, free from foreign
contaminants, safe and immunogenic .The prepared vaccine was evaluated in rabbits and the immune
response of vaccinated animals to combined vaccine was estimated by ELISA test for M. haemolytica,
P. trehalosi antibodies. High antibody levels induced for M. haemolytica and P. trehalosi in combined
freeze-dried vaccine compared with combined liquid one. There was a good antibody response to all
Clostridial components determined by Serum neutralization test (SNT) and agglutination test in sera of
rabbits revealed no substantial differences with respect to the antibody values between combined freeze-
dried vaccine and combined liquid vaccine. The obtained results confirmed that the locally prepared
combined freeze-dried vaccine of M. haemolytica, P. trehalosi and polyvalent Clostridial vaccine was of
good quality and producing high antibody titers.
Keywords: Pasteurellosis, Clostridial diseases, pneumonia and Combined vaccine.
Minufiya Veterinary Journal ISSN: 1110-9750
Hanan et al. / Minufiya Vet. J. 2015, 9: 22-31
23
designated biotypes A and T (the letters
standing for arabinose or trehalose
fermentation, respectively) (Adlam, 1989).
Strains belonging to the T biotype, initially
designated as Pasteurella trehalosi (Sneath &
Stevens, 1990), have been recently
reclassified as P. trehalosi on the basis of
phylogenetic studies (Blackall et al., 2007a,
b). In parallel, the taxonomy of M.
haemolytica has been further modified
(Sneath & Stevens, 1990; Angen et al.,
1999a, b). Both species can be serotyped by
indirect haemagglutination according to their
capsular antigens (Foder et.al., 1999). M.
haemolytica and P. trehalosi are the most
common bacterial isolates that cause
pulmonary diseases in ruminants worldwide
that resulted in economic losses for the cattle
backgrounding and feedlot industry due to
elevated mortality rates, intensive costs for
treatment and prevention as well as reduction
of the carcass value (Confer, 2009 ).
Vaccines containing different serotypes are
used in the control of pasteurellosis. For the
vaccination of cattle and sheep, bacterins, live
attenuated, leukotoxin (Lkt), capsule,
lipopolysaccaride, subunit vaccines
comprised of different surface antigens,
sodium salicylate extract and potassium
thiocyanate extract vaccines were used. A
cell-free vaccine containing leukotoxin and
serotype specific surface antigens was shown
to be efficacious in preventing pneumonia in
calves vaccinated twice followed by
intratracheal challenge with live attenuated M.
haemolytica (Diker et al., 2000; Sabri et al.,
2000; Donachie et al., 1986). Researchers
found that vaccines provide a good protection
against homologous strains while they were
insufficiently protective against heterologous
ones (Diker et al., 2000).
On other hand, Clostridia cause many
different diseases that affect beef cattle and
sheep of all ages, characterized by sudden
death, most occurring worldwide ( Troxel
et.al, 2001). Diseases caused by clostridia can
be divided into 4 groups: those affecting the
alimentary system (the enterotoxemias), those
affecting the parenchymatous organs, those
causing myonecrosis and toxemia, and those
causing neurologic disorders. Their mode of
action is to produce one or more potent toxins
when multiplying under favorable conditions
(Parsonson, 2007). Excellent control of these
diseases by active immunization is of a
considerable importance (Webster and
Frank, 1985 and Rahman et al., 1998).
Vaccination against clostridial diseases has
been practiced for many years in sheep
(Blackwell et al., 1983) and cattle (Stokka et
al., 1994). Polyvalent clostridial vaccine
containing six toxoids mixture can protect
Hanan et al. / Minufiya Vet. J. 2015, 9: 22-31
24
cattle and sheep against C. perfringens types
A, B and D, C. novyi type B, C.chauvoei ,
C.septicum and C. tetani . The effectiveness
of immunization depends on several factors as
type of vaccine, route or site of vaccination
and adjuvant used (Chirase et al., 2001).
The present work aimed to prepare combined
freeze-dried bacterin-toxoid vaccine of
Mannheimia haemolytica , Pasteurella
trehalosi with Clostridial polyvalent vaccine
and compare it with the combined inactivated
liquid vaccine in terms of inducing a
protection for cattle and sheep against the
most dangerous diseases, M.haemolytica , P.
trehalosi and Clostridial diseases ,affecting
them in a dramatic form saving time and
efforts.
MATERIAL AND METHODS
1-Mannheimia(M) haemolytica and
Pasteurella(P) trehalosi: Local isolates of
M.haemolytica and P.trehalosi isolated from
infected cattle and sheep respectively were
obtained from Vet. Serum and Vaccine
Research Institute, Abbasia, Cairo, Egypt.
These isolates were used for preparation of
experimental vaccine.
2- Clostridial strains: Local isolates of C.
perfringens types A, B and D, C. novyi type
B, C.chauvoei , C.septicum and C. tetani were
obtained from Vet. Serum and Vaccine
Research Institute, Abbasia ,Cairo,Egypt.
These isolates were used for preparation of
experimental vaccine.
3-Rabbits : Fifty two, three-week old Bosket
rabbits were supplied by Vet. Serum and
Vaccine Research institute, Abbasia , Cairo,
Egypt, These animals were divided as follow:
*12 Rabbits were used in the safety test of the
prepared vaccines.
* 40 Rabbits were used in potency test.
4-Mice: A total of 100 Swiss Albino mice of
about 15-20 g body weight supplied by
Veterinary Serum and Vaccine Research
Institute, were used for serum neutralization
test (SNT) for determination of the antitoxin
assay.
5- Vaccine preparation:
5.1. Preparation of M.haemolytica and
P.trehalosi vaccine in the liquid form:
Inactivated M.haemolytica and P.trehalosi
vaccine was prepared according to (Mosier
et.al, 1998). The final bacterial suspension
was adjusted to contain 108 colony forming
units/ml then inactivated by adding 0.3%
formalin.
5.2. Preparation of M.haemolytica and
P.trehalosi vaccine in Freeze-dried form:
A freeze-dried bacterin-toxoid vaccine
(containing leukotoxoid , capsular , antigen ,
soluble , antigens and inactivated cells) of M.
haemolytica and P. trehalosi strains prepared
Hanan et al. / Minufiya Vet. J. 2015, 9: 22-31
25
according to Brown et.al,1995. The bacterial
suspension was adjusted to contain 108 cells
/ml then inactivated by adding 0.3% formalin.
5.3. Preparation of polyvalent Clostridial
vaccine: Inactivated polyvalent clostridial
vaccine containing five toxoid components of
C.septicum,C.perfringens types A,B and D
and C novyi type B and whole culture of
C.chauvoei were prepared as described by
(Gaddallah et al.,1974) while tetanus toxoid
was prepared according to instruction of
Rijks Institute (1980). Aluminum hydroxide
gel was added at 20% concentration as
adjuvant according to (El-Sehemy et al.,
2004)
5.4. Preparation of combined vaccine of M.
haemolytica ,P. trehalosi and Clostridial
vaccine in liquid form : It was prepared
according to Stone et al. (1978) by mixing
previously prepared inactivated M.
haemolytica ,P. trehalosi and Clostridial
vaccine vaccines to contain 3ml for clostridia
and 2 ml for both M. haemolytica and P.
trehalosi per each dose. The vaccine was
adjuvanted with aluminum hydroxide gel in a
concentration of 20%
5.5 Preparation of combined freeze-dried
vaccine of M. haemolytica ,P. trehalosi and
polyvalent Clostridial vaccine:
Freeze-dried vaccine of M.haemolytica and
P.trehalosi was reconstituted with Clostridial
vaccine just prior to use
6- Quality control testing of the prepared
experimental vaccine:
6.1-Sterility test: Testing the freedom of the
prepared vaccine from foreign contaminants
(aerobic and anaerobic bacteria and fungi) was
carried out according to OIE (2013)
6.2-Safety test: Safety of the prepared
vaccines was tested according to OIE (2013)
through inoculation of double dose
subcutaneously in each of rabbits which kept
under daily observation for 14 days.
6.3-Potency test:
-Group (1): 10 rabbits inoculated with
M.heamolytica and P. trehalosi freeze-dried
bacterin-toxoid vaccine which was
reconstituted just prior to use with phosphate
buffer saline containing 20% alum hydroxide
gel.
-Group (2): 10 rabbits inoculated with
M.heamolytica and P. trehalosi freeze-dried
bacterin-toxoid vaccine which was
reconstituted just prior to use with inactivated
polyvalent Clostridial vaccine.
- Group (3): 10 rabbits inoculated with
combined liquid inactivated M.heamolytica,
P. trehalosi and polyvalent Clostridial
vaccine.
Hanan et al. / Minufiya Vet. J. 2015, 9: 22-31
26
- Group (4): 10 rabbits were kept without
vaccination as control.
The vaccines were inoculated through the
subcutaneous route with a dose of 2 ml / rabbit
for group (1), 3 ml/ rabbit for group (2) and 5
ml/ rabbit for group (3) administrated twice
with 3 weeks intervals. All rabbits were
housed in separate isolates under hygienic
measures receiving adequate ration and water.
Serum samples were obtained regularly on
week intervals to follow up the induced
antibody levels up to 9 weeks post the first
vaccination.
7- Enzyme linked immunosorbent
assay(ELISA):
It was carried out according to Akan et al
(2006) for the determination of
M.heamolytica and P.trehalosi antibody OD
in rabbits sera. OD results were evaluated,
considering
the highest dilution of sample as positive if the
OD rise more than three standard deviations
above the mean value of negative serum
samples obtained from unvaccinated controls
8-Antitoxin Assay:
The sera of each group of rabbits received
Clostridial polyvalent vaccine were collected
at 2nd week after the second dose. Pooled sera
of each vaccinated groups were tested for the
detection of antibodies against all antigens
components of the vaccine by using Serum
neutralization test (SNT) in Swiss white mice.
The antitoxin values for these components
were expressed in international units (IU) as
described by British Veterinary
Pharmacopeia (2013). Clostridium tetani
antitoxin was titrated according to the Rijks
Institute protocol (1989), while antibody
against C.chauvoei was determined by plate
agglutination test according to Claus and
Macheak(1972).
9-Statistical analyses
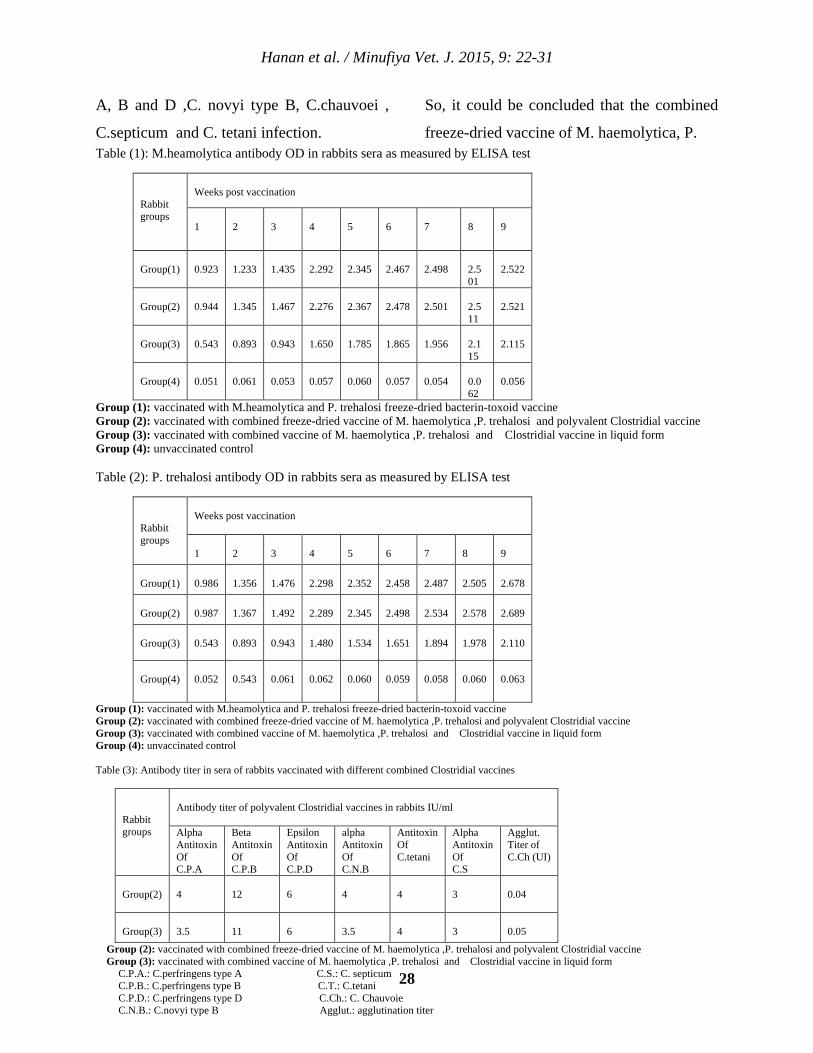
Results of ELISA test in table (1 and 2) were
analyzed and compared with parametrical
correlation using Student’s t test (Sendecor,
1971).
RESULTS AND DISCUSSION
Together M. haemolytica and P. trehalosi
represent a major bacterial causative agent of
bovine and ovine respiratory disease, which is
one of the most important causes for economic
losses for the cattle backgrounding and feedlot
industry. Commercially available vaccines
only partially prevent infections caused by P.
trehalosi and M. haemolytica (Confer, 2009).
Clostridial diseases are characterized by
sudden onset, short disease fade and high
fatality rate which make the probability of
treatment success at minimal level (Troxel
et.al, 2001).
Polyvalent clostridial vaccine is widely
recommended as prophylaxis against such
Hanan et al. / Minufiya Vet. J. 2015, 9: 22-31
27
diseases, the prepared polyvalent clostridial
vaccine containing six antigens achieved the
most suitable requirements to produce high
protection rate (Chirase et al., 2001).
During the present work a M.heamolytica and
P. trehalosi freeze-dried bacterin-toxoid
vaccine, combined freeze-dried vaccine of M.
haemolytica, P. trehalosi with polyvalent
Clostridial vaccine and combined vaccine of
M. haemolytica ,P. trehalosi and Clostridial
vaccine in liquid form were found to be stable
,free from foreign contaminants ( aerobic and
anaerobic bacteria and fungi ) and safe in
vaccinated rabbits where such animals
remained healthy all over the experimental
period. These observations agree with the
recommendation of OIE (2013).
ELISA test was performed to follow up the
induced immune response of vaccinated
rabbits with the prepared M.heamolytica and
P. trehalosi freeze-dried bacterin-toxoid
vaccine, combined freeze-dried vaccine of M.
haemolytica ,P. trehalosi and polyvalent
Clostridial vaccine and combined vaccine of
M. haemolytica ,P. trehalosi and Clostridial
vaccine in liquid form . The results
demonstrated in table (1 and 2) showed that
high antibody levels were induced by
vaccination of rabbits with M.heamolytica and
P. trehalosi freeze-dried bacterin-toxoid
vaccine either alone or in combination with
polyvalent Clostridial vaccine more than that
obtained from corresponding combined liquid
vaccine starting from the 1st week post
vaccination and reached to the maximum
value on the 9th week post vaccination. These
findings came in agreement with Diker et al.,
2000 and Sabri et al., 2000 who found that
vaccine containing leukotoxin and serotype
specific surface antigens was shown to be
efficacious in preventing pneumonia in
animals vaccinated twice followed by
intratracheal challenge. The immunogenic
response of the prepared polyvalent
Clostridial vaccine as shown in table (3)
revealed that there was good antibody
response to all Clostridial components
determined by Serum neutralization test
(SNT) for C. perfringens types A, B and D ,C.
novyi type B, C.septicum and C. tetani and by
using agglutination test for C.chauvoei in sera
of rabbits vaccinated with either combined
freeze-dried vaccine of M. haemolytica ,P.
trehalosi and polyvalent Clostridial vaccine or
combined vaccine of M. haemolytica ,P.
trehalosi and Clostridial vaccine in liquid
form which gave a parallel results. These
results came in agreement with that reported
by Chirase et al., 2001 who recommended the
use of polyvalent Clostridial vaccine
containing six toxoids mixture can protect
cattle and sheep against C. perfringens types
Hanan et al. / Minufiya Vet. J. 2015, 9: 22-31
28
A, B and D ,C. novyi type B, C.chauvoei ,
C.septicum and C. tetani infection.
So, it could be concluded that the combined
freeze-dried vaccine of M. haemolytica, P. Table (1): M.heamolytica antibody OD in rabbits sera as measured by ELISA test
Rabbit groups
Weeks post vaccination
1
2
3
4
5
6
7
8
9
Group(1)
0.923
1.233
1.435
2.292
2.345
2.467
2.498
2.501
2.522
Group(2)
0.944
1.345
1.467
2.276
2.367
2.478
2.501
2.511
2.521
Group(3)
0.543
0.893
0.943
1.650
1.785
1.865
1.956
2.115
2.115
Group(4)
0.051
0.061
0.053
0.057
0.060
0.057
0.054
0.062
0.056
Group (1): vaccinated with M.heamolytica and P. trehalosi freeze-dried bacterin-toxoid vaccine Group (2): vaccinated with combined freeze-dried vaccine of M. haemolytica ,P. trehalosi and polyvalent Clostridial vaccine Group (3): vaccinated with combined vaccine of M. haemolytica ,P. trehalosi and Clostridial vaccine in liquid form Group (4): unvaccinated control Table (2): P. trehalosi antibody OD in rabbits sera as measured by ELISA test
Rabbit groups
Weeks post vaccination 1
2
3
4
5
6
7
8
9
Group(1)
0.986
1.356
1.476
2.298
2.352
2.458
2.487
2.505
2.678
Group(2)
0.987
1.367
1.492
2.289
2.345
2.498
2.534
2.578
2.689
Group(3)
0.543
0.893
0.943
1.480
1.534
1.651
1.894
1.978
2.110
Group(4)
0.052
0.543
0.061
0.062
0.060
0.059
0.058
0.060
0.063
Group (1): vaccinated with M.heamolytica and P. trehalosi freeze-dried bacterin-toxoid vaccine Group (2): vaccinated with combined freeze-dried vaccine of M. haemolytica ,P. trehalosi and polyvalent Clostridial vaccine Group (3): vaccinated with combined vaccine of M. haemolytica ,P. trehalosi and Clostridial vaccine in liquid form Group (4): unvaccinated control Table (3): Antibody titer in sera of rabbits vaccinated with different combined Clostridial vaccines
Rabbit groups
Antibody titer of polyvalent Clostridial vaccines in rabbits IU/ml Alpha Antitoxin Of C.P.A
Beta Antitoxin Of C.P.B
Epsilon Antitoxin Of C.P.D
alpha Antitoxin Of C.N.B
Antitoxin Of C.tetani
Alpha Antitoxin Of C.S
Agglut. Titer of C.Ch (UI)
Group(2)
4
12
6
4
4
3
0.04
Group(3)
3.5
11
6
3.5
4
3
0.05
Group (2): vaccinated with combined freeze-dried vaccine of M. haemolytica ,P. trehalosi and polyvalent Clostridial vaccine Group (3): vaccinated with combined vaccine of M. haemolytica ,P. trehalosi and Clostridial vaccine in liquid form
C.P.A.: C.perfringens type A C.S.: C. septicum C.P.B.: C.perfringens type B C.T.: C.tetani C.P.D.: C.perfringens type D C.Ch.: C. Chauvoie C.N.B.: C.novyi type B Agglut.: agglutination titer
Hanan et al. / Minufiya Vet. J. 2015, 9: 22-31
29
trehalosi and polyvalent Clostridial vaccine
was of good quality and producing a
significant high antibody titers compared to
the combined liquid one without any
antagonizing effect among them.
REFERENCES
1-Adlam, C (1989): The structure, function
and properties of cellular and extracellular
components of Pasteurella haemolytica.
Pasteurella and Pasteurellosis (Adlam C &
Rutter JM, eds), pp. 75–92. Academic Press,
London, UK
2- Akan, M.A., Taner, O.N., Sareyyu,
N.H., Glu, R.H. and Osman, Y. (2006):
Vaccination studies of lambs against
experimental Mannheimia (Pasteurella)
haemolytica infection. Small Ruminant
Research 65 (2006) 44–50
3-Angen, O., Mutters, R., Caugant, D.A.,
Olsen, J.E. and Bisgaard, M. (1999a):
Taxonomic relationships of the [Pasteurella]
haemolytica complex as evaluated by DNA-
DNA hybridisations and 16S rRNA
sequencing with proposal of Mannheimia
haemolytica gen. nov., comb. nov.,
Mannheimia granulomatis comb. nov.,
Mannheimia glucosida sp. nov., Mannheimia
ruminalis sp. nov. and Mannheimia varigena
sp. nov. Int J Syst Bacteriol 49: 67–86.
4-Angen, O., Quirie, M., Donachie, W. and
Bisgaard, M. (1999b): Investigations on the
specifity of Mannheimia (Pasteurella)
haemolytica serotyping. Vet Microbiol 65:
283–290.
5-Blackall, P.J., Bisgaard, M. and Stephens,
C.P. (2007a): Phenotypic characterisation of
Australian sheep and cattle isolates of
Mannheimia haemolytica, Mannheimia
granulomatis andMannheimia varigena. Aust
Vet J 80: 87–91.
6-Blackall, P.J., Bojesen, A.M.,
Christensen, H. and Bisgaard, M. (2007b):
Reclassification of [Pasteurella] trehalosi as
Bibersteinia trehalosi gen. nov., comb. nov.
Int. J. Syst Evol. Microbiol. 57: 666–674.
7-Blackwell, T.E., Bulter, D.G. and Bell,
A.G. (1983): Enterotoxeamia in the goat: The
humoral response and the local tissue reaction
following vaccination with two different
bacterin toxoids .Can.J.Comp.Med. 47: 127-
132
8- British Veterinary Pharmacopoia (2013),
ISBN: 9780113229321
[http://www.pharmacopoeia.co.uk].
9-Brown, L.A., Dayalu, K.I., Kaufman, T.J.
and Newsham, R.S. (1995): Pasteurella
heamolytica type A-1 bacterin-toxoid vaccine
.Pfizer Inc.New York, N.Y.Oct.30, 1995
10-Chirase, N.K., Green, L.K., Graham,
A.S. and Avampto, J.M. (2001): Influence of
clostridial vaccines and infection sites on

Hanan et al. / Minufiya Vet. J. 2015, 9: 22-31
30
performance feeding behaviour. J. Anim.
Sci.79:1409-1415
11-Confer, A.W. (2009): Update on bacterial
pathogenesis in BRD. Anim. Health Res. Rev.
10, 145–148.
12-Claus, K.D. and Macheak, M.E. (1972):
Preparation of a C.chauvoei antigen and
determination of protective immunity by plate
agglutination test. Amr.J.Vet.Res.33 :1045-
1052
13-Diker, K.S., Akan, M., Kaya, O. (2000):
Evaluation of immunogenicity of Pasteurella
haemolytica serotypes in experimental
models. Turk. J. Vet. Anim. Sci. 24, 139–143.
14-Donachie, W., Burrels, C., Sutherland,
A.D., Gilmour, J.S., Gilmour,
N.J.L., 1986. Immunity of spesific pathojen
free lambs to challenge with an aerosol of
Pasteurella haemolytica biotype A serotype 2.
Pulmonary antibody and cell response to
primary and secondary infections. Vet.
Immunol. Immunopathol. 11, 265–279.
15-El-Sehemy, M.M., Diab, R.A., Hussein,
A.Z., Fathia Shafie and Roukaya M.
Osman (2004): Immunological studies on
rabbit enterotoxaemia vaccine. 6th Sci.Conf.of
the Egy.Vet.poultry Assoc.Sep.2004:25-27
16-Fodor, L., Varga, J., Hajtos, I. and
Molnar, T. (1999): Serotypes of Pasteurella
haemolytica and Pasteurella trehalosi isolated
from farm animals in Hungary. Zentralbl Vet
Med B 46: 241–247.
17-Franck, G.H. (1989): Pasteurellosis in
cattle. Pasteurella and Pasteurellosis (Adlam
C & Rutter JM, eds), pp. 197–222.Academic
Press, London, UK.
18-Gaddallah, M.S., Farrag,I., Lotfy, O.,
Mahmoud, M.S. and Magda, H. (1971):
The immunilogenicity of alum precipitated
multicomponent clostridial vaccines.J.Egypt
vet Med.Assoc.,31(3-4):136-151
19-Griffin, D. (2010): Bovine pasteurellosis
and other bacterial infections of the
respiratory
tract. Vet. Clin. North Am. Food Anim. Pract.
26, 57–71.
20-Kodjo, A., Villard, L., Bizet, C., Martel,
J.L., Sanchis, R., Borges, E., Gauthier, D.,
Maurin, F. and Richard, Y. (1999): Pulsed
Field Gel Electrophoresis is more efficient
than Ribotyping and Random Amplified
Polymorphic DNA, in discrimination of
Pasteurella haemolytica strains. J Clin
Microbiol 37: 380–385.
21-Mosier, D.A., Panciera, R.J., Rogers,
D.P., Uhlich, G.A., Butine, M.D., Confer,
A.W. and Basaraba, R.J. (1998):
Comparison of serologic and protective
responses induced by two Pasteurella
vaccines. Can J Vet Res.Jul;62(3):178
Hanan et al. / Minufiya Vet. J. 2015, 9: 22-31
31
22- OIE Terrestrial Manual (2013): Chapter
1.1.9 Tests for sterility and freedom from
contamination of biological materials
23-Parsonson I (2007): Epidemic catarrh of
sheep: the possible role of black disease. Aust.
Vet. J. 85: 78-83.
24-Rahman, M.S., Huque, A.K. and
Rahman, M.M. (1998): Immunological
observation in ruminant to the use of
clostridium perfringens beta and epsilon
toxoids.Ind.Vet.j., 75:639-642
25-Rijks Institute (1980): instruction for the
preparation of vaccine. Rijks voor
Volksgezonahied Bithoven, The Netherlands.
26- Rijks Institute protocol (1989): Quality
control of bacterial vaccines. Rijks voor
Volksgezonahied Bithoven, The Netherlands.
27-Sabri, M.Y., Zamri-Saad, M., Mutalib,
A.R., Israf, D.A., Muniandy, N., (2000):
Efficacy of an outer membrane protein of
Pasteurella haemolytica A2, A7 or A9-
enriched vaccine against intratracheal
challenge exposure in sheep. Vet. Microbiol.
73, 13–23.
28-Sendecor, G.W. (1971): Statistical
Methods, 4th Ed. Iowa State Univ. Press.
29-Sneath, P.H. and Stevens, M. (1990):
Actinobacillus rossii sp. nov., Actinobacillus
seminis sp. nov., nom. rev., Pasteurella bettii
sp. nov., Pasteurella lymphangitidis sp. nov.,
Pasteurella mairi sp. nov., and Pasteurella
trehalosi sp. nov. Int J Syst Bacteriol 40: 148–
153.
30-Stokka, G.l., Edwards, A.J., Spire, M.F.,
Brandt, R.T. and Smith, J.E. (1994):
Inflammatory response to clostridial vaccines
in feed lot cattle J.A.M.V.,204: 415-419
31-Stone, H.D., Burgh, M., Hopkins, S.R.
and Yoder, H.W. (1978):
Prepration of inactivated oil emulsion vaccine
with viral antigen. Avian Dis.,22(4):666-674
32-Troxel T. R., Gadberry, M. S., Wallace,
W. T., Kreider, D. L., Shockey, J. D.,
Colburn, E. A., Widel, P. and Nicholson, I.
(2001): Clostridial antibody response from
injection-site lesions in beef cattle, long-term
response to single or multiple doses, and
response J. Anim. Sci. 2001. 79:2558–2564
33-Webster, A.C. and Frank, C.L. (1985):
Comparison of immune response stimulated
in sheep, rabbits and guinea pigs by the
administration of multicomponent clostridial
vaccines Aust.Vet.J. 62(4):112-114.
32
Introduction
Staphylococcal protein–A "SPA" is a
proteinbound to the cell wall of the pathogenic
bacterium Staphylococcus aureus binds to the
Fc portion of most mammalian class G
immunoglobulins. Therefore, this protein has
a unique potential for making "universal"
immunoassays (Aslam and Dent, 1998).
Preparation and Conjugation of Staphylococcal protein A and streptococcal protein G with fluorescein isothiocyanate as non-species specific diagnostic kits
Omnia, F. H.a* Khodeir, M. H.b and Saad, M. A .Mc
aAnimal Health research Institute Bacteriology Department-Dokki – Giza – Egypt. bVetrinary Serum and Vaccine Research Institute-Abassia, Cairo - Egypt cAnimal Reproduction Research Institute, Haram, Giza. Egypt. *Corresponding Author: [email protected] Accepted: 11/8/2015
Abstract:
Staphylococcal protein A “SPA” and streptococcal protein G “SG” are binds to the most mammalian
class G immunoglobulin. Therefore “SPA” and “SG” has a unique potential for making “universal” tool,
which can be used in various immunoassays which achieve early diagnosis and quick perform till date
including coagulation test; Immune fluorescence antibody technique (IFT) and enzyme linked immune
sorbent assay (ELISA). In this study “SPA” and “SG” were prepared using two reference strains of
Cowan-1 and group C streptococci. Three classical forms of SPA and SG were used including crud;
purified and fluorescein isothiocyanate “FITC” conjugates. Such preparations were used in application
of coagulation test and fluorescent antibody technique on reference antigens and antibodies (antisera) in
order to evaluate their efficacy. The used antisera were obtained from different animal species including
cattle; buffaloes; sheep; goat; dogs; horse; rabbit; mice as well as camel sera. SPA and SG also used for
differentiation between IgG1 andIgG2 subclass in serum of different animal species. In conclusion it could
be stated that SPA and SG are safe; easy to be used, high stable, highly sensitive, can be used as rapid
field test, of low cost having friendly environmental relationship.
Keywords: SPA, SG, Fluorescein isothiocyanate, FAT and Coagulation test.
Minufiya Veterinary Journal ISSN: 1110-9750
Omnia et al. / Minufiya Vet. J. 2015, 9: 32-39
33
Some strains of S-aureus synthesize protein –
A, a group specific ligand which binds the Fc
region of IgG from many species. It binds to
human, mouse, rabbit, cat, cow, dog, goat,
Guinea pig, horse and sheep IgG but not bind
to chicken (-) and hamster (±) IgG (Alan and
Rabinthorpe, 1996). Staphylococcal protein–
A "SPA" has increasing importance as a tool
in both quantitative and qualitative
immunological techniques. SPA remains
markedly stable on exposure to high
temperatures, low pH and denaturizing agents
(Montassier et al, 1994). Staphyelococcal
protein–A was used to develop a coagulation
"COA" test for the detection and typing of foot
and mouth disease virus (FMDV). Its
simplicity and rapidity of performance and its
low cost, has a great potential for direct
detection and identification of FMDV as
screening strategy at FMDV outbreaks
(Montassier et al, 1994).
Protein G is an immunoglobulin-binding
protein expressed in group C and G
Streptcoccal bacteria much like protein A but
with differing specificity. The native molecule
also binds albumin, however, because serum
albumin is a major contaminant of antibody
sources. The albumin binding site has been
removed from recombinant forms of protein G
(Sjobring et al, 1991).
Fluorescent dyes are commonly employed as
labels in primary binding tests, the most
important being fluorescein isothiocyanate
(FITC). FITC is a yellow component that can
be bound to antibodies without affecting their
reactivity. When irradiated with invisible
ultraviolet light, FITC emits violet green light,
so FITC- labeled eddies are used in the direct
and indirect fluorescent antibody tests
(Tizard, 1996).
The present work was designed to prepare
“SPA” and “SG” using two reference strains
of Cowan-1 and group C streptococci
including crud; purified and fluorescein
isothiocyanate “FI” conjugates. The efficacy
of such preparations will be evaluated through
the application of coagulation test and
fluorescent antibody technique on reference
antigens and antisera from different animal
species including cattle; camel; horse; sheep;
dogs; horse; rabbit; mice and rats.
MATERIAL AND METHODS
1- Reference bacterial strains:
1.1-Cowan-1 strain of S.aureus was supplied
by Prof.Dr. Saad, M. A.M (Aimal
reproduction Research Institute; Alharam
Giza) for preparation of staphylococcal
protein A according to Kassler (1975) and
Sting et al (1990).
Omnia et al. / Minufiya Vet. J. 2015, 9: 32-39
34
1.2-Streptococcal group C strain
Streptococcalequi (c) was supplied by
ATTCC33398 Microbiologic Com 200
Cooper Avenue North. St. Co. Lud for
preparation of streptococcal protein –G
according to Sting et al (1990).
2- Specific antigens and Antibodies (Ags
and Abs):
2.1-Viral Ags:
Antigens of foot and mouth disease (FMD)
type O, A and SAT2, bovine ephemeral fever
(BEF); Rabies; Rift Valley fever (RVF) and
rabbit hemorrhagic viral disease vaccine
(RHDV) were kindly provided by Veterinary
Serum and Vaccine Research Institute, Abasia
Cairo.
2.2-Bacterial soluble antigens and
antibodies:
2.2.1-Brucella periplasmic protein and
positive brucella serum of naturally infected
cows were kindly provided by Dr. Nour"
Brucella department Animal health Research
Institute- Dokki, Giza.
2.2.2-Pasteurellamultocida group type B was
kindly provided by Prof. Dr. Emad Mokhtare
Bacteriolgy department Animal health
institute- Dokki
2.2.3-Tetanus toxoid was kindly supplied by
Veterinary Serum and Vaccine Research
Institute.
3-Serum:
3.1-Normal rabbit serum was used as control
negative.
3.1.2-Serum samples were obtained from
different vaccinated animal species cattle
(vaccinated with trivalent FMD vaccine and
BEF vaccine); camel (vaccinated with rabies
vaccine); sheep (vaccinated with RVF
vaccine); horse (vaccinated with tetanus
toxoid); dog; cat and mice (vaccinated with
rabies vaccine); rabbit (vaccinated with rabbit
hemorrhagic viral disease vaccine) and camel
(vaccinated with rabies and RVF vaccines)
4-Fluorescein isothiocyanate (C4 H11 NO5
S) E:
(C4 H11 NO5 S) E was supplied by Merck,
Darmstadt for Microscopy (M.Gew.389.39).
FI was used for conjugation of SPA and SG
proteins according to Narin (1969). Acetone
dried bovine liver powder at a final
concentration of 50mg/ml was used for
removal residual untreated
fluoresceinisothiocyanate (FITC) and labeled
protein according to Cabel (1974).
5-Preparation of SPA suspension according
to Kessler (1975):
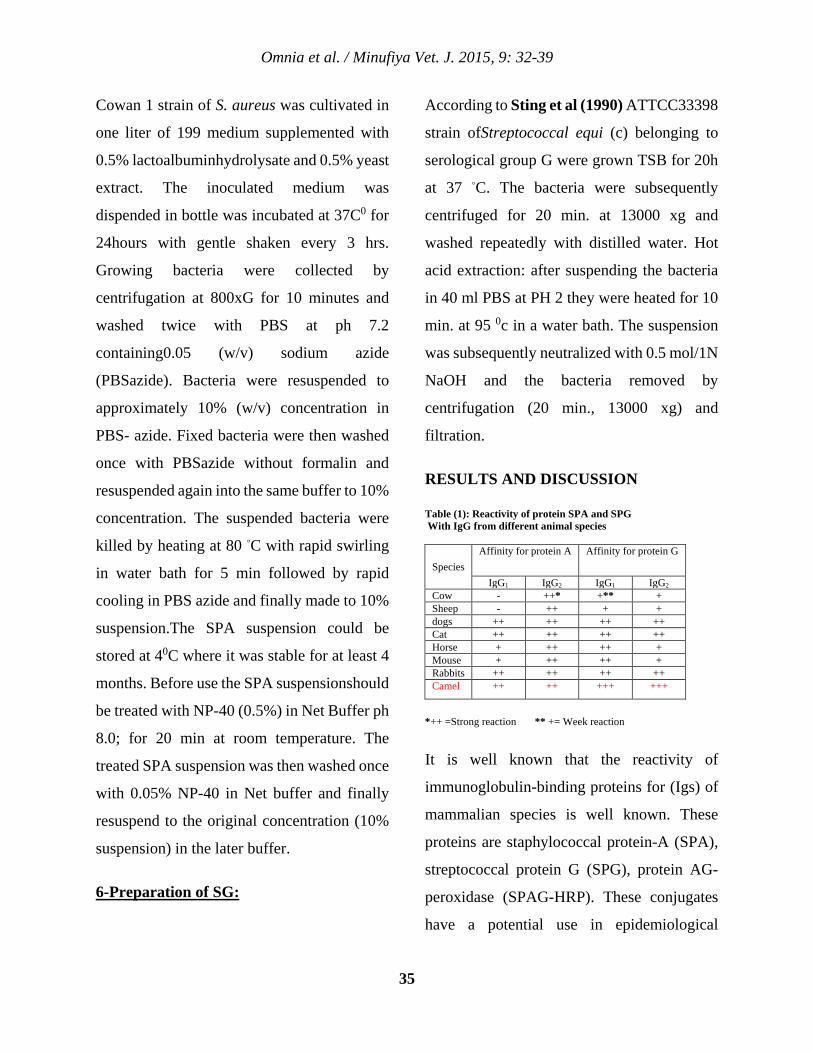
Omnia et al. / Minufiya Vet. J. 2015, 9: 32-39
35
Cowan 1 strain of S. aureus was cultivated in
one liter of 199 medium supplemented with
0.5% lactoalbuminhydrolysate and 0.5% yeast
extract. The inoculated medium was
dispended in bottle was incubated at 37C0 for
24hours with gentle shaken every 3 hrs.
Growing bacteria were collected by
centrifugation at 800xG for 10 minutes and
washed twice with PBS at ph 7.2
containing0.05 (w/v) sodium azide
(PBSazide). Bacteria were resuspended to
approximately 10% (w/v) concentration in
PBS- azide. Fixed bacteria were then washed
once with PBSazide without formalin and
resuspended again into the same buffer to 10%
concentration. The suspended bacteria were
killed by heating at 80 ◦C with rapid swirling
in water bath for 5 min followed by rapid
cooling in PBS azide and finally made to 10%
suspension.The SPA suspension could be
stored at 40C where it was stable for at least 4
months. Before use the SPA suspensionshould
be treated with NP-40 (0.5%) in Net Buffer ph
8.0; for 20 min at room temperature. The
treated SPA suspension was then washed once
with 0.05% NP-40 in Net buffer and finally
resuspend to the original concentration (10%
suspension) in the later buffer.
6-Preparation of SG:
According to Sting et al (1990) ATTCC33398
strain ofStreptococcal equi (c) belonging to
serological group G were grown TSB for 20h
at 37 ◦C. The bacteria were subsequently
centrifuged for 20 min. at 13000 xg and
washed repeatedly with distilled water. Hot
acid extraction: after suspending the bacteria
in 40 ml PBS at PH 2 they were heated for 10
min. at 95 0c in a water bath. The suspension
was subsequently neutralized with 0.5 mol/1N
NaOH and the bacteria removed by
centrifugation (20 min., 13000 xg) and
filtration.
RESULTS AND DISCUSSION
Table (1): Reactivity of protein SPA and SPG With IgG from different animal species
Species Affinity for protein A Affinity for protein G
IgG1 IgG2 IgG1 IgG2 Cow - ++* +** + Sheep - ++ + + dogs ++ ++ ++ ++ Cat ++ ++ ++ ++ Horse + ++ ++ + Mouse + ++ ++ + Rabbits ++ ++ ++ ++ Camel ++ ++ +++ +++
*++ =Strong reaction ** += Week reaction
It is well known that the reactivity of
immunoglobulin-binding proteins for (Igs) of
mammalian species is well known. These
proteins are staphylococcal protein-A (SPA),
streptococcal protein G (SPG), protein AG-
peroxidase (SPAG-HRP). These conjugates
have a potential use in epidemiological
Omnia et al. / Minufiya Vet. J. 2015, 9: 32-39
36
surveys of zoonotic infections (Angel Alberto
Justiz – Vaillant, 2013).
Recombinant protein A/G are reagents more
universal than protein A or G individually
labeled with horseradish peroxidase as a
detection reagent for the presumptive
diagnosis of brucellosis caused by smooth
brucellae in swine, sheep, goats and cattle as
well as for sheep, with antibody to rough
brucellae (Nielsen et al, 2004).
Elagamy et al. (1996) stated that camel blood
serum or milk IgG had high affinity to
proteine – A in addition to IGA did bind to
protein A.
It was concluded that the SPA-FA is highly
specific more than SPA-ELIZA that is highly
sensitive but the drawback of FA in diagnostic
reactions was showed in nonspecific reactions
this problem can be lightly dissolved by
adjusting the amount of conjugate with that of
SPA because heavily conjugation of protein
and FITC, can be reduced by reducing the
ratio of dye to protein, good dialysis leading to
the removal of excess amount of free dye,
further purification by sing chromatogeaphy
as well as using of acetone liver powder also
remove nonspecifically stained molecule
(Saad et al., 2000).
Hanaa et al. (2011) demonstrated that due to
the nature of SPA to bind with FC portion of
the most mammalian immunoglobulines class
G. Therefore, this protein has a good ability to
react with wide range of animal species
mainly when anti-immunoglouline not
available as in case of camel IgG.
It was concluded that protein G is bacterial
cell wall protein isolated from group G
streptococci, which bind to the Fc region of
IgG froma variety of mammalian species.
Native protein G has IgG binding domains.
For the tertiary structures of protein Aand
protein G are very similar, the potential
applications of protein G include nearly all of
current application of protein -A- compared to
protein A and G has greater affinity , ability
and binds more strongly for most mammalian
IgGs (Siano Biological, 2014)
Typical macroscopic patterns of positive and
negative coagulation reactions obtained by
interaction of the homogenate supernatants of
the skin biopsies (100%) with positive and
negative sera of rabbits against lumpy skin
disease virus. Staphylococcal protein – A
Coagulation was rapid (Carried out in 5-10
min) accurate, sensitive, specific and
economic and not require special equipment
(Iman and Saad, 2007).
Omnia et al. / Minufiya Vet. J. 2015, 9: 32-39
37
Iman et al. (2011) aggregated Rhabdoviral
particles coated with the specific antibody
were observed in addition to their attachment
to the surface staphylococcus aurous protein
A.
In addition Sigma showed that protein – A is
capable of binding to the Fc portion of
immunoglobulines, especially IgGs, from
large number of species. Protein - A is a highly
stable cell surface reseptor produced by
several stations of Staphylococcus aureus.
Protein A may be conjugated with various
receptor molecules, including fluorescent
(FITC), enzyme marker, (peroxidase without
affecting the antibody binding site on the
molecule.
SPA / SPG tests when compared with other
techniques would be cheaper taking into
consideration the price of the reagents
involved, which is low and the simplicity of
the technique. SPA/ SPG test do not require
the production of anti-serum. The SPG test
was the most sensitive test, followed by the
SPA test. SPG is superior as reagent (Vallant
et al., 2013)
It was suggested that the discovery of protein
A, and subsequently protein G , immune-
affinity Chromotography has ground in
popularity and is now the standard
methodology for the purification of antibodies
which many be implemented for selection of
different application such as
immunodiagnostics (Darcy et al., 2011)
Depending on the obtained results and in
agreement with Nielsen et al. (2004); it could
be concluded that Staphylocoocus aureus
Cowan strain and streptococcu spp. group G
are among a group of bacteria that produce
protein with capacity attach to
immunoglobuline molecules of various
species aiding to rapid detection of bacterial
and viral antigens and antibodies in order to
reach rapid control of infectious diseases
facing different live stocks.
REFERENCES
Aslam M. and Dent A. (1998):
Bioconjugation protein coupling techniques
for the biochemical sciences. Macmillan.Ref –
Ltd.U.K.
Alan J. and Rabinthorpe (1996): Coupling
antibodie to fluorochromes enzymes and
biotin preparation of S-
aureusadsorbent.Immuochem in practices 3rd
ED 277-279, 249-251.
Montassier, H. S.; Araujo, J., P. and Pnto,
A. (1994): Rapid coagglutinationtestfor the
detection and typing of foot and mouth disease
virus. J, VirolMeth.50:29-42.
Omnia et al. / Minufiya Vet. J. 2015, 9: 32-39
38
Angel Alberto Justiz–Vaillant (2013):
Preparation of universal peroxidase - labeled
bacterial protein conjugates and separation
properties. J.Chromatograph separate
technique vol. 4:6 (2013).
Narin, R. C. (1969): Fluorescent protein
tracing. 3rd Ed. Livingston Edinburgh and
London
Nielsen, K.; Smith, P.W.W; Niceletti, P,
Elzer, P; Vigliocco, A, Silva, P; Bermwdez,
R; Rentoeria, T; oMreno, F; Ruiz, A.;
Massengill, C; Muenks, Q; Kenny, K;
Tollerstud, T; Samartino L.; Conde, S;
Draghi, Ode Benitez, G; Gall, D,; Perez, B
and Rojas.(2004): Enzyme immunoassay for
the diagnosis of brucellosis: Chimeric Protein
A-protein G as a common enzyme labeled
detection reagent for sera from different
animal species. Vet. Microbiol. 101: 123-129
Sigma Product information: Protein –A.
from Staphylococusaureus. Saint- Louis.
Missouri USA Sigma – Aldrich.Com
Elagamy, E.I; Ruppanner, R; Ismail, A;
Champagne, C.P and Assaf, R (1996):
Purification and characterization of lactofer
In, Lactoperoxidase, lysozyme and
immunoglobulins from Camel´s
milk.International dairy journal vol.6, issue
2:129-145.
Cabel, M.J (1974): The direct fluorescent
antibody test for detection of brucellaabortus
in bovine abortion materials. J.Hyg. Camb.71:
123-129.
Iman, M.; Bastawecy and Saad, M.A.M
(2007): Staphylococcus aurous protein-A for
improving the performance of transmission
Electron Microscopy for rapid diagnosis of
lumpy skin disease 9th Sci. Cong.,Egyptian
Society for cattle disease, 2-4 Des. 2007
Assiut, Egypt.
Iman, M.; Bastawecy and Saad, M.A.M;
Abd El-Samee, A.A and Youssef, H.M
(2011): Electron microscopic characterization
of Bovine Ephemeral fever virus .Journal of
American Science 7(12).612-617.
Saad, M.A.M; EL- Nakashyly.S, Khodeir
M.H. and Daoud.A.M (2000): Production
and conjugation of staphylococcal protein "A"
"SPA" with fluoresceinisothirocyanate SPA-
FA and with peroxidase 'SPA"-ELISA" as a
non-species specific diagnostic
conjugates.9thSci.Cong.2000.Fac.Vet. Med,
Assiut Univ. Egypt.
Hanaa, A. M. Ghomeim, M. A., Saad M.,
Hala, A. Salem, Ibrahim. A. A (2011):
Staphylococcus aureus protein "A" as a rapid
and sensitive test in comparative with other
serological testes for detection of Rift Valley
Omnia et al. / Minufiya Vet. J. 2015, 9: 32-39
39
fever antibodies in vaccinated camels. Bs. vet.
Med.J.Vol.21 No.1 P.67-72
Sino Biological Inc. Biological Solution
Specialist: Affinity media: protein G resins.
WWW, Sinobiological.com catalogue
number: 13103. PNAERN.
Sting, R; Lauerman, L.L. and Blobel, H
(1990): Isolation of protein A and protein G
from the bacterial surface. Zbl.Bakt.273, 306-
312.
Vallant. A.A.J; Akaka.P.E; Norma M.A
and Smikle (2013): Use of Staphylococcal
protein-A and streptococcal protein-G for
detection Red blood cells (RBC) antibodies
and comparison with other techniques. British
Journal of Medicine nd Medical Research
3(4): 1671-1677, 2013.
Darcy E, Leomard P, Fitzgerald J Damaher
M, and Kemmedy R (2011): Purification of
antibodies using affinity chromatography. J.
Clin. Microbiol. 49 (2): 638-646
Hunter, W. H. and Greenwood, F.C.
(1962): Preparation of iodine 131 labelled
growth hormone of high specific activity
.nature (lond.) 194 (1962) 495-496.
40
Introduction
Chicken infectious anemia (CIA), a disease of
young chickens, is caused by a unique small
circular DNA virus (Yuasa et al., 1979, and
Goryo et al., 1987). Chicken anemia virus
(CAV) is considered a member of the genus
gyrovirus and the family circoviridae and an
immunosuppressive pathogen of chickens
(Pringle, 1999; Büchen-Osmond, 2006;
Clinicopathological studies on chicken infectious anemia disease live virus vaccines
Tamer S. Allam a, Nahed S. Saleh a*, Salah S. El-Ballal b and Hesham A. Sultan c
a Department of Clinicalpathology- Faculty of Veterinary Medicine – University of Sadat City- Egypt. b Department of Pathology - Faculty of Veterinary Medicine - University of Sadat City- Egypt. c Department of Poultry and Rabbit diseases - Faculty of Veterinary Medicine - University of Sadat City- Egypt. *Corresponding Author: [email protected] Accepted: 19/7/2015
Abstract: The present study aimed to shed light on the pathomechanism of chicken infectious anemia disease in chickens experimentally
vaccinated with live chicken anemia virus (CAV) -26P4 and -cux-1 strains through investigation of pathogenicity,
hematological, blood coagulation and blood biochemical serum parameters. At the75th day of age, 168 chickens were
divided randomly into 7 groups, each group contain 24 chickens. Group 1 was subjected to CAV-26P4 vaccinal
strain at 75 day of age. Group 2 was subjected to CAV-cux-1 vaccinal strain at 75 day of age. Group 3 was subjected
to CAV-26P4 vaccinal strain at 75 & 95 day of age. Group 4 was subjected to CAV-cux-1 vaccinal strain at 75 & 95 day
of age. Group 5 was subjected to CAV-26P4 vaccinal strain at 75 day of age and CAV-cux-1 vaccinal strain at 95 day of
age. Group 6 was subjected to CAV-cux-1 vaccinal strain at 75 day of age and CAV-26P4 vaccinal strain at 95 day of
age. Group 7 was not vaccinated (control). The present study revealed that live CAV-26P4 vaccinal strain inoculated by
intramuscular (i.m.) route developed clinical signs and PM lesions, while live CAV-cux-1 vaccinal strain inoculated by oral
route did not develop clinical signs but could develop mild PM lesions. Chicken anemia virus-26P4 and cux-1 vaccinal strains
cause a significant increase of enzyme linked immunosorbent assay (ELISA) titers mostly at the 5th & 6th weeks post
vaccination (PV). A significant anemia, leucopenia, heterophilia, lymphopenia, monocytopenia and thrombocytopenia were
observed. All these changes were observed early in birds inoculated with CAV-26P4 vaccinal strain, but were observed later
in birds inoculated with CAV-cux-1 vaccinal strain. Both CAV vaccinal strains caused a significant increase of coagulation
parameters, liver enzymes and A/G ratio, in addition to a significant hypoproteinemia, hypoglobuliemia. The observed
biochemical changes may indicate liver affection.
Keywords: Chicken anemia virus, Pathomechanism, Hematological parameter and ELISA.
Minufiya Veterinary Journal ISSN: 1110-9750
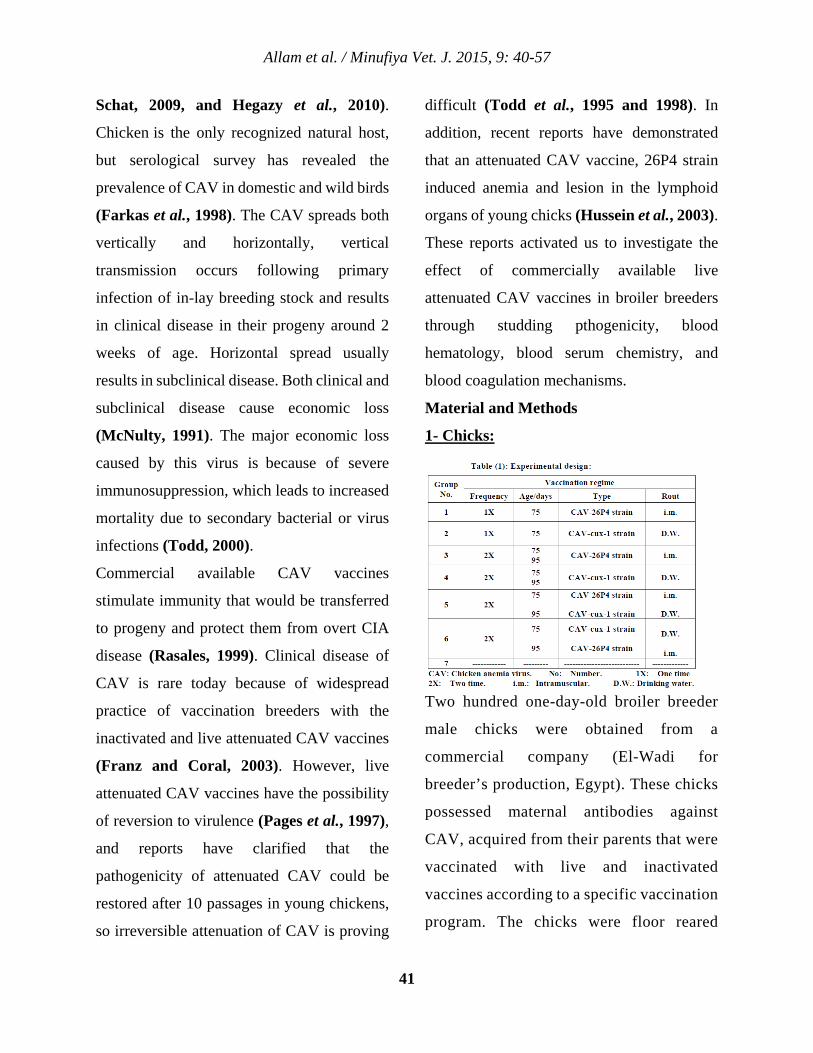
Allam et al. / Minufiya Vet. J. 2015, 9: 40-57
41
Schat, 2009, and Hegazy et al., 2010).
Chicken is the only recognized natural host,
but serological survey has revealed the
prevalence of CAV in domestic and wild birds
(Farkas et al., 1998). The CAV spreads both
vertically and horizontally, vertical
transmission occurs following primary
infection of in-lay breeding stock and results
in clinical disease in their progeny around 2
weeks of age. Horizontal spread usually
results in subclinical disease. Both clinical and
subclinical disease cause economic loss
(McNulty, 1991). The major economic loss
caused by this virus is because of severe
immunosuppression, which leads to increased
mortality due to secondary bacterial or virus
infections (Todd, 2000).
Commercial available CAV vaccines
stimulate immunity that would be transferred
to progeny and protect them from overt CIA
disease (Rasales, 1999). Clinical disease of
CAV is rare today because of widespread
practice of vaccination breeders with the
inactivated and live attenuated CAV vaccines
(Franz and Coral, 2003). However, live
attenuated CAV vaccines have the possibility
of reversion to virulence (Pages et al., 1997),
and reports have clarified that the
pathogenicity of attenuated CAV could be
restored after 10 passages in young chickens,
so irreversible attenuation of CAV is proving
difficult (Todd et al., 1995 and 1998). In
addition, recent reports have demonstrated
that an attenuated CAV vaccine, 26P4 strain
induced anemia and lesion in the lymphoid
organs of young chicks (Hussein et al., 2003).
These reports activated us to investigate the
effect of commercially available live
attenuated CAV vaccines in broiler breeders
through studding pthogenicity, blood
hematology, blood serum chemistry, and
blood coagulation mechanisms.
Material and Methods
1- Chicks:
Two hundred one-day-old broiler breeder
male chicks were obtained from a
commercial company (El-Wadi for
breeder’s production, Egypt). These chicks
possessed maternal antibodies against
CAV, acquired from their parents that were
vaccinated with live and inactivated
vaccines according to a specific vaccination
program. The chicks were floor reared
Allam et al. / Minufiya Vet. J. 2015, 9: 40-57
42
under natural day light in strictly isolated
experimental rooms, previously cleaned
and disinfected and were provided with
commercial starter ration. Water and feed
were provided adlibitum. Before
experimental study, chicks were vaccinated
with different vaccines obtained from the
local agencies. At 75 day of age, 168
chickens were divided randomly into 7
groups (table 1), each group contain 24
chickens. Chickens were subjected to CAV-
26P4 vaccinal strain at 75 or 95 day of age
by i.m. injection, 0.5 ml per bird and to
CAV-cux-1 vaccinal strain by drinking
water. The groups were observed weekly
for six weeks post vaccination (PV).
2- Blood samples:
Blood samples were obtained from shank
vein. Each Blood sample was divided into
two portions. The first one was placed into
tubes containing sodium citrate for
measuring coagulation parameters and
evaluation of hemogram. The second portion
was obtained in plain centrifuge tubes,
allowed to clot, centrifuged at 3000 rpm for
15 minutes for separation of serum for
determination of serum biochemical
parameters and serological studies.
3- Vaccines:
Two types of commercial live chicken
anemia virus (CAV) vaccines were used in
the study:
A- CAV-26P4 strain.
B- CAV-cux-1 strain.
Chicken anemia virus-26P4 and cux-1
strains are attenuated live freeze-dried
vaccines against chicken infectious anemia
disease, each dose contains ≥ 3.0 log10
TCID50 and min. 1045 TCID50,
respectively. They were administrated via
intramuscular and drinking water,
respectively, and were obtained from local
agency of Intervet and Lohman Animal
Health, respectively.
4- Hematological parameters:
The evaluated hematological parameters in the
study included estimation of the packed cell
volume (PCV) according to Campbell and
Coles (1986), Hemoglobin concentration (Hb)
according to Campbell (1988), Erythrocyte
and Leukocyte counts (RBCs & WBCs)
according to Natt and Herrick (1952),
Thrombocyte count according to Campbell
(1995) and Differential Leukocytic count
(DLC) according to Mulley (1979).
5- Coagulative parameters:
The evaluated coagulative parameters in the
study included estimation of Bleeding Time
(BT) according to Bigland (1964), Clotting
Time (CT) according to Benjamin (1978),
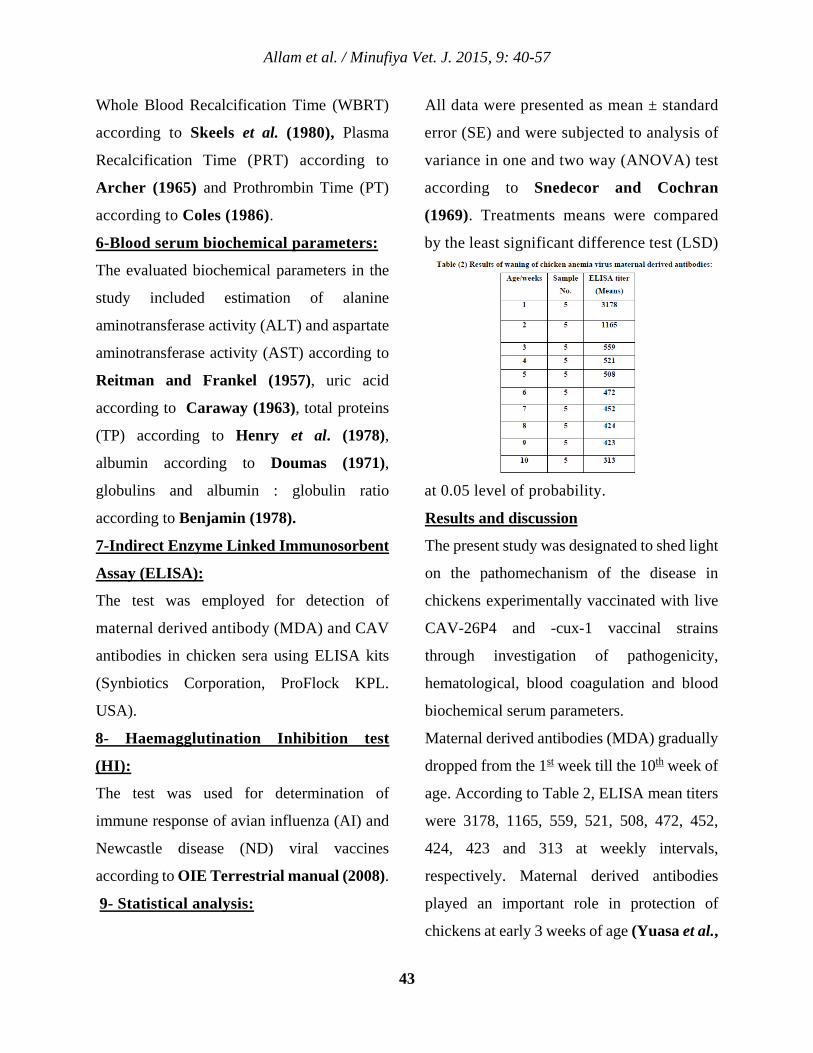
Allam et al. / Minufiya Vet. J. 2015, 9: 40-57
43
Whole Blood Recalcification Time (WBRT)
according to Skeels et al. (1980), Plasma
Recalcification Time (PRT) according to
Archer (1965) and Prothrombin Time (PT)
according to Coles (1986).
6-Blood serum biochemical parameters:
The evaluated biochemical parameters in the
study included estimation of alanine
aminotransferase activity (ALT) and aspartate
aminotransferase activity (AST) according to
Reitman and Frankel (1957), uric acid
according to Caraway (1963), total proteins
(TP) according to Henry et al. (1978),
albumin according to Doumas (1971),
globulins and albumin : globulin ratio
according to Benjamin (1978).
7-Indirect Enzyme Linked Immunosorbent
Assay (ELISA):
The test was employed for detection of
maternal derived antibody (MDA) and CAV
antibodies in chicken sera using ELISA kits
(Synbiotics Corporation, ProFlock KPL.
USA).
8- Haemagglutination Inhibition test
(HI):
The test was used for determination of
immune response of avian influenza (AI) and
Newcastle disease (ND) viral vaccines
according to OIE Terrestrial manual (2008).
9- Statistical analysis:
All data were presented as mean ± standard
error (SE) and were subjected to analysis of
variance in one and two way (ANOVA) test
according to Snedecor and Cochran
(1969). Treatments means were compared
by the least significant difference test (LSD)
at 0.05 level of probability.
Results and discussion
The present study was designated to shed light
on the pathomechanism of the disease in
chickens experimentally vaccinated with live
CAV-26P4 and -cux-1 vaccinal strains
through investigation of pathogenicity,
hematological, blood coagulation and blood
biochemical serum parameters.
Maternal derived antibodies (MDA) gradually
dropped from the 1st week till the 10th week of
age. According to Table 2, ELISA mean titers
were 3178, 1165, 559, 521, 508, 472, 452,
424, 423 and 313 at weekly intervals,
respectively. Maternal derived antibodies
played an important role in protection of
chickens at early 3 weeks of age (Yuasa et al.,
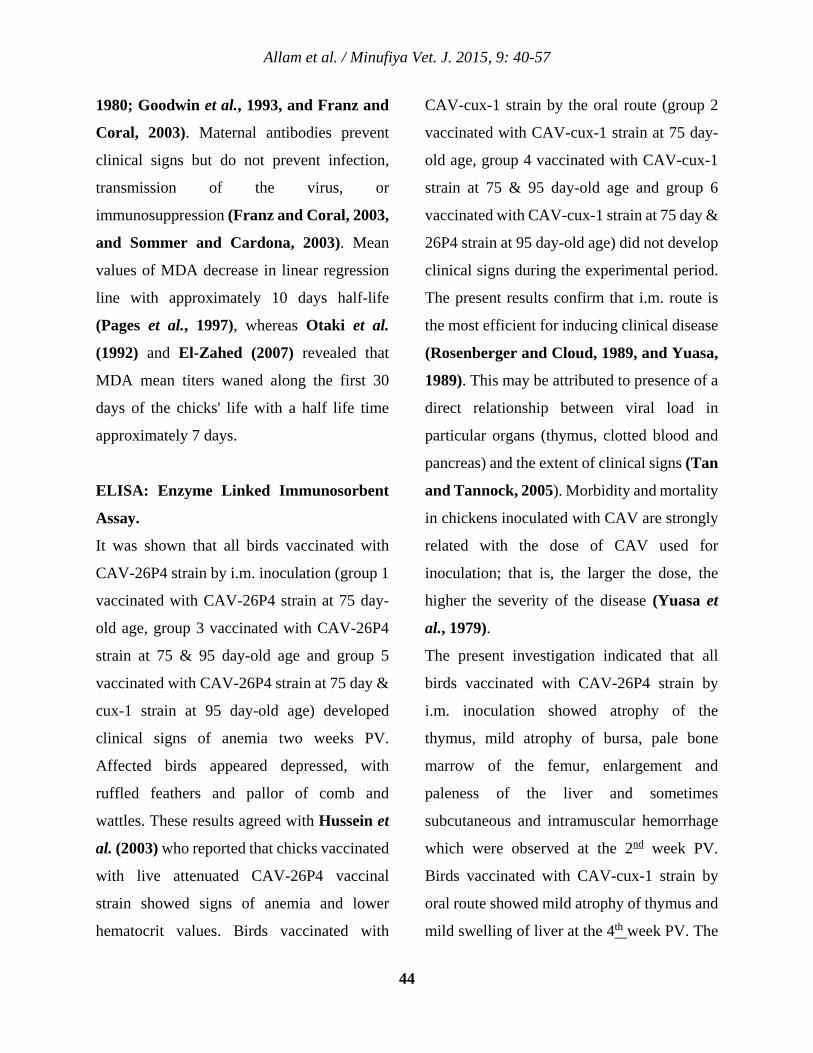
Allam et al. / Minufiya Vet. J. 2015, 9: 40-57
44
1980; Goodwin et al., 1993, and Franz and
Coral, 2003). Maternal antibodies prevent
clinical signs but do not prevent infection,
transmission of the virus, or
immunosuppression (Franz and Coral, 2003,
and Sommer and Cardona, 2003). Mean
values of MDA decrease in linear regression
line with approximately 10 days half-life
(Pages et al., 1997), whereas Otaki et al.
(1992) and El-Zahed (2007) revealed that
MDA mean titers waned along the first 30
days of the chicks' life with a half life time
approximately 7 days.
ELISA: Enzyme Linked Immunosorbent
Assay.
It was shown that all birds vaccinated with
CAV-26P4 strain by i.m. inoculation (group 1
vaccinated with CAV-26P4 strain at 75 day-
old age, group 3 vaccinated with CAV-26P4
strain at 75 & 95 day-old age and group 5
vaccinated with CAV-26P4 strain at 75 day &
cux-1 strain at 95 day-old age) developed
clinical signs of anemia two weeks PV.
Affected birds appeared depressed, with
ruffled feathers and pallor of comb and
wattles. These results agreed with Hussein et
al. (2003) who reported that chicks vaccinated
with live attenuated CAV-26P4 vaccinal
strain showed signs of anemia and lower
hematocrit values. Birds vaccinated with
CAV-cux-1 strain by the oral route (group 2
vaccinated with CAV-cux-1 strain at 75 day-
old age, group 4 vaccinated with CAV-cux-1
strain at 75 & 95 day-old age and group 6
vaccinated with CAV-cux-1 strain at 75 day &
26P4 strain at 95 day-old age) did not develop
clinical signs during the experimental period.
The present results confirm that i.m. route is
the most efficient for inducing clinical disease
(Rosenberger and Cloud, 1989, and Yuasa,
1989). This may be attributed to presence of a
direct relationship between viral load in
particular organs (thymus, clotted blood and
pancreas) and the extent of clinical signs (Tan
and Tannock, 2005). Morbidity and mortality
in chickens inoculated with CAV are strongly
related with the dose of CAV used for
inoculation; that is, the larger the dose, the
higher the severity of the disease (Yuasa et
al., 1979).
The present investigation indicated that all
birds vaccinated with CAV-26P4 strain by
i.m. inoculation showed atrophy of the
thymus, mild atrophy of bursa, pale bone
marrow of the femur, enlargement and
paleness of the liver and sometimes
subcutaneous and intramuscular hemorrhage
which were observed at the 2nd week PV.
Birds vaccinated with CAV-cux-1 strain by
oral route showed mild atrophy of thymus and
mild swelling of liver at the 4th week PV. The
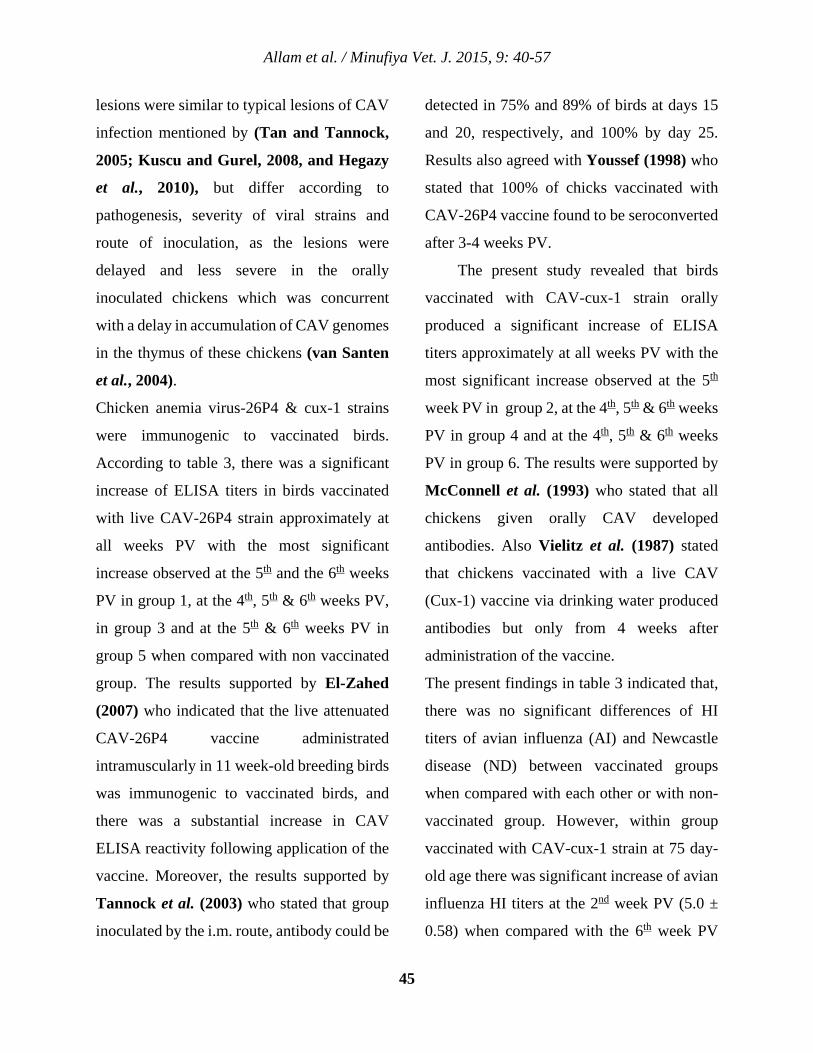
Allam et al. / Minufiya Vet. J. 2015, 9: 40-57
45
lesions were similar to typical lesions of CAV
infection mentioned by (Tan and Tannock,
2005; Kuscu and Gurel, 2008, and Hegazy
et al., 2010), but differ according to
pathogenesis, severity of viral strains and
route of inoculation, as the lesions were
delayed and less severe in the orally
inoculated chickens which was concurrent
with a delay in accumulation of CAV genomes
in the thymus of these chickens (van Santen
et al., 2004).
Chicken anemia virus-26P4 & cux-1 strains
were immunogenic to vaccinated birds.
According to table 3, there was a significant
increase of ELISA titers in birds vaccinated
with live CAV-26P4 strain approximately at
all weeks PV with the most significant
increase observed at the 5th and the 6th weeks
PV in group 1, at the 4th, 5th & 6th weeks PV,
in group 3 and at the 5th & 6th weeks PV in
group 5 when compared with non vaccinated
group. The results supported by El-Zahed
(2007) who indicated that the live attenuated
CAV-26P4 vaccine administrated
intramuscularly in 11 week-old breeding birds
was immunogenic to vaccinated birds, and
there was a substantial increase in CAV
ELISA reactivity following application of the
vaccine. Moreover, the results supported by
Tannock et al. (2003) who stated that group
inoculated by the i.m. route, antibody could be
detected in 75% and 89% of birds at days 15
and 20, respectively, and 100% by day 25.
Results also agreed with Youssef (1998) who
stated that 100% of chicks vaccinated with
CAV-26P4 vaccine found to be seroconverted
after 3-4 weeks PV.
The present study revealed that birds
vaccinated with CAV-cux-1 strain orally
produced a significant increase of ELISA
titers approximately at all weeks PV with the
most significant increase observed at the 5th
week PV in group 2, at the 4th, 5th & 6th weeks
PV in group 4 and at the 4th, 5th & 6th weeks
PV in group 6. The results were supported by
McConnell et al. (1993) who stated that all
chickens given orally CAV developed
antibodies. Also Vielitz et al. (1987) stated
that chickens vaccinated with a live CAV
(Cux-1) vaccine via drinking water produced
antibodies but only from 4 weeks after
administration of the vaccine.
The present findings in table 3 indicated that,
there was no significant differences of HI
titers of avian influenza (AI) and Newcastle
disease (ND) between vaccinated groups
when compared with each other or with non-
vaccinated group. However, within group
vaccinated with CAV-cux-1 strain at 75 day-
old age there was significant increase of avian
influenza HI titers at the 2nd week PV (5.0 ±
0.58) when compared with the 6th week PV
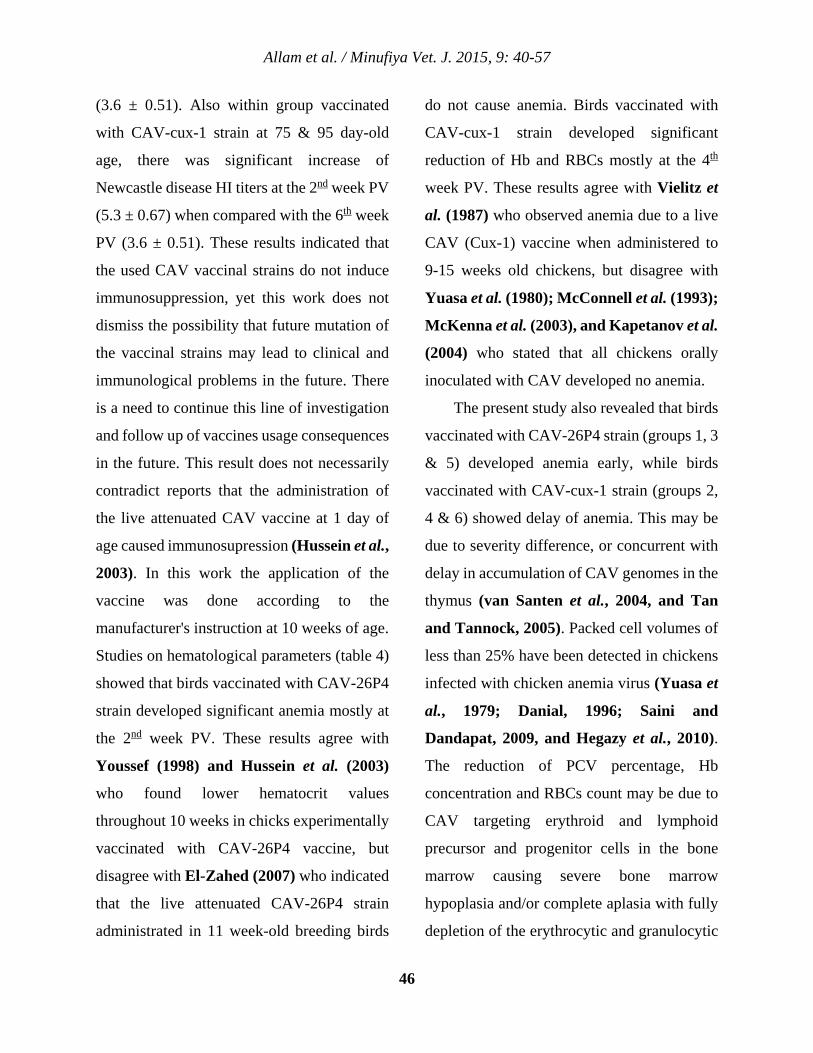
Allam et al. / Minufiya Vet. J. 2015, 9: 40-57
46
(3.6 ± 0.51). Also within group vaccinated
with CAV-cux-1 strain at 75 & 95 day-old
age, there was significant increase of
Newcastle disease HI titers at the 2nd week PV
(5.3 ± 0.67) when compared with the 6th week
PV (3.6 ± 0.51). These results indicated that
the used CAV vaccinal strains do not induce
immunosuppression, yet this work does not
dismiss the possibility that future mutation of
the vaccinal strains may lead to clinical and
immunological problems in the future. There
is a need to continue this line of investigation
and follow up of vaccines usage consequences
in the future. This result does not necessarily
contradict reports that the administration of
the live attenuated CAV vaccine at 1 day of
age caused immunosupression (Hussein et al.,
2003). In this work the application of the
vaccine was done according to the
manufacturer's instruction at 10 weeks of age.
Studies on hematological parameters (table 4)
showed that birds vaccinated with CAV-26P4
strain developed significant anemia mostly at
the 2nd week PV. These results agree with
Youssef (1998) and Hussein et al. (2003)
who found lower hematocrit values
throughout 10 weeks in chicks experimentally
vaccinated with CAV-26P4 vaccine, but
disagree with El-Zahed (2007) who indicated
that the live attenuated CAV-26P4 strain
administrated in 11 week-old breeding birds
do not cause anemia. Birds vaccinated with
CAV-cux-1 strain developed significant
reduction of Hb and RBCs mostly at the 4th
week PV. These results agree with Vielitz et
al. (1987) who observed anemia due to a live
CAV (Cux-1) vaccine when administered to
9-15 weeks old chickens, but disagree with
Yuasa et al. (1980); McConnell et al. (1993);
McKenna et al. (2003), and Kapetanov et al.
(2004) who stated that all chickens orally
inoculated with CAV developed no anemia.
The present study also revealed that birds
vaccinated with CAV-26P4 strain (groups 1, 3
& 5) developed anemia early, while birds
vaccinated with CAV-cux-1 strain (groups 2,
4 & 6) showed delay of anemia. This may be
due to severity difference, or concurrent with
delay in accumulation of CAV genomes in the
thymus (van Santen et al., 2004, and Tan
and Tannock, 2005). Packed cell volumes of
less than 25% have been detected in chickens
infected with chicken anemia virus (Yuasa et
al., 1979; Danial, 1996; Saini and
Dandapat, 2009, and Hegazy et al., 2010).
The reduction of PCV percentage, Hb
concentration and RBCs count may be due to
CAV targeting erythroid and lymphoid
precursor and progenitor cells in the bone
marrow causing severe bone marrow
hypoplasia and/or complete aplasia with fully
depletion of the erythrocytic and granulocytic
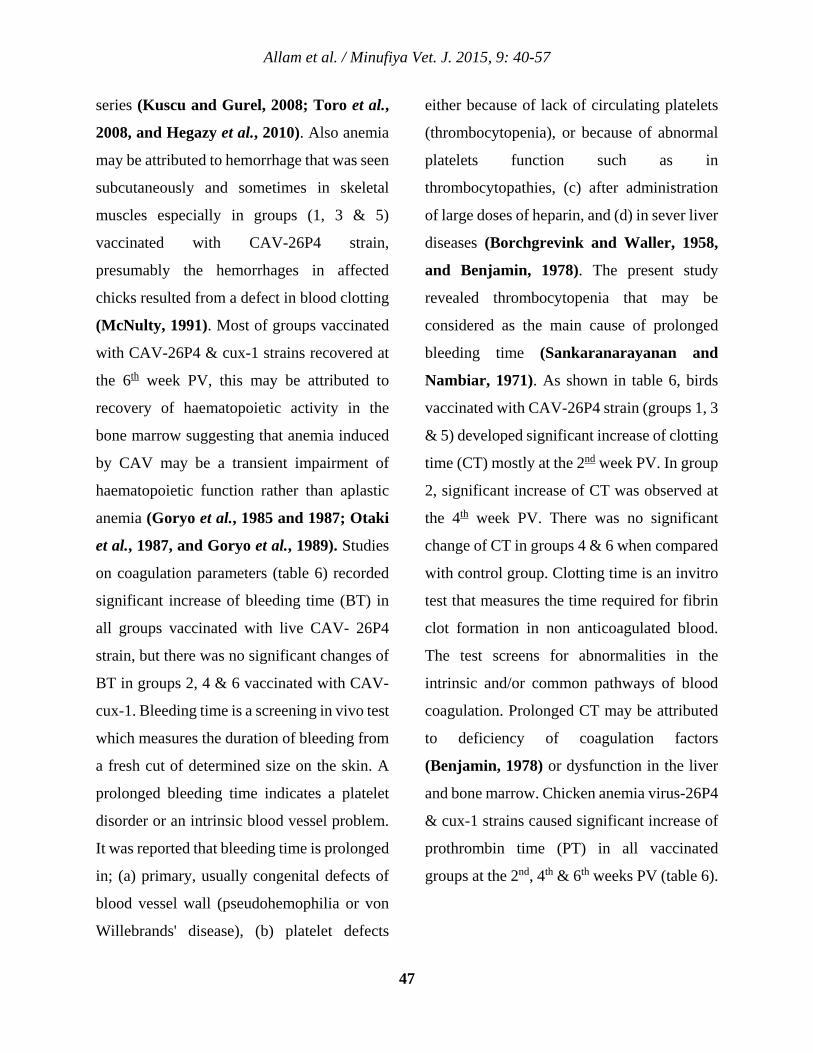
Allam et al. / Minufiya Vet. J. 2015, 9: 40-57
47
series (Kuscu and Gurel, 2008; Toro et al.,
2008, and Hegazy et al., 2010). Also anemia
may be attributed to hemorrhage that was seen
subcutaneously and sometimes in skeletal
muscles especially in groups (1, 3 & 5)
vaccinated with CAV-26P4 strain,
presumably the hemorrhages in affected
chicks resulted from a defect in blood clotting
(McNulty, 1991). Most of groups vaccinated
with CAV-26P4 & cux-1 strains recovered at
the 6th week PV, this may be attributed to
recovery of haematopoietic activity in the
bone marrow suggesting that anemia induced
by CAV may be a transient impairment of
haematopoietic function rather than aplastic
anemia (Goryo et al., 1985 and 1987; Otaki
et al., 1987, and Goryo et al., 1989). Studies
on coagulation parameters (table 6) recorded
significant increase of bleeding time (BT) in
all groups vaccinated with live CAV- 26P4
strain, but there was no significant changes of
BT in groups 2, 4 & 6 vaccinated with CAV-
cux-1. Bleeding time is a screening in vivo test
which measures the duration of bleeding from
a fresh cut of determined size on the skin. A
prolonged bleeding time indicates a platelet
disorder or an intrinsic blood vessel problem.
It was reported that bleeding time is prolonged
in; (a) primary, usually congenital defects of
blood vessel wall (pseudohemophilia or von
Willebrands' disease), (b) platelet defects
either because of lack of circulating platelets
(thrombocytopenia), or because of abnormal
platelets function such as in
thrombocytopathies, (c) after administration
of large doses of heparin, and (d) in sever liver
diseases (Borchgrevink and Waller, 1958,
and Benjamin, 1978). The present study
revealed thrombocytopenia that may be
considered as the main cause of prolonged
bleeding time (Sankaranarayanan and
Nambiar, 1971). As shown in table 6, birds
vaccinated with CAV-26P4 strain (groups 1, 3
& 5) developed significant increase of clotting
time (CT) mostly at the 2nd week PV. In group
2, significant increase of CT was observed at
the 4th week PV. There was no significant
change of CT in groups 4 & 6 when compared
with control group. Clotting time is an invitro
test that measures the time required for fibrin
clot formation in non anticoagulated blood.
The test screens for abnormalities in the
intrinsic and/or common pathways of blood
coagulation. Prolonged CT may be attributed
to deficiency of coagulation factors
(Benjamin, 1978) or dysfunction in the liver
and bone marrow. Chicken anemia virus-26P4
& cux-1 strains caused significant increase of
prothrombin time (PT) in all vaccinated
groups at the 2nd, 4th & 6th weeks PV (table 6).
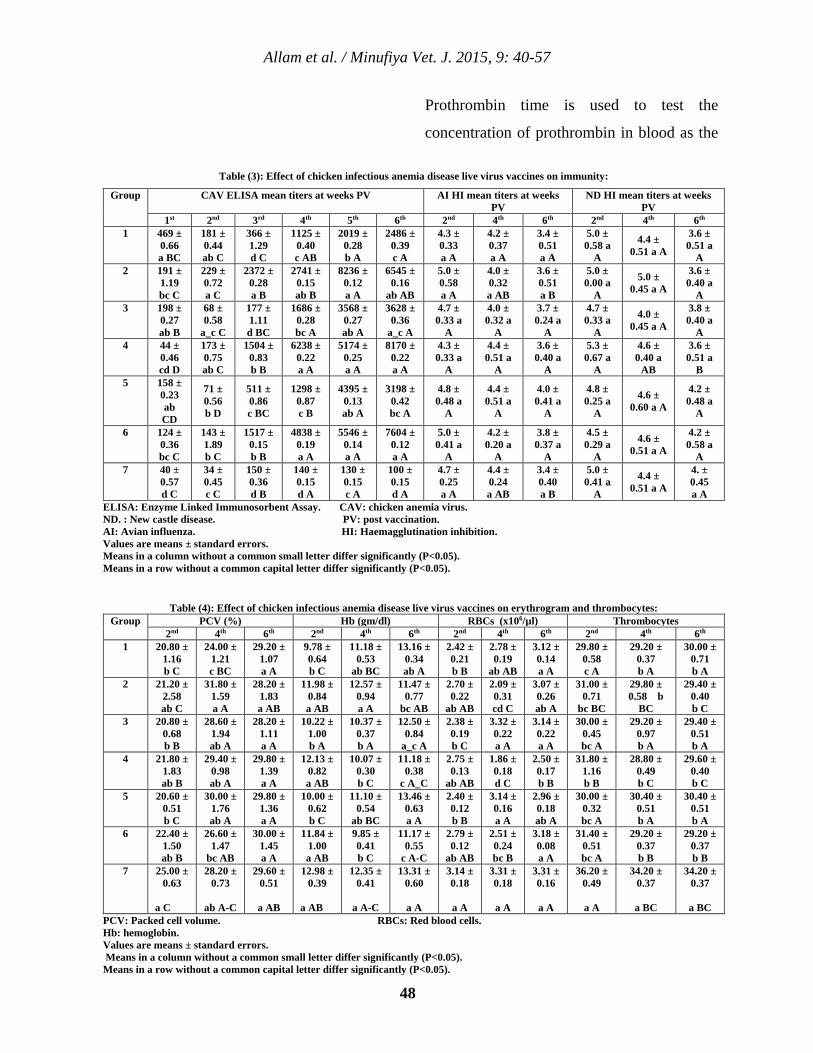
Allam et al. / Minufiya Vet. J. 2015, 9: 40-57
48
Prothrombin time is used to test the
concentration of prothrombin in blood as the
Table (3): Effect of chicken infectious anemia disease live virus vaccines on immunity:
ND HI mean titers at weeks PV
AI HI mean titers at weeks PV
CAV ELISA mean titers at weeks PV Group
6th 4th 2nd 6th 4th 2nd 6th 5th 4th 3rd 2nd 1st 3.6 ± 0.51 a
A
4.4 ± 0.51 a A
5.0 ± 0.58 a
A
3.4 ± 0.51 a A
4.2 ± 0.37 a A
4.3 ± 0.33 a A
2486 ± 0.39 c A
2019 ± 0.28 b A
1125 ± 0.40 c AB
366 ± 1.29 d C
181 ± 0.44 ab C
469 ± 0.66 a BC
1
3.6 ± 0.40 a
A
5.0 ± 0.45 a A
5.0 ± 0.00 a
A
3.6 ± 0.51 a B
4.0 ± 0.32 a AB
5.0 ± 0.58 a A
6545 ± 0.16
ab AB
8236 ± 0.12 a A
2741 ± 0.15 ab B
2372 ± 0.28 a B
229 ± 0.72 a C
191 ± 1.19 bc C
2
3.8 ± 0.40 a
A
4.0 ± 0.45 a A
4.7 ± 0.33 a
A
3.7 ± 0.24 a
A
4.0 ± 0.32 a
A
4.7 ± 0.33 a
A
3628 ± 0.36
a_c A
3568 ± 0.27 ab A
1686 ± 0.28 bc A
177 ± 1.11 d BC
68 ± 0.58
a_c C
198 ± 0.27 ab B
3
3.6 ± 0.51 a
B
4.6 ± 0.40 a
AB
5.3 ± 0.67 a
A
3.6 ± 0.40 a
A
4.4 ± 0.51 a
A
4.3 ± 0.33 a
A
8170 ± 0.22 a A
5174 ± 0.25 a A
6238 ± 0.22 a A
1504 ± 0.83 b B
173 ± 0.75 ab C
44 ± 0.46 cd D
4
4.2 ± 0.48 a
A
4.6 ± 0.60 a A
4.8 ± 0.25 a
A
4.0 ± 0.41 a
A
4.4 ± 0.51 a
A
4.8 ± 0.48 a
A
3198 ± 0.42 bc A
4395 ± 0.13 ab A
1298 ± 0.87 c B
511 ± 0.86 c BC
71 ± 0.56 b D
158 ± 0.23 ab CD
5
4.2 ± 0.58 a
A
4.6 ± 0.51 a A
4.5 ± 0.29 a
A
3.8 ± 0.37 a
A
4.2 ± 0.20 a
A
5.0 ± 0.41 a
A
7604 ± 0.12 a A
5546 ± 0.14 a A
4838 ± 0.19 a A
1517 ± 0.15 b B
143 ± 1.89 b C
124 ± 0.36 bc C
6
4. ± 0.45 a A
4.4 ± 0.51 a A
5.0 ± 0.41 a
A
3.4 ± 0.40 a B
4.4 ± 0.24 a AB
4.7 ± 0.25 a A
100 ± 0.15 d A
130 ± 0.15 c A
140 ± 0.15 d A
150 ± 0.36 d B
34 ± 0.45 c C
40 ± 0.57 d C
7
ELISA: Enzyme Linked Immunosorbent Assay. CAV: chicken anemia virus. ND. : New castle disease. PV: post vaccination. AI: Avian influenza. HI: Haemagglutination inhibition. Values are means ± standard errors. Means in a column without a common small letter differ significantly (P<0.05). Means in a row without a common capital letter differ significantly (P<0.05).
Table (4): Effect of chicken infectious anemia disease live virus vaccines on erythrogram and thrombocytes: Thrombocytes RBCs (x106/µl) Hb (gm/dl) PCV (%) Group
6th 4th 2nd 6th 4th 2nd 6th 4th 2nd 6th 4th 2nd 30.00 ±
0.71 b A
29.20 ± 0.37 b A
29.80 ± 0.58 c A
3.12 ± 0.14 a A
2.78 ± 0.19
ab AB
2.42 ± 0.21 b B
13.16 ± 0.34 ab A
11.18 ± 0.53
ab BC
9.78 ± 0.64 b C
29.20 ± 1.07 a A
24.00 ± 1.21 c BC
20.80 ± 1.16 b C
1
29.40 ± 0.40 b C
29.80 ± 0.58 b
BC
31.00 ± 0.71
bc BC
3.07 ± 0.26 ab A
2.09 ± 0.31 cd C
2.70 ± 0.22
ab AB
11.47 ± 0.77
bc AB
12.57 ± 0.94 a A
11.98 ± 0.84 a AB
28.20 ± 1.83 a AB
31.80 ± 1.59 a A
21.20 ± 2.58 ab C
2
29.40 ± 0.51 b A
29.20 ± 0.97 b A
30.00 ± 0.45 bc A
3.14 ± 0.22 a A
3.32 ± 0.22 a A
2.38 ± 0.19 b C
12.50 ± 0.84
a_c A
10.37 ± 0.37 b A
10.22 ± 1.00 b A
28.20 ± 1.11 a A
28.60 ± 1.94 ab A
20.80 ± 0.68 b B
3
29.60 ± 0.40 b C
28.80 ± 0.49 b C
31.80 ± 1.16 b B
2.50 ± 0.17 b B
1.86 ± 0.18 d C
2.75 ± 0.13
ab AB
11.18 ± 0.38
c A_C
10.07 ± 0.30 b C
12.13 ± 0.82 a AB
29.80 ± 1.39 a A
29.40 ± 0.98 ab A
21.80 ± 1.83 ab B
4
30.40 ± 0.51 b A
30.40 ± 0.51 b A
30.00 ± 0.32 bc A
2.96 ± 0.18 ab A
3.14 ± 0.16 a A
2.40 ± 0.12 b B
13.46 ± 0.63 a A
11.10 ± 0.54
ab BC
10.00 ± 0.62 b C
29.80 ± 1.36 a A
30.00 ± 1.76 ab A
20.60 ± 0.51 b C
5
29.20 ± 0.37 b B
29.20 ± 0.37 b B
31.40 ± 0.51 bc A
3.18 ± 0.08 a A
2.51 ± 0.24 bc B
2.79 ± 0.12
ab AB
11.17 ± 0.55
c A-C
9.85 ± 0.41 b C
11.84 ± 1.00 a AB
30.00 ± 1.45 a A
26.60 ± 1.47
bc AB
22.40 ± 1.50 ab B
6
34.20 ± 0.37
a BC
34.20 ± 0.37
a BC
36.20 ± 0.49
a A
3.31 ± 0.16
a A
3.31 ± 0.18
a A
3.14 ± 0.18
a A
13.31 ± 0.60
a A
12.35 ± 0.41
a A-C
12.98 ± 0.39
a AB
29.60 ± 0.51
a AB
28.20 ± 0.73
ab A-C
25.00 ± 0.63
a C
7
PCV: Packed cell volume. RBCs: Red blood cells. Hb: hemoglobin. Values are means ± standard errors. Means in a column without a common small letter differ significantly (P<0.05). Means in a row without a common capital letter differ significantly (P<0.05).
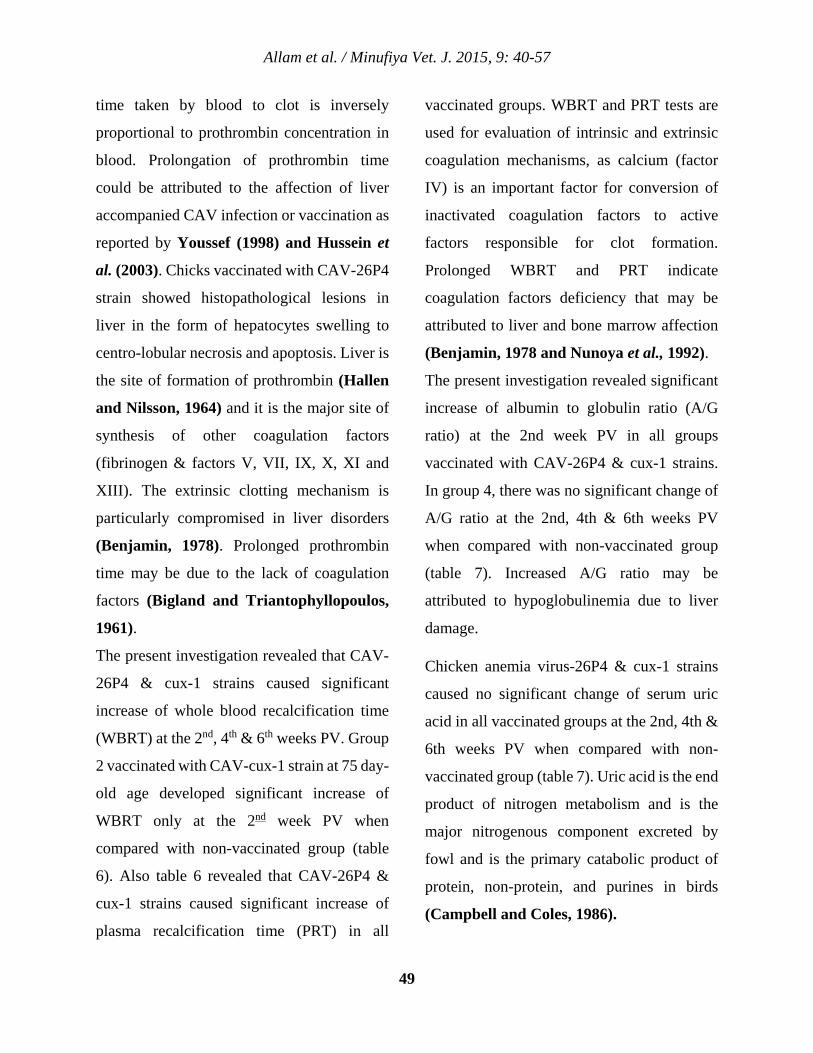
Allam et al. / Minufiya Vet. J. 2015, 9: 40-57
49
time taken by blood to clot is inversely
proportional to prothrombin concentration in
blood. Prolongation of prothrombin time
could be attributed to the affection of liver
accompanied CAV infection or vaccination as
reported by Youssef (1998) and Hussein et
al. (2003). Chicks vaccinated with CAV-26P4
strain showed histopathological lesions in
liver in the form of hepatocytes swelling to
centro-lobular necrosis and apoptosis. Liver is
the site of formation of prothrombin (Hallen
and Nilsson, 1964) and it is the major site of
synthesis of other coagulation factors
(fibrinogen & factors V, VII, IX, X, XI and
XIII). The extrinsic clotting mechanism is
particularly compromised in liver disorders
(Benjamin, 1978). Prolonged prothrombin
time may be due to the lack of coagulation
factors (Bigland and Triantophyllopoulos,
1961).
The present investigation revealed that CAV-
26P4 & cux-1 strains caused significant
increase of whole blood recalcification time
(WBRT) at the 2nd, 4th & 6th weeks PV. Group
2 vaccinated with CAV-cux-1 strain at 75 day-
old age developed significant increase of
WBRT only at the 2nd week PV when
compared with non-vaccinated group (table
6). Also table 6 revealed that CAV-26P4 &
cux-1 strains caused significant increase of
plasma recalcification time (PRT) in all
vaccinated groups. WBRT and PRT tests are
used for evaluation of intrinsic and extrinsic
coagulation mechanisms, as calcium (factor
IV) is an important factor for conversion of
inactivated coagulation factors to active
factors responsible for clot formation.
Prolonged WBRT and PRT indicate
coagulation factors deficiency that may be
attributed to liver and bone marrow affection
(Benjamin, 1978 and Nunoya et al., 1992).
The present investigation revealed significant
increase of albumin to globulin ratio (A/G
ratio) at the 2nd week PV in all groups
vaccinated with CAV-26P4 & cux-1 strains.
In group 4, there was no significant change of
A/G ratio at the 2nd, 4th & 6th weeks PV
when compared with non-vaccinated group
(table 7). Increased A/G ratio may be
attributed to hypoglobulinemia due to liver
damage.
Chicken anemia virus-26P4 & cux-1 strains
caused no significant change of serum uric
acid in all vaccinated groups at the 2nd, 4th &
6th weeks PV when compared with non-
vaccinated group (table 7). Uric acid is the end
product of nitrogen metabolism and is the
major nitrogenous component excreted by
fowl and is the primary catabolic product of
protein, non-protein, and purines in birds
(Campbell and Coles, 1986).
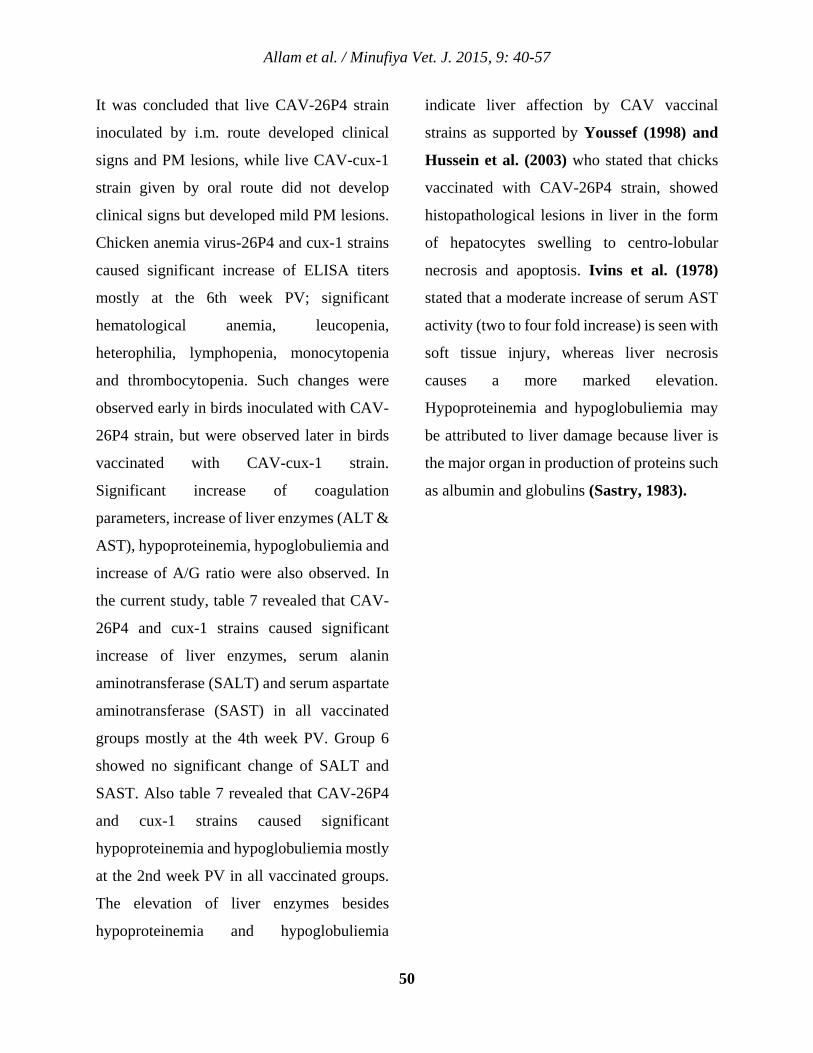
Allam et al. / Minufiya Vet. J. 2015, 9: 40-57
50
It was concluded that live CAV-26P4 strain
inoculated by i.m. route developed clinical
signs and PM lesions, while live CAV-cux-1
strain given by oral route did not develop
clinical signs but developed mild PM lesions.
Chicken anemia virus-26P4 and cux-1 strains
caused significant increase of ELISA titers
mostly at the 6th week PV; significant
hematological anemia, leucopenia,
heterophilia, lymphopenia, monocytopenia
and thrombocytopenia. Such changes were
observed early in birds inoculated with CAV-
26P4 strain, but were observed later in birds
vaccinated with CAV-cux-1 strain.
Significant increase of coagulation
parameters, increase of liver enzymes (ALT &
AST), hypoproteinemia, hypoglobuliemia and
increase of A/G ratio were also observed. In
the current study, table 7 revealed that CAV-
26P4 and cux-1 strains caused significant
increase of liver enzymes, serum alanin
aminotransferase (SALT) and serum aspartate
aminotransferase (SAST) in all vaccinated
groups mostly at the 4th week PV. Group 6
showed no significant change of SALT and
SAST. Also table 7 revealed that CAV-26P4
and cux-1 strains caused significant
hypoproteinemia and hypoglobuliemia mostly
at the 2nd week PV in all vaccinated groups.
The elevation of liver enzymes besides
hypoproteinemia and hypoglobuliemia
indicate liver affection by CAV vaccinal
strains as supported by Youssef (1998) and
Hussein et al. (2003) who stated that chicks
vaccinated with CAV-26P4 strain, showed
histopathological lesions in liver in the form
of hepatocytes swelling to centro-lobular
necrosis and apoptosis. Ivins et al. (1978)
stated that a moderate increase of serum AST
activity (two to four fold increase) is seen with
soft tissue injury, whereas liver necrosis
causes a more marked elevation.
Hypoproteinemia and hypoglobuliemia may
be attributed to liver damage because liver is
the major organ in production of proteins such
as albumin and globulins (Sastry, 1983).
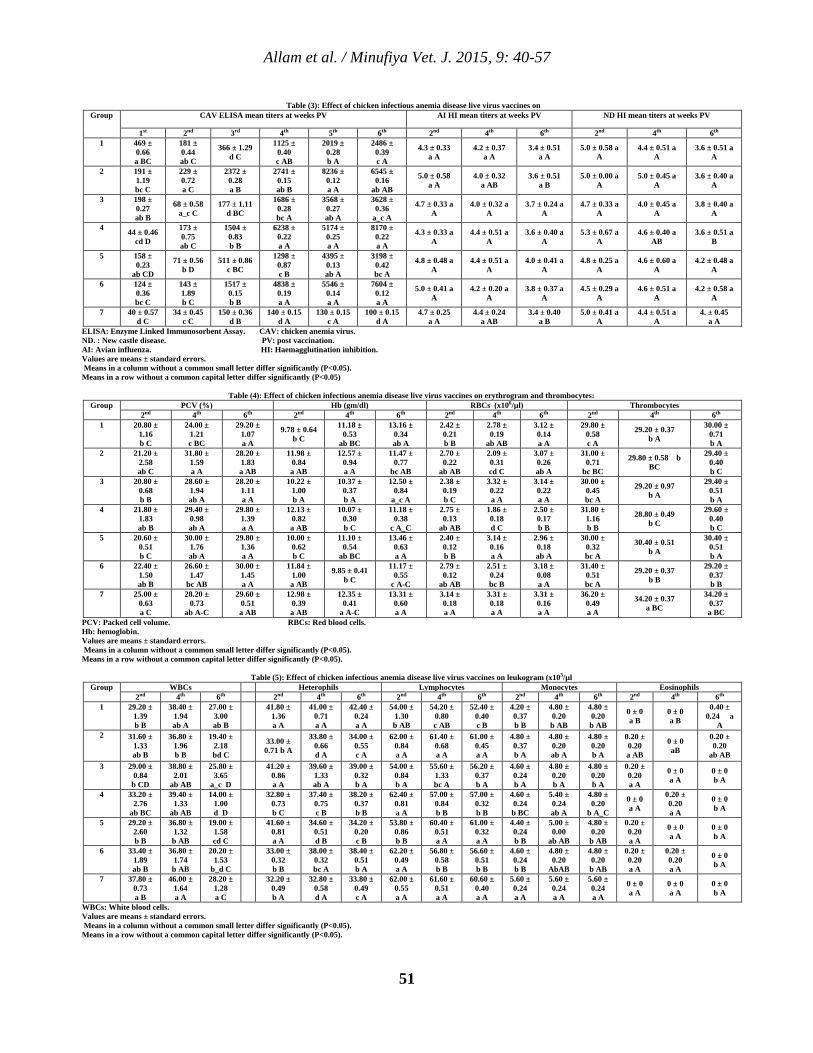
Allam et al. / Minufiya Vet. J. 2015, 9: 40-57
51
Table (3): Effect of chicken infectious anemia disease live virus vaccines on ND HI mean titers at weeks PV AI HI mean titers at weeks PV CAV ELISA mean titers at weeks PV Group
6th 4th 2nd 6th 4th 2nd 6th 5th 4th 3rd 2nd 1st
3.6 ± 0.51 a A
4.4 ± 0.51 a A
5.0 ± 0.58 a A
3.4 ± 0.51 a A
4.2 ± 0.37 a A
4.3 ± 0.33 a A
2486 ± 0.39 c A
2019 ± 0.28 b A
1125 ± 0.40 c AB
366 ± 1.29 d C
181 ± 0.44 ab C
469 ± 0.66 a BC
1
3.6 ± 0.40 a A
5.0 ± 0.45 a A
5.0 ± 0.00 a A
3.6 ± 0.51 a B
4.0 ± 0.32 a AB
5.0 ± 0.58 a A
6545 ± 0.16
ab AB
8236 ± 0.12 a A
2741 ± 0.15 ab B
2372 ± 0.28 a B
229 ± 0.72 a C
191 ± 1.19 bc C
2
3.8 ± 0.40 a A
4.0 ± 0.45 a A
4.7 ± 0.33 a A
3.7 ± 0.24 a A
4.0 ± 0.32 a A
4.7 ± 0.33 a A
3628 ± 0.36
a_c A
3568 ± 0.27 ab A
1686 ± 0.28 bc A
177 ± 1.11 d BC
68 ± 0.58 a_c C
198 ± 0.27 ab B
3
3.6 ± 0.51 a B
4.6 ± 0.40 a AB
5.3 ± 0.67 a A
3.6 ± 0.40 a A
4.4 ± 0.51 a A
4.3 ± 0.33 a A
8170 ± 0.22 a A
5174 ± 0.25 a A
6238 ± 0.22 a A
1504 ± 0.83 b B
173 ± 0.75 ab C
44 ± 0.46 cd D
4
4.2 ± 0.48 a A
4.6 ± 0.60 a A
4.8 ± 0.25 a A
4.0 ± 0.41 a A
4.4 ± 0.51 a A
4.8 ± 0.48 a A
3198 ± 0.42 bc A
4395 ± 0.13 ab A
1298 ± 0.87 c B
511 ± 0.86 c BC
71 ± 0.56 b D
158 ± 0.23
ab CD
5
4.2 ± 0.58 a A
4.6 ± 0.51 a A
4.5 ± 0.29 a A
3.8 ± 0.37 a A
4.2 ± 0.20 a A
5.0 ± 0.41 a A
7604 ± 0.12 a A
5546 ± 0.14 a A
4838 ± 0.19 a A
1517 ± 0.15 b B
143 ± 1.89 b C
124 ± 0.36 bc C
6
4. ± 0.45a A
4.4 ± 0.51 a A
5.0 ± 0.41 a A
3.4 ± 0.40 a B
4.4 ± 0.24 a AB
4.7 ± 0.25 a A
100 ± 0.15 d A
130 ± 0.15 c A
140 ± 0.15 d A
150 ± 0.36 d B
34 ± 0.45 c C
40 ± 0.57 d C
7
ELISA: Enzyme Linked Immunosorbent Assay. CAV: chicken anemia virus. ND. : New castle disease. PV: post vaccination. AI: Avian influenza. HI: Haemagglutination inhibition. Values are means ± standard errors. Means in a column without a common small letter differ significantly (P<0.05). Means in a row without a common capital letter differ significantly (P<0.05)
Table (4): Effect of chicken infectious anemia disease live virus vaccines on erythrogram and thrombocytes: Thrombocytes RBCs (x106/µl) Hb (gm/dl) PCV (%) Group
6th 4th 2nd 6th 4th 2nd 6th 4th 2nd 6th 4th 2nd 30.00 ±
0.71 b A
29.20 ± 0.37 b A
29.80 ± 0.58 c A
3.12 ± 0.14 a A
2.78 ± 0.19
ab AB
2.42 ± 0.21 b B
13.16 ± 0.34 ab A
11.18 ± 0.53
ab BC
9.78 ± 0.64 b C
29.20 ± 1.07 a A
24.00 ± 1.21 c BC
20.80 ± 1.16 b C
1
29.40 ± 0.40 b C
29.80 ± 0.58 b BC
31.00 ± 0.71
bc BC
3.07 ± 0.26 ab A
2.09 ± 0.31 cd C
2.70 ± 0.22
ab AB
11.47 ± 0.77
bc AB
12.57 ± 0.94 a A
11.98 ± 0.84 a AB
28.20 ± 1.83 a AB
31.80 ± 1.59 a A
21.20 ± 2.58 ab C
2
29.40 ± 0.51 b A
29.20 ± 0.97 b A
30.00 ± 0.45 bc A
3.14 ± 0.22 a A
3.32 ± 0.22 a A
2.38 ± 0.19 b C
12.50 ± 0.84
a_c A
10.37 ± 0.37 b A
10.22 ± 1.00 b A
28.20 ± 1.11 a A
28.60 ± 1.94 ab A
20.80 ± 0.68 b B
3
29.60 ± 0.40 b C
28.80 ± 0.49 b C
31.80 ± 1.16 b B
2.50 ± 0.17 b B
1.86 ± 0.18 d C
2.75 ± 0.13
ab AB
11.18 ± 0.38
c A_C
10.07 ± 0.30 b C
12.13 ± 0.82 a AB
29.80 ± 1.39 a A
29.40 ± 0.98 ab A
21.80 ± 1.83 ab B
4
30.40 ± 0.51 b A
30.40 ± 0.51 b A
30.00 ± 0.32 bc A
2.96 ± 0.18 ab A
3.14 ± 0.16 a A
2.40 ± 0.12 b B
13.46 ± 0.63 a A
11.10 ± 0.54
ab BC
10.00 ± 0.62 b C
29.80 ± 1.36 a A
30.00 ± 1.76 ab A
20.60 ± 0.51 b C
5
29.20 ± 0.37 b B
29.20 ± 0.37 b B
31.40 ± 0.51 bc A
3.18 ± 0.08 a A
2.51 ± 0.24 bc B
2.79 ± 0.12
ab AB
11.17 ± 0.55
c A-C
9.85 ± 0.41 b C
11.84 ± 1.00 a AB
30.00 ± 1.45 a A
26.60 ± 1.47
bc AB
22.40 ± 1.50 ab B
6
34.20 ± 0.37 a BC
34.20 ± 0.37 a BC
36.20 ± 0.49 a A
3.31 ± 0.16 a A
3.31 ± 0.18 a A
3.14 ± 0.18 a A
13.31 ± 0.60 a A
12.35 ± 0.41
a A-C
12.98 ± 0.39 a AB
29.60 ± 0.51 a AB
28.20 ± 0.73
ab A-C
25.00 ± 0.63 a C
7
PCV: Packed cell volume. RBCs: Red blood cells. Hb: hemoglobin. Values are means ± standard errors. Means in a column without a common small letter differ significantly (P<0.05). Means in a row without a common capital letter differ significantly (P<0.05).
Table (5): Effect of chicken infectious anemia disease live virus vaccines on leukogram (x103/µl Eosinophils Monocytes Lymphocytes Heterophils WBCs Group
6th 4th 2nd 6th 4th 2nd 6th 4th 2nd 6th 4th 2nd 6th 4th 2nd 0.40 ±
0.24 a A
0 ± 0 a B
0 ± 0 a B
4.80 ± 0.20 b AB
4.80 ± 0.20 b AB
4.20 ± 0.37 b B
52.40 ± 0.40 c B
54.20 ± 0.80 c AB
54.00 ± 1.30 b AB
42.40 ± 0.24 a A
41.00 ± 0.71 a A
41.80 ± 1.36 a A
27.00 ± 3.00 ab B
38.40 ± 1.94 ab A
29.20 ± 1.39 b B
1
0.20 ± 0.20
ab AB
0 ± 0 aB
0.20 ± 0.20 a AB
4.80 ± 0.20 b A
4.80 ± 0.20 ab A
4.80 ± 0.37 b A
61.00 ± 0.45 a A
61.40 ± 0.68 a A
62.00 ± 0.84 a A
34.00 ± 0.55 c A
33.80 ± 0.66 d A
33.00 ± 0.71 b A
19.40 ± 2.18 bd C
36.80 ± 1.96 b B
31.60 ± 1.33 ab B
2
0 ± 0 b A
0 ± 0 a A
0.20 ± 0.20 a A
4.80 ± 0.20 b A
4.80 ± 0.20 b A
4.60 ± 0.24 b A
56.20 ± 0.37 b A
55.60 ± 1.33 bc A
54.00 ± 0.84 b A
39.00 ± 0.32 b A
39.60 ± 1.33 ab A
41.20 ± 0.86 a A
25.80 ± 3.65
a_c D
38.80 ± 2.01
ab AB
29.00 ± 0.84 b CD
3
0 ± 0 b A
0.20 ± 0.20 a A
0 ± 0 a A
4.80 ± 0.20
b A_C
5.40 ± 0.24 ab A
4.60 ± 0.24 b BC
57.00 ± 0.32 b B
57.00 ± 0.84 b B
62.40 ± 0.81 a A
38.20 ± 0.37 b B
37.40 ± 0.75 c B
32.80 ± 0.73 b C
14.00 ± 1.00 d D
39.40 ± 1.33
ab AB
33.20 ± 2.76
ab BC
4
0 ± 0 b A
0 ± 0 a A
0.20 ± 0.20 a A
4.80 ± 0.20 b AB
5.00 ± 0.00
ab AB
4.40 ± 0.24 b B
61.00 ± 0.32 a A
60.40 ± 0.51 a A
53.80 ± 0.86 b B
34.20 ± 0.20 c B
34.60 ± 0.51 d B
41.60 ± 0.81 a A
19.00 ± 1.58 cd C
36.80 ± 1.32 b AB
29.20 ± 2.60 b B
5
0 ± 0 b A
0.20 ± 0.20 a A
0.20 ± 0.20 a A
4.80 ± 0.20 b AB
4.80 ± 0.20
AbAB
4.60 ± 0.24 b B
56.60 ± 0.51 b B
56.80 ± 0.58 b B
62.20 ± 0.49 a A
38.40 ± 0.51 b A
38.00 ± 0.32 bc A
33.00 ± 0.32 b B
20.20 ± 1.53
b_d C
36.80 ± 1.74 b AB
33.40 ± 1.89 ab B
6
0 ± 0 b A
0 ± 0 a A
0 ± 0 a A
5.60 ± 0.24 a A
5.60 ± 0.24 a A
5.60 ± 0.24 a A
60.60 ± 0.40 a A
61.60 ± 0.51 a A
62.00 ± 0.55 a A
33.80 ± 0.49 c A
32.80 ± 0.58 d A
32.20 ± 0.49 b A
28.20 ± 1.28 a C
46.00 ± 1.64 a A
37.80 ± 0.73 a B
7
WBCs: White blood cells. Values are means ± standard errors. Means in a column without a common small letter differ significantly (P<0.05). Means in a row without a common capital letter differ significantly (P<0.05).
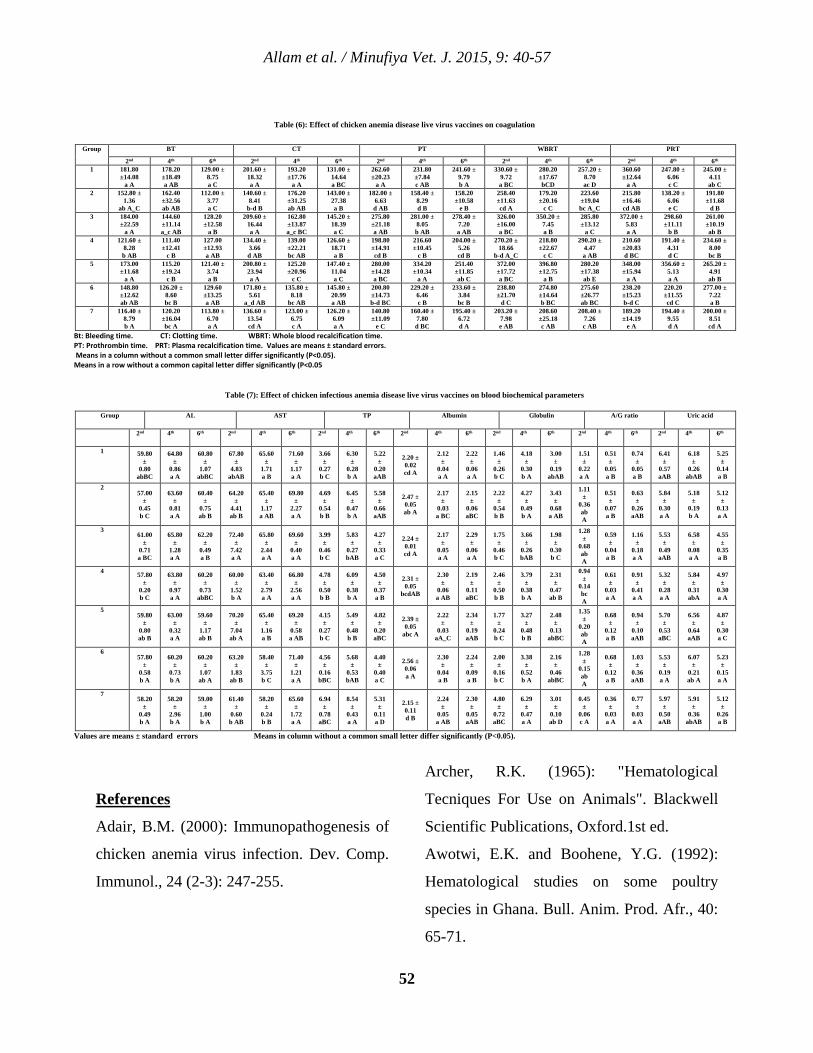
Allam et al. / Minufiya Vet. J. 2015, 9: 40-57
52
References
Adair, B.M. (2000): Immunopathogenesis of
chicken anemia virus infection. Dev. Comp.
Immunol., 24 (2-3): 247-255.
Archer, R.K. (1965): "Hematological
Tecniques For Use on Animals". Blackwell
Scientific Publications, Oxford.1st ed.
Awotwi, E.K. and Boohene, Y.G. (1992):
Hematological studies on some poultry
species in Ghana. Bull. Anim. Prod. Afr., 40:
65-71.
Table (6): Effect of chicken anemia disease live virus vaccines on coagulation
PRT WBRT PT CT BT Group
6th 4th 2nd 6th 4th 2nd 6th 4th 2nd 6th 4th 2nd 6th 4th 2nd 245.00 ±
4.11 ab C
247.80 ± 6.06 c C
360.60 ±12.64
a A
257.20 ± 8.70 ac D
280.20 ±17.67 bCD
330.60 ± 9.72 a BC
241.60 ± 9.79 b A
231.80 ±7.84 c AB
262.60 ±20.23
a A
131.00 ± 14.64 a BC
193.20 ±17.76
a A
201.60 ± 18.32 a A
129.00 ± 8.75 a C
178.20 ±18.49 a AB
181.80 ±14.08
a A
1
191.80 ±11.68
d B
138.20 ± 6.06 e C
215.80 ±16.46 cd AB
223.60 ±19.04 bc A_C
179.20 ±20.16
c C
258.40 ±11.63 cd A
158.20 ±10.58
e B
158.40 ± 8.29 d B
182.00 ± 6.63 d AB
143.00 ± 27.38 a B
176.20 ±31.25 ab AB
140.60 ± 8.41
b-d B
112.00 ± 3.77 a C
162.40 ±32.56 ab AB
152.80 ± 1.36
ab A_C
2
261.00 ±10.19 ab B
298.60 ±11.11
b B
372.00 ± 5.83 a A
285.80 ±13.12
a C
350.20 ± 7.45 a B
326.00 ±16.00 a BC
278.40 ± 7.20 a AB
281.00 ± 8.05 b AB
275.80 ±21.18 a AB
145.20 ± 18.39 a C
162.80 ±13.87 a_c BC
209.60 ± 16.44 a A
128.20 ±12.58
a B
144.60 ±11.14 a_c AB
184.00 ±22.59
a A
3
234.60 ± 8.00 bc B
191.40 ± 4.31 d C
210.60 ±20.83 d BC
290.20 ± 4.47 a AB
218.80 ±22.67
c C
270.20 ± 18.66
b-d A_C
204.00 ± 5.26 cd B
216.60 ±10.45
c B
198.80 ±14.91 cd B
126.60 ± 18.71 a B
139.00 ±22.21 bc AB
134.40 ± 3.66 d AB
127.00 ±12.93 a AB
111.40 ±12.41
c B
121.60 ± 8.28 b AB
4
265.20 ± 4.91 ab B
356.60 ± 5.13 a A
348.00 ±15.94
a A
280.20 ±17.38 ab E
396.80 ±12.75
a B
372.00 ±17.72 a BC
251.40 ±11.85 ab C
334.20 ±10.34
a A
280.00 ±14.28 a BC
147.40 ± 11.04 a C
125.20 ±20.96
c C
200.80 ± 23.94 a A
121.40 ± 3.74 a B
115.20 ±19.24
c B
173.00 ±11.68
a A
5
277.00 ± 7.22 a B
220.20 ±11.55 cd C
238.20 ±15.23 b-d C
275.60 ±26.77 ab BC
274.80 ±14.64 b BC
238.80 ±21.70
d C
233.60 ± 3.84 bc B
229.20 ± 6.46 c B
200.80 ±14.73 b-d BC
145.80 ± 20.99 a AB
135.80 ± 8.18
bc AB
171.80 ± 5.61
a_d AB
129.60 ±13.25 a AB
126.20 ± 8.60 bc B
148.80 ±12.62 ab AB
6
200.00 ± 8.51 cd A
194.40 ± 9.55 d A
189.20 ±14.19
e A
208.40 ± 7.26 c AB
208.60 ±25.18 c AB
203.20 ± 7.98 e AB
195.40 ± 6.72 d A
160.40 ± 7.80 d BC
140.80 ±11.09
e C
126.20 ± 6.09 a A
123.00 ± 6.75 c A
136.60 ± 13.54 cd A
113.80 ± 6.70 a A
120.20 ±16.04 bc A
116.40 ± 8.79 b A
7
Bt: Bleeding time. CT: Clotting time. WBRT: Whole blood recalcification time. PT: Prothrombin time. PRT: Plasma recalcification time. Values are means ± standard errors. Means in a column without a common small letter differ significantly (P<0.05). Means in a row without a common capital letter differ significantly (P<0.05
Table (7): Effect of chicken infectious anemia disease live virus vaccines on blood biochemical parameters
Uric acid A/G ratio Globulin Albumin TP AST AL Group
6th 4th 2nd 6th 4th 2nd 6th 4th 2nd 6th 4th 2nd 6th 4th 2nd 6th 4th 2nd 6th 4th 2nd
5.25 ±
0.14 a B
6.18 ±
0.26 abAB
6.41 ±
0.57 aAB
0.74 ±
0.05 a B
0.51 ±
0.05 a B
1.51 ±
0.22 a A
3.00 ±
0.19 abAB
4.18 ±
0.30 b A
1.46 ±
0.26 b C
2.22 ±
0.06 a A
2.12 ±
0.04 a A
2.20 ± 0.02 cd A
5.22 ±
0.20 aAB
6.30 ±
0.28 b A
3.66 ±
0.27 b C
71.60 ±
1.17 a A
65.60 ±
1.71 a B
67.80 ±
4.83 abAB
60.80 ±
1.07 abBC
64.80 ±
0.86 a A
59.80 ±
0.80 abBC
1
5.12 ±
0.13 a A
5.18 ±
0.19 b A
5.84 ±
0.30 a A
0.63 ±
0.26 aAB
0.51 ±
0.07 a B
1.11 ±
0.36 ab A
3.43 ±
0.68 a AB
4.27 ±
0.49 b A
2.22 ±
0.54 b B
2.15 ±
0.06 aBC
2.17 ±
0.03 a BC
2.47 ± 0.05 ab A
5.58 ±
0.66 aAB
6.45 ±
0.47 b A
4.69 ±
0.54 b B
69.80 ±
2.27 a A
65.40 ±
1.17 a AB
64.20 ±
4.41 ab B
60.40 ±
0.75 ab B
63.60 ±
0.81 a A
57.00 ±
0.45 b C
2
4.55 ±
0.35 a B
6.58 ±
0.08 a A
5.53 ±
0.49 aAB
1.16 ±
0.18 a A
0.59 ±
0.04 a B
1.28 ±
0.68 ab A
1.98 ±
0.30 b C
3.66 ±
0.26 bAB
1.75 ±
0.46 b C
2.29 ±
0.06 a A
2.17 ±
0.05 a A
2.24 ± 0.01 cd A
4.27 ±
0.33 a C
5.83 ±
0.27 bAB
3.99 ±
0.46 b C
69.60 ±
0.40 a A
65.80 ±
2.44 a A
72.40 ±
7.42 a A
62.20 ±
0.49 a B
65.80 ±
1.28 a A
61.00 ±
0.71 a BC
3
4.97 ±
0.30 a A
5.84 ±
0.31 abA
5.32 ±
0.28 a A
0.91 ±
0.41 a A
0.61 ±
0.03 a A
0.94 ±
0.14 bc A
2.31 ±
0.47 ab B
3.79 ±
0.38 b A
2.46 ±
0.50 b B
2.19 ±
0.11 aBC
2.30 ±
0.06 a AB
2.31 ± 0.05
bcdAB
4.50 ±
0.37 a B
6.09 ±
0.38 b A
4.78 ±
0.50 b B
66.80 ±
2.56 a A
63.40 ±
2.79 a A
60.00 ±
1.52 b A
60.20 ±
0.73 abBC
63.80 ±
0.97 a A
57.80 ±
0.20 b C
4
4.87 ±
0.30 a C
6.56 ±
0.64 aAB
5.70 ±
0.53 aBC
0.94 ±
0.10 aAB
0.68 ±
0.12 a B
1.35 ±
0.20 ab A
2.48 ±
0.13 abBC
3.27 ±
0.48 b B
1.77 ±
0.24 b C
2.34 ±
0.19 aAB
2.22 ±
0.03 aA_C
2.39 ± 0.05
abc A
4.82 ±
0.20 aBC
5.49 ±
0.48 b B
4.15 ±
0.27 b C
69.20 ±
0.58 a AB
65.40 ±
1.16 a B
70.20 ±
7.04 ab A
59.60 ±
1.17 ab B
63.00 ±
0.32 a A
59.80 ±
0.80 ab B
5
5.23 ±
0.15 a A
6.07 ±
0.21 ab A
5.53 ±
0.19 a A
1.03 ±
0.36 aAB
0.68 ±
0.12 a B
1.28 ±
0.15 ab A
2.16 ±
0.46 abBC
3.38 ±
0.52 b A
2.00 ±
0.16 b C
2.24 ±
0.09 a B
2.30 ±
0.04 a B
2.56 ± 0.06 a A
4.40 ±
0.40 a C
5.68 ±
0.53 bAB
4.56 ±
0.16 bBC
71.40 ±
1.21 a A
58.40 ±
3.75 b C
63.20 ±
1.83 ab B
60.20 ±
1.07 ab A
60.20 ±
0.73 b A
57.80 ±
0.58 b A
6
5.12 ±
0.26 a B
5.91 ±
0.36 abAB
5.97 ±
0.50 aAB
0.77 ±
0.03 a A
0.36 ±
0.03 a A
0.45 ±
0.06 c A
3.01 ±
0.10 ab D
6.29 ±
0.47 a A
4.80 ±
0.72 aBC
2.30 ±
0.05 aAB
2.24 ±
0.05 a AB
2.15 ± 0.11 d B
5.31 ±
0.11 a D
8.54 ±
0.43 a A
6.94 ±
0.78 aBC
65.60 ±
1.72 a A
58.20 ±
0.24 b B
61.40 ±
0.60 b AB
59.00 ±
1.00 b A
58.20 ±
2.96 b A
58.20 ±
0.49 b A
7
Values are means ± standard errors Means in column without a common small letter differ significantly (P<0.05).
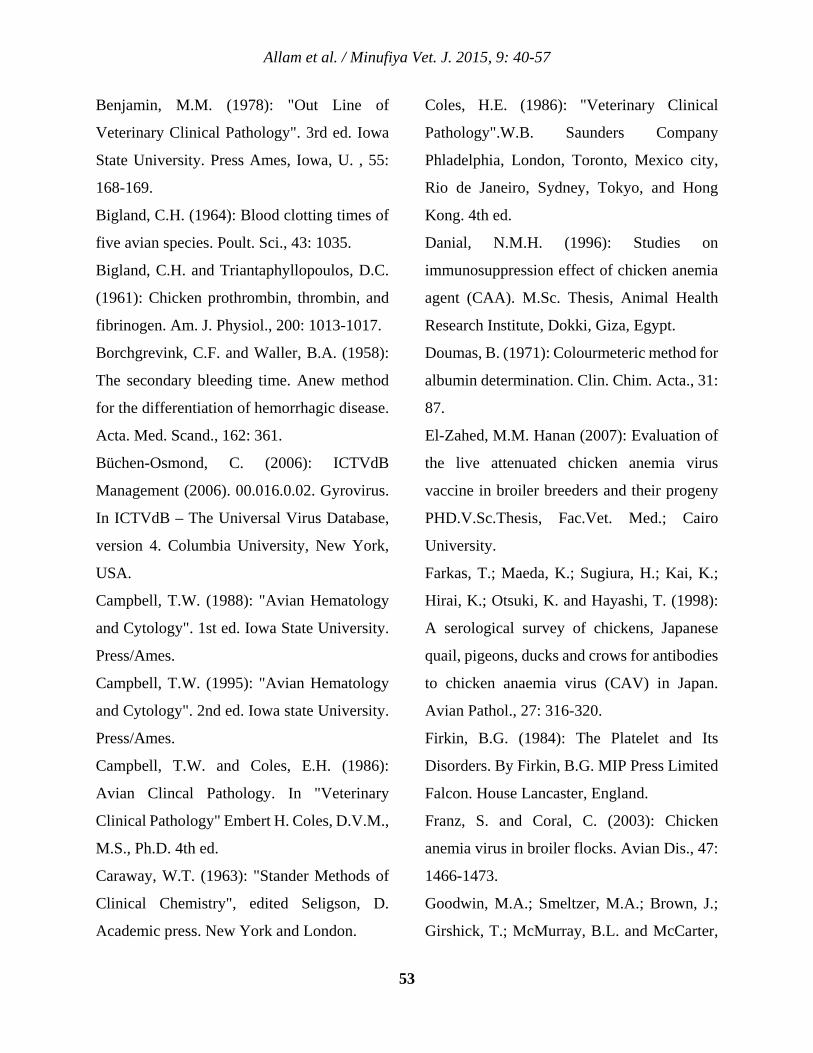
Allam et al. / Minufiya Vet. J. 2015, 9: 40-57
53
Benjamin, M.M. (1978): "Out Line of
Veterinary Clinical Pathology". 3rd ed. Iowa
State University. Press Ames, Iowa, U. , 55:
168-169.
Bigland, C.H. (1964): Blood clotting times of
five avian species. Poult. Sci., 43: 1035.
Bigland, C.H. and Triantaphyllopoulos, D.C.
(1961): Chicken prothrombin, thrombin, and
fibrinogen. Am. J. Physiol., 200: 1013-1017.
Borchgrevink, C.F. and Waller, B.A. (1958):
The secondary bleeding time. Anew method
for the differentiation of hemorrhagic disease.
Acta. Med. Scand., 162: 361.
Büchen-Osmond, C. (2006): ICTVdB
Management (2006). 00.016.0.02. Gyrovirus.
In ICTVdB – The Universal Virus Database,
version 4. Columbia University, New York,
USA.
Campbell, T.W. (1988): "Avian Hematology
and Cytology". 1st ed. Iowa State University.
Press/Ames.
Campbell, T.W. (1995): "Avian Hematology
and Cytology". 2nd ed. Iowa state University.
Press/Ames.
Campbell, T.W. and Coles, E.H. (1986):
Avian Clincal Pathology. In "Veterinary
Clinical Pathology" Embert H. Coles, D.V.M.,
M.S., Ph.D. 4th ed.
Caraway, W.T. (1963): "Stander Methods of
Clinical Chemistry", edited Seligson, D.
Academic press. New York and London.
Coles, H.E. (1986): "Veterinary Clinical
Pathology".W.B. Saunders Company
Phladelphia, London, Toronto, Mexico city,
Rio de Janeiro, Sydney, Tokyo, and Hong
Kong. 4th ed.
Danial, N.M.H. (1996): Studies on
immunosuppression effect of chicken anemia
agent (CAA). M.Sc. Thesis, Animal Health
Research Institute, Dokki, Giza, Egypt.
Doumas, B. (1971): Colourmeteric method for
albumin determination. Clin. Chim. Acta., 31:
87.
El-Zahed, M.M. Hanan (2007): Evaluation of
the live attenuated chicken anemia virus
vaccine in broiler breeders and their progeny
PHD.V.Sc.Thesis, Fac.Vet. Med.; Cairo
University.
Farkas, T.; Maeda, K.; Sugiura, H.; Kai, K.;
Hirai, K.; Otsuki, K. and Hayashi, T. (1998):
A serological survey of chickens, Japanese
quail, pigeons, ducks and crows for antibodies
to chicken anaemia virus (CAV) in Japan.
Avian Pathol., 27: 316-320.
Firkin, B.G. (1984): The Platelet and Its
Disorders. By Firkin, B.G. MIP Press Limited
Falcon. House Lancaster, England.
Franz, S. and Coral, C. (2003): Chicken
anemia virus in broiler flocks. Avian Dis., 47:
1466-1473.
Goodwin, M.A.; Smeltzer, M.A.; Brown, J.;
Girshick, T.; McMurray, B.L. and McCarter,
Allam et al. / Minufiya Vet. J. 2015, 9: 40-57
54
S. (1993): Effect of so-called chicken anaemia
agent maternal antibody on chick serologic
conversion to viruses in the field. Avian Dis.,
37: 542-545.
Goryo, M.; Sugimura, H.; Matsumoto, S.;
Umemura, T. and Itakura, C. (1985): Isolation
of an agent inducing chicken anemia. Avian
Pathol., 14: 483-496.
Goryo, M.; Suwa, T.; Matsumoto, S.;
Umemura, T. and Itakura, C. (1987): Serial
propagation and purification of chicken
anaemia agent in MDCC-MSB1 cell line,
Avian Pathol., 16: 149-163.
Goryo, M.; Suwa, T.; Umemura, T.; Itakura,
C. and Yamashiro, S. (1989): Histopathology
of chicks inoculated with chicken anaemia
agent (MSB1–TK5803 strain). Avian Pathol.,
18: 73–89.
Hallen, A. and Nilsson, I.M. 1964):
Coagulation studies in liver disease. Thromb.
Diath. Haemorrh., 11: 51.
Hegazy, A.M.; Abdallah, F.M.; Abd-El
Samie, L.K. and Nazim, A.A. (2010): Chicken
infectious anemia virus (CIAV) in broilers and
laying hens in Sharkia Province, Egypt.
Journal of American Science, 6 ( 9): 752-761.
Henry, N.W.; Rosenberger, J.K. and Lee, K.P.
(1978): A clinical evaluation of chickens
inoculated with several avian adeno virus
isolates. Avian Dis., 22: 46-52.
Hussein, H.A.; Youssef, M.M.; Osman, A.;
El-Ebiary, E.A. and Shalaby, M.A. (2003):
Immunopathogenesis of attenuated strain of
chicken infectious anemia virus in one-day-
old specific-pathogen-free chicks. Egypt J.
Immunol., 10 (1): 89-102.
Ivins, G.K.; Weddle, G.D. and Halliwell,
W.H. (1978): Hematology and Serum
Chemisteries in Birds of Prey. In: "Zoo and
Wild Animal Medicine", edited by Fowler,
M.E., W.B. Saunders Co., Philadelphia.
Kapetanov, M.; Orlić, D.; Velhner, M.;
Potkonjak, D. and Lazić, S. (2004): Clinical
and laboratory investigation of experimentally
infected broilers with CIAV. Proc. Nat. Sci.,
107: 65-73.
Kuscu, B. and Gurel, A. (2008): Lesions in the
thymus and bone marrow in chicks with
experimentally induced chicken infectious
anemia disease. J. Vet. Sci., 9 (1): 15-23.
McConnell, C.D.G.; Adair, B.M. and
McNulty, M.S. (1993): Effects of chicken
anemia virus on cell-mediated immune
function in chickens exposed to the virus by a
natural route. Avian Dis., 37: 366-374.
McKenna, G.F.; Todd, D.; Borghmans, B.J.;
Welsh, M.D. and Adair, B.M. (2003):
Immunopathologic investigations with an
attenuated chicken anemia virus in day-old
chickens. Avian Dis., 47 (4): 1339-1345.
Allam et al. / Minufiya Vet. J. 2015, 9: 40-57
55
McNulty, M.S. (1991): Chicken anaemia
agent: A review. Avian Pathol., 20: 187–203.
Michelle, A.P.; Brendan, S.C.; Kelly, A.T. and
Glenn, F.B. (2007): Attenuation of chicken
anemia virus by site-directed mutagenesis of
VP2. J. Gen. Virol., 88: 2168-2175.
Mulley, R.C. (1979): Hematology a ِ◌nd blood
chemistry of the black duck (Anas
Superciliosa). Journal of wild life Diseases, 15
(3) : 437-441.
Natt, M.P. and Herrick, C.A. (1952): A new
blood diluent for counting of erythrocytes and
leukocytes of the chicken. Poult. Sci., 31: 735-
738.
Nunoya, T.; Otaki, Y.; Tajima, M.; Hiraga, M.
and Saito, T. (1992): Occurance of acute
infectious bursal disease with high mortality
in Japan and pathogenesity of field isolates in
specific-pathogen-free chickens. Avian Dis.,
36 (3): 597-609.
OIE Terrestrial manual (2008): The World
Organisation for Animal Health. OIE Manual
of Diagnostic Tests and Vaccines for
Terrestrial Animals. Chapter,
2.3.4.http://www.oie.int/eng/normes/manual/
A_00037.htm.
Otaki, Y.; Nunoya, T.; Tajima, M.; Tamada,
H. and Nomura, Y. (1987): Isolation of
chicken anaemia agent and Marek's disease
virus from chickens vaccinated with turkey
herpesvirus and lesions induced in chicks by
inoculating both agents. Avian Pathol., 16:
291-306.
Otaki, Y.; Saito, K.; Tajima, M. and Nomura,
Y. (1992): Persistence of maternal antibody to
chicken anemia agent and its effect on the
susceptibility of young chickens. Avian
Pathol., 21: 147-151.
Pages, A.; Saubi, N.; Artigas, C. and ESpuna,
E. (1997): Experimental evaluation of an
inactivated vaccine against chicken anemia
virus. Avian Pathol., 26: 721-729.
Pringle, C.R. (1999): Virus taxonomy at the
XIth International congress of virology,
Sydney, Australia. Arch. Virol., 144: 2065-
2070.
Rasales, A.G. (1999): Control of infectious
chicken anemia in broiler breeders and their
progeny in: Proc. 48th Animal New England
Poult. Health, Conf., Postsmouth, N.H., 7-10.
Reitman, S. and Frankel, S. (1957):
Colouremetric determination of serum
glutamic oxaloacetic and glutamic pyruvic
transminase. Am. J. Clin. Path., 28: 56-58.
Rosenberger, J.K. and Cloud, S.S. (1989):
The effects of age, route of exposure, and
coinfection with infectious bursal disease
virus on the pathogenicity and transmissibility
of chicken anemia agent (CAA). Avian Dis.,
33 (4): 753-759.
Saini, N.S. and Dandapat, A. (2009):
Diagnosis and molecular characterization of
Allam et al. / Minufiya Vet. J. 2015, 9: 40-57
56
chicken anaemia virus. Veterinary World, 2
(4): 156-160.
Sankaranarayanan, G. and Nambiar, K.T.K.
(1971): Studies on blood coagulation in
domestic fowl. Indian Vet. Journal, 48 (1): 30.
Sastry, G.A. (1983): "Veterinary Clinical
Pathology". 3rd ed., CBS Publishers.
NewDelhi-32.
Schat K.A.(2009): Chicken anemia virus.
Curr. Top. Microbiol. Immunol., 331: 151-
183.
Skeeles, J.K.; Slavik, M.; Beasley, J.N.;
Brown, A.H.; Meinecke, C.F.; Maruca, S. and
Welch, S. (1980): An age-related coagulation
disorder associated with experimental
infection with infectious bursal disease virus.
Am. J. Vet. Res., 41 (9): 1458-1461.
Smyth, J.A.; Moffett, D.A.; Connor, T.J. and
McNulty, M.S. (2006): Chicken anemia virus
inoculated by oral rout causes lympocyte
depletion in the thymus in 3-week-old and 6-
week-old chickens. Avian Pathol., 35 (3): 254-
259.
Snedecore, G.W. and Cochran, W.C. (1969):
"Statistical Methods". 8th ed. The Iowa. Univ.
U.S.A.
Sommer, F. and Cardona, C. (2003): Chicken
anemia virus in broilers: Dynamics of the
infection in two commercial broiler flocks.
Avian Dis., 47 (4): 1466–1473.
Sterz, I. and Weiss, E. (1973): Electron
microscope studies on phagocytosis and
replication of fowl plague virus in
thrombocytes of infected fowls. Zentralblatt
fur veterinarmedizin 20 B Heft 8 : 613 (De. en,
es. fr).
Tan, J. and Tannock, G.A. (2005): Role of
viral load in the pathogenesis of chicken
anemia virus. J. Gen. Virol., 86: 1327-1333.
Tannock, G.A.; Tan, J.; Mawhinney, K.A.;
Todd, D.; O’Rourke, D. and Bagust, T.J.
(2003): A modified blocking ELISA for the
detection of antibody to chicken anaemia virus
using an Australian strain. Aust. Vet. J., 81:
428–430.
Todd, D. (2000): Circoviruses:
Immunosuppressive threats to avian species:
A review. Avian Pathol., 29: 373–394.
Todd, D.; Connor, T.J.; Calvert, V.M.;
Creelan, J.L.; Meehan, B.M. and McNulty,
M.S. (1995): Molecular cloning of an
attenuated chicken anemia virus isolate
following repeated cell culture passage. Avian
Pathol., 24: 171 – 187.
Todd, D.; Connor, T.J.; Creelan, J.L.;
Borghmans, B.J.; Calvert, V.M. and McNulty,
M.S. (1998): Effect of multiple cell culture
passages on the biological behaviour of
chicken anemia virus. Avian Pathol., 27: 74-
79.
Allam et al. / Minufiya Vet. J. 2015, 9: 40-57
57
Toro, H.; van Santen, V.L.; Hoerr, F.J. and
Breedlove, C. (2008): Effects of chicken
anemia virus and infectious bursal disease
virus in commercial chickens. Avian Dis., 53
(1): 94–102.
Van Santen, V.L; Joiner, K.S.; Murray, C.;
Petrenko, N.; Hoerr, F.J. and Toro, H. (2004):
Pathogenesis of chicken anemia virus:
Comparison of the oral and the intramuscular
routes of infection. Avian Dis., 48 (3): 494-
504.
Vielitz, E.; Bulow, V.V.; Landgraf, H. and
Conrad, C. (1987): Anemia in broilers-
development of a vaccine for breeder stock.
Zentralbl. Veterinaermed. B., 34: 553–557.
Youssef, M.M.M. (1998): Chicken anemia
virus (CAV): Molecular and
immunobiological studies on the live
attenuated vaccine. M.V.Sc.Thesis, Fac.Vet.
Med.; Cairo University.
Yuasa, N. (1989): CAA: Review and recent
problems. In Proceedings of 38th Western
Poultry Disease Conference, Tempe, Arizona,
p: 14-20.
Yuasa, N.; Taniguchi, T. and Yoshida, I.
(1979): Isolation and some characteristics of
an agent inducing anemia in chicks. Avian
Pathol., 23: 366-385.
Yuasa, N.; Taniguchi, T.; Noguchi, T. and
Yoshida, I. (1980): Effect of infectious bursal
disease virus infection on incidence of anemia
by chicken anemia agent. Avian Dis., 24: 202-
209.
58
Introduction
Gastrointestinal nematode parasitism is
arguably the most serious constraint affecting
the production of small ruminants worldwide.
Economic losses are caused by decreased
production, the costs of treatment and the
Microscopical Identification and seasonal dynamics of Gastrointestinal Nematodes in Small Ruminants at Menoufia province.
Nasr M. Elbahy, Ahmed O. Elkhtam*, Mahmoud AbouLaila, and Amer R. Abdelaziz.
Department of Parasitology, Faculty of Veterinary Medicine, University of Sadat City, Menoufia 32511, Egypt.
*Corresponding Author:[email protected] Accepted: 21/7/2015
Abstract: Gastrointestinal nematodes are of major concern to the productivity and health for small ruminants, they
cause severe symptoms such as watery diarrhea, anorexia, weight loss and even death of affected
animals. The present study was carried out for microscopical identification of gastro intestinal nematodes
in sheep and goats by floatation technique and faecal culture and determines their prevalence and
seasonal incidence. Faecal examination was carried out on 83 sheep and 38 goats of different ages, sex
and localities, the infection rate among sheep and goats was (44.57%) and (18.42%) respectively. The
seasonal incidence of nematodes was recorded. By floatation technique, the recorded species in sheep
were as follow; eggs of Trichuris ovis (2.40%), Haemonchus contortus (38.55%), Strongyloides
papillosus eggs (36.14%), Bunostomum trigoncephalum eggs (2.40%). Trichostrongylus sp. eggs
(9.63%), the highest infection rate recorded during summer season followed by spring and winter season
was 46.66%, 44.82% and 41.66% respectively. Regarding goats; Trichuris ovis eggs (2.63%),
Haemonchus contortus eggs (7.89%). Strongyloides papillosus eggs (13.15%). Trichostrongylus sp.
Eggs (5.26%), the highest infection rate recorded during winter season followed by spring and summer
season with an infection rate of 25%, 22.22% and 16% respectively, the same samples were re-examined
by faecal cultures and Baerman's technique, results compared, it concluded that, the combination
between two method is better for concise identification than floatation technique alone, also the
morphology and morphometry of recovered eggs and larvae were recorded.
Keywords: Diagnosis, Baerman's technique, Fecal culture, Gastrointestinal nematodes and Menoufia province
Minufiya Veterinary Journal ISSN: 1110-9750
Elbahy et al. / Minufiya Vet. J. 2015, 9: 58-65
59
death of the infected animals, they are the
most numerous, complex and variable among
the helminth parasites of sheep and goats
(Urquhart et al., 1996), inadequately parasite
control causing severe symptoms such as
watery diarrhea, anorexia, weight loss and
even death of affected animals, and should
therefore be regarded as major animal welfare
concerns. However, more common and of
major economical impact are sub clinical
infections, which may cause significantly
reduced performance of infected animals
without obvious symptoms. (Suarez and
Busetti, 1995). Traditional methods for
detesction of the type and level of infection in
a sheep flock require laborious laboratory
extraction, culture and microscopic
examination of eggs or larvae from faecal
samples. This study aimed to identify
gastrointestinal nematodal infections in sheep
and goats by floatation technique and faecal
culture, to identify the recovered eggs and
larvae and determine the prevalence and
seasonal incidence.
Materials and methods
1- Samples collection:-
Faecal pellets samples were collected from 83
sheep and 38 goats either from rectum directly
or as soon as possible after defecation in
plastic containers that labeled with all data
about the animal (Age, sex, species, date, and
locality).
2- Floatation technique: (Urquhart et al.,
1996)
Two grams of fresh faeces is added to 10 ml
of saturated sodium chloride solution and
following thorough mixing the suspension
was poured into a test tube and more floatation
solution added to fill the tube to the top. A
cover slip is then added on the top of the
surface of the liquid and the tube and the cover
slip left standing for 15 minutes. The cover
slip is then removed vertically and placed on a
slide and examined under the compound
microscope systematically.
3-Faecal culture technique: (MAFF, 1986).
The faeces were broken finely, using either a
tongue depressor, very dry faeces should be
moisted with water; if they are very wet, wood
shaves should be added until the correct
consistency is obtained. The glass culture or
honey jars are then filled with the mixture and
placed in an incubator at 27◦c for 7 days. The
larvae were recovered by Baerman's
apparatus.
4- Baerman's technique: (MAFF 1986), and
(Urquhart et al., 1996)
Baerman's apparatus consisted of a ring stand
and a ring supporting a large glass or plastic
funnel. The funnel's stem is connected by a
piece of rubber tubing to a tapered tube (a cut
Elbahy et al. / Minufiya Vet. J. 2015, 9: 58-65
60
of Pasteur pipette). The rubber tubing is
clamped shut with a pinch clamp. A piece of
metal screen is placed in the funnel to serve as
a support for the sample. The funnel is then
filled with warm water at 30 ◦c to a level 1 to
3 cm above the sample. The content of faecal
culture was placed in the gauze on the metal
screen over the funnel. The apparatus was kept
undisturbed over night. Afterward, the clamp
was removed and collect the first few drop
into clean glass tube. A small drop of
suspension of larvae was placed on a
microscope slide and mixed with a drop of
gram's iodine solution (1gm iodine, 2 gm
potassium iodide and 300 ml distilled water).
The slide was covered by cover slip and
examined under a microscope. Each larva was
examined, recognized and identified
according to standard keys (Soulsby 1986).
Results
The results in table (1) showed that the
infection rate of nematodes in sheep and goats
by floatation technique that was carried out on
83 sheep and 38 goats, it was (44.57%) and
(18.42%) respectively. Concerning to the
nematode infection between sheep, Trichuris
ovis eggs 2.40%, Haemonchus contortus
38.55%, Strongyloides papillosus eggs
36.14%, Bunostomum trigoncephalum eggs
2.40%, Trichostrongylus sp. eggs 9.63%,
mixed infections between nematodes were
recorded, the seasonal incidence show the
highest infection rate during summer season
followed by spring and winter season with an
infection rate of 46.66%, 44.82% and 41.66%
respectively. The nematode infections among
as recorded in table (1), 7 out of 38 goats was
infected with nematodes with an infection rate
of 18.42%. Trichuris ovis eggs 2.63%,
Haemonchus contortus eggs 7.89%,
Strongyloides papillosus eggs 13.15%,
Trichostrongylus sp. eggs 5.26%. The
seasonal incidence show the highest infection
rate during winter season followed by spring
and summer with an infection rate of 25%,
22.22% and 16% respectively.
The morphology of some recovered eggs of
nematodes (Trichuris ovis, Haemonchus
contortus, Trichostrongylus sp., Strongyloides
papillosus and Bunostomum trigoncephalum)
was displayed in figure (1). The
morphological examination of the recovered
larvae (the anterior and posterior extremity of
the body, the number of intestinal cells, and
the shape of esophagus) as well as the
micrometrical data (total body length,
esophagus length, and the length from anus to
the tail sheath tip) were recorded. Table (2, 3),
including Haemonchus contortus,
strongyloides papillosus, Trichostrongylus
axei, Bunostomum trigoncephalum,
Ostertagia circumcincta, Cooperia curticei
Elbahy et al. / Minufiya Vet. J. 2015, 9: 58-65
61
and Chabertia ovina larvae. Concerning
sheep, 67 out of 83 sheep with an infection
rate of 80.72%. Haemonchus contortus
(61.44%), Strongyloides papillosus (56.62%).
Trichostrongylus axei (12.04%), Chabertia
ovina (3.61%), Cooperia curticei (2.40%),
Bunostomum trigoncephalum (2.40%),
Trichuris ovis (egg containing larva) (2.40%),
and 1 sheep were identified with Ostertagia
circumcincta with an infection rate of 1.20%,
for mixed infection, the highest infection rate
was Haemonchus contortus (61.44%)
followed by strongyloides papillosus
(56.62%) and the lowest infection rate was
recorded by Ostertagia circumcincta (1.20%).
Concerning goats, 23 out of 38 goats were
infected with nematodes with an infection rate
of 60.52%. Haemonchus contortus (39.47%).
strongyloides papillosus (36.84%).
Trichostrongylus axei (5.26%). Chabertia
ovina (2.63%), Cooperia curticei (2.63%).
Ostertagia circumcinca (2.63%). Trichuris
ovis (egg containing larva) (2.63%). About the
mixed infection, the highest rate was recorded
by Haemonchus contortus (39.47%) followed
by Strongyloides papillosus (36.84%) and the
lowest infection rate was recorded by
Ostertagia circumcincta, Cooperia curticei
and Chabertia ovina that had the same percent
(2.63%). Tables (2, 3) showed seasonal
variations of the recovered larvae; the highest
infection rate recorded during summer season
(90%) followed by spring (79.31%) and
winter season (70.83%). For goats; the highest
infection rate of nematodes recorded during
spring season (66.66%) followed by summer
(60%) and winter season (50%).
Discussion
Gastrointestinal nematode parasitism of sheep
and goats is a serious constraint affecting their
production worldwide; the economic losses
are due to decreased production, the costs of
treatment and the death of the infected
animals, little knowledge on the prevalence
and seasonal dynamics of parasitism with
these nematodes lead to inadequately parasite
control measures that causing severe problems
even death of affected animals. Traditional
methods for detection of the type and level of
infection in a sheep flock require laborious
laboratory extraction, culture and microscopic
examination of eggs or larvae from faecal
samples. Until now little researches were done
on the prevalence and dynamics of these
nematodes in Menoufiya province; so, this
study aimed primarily to identify
morphological and morphometrical data on
the gastrointestinal nematodes in sheep and
goats by floatation technique and faecal
culture, to identify the recovered eggs and
larvae and determine the prevalence and
seasonal incidence in the province.
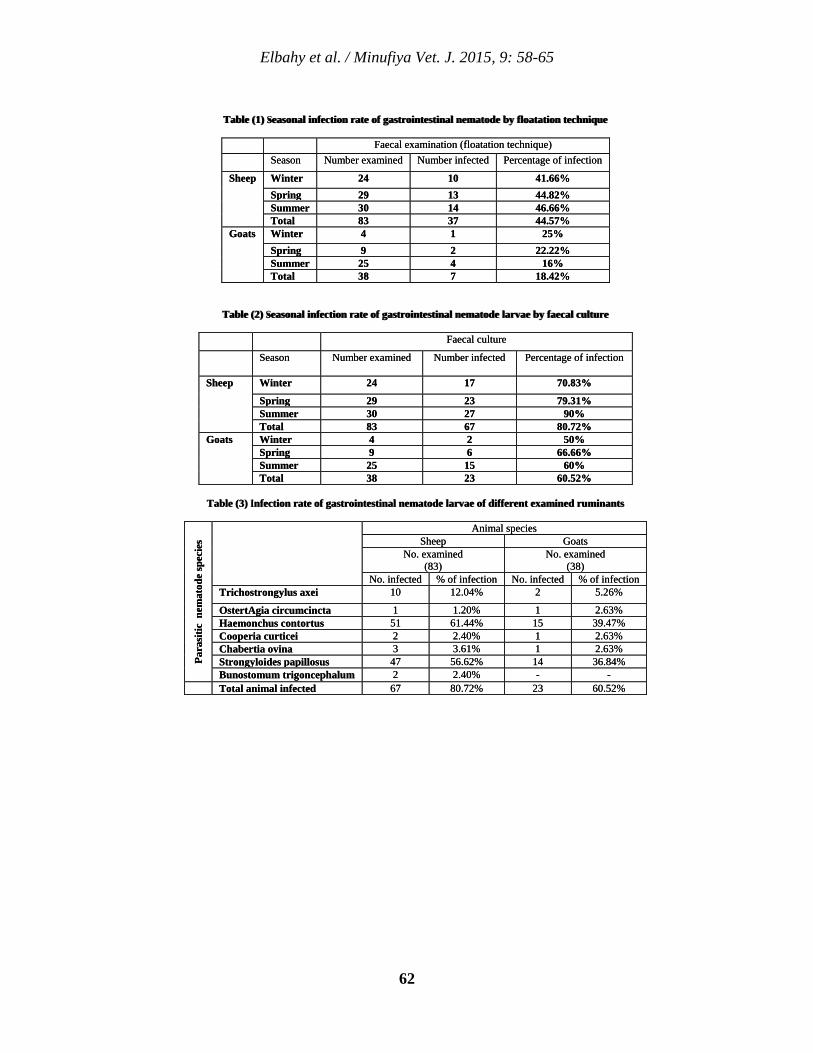
Elbahy et al. / Minufiya Vet. J. 2015, 9: 58-65
62
Table (1) seasonal infection rate of gastrointestinal nematode by floatation technique
Faecal examination (floatation technique) Season Number examined Number infected Percentage of infection
Sheep Winter 24 10 41.66% Spring 29 13 44.82% Summer 30 14 46.66% Total 83 37 44.57%
Goats Winter 4 1 25% Spring 9 2 22.22% Summer 25 4 16% Total 38 7 18.42%
Table (2) seasonal infection rate of gastrointestinal nematode larvae by faecal culture
Faecal culture
Season Number examined Number infected Percentage of infection
Sheep Winter 24 17 70.83%
Spring 29 23 79.31% Summer 30 27 90% Total 83 67 80.72%
Goats Winter 4 2 50% Spring 9 6 66.66% Summer 25 15 60% Total 38 23 60.52%
Table (3) infection rate of gastrointestinal nematode larvae of different examined ruminants
Para
sitic
nem
atod
e sp
ecie
s
Animal species Sheep Goats
No. examined (83)
No. examined (38)
No. infected % of infection No. infected % of infection Trichostrongylus axei 10 12.04% 2 5.26%
OstertAgia circumcincta 1 1.20% 1 2.63% Haemonchus contortus 51 61.44% 15 39.47% Cooperia curticei 2 2.40% 1 2.63% Chabertia ovina 3 3.61% 1 2.63% Strongyloides papillosus 47 56.62% 14 36.84% Bunostomum trigoncephalum 2 2.40% - -
Total animal infected 67 80.72% 23 60.52%
Table (1) Seasonal infection rate of gastrointestinal nematode by floatation technique
Faecal examination (floatation technique) Season Number examined Number infected Percentage of infection
Sheep Winter 24 10 41.66% Spring 29 13 44.82% Summer 30 14 46.66% Total 83 37 44.57%
Goats Winter 4 1 25% Spring 9 2 22.22% Summer 25 4 16% Total 38 7 18.42%
Table (2) Seasonal infection rate of gastrointestinal nematode larvae by faecal culture
Faecal culture
Season Number examined Number infected Percentage of infection
Sheep Winter 24 17 70.83%
Spring 29 23 79.31% Summer 30 27 90% Total 83 67 80.72%
Goats Winter 4 2 50% Spring 9 6 66.66% Summer 25 15 60% Total 38 23 60.52%
Table (3) Infection rate of gastrointestinal nematode larvae of different examined ruminants
Para
sitic
nem
atod
e sp
ecie
s
Animal species Sheep Goats
No. examined (83)
No. examined (38)
No. infected % of infection No. infected % of infection Trichostrongylus axei 10 12.04% 2 5.26%
OstertAgia circumcincta 1 1.20% 1 2.63% Haemonchus contortus 51 61.44% 15 39.47% Cooperia curticei 2 2.40% 1 2.63% Chabertia ovina 3 3.61% 1 2.63% Strongyloides papillosus 47 56.62% 14 36.84% Bunostomum trigoncephalum 2 2.40% - -
Total animal infected 67 80.72% 23 60.52%
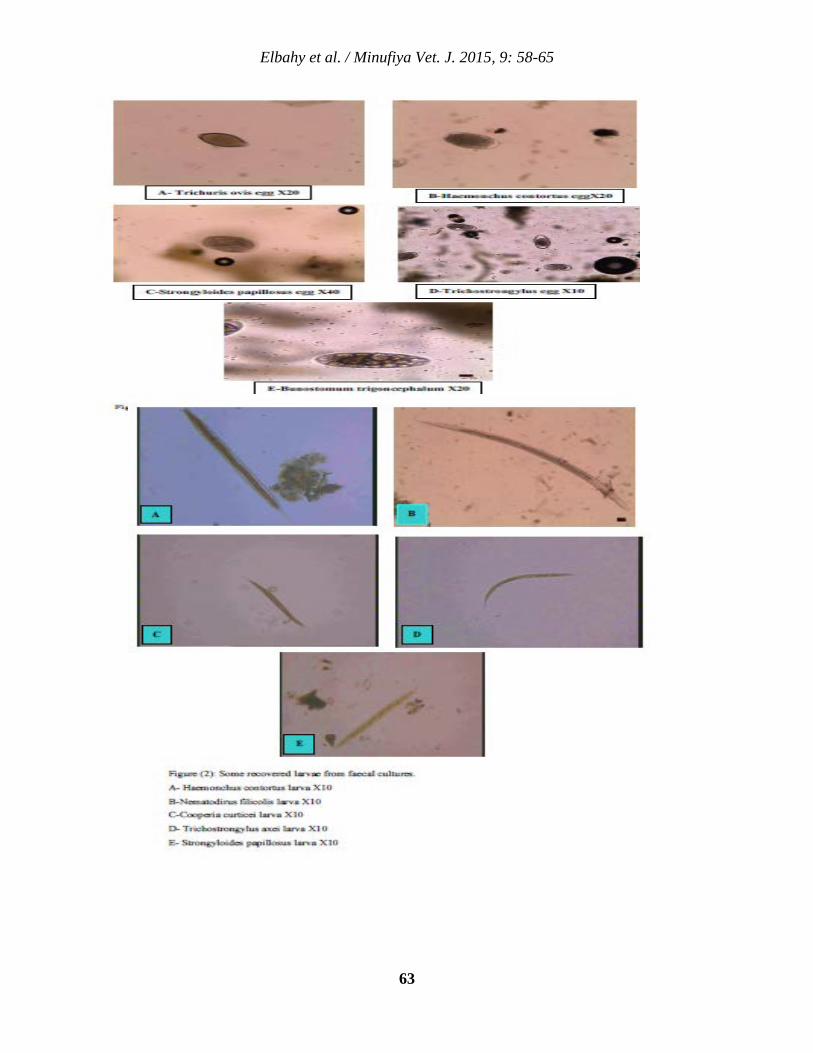
Elbahy et al. / Minufiya Vet. J. 2015, 9: 58-65
63
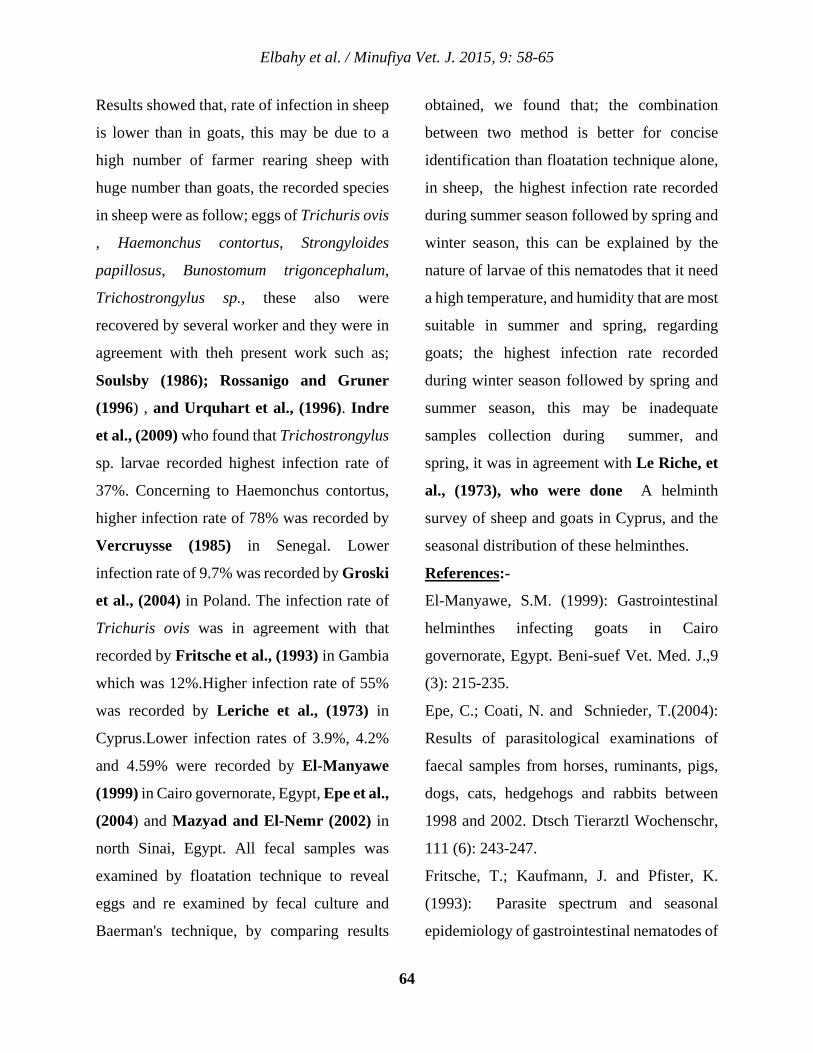
Elbahy et al. / Minufiya Vet. J. 2015, 9: 58-65
64
Results showed that, rate of infection in sheep
is lower than in goats, this may be due to a
high number of farmer rearing sheep with
huge number than goats, the recorded species
in sheep were as follow; eggs of Trichuris ovis
, Haemonchus contortus, Strongyloides
papillosus, Bunostomum trigoncephalum,
Trichostrongylus sp., these also were
recovered by several worker and they were in
agreement with theh present work such as;
Soulsby (1986); Rossanigo and Gruner
(1996) , and Urquhart et al., (1996). Indre
et al., (2009) who found that Trichostrongylus
sp. larvae recorded highest infection rate of
37%. Concerning to Haemonchus contortus,
higher infection rate of 78% was recorded by
Vercruysse (1985) in Senegal. Lower
infection rate of 9.7% was recorded by Groski
et al., (2004) in Poland. The infection rate of
Trichuris ovis was in agreement with that
recorded by Fritsche et al., (1993) in Gambia
which was 12%.Higher infection rate of 55%
was recorded by Leriche et al., (1973) in
Cyprus.Lower infection rates of 3.9%, 4.2%
and 4.59% were recorded by El-Manyawe
(1999) in Cairo governorate, Egypt, Epe et al.,
(2004) and Mazyad and El-Nemr (2002) in
north Sinai, Egypt. All fecal samples was
examined by floatation technique to reveal
eggs and re examined by fecal culture and
Baerman's technique, by comparing results
obtained, we found that; the combination
between two method is better for concise
identification than floatation technique alone,
in sheep, the highest infection rate recorded
during summer season followed by spring and
winter season, this can be explained by the
nature of larvae of this nematodes that it need
a high temperature, and humidity that are most
suitable in summer and spring, regarding
goats; the highest infection rate recorded
during winter season followed by spring and
summer season, this may be inadequate
samples collection during summer, and
spring, it was in agreement with Le Riche, et
al., (1973), who were done A helminth
survey of sheep and goats in Cyprus, and the
seasonal distribution of these helminthes.
References:-
El-Manyawe, S.M. (1999): Gastrointestinal
helminthes infecting goats in Cairo
governorate, Egypt. Beni-suef Vet. Med. J.,9
(3): 215-235.
Epe, C.; Coati, N. and Schnieder, T.(2004):
Results of parasitological examinations of
faecal samples from horses, ruminants, pigs,
dogs, cats, hedgehogs and rabbits between
1998 and 2002. Dtsch Tierarztl Wochenschr,
111 (6): 243-247.
Fritsche, T.; Kaufmann, J. and Pfister, K.
(1993): Parasite spectrum and seasonal
epidemiology of gastrointestinal nematodes of
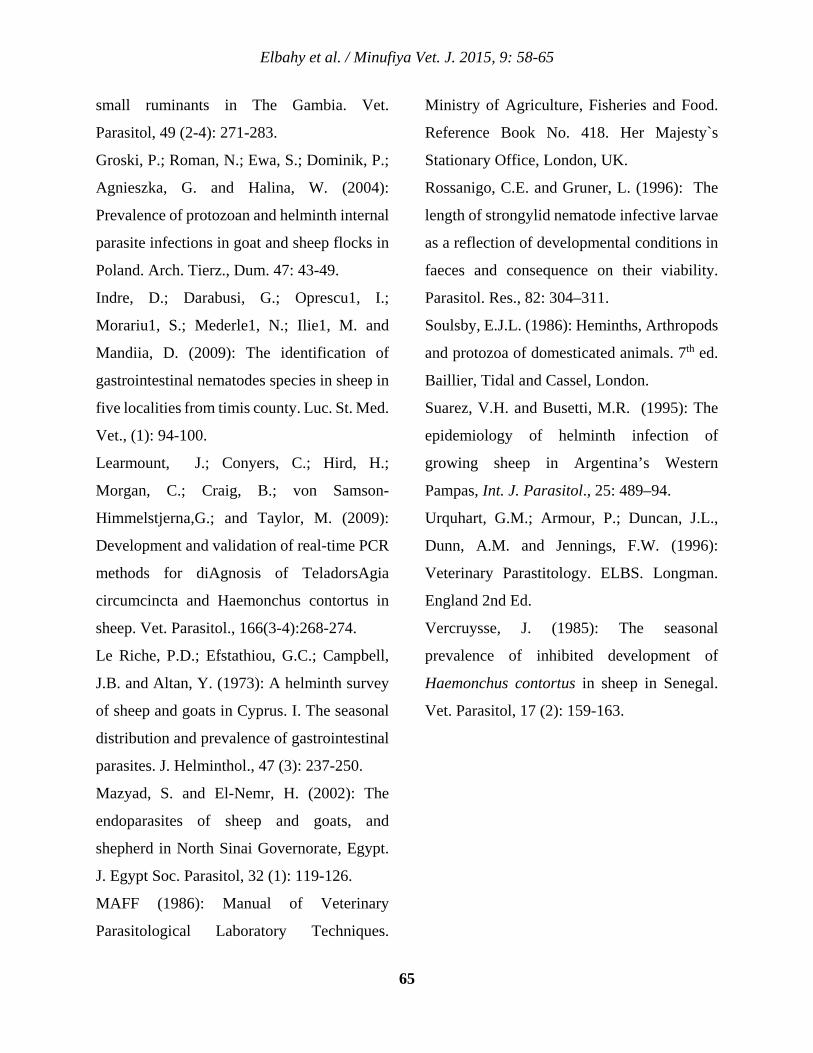
Elbahy et al. / Minufiya Vet. J. 2015, 9: 58-65
65
small ruminants in The Gambia. Vet.
Parasitol, 49 (2-4): 271-283.
Groski, P.; Roman, N.; Ewa, S.; Dominik, P.;
Agnieszka, G. and Halina, W. (2004):
Prevalence of protozoan and helminth internal
parasite infections in goat and sheep flocks in
Poland. Arch. Tierz., Dum. 47: 43-49.
Indre, D.; Darabusi, G.; Oprescu1, I.;
Morariu1, S.; Mederle1, N.; Ilie1, M. and
Mandiia, D. (2009): The identification of
gastrointestinal nematodes species in sheep in
five localities from timis county. Luc. St. Med.
Vet., (1): 94-100.
Learmount, J.; Conyers, C.; Hird, H.;
Morgan, C.; Craig, B.; von Samson-
Himmelstjerna,G.; and Taylor, M. (2009):
Development and validation of real-time PCR
methods for diAgnosis of TeladorsAgia
circumcincta and Haemonchus contortus in
sheep. Vet. Parasitol., 166(3-4):268-274.
Le Riche, P.D.; Efstathiou, G.C.; Campbell,
J.B. and Altan, Y. (1973): A helminth survey
of sheep and goats in Cyprus. I. The seasonal
distribution and prevalence of gastrointestinal
parasites. J. Helminthol., 47 (3): 237-250.
Mazyad, S. and El-Nemr, H. (2002): The
endoparasites of sheep and goats, and
shepherd in North Sinai Governorate, Egypt.
J. Egypt Soc. Parasitol, 32 (1): 119-126.
MAFF (1986): Manual of Veterinary
Parasitological Laboratory Techniques.
Ministry of Agriculture, Fisheries and Food.
Reference Book No. 418. Her Majesty`s
Stationary Office, London, UK.
Rossanigo, C.E. and Gruner, L. (1996): The
length of strongylid nematode infective larvae
as a reflection of developmental conditions in
faeces and consequence on their viability.
Parasitol. Res., 82: 304–311.
Soulsby, E.J.L. (1986): Heminths, Arthropods
and protozoa of domesticated animals. 7th ed.
Baillier, Tidal and Cassel, London.
Suarez, V.H. and Busetti, M.R. (1995): The
epidemiology of helminth infection of
growing sheep in Argentina’s Western
Pampas, Int. J. Parasitol., 25: 489–94.
Urquhart, G.M.; Armour, P.; Duncan, J.L.,
Dunn, A.M. and Jennings, F.W. (1996):
Veterinary Parastitology. ELBS. Longman.
England 2nd Ed.
Vercruysse, J. (1985): The seasonal
prevalence of inhibited development of
Haemonchus contortus in sheep in Senegal.
Vet. Parasitol, 17 (2): 159-163.
66
Introduction:-
Ruminants such as cattle, buffaloes, sheep,
and goat are the most important animals raised
and used for meat production in Moslem
countries and considered the main source of
animal protein in Egypt. The gradual increase
in the human population with the increased
consumption of animal proteins (from) in
front of the limited abilities of animal
production required more research interest in
Prevalence of Different Flatworms Infecting Ruminants In Menoufia Governorate.
Nasr M. Elbahy, Ahmed O. Elkhtam*, Mahmoud AbouLaila, and Amer R. Abdelaziz.
Department of Parasitology, Faculty of Veterinary Medicine, University of Sadat City, Menoufia 32511, Egypt.
*Corresponding Author:[email protected] Accepted: 25/7/2015 Abstract: Flatworms in ruminants cause a great variety of clinical signs including diarrhea, unthriftness, weight loss, anemia,
and may cause intestinal obstruction and deaths in heavy infections. Little studies was done on flatworm of
ruminants in Menoufia governorate, so the present study was aimed to identify flatworms of ruminants, their
prevalence, seasonal and monthly incidence in this governorate, it was carried out on 1200 animals (656 cattle,
271 buffaloes, 159 sheep and 114 goats) of different ages, breeds and sexes, the period of survey extended from
April 2006 to March 2007 by examination of slaughtered animals. Results revealed that, trematodes recovered
were Fasciola hepatica, Fasciola gigantica, Paramphistomum cervi, Cotylophoron cotylophorum and Carmyerius
gregarius. The highest infection rate was among sheep (97.48 %), while the lowest was goats (26.31%). The
recovered cestodes were Moniezia expansa, Moniezia benedeni, Avitellina centripunctata, and Moniezia
denticulata. The highest infection rate was among sheep (62.89%), while the lowest was among buffaloes (3.69%).
Regarding seasonal and monthly incidence of trematodes showed that, the highest infection rate recorded during
winter and spring season (30.09%) and the peak of infection observed during December(66.66%), for cestodes
infection, the highest infection rate of Moniezia expansa recorded during autumn, and winter season and the peak
of infection observed during November and December. Keywords: Prevalence, Ruminants, Fecal culture, Flatworms and Menoufia province
Minufiya Veterinary Journal ISSN: 1110-9750
Elbahy et al. / Minufiya Vet. J. 2015, 9: 66-77
67
the problem concerning the capacity of the
animal to produce Hassan (1973), and Hiekal
(1980). Flatworms of ruminants cause a great
variety of clinical problems and may cause
intestinal obstruction and deaths in heavy
infections. (Urquhart et al., 1996), the most
destructive enemies of our animal wealth and
the biggest hinderness for successful
production are parasitic infection where, its
percentage in the Egyptian field animals
fluctuated according to many factors
including irrigation, season, frequency of
exposure of animal to infection, immune
condition of the animal, the geographic
location and climatic conditions (Cawthorne,
1984). The indirect losses by flatworm
parasitism are not easily diagnosed, as the
infection run usually a silent long standing
course including loss in body weight, lowered
fertility, reduced work capacity, involuntary
culling, treatment costs, retardation of growth,
impaired milk and meat production (El-Molla
et al., 1981), increase their susceptibility to
other diseases with increase of mortality rate
(Khan, 1993) and diarrhea specially in calves
(Al-farwachi, 2000). So, the aim of this study
was to identify flatworms in ruminants and
determine their prevalence, seasonal and
monthly dynamics in Menoufia governorate.
Material and methods
1-Animals and localities:
This study carried out on: 656 cattle, 271
buffaloes, 159 sheep and 114 goats of
different ages and breeds from slaughtered
ruminants at abattoirs of Ashmoun, Shebin el-
koom, Kafr dawoud and Minoof, from April
2006 to April 2007.
2- Parasitological examinations
A-Samples collection and preservation:
(Khan, M.Q. 1993)
Worms from slaughtered ruminants was
collected from different organs and during
evacuation of gastrointestinal tract, then
washed thoroughly several times in normal
saline solution, placed in refrigerator
overnight for complete relaxation. The length
and breadth of the worms were measured
before fixation. Each sample collected in a
separate glass container that labeled with date
of collection, site of collection, age of animal,
species of animal and sex of animal.
B- Identification of collected flatworms:
(Pritchard and Kruse, 1982)
1-Fixation and Staining:
The washed relaxed worms were compressed
between glass sheets and flooded with the
fixative (10% formalin) over night, after the
removal of the fixative solution, then
transferred to 70% ethyl alcohol, then stained
with Mayer's acid carmine stain 48 hrs.
2-Dehydration and mounting:
Elbahy et al. / Minufiya Vet. J. 2015, 9: 66-77
68
The samples were dehydrated by serial
passage for 1/2 hour in ascending grades of
ethyl alcohol 50%, 70%, 80%, 90%, 95% and
absolute. The specimens were mounted after
this in Canada balsam under cover slips, left
over night at 37ċ in the incubator to dry, and
then stored for microscopic examination.
They were measured using a standardized eye
piece micrometer.
3- Identification:
The species of flatworms were identified
according to Soulsby (1986), Urquhart et al.,
(1996) Khalil; Jones and Bary (1994).
Results
1-Trematodes:-
The recovered trematodes were Fasciola
hepatica, Fasciola gigantica,
Paramphistomum cervi, Cotylophoron
cotylophorum and Carmyerius gregarious.
The results in tables (1), (2), (3) showed that
the prevalence, seasonal and monthly
incidence of different trematodes of
ruminants. Cotylophoron cotylophorum and
Carmyerius gregarious were recorded only in
cattle. Concerning to the trematodes infection
among cattle, it was (71.64%), among which
(18.29%) Fasciola hepatica, (19.81%)
Fasciola gigantica, (16.76%)
Paramphistomum cervi, (13.71%)
Cotylophoron cotylophorum and (3.04%)
Carmyerius gregarius. Seasonal and monthly
incidence of trematodes in cattle showed that,
the highest infection rate of Fasciola hepatica
recorded during winter season (30.09%) and
the peak of infection observed during
December (66.66%), the highest infection rate
of Fasciola gigantica recorded during spring
season (25.87%) and the peak of infection
observed during May (35.71%), the highest
infection rate of Paramphistomum cervi
recorded during spring season (24.47%) and
the peak of infection observed during May
(59.52%), the highest infection rate of
Cotylophoron cotylophorum recorded during
spring season (25.17%) and the peak of
infection observed during May (85.71%), the
highest infection rate of Carmyerius gregarius
recorded during winter season (5.82%) and
the peak of infection observed during
December (18.51%). Regarding to the
trematodes infection among buffaloes, it was
(18.45 %), among which (3.69%) Fasciola
hepatica, (7.38%) Fasciola gigantica,
(7.38%) Paramphistomum cervi. The seasonal
and monthly incidence showed that the
highest infection rate of Fasciola hepatica
recorded during autumn (7.57%) and the peak
of infection observed during September
(15.78%), the highest infection rate of
Fasciola gigantica recorded during summer
season (12.72 %) and the peak of infection
observed during June (26.31%), the highest
Elbahy et al. / Minufiya Vet. J. 2015, 9: 66-77
69
infection rate of Paramphistomum cervi
recorded during autumn season (16.66%) and
the peak of infection observed during October
(35.71%). While in sheep, (97.48 %) of
examined sheep were infected with
trematodes, among which (62.89%) Fasciola
hepatica, (25.15%) Fasciola gigantica and
(9.43%) Paramphistomum cervi. The results
in tables (2, 3) showed the seasonal incidence
of infection of different helminthes of sheep.
Concerning to the trematode infection, the
highest infection rate of Fasciola hepatica
recorded during autumn season (77.41%) and
the peak of infection observed during
November (100%), the highest infection rate
of Fasciola gigantica recorded during autumn
season (22.58%) and the peak of infection
observed during September (100%), the
highest infection rate of Paramphistomum
cervi recorded during spring season (18.18%)
and the peak of infection observed during
April (41.66%). Concerning the trematodes
infection among goats table (1) showed that
(26.31%) of examined goats were infected
with trematodes, (8.77%) Fasciola hepatica
and (17.54%) Fasciola gigantica. The results
in tables (2, 3) showed the seasonal and
monthly incidence of Fasciola hepatica and
Fasciola gigantica in goats. the highest
infection rate of Fasciola hepatica recorded
during autumn season (13.04%) and the peak
of infection observed during October
(16.66%), the highest infection rate of
Fasciola gigantica recorded during autumn
season (30.43%) and the peak of infection
observed during September (50%).
Measurements of recovered trematodes were
recorded in table (6).
2-Cestodes
The recovered cestodes were Moniezia
expansa, Moniezia benedeni and Moniezia
denticulate and Avitellina centripunctata. The
results in tables (1), (4) and (5) showed the
prevalence, seasonal and monthly incidence of
different cestodes of ruminants. (32.01%) of
examined cattle were infected with cestodes,
among which (9.14%) Moniezia expansa,
(7.62%) Moniezia benedeni and (15.24%)
Moniezia denticulata. Regarding to seasonal
and monthly incidence of cestodes among
cattle, the highest infection rate of Moniezia
expansa recorded during autumn season
(11.30%) and the peak of infection observed
during November (20.68%), the highest
infection rate of Moniezia benedeni recorded
during winter season (9.70%) and the peak of
infection observed during December
(18.53%), the highest infection rate of
Moniezia denticulata recorded during autumn
season (20.86%) and the peak of infection
observed during October (32.25%). (3.69%)
of examined buffaloes were infected with
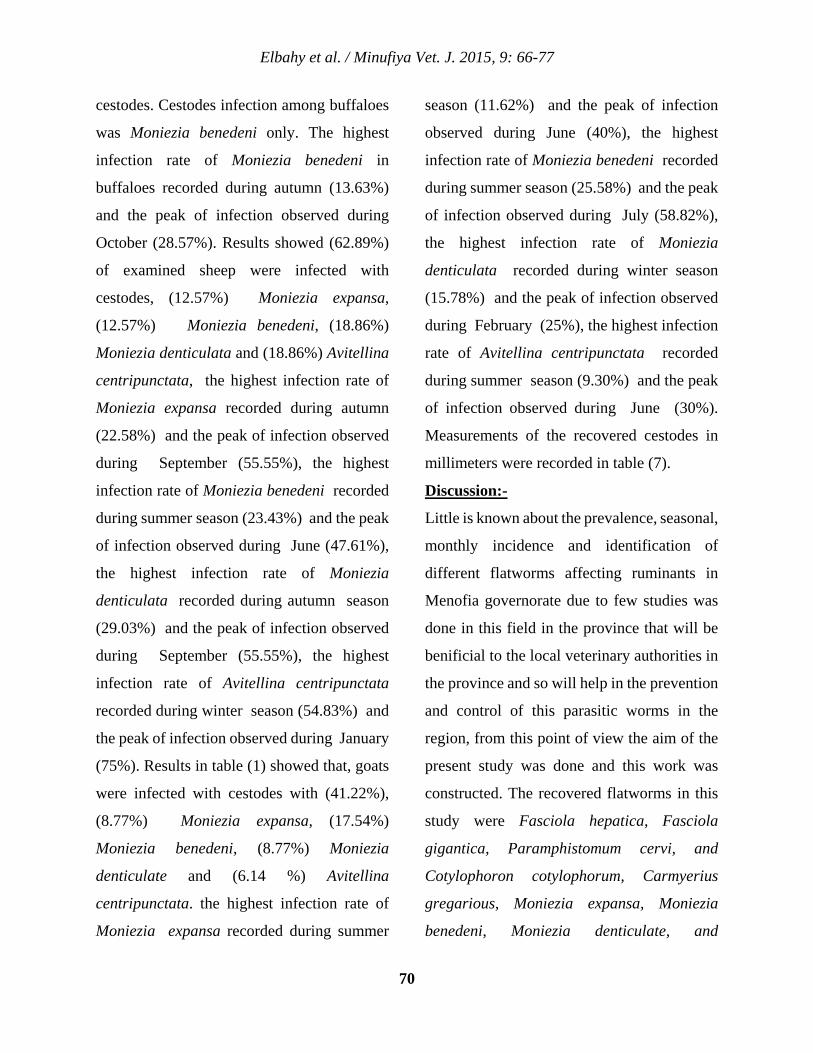
Elbahy et al. / Minufiya Vet. J. 2015, 9: 66-77
70
cestodes. Cestodes infection among buffaloes
was Moniezia benedeni only. The highest
infection rate of Moniezia benedeni in
buffaloes recorded during autumn (13.63%)
and the peak of infection observed during
October (28.57%). Results showed (62.89%)
of examined sheep were infected with
cestodes, (12.57%) Moniezia expansa,
(12.57%) Moniezia benedeni, (18.86%)
Moniezia denticulata and (18.86%) Avitellina
centripunctata, the highest infection rate of
Moniezia expansa recorded during autumn
(22.58%) and the peak of infection observed
during September (55.55%), the highest
infection rate of Moniezia benedeni recorded
during summer season (23.43%) and the peak
of infection observed during June (47.61%),
the highest infection rate of Moniezia
denticulata recorded during autumn season
(29.03%) and the peak of infection observed
during September (55.55%), the highest
infection rate of Avitellina centripunctata
recorded during winter season (54.83%) and
the peak of infection observed during January
(75%). Results in table (1) showed that, goats
were infected with cestodes with (41.22%),
(8.77%) Moniezia expansa, (17.54%)
Moniezia benedeni, (8.77%) Moniezia
denticulate and (6.14 %) Avitellina
centripunctata. the highest infection rate of
Moniezia expansa recorded during summer
season (11.62%) and the peak of infection
observed during June (40%), the highest
infection rate of Moniezia benedeni recorded
during summer season (25.58%) and the peak
of infection observed during July (58.82%),
the highest infection rate of Moniezia
denticulata recorded during winter season
(15.78%) and the peak of infection observed
during February (25%), the highest infection
rate of Avitellina centripunctata recorded
during summer season (9.30%) and the peak
of infection observed during June (30%).
Measurements of the recovered cestodes in
millimeters were recorded in table (7).
Discussion:-
Little is known about the prevalence, seasonal,
monthly incidence and identification of
different flatworms affecting ruminants in
Menofia governorate due to few studies was
done in this field in the province that will be
benificial to the local veterinary authorities in
the province and so will help in the prevention
and control of this parasitic worms in the
region, from this point of view the aim of the
present study was done and this work was
constructed. The recovered flatworms in this
study were Fasciola hepatica, Fasciola
gigantica, Paramphistomum cervi, and
Cotylophoron cotylophorum, Carmyerius
gregarious, Moniezia expansa, Moniezia
benedeni, Moniezia denticulate, and
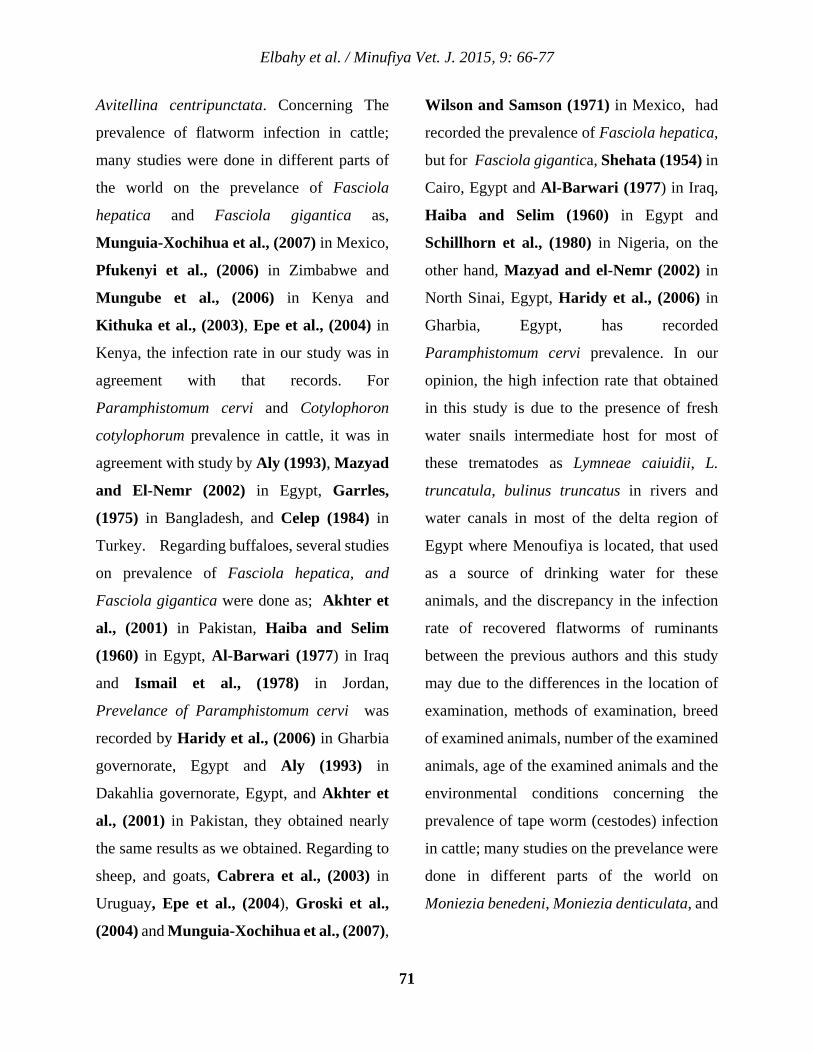
Elbahy et al. / Minufiya Vet. J. 2015, 9: 66-77
71
Avitellina centripunctata. Concerning The
prevalence of flatworm infection in cattle;
many studies were done in different parts of
the world on the prevelance of Fasciola
hepatica and Fasciola gigantica as,
Munguia-Xochihua et al., (2007) in Mexico,
Pfukenyi et al., (2006) in Zimbabwe and
Mungube et al., (2006) in Kenya and
Kithuka et al., (2003), Epe et al., (2004) in
Kenya, the infection rate in our study was in
agreement with that records. For
Paramphistomum cervi and Cotylophoron
cotylophorum prevalence in cattle, it was in
agreement with study by Aly (1993), Mazyad
and El-Nemr (2002) in Egypt, Garrles,
(1975) in Bangladesh, and Celep (1984) in
Turkey. Regarding buffaloes, several studies
on prevalence of Fasciola hepatica, and
Fasciola gigantica were done as; Akhter et
al., (2001) in Pakistan, Haiba and Selim
(1960) in Egypt, Al-Barwari (1977) in Iraq
and Ismail et al., (1978) in Jordan,
Prevelance of Paramphistomum cervi was
recorded by Haridy et al., (2006) in Gharbia
governorate, Egypt and Aly (1993) in
Dakahlia governorate, Egypt, and Akhter et
al., (2001) in Pakistan, they obtained nearly
the same results as we obtained. Regarding to
sheep, and goats, Cabrera et al., (2003) in
Uruguay, Epe et al., (2004), Groski et al.,
(2004) and Munguia-Xochihua et al., (2007),
Wilson and Samson (1971) in Mexico, had
recorded the prevalence of Fasciola hepatica,
but for Fasciola gigantica, Shehata (1954) in
Cairo, Egypt and Al-Barwari (1977) in Iraq,
Haiba and Selim (1960) in Egypt and
Schillhorn et al., (1980) in Nigeria, on the
other hand, Mazyad and el-Nemr (2002) in
North Sinai, Egypt, Haridy et al., (2006) in
Gharbia, Egypt, has recorded
Paramphistomum cervi prevalence. In our
opinion, the high infection rate that obtained
in this study is due to the presence of fresh
water snails intermediate host for most of
these trematodes as Lymneae caiuidii, L.
truncatula, bulinus truncatus in rivers and
water canals in most of the delta region of
Egypt where Menoufiya is located, that used
as a source of drinking water for these
animals, and the discrepancy in the infection
rate of recovered flatworms of ruminants
between the previous authors and this study
may due to the differences in the location of
examination, methods of examination, breed
of examined animals, number of the examined
animals, age of the examined animals and the
environmental conditions concerning the
prevalence of tape worm (cestodes) infection
in cattle; many studies on the prevelance were
done in different parts of the world on
Moniezia benedeni, Moniezia denticulata, and
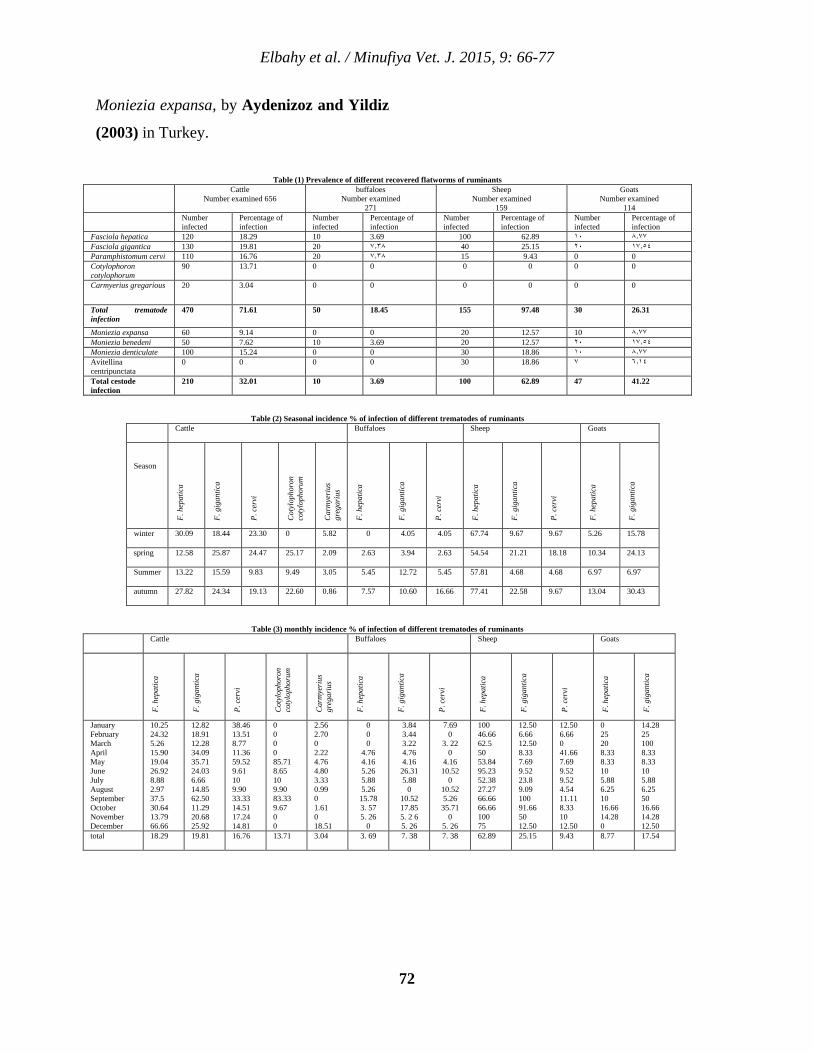
Elbahy et al. / Minufiya Vet. J. 2015, 9: 66-77
72
Moniezia expansa, by Aydenizoz and Yildiz
(2003) in Turkey.
Table (1) Prevalence of different recovered flatworms of ruminants Cattle
Number examined 656 buffaloes
Number examined 271
Sheep Number examined
159
Goats Number examined
114 Number infected
Percentage of infection
Number infected
Percentage of infection
Number infected
Percentage of infection
Number infected
Percentage of infection
Fasciola hepatica 120 18.29 10 3.69 100 62.89 ۱۰ ۸٫۷۷ Fasciola gigantica 130 19.81 20 ۷٫۳۸ 40 25.15 ۲۰ ۱۷٫٥٤ Paramphistomum cervi 110 16.76 20 ۷٫۳۸ 15 9.43 0 0 Cotylophoron cotylophorum
90 13.71 0 0 0 0 0 0
Carmyerius gregarious 20 3.04 0 0 0 0 0 0
Total trematode infection
470 71.61 50 18.45 155 97.48 30 26.31
Moniezia expansa 60 9.14 0 0 20 12.57 10 ۸٫۷۷ Moniezia benedeni 50 7.62 10 3.69 20 12.57 ۲۰ ۱۷٫٥٤ Moniezia denticulate 100 15.24 0 0 30 18.86 ۱۰ ۸٫۷۷ Avitellina centripunctata
0 0 0 0 30 18.86 ۷ ٦٫۱٤
Total cestode infection
210 32.01 10 3.69 100 62.89 47 41.22
Table (2) Seasonal incidence % of infection of different trematodes of ruminants Cattle Buffaloes Sheep Goats
Season
F. h
epat
ica
F. g
igan
tica
P. c
ervi
Cot
ylop
horo
n co
tylo
phor
um
Car
mye
rius
gr
egar
ius
F. h
epat
ica
F. g
igan
tica
P. c
ervi
F. h
epat
ica
F. g
igan
tica
P. c
ervi
F. h
epat
ica
F. g
igan
tica
winter 30.09 18.44 23.30 0 5.82 0 4.05 4.05 67.74 9.67 9.67 5.26 15.78
spring 12.58 25.87 24.47 25.17 2.09 2.63 3.94 2.63 54.54 21.21 18.18 10.34 24.13
Summer 13.22 15.59 9.83 9.49 3.05 5.45 12.72 5.45 57.81 4.68 4.68 6.97 6.97
autumn 27.82 24.34 19.13 22.60 0.86 7.57 10.60 16.66 77.41 22.58 9.67 13.04 30.43
Table (3) monthly incidence % of infection of different trematodes of ruminants Cattle Buffaloes Sheep Goats
F. h
epat
ica
F. g
igan
tica
P. c
ervi
Cot
ylop
horo
n co
tylo
phor
um
Car
mye
rius
gr
egar
ius
F. h
epat
ica
F. g
igan
tica
P. c
ervi
F. h
epat
ica
F. g
igan
tica
P. c
ervi
F. h
epat
ica
F. g
igan
tica
January February March April May June July August September October November December
10.25 24.32 5.26 15.90 19.04 26.92 8.88 2.97 37.5 30.64 13.79 66.66
12.82 18.91 12.28 34.09 35.71 24.03 6.66 14.85 62.50 11.29 20.68 25.92
38.46 13.51 8.77 11.36 59.52 9.61 10 9.90 33.33 14.51 17.24 14.81
000085.71 8.65 10 9.90 83.33 9.67 00
2.56 2.70 0 2.22 4.76 4.80 3.33 0.99 0 1.61 0 18.51
000
4.76 4.16 5.26 5.88 5.26 15.78 3. 575. 26
0
3.84 3.44 3.22 4.76 4.16 26.31 5.88
0 10.52 17.85 5. 2 65. 26
7.69 0
3. 220
4.16 10.52
0 10.52 5.26 35.71
0 5. 26
100 46.66 62.5 50 53.84 95.23 52.38 27.27 66.66 66.66 100 75
12.50 6.66 12.50 8.33 7.69 9.52 23.8 9.09 100 91.66 50 12.50
12.50 6.66 0 41.66 7.69 9.52 9.52 4.54 11.11 8.33 10 12.50
0 25 20 8.33 8.33 10 5.88 6.25 10 16.66 14.28 0
14.28 25 100 8.33 8.33 10 5.88 6.25 50 16.66 14.28 12.50
total 18.29 19.81 16.76 13.71 3.04 3. 69 7. 38 7. 38 62.89 25.15 9.43 8.77 17.54
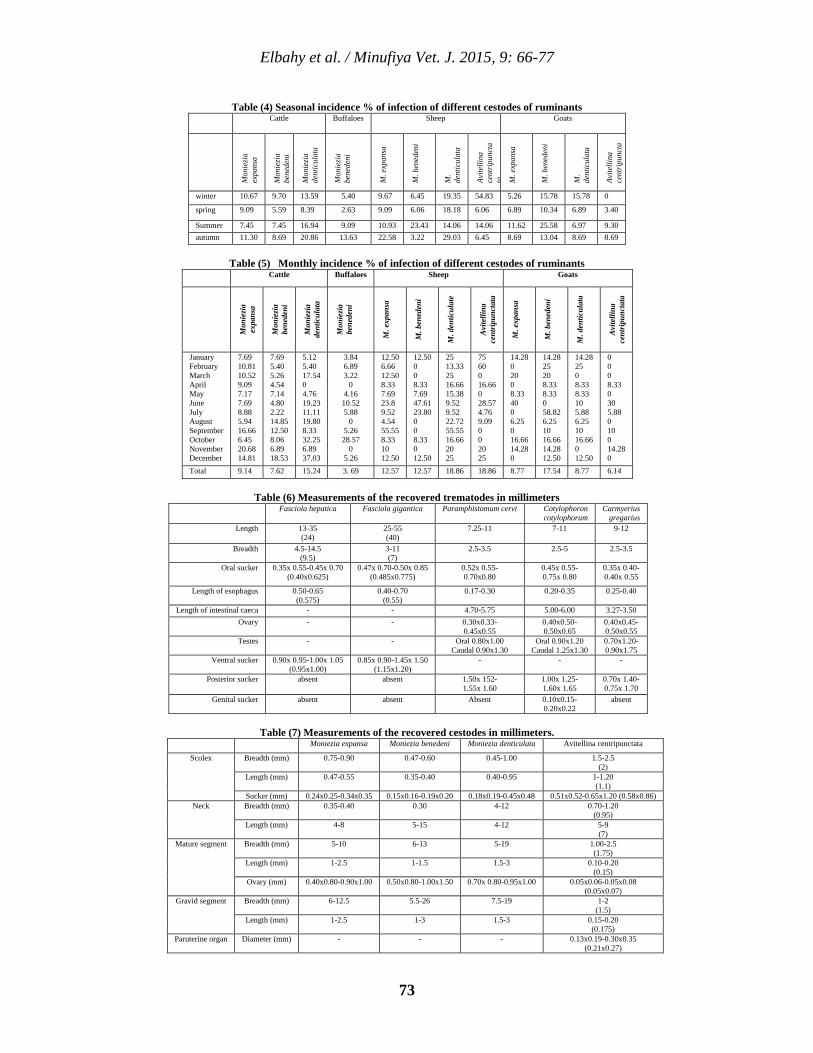
Elbahy et al. / Minufiya Vet. J. 2015, 9: 66-77
73
Table (4) Seasonal incidence % of infection of different cestodes of ruminants Cattle Buffaloes Sheep Goats
Mon
iezi
a ex
pans
a
Mon
iezi
a be
nede
ni
Mon
iezi
a de
ntic
ulat
a
Mon
iezi
a be
nede
ni
M. e
xpan
sa
M. b
ened
eni
M.
dent
icul
ata
Avite
llina
ce
ntri
punc
tata M
. exp
ansa
M. b
ened
eni
M.
dent
icul
ata
Avite
llina
ce
ntri
punc
ta
winter 10.67 9.70 13.59 5.40 9.67 6.45 19.35 54.83 5.26 15.78 15.78 0
spring 9.09 5.59 8.39 2.63 9.09 6.06 18.18 6.06 6.89 10.34 6.89 3.40
Summer 7.45 7.45 16.94 9.09 10.93 23.43 14.06 14.06 11.62 25.58 6.97 9.30 autumn 11.30 8.69 20.86 13.63 22.58 3.22 29.03 6.45 8.69 13.04 8.69 8.69
Table (5) Monthly incidence % of infection of different cestodes of ruminants Cattle Buffaloes Sheep Goats
Mon
iezi
a ex
pans
a
Mon
iezi
a be
nede
ni
Mon
iezi
a de
ntic
ulat
a
Mon
iezi
a be
nede
ni
M. e
xpan
sa
M. b
ened
eni
M. d
entic
ulat
e
Avi
telli
na
cent
ripu
ncta
ta
M. e
xpan
sa
M. b
ened
eni
M. d
entic
ulat
a
Avi
telli
na
cent
ripu
ncta
ta
January February March April May June July August September October November December
7.69 10.81 10.52 9.09 7.17 7.69 8.88 5.94 16.66 6.45 20.68 14.81
7.69 5.40 5.26 4.54 7.14 4.80 2.22 14.85 12.50 8.06 6.89 18.53
5.12 5.40 17.54 0 4.76 19.23 11.11 19.80 8.33 32.25 6.89 37.03
3.84 6.89 3.22
0 4.16 10.52 5.88
0 5.26 28.57
0 5.26
12.50 6.66 12.50 8.33 7.69 23.8 9.52 4.54 55.55 8.33 10 12.50
12.50 008.33 7.69 47.61 23.80 008.33 0 12.50
25 13.33 25 16.66 15.38 9.52 9.52 22.72 55.55 16.66 20 25
75 60 0 16.66 0 28.57 4.76 9.09 0020 25
14.28 0 20 0 8.33 40 0 6.25 0 16.66 14.28 0
14.28 25 20 8.33 8.33 0 58.82 6.25 10 16.66 14.28 12.50
14.28 25 0 8.33 8.33 10 5.88 6.25 10 16.66 0 12.50
0008.33 0 30 5.88 0 10 0 14.28 0
Total 9.14 7.62 15.24 3. 69 12.57 12.57 18.86 18.86 8.77 17.54 8.77 6.14
Table (6) Measurements of the recovered trematodes in millimeters Carmyerius
gregarius Cotylophoron cotylophorum
Paramphistomum cervi Fasciola gigantica Fasciola hepatica
9-12 7-11 7.25-11 25-55 (40)
13-35 (24)
Length
2.5-3.5 2.5-5 2.5-3.5 3-11 (7)
4.5-14.5 (9.5)
Breadth
0.35x 0.40- 0.40x 0.55
0.45x 0.55- 0.75x 0.80
0.52x 0.55- 0.70x0.80
0.47x 0.70-0.50x 0.85 (0.485x0.775)
0.35x 0.55-0.45x 0.70 (0.40x0.625)
Oral sucker
0.25-0.40 0.20-0.35 0.17-0.30 0.40-0.70 (0.55)
0.50-0.65 (0.575)
Length of esophagus
3.27-3.50 5.00-6.00 4.70-5.75 - - Length of intestinal caeca 0.40x0.45- 0.50x0.55
0.40x0.50- 0.50x0.65
0.30x0.33- 0.45x0.55
- - Ovary
0.70x1.20- 0.90x1.75
Oral 0.90x1.20 Caudal 1.25x1.30
Oral 0.80x1.00 Caudal 0.90x1.30
- - Testes
- - - 0.85x 0.90-1.45x 1.50 (1.15x1.20)
0.90x 0.95-1.00x 1.05 (0.95x1.00)
Ventral sucker
0.70x 1.40- 0.75x 1.70
1.00x 1.25- 1.60x 1.65
1.50x 152- 1.55x 1.60
absent absent Posterior sucker
absent 0.10x0.15- 0.20x0.22
Absent absent absent Genital sucker
Table (7) Measurements of the recovered cestodes in millimeters. Avitellina centripunctata Moniezia denticulata Moniezia benedeni Moniezia expansa
1.5-2.5 (2)
0.45-1.00 0.47-0.60 0.75-0.90 Breadth (mm) Scolex
1-1.20 (1.1)
0.40-0.95 0.35-0.40 0.47-0.55 Length (mm)
0.51x0.52-0.65x1.20 (0.58x0.86) 0.18x0.19-0.45x0.48 0.15x0.16-0.19x0.20 0.24x0.25-0.34x0.35 Sucker (mm) 0.70-1.20
(0.95) 4-12 0.30 0.35-0.40 Breadth (mm) Neck
5-9 (7)
4-12 5-15 4-8 Length (mm)
1.00-2.5 (1.75)
5-19 6-13 5-10 Breadth (mm) Mature segment
0.10-0.20 (0.15)
1.5-3 1-1.5 1-2.5 Length (mm)
0.05x0.06-0.05x0.08 (0.05x0.07)
0.70x 0.80-0.95x1.00 0.50x0.80-1.00x1.50 0.40x0.80-0.90x1.00 Ovary (mm)
1-2 (1.5)
7.5-19 5.5-26 6-12.5 Breadth (mm) Gravid segment
0.15-0.20 (0.175)
1.5-3 1-3 1-2.5 Length (mm)
0.13x0.19-0.30x0.35 (0.21x0.27)
- - - Diameter (mm) Paruterine organ
Elbahy et al. / Minufiya Vet. J. 2015, 9: 66-77
74
In sheep and goats, recorded by Heikal (1980)
in Behera, Hassan (1973), and Mazyad and
el-Nemr (2002) in north Sinai, Egypt, Umur
and Gicik (1995), Tinar et al., (1993),
Aydenizoz and Yildiz (2003) in Turkey, and
Cantoray et al., (1993) in Kenya, pal and
Qayyum (1993) in Pakistan. The infection
rate of Avitellina centripunctata was recorded
by Hassan (1973), El-Manyawe (1999) in
Cairo, Egypt and Umur and Gicik (1995) in
turkey, Leriche et al., (1973) in Cyprus.
Regarding seasonal and monthly incidence of
trematodes showed that, the highest infection
rate recorded during winter and spring season,
and the peak of infection observed during
December, this is may be due to this period
(spring, and winter) is the rainy season in the
year and a high amount of water is available
for snail reproduction and maintenance of
larval stages of trematodes to producing the
encysted metacercariae on vegetable and tree
leaves on water to become infective for
ruminants and continue the life cycle and more
infection, on the other hand, if water canals
and rivers is dried or even the air temperature
is high as in autumn and summer season, the
metacercariae cannot encysted and so
infection rate is low. for cestodes infection, the
highest infection rate of Moniezia expansa
recorded during autumn, and winter season
and the peak of infection observed during
November, and December, and this may be
due to the humidity and moderate temperature
that may be suitable for oribated mite
(intermediate host) in which the cysticercoids
is encysted.
References:-
Akhter, N.; Mohammed, I.R.; Mirbahar,
K.B.; Memon, M.I. and Soomro, S.A.
(2001): Prevalence of helminthiasis in
buffaloes in cattle colony Hyderabad. J. bio.
sci., 1 (3): 158-159.
Al-Barwari, S.E. (1977): A survey on liver
infections with F. gigantica in slaughtered
animals in Iraq. Bulletin of endemic diseases
(1977, publ. 1978) 18 (14).
Al-Farwachi, M.I. (2000): Occurrence of
internal parasites in cattle, Mosul, Iraq. Iraq
journal of veterinary sciences, 13 (1): 187-
191.
Aly, M.E.M. (1993): Some biological and
serological studies on gastrointestinal
helminth infection in cattle and buffaloes in
Dakahlia governorate. Ph. D. Fac. Vet. Med.
Cairo univ.
Aydenizoz, M. and Yildiz, K. (2003):
Prevalence of anoplocephalidae species in
sheep and cattle slaughtered in Kirikkale,
Turkey. Revue Med. Vet., 154(12): 767-771.
Cabrera, P.A.; Irabedra, P.; Orlando, D.;
Rista, L.; Haran, G.; Vinals, G.; Blanco,
M.T.; Alvarez, M.; Elola, S.; Morosoli, D.;
Elbahy et al. / Minufiya Vet. J. 2015, 9: 66-77
75
Morana, A.; Bondad, M.; Sambran, Y.;
Heinzen, T.; Chans, L.; Pineyro, L.; Perez,
D. and Pereyra, I. (2003): National
prevalence of larval echinococcosis in sheep
in slaughtering plants Ovis Aries as an
indicator in control programmes in Uruguay.
Acta. Trop., 85 (2): 281-285.
Cantoray, R.; Guclu, F. and Aydenizoz, M.
(1993): Prevalence of anoplocephalidae
species in sheep slaughtered at an abattoir in
Konya. Veteriner Fakultesi Dergisi, Selcuk
Univ., 9 (1): 53-57.
Cawthorne, R.J.C. (1984): Anthelminthics
for cattle, sheep, goats, pigs, horses and
poultry. MAFF publication lion house,
willowbum estate, Alinwick.
Celep, A. (1984): Results of the examination
of peripheral blood smears and
helminthological findings in the faeces of
cattle in the som sun and ordu provinces of
Turkey. Etlik Veteriner Mikrobiyoloji
Enstitusu Deryisi 5(617): 106-112.
El-Manyawe, S.M. (1999): Gastrointestinal
helminthes infecting goats in Cairo
governorate, Egypt. Beni-suef Vet. Med. J.,9
(3): 215-235.
El-Molla, A.; Fahmy, F.; Mohamed, A. and
Omran, H. (1981): Trials with some
anthelmintics against gastrointestinal
nematodes in camels. Zag. Vet.J. IV: 24-36.
Epe, C.; Coati, N. and Schnieder, T.(2004):
Results of parasitological examinations of
faecal `samples from horses, ruminants, pigs,
dogs, cats, hedgehogs and rabbits between
1998 and 2002. Dtsch Tierarztl Wochenschr,
111 (6): 243-247.
Garrles, G. (1975): Gastrointestinal parasite
infestation of cattle in some villages of Dacca
and Tangiil district in Bangladesh.
Bangladesh Vet. J. , 9 (1/4): 9-10.
Groski, P.; Roman, N.; Ewa, S.; Dominik,
P.; Agnieszka, G. and Halina, W. (2004):
Prevalence of protozoan and helminth internal
parasite infections in goat and sheep flocks in
Poland. Arch. Tierz., Dum. 47: 43-49.
Hassan, A.A. (1973): Studies on ovine
cestodes in A.R.E. M. V. Sc. Fac. Vet. Med.
Cairo univ., Egypt.
Haiba, M.H. and Selim, M.K. (1960): A
comparative preliminary biochemical study
on the effect of Fasciola infestation in the bile
and serum of Egyptian buffaloes, cows and
sheep. Z. P. parasitenkunde. 19 : 535-549.
Haridy, F.M; El-Sherbiny, G.T. and
Morsy, T.A. (2006): Some parasitic flukes
infecting farm animals in Al-Santa Center,
Gharbia Governorate, Egypt. J. Egypt Soc.
Parasitol, 36 (1): 259-264.
Ismail, N.S. ; Saliba, E.K. and Lutfy, R.C.
(1978): Fascioliasis in Azrag oases, Jordan, I.
incidence and degree of infection in cows and
Elbahy et al. / Minufiya Vet. J. 2015, 9: 66-77
76
buffaloes. Acta. Parasitologica polonica. 25
:233-340.
Hiekal, F.A. (1980): Studies on tapeworms
infesting ruminants in behera governorate. M.
V. Sc. Fac. Vet. Med. Cairo univ.
Kithuka, J.M.; Maingi, N.; Njeruh, F.M.
and Ombui, J.N. (2003): The prevalence and
economic importance of bovine fasciolosis in
Kenya-an analysis of abattoir data.
Onderstepoort J. Vet. Res., 69 (4): 255-262.
Khalil, L.F.; Jones, A. and Bray, R.A.
(1994): Keys to the cestode parasites of
vertebrates. International institute of
parasitology (an institute of CAB
International).
Khan, M.Q. (1993): Prevalence of
gastrointestinal parasites in sheep and goats
slaughtered at Rawalpindi abattoir. J. Anim.
Health.& prod., (12-13): 14-16.
Le Riche, P.D.; Efstathiou, G.C.; Campbell,
J.B. and Altan, Y. (1973): A helminth survey
of sheep and goats in Cyprus. I. The seasonal
distribution and prevalence of gastrointestinal
parasites. J. Helminthol., 47 (3): 237-250.
Mazyad, S. and El-Nemr, H. (2002): The
endoparasites of sheep and goats, and
shepherd in North Sinai Governorate, Egypt.
J. Egypt Soc. Parasitol, 32 (1): 119-126.
Mungube, E.O.; Bauni, S.M.; Tenhagen,
B.A.; Wamae, L.W.; Nginyi, J.M. and
Mugambi, J.M. (2006): The prevalence and
economic significance of Fasciola gigantica
and Stilesia hepatica in slaughtered animals in
the semi-arid coastal Kenya. Trop. Anim
.Health Prod., 38 (6): 475-483.
Munguia-Xochihua, J.; Ibarra-Velarde, F.;
Ducoing-Watty, A.; Montenegro-Cristino,
N. and Quiroz-Romero, H. (2007):
Prevalence of Fasciola hepatica (ELISA and
fecal analysis) in ruminants from a semi-
desert area in the northwest of Mexico.
Parasitol Res.
Pal, R.A. and Qayyum, M. (1993b):
Distribution of gastrointestinal amphistomes
and cestodes in small ruminants grazed on
irrigated and non irrigated pasture zones. Proc.
Pakistan cong. Zool., 13(3): 307-313.
Pfukenyi, D.M.; Mukaratirwa, S.;
Willingham, A.L. and Monrad, J. (2006):
Epidemiological studies of Fasciola gigantica
infections in cattle in the highveld and lowveld
communal grazing areas of Zimbabwe.
Onderstepoort J. Vet. Res., 73 (1): 37-51.
Pritchard, M.N. and Kruse, O.W. (1982):
Tec. Collection and preservation of animal
parasites. Technical Bull.1 Univ. Nebraska
Lincolon London, 141.
Schillhorn, V.V.; Foloram, D.O.B.; Usman,
S. and Ishaya, T. (1980): Incidence of liver
fluke infection (F. gigantica and dicrocoelium
hospes) in ruminants in northern Nigeria.
Trop. Anim. Helth. Prod. 12 (2) : 97-107.
Elbahy et al. / Minufiya Vet. J. 2015, 9: 66-77
77
Shehata, H.A. (1954): Some studies on
fascioliasis as animal problem. Ph. D. Fac.
Vet. Med. Alex. Univ.
Soulsby, E.J.L. (1986): Heminths,
Arthropods and protozoa of domesticated
animals. 7th ed. Baillier, Tidal and Cassel,
London.
Tinar, R.; Coskun, S.Z.; Demir, S.; Akyol,
C.V. ; Dogan, H. and Aydin, L. (1993):
Cestode species (Anoplocephalidae) and their
prevalence in ruminants slaughtered at the
Bursa meat and fish plant. Veteriner Fakultesi
Dergisi, Uludag Univ., 12 (3): 32-40.
Umur, S. and Gicik, Y. (1995): Incidence of
anoplocephalidae species in ruminants in Kars
district, Turkey. Turkiye Parazitoloji Dergisi,
19(2): 272-281.
Urquhart, G.M.; Armour, P.; Duncan, J.L.,
Dunn, A.M. and Jennings, F.W. (1996):
Veterinary Parastitology. ELBS. Longman.
England 2nd ed.
Wilson, G.I. and Samsson, K.S. (1971): The
incidence of fascioliasis of sheep and cattle in
the south west with observations on snail
vectors. Proc. Helminth Sco. Wash. 38, 952.
78
Introduction
Mastitis is a global problem in dairy herds as
it adversely affects animal health, and milk
production (Sharma et al., 2012). High losses
attributed to mastitis includes reduction of
milk yield, low grade of milk quality,
premature culling and treatment costs
(Fetrow, 2000). Wide variety of bacteria can
be involved in udder infection, but the most
common bacteria causing mastitis in Egypt are
Staphylococcus Species, Streptococcus
Species and Escherichia coli (Ahmed and
Mohammed, 2008). Application of PCR for
mastitis diagnosis will be helpful for rapid
application of the preventive measures of the
disease (Qing-Hil et al., 2008) PCR tend to
Studies on clinical and subclinical mastitis in Menoufia Governate with application of PCR for diagnosis
Walid S. Mousa a*, Ahmed A. Zaghawa a, Mohammed A. Nayel a, Eman E. Abdeen b, Ahmed M. Elsify a and Akram A Salama a
a Department of Animal Medicine and Infectious Diseases, Faculty of Veterinary Medicine, University of Sadat City, Menoufia 32511, Egypt. b Department of Bacteriology, Mycology and Immunology, Faculty of veterinary medicine, University of Sadat City, Menoufia 32511, Egypt.
*Corresponding Author: [email protected] Accepted: 15/7/2015
Abstract:
Bovine mastitis is a serious problem in the dairy herds all over the world. In this study 105
mastitic milk samples were collected from small holder’s cows for bacteriological and
molecular diagnosis. The prevalence of clinical and subclinical mastitis were 20.5% and
32% respectively which were detected by clinical examination and California Mastitis Test
respectively. Bacteriological results revealed that Staphylococcus aureus was the most
common isolated bacteria from both clinical and subclinical mastitis. Streptococcus species,
Pseudomonas species, E. coli and Enterobacter species were also isolated. Application of
multiplex PCR was effective in identification of bacteria causing mastitis directly from milk
samples and from extracted DNA of bacteria
Keywords: Mastitis, Prevalence, Staphylococcus aureus, Multiplex PCR.
Minufiya Veterinary Journal ISSN: 1110-9750
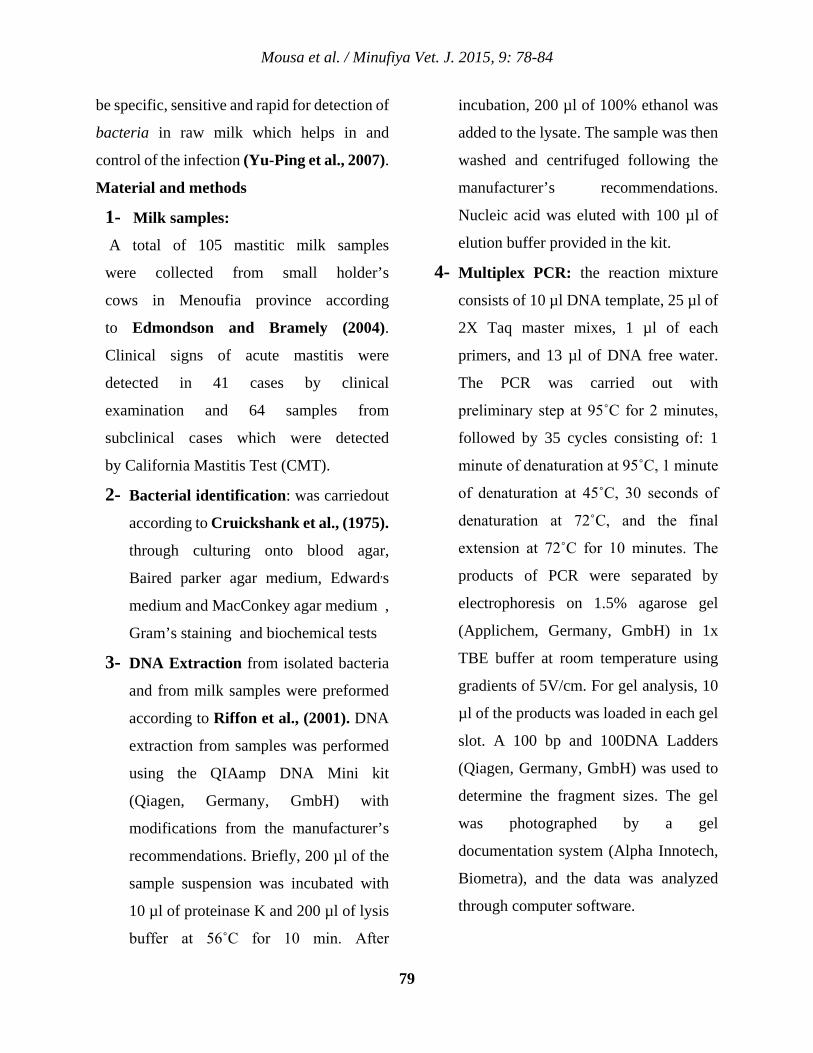
Mousa et al. / Minufiya Vet. J. 2015, 9: 78-84
79
be specific, sensitive and rapid for detection of
bacteria in raw milk which helps in and
control of the infection (Yu-Ping et al., 2007).
Material and methods
1- Milk samples:
A total of 105 mastitic milk samples
were collected from small holder’s
cows in Menoufia province according
to Edmondson and Bramely (2004).
Clinical signs of acute mastitis were
detected in 41 cases by clinical
examination and 64 samples from
subclinical cases which were detected
by California Mastitis Test (CMT).
2- Bacterial identification: was carriedout
according to Cruickshank et al., (1975).
through culturing onto blood agar,
Baired parker agar medium, Edward,s
medium and MacConkey agar medium ,
Gram’s staining and biochemical tests
3- DNA Extraction from isolated bacteria
and from milk samples were preformed
according to Riffon et al., (2001). DNA
extraction from samples was performed
using the QIAamp DNA Mini kit
(Qiagen, Germany, GmbH) with
modifications from the manufacturer’s
recommendations. Briefly, 200 µl of the
sample suspension was incubated with
10 µl of proteinase K and 200 µl of lysis
buffer at 56˚C for 10 min. After
incubation, 200 µl of 100% ethanol was
added to the lysate. The sample was then
washed and centrifuged following the
manufacturer’s recommendations.
Nucleic acid was eluted with 100 µl of
elution buffer provided in the kit.
4- Multiplex PCR: the reaction mixture
consists of 10 µl DNA template, 25 µl of
2X Taq master mixes, 1 µl of each
primers, and 13 µl of DNA free water.
The PCR was carried out with
preliminary step at 95˚C for 2 minutes,
followed by 35 cycles consisting of: 1
minute of denaturation at 95˚C, 1 minute
of denaturation at 45˚C, 30 seconds of
denaturation at 72˚C, and the final
extension at 72˚C for 10 minutes. The
products of PCR were separated by
electrophoresis on 1.5% agarose gel
(Applichem, Germany, GmbH) in 1x
TBE buffer at room temperature using
gradients of 5V/cm. For gel analysis, 10
µl of the products was loaded in each gel
slot. A 100 bp and 100DNA Ladders
(Qiagen, Germany, GmbH) was used to
determine the fragment sizes. The gel
was photographed by a gel
documentation system (Alpha Innotech,
Biometra), and the data was analyzed
through computer software.
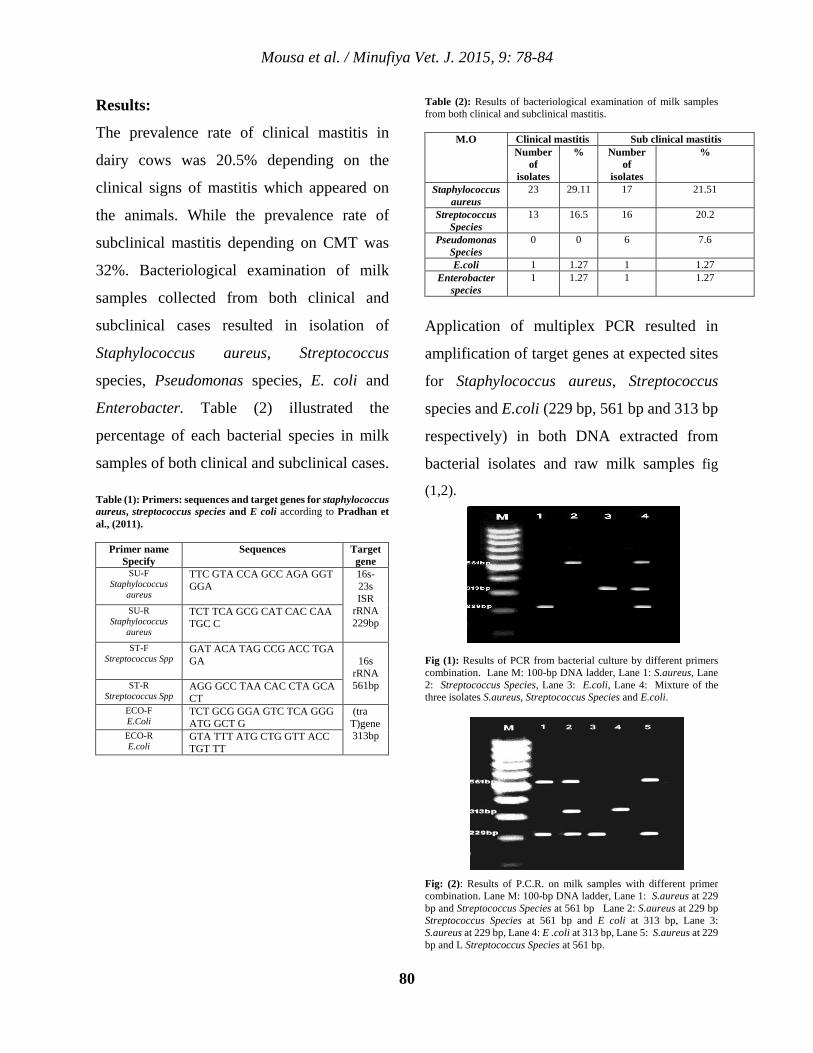
Mousa et al. / Minufiya Vet. J. 2015, 9: 78-84
80
Results:
The prevalence rate of clinical mastitis in
dairy cows was 20.5% depending on the
clinical signs of mastitis which appeared on
the animals. While the prevalence rate of
subclinical mastitis depending on CMT was
32%. Bacteriological examination of milk
samples collected from both clinical and
subclinical cases resulted in isolation of
Staphylococcus aureus, Streptococcus
species, Pseudomonas species, E. coli and
Enterobacter. Table (2) illustrated the
percentage of each bacterial species in milk
samples of both clinical and subclinical cases.
Table (1): Primers: sequences and target genes for staphylococcus aureus, streptococcus species and E coli according to Pradhan et al., (2011).
Target gene
Sequences Primer name Specify
16s-23s ISR
rRNA 229bp
TTC GTA CCA GCC AGA GGT GGA
SU-F Staphylococcus
aureus
TCT TCA GCG CAT CAC CAA TGC C
SU-R Staphylococcus
aureus
16s rRNA 561bp
GAT ACA TAG CCG ACC TGA GA
ST-F Streptococcus Spp
AGG GCC TAA CAC CTA GCA CT
ST-R Streptococcus Spp
(tra T)gene 313bp
TCT GCG GGA GTC TCA GGG ATG GCT G
ECO-F E.Coli
GTA TTT ATG CTG GTT ACC TGT TT
ECO-R E.coli
Table (2): Results of bacteriological examination of milk samples from both clinical and subclinical mastitis.
Sub clinical mastitis Clinical mastitis M.O % Number
of isolates
% Number of
isolates 21.51 17 29.11 23 Staphylococcus
aureus 20.2 16 16.5 13 Streptococcus
Species 7.6 6 0 0 Pseudomonas
Species 1.27 1 1.27 1 E.coli 1.27 1 1.27 1 Enterobacter
species
Application of multiplex PCR resulted in
amplification of target genes at expected sites
for Staphylococcus aureus, Streptococcus
species and E.coli (229 bp, 561 bp and 313 bp
respectively) in both DNA extracted from
bacterial isolates and raw milk samples fig
(1,2).
Fig (1): Results of PCR from bacterial culture by different primers combination. Lane M: 100-bp DNA ladder, Lane 1: S.aureus, Lane 2: Streptococcus Species, Lane 3: E.coli, Lane 4: Mixture of the three isolates S.aureus, Streptococcus Species and E.coli.
Fig: (2): Results of P.C.R. on milk samples with different primer combination. Lane M: 100-bp DNA ladder, Lane 1: S.aureus at 229 bp and Streptococcus Species at 561 bp Lane 2: S.aureus at 229 bp Streptococcus Species at 561 bp and E coli at 313 bp, Lane 3: S.aureus at 229 bp, Lane 4: E .coli at 313 bp, Lane 5: S.aureus at 229 bp and L Streptococcus Species at 561 bp.
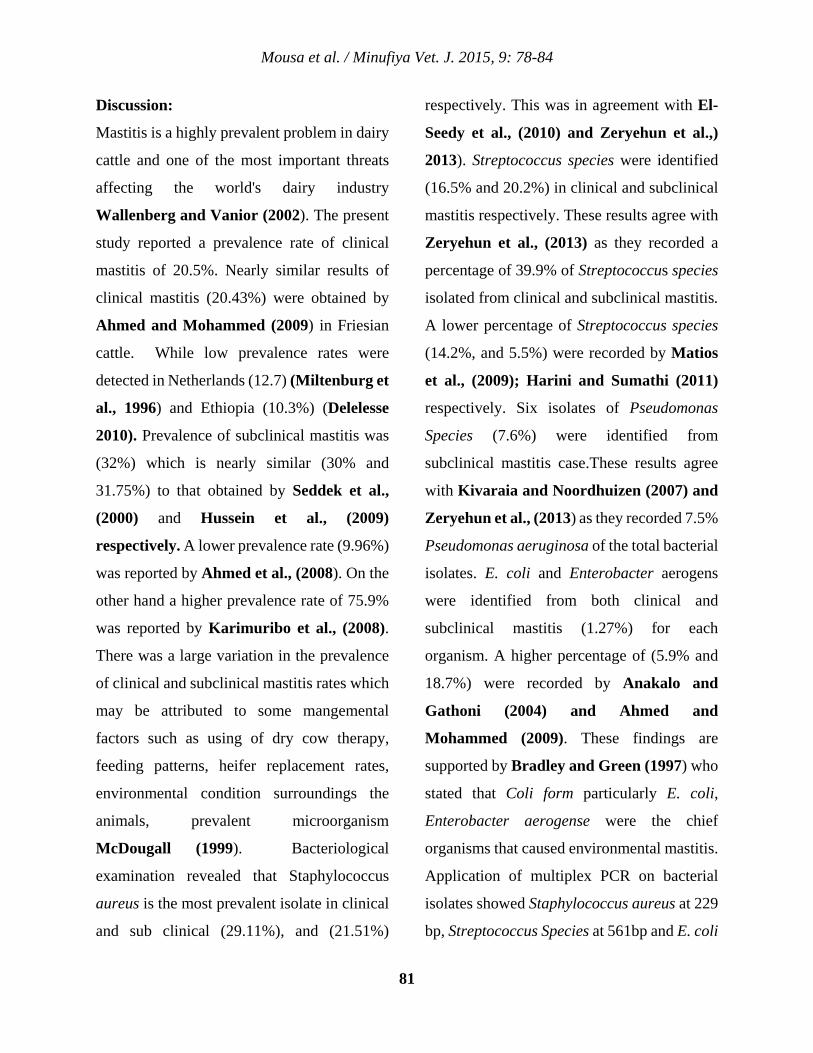
Mousa et al. / Minufiya Vet. J. 2015, 9: 78-84
81
Discussion:
Mastitis is a highly prevalent problem in dairy
cattle and one of the most important threats
affecting the world's dairy industry
Wallenberg and Vanior (2002). The present
study reported a prevalence rate of clinical
mastitis of 20.5%. Nearly similar results of
clinical mastitis (20.43%) were obtained by
Ahmed and Mohammed (2009) in Friesian
cattle. While low prevalence rates were
detected in Netherlands (12.7) (Miltenburg et
al., 1996) and Ethiopia (10.3%) (Delelesse
2010). Prevalence of subclinical mastitis was
(32%) which is nearly similar (30% and
31.75%) to that obtained by Seddek et al.,
(2000) and Hussein et al., (2009)
respectively. A lower prevalence rate (9.96%)
was reported by Ahmed et al., (2008). On the
other hand a higher prevalence rate of 75.9%
was reported by Karimuribo et al., (2008).
There was a large variation in the prevalence
of clinical and subclinical mastitis rates which
may be attributed to some mangemental
factors such as using of dry cow therapy,
feeding patterns, heifer replacement rates,
environmental condition surroundings the
animals, prevalent microorganism
McDougall (1999). Bacteriological
examination revealed that Staphylococcus
aureus is the most prevalent isolate in clinical
and sub clinical (29.11%), and (21.51%)
respectively. This was in agreement with El-
Seedy et al., (2010 ) and Zeryehun et al.,)
2013). Streptococcus species were identified
(16.5% and 20.2%) in clinical and subclinical
mastitis respectively. These results agree with
Zeryehun et al., (2013) as they recorded a
percentage of 39.9% of Streptococcus species
isolated from clinical and subclinical mastitis.
A lower percentage of Streptococcus species
(14.2%, and 5.5%) were recorded by Matios
et al., (2009); Harini and Sumathi (2011)
respectively. Six isolates of Pseudomonas
Species (7.6%) were identified from
subclinical mastitis case.These results agree
with Kivaraia and Noordhuizen (2007) and
Zeryehun et al., (2013) as they recorded 7.5%
Pseudomonas aeruginosa of the total bacterial
isolates. E. coli and Enterobacter aerogens
were identified from both clinical and
subclinical mastitis (1.27%) for each
organism. A higher percentage of (5.9% and
18.7%) were recorded by Anakalo and
Gathoni (2004) and Ahmed and
Mohammed (2009). These findings are
supported by Bradley and Green (1997) who
stated that Coli form particularly E. coli,
Enterobacter aerogense were the chief
organisms that caused environmental mastitis.
Application of multiplex PCR on bacterial
isolates showed Staphylococcus aureus at 229
bp, Streptococcus Species at 561bp and E. coli
Mousa et al. / Minufiya Vet. J. 2015, 9: 78-84
82
at 313 bp. These results are in agreement with
(Alaa et al., 2008 and Phuektes et al., 2001).
Also application of multiplex PCR on milk
samples directly without the need for culture
step showed Staphylococcus aureus,
Streptococcus species and E coli were
detected at 229 bp, 561 bp and 313 bp)
respectively. The obtained results are in
agreement with Yamagishi et al., (2007) and
Amin et al., (2011).
References:
Ahmed, A.R. and Mohammed, S
(2008): Acute clinically mastitis animals
in villages of Assiut Governance:
Diagnosis and Treatment. Veterinary
World, (1): 261-264.
Ahmed, A.R. and Mohammed, S.
(2009): Epidemiological studies on
subclinical mastitis in dairy cows in
Assiut Governorate. Veterinary World,
Vol. 2(10): 373-380.
Ahmed, W.M.; Sherein, I. A. and
Ghada, M. N. (2008): Observation on
sub-clinical mastitis in Buffalo-cows
with Emphasis on measuring of milk
electrical resistance for its early
detection. Global Veterinaria 2(1): 41-
45.
Alaa, A.M. E.; Mohamed, A.; Hamza,
E. and Nagla, H. (2008): Application of
PCR as a diagnostic tool of clinical
mastitis in dairy cattle in comparison to
traditional methods. Veterinary Serum
and Vaccine Research Institute .Vol
13(1):61-68.
Amin, A.S.; Hamouda, R. H. and
Abeer, A.A. (2011): PCR assay for
detection major pathogens of mastitis in
milk samples. World Journal of Dairy
&Food Sciences, 6(2): 199-206.
Anakalo, S. and Gathoni, K. (2004):
Assessment of the California mastitis
test usage in smallholder dairy herds and
risk of volatile antimicrobial residues.
J.Vet. Sci. Vol (5):5-9.
Bradley, A.J. and Green, M.J. (1997):
Clinical mastitis in dairy cows after (blitz)
therapy. Vet Res. Vol (141): 179-180.
Cruickshank, R.; Duguid, J.P.;
Marmion, B.P. and Swain, R.H.A.
(1975): Medical Microbiology. The
Practice of Medical Microbiology. 12 Th
Ed., Churchill. Livingstone, Edinburgh,
London, New York.
Delelesse,G. D. (2010): Study on prevalence
of bovine mastitis on Cross breed dairy cow
around Holeta areas, West Shoa Zone of
Oromia, Ethiopia. Global Vet. 5 (6): 318-323.
Edmondson, P.W. and Bramley, A. J.
(2004): Mastitis. In: Andrew, A.H., et al.
(Eds.) Bovine Medicine diseases and
Mousa et al. / Minufiya Vet. J. 2015, 9: 78-84
83
husbandry of cattle. Pp. 326-336. Back
well Science.
El-Seedy, F.R.; El-Shabrawy, M.;
Hakim, A.S.; Dorgham, S.M.; Nagwa,
S.; Bakry, M.A. and Osman, N.M.N.
(2010):Recent Techniques used for
isolation and characterization of
Staphylococcus aureus from mastitis
cows. J.Am. Sci. 6 (2) : 701-708.
Fetrow, J. (2000): Mastitis on economic
consideration pages 3-47.in proc. National
mastitis Council. Madison, Wisconsin.
Harini, H. and Sumathi, B.R. (2011):
Screening of bovine milk samples for
subclinical mastitis and antibiogram of
bacterial isolates. Vet World. 4 (8): 358-
359.
Hussein, M.M.; Agawany, A.A. E. and
Khalil, A.A.Y. (2009): Influence of
subclinical mastitis on some reproductive
parameters in Holstein-Friesian dairy cows.
Veterinary Medical Journal Giza. Vol 57(1):
97-113.
Karimuribo, E.D.; Swia, E.S.; Ogden,
N. H. and French, N.P. (2008):
Prevalence of subclinical mastitis and
associated risk factors in smallholder
dairy cows in Tanzania. British
Veterinary Association. 163: 16-21.
Kivaraia, F.M.; Noordhuizen, J.P. and
Msami, H.M. (2007): Risk factors
associated with the incidence rate of
clinical mastitis in smallholder dairy
cows in the Dar es Salaam region of
Tanzania. Vet Journal (173): 623-629.
Matios, L.; Tadele, T. and Worku, T.
(2009): Prevalence and major bacterial
causes of bovine mastitis in Asella,
South Eastern Ethiopia. Tropical Animal
Health and Production. Vol 41(7): 1525-
1530.
McDougall, S. (1999): prevalence of clinical
mastitis in 38 Waikats dairy herds in early
lactation. N.Z.Vet.J. vol 74(4): 143-149.
Miltenburg, J. D.; De Lange, D.;
Crauwels, A.P.; Bongers, J.H.; Tielen,
M.J.; Shucking, Y.H. and Elbers, A.R.
(1996): Incidence of clinical mastitis in a
random sample of dairy herds in the
southern Netherlands. Vet Rec. 139 (9):
204-207.
Phuektes, P.; Mansell, P.D. and
Browning, G. F. (2001): Multiplex
polymerase chain reaction assay for
simultaneous detection of
Staphylococcus aureus and
Streptococcal causes of bovine mastitis.
J Dairy Sci. Vol 84 (5): 1140-1148.
Pradhan, P.; Gopinath, S.M.; Reddy,
G.R.; Dechamma, H. and
Suryanarayana, V.V.S. (2011):
Mousa et al. / Minufiya Vet. J. 2015, 9: 78-84
84
Detection of major pathogens in bovine
subclinical mastitis by multiplex PCR
directly from milk samples in presence
of an internal control. Journal of
Fundamental and Applied Life Science.
Vol (1): 209-218.
Qing-Hil, M.A.; Zhou, Y.U.; Feng, L.I.
and Ping, L. (2008): Progress on
subclinical mastitis in Dairy cows.
Progress in Veterinary Medicine.
Riffon, R.; Sayasith, K.; Khalil, H.;
Dubreuil, P.; Drolet, M. and Lagace,
J. (2001): Development of a rapid and
sensitive test for identification for major
pathogens in bovine mastitis by PCR. J.
Clinical Microbiol, 39(7): 2584-2589.
Seddek, S.R.; El-Kader, H.A. and
Bastawrows, A.F. (2000): Incidence of
Pseudomonas organisms in clinical,
subclinical mastitis and raw milk of
cattle in Assuit Governorate. Assuit
Veterinary Medical Journal. Vol 44 (87):
139-148.
Sharma, N.; Gyu, J.R.; Yeong, H.H.;
Tae, Y.K.; Hak, K.L.; Tai-Young, H.
and Dong, K.J. (2012): Bovine mastitis
: An Asian perspective. Asian Journal of
Animal and Veterinary Advances. Vol 7:
454-476.
Wallenberg, G.J. and Vanior, J.T.
(2002): Viral infection and bovine
mastitis. J.Vet. Microbiol., 88: 27-45.
Yamagishi, N.; Jinkawa, Y.; Omoe,
K.; Makino, S. and Oboshi, K. (2007):
Sensitive test for screening for
Staphylococcus aureus in bovine
mastitis by broth cultivation and PCR.
Veterinary Record, 161 (11): 381-383.
Yu-Ping, S.; Dong-Shun, Z.; Hong-
kun, Z.; Ren-Zhong, W.; Wen-
Quiang, L. and Jin-Dong, H. (2007): A
nested PCR-based method for detection
of Streptococcus agalactia 16sr RNA in
milk and its application. Chinese Journal
of Agricultural Biotechnology. Vol (3):
115-118.
Zeryehun, T.; Aya, T. and Bayecha, R.
(2013): Study on prevalence, bacterial
pathogens and associated risk factors of
bovine mastitis in small holder dairy
farms in and around Addis Ababa,
Ethiopia. The Journal of Animal& plant
Sciences, 23 (1): 50-55.
85
Introduction:
Clostridium perfringens is a spore forming;
anaerobic bacteria widely distributed in the
soil and the digestive tract of many domestic
animals and they produce a number of toxins
that result in enteric and histotoxic disease.
Clostridium perfringens isolates are classified
into five types designated A, B, C, D and E
according to their ability to produce the four
major lethal toxins: the alpha (CPA), beta
(CPB), epsilon (ETX), and iota (ITX) toxins.
The activities of the major lethal toxins are the
basis of the pathogenesis of the classical
enterotoxaemia attributed to this organism.
Recently, it has been recognized that
Clostridium perfringens produces other toxins
of probable importance in animal disease,
such as enterotoxin and a cytotoxic beta -2
toxin, the latter encoded by the cbp2 gene
(Radostitis et al., 2007). On the other hand
Clostridium perfringens produces minor
toxins such as eta, theta (θ), kappa, lambda,
mu, nu toxins, neuraminidase, sialidase,
A review on Clostridium perfringens toxins with special reference to Beta 2 toxin
Ahmed M. Elsify *.
a Department of Animal Medicine and Infectious Diseases, Faculty of Veterinary Medicine, University of Sadat City, Menoufia 32511, Egypt. *Corresponding Author: [email protected] Accepted: 17/8/2015
Abstract: Clostridium perfringens toxins are the main cause of lesions and symptoms associated with diseases
caused by its infection. There are two main groups of toxins; major and minor. The major toxins
are alpha (CPA), beta (CPB), epsilon (ETX), and iota (ITX) toxins. Theses toxins are lethal and
necrotizing agents. minor toxins such as eta, theta (θ), kappa, lambda, mu, nu toxins, neuraminidase,
sialidase, enterotoxin, non-alpha-delta-theta hemolysin, and metabolic active substance. Recently
there are newly discovered toxins Such as enterotoxin and a cytotoxic beta -2 toxin. Theses toxins
may play an important role in pathogenesis of the diseases and need more investigation. Here we
summarized important data about Clostridium perfringens toxins.
Keywords: Clostridium perfringens, Toxins, Beta-2 toxins and Pathogensis.
Minufiya Veterinary Journal ISSN: 1110-9750
Elsify / Minufiya Vet. J. 2015, 9: 85-100
86
enterotoxin, non-alpha-delta-theta hemolysin,
and metabolic active substance (Louis 1979).
Clostridium perfringens alpha toxin
(CPA):
Alpha-toxin, produced in large amounts by
type A strains, is a phospholipase C; and is
believed to be the major factor responsible for
the tissue pathology in myonecrosis (gas
gangrene) caused by this organism (Stevens et
al., 1988). All Clostridium perfringens strains
possess the gene encoding CPA. This gene
(cpa) is chromosomally encoded and located
close to the origin of replication, which is one
of the most stable regions within the bacterial
chromosome (Canard and Cole 1989).
CPA is a 43 kDa protein comprised of 370
amino acids. It contains two domains, an
alpha-helical N-terminal domain harboring
the phospholipase C active site, and an alpha-
sandwich C-terminal domain which is
involved in membrane binding (Uzal et al.,
2010).
Alpha-toxin has been shown to affect
myocardial function, causing hypotension and
bradycardia, resulting in shock, a common and
often fatal feature of gas gangrene (Stevens et
al., 1988). The toxin also increases vascular
permeability, as can be demonstrated by i.d.
injection (Sugahara et al., 1977). CPA is a
classic example of a toxin that modifies cell
membranes by enzymatic activity. This toxin
is a zinc-dependent phospholipase C which
degrades phosphatidylcholine and
sphingomyelin, both components of the
eukaryiotic cell membranes causing damage
on the membrane of erythrocytes and other
cells from many animal species. The net result
of this action is cell lysis, by degradation of
membrane phospholipids. CPA also activates
several other membrane and internal cell
mechanisms that lead to hemolysis. In
addition, CPA activates the arachidonic
cascade resulting in the formation of
thromboxanes, leukotrienes and
prostaglandins, which activate the
inflammation cascade and produce
vasoconstriction (Tiball et al., 1999, Sakurai
et al., 1993, Oda 2008 and Sakurai et al.,
2004). CPA associated with yellow lamb
disease, gas gangrene in humans and
malignant edema of domestic animals
including sheep, goat, cattle and horse (Uzal
et al., 2010). Its role still frequently blamed
for enteritis, abomasitis and/or enterotoxemia
in cattle (Manteca et al., 2002 and Songer
and Miskimins 2005), horses (Bacciarini
2003 and water et al., 2005), goats (Songer
1998) and pigs (Saenz et al., 2007).
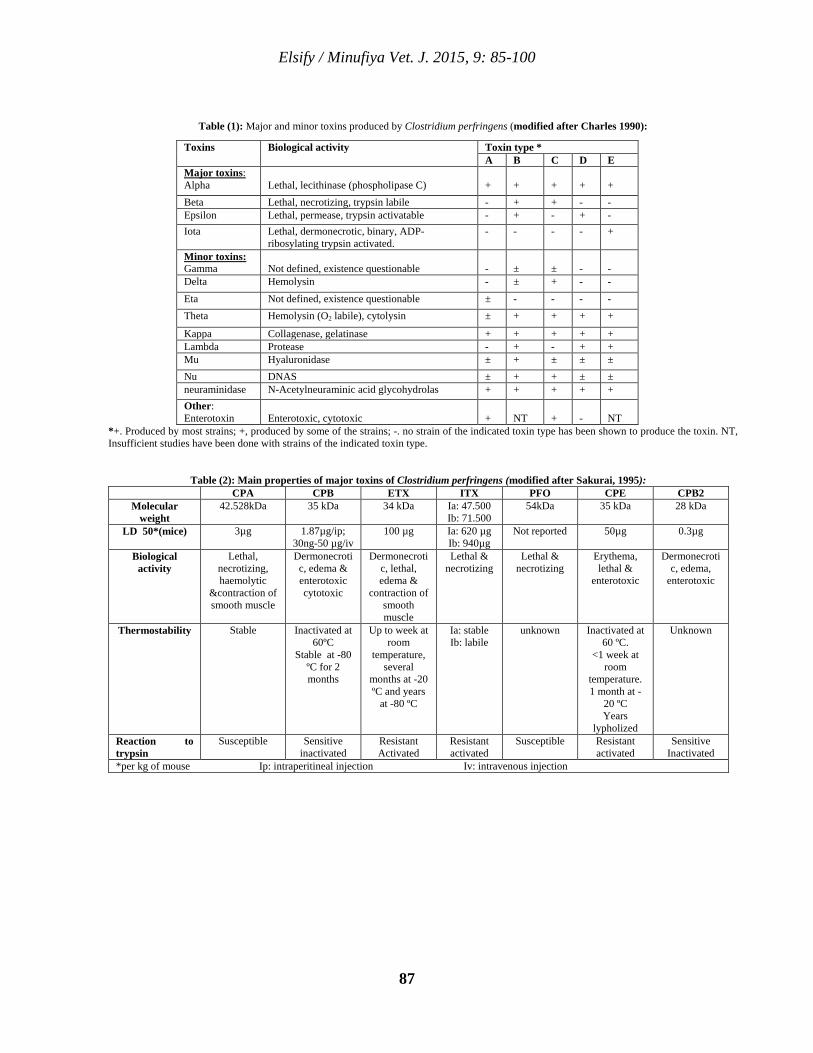
Elsify / Minufiya Vet. J. 2015, 9: 85-100
87
Table (1): Major and minor toxins produced by Clostridium perfringens (modified after Charles 1990):
Toxins Biological activity Toxin type * A B C D E
Major toxins: Alpha
Lethal, lecithinase (phospholipase C)
+
+
+
+
+
Beta Lethal, necrotizing, trypsin labile - + + - - Epsilon Lethal, permease, trypsin activatable - + - + - Iota Lethal, dermonecrotic, binary, ADP-
ribosylating trypsin activated. - - - - +
Minor toxins: Gamma
Not defined, existence questionable
-
±
±
-
-
Delta Hemolysin - ± + - - Eta Not defined, existence questionable ± - - - - Theta Hemolysin (O2 labile), cytolysin ± + + + +
Kappa Collagenase, gelatinase + + + + + Lambda Protease - + - + + Mu Hyaluronidase ± + ± ± ± Nu DNAS ± + + ± ± neuraminidase N-Acetylneuraminic acid glycohydrolas + + + + + Other: Enterotoxin
Enterotoxic, cytotoxic
+
NT
+
-
NT
*+. Produced by most strains; +, produced by some of the strains; -. no strain of the indicated toxin type has been shown to produce the toxin. NT, Insufficient studies have been done with strains of the indicated toxin type.
Table (2): Main properties of major toxins of Clostridium perfringens (modified after Sakurai, 1995): CPA CPB ETX ITX PFO CPE CPB2
Molecular weight
42.528kDa 35 kDa 34 kDa Ia: 47.500 Ib: 71.500
54kDa 35 kDa 28 kDa
LD 50*(mice) 3µg 1.87µg/ip; 30ng-50 µg/iv
100 µg Ia: 620 µg Ib: 940µg
Not reported 50µg 0.3µg
Biological activity
Lethal, necrotizing, haemolytic
&contraction of smooth muscle
Dermonecrotic, edema & enterotoxic cytotoxic
Dermonecrotic, lethal, edema &
contraction of smooth muscle
Lethal & necrotizing
Lethal & necrotizing
Erythema, lethal &
enterotoxic
Dermonecrotic, edema,
enterotoxic
Thermostability Stable Inactivated at 60ºC
Stable at -80 ºC for 2 months
Up to week at room
temperature, several
months at -20 ºC and years
at -80 ºC
Ia: stable Ib: labile
unknown Inactivated at 60 ºC.
<1 week at room
temperature. 1 month at -
20 ºC Years
lypholized
Unknown
Reaction to trypsin
Susceptible Sensitive inactivated
Resistant Activated
Resistant activated
Susceptible Resistant activated
Sensitive Inactivated
*per kg of mouse Ip: intraperitineal injection Iv: intravenous injection
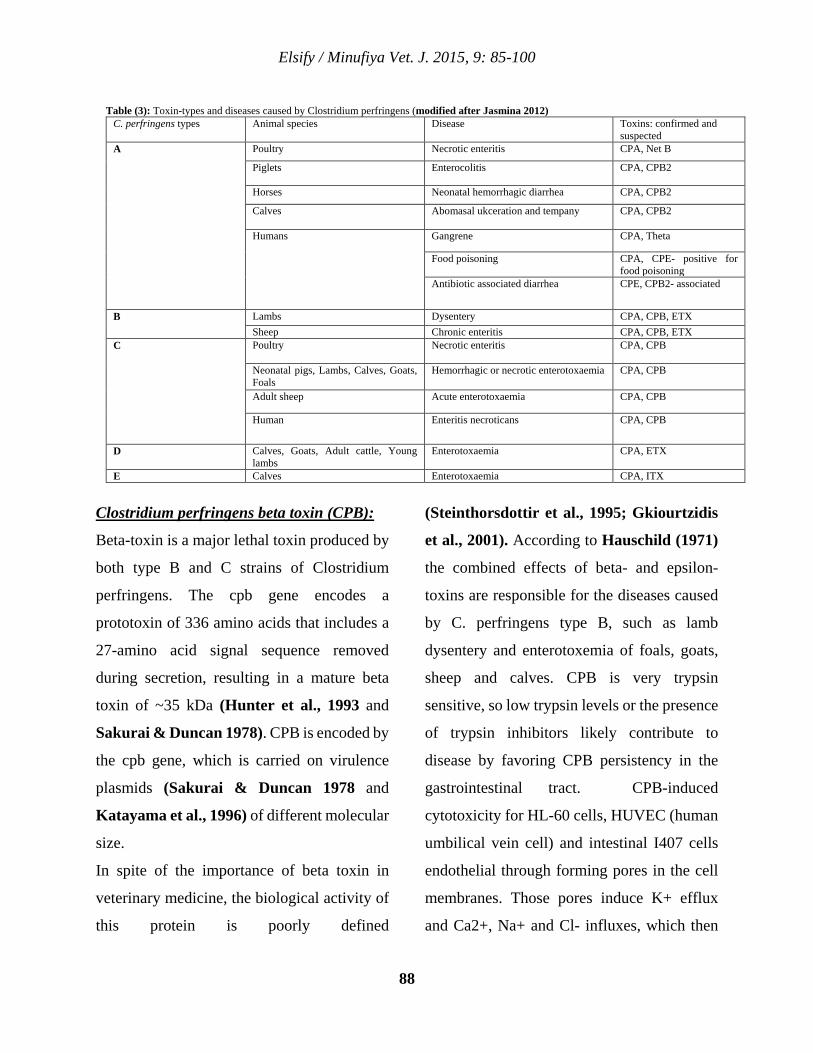
Elsify / Minufiya Vet. J. 2015, 9: 85-100
88
Clostridium perfringens beta toxin (CPB):
Beta-toxin is a major lethal toxin produced by
both type B and C strains of Clostridium
perfringens. The cpb gene encodes a
prototoxin of 336 amino acids that includes a
27-amino acid signal sequence removed
during secretion, resulting in a mature beta
toxin of ~35 kDa (Hunter et al., 1993 and
Sakurai & Duncan 1978). CPB is encoded by
the cpb gene, which is carried on virulence
plasmids (Sakurai & Duncan 1978 and
Katayama et al., 1996) of different molecular
size.
In spite of the importance of beta toxin in
veterinary medicine, the biological activity of
this protein is poorly defined
(Steinthorsdottir et al., 1995; Gkiourtzidis
et al., 2001). According to Hauschild (1971)
the combined effects of beta- and epsilon-
toxins are responsible for the diseases caused
by C. perfringens type B, such as lamb
dysentery and enterotoxemia of foals, goats,
sheep and calves. CPB is very trypsin
sensitive, so low trypsin levels or the presence
of trypsin inhibitors likely contribute to
disease by favoring CPB persistency in the
gastrointestinal tract. CPB-induced
cytotoxicity for HL-60 cells, HUVEC (human
umbilical vein cell) and intestinal I407 cells
endothelial through forming pores in the cell
membranes. Those pores induce K+ efflux
and Ca2+, Na+ and Cl- influxes, which then
Table (3): Toxin-types and diseases caused by Clostridium perfringens (modified after Jasmina 2012) C. perfringens types Animal species Disease Toxins: confirmed and
suspected A Poultry Necrotic enteritis CPA, Net B
Piglets Enterocolitis CPA, CPB2
Horses Neonatal hemorrhagic diarrhea CPA, CPB2
Calves Abomasal ukceration and tempany CPA, CPB2
Humans Gangrene CPA, Theta
Food poisoning CPA, CPE- positive for food poisoning
Antibiotic associated diarrhea CPE, CPB2- associated
B Lambs Dysentery CPA, CPB, ETX Sheep Chronic enteritis CPA, CPB, ETX
C Poultry Necrotic enteritis CPA, CPB
Neonatal pigs, Lambs, Calves, Goats, Foals
Hemorrhagic or necrotic enterotoxaemia CPA, CPB
Adult sheep Acute enterotoxaemia CPA, CPB
Human Enteritis necroticans CPA, CPB
D Calves, Goats, Adult cattle, Young lambs
Enterotoxaemia CPA, ETX
E Calves Enterotoxaemia CPA, ITX
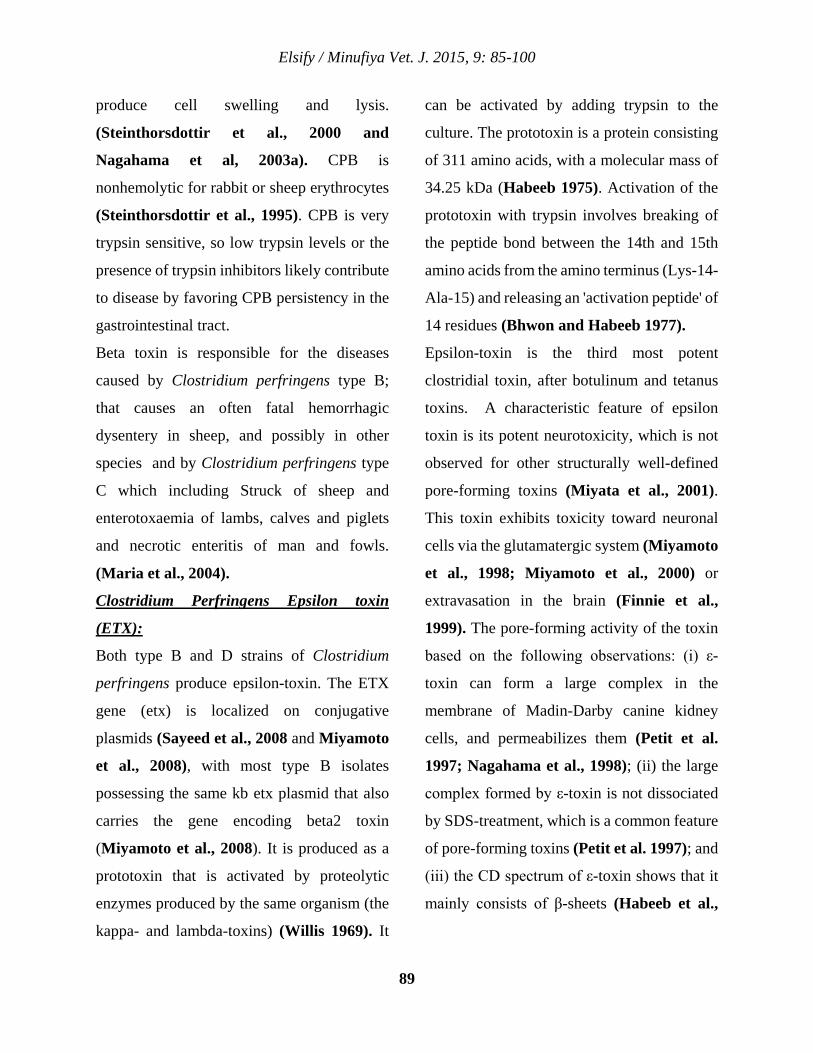
Elsify / Minufiya Vet. J. 2015, 9: 85-100
89
produce cell swelling and lysis.
(Steinthorsdottir et al., 2000 and
Nagahama et al, 2003a). CPB is
nonhemolytic for rabbit or sheep erythrocytes
(Steinthorsdottir et al., 1995). CPB is very
trypsin sensitive, so low trypsin levels or the
presence of trypsin inhibitors likely contribute
to disease by favoring CPB persistency in the
gastrointestinal tract.
Beta toxin is responsible for the diseases
caused by Clostridium perfringens type B;
that causes an often fatal hemorrhagic
dysentery in sheep, and possibly in other
species and by Clostridium perfringens type
C which including Struck of sheep and
enterotoxaemia of lambs, calves and piglets
and necrotic enteritis of man and fowls.
(Maria et al., 2004).
Clostridium Perfringens Epsilon toxin
(ETX): Both type B and D strains of Clostridium
perfringens produce epsilon-toxin. The ETX
gene (etx) is localized on conjugative
plasmids (Sayeed et al., 2008 and Miyamoto
et al., 2008), with most type B isolates
possessing the same kb etx plasmid that also
carries the gene encoding beta2 toxin
(Miyamoto et al., 2008). It is produced as a
prototoxin that is activated by proteolytic
enzymes produced by the same organism (the
kappa- and lambda-toxins) (Willis 1969). It
can be activated by adding trypsin to the
culture. The prototoxin is a protein consisting
of 311 amino acids, with a molecular mass of
34.25 kDa (Habeeb 1975). Activation of the
prototoxin with trypsin involves breaking of
the peptide bond between the 14th and 15th
amino acids from the amino terminus (Lys-14-
Ala-15) and releasing an 'activation peptide' of
14 residues (Bhwon and Habeeb 1977).
Epsilon-toxin is the third most potent
clostridial toxin, after botulinum and tetanus
toxins. A characteristic feature of epsilon
toxin is its potent neurotoxicity, which is not
observed for other structurally well-defined
pore-forming toxins (Miyata et al., 2001).
This toxin exhibits toxicity toward neuronal
cells via the glutamatergic system (Miyamoto
et al., 1998; Miyamoto et al., 2000) or
extravasation in the brain (Finnie et al.,
1999). The pore-forming activity of the toxin
based on the following observations: (i) ε-
toxin can form a large complex in the
membrane of Madin-Darby canine kidney
cells, and permeabilizes them (Petit et al.
1997; Nagahama et al., 1998); (ii) the large
complex formed by ε-toxin is not dissociated
by SDS-treatment, which is a common feature
of pore-forming toxins (Petit et al. 1997); and
(iii) the CD spectrum of ε-toxin shows that it
mainly consists of β-sheets (Habeeb et al.,
Elsify / Minufiya Vet. J. 2015, 9: 85-100
90
1973), as observed for pore-forming β-barrel
toxins.
This toxin causes blood pressure elevation,
increased contractility of smooth muscle,
vascular permeability increase, as well as
brain and lung edema in multiple animal
species, while in goats ETX also causes colitis
(Uzal et al., 2004). ETX-producing C.
perfringens type D strains are the most
common cause of clostridial enterotoxemia in
sheep and goats (Uzal and Kelly 1997); In
cattle there are few reports about natural cases
of type D enterotoxemia, and information
about clinical and pathologic findings of the
disease in this species is scant and frequently
contradictory (Keast and McBarron 1954 ,
Griner et al., 1956 and Griesemer and
Krill 1962).
Clostridium Perfringens Iota toxin (ITX): The iota-toxin is produced only by
Clostridium Perfringens type E and has been
implicated in fatal calf, lamb and guinea pig
enterotoxemias (Bosworth, 1943; Madden,
1970). ITX is a clostridial binary toxin has a
common structure consisting of two
independent protein components that are not
covalently linked, one being the binding
component (Ib,100 kDa), and the other the
enzymatic component (Ia, 45 kDa); both
components are required for biological
activity (Barth et al., 2000). These
components are proteolytically activated by
trypsin or chymotrypsin, removing a 20 kDa
Nterminal peptide from the binding
component (80 kDa for the active form) and 9
to 11 N-terminal residues from the enzymatic
component (Gibert et al., 2000). These
components encoded by two genes in a
plasmid, organized in an operon. Two genes,
with the same orientation, coding for Ia (454
amino acids) and Ib (875 amino acids) and
separated by 243 noncoding nucleotides, were
identified. (Sakuria et al., 2009).
Iota-toxin enters host cells and induces
toxicity by exploiting the cell’s endogenous
pathways as follows: (1) Ib binds to a receptor
at plasma membranes, then moves to lipid-
rafts and
forms a heptamer, (2) the N-terminal domain
of Ia binds to the Ca2+-binding motif in the N-
terminal region of Ib, (3) Ia bound to the Ib
oligomer is internalized in cells by receptor-
mediated endocytosis, (4) the complex of Ia
and Ib is transported to the early endosomes,
where acidification promotescytosolic entry
of Ia, and 5) the C-domain and part of the N-
domain of Ia bind to G-actin in the cytosol and
ADP-ribosylate it, thereby blocking the
polymerization of actin, and eventually
intoxicating cells. (Sakuria et al., 2009).
Infections by Clostridium perfringens type E
are usually assumed to be mediated by ITX,
Elsify / Minufiya Vet. J. 2015, 9: 85-100
91
although no definitive evidence in this regard
has been provided. Clostridium perfringens
type E produces enterotoxemia in rabbits.
Although the role of ITX in these infections
has not been elucidated; toxinotype E is an
occasional cause of hemorrhagic enteritis and
sudden death in beef calves. Type E disease
has rarely been described in sheep and goats.
(Uzal et al., 2010).
Clostridium Perfringens Beta 2 Toxin
(CPB2):
Toxin discovery:
The history of beta 2 toxin started with Popoff
et al., during the 1980s as they obtained a
protein of approximately 28kDa, which is
significantly smaller than CPB (~35kDa). The
newly discovered protein (27.6 kDa) was at
first considered a product of CPB (34.8 kDa)
proteolysis; but the CPB2 amino acid
sequence showed minimal homology with
CPB (15% identity). The protein and the
encoding sequence were named CPB2 and
cpb2, respectively, due to comparable
biological effects to CPB (Gibert et al.,
1997).
Structure and genetic of the toxin:
The CPB2 protein consists of a 265 amino
acid polypeptide, which after secretion loses
30 amino acids giving it a molecular mass of
27.6 kDa (Lebrun et al., 2007a). It is
unstable, being susceptible to proteolytic
cleavage (Gibert at al., 1997).
The cpb2 toxin gene is transcribed during
vegetative growth, especially during the
exponential phase and regulation by the
VirS/VirR two-component regulatory system
(Ohtani et al., 2003). The cpb2 gene is
present on Clostridium perfringens type D
isolates on plasmids 48 kb to 110 kb in size
(Sayeed and McClane 2007).. In these
isolates, the gene is either present on the same
plasmid carrying the etx gene or on a different
plasmid. In type E isolates, cpb2 gene is
present on plasmids sizes varying from 70 kb
to 90 kb. The gene is always present on
different plasmid carrying the iota toxin gene
(itx) (Li et al., 2007). In recent studies the
cpb2 gene was found to be present on a 65 kb
plasmid that also carries the etx gene, in
Clostridium perfringens type B isolates (Uzal
et al., 2010).
Mechanism of action of Beta 2 toxin:
There is no significant homology between the
novel CPB2 and beta toxin or other known
bacterial toxins (Gibert et al., 1997, Shimizu
et al., 2002b and Shimizu et al., 2002a).
Schotte et al., 2004 and Gibert et al. 1997
suggested that the toxin behaves similarly to
CPB and demonstrated the cytotoxic effects
of CPB2 on Chinese hamster ovary and human
intestinal embryonic 1407 cell lines. This
Elsify / Minufiya Vet. J. 2015, 9: 85-100
92
cytopathology included cell rounding,
membrane blebbing and detachment from the
culture matrix. The toxin did modify small G
proteins such as actin, either by ADP-
ribosylation or by UDP- glucosylation. Other
cell lines, such as CaCo2 cells have also been
shown to be sensitive to the cytotoxic effects
of CPB2 (Fisher et al., 2005). Based on these
studies, it was suggested that CPB2 toxin
could act as a potential pore-forming toxin
similar to other enterically-active clostridial
toxins. The toxin was shown to be highly
susceptible to proteolytic cleavage by trypsin
(Gibert et al. 1997).
Prevalence and pathological effect induced
by Beta 2 toxin among animals:
Clostridium perfringens beta 2 toxin has been
responsible for enteric diseases in wide range
of animals and man. The clinical symptoms
related to the action of the toxin are pasty to
watery bloody diarrhea, abdominal pain and
loss of condition (Uzal et al., 2010). The beta2
toxin gene of Clostridium perfringens was
detected in all isolates originated 1213 field
samples taken from diseased or perished live
stock. Animal species examined, comprising
pigs, the small ruminants sheep and goats,
cattle, horses, rabbits, alpacas and lamas, and
fallow deer. Among all the animal species
included in this study, pigs attracted attention
by a high quota of 74.2% (610 of 822) cpb2-
positive C. perfringens isolates in comparison
to the other animal species tested, revealing a
quota of 20.8% (72 of 346) (Sting 2009)
There was evidence for importance of beta 2
toxin in bovine enterotoxaemia; since necrotic
and haemorrhagic lesions developed after
infection with beta 2 positive Clostridium
perfringens strain (Manteca et al., 2002).
Gkiourtizidis et al., 2001 found that the
recently discovered, beta 2-toxigenic type of
Clostridium perfringens was represented in
6% of all isolates of Clostridium perfingens
associated with lamb dysentery. But Das et
al., 2009 found that Beta 2 toxigenic
Clostridium perfringens incriminated in the
chronic enteritis of goats. In which in PCR,
both cpa and cpb2 toxin genes were detected
from all the isolates.
In equine Cornella et al., 1999 attributed the
pathogenicities of Clostridium perfringens
isolates from horses to the beta 2 toxin. They
found beta 2 toxigenic Clostridium
perfringens mainly in horses with typical and
atypical typhlocolitis, representing 52% of the
isolates. In 2003 Bacciarini et al., confirmed
the role of beta 2 Clostridium perfringens in
development of typhlocolitis and hemorrhagic
fibrinonecrotic duodenitis-proximal jejunitis
in horses by detection of beta 2 toxin in horse
intestinal tissues by immuhistochemical
staining; in which 69 sections from horses
Elsify / Minufiya Vet. J. 2015, 9: 85-100
93
were stained and beta 2 toxin was observed in
40 animals. Murray et al., 2011 recovered
beta 2 toxigenic Clostridium perfringens type
A in large numbers from the intestine of a
neonatal foal with colitis and beta -2 toxin was
demonstrated in the lesions by
immunohistochemical staining.
Garmory et al., 2000 showed a significant
association between Clostridium perfringens
possessing the gene encoding b2-toxin and
diarrhoea in piglets. Results obtained by
Michael et al., 2003 support a significant
association between CPB2-positive
Clostridium perfringens isolates and diarrhea
in piglets. Hendriksen et al., 2006 found that
alpha- and beta2-toxin-producing Clostridium
perfringens was isolated from all tested herds
with piglets with neonatal diarrhoea.
Clostridium perfringens enterotoxin (CPE): Granum 1986 and Hauschild and
Hilsheimer 1971 found that Clostridium
perfringens enterotoxin composed of a protein
with a molecular mass of 35 kDa and
determine its amino acid sequence. The toxin
consists of one peptide of 309 amino acids
with a molecular weight of 34,262. The
peptide has one free sulfhydryl group. The
activity of the enterotoxin is enhanced
threefold by treatment with trypsin (Granum
et al., 1981).The trypsinized toxin then
consists of 284 amino acids and two short
peptides of 10 and 15 amino acids. The gene
(cpe) encoding CPE can reside on either the
chromosome or on plasmids. In type A
isolates, there are two major cpe plasmid
families: i) a family of ~75 kb plasmids that
also carry the beta2 toxin gene (cpb2); ii) a
family of ~70 kb plasmids lacking the cpb2
gene. Some type C and D isolates also carry a
plasmid-borne cpe gene although those
plasmids do not appear to be closely related to
the cpe plasmids of type A isolates.
Interestingly, most type E isolates carry silent
cpe sequences on their iota toxin-encoding
plasmids, which are often related to cpe
plasmids of type A isolates (Uzal et al., 2010).
The mechanism of action of the enterotoxin
seems to involve direct binding of the toxin to
receptors on the surface of intestinal epithelial
cells. Binding is followed by insertion of the
entire molecule into the cell membrane, but no
internalization into the cell. A sudden change
of ion fluxes occurs, affecting cellular
metabolism and macromolecular synthesis.
As intracellular calcium ion levels increase,
morphological damage occurs, resulting in
greatly altered membrane permeability and
loss of cellular fluid and ions and
moderatesized molecules up to 3.5 kDa.
Under some conditions a loss of protein
molecules may occur. (McClane et al., 1988a
and McClane et al., 1988b).
Elsify / Minufiya Vet. J. 2015, 9: 85-100
94
Enterotoxin has been studied almost
exclusively in type A strains. It has been
established that type C and D strains also can
produce enterotoxin. Only a few strains of
types B and E have been tested for enterotoxin
production, and all were negative (Charles
1990).
All tested mammalian species are sensitive to
CPE. This toxin affects all small intestinal
regions but is most active in the ileum. CPE
has only weak effects on the colon of rabbits
or human colonic tissue. In the ileum, CPE
causes villus shortening and epithelial
desquamation and such damage appears
necessary for accumulation of fluids and
electrolytes in the lumen (Uzal et al., 2010).
CPE toxin is important for Clostridium
perfringens type A food poisoning or
nonfoodborne gastrointestinal disease isolates
to cause diarrheal symptoms in experimental
animals. Coupled with extensive
epidemiologic evidence, these findings
support CPE as an important virulence factor
for C. perfringens type A food poisoning or
CPE-associated nonfoodborne human
gastrointestinal disease disease. In contrast to
the well-established role of this toxin in
human GI disease, the data implicating CPE in
animal disease remains more ambiguous.
there are case reports suggesting CPE may
cause GI disease in both domestic animals
(including dogs, pigs, /horses, and goats) and
possibly wild animals (such as penguins,
leopards and tortoises) (Uzal et al., 2010).
Type A isolates and CPE in the small
intestines of goat kid suffering from necrotic
enteritis (Deguchi et al., 2009). Additionally,
fecal CPE and CPE-positive fecal isolates
have been associated with canine diarrhea and
it has been suggested that CPE-positive strains
can cause recurrent diarrhea in dogs (Marks
et al., 2002 and Weese et al., 2001b). Finally,
in horses, fecal CPE was detected in ~20% of
adults with diarrhea and ~30% of foals with
diarrhea (Weese et al., 2001); thus supporting
a role for this fecal toxin contributing to
disease in those animals, while no fecal CPE
was detected in healthy adult horses or foals.
Minor toxins produced by Clostridium
perfringens:
The minor toxins produced by Clostridium
perfringens are listed in Table 1. At least some
strains of all toxin types produce theta, kappa,
mu, nu, and neuraminidase. Delta-toxin is a
hemolysin produced by type B and C strains,
but not by type A, D, and E strains. Lambda
has not been detected in type A and C strains.
It is a proteinase that digests gelatin,
hemoglobin, and casein to some extent, but
not collagen (Smith and Williams 1984).
Kappa-toxin (collagenase), mu-toxin
(hyaluronidase), and lambda-toxin (protease)
Elsify / Minufiya Vet. J. 2015, 9: 85-100
95
appear to play roles in pathogenesis because
of their ability to break down host tissues.
Gamma- and eta toxins have been proposed to
account for discrepancies in neutralizing
results obtained with specific antisera, but
specific active substances related to those
supposed entities have not yet been isolated
(McDonel 1980).
References:
Bacciarini L. N., Boerlin P., Straub R., Frey J.,
and Grone A. (2003): Immunohistochemical
localization of Clostridium perfringens beta 2
toxin in the gastrointestinal tract of horses.
Vet. Pathol. (40): 376-381.
Barth H, Blöcker D, Behlke J, et al. (2000):
Cellular uptake of Clostridium botulinum C2
toxin requires oligomerization and
acidification. J. Biol. Chem. (275): 18704-
18711.
Bhown, A. S., and A. F. Habeeb. (1977):
Structural studies on epsilon-prototoxin of
Clostridiulm petfringens type D. Localization
of the site of tryptic scission necessary for
activation to epsilon-toxin. Biochem.
Biophys. Res. Commun. (78):889-896.
Bosworth, T. J. (1943): On a new type of toxin
produced by Clostridium welchii. J. Comp.
Pathol. (53):245-255.
Canard B. and Cole S. (1989): Genome
organization of the anaerobic pathogen
Clostridium perfringens. Proc. Natl. Acad.
Sci. USA. (86): 6676-6680.
Cornelia Herholz, Raymond Miserez, Jacques
Nicolet, Joachim Frey, Michel Popoff, Maryse
Gibert, Heinz Gerber and Reto Straub (1999):
Prevalence of Beta-toxigenic Clostridium
perfringens in horses with intestinal disorders.
J. Clin. Microbiol. 37(2): 358-361.
Das Arunava, Yahya Mazumder and Merlin
Rajesh (2009): Diagnosis of chronic enteritis
in goats by polymerase chain reaction.
International Journal of Biotechnology &
Biochemistry.
Deguchi A, Miyamoto K, Kuwahara T, et al.,
(2009): Genetic characterization of type A
enterotoxigenic Clostridium perfringens
strains. PLoS One 4: e5598.
Finnie, J. W.; Blumbergs, P. C.; Manavis, J.
(1999): Neuronal damage produced in rat
brains by Clostridium perfringens type D
epsilon toxin. J. Comp. Pathol. (120)/4:415-
420.
Fisher D. J., Miyamoto K., Harrison B., et al.
(2005): Association of beta2 toxin production
with Clostridium perfringens type A human
gastrointestinal disease isolates carrying a
plasmid enterotoxin gene. Mol Microbiol 56:
747-762.
Granum, P. E. (1986): Structure and
mechanism of action of the enterotoxin from
Clostridium perfringens, p. 327-334. In
Elsify / Minufiya Vet. J. 2015, 9: 85-100
96
P.Falmagne, J. Jeljaszewicz, and M.
Thelestam (ed.), Proceedings,II European
Workshop on Bacterial Protein Toxins.
Gustav Fischer, Stuttgart, Federal Republic of
Germany.
Granum, P. E., J. R. Whitaker, and R.
Skjelkvale. (1981): Trypsin activation of
enterotoxin from Clostridium perfringens type
A. Biochim. Biophys. Acta (668):325-332.
Gkiourtzidis K., Frey J., Bourtzi-Hatzopoulou
E., Iliadis N.,and Sarris K. (2001): PCR
detection and prevalence of alpha-, beta-, beta
2-, epsilon-, iota- and enterotoxin genes in
Clostridium perfringens isolated from lambs
with clostridial dysentery. Vet. Microbiol.
82(1):39-43.
Gibert, M., Jolivet-Reynaud, C., Popoff, M. R.
(1997): Beta2 toxin, a novel toxin produced by
Clostridium perfringens. Gene. (203):65-73.
Gibert M, Petit L, Raffestin S, Okabe A,
Popoff MR. (2000): Clostridium perfringens
iota-toxin requires activation of both binding
and enzymatic components for cytopathic
activity. Infect. Immun. (68): 3848-3853.
Griesemer RA. and Krill WR.(1962):
Enterotoxemia in beef calves-30 years
observation. J Am. Vet. Med. Assoc. (140):
154-8.
Griner LA., Aichelman WW., and Brown GD.
(1956): Clostridium perfringens type D (ETX)
enterotoxemia in brown swiss dairy calves. J.
Am. Vet. Med. Assoc. (129): 375-376.
Keast JC. and McBarron EJ.(1954): A case of
bovine enterotoxemia. Aust. Vet. J. (56): 305-
306.
Habeeb, A. F. S. A. (1975). Studies on
epsilon-prototoxin of Clostridium perfringens
type D; physicochemical and chemical
properties of epsilon-prototoxin. Biochim.
Biophys. Acta (412): 62-69.
Habeeb, A. F.; Lee, C. L.; Atassi, M. Z.
(1973): Conformational studies on modified
proteins and peptides. VII. Conformation of
epsilon-prototoxin and epsilon-toxin from
Clostridium perfringens. Conformational
changes associated with toxicity. Biochem.
Biophys. Acta. (322): 245-250.
Hauschild, A. H. W. (1971): Clostridium
perfringens toxins types B, C, D, and E. In:
KADIS, S., MONTIE, T. C.; AJL, S. J., eds.
Microbial toxins - Bacterial protein toxins.
New York: Academic Press, v.2, p.200.
Hauschild, A. H. W., and R. Hilsheimer.
(1971). Purification and characteristics of the
enterotoxin of Clostridium perfringens type A.
Can. J. Microbiol. (17):1425-1433.
Hendriksen SW., Van Leengoed LA., Roest
HI., Van Nes A. (2006): Neonatal diarrhoea in
pigs: alpha- and beta2-toxin produced by
Clostridium perfringens. Tijdschr
Diergeneeskd. 131(24):910-913.
Elsify / Minufiya Vet. J. 2015, 9: 85-100
97
Hunter SE. Brown JE. Oyston PC. Sakurai J.,
and Titball RW. (1993): Molecular genetic
analysis of beta-toxin of Clostridium
perfringens reveals sequence homology with
alpha-toxin, gamma-toxin, and leukocidin of
Staphylococcus aureus. Infect. Immun. (61):
3958-3965.
Jasmina Kircanski (2012): Master thesis
(University of Guelph). Clostridium
perfringens and the beta2 (CPB2) toxin:
Development of a diagnostic ELISA for
neonatal piglet enteritis, and distribution of the
gene in isolates from selected animal species.
Katayama S., Dupuy B., Daube G., China B.,
and Cole ST. (1996): Genome mapping of
Clostridium perfringens strains with I-CeuI
shows many virulence genes to be plasmid-
borne. Mol. Gen. Genet. (251): 720-726.
Fernandez Miyakawa ME, Fisher DJ, Poon R,
et al. (2007): Both epsilon toxin and beta-toxin
are important for the lethal properties of
Clostridium perfringens type B isolates in the
mouse intravenous injection model. Infect.
Immun. (75): 1443-1452.
Louis D.S. Smith (1979): Virulence factors of
Clostridium perfringens. Review of infectious
diseases. Vol. 1. No. 2.
Madden, D. L.; Horton, R. E.; Mccullough, N.
B. (1970): Spontaneous infection in ex-germ-
free guinea pigs due to Clostridium
perfringens. Lab. Animal Care. (20): 454-455.
Marks SL, Kather EJ, Kass PH, Melli AC.
(2002): Genotypic and phenotypic
characterization of Clostridium perfringens
and Clostridium difficile in diarrheic and
healthy dogs. J. Vet. Intern. Med. (16): 533-
540.
Manteca C., Daube G., Jauniaux T., Linden
A., Pirson A., Detilleux J., Ginter A., Coppe
P., Kaeckenbeek and Mainil J.G. (2002): A
role for the Clostridium perfringens beta 2
toxin in bovine enterotoxaemia. Veterinary
microbiology 86: 191-202.
Maria Taciana Holanda Cavalcanti, Tatiana
Porto, Ana Lúcia Figueiredo Porto, Igor Viana
Brandi, José Luiz de Lima Filho, and
Adalberto Pessoa Junior. (2004): Large scale
purification of Clostridium perfringens toxins:
a review. Brazilian Journal of Pharmaceutical
Sciences (40)/2:151-164.
McClane, B. A., P. C. Hanna, and A. P. Wnek.
(1988a): Clostridium perfringens enterotoxin.
Microb. Pathogen. (4):317-323.
McClane, B. A., A. P. Wnek, K. I. Hulkower,
and P. C. Hanna. (1988b): Divalent cation
involvement in the action of Clostridium
perfringens type A enterotoxin. J. Biol. Chem.
(263):2423-2435.
McDonel, J. L. (1980): Clostridium
perfringens toxins (type A,B, C, D, E).
Pharmacol. Ther. (10):617-655.
Elsify / Minufiya Vet. J. 2015, 9: 85-100
98
Miyamoto, O.; Minami, J.; Toyoshima, T.;
Nakamura, T.; Masada, T.; Nagao, S.; Negi,
T.; Itano, T.; Okabe, A. (1998): Neurotoxicity
of Clostridium perfringens epsilon toxin for
the rat hippocampus via the glutamatergic
system. Infect. Immun., (66)/6:2501- 2508.
Miyata, S.; Matsushita, O.; Minami, J.;
Katayama, S.; Shimamoto, S.; Okabe. (2001):
A. Cleavage of a C- terminal peptide is
essential for heptamerization of Clostridium
perfringens e-toxin in the synaptosomal
membrane. J. Biol. Chem., (276)/17: 13778-
13783.
Miyamoto K, Li J, Sayeed S, Akimoto S,
McClane BA. (2008): Sequencing and
diversity analyses reveal extensive similarities
between some epsilon-toxin-encoding
plasmids and the pCPF5603 Clostridium
perfringens enterotoxin plasmid. J. Bacteriol.
(190): 7178-88.
Michael Waters, Amanda Savoie, Helen S.
Garmory, Dawn Bueschel, Michel R. Popoff,
J. Glenn Songer, Richard W. Titball, Bruce A.
McClane, and Mahfuzur R. Sarker. (2003):
Genotyping and Phenotyping of Beta2-
Toxigenic Clostridium perfringens fecal
Isolates associated with gastrointestinal
diseases in Piglets. J Clin Microbiol. 2003
August; 41(8): 3584–3591.
Murray J. Hazlett., Jasmina Kircanski, Durda
Slvac and John F. Prescott (2011): Beta 2
toxigenic Clostridium perfringens type A
colitis in three day old foal. J. Vet. Diagn.
Invest. (23):373-376.
Nagahama, M.; Ochi, S.; Sakurai, J. (1998):
Assembly of Clostridium perfringens epsilon
toxin on MDCK cell membrane. J. Nat.
Toxins, (7)/3:291-302.
Nagahama M., Hayashi S., Morimitsu S.,
Sakurai J. (2003a): Biological activities and
pore formation of Clostridium perfringens
beta toxin in HL 60 cells. J. Biol. Chem. (278):
36934-36941.
Oda M., Matsuno T., and Shiihara R. , et
al.(2008): The relationship between the
metabolism of sphingomyelin species and the
hemolysis of sheep erythrocytes induced by
Clostridium perfringens alpha-toxin. J. Lipid
Res.(49): 1039-47.
Ohtani k., kawsar HI., Okumura k., Hayashi
H., and Shimizu T (2003): the virR /virS
regulatory cascade affect transcription of
plasmid encoded putative virulence genes in
Clostridium perfringens strain 13. FEMS.
Microbiol lett.(222):137-141.
Petit, L.; Gibert, M.; Gillet, D.; Laurentwinter,
C.; Boquet, P.; Popoff, M. R. (1997):
Clostridium perfringens epsilon toxin acts on
MDCK cells by forming a large membrane
complex. J. Bacteriol. (179): 6480-6487.
Elsify / Minufiya Vet. J. 2015, 9: 85-100
99
Radostitis, O. M; Gay, C. C.; Blood, D. C. and
Hinchcliff, K. V. V. (2007): Veterinary
medicine 10th ed. Saunders Elsevier, London.
Sakurai J. (1995): Toxins of Clostridium
perfringens. Rev. Med. Microbio. (6): 175-
185.
Sakurai J, and Duncan CL.(1978): Some
properties of beta-toxin produced by
Clostridium perfringens type C. Infect.
Immun. (21): 678-680.
Sakurai J., Ochi S., and Tanaka H.(1993):
Evidence for coupling of Clostridium
perfringens alpha-toxin-induced hemolysis to
stimulated phosphatidic acid formation in
rabbit erythrocytes. Infect. Immun.(61):
3711-3718.
Sakurai J., Nagahama M., and Oda M(2004):
Clostridium perfringens alphatoxin:
characterization and mode of action. J.
Biochem. (136): 569-574.
Sakurai Jun, Masahiro Nagahama , Masataka
Oda , Hideaki Tsuge and Keiko Kobayashi.
(2009): Clostridium perfringens Iota-Toxin:
Structure and Function review. Toxins
(1):208-228.
Sayeed S, Li J., and McClane BA. (2007):
Virulence plasmid diversity in Clostridium
perfringens type D isolates. Infect. Immun.
75: 2391-1398.
Sayeed S, Uzal FA, Fisher DJ, et al.(2008):
Beta toxin is essential for the intestinal
virulence of Clostridium perfringens type C
disease isolate CN3685 in a rabbit ileal loop
model. Mol Microbiol. (67):15-30.
Schotte U, Truyen U, Neubauer H. (2004):
Significance of beta 2-toxigenic Clostridium
perfringens infections in animals and their
predisposing factors-a review. J. Vet. Med. B.
Infect. Dis. Vet. Public Health 51: 423-426.
Shimizu T, Yaguchi H, Ohtani K, Banu S,
Hayashi H. (2002a): Clostridial VirR/VirS
regulon involves a regulatory RNA molecule
for expression of toxins. Mol. Microbiol. 43:
257-265.
Shimizu T, Ohtani K, Hirakawa H, et al.
(2002b): Complete genome sequence of
Clostridium perfringens, an anaerobic flesh-
eater. Proc. Natl. Acad. Sci. 99: 996-1001.
Smith, L. DS., and B. L. Williams. 1984. The
pathogenic anaerobic bacteria, 3rd ed. Charles
C Thomas, Publisher,Springfield, Ill.
Songer JG. (1998): Clostridial diseases of
small ruminants. Vet. Res. (29): 219-32.
Songer JG. and Miskimins DW. (2005)
Clostridial abomasitis in calves: case report
and review of the literature. Anaerobe (11):
290-294.
Steinthorsdottir, V.; Fridriksdottir, V.;
Gunnarsson, E.; Andresson, O. S. (1995):
Expression and purification of Clostridium
perfringens beta-toxin glutathione S-
Elsify / Minufiya Vet. J. 2015, 9: 85-100
100
transferase fusion protein. FEMS Microbiol.
Lett. (130):273-278.
Steinthorsdottir V., Fridriksdottir V.,
Gunnarsson E., Andresson OS. (1998): Site-
directed mutagenesis of Clostridium
perfringens beta-toxin: expression of wild-
type and mutant toxins in Bacillus subtilis.
FEMS. Microbiol. Lett. (58): 17-23.
Steinthorsdottir V., Halldorsson H.,
Andresson OS.(2000): Clostridium
perfringens beta-toxin forms multimeric
transmembrane pores in human endothelial
cells. Microb. Pathog. (28): 45-50.
Stevens, D. L., B. E. Troyer, D. T. Merrick, J.
E. Mitten, and R. D. Olson. (1988): Lethal
effects and cardiovascular effects of purified
alpha and theta toxins from Clostridium
perfringens. J. Infect. Dis. (157):272-279.
Sting R. (2009): Detection of beta2 and major
toxin genes by PCR in Clostridium
perfringens field isolates of domestic animals
suffering from enteritis or enterotoxaemia.
Berl. Munch. Tierarztl Wochenschr.122(9-
10):341-347.
Sugahara, T., T. Takahashi, S. Yamaya, and
A. Ohsaka. (1977): Vascular permeability
increase by alpha-toxin (phospholipase C) of
Clostridium perfringens. Toxicon (15):81-87.
Titball RW., Naylor CE.,and Basak AE.
(1999): The Clostridium perfringens α- toxin.
Anaerobe. (5): 51-64.
Waters M., Raju D., Garmory HS., Popoff
MR., and Sarker MR. (2005): Regulated
expression of the beta2-toxin gene (cpb2) in
Clostridium perfringens type a isolates from
horses with gastrointestinal diseases. J. Clin.
Microbiol. (43): 4002-4009.
Weese JS., Staempfli HR., and Prescott
JF.(2001a): A prospective study of the roles of
Clostridium difficile and enterotoxigenic
Clostridium perfringens in equine diarrhoea.
Equine Vet. J. (33): 403-409.
Weese JS, Greenwood SJ, and Staempfli HR.
(2001b): Recurrent diarrhea associated with
enterotoxigenic Clostridium perfringens in 2
dogs. Can. Vet. J. (42): 292-294.
Willis, A. T. (1969). Clostridia of wound
infection. Butterworths, London.
Uzal FA. (2004): Diagnosis of Clostridium
perfringens intestinal infections in sheep and
goats. Anaerobe. (10): 135-43.
Uzal FA. and Kelly WR. (1997): The effects
of intravenous administration of Clostridium
perfringens type D epsilon toxin on young
goats and lambs. J. Comp. Pathol. (116): 63-
71.
101
Introduction
Milk is a major component in human diet all
over the world, it was considered as complete
food for human from birth to senility, as it
contains all the nutrients required for growth
and maintenance of the body health (Jay,
2000).
Milk of cattle, buffalo, goat, sheep and camel
contains almost same but varying
concentration of the chemical constituents.
Milk differs widely in composition due to
different factors including species of animal,
breed, individuality, stage of lactation,
Bacteriological Quality and Safety of Raw Cow’s and Buffalo’s Milk Sold in Menoufia Governorate, Egypt
Rabee A. Ombarak* and Abdel-Rahman M. Elbagory
Food Hygiene & Control Department, Faculty of Veterinary Medicine, University of Sadat City, Sadat City, Menofia 32511, Egypt.
*Corresponding Author: [email protected] Accepted: 25/8/2015
Abstract:
This study focused on assessment of the microbiological quality, including the incidence of pathogens,
of commercial raw cow’s and buffalo’s milk in Menoufia Governorate, Egypt. A total of 70 (35 each)
milk samples were collected from different sites and analyzed for microbiological quality and isolation
of pathogenic bacteria. Microbiological analysis revealed that the mean aerobic plate count
was 2.01±0.836×10⁷ and 4.03±1.37×10⁷ cfu/ml for cow’s and buffalo’s milk,
respectively. Enterobacteriaceae were detected in 31 (88.57%) and 31 (88.57%), with mean
count values of 2.22±0.92×10⁶ and 1.03±0.267×10⁷ cfu/ml in cow’s and buffalo’s milk
samples, respectively. Coliforms were detected in 88.57% and 88.57%, with mean count values
of 5.57±3.56×10⁵ and 8.86±1.71×10⁵ cfu/ml in cow’s and buffalo’s milk samples, respectively. E.
coli was detected in 8 (22.9%) and 5 (14.3%), S. aureus was detected in 22 (62.86%) and 20 (57.14%),
with mean count values of 5.69±1.97×10⁴ and 1.58±0.50×10⁵ cfu/ml in cow’s and buffalo’s milk,
respectively. On the other hand, Salmonella and L. monocytogenes were not detected in the examined
samples. Keywords: Bacteriological quality, E. coli, S. aureus, Salmonella, Listeria monocytogenes, cow’s and buffalo’s milk.
Minufiya Veterinary Journal ISSN: 1110-9750
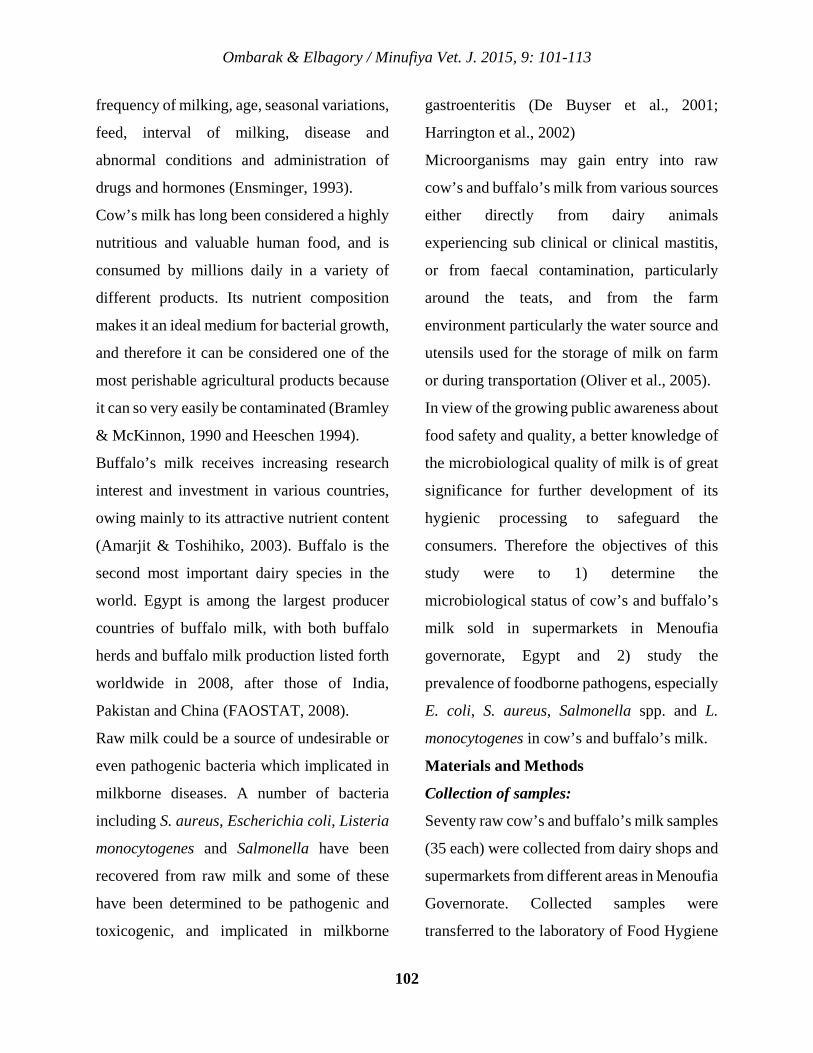
Ombarak & Elbagory / Minufiya Vet. J. 2015, 9: 101-113
102
frequency of milking, age, seasonal variations,
feed, interval of milking, disease and
abnormal conditions and administration of
drugs and hormones (Ensminger, 1993).
Cow’s milk has long been considered a highly
nutritious and valuable human food, and is
consumed by millions daily in a variety of
different products. Its nutrient composition
makes it an ideal medium for bacterial growth,
and therefore it can be considered one of the
most perishable agricultural products because
it can so very easily be contaminated (Bramley
& McKinnon, 1990 and Heeschen 1994).
Buffalo’s milk receives increasing research
interest and investment in various countries,
owing mainly to its attractive nutrient content
(Amarjit & Toshihiko, 2003). Buffalo is the
second most important dairy species in the
world. Egypt is among the largest producer
countries of buffalo milk, with both buffalo
herds and buffalo milk production listed forth
worldwide in 2008, after those of India,
Pakistan and China (FAOSTAT, 2008).
Raw milk could be a source of undesirable or
even pathogenic bacteria which implicated in
milkborne diseases. A number of bacteria
including S. aureus, Escherichia coli, Listeria
monocytogenes and Salmonella have been
recovered from raw milk and some of these
have been determined to be pathogenic and
toxicogenic, and implicated in milkborne
gastroenteritis (De Buyser et al., 2001;
Harrington et al., 2002)
Microorganisms may gain entry into raw
cow’s and buffalo’s milk from various sources
either directly from dairy animals
experiencing sub clinical or clinical mastitis,
or from faecal contamination, particularly
around the teats, and from the farm
environment particularly the water source and
utensils used for the storage of milk on farm
or during transportation (Oliver et al., 2005).
In view of the growing public awareness about
food safety and quality, a better knowledge of
the microbiological quality of milk is of great
significance for further development of its
hygienic processing to safeguard the
consumers. Therefore the objectives of this
study were to 1) determine the
microbiological status of cow’s and buffalo’s
milk sold in supermarkets in Menoufia
governorate, Egypt and 2) study the
prevalence of foodborne pathogens, especially
E. coli, S. aureus, Salmonella spp. and L.
monocytogenes in cow’s and buffalo’s milk.
Materials and Methods
Collection of samples:
Seventy raw cow’s and buffalo’s milk samples
(35 each) were collected from dairy shops and
supermarkets from different areas in Menoufia
Governorate. Collected samples were
transferred to the laboratory of Food Hygiene
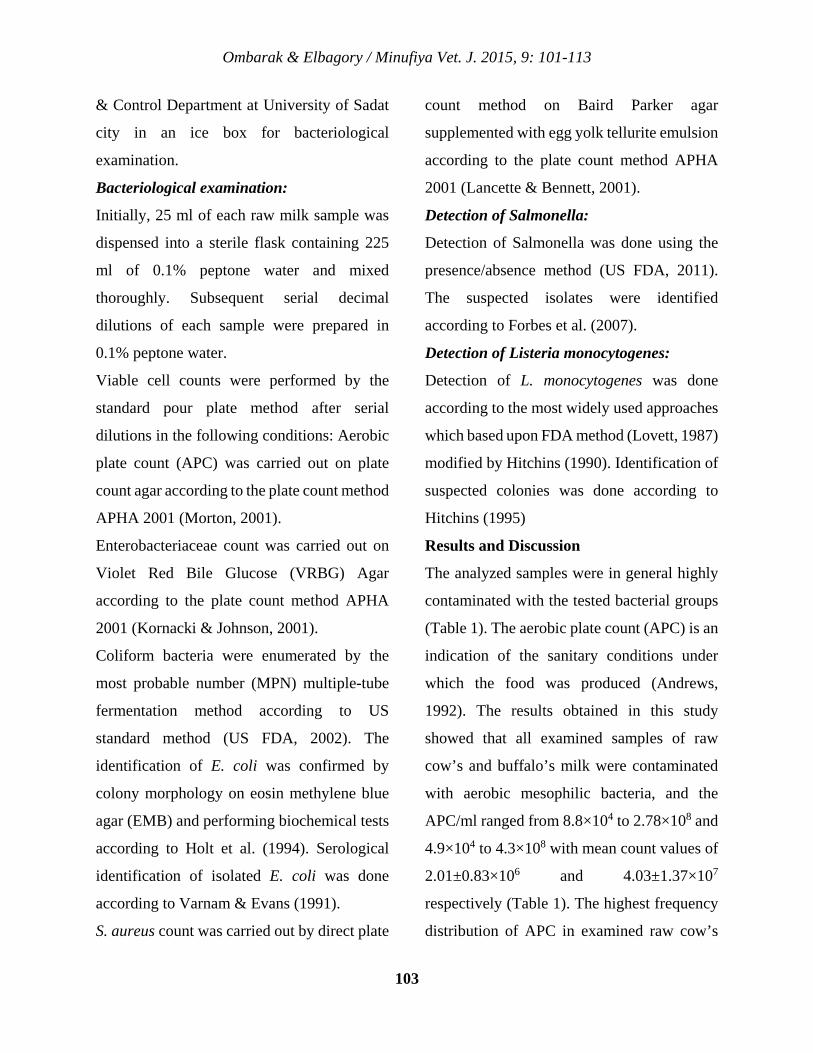
Ombarak & Elbagory / Minufiya Vet. J. 2015, 9: 101-113
103
& Control Department at University of Sadat
city in an ice box for bacteriological
examination.
Bacteriological examination:
Initially, 25 ml of each raw milk sample was
dispensed into a sterile flask containing 225
ml of 0.1% peptone water and mixed
thoroughly. Subsequent serial decimal
dilutions of each sample were prepared in
0.1% peptone water.
Viable cell counts were performed by the
standard pour plate method after serial
dilutions in the following conditions: Aerobic
plate count (APC) was carried out on plate
count agar according to the plate count method
APHA 2001 (Morton, 2001).
Enterobacteriaceae count was carried out on
Violet Red Bile Glucose (VRBG) Agar
according to the plate count method APHA
2001 (Kornacki & Johnson, 2001).
Coliform bacteria were enumerated by the
most probable number (MPN) multiple-tube
fermentation method according to US
standard method (US FDA, 2002). The
identification of E. coli was confirmed by
colony morphology on eosin methylene blue
agar (EMB) and performing biochemical tests
according to Holt et al. (1994). Serological
identification of isolated E. coli was done
according to Varnam & Evans (1991).
S. aureus count was carried out by direct plate
count method on Baird Parker agar
supplemented with egg yolk tellurite emulsion
according to the plate count method APHA
2001 (Lancette & Bennett, 2001).
Detection of Salmonella:
Detection of Salmonella was done using the
presence/absence method (US FDA, 2011).
The suspected isolates were identified
according to Forbes et al. (2007).
Detection of Listeria monocytogenes:
Detection of L. monocytogenes was done
according to the most widely used approaches
which based upon FDA method (Lovett, 1987)
modified by Hitchins (1990). Identification of
suspected colonies was done according to
Hitchins (1995)
Results and Discussion
The analyzed samples were in general highly
contaminated with the tested bacterial groups
(Table 1). The aerobic plate count (APC) is an
indication of the sanitary conditions under
which the food was produced (Andrews,
1992). The results obtained in this study
showed that all examined samples of raw
cow’s and buffalo’s milk were contaminated
with aerobic mesophilic bacteria, and the
APC/ml ranged from 8.8×10⁴ to 2.78×10⁸ and
4.9×10⁴ to 4.3×10⁸ with mean count values of
2.01±0.83×10⁶ and 4.03±1.37×10⁷
respectively (Table 1). The highest frequency
distribution of APC in examined raw cow’s
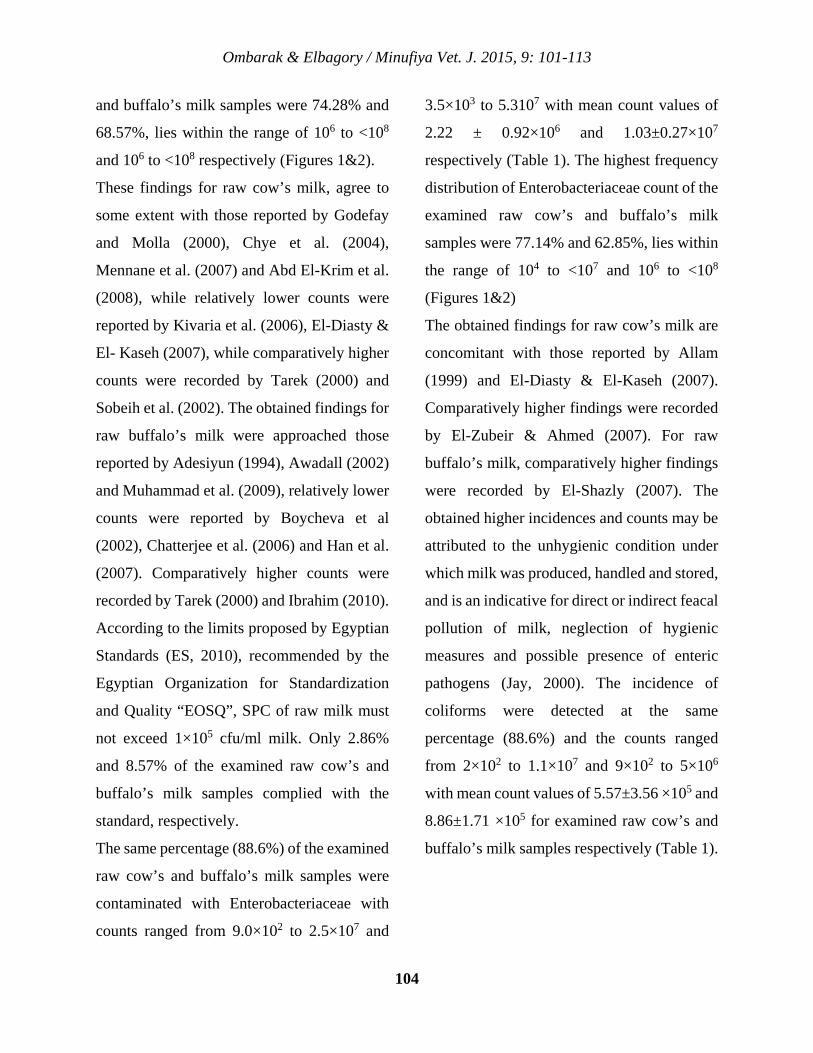
Ombarak & Elbagory / Minufiya Vet. J. 2015, 9: 101-113
104
and buffalo’s milk samples were 74.28% and
68.57%, lies within the range of 106 to <108
and 106 to <108 respectively (Figures 1&2).
These findings for raw cow’s milk, agree to
some extent with those reported by Godefay
and Molla (2000), Chye et al. (2004),
Mennane et al. (2007) and Abd El-Krim et al.
(2008), while relatively lower counts were
reported by Kivaria et al. (2006), El-Diasty &
El- Kaseh (2007), while comparatively higher
counts were recorded by Tarek (2000) and
Sobeih et al. (2002). The obtained findings for
raw buffalo’s milk were approached those
reported by Adesiyun (1994), Awadall (2002)
and Muhammad et al. (2009), relatively lower
counts were reported by Boycheva et al
(2002), Chatterjee et al. (2006) and Han et al.
(2007). Comparatively higher counts were
recorded by Tarek (2000) and Ibrahim (2010).
According to the limits proposed by Egyptian
Standards (ES, 2010), recommended by the
Egyptian Organization for Standardization
and Quality “EOSQ”, SPC of raw milk must
not exceed 1×10⁵ cfu/ml milk. Only 2.86%
and 8.57% of the examined raw cow’s and
buffalo’s milk samples complied with the
standard, respectively.
The same percentage (88.6%) of the examined
raw cow’s and buffalo’s milk samples were
contaminated with Enterobacteriaceae with
counts ranged from 9.0×10² to 2.5×10⁷ and
3.5×10³ to 5.3107 with mean count values of
2.22 ± 0.92×10⁶ and 1.03±0.27×10⁷
respectively (Table 1). The highest frequency
distribution of Enterobacteriaceae count of the
examined raw cow’s and buffalo’s milk
samples were 77.14% and 62.85%, lies within
the range of 104 to <107 and 106 to <108
(Figures 1&2)
The obtained findings for raw cow’s milk are
concomitant with those reported by Allam
(1999) and El-Diasty & El-Kaseh (2007).
Comparatively higher findings were recorded
by El-Zubeir & Ahmed (2007). For raw
buffalo’s milk, comparatively higher findings
were recorded by El-Shazly (2007). The
obtained higher incidences and counts may be
attributed to the unhygienic condition under
which milk was produced, handled and stored,
and is an indicative for direct or indirect feacal
pollution of milk, neglection of hygienic
measures and possible presence of enteric
pathogens (Jay, 2000). The incidence of
coliforms were detected at the same
percentage (88.6%) and the counts ranged
from 2×10² to 1.1×10⁷ and 9×10² to 5×10⁶
with mean count values of 5.57±3.56 ×10⁵ and
8.86±1.71 ×10⁵ for examined raw cow’s and
buffalo’s milk samples respectively (Table 1).
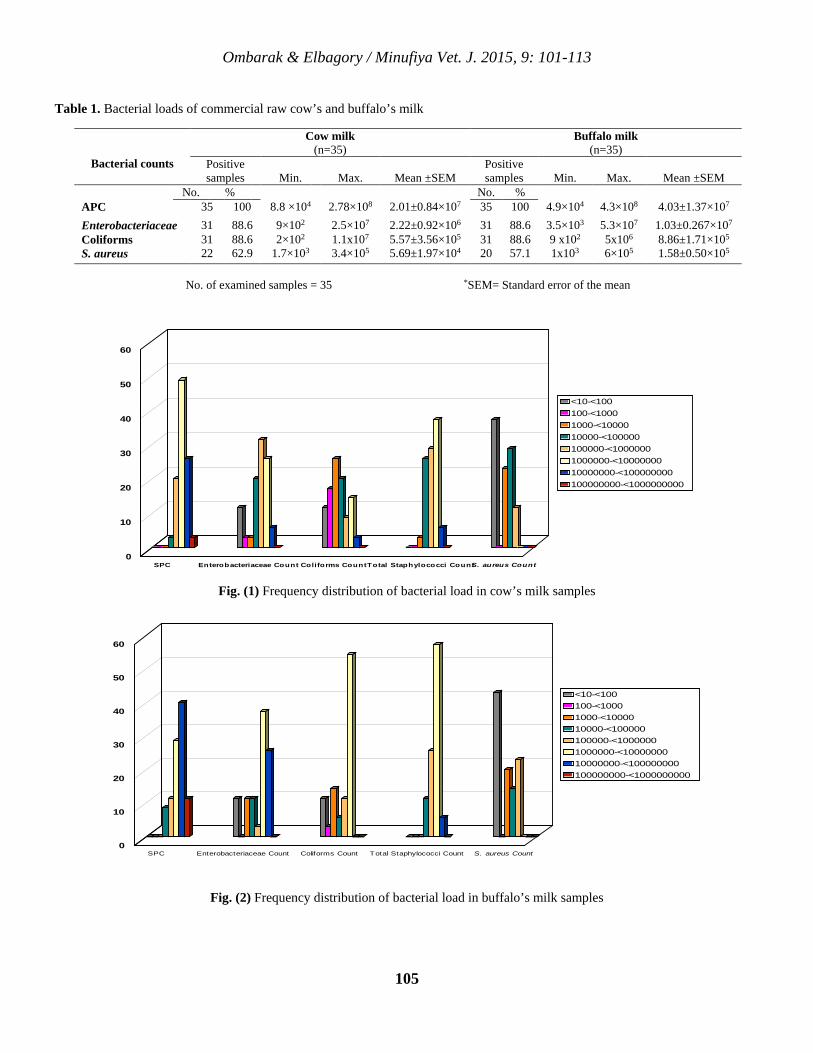
Ombarak & Elbagory / Minufiya Vet. J. 2015, 9: 101-113
105
Table 1. Bacterial loads of commercial raw cow’s and buffalo’s milk
Buffalo milk (n=35)
Cow milk (n=35)
Bacterial counts Mean ±SEM
Max.
Min.
Positive samples
Mean ±SEM
Max.
Min.
Positive samples
% No. % No. 4.03±1.37×10⁷ 4.3×10⁸ 4.9×10⁴ 100 35 2.01±0.84×10⁷ 2.78×10⁸ 8.8 ×10⁴ 100 35 APC
1.03±0.267×10⁷ 5.3×10⁷ 3.5×10³ 88.6 31 2.22±0.92×10⁶ 2.5×10⁷ 9×10² 88.6 31 Enterobacteriaceae 8.86±1.71×10⁵ 5x10⁶ 9 x10² 88.6 31 5.57±3.56×10⁵ 1.1x10⁷ 2×10² 88.6 31 Coliforms 1.58±0.50×10⁵ 6×10⁵ 1x10³ 57.1 20 5.69±1.97×10⁴ 3.4×10⁵ 1.7×10³ 62.9 22 S. aureus
No. of examined samples = 35 *SEM= Standard error of the mean
Fig. (1) Frequency distribution of bacterial load in cow’s milk samples
Fig. (2) Frequency distribution of bacterial load in buffalo’s milk samples
SPC Enterobacteriaceae Count Coliforms CountTotal Staphylococci CountS. aureus Count0
10
20
30
40
50
60
<10-<100100-<10001000-<1000010000-<100000100000-<10000001000000-<1000000010000000-<100000000100000000-<1000000000
SPC Enterobacteriaceae Count Coliforms Count Total Staphylococci Count S. aureus Count0
10
20
30
40
50
60
<10-<100100-<10001000-<1000010000-<100000100000-<10000001000000-<1000000010000000-<100000000100000000-<1000000000
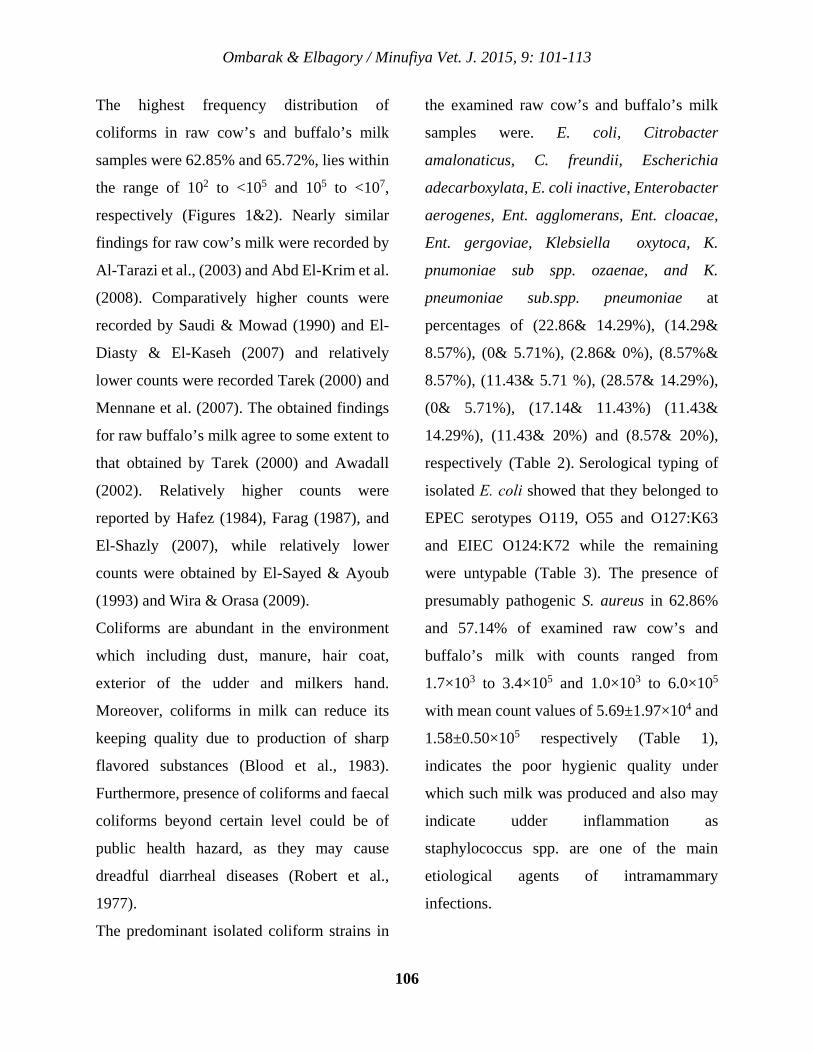
Ombarak & Elbagory / Minufiya Vet. J. 2015, 9: 101-113
106
The highest frequency distribution of
coliforms in raw cow’s and buffalo’s milk
samples were 62.85% and 65.72%, lies within
the range of 102 to <105 and 105 to <107,
respectively (Figures 1&2). Nearly similar
findings for raw cow’s milk were recorded by
Al-Tarazi et al., (2003) and Abd El-Krim et al.
(2008). Comparatively higher counts were
recorded by Saudi & Mowad (1990) and El-
Diasty & El-Kaseh (2007) and relatively
lower counts were recorded Tarek (2000) and
Mennane et al. (2007). The obtained findings
for raw buffalo’s milk agree to some extent to
that obtained by Tarek (2000) and Awadall
(2002). Relatively higher counts were
reported by Hafez (1984), Farag (1987), and
El-Shazly (2007), while relatively lower
counts were obtained by El-Sayed & Ayoub
(1993) and Wira & Orasa (2009).
Coliforms are abundant in the environment
which including dust, manure, hair coat,
exterior of the udder and milkers hand.
Moreover, coliforms in milk can reduce its
keeping quality due to production of sharp
flavored substances (Blood et al., 1983).
Furthermore, presence of coliforms and faecal
coliforms beyond certain level could be of
public health hazard, as they may cause
dreadful diarrheal diseases (Robert et al.,
1977).
The predominant isolated coliform strains in
the examined raw cow’s and buffalo’s milk
samples were. E. coli, Citrobacter
amalonaticus, C. freundii, Escherichia
adecarboxylata, E. coli inactive, Enterobacter
aerogenes, Ent. agglomerans, Ent. cloacae,
Ent. gergoviae, Klebsiella oxytoca, K.
pnumoniae sub spp. ozaenae, and K.
pneumoniae sub.spp. pneumoniae at
percentages of (22.86& 14.29%), (14.29&
8.57%), (0& 5.71%), (2.86& 0%), (8.57%&
8.57%), (11.43& 5.71 %), (28.57& 14.29%),
(0& 5.71%), (17.14& 11.43%) (11.43&
14.29%), (11.43& 20%) and (8.57& 20%),
respectively (Table 2). Serological typing of
isolated E. coli showed that they belonged to
EPEC serotypes O119, O55 and O127:K63
and EIEC O124:K72 while the remaining
were untypable (Table 3). The presence of
presumably pathogenic S. aureus in 62.86%
and 57.14% of examined raw cow’s and
buffalo’s milk with counts ranged from
1.7×10³ to 3.4×10⁵ and 1.0×10³ to 6.0×10⁵
with mean count values of 5.69±1.97×10⁴ and
1.58±0.50×10⁵ respectively (Table 1),
indicates the poor hygienic quality under
which such milk was produced and also may
indicate udder inflammation as
staphylococcus spp. are one of the main
etiological agents of intramammary
infections.
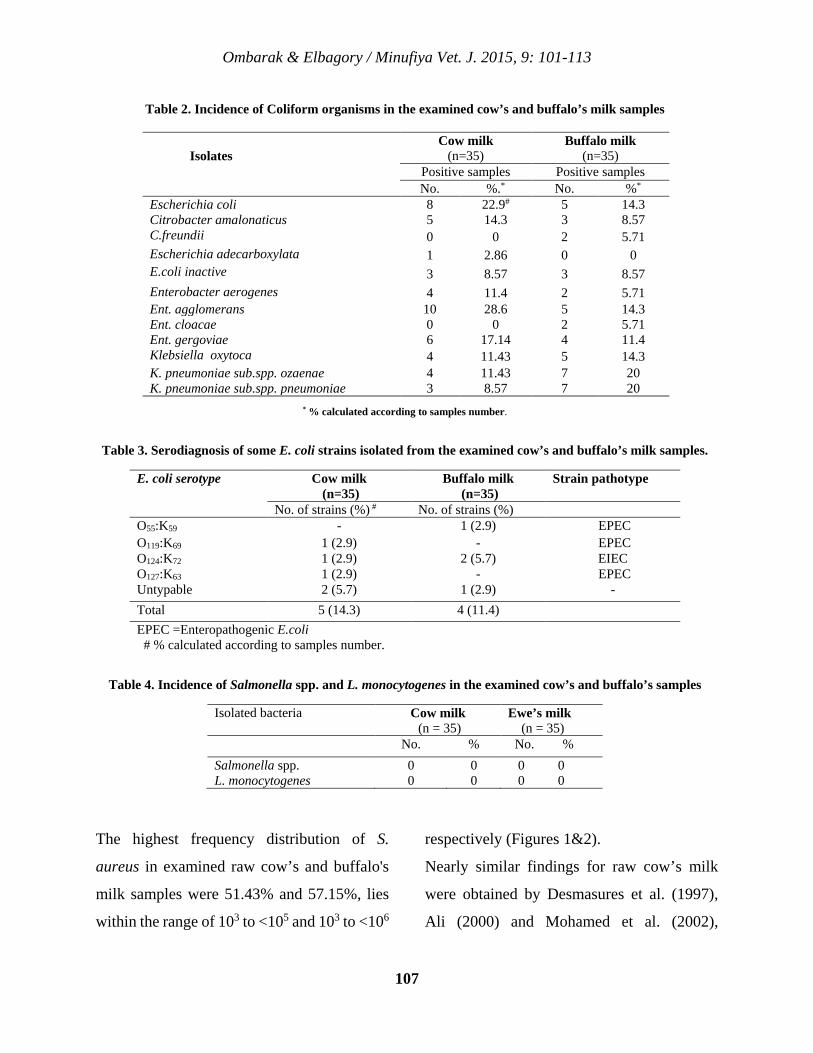
Ombarak & Elbagory / Minufiya Vet. J. 2015, 9: 101-113
107
The highest frequency distribution of S.
aureus in examined raw cow’s and buffalo's
milk samples were 51.43% and 57.15%, lies
within the range of 103 to <105 and 103 to <106
respectively (Figures 1&2).
Nearly similar findings for raw cow’s milk
were obtained by Desmasures et al. (1997),
Ali (2000) and Mohamed et al. (2002),
Table 2. Incidence of Coliform organisms in the examined cow’s and buffalo’s milk samples
Buffalo milk (n=35)
Cow milk (n=35) Isolates
Positive samples Positive samples %* No. %.* No.
14.3 5 22.9# 8 Escherichia coli 8.57 3 14.3 5 Citrobacter amalonaticus 5.71 2 0 0 C.freundii
0 0 2.86 1 Escherichia adecarboxylata 8.57 3 8.57 3 E.coli inactive 5.71 2 11.4 4 Enterobacter aerogenes 14.3 5 28.6 10 Ent. agglomerans 5.71 2 0 0 Ent. cloacae 11.4 4 17.14 6 Ent. gergoviae 14.3 5 11.43 4 Klebsiella oxytoca 20 7 11.43 4 K. pneumoniae sub.spp. ozaenae 20 7 8.57 3 K. pneumoniae sub.spp. pneumoniae
* % calculated according to samples number.
Table 3. Serodiagnosis of some E. coli strains isolated from the examined cow’s and buffalo’s milk samples.
E. coli serotype Cow milk (n=35)
Buffalo milk (n=35)
Strain pathotype
No. of strains (%) # No. of strains (%) O55:K59 - 1 (2.9) EPEC O119:K69 1 (2.9) - EPEC O124:K72 1 (2.9) 2 (5.7) EIEC O127:K63 1 (2.9) - EPEC Untypable 2 (5.7) 1 (2.9) - Total 5 (14.3) 4 (11.4) EPEC =Enteropathogenic E.coli # % calculated according to samples number.
Table 4. Incidence of Salmonella spp. and L. monocytogenes in the examined cow’s and buffalo’s samples
Isolated bacteria Cow milk (n = 35)
Ewe’s milk (n = 35)
No. % No. % Salmonella spp. L. monocytogenes
00
00
0 0 0 0
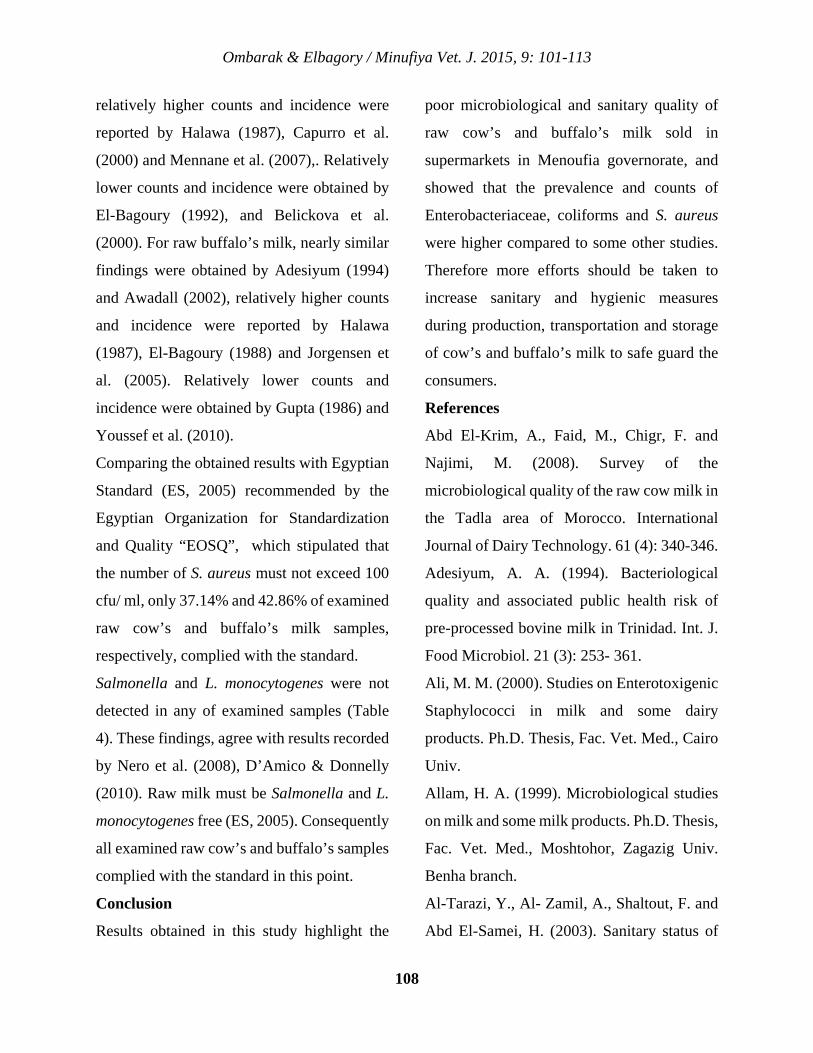
Ombarak & Elbagory / Minufiya Vet. J. 2015, 9: 101-113
108
relatively higher counts and incidence were
reported by Halawa (1987), Capurro et al.
(2000) and Mennane et al. (2007),. Relatively
lower counts and incidence were obtained by
El-Bagoury (1992), and Belickova et al.
(2000). For raw buffalo’s milk, nearly similar
findings were obtained by Adesiyum (1994)
and Awadall (2002), relatively higher counts
and incidence were reported by Halawa
(1987), El-Bagoury (1988) and Jorgensen et
al. (2005). Relatively lower counts and
incidence were obtained by Gupta (1986) and
Youssef et al. (2010).
Comparing the obtained results with Egyptian
Standard (ES, 2005) recommended by the
Egyptian Organization for Standardization
and Quality “EOSQ”, which stipulated that
the number of S. aureus must not exceed 100
cfu/ ml, only 37.14% and 42.86% of examined
raw cow’s and buffalo’s milk samples,
respectively, complied with the standard.
Salmonella and L. monocytogenes were not
detected in any of examined samples (Table
4). These findings, agree with results recorded
by Nero et al. (2008), D’Amico & Donnelly
(2010). Raw milk must be Salmonella and L.
monocytogenes free (ES, 2005). Consequently
all examined raw cow’s and buffalo’s samples
complied with the standard in this point.
Conclusion
Results obtained in this study highlight the
poor microbiological and sanitary quality of
raw cow’s and buffalo’s milk sold in
supermarkets in Menoufia governorate, and
showed that the prevalence and counts of
Enterobacteriaceae, coliforms and S. aureus
were higher compared to some other studies.
Therefore more efforts should be taken to
increase sanitary and hygienic measures
during production, transportation and storage
of cow’s and buffalo’s milk to safe guard the
consumers.
References
Abd El-Krim, A., Faid, M., Chigr, F. and
Najimi, M. (2008). Survey of the
microbiological quality of the raw cow milk in
the Tadla area of Morocco. International
Journal of Dairy Technology. 61 (4): 340-346.
Adesiyum, A. A. (1994). Bacteriological
quality and associated public health risk of
pre-processed bovine milk in Trinidad. Int. J.
Food Microbiol. 21 (3): 253- 361.
Ali, M. M. (2000). Studies on Enterotoxigenic
Staphylococci in milk and some dairy
products. Ph.D. Thesis, Fac. Vet. Med., Cairo
Univ.
Allam, H. A. (1999). Microbiological studies
on milk and some milk products. Ph.D. Thesis,
Fac. Vet. Med., Moshtohor, Zagazig Univ.
Benha branch.
Al-Tarazi, Y., Al- Zamil, A., Shaltout, F. and
Abd El-Samei, H. (2003). Sanitary status of
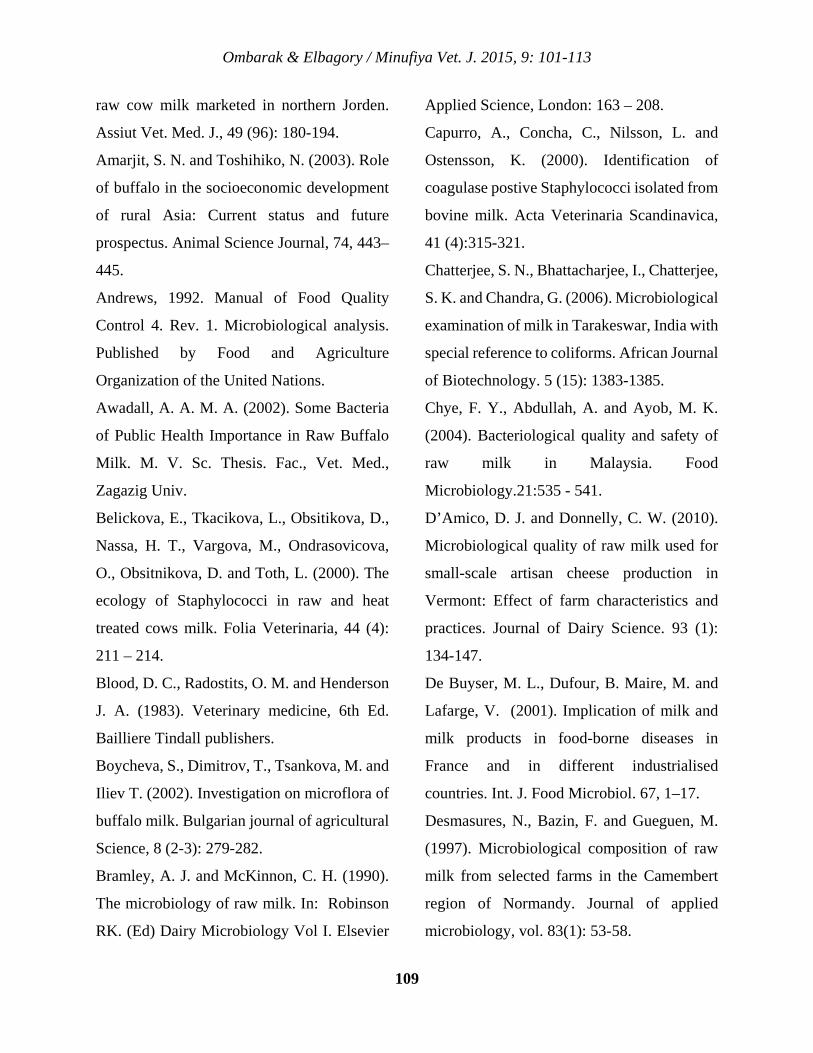
Ombarak & Elbagory / Minufiya Vet. J. 2015, 9: 101-113
109
raw cow milk marketed in northern Jorden.
Assiut Vet. Med. J., 49 (96): 180-194.
Amarjit, S. N. and Toshihiko, N. (2003). Role
of buffalo in the socioeconomic development
of rural Asia: Current status and future
prospectus. Animal Science Journal, 74, 443–
445.
Andrews, 1992. Manual of Food Quality
Control 4. Rev. 1. Microbiological analysis.
Published by Food and Agriculture
Organization of the United Nations.
Awadall, A. A. M. A. (2002). Some Bacteria
of Public Health Importance in Raw Buffalo
Milk. M. V. Sc. Thesis. Fac., Vet. Med.,
Zagazig Univ.
Belickova, E., Tkacikova, L., Obsitikova, D.,
Nassa, H. T., Vargova, M., Ondrasovicova,
O., Obsitnikova, D. and Toth, L. (2000). The
ecology of Staphylococci in raw and heat
treated cows milk. Folia Veterinaria, 44 (4):
211 – 214.
Blood, D. C., Radostits, O. M. and Henderson
J. A. (1983). Veterinary medicine, 6th Ed.
Bailliere Tindall publishers.
Boycheva, S., Dimitrov, T., Tsankova, M. and
Iliev T. (2002). Investigation on microflora of
buffalo milk. Bulgarian journal of agricultural
Science, 8 (2-3): 279-282.
Bramley, A. J. and McKinnon, C. H. (1990).
The microbiology of raw milk. In: Robinson
RK. (Ed) Dairy Microbiology Vol I. Elsevier
Applied Science, London: 163 – 208.
Capurro, A., Concha, C., Nilsson, L. and
Ostensson, K. (2000). Identification of
coagulase postive Staphylococci isolated from
bovine milk. Acta Veterinaria Scandinavica,
41 (4):315-321.
Chatterjee, S. N., Bhattacharjee, I., Chatterjee,
S. K. and Chandra, G. (2006). Microbiological
examination of milk in Tarakeswar, India with
special reference to coliforms. African Journal
of Biotechnology. 5 (15): 1383-1385.
Chye, F. Y., Abdullah, A. and Ayob, M. K.
(2004). Bacteriological quality and safety of
raw milk in Malaysia. Food
Microbiology.21:535 - 541.
D’Amico, D. J. and Donnelly, C. W. (2010).
Microbiological quality of raw milk used for
small-scale artisan cheese production in
Vermont: Effect of farm characteristics and
practices. Journal of Dairy Science. 93 (1):
134-147.
De Buyser, M. L., Dufour, B. Maire, M. and
Lafarge, V. (2001). Implication of milk and
milk products in food-borne diseases in
France and in different industrialised
countries. Int. J. Food Microbiol. 67, 1–17.
Desmasures, N., Bazin, F. and Gueguen, M.
(1997). Microbiological composition of raw
milk from selected farms in the Camembert
region of Normandy. Journal of applied
microbiology, vol. 83(1): 53-58.
Ombarak & Elbagory / Minufiya Vet. J. 2015, 9: 101-113
110
El-Bagoury, A. M. (1988). Incidence and
significanice of indicator organisms in milk
and some dairy products in kaliobia
Governorate. M. V. Sc. Thesis, Fac. Vet.
Med., Moshtohor, Zagazig Univ. Benh
branch.
El-Bagoury, A. M. (1992). Incidence and
public heath importance of food poisoning
causative organisms in milk and some dairy
products in Kaliobia Governorate. Ph. D.
Thesis Fac. of Vet. Med., Zagazig Univ.
“Benha branch".
El-Diasty, M. E. and El- Kaseh, M. R. (2007).
Microbiological Studies on Raw Milk and
Yoghurt in El-beida City. Research Journal of
Animal and Veterinary Sciences, 2: 34-38.
El-Sayed, M. S. and Ayoub, M. A. (1993). The
relationship between coliform and
Enterococcus count in milk and some dairy
product. Beni-suef. Vet. Med. Res., 3 (2): 226
– 275.
El-Shazly, E. S. M. (2007). Studies on
Enterobacteriaceae, yeasts and moulds in milk
and some dairy products. Ph. D. Thesis,
Faculty of Veterinary Medicine, Sadat city,
Menofia University.
El-Zubeir, I. E. M. and Ahmed, M. I. A.
(2007). The hygienic quality of raw milk
produced by some dairy farms in Khartoum
State, Sudan. Res. J. Microbiol., 2: 988-991.
Ensminger, M. E. (1993). Milk Secretion and
Handling in “Dairy Cattle Science, 3rd
Edition, Interstate Publishing, Inc., Danville,
Illinois 416-422 pp.
ES (Egyptian Standards) (2005). ES: 154-
1/2005, Milk and Dairy products. PART: 1,
Raw milk. Egyptian Organization for
Standardization and Quality, Egypt.
ES (Egyptian Standards) (2010). ES:
7123/2010, Essential Requirements for Milk
and Dairy products. Egyptian Organization for
Standardization and Quality, Egypt.
FAOSTAT (2008). Production. Country by
commodity. Available from:
http://faostat.fao.org/site/339/default.aspx.
Farag, H. A. M. (1987). Bacteriological
quality of market raw milk. M.V.SC. Thesis,
Fac. Vet. Med. Moshtohor, Zagazig
University.
Forbes, B. A., Sahm, D. F., and Weissfeld, A.
S. eds. (2007). Bailey and Scott’s Diagnostic
Microbiology, 12th ed. Mosby, St. Louis,
Toronto, London.
Godefay, B. and Molla, B. (2000).
Bacteriological quality of raw cow's milk from
four dairy farms and a milk collection center
in and around Addis Ababa. Berl Munch
Tierarztl Wochenschr. 113(7-8):276-8.
Gupta, R. S. (1986). Bacteriological analysis
of raw milk. Indian Vet. J. 63(3): 254. Dairy
Sci. Abst., 48,692.
Hafez, N.M. (1984). Incidence and public
Ombarak & Elbagory / Minufiya Vet. J. 2015, 9: 101-113
111
health importance of coliform with
special reference to enteropathogenic
serotypes of E. coli in milk and some dairy
products. M.V.Sci. Thesis, Fac. Vet. Med.,
Cairo Univ., Egypt. Halawa, M. A.
(1987). Studies on Staphylococcus
aureus in milk and dairy products and
its public health importance. M.V.Sc.
Thesis, Fac. Vet. Med., Cairo Univ. Han, B.
Z.; Menga, Y., Lia, M.; Yanga, Y. X.; Rena,
F. Z.; Zengb, Q. K. and Noutd, M. J. R.
(2007). A survey on the microbiological and
chemical composition of buffalo milk in
China. Food Control, 18 (6): 742-746.
Harrington, P., Archer, J. Davis, J. P. Croft, D.
R. Varma, J. K. and EIC officers (2002).
Outbreak of Campylobacter jejuni infections
associated with drinking unpasteurized milk
procured through a cow-leasing
program-Wisconsin, 2001. MMWR 51, 548–
549. Heeschen W. H. (1994).
Introduction. In: Monograph on the
significance of pathogenic microorganisms
in raw milk, International Dairy
Federation, Brussels: 8-11.
Hitchins, A.D. (1990). Listeria isolation. In:
6th ed., Food and Drug Administration,
Bacteriological Analytical Manual
(BAM). AOAC. Chapter 29, Arlington,
Virginia. USA.
Hitchins, A. D. (1995).
Listeria monocytogenes. In: 8th ed., Food
and Drug Administration, Revised
1998.
Bacteriological Analytical Manual (BAM),
Chapter 10, AOAC International.
Gaithersburg, MD. USA.
Holt, Krieg, Sneath, Staley, Williams (Ed.).
(1994). Bergey’s Manual™ of determinative
bacteriology, 9th ed. Williams & Wilkins,
Baltimore, Md.
Ibrahim, M. A. (2010). Microbiological Status
of Raw and Pasteurized Milk in Sharkia
Governorate. Ph. D. Thesis, Fac. Vet. Med.,
Zagazig Univ., Egypt.
Jay, J. M. (2000). Modern food microbiology,
6th Ed., Van Nostrand Reinhold Company,
New York.
Jorgensen, H. J., Mork, T., Hogasen, H. R. and
Rorvik, L. M. (2005). Enterotoxigenic
Staphylococcus aureus in bulk milk in
Norway. J. Appl. Microbiol. 99:158–166.
Kivaria, F. M., Noordhuizen, J.P.T.M. and
Kapaga, A.M. (2006). Evaluation of the
hygienic quality and associated public health
hazards of raw milk marketed by smallholder
dairy producers in the Dar es Salaam region,
Tanzania. Trop. Anim. Health Prod. 38:185–
194.
Kornacki, J. L. and Johnson, J. L. (2001).
Enterobacteriaceae, coliforms, and
Escherichia coli as quality and safety
indicators. In: Downes, F.P. & Ito, K. (eds).
Compendium of Methods for the
Microbiological Examination of Foods. 4th
Ombarak & Elbagory / Minufiya Vet. J. 2015, 9: 101-113
112
edition. Washington, American Public Health
Association. Chapter 8, pp. 69–82.
Lancette, G.A. and Bennett, R.W. (2001).
Staphylococcus aureus and staphylococcal
enterotoxins. In: Downes, F.P. & Ito, K. (eds).
Compendium of Methods for the
Microbiological Examination of Foods. 4th
edition. Washington, American Public Health
Association. Chapter 39, pp. 387–403.
Lovett, J. (1987). Listeria isolation. Chapter
29. Bacteriological Analytical Manual
(BAM). AOAC. Arlington, Virginia.
Mennane, Z., Ouhssine, M., Khedid, K. and
Elyachioui, M. (2007). Hygienic Quality of
Raw Cow’s Milk. Int. J. Agri. Biol., 9 (1): 46–
48.
Mohmed, A. A., Hassan, N. M. K. and Eman,
M. S. Z. (2002). A study on some
enterotoxigenic microorganisms in raw and
boiled milk in Cairo and Giza Markets. J.
Egypt. Vet. Med. Ass., 62 (6): 71-81.
Morton, R.D. (2001). Aerobic plate count. In:
Downes, F.P. & Ito, K. (eds). Compendium of
Methods for the Microbiological Examination
of Foods. 4th edition. Washington, American
Public Health Association. Chapter 6, pp. 63–
67.
Muhammad, K., Altaf, I., Hanif, A., Anjum,
A. A. and Tipu, M. Y. (2009). Monitoring of
Hygienic Status of Raw Milk Marketed In
Lahore City, Pakistan. The Journal of Animal
& Plant Sciences 19(2): 74-77.
Nero, L. A., De Mattos, M. R., De Aguiar
Ferreira Barros, M.; Ortolani, M. B. T., Beloti,
V. and De Melo Franco, D. (2008). Listeria
monocytogenes and Salmonella spp. in Raw
Milk Produced in Brazil: Occurrence and
Interference of Indigenous Microbiota in their
Isolation and Development. Zoonoses Public
Health. 55: 299–305.
Oliver, S. P., Jayarao, B. M., Almeida, R. A.
(2005). Foodborne Pathogens in Milk and the
Dairy Farm Environment: Food Safety and
Public Health Implications. Foodborne
Pathogens and Disease 2, 115–129.
Robert, W., Shannon, C. W. and Jorge, O.
(1977). Chemical and microbiological
parameters of milk. J. Infect. Dis., 135: 785.
Saudi, A. M. M. and Moawad, A. A. (1990).
Incidence of Enterobacteriaceae in market
milk in Cairo and its suburbs. Assiut Vet,
Med. J., 24 (47): 134: 139.
Sobeih, A. M. K., Al-Hawary, I. I. and Aman,
I. (2002). Microbiological quality of milk and
ice cream sold in Kafr El- Sheikh and El-
Gharbia governorate. Menufiya Vet. J., 2 (1):
79 – 87.
Tarek, H. M. (2000). Studies On Microbial
And Chemical Pollutants Of Milk Produced In
Assiut Vicinity. Thesis (M.V.Sc), Faculty of
Agriculture, Assiut University.
US FDA (2002). Bacteriological analytical
Ombarak & Elbagory / Minufiya Vet. J. 2015, 9: 101-113
113
manual online. Enumeration of Escherichia
coli and the coliform bacteria. Available from:
http://www.fda.gov/Food/FoodScienceResear
ch/LaboratoryMethods/ucm064948.htm
Varnam, A. H. and Evans, M. G. (1991).
Foodborne pathogens. An illustrated text
chapter 13, pp. 267. Wolfe Publishing Ltd,
Book House, 2 – 16 Tomington Place,
England.
Wira, D. and Orasa, S. (2009). Preliminary
assessment of microbiological quality of raw
buffalo milk commercially produced in
Thailand. As. J. Food Ag-Ind., Special Issue,
S368-S373.
Youssef, M. M., Manal, M., El- Bramony;
Azza M. El-Baz and El-Sherbieny, M. A.
(2010). Relationship between Somatic Cell
Count in Milk and Intramammary Infection in
Egyptian Buffaloes. Proceedings 9th World
Buffalo Congress, Buenos Aires, Abril 2010
p, 588-595.
114
Introduction
Metals, especially heavy metals, are serious
environmental and public health hazards
because their released concentrations into the
environment from industrial processes often
exceed the permissible limits (Velma et al.,
Studies on the potential protective effect of curcumin and zinc against nickel- induced nephrotoxicity in rats
Salah S. El-Ballala, Ashraf M. Morganb , and Nermeen B. EL-Boraic*
a Pathology Department, Faculty of Veterinary Medicine, University of Sadat City, Egypt. b Toxicology and Forensic Medicine Department, Faculty of Veterinary Medicine, Cairo University, Egypt. c Forensic Medicine & Toxicology Department, Faculty of Veterinary Medicine, University of Sadat City, Egypt. *Corresponding Author: [email protected] Accepted: 20/7/2015
Abstract: Nickel (Ni) is a widely distributed metallic environmental pollutant and reported to be the highest
potential risk to health of populations. This work aimed to investigate the ameliorative effect of curcumin
(80 mg/kg. b.w. P.O. every other day) and/or zinc (227mg/L in D.W.) against NiCl2 (1200 ppm (Ni) in
D.W.)- induced nephrotoxicity in rats. One hundred and twenty female albino rats were used. They were
divided into two main groups (A &B) 60 rats each. Each group was subdivided into sex subgroups, 10
rats each. Group A (administrated the antioxidants concomitantly with nickel for 8 weeks), group B
(administered the antioxidants 2 weeks prior to nickel exposure and 8 weeks with nickel). Subgroup
A1& B1 (Normal control), A2 & B2 (Control +ve), A3 & B3 (Ni + corn oil), A4 & B4 (Ni + curcumin),
A5 & B5 (Ni + zinc) and A6 & B6 (Ni + curcumin + zinc). NiCl2- exposed rats showed significant
elevation in serum urea, creatinine levels and serum, renal MDA levels and CAT activities. Moreover,
NiCl2 exposure induced significant decrease in serum and renal GSH levels. Furthermore,
histopathological examination of renal tissues showed necrobiotic changes in renal tubules with
hypercellularity of glomeruli. Treatment (concomitantly with Ni) and pre-treatment (Pre- Ni exposure)
with curcumin and/or zinc improved the altered biochemical parameters and renal histopathological
changes. In conclusion, curcumin and or/zinc administration reversed NiCl2-induced nephrotoxicity in
rats via their ameliorating antioxidant effects. Pre-treatment with curcumin and zinc combination
provided the greatest protection.
Keywords: Nickel, curcumin, zinc, nephrotoxicity, antioxidants.
Minufiya Veterinary Journal ISSN: 1110-9750
El-Ballal et al. / Minufiya Vet. J. 2015, 9: 114-131
115
2009). Industry, mining, advanced agriculture,
household waste, and motor traffic are all
among the activities considered to be major
sources of metals pollution (Sevcikova et al.,
2011). Generally, metals exert toxic effects by
generating reactive oxygen species (ROS) that
induce oxidative damage (Jabeen et al.,
2012).
Nickel is one of the most common heavy
metal contaminants in polluted environments
(Mishra and Dubey 2006). It is used in a
wide variety of metallurgical processes such
as electroplating and alloy production as well
as in nickel-cadmium batteries and household
products manufactures (Das et al., 2008).
Although nickel is considered as an essential
heavy metal (Goyer, 1991), its toxicity is
frequently approved (Parthiban and
Muniyan, 2011; El Ballal et al., 2012 and
Adeyemi and Elebiyo, 2014).
Nickel is a known haemato-, immune-, geno-,
nephro-, hepato-, reproductive and pulmonary
toxic as well as carcinogenic agent
(Kasprzak, et al., 2003; Hostynek, 2006;
Gupta et al., 2006, 2007; Das et al., 2007; El
Ballal et al., 2012 and Adeyemi and Elebiyo,
2014). It exerts its toxic effects by causing cell
death and/or damage, as nickel induces
oxidative stress via ROS production
accompanied by lipid peroxidation (LPO) and
modification in the antioxidant capacity
(Prasad et al., 2006, 2007).
Data suggest that exogenous antioxidants may
play an important role in the prevention of
cellular damage by interacting with free
radicals and by terminating the chain reaction
of LPO (Das et al., 2001). Zinc (Sidhu et al.,
2004) and curcumin (Rao et al., 2008) were
previously reported as exogenous antioxidants
against Ni- induced oxidative stress.
Curcumin, a major yellow pigment and active
component of turmeric powder extracted from
rhizome of Curcuma longa Linn. Previous in
vitro and in vivo studies suggested that
curcumin possesses hepatoprotective
(Marotta et al., 2003), nephroprotective
(Farombi and Ekor, 2006), antitumor (Choi
et al., 2006), anti-inflammatory (Stix, 2007)
and antioxidant (Jefremov et al., 2007)
properties.
Zinc is an essential mineral that is naturally
present in some foods,
added to others, and available as a dietary
supplement. Zinc exerts nephroprotective
(Michael et al., 1985), hepatoprotective
(Szuster-Ciesielska et al., 2009) and
antioxidant (El Ballal et al., 2012) properties.
Also, zinc accelerates wound healing
(Wintergerst et al., 2007) and regulates
apoptosis (Hambidge and Krebs, 2007).
El-Ballal et al. / Minufiya Vet. J. 2015, 9: 114-131
116
A number of natural and chemical compounds
(Rao et al., 2006, 2008, Jia and Chen 2008
and Adeyemi and Elebiyo, 2014) have been
used to ameliorate nickel toxicity. However,
there is scanty literature concerning the
protective activity of curcumin and zinc gainst
Ni- induced nephrotoxicity especially the
ideal time of their administration to give the
best protection. In the light of this, our work
aimed to study ameliorating role of curcumin
and/ or Zinc (both on concomitant and pre Ni-
exposure treatment) against Ni– induced
nephrotoxicity in rats.
Materials and Methods
1. Animals:
A total of 120 adult female albino rats
weighing between 140-160g were used in this
study. They were obtained from Faculty of
Veterinary Medicine, Cairo University, Giza,
Egypt. All animals were housed in
polypropylene cages with mesh wire tops in
well ventilated room and provided with
balanced ration and clean water ad libitum.
They were kept under observation for two
weeks before the beginning of experiments for
atmospheric and handling accommodation.
2. Chemicals:
Nickel in the form of Nickel chloride
hexahydrate (NiCl2. 6H2O) and zinc in the
form of Zinc sulfate heptahydrate (ZnSO4·
7H2O) were purchased from EL Naser
Company, Egypt.
Curcumin in a powder form was purchased
from EL Gomhorya Company, Egypt.
Curcumin was dissolved in corn oil (vehicle).
Diagnostic kits for assaying serum and tissue
biochemical parameters were purchased from
Biodiagnostic Company, Dokki, Giza, Egypt.
All other chemicals and reagents were of
analytical grade and commercially available.
3. Experimental design and animal
grouping:
One hundred and twenty female albino rats
were used. They were divided into two main
groups (A & B) 60 rats each. Each group was
subdivided into sex subgroups, 10 rats each.
Group A (administrated the antioxidants
concomitantly with nickel for 8 weeks), group
B (administered the antioxidants 2 weeks prior
to nickel exposure and 8 weeks with nickel).
Subgroup A1& B1 (Normal control), A2 & B2
(control +ve, NiCl2- intoxicated), A3 & B3
(NiCl2+corn oil), A4 & B4 (NiCl2+curcumin),
A5 & B5 (NiCl2+zinc) and A6 & B6
(NiCl2+curcumin+zinc).
The dose and rout of exposure of NiCl2 (1200
ppm (Ni) in D.W.), curcumin (80 mg/kg.
b.w.P.O. every other day) and zinc (227mg/L
in D.W.) were selected according to those
previously used by Cempel and Janicka
El-Ballal et al. / Minufiya Vet. J. 2015, 9: 114-131
117
(2002); Kalpana and Menon (2004) and
Sidhu et al. (2004), respectively.
4. Samples collection and preparation:
After eight weeks in treated subgroups and ten
weeks in pre-treated subgroups, animals were
fasted overnight, anaesthetized and sacrificed
for samples collection. Blood sample were
collected without anticoagulant and
centrifuged at 3000 rpm for 15 min in a
cooling centrifuge for serum separation and
estimation of serum biochemical parameters.
Kidneys of each rat were divided into two
parts, one part stored in ice bags at -200C for
assaying renal tissue biochemical
investigations while the other part was kept in
10% formalin for the histopathological
examination.
5. Biochemical analysis:
5.1. Serum urea and creatinine levels were
measured using the colorimetric methods of
Young (2001).
5.2. Serum and tissue MDA, GSH contents
and CAT activities were determined
according to the procedure described by
Ohkawa et al. (1979); Beutler et al. (1963)
and Aebi (1984), respectively.
6. Histopathological examination:
Kidney Specimens intended for the
histopathological examination were fixed in
10% neutral buffered formalin solution,
processed and stained by hematoxylin and
eosin (H&E) stain according to Bancroft and
Marilyn (2002).
7. Statistical analysis:
Values were presented as mean ± standard
error (SE). Statistical differences of Ni-
nephrotoxic effect and the ameliorative effect
of curcumine and/or zinc were analyzed by
one-way ANOVA according to Snedecor and
Cochron (1987). All statistical analyses were
performed using SPSS (Statistical package for
Social Sciences) Version 16 released on 2007.
Statistical significance was considered at P <
0.05.
Results
Our results revealed that NiCl2- induced renal
adverse toxic effects as evidenced by
biochemical and histopathological changes. In
addition, the obtained results approved the
curative and protective effects of curcumin
and/or zinc administrations against such toxic
effects (Tables 1, 2 and figures 1-14) this
study declared a significant increase in serum
urea and creatinine levels in Ni- intoxicated
rats compared to the normal control ones
(figure 1). Also, investigation of MDA; GSH
levels and CAT activities revealed significant
elevation in serum and renal MDA levels with
a concomitant decrease in GSH contents and
significant increase in CAT activities (figures
2, 3, 4).
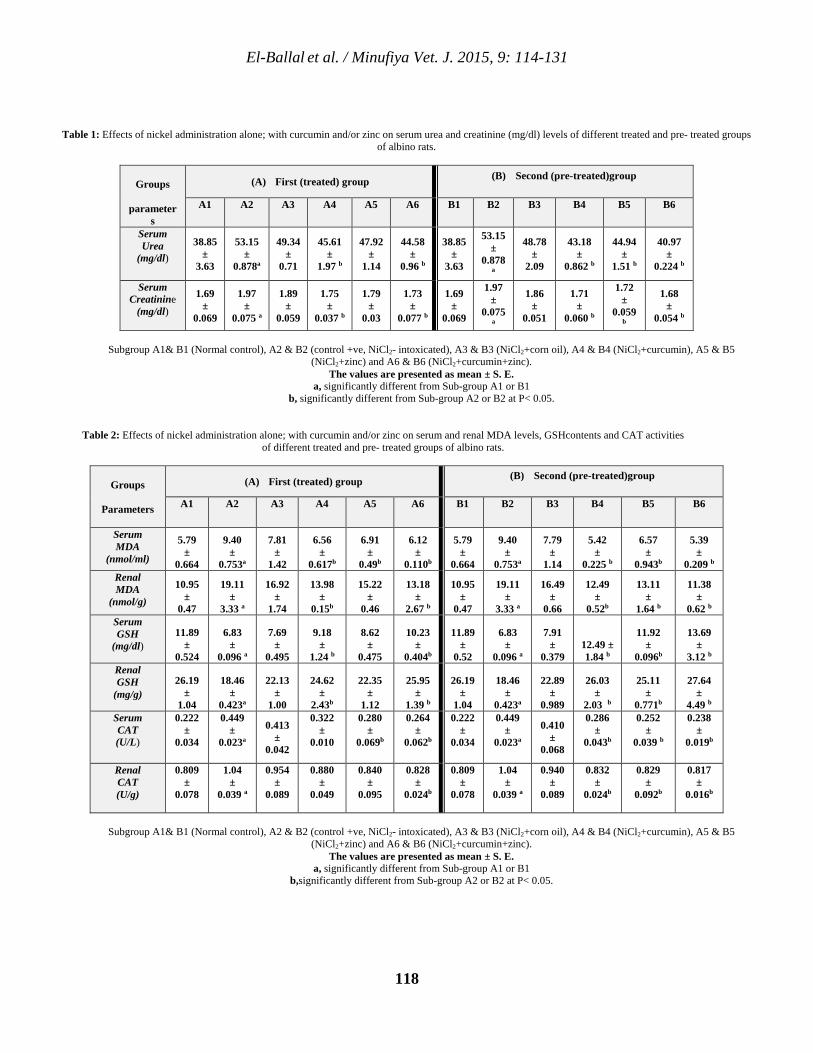
El-Ballal et al. / Minufiya Vet. J. 2015, 9: 114-131
118
Table 1: Effects of nickel administration alone; with curcumin and/or zinc on serum urea and creatinine (mg/dl) levels of different treated and pre- treated groups of albino rats.
Groups
parameters
(A) First (treated) group (B) Second (pre-treated)group
A1 A2 A3 A4 A5 A6 B1 B2 B3 B4 B5 B6
Serum Urea
(mg/dl) 38.85
± 3.63
53.15 ±
0.878a
49.34 ±
0.71
45.61 ±
b1.97
47.92 ±
1.14
44.58 ±
b0.96
38.85 ±
3.63
53.15 ±
0.878 a
48.78 ±
2.09
43.18 ±
0.862 b
44.94 ±
1.51 b
40.97 ±
0.224 b
Serum Creatinine
(mg/dl)
1.69 ±
0.069
1.97 ±
a0.075
1.89 ±
0.059
1.75 ±
b0.037
1.79 ±
0.03
1.73 ±
b0.077
1.69 ±
0.069
1.97 ±
0.075 a
1.86 ±
0.051
1.71 ±
0.060 b
1.72 ±
0.059 b
1.68 ±
0.054 b
Subgroup A1& B1 (Normal control), A2 & B2 (control +ve, NiCl2- intoxicated), A3 & B3 (NiCl2+corn oil), A4 & B4 (NiCl2+curcumin), A5 & B5
(NiCl2+zinc) and A6 & B6 (NiCl2+curcumin+zinc). The values are presented as mean ± S. E.
a, significantly different from Sub-group A1 or B1 b, significantly different from Sub-group A2 or B2 at P< 0.05.
Table 2: Effects of nickel administration alone; with curcumin and/or zinc on serum and renal MDA levels, GSHcontents and CAT activities of different treated and pre- treated groups of albino rats.
Groups
Parameters
(A) First (treated) group (B) Second (pre-treated)group
A1 A2 A3 A4 A5 A6 B1 B2 B3 B4 B5 B6
Serum MDA
(nmol/ml)
5.79 ±
0.664
9.40 ±
0.753a
7.81 ±
1.42
6.56 ±
b0.617
6.91 ±
b0.49
6.12 ±
b0.110
5.79 ±
0.664
9.40 ±
0.753a
7.79 ±
1.14
5.42 ±
0.225 b
6.57 ±
0.943b
5.39 ±
0.209 b Renal MDA
(nmol/g) 10.95
± 0.47
19.11 ±
a3.33
16.92 ±
1.74
13.98 ±
b0.15
15.22 ±
0.46
13.18 ±
b2.67
10.95 ±
0.47
19.11 ±
a3.33
16.49 ±
0.66
12.49 ±
b0.52
13.11 ±
b1.64
11.38 ±
b0.62 Serum GSH
(mg/dl) 11.89
± 0.524
6.83 ±
a0.096
7.69 ±
0.495
9.18 ±
b1.24
8.62 ±
0.475
10.23 ±
b0.404
11.89 ±
0.52
6.83 ±
a0.096
7.91 ±
0.379 12.49 ±
b1.84
11.92 ±
b0.096
13.69 ±
b3.12 Renal GSH
(mg/g) 26.19
± 1.04
18.46 ±
a0.423
22.13 ±
1.00
24.62 ±
2.43b
22.35 ±
1.12
25.95 ±
b1.39
26.19 ±
1.04
18.46 ±
a0.423
22.89 ±
0.989
26.03 ±
2.03 b
25.11 ±
0.771b
27.64 ±
4.49 b Serum CAT (U/L)
0.222 ±
0.034
0.449 ±
0.023a 0.413
± 0.042
0.322 ±
0.010
0.280 ±
b0.069
0.264 ±
b0.062
0.222 ±
0.034
0.449 ±
0.023a 0.410
± 0.068
0.286 ±
b0.043
0.252 ±
b0.039
0.238 ±
b0.019
Renal CAT (U/g)
0.809 ±
0.078
1.04 ±
a0.039
0.954 ±
0.089
0.880 ±
0.049
0.840 ±
0.095
0.828 ±
b0.024
0.809 ±
0.078
1.04 ±
a0.039
0.940 ±
0.089
0.832 ±
b0.024
0.829 ±
0.092b
0.817 ±
0.016b
Subgroup A1& B1 (Normal control), A2 & B2 (control +ve, NiCl2- intoxicated), A3 & B3 (NiCl2+corn oil), A4 & B4 (NiCl2+curcumin), A5 & B5
(NiCl2+zinc) and A6 & B6 (NiCl2+curcumin+zinc). The values are presented as mean ± S. E.
a, significantly different from Sub-group A1 or B1 b,significantly different from Sub-group A2 or B2 at P< 0.05.
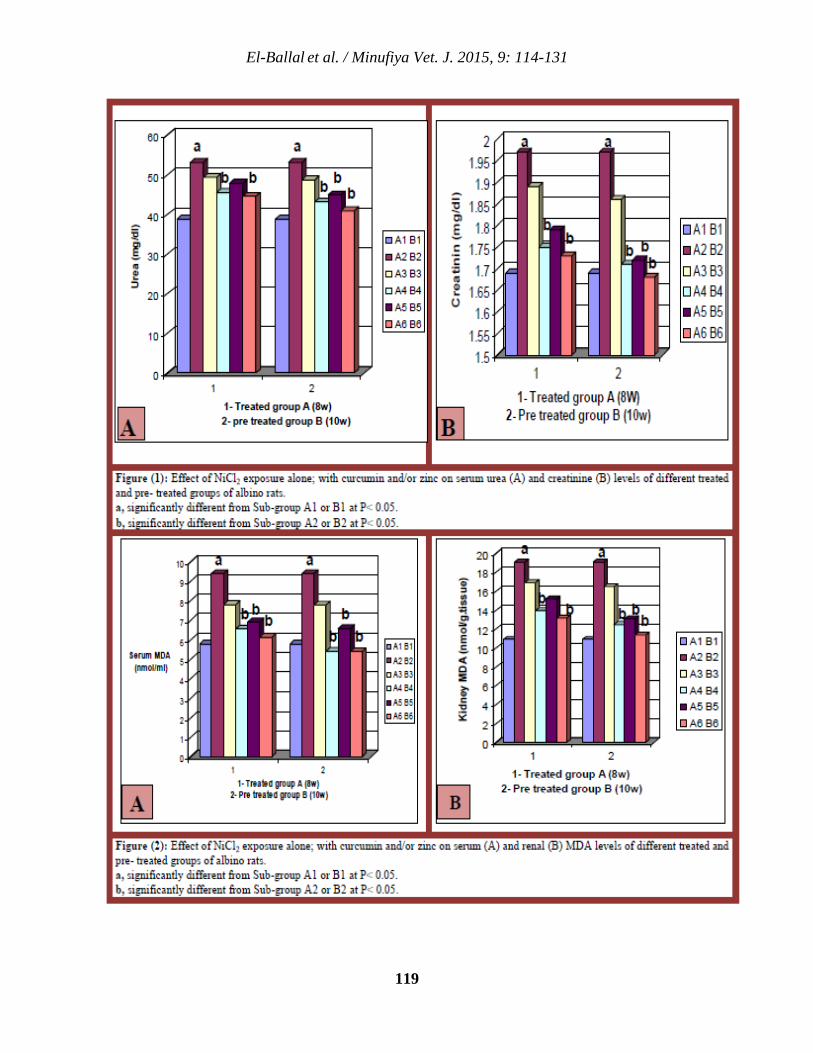
El-Ballal et al. / Minufiya Vet. J. 2015, 9: 114-131
119
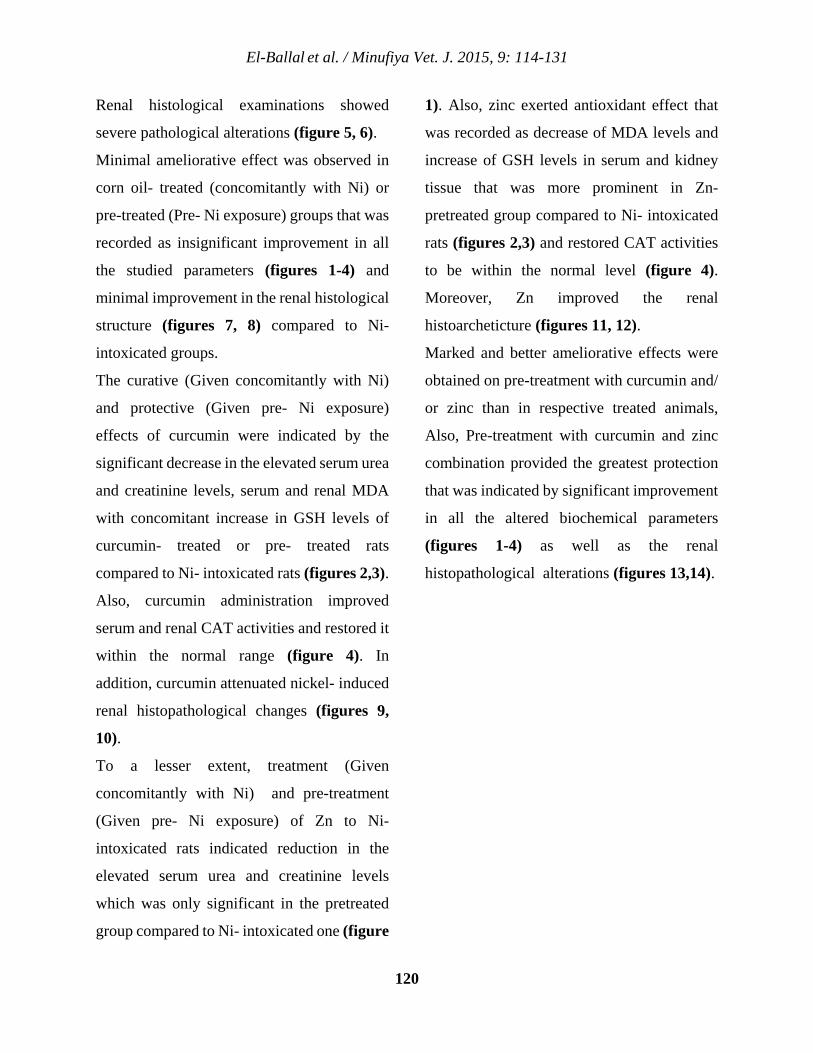
El-Ballal et al. / Minufiya Vet. J. 2015, 9: 114-131
120
Renal histological examinations showed
severe pathological alterations (figure 5, 6).
Minimal ameliorative effect was observed in
corn oil- treated (concomitantly with Ni) or
pre-treated (Pre- Ni exposure) groups that was
recorded as insignificant improvement in all
the studied parameters (figures 1-4) and
minimal improvement in the renal histological
structure (figures 7, 8) compared to Ni-
intoxicated groups.
The curative (Given concomitantly with Ni)
and protective (Given pre- Ni exposure)
effects of curcumin were indicated by the
significant decrease in the elevated serum urea
and creatinine levels, serum and renal MDA
with concomitant increase in GSH levels of
curcumin- treated or pre- treated rats
compared to Ni- intoxicated rats (figures 2,3).
Also, curcumin administration improved
serum and renal CAT activities and restored it
within the normal range (figure 4). In
addition, curcumin attenuated nickel- induced
renal histopathological changes (figures 9,
10).
To a lesser extent, treatment (Given
concomitantly with Ni) and pre-treatment
(Given pre- Ni exposure) of Zn to Ni-
intoxicated rats indicated reduction in the
elevated serum urea and creatinine levels
which was only significant in the pretreated
group compared to Ni- intoxicated one (figure
1). Also, zinc exerted antioxidant effect that
was recorded as decrease of MDA levels and
increase of GSH levels in serum and kidney
tissue that was more prominent in Zn-
pretreated group compared to Ni- intoxicated
rats (figures 2,3) and restored CAT activities
to be within the normal level (figure 4).
Moreover, Zn improved the renal
histoarcheticture (figures 11, 12).
Marked and better ameliorative effects were
obtained on pre-treatment with curcumin and/
or zinc than in respective treated animals,
Also, Pre-treatment with curcumin and zinc
combination provided the greatest protection
that was indicated by significant improvement
in all the altered biochemical parameters
(figures 1-4) as well as the renal
histopathological alterations (figures 13,14).
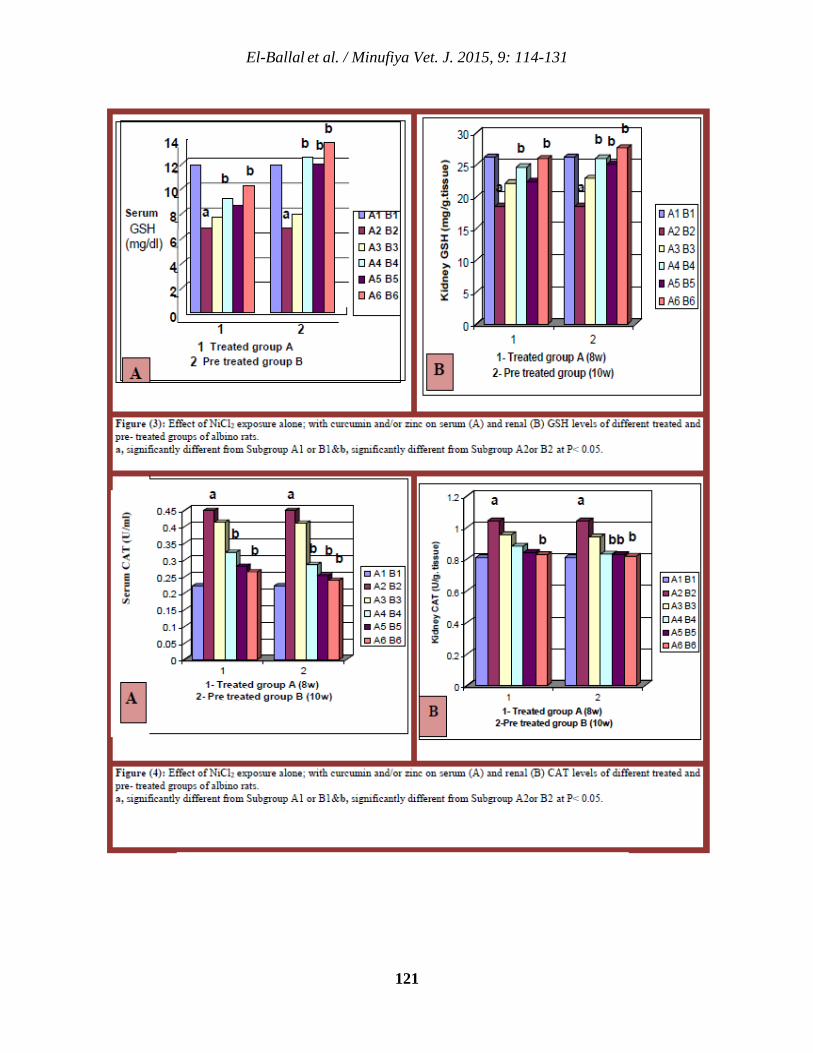
El-Ballal et al. / Minufiya Vet. J. 2015, 9: 114-131
121
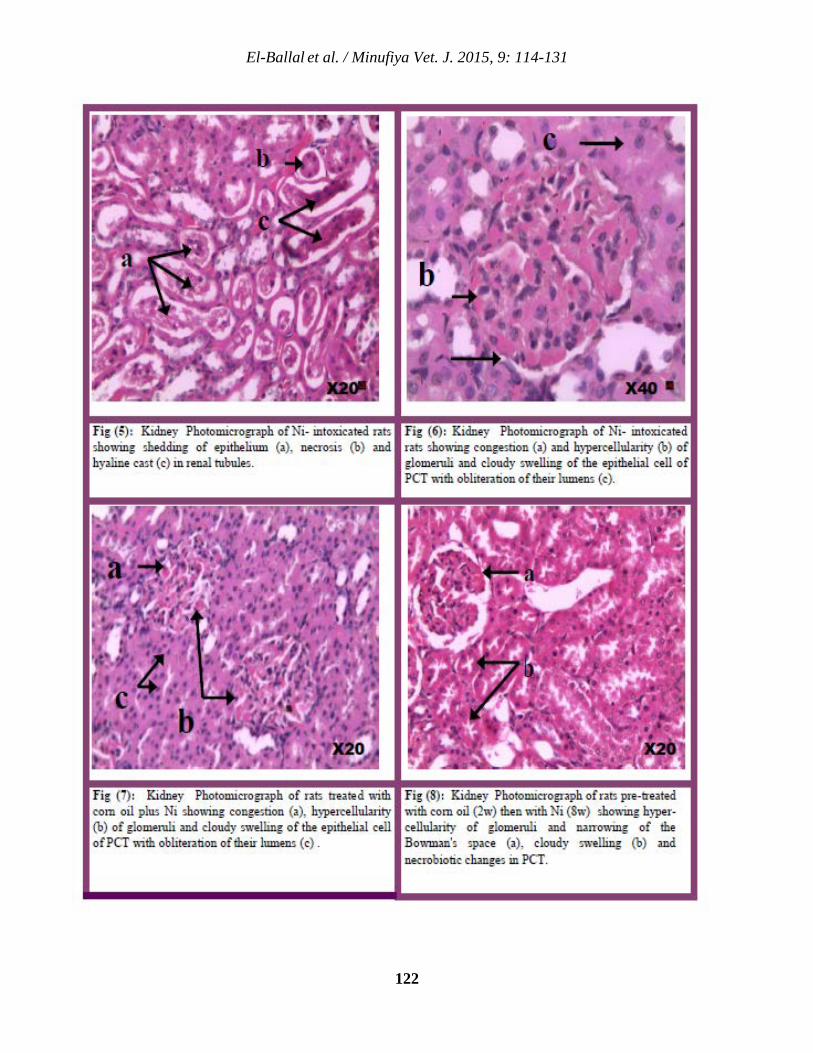
El-Ballal et al. / Minufiya Vet. J. 2015, 9: 114-131
122
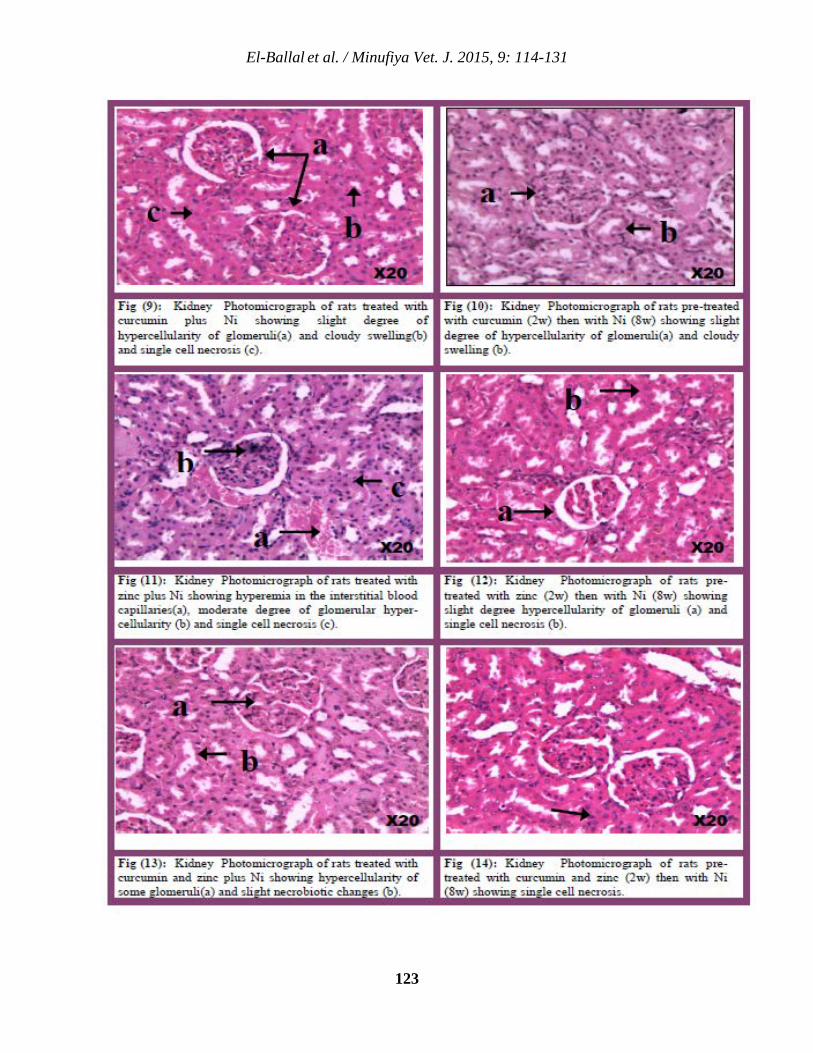
El-Ballal et al. / Minufiya Vet. J. 2015, 9: 114-131
123
El-Ballal et al. / Minufiya Vet. J. 2015, 9: 114-131
124
Discussion:
The role of pollution as a health risk factor is
of special interest. Numerous toxic pollutants,
such as nickel, cadmium and lead are being
released into the environment as a result of
industrialization, combustion of fossil fuels,
crude oil and coal.
Nickel (Ni) is considered as one of the widely
distributed metallic pollutants in the
environment. Several approaches involving its
nephrotoxicity have been documented
(Prasad et al., 2006, Amudha and Pari, 2011
and Adeyemi and Elebiyo, 2014).
As a result of the frequent and continuous
exposure to Ni due to its indiscriminate uses
and industrial discharges into the environment
with the resulting environmental pollution and
health hazards, this study aimed to investigate
NiCl2- induced nephrotoxicity in rats with
trials for protection using curcumin and/or
zinc against such toxic effects.
Our results revealed that the nephrotoxic
effect of Ni was in the form of biochemical
changes in serum urea and creatinine levels,
serum and renal MDA, GSH contents and
CAT activities, as well as renal
histopathological changes.
Serum urea and creatinine levels are among
the major biochemical indices commonly used
to evaluate renal functions (Gross et al., 2005
and Asante et al., 2014). In agreement with
our result, Adeyemi and Elebiyo (2014)
observed elevated serum urea and creatinine
levels following Ni exposure. The negative
effect of nickel ions on glycoprotein
metabolism may explain the nephrotoxic
effects of excessive exposure (Savolainen,
1996).
Previous studies revealed that oxidative
damages are implicated in the pathogenesis of
Ni- induced nephrotoxicity (Prasad, 2006,
2007 and Amudha and Pari, 2011). In
general, Ni induces oxidative damages in
various tissues by either increasing ROS
production (Das et al., 2001) or depleting the
endogenous antioxidants (Parthiban and
Muniyan, 2011)
In the present study, Ni administration
disrupted the prooxidant/ antioxidant balance
of cells resulting in oxidative damages that
was represented by the significantly increased
serum and renal MDA levels, CAT activities
and reduction in their GSH contents.
The increase in MDA, the breakdown product
of lipid peroxidation and the reduction in GSH
were previously recorded in kidney of rats
exposed to nickel intoxication (Amudha and
Pari, 2011).
In our study the decreased level of serum and
tissue GSH contents of Ni- intoxicated rats
may be due to its excessive utilization in
detoxification of peroxide radicals produced
El-Ballal et al. / Minufiya Vet. J. 2015, 9: 114-131
125
after Ni toxicity. The decreased GSH contents
may be the cause of enhanced renal LPO and
increase MDA levels (Dwivedi and Sarkar,
2009).
Surprisingly, our result showed increase in
serum and renal CAT activities that could be
attributed to several interpretations. Prasad et
al. (2006, 2007) and M’Bemba-Meka et al.
(2005) mentioned that Ni administration
resulted in increase the formation of H2O2.
Also, zinc deficiency following exposure to Ni
causes leakage of H2O2 from a NADPH-
dependent cytochrome P450 enzyme system
(Hammermueller et al., 1987) which could
stimulate CAT activity to cope with the
increase of oxidative stress (Sidhu et al.,
2004). In addition, CAT is a homotetrameric
ferriheme-containing enzyme, requiring iron
for its synthesis (Fridovich, 1998), Nickel
toxicity increases tissue iron levels (Athar et
al., 1987) and as a consequence, it increases
CAT activities.
The recorded improvement in the biochemical
parameters and renal histopathological
changes following corn oil administration to
Ni– exposed animals could be attributed to its
antioxidant constituents of alpha-tocopherol,
beta-tocopherol, gammatocopherol and delta-
tocopherol (vitamin E) (Traber, 2006).
In our study, curcumin attenuated renal
dysfunction along with reduction of lipid
peroxidation and restored MDA, GSH and
CAT in Ni-intoxicated rats near to normal.
This observation is in line with the previous
reports, which approved that curcumin
decreased LPO possibly by its antioxidant
properties (Farombi and Ekor, 2006 and
Hussein and Abu-Zinadah, 2010).
The antioxidative properties of curcumin
could be attributed to various mechanisms.
Curcumin suppresses iron- induced LPO due
to chelation of iron (Sreejayan and Rao,
1994), acts as free radicals scavenger (Majeed
et al., 2000), reduces the utilization of
vitamins C and thus maintains their levels
(Rukkumani, 2003) and increases GSH
synthesis (Zheng et al., 2007). Thus,
curcumin exerted its protective effect against
Ni-induced toxicity by modulating the extent
of LPO and augmenting the antioxidant
defense system.
The ability of curcumin to chelate iron (Jiao
et al., 2006, 2009) that is essential for CAT
synthesis and to scavenge H2O2 (Reddy and
Lokesh, 1994).could explain the recorded
reduction in CAT activity following curcumin
administration both in treated and pre-treated
groups.
In consistent with our results, Michael et al.
(1985) reported that oral zinc supplementation
counteracted the Ni– induced renal oxidative
damages in rats, approving its antioxidant
El-Ballal et al. / Minufiya Vet. J. 2015, 9: 114-131
126
properties (Milbury and Richer, 2008). This
could illustrate the recorded improvement of
all the altered biochemical parameters and
renal histopathological changes following
Zinc administration either in treated (Given
Zn concomitantly with Ni) or pre-treated
(Given Zn pre- Ni exposure) groups.
It has been suggested that zinc may protect
sulfhydryl groups against oxidation and
inhibit the production of ROS by transition
metals, in addition to its function as a
membrane stabilizer (Bray and Bettger, 1990
and Oteiza et al., 1995). Zinc acts as a
cofactor of antioxidant enzymes and essential
for SOD synthesis and thus for elimination of
free radicals (Tainer et al., 1983 and Leung,
1998).
Following administration of both curcumin
and zinc together, the obtained results
confirmed significant improvement in all of
the adversely affected parameters and the
toxic pathological changes especially in the
pre-treated rats. The attenuation of N- induced
toxic effects may be due to an agonistic effect
between curcumin and zinc that strengthened
their antioxidant properties.
Conclusion
In conclusion, the results of this study
revealed that Ni- induced nephrotoxicity
could be ameliorated by curcumin and/or zinc
supplementations. Significant and better
improvement was obtained on pre-treatment
with the two antioxidants alone or together.
However, Pre-treatment with curcumin and
zinc combination provided the greatest
protection.
References:
Adeyemi, O.S. and Elebiyo, T.C. (2014):
Moringa oleifera supplemented diets
prevented nickel-induced nephrotoxicity in
wistar rats. Hindawi Publishing Corporation
Journal of Nutrition and Metabolism, 2014: 8
pages.
Aebi, H. (1984): Catalase in vitro. Method.
Enzymol., 105: 121-126.
Amudha, K. and Pari, L. (2011): Beneficial
role of naringin, a flavanoid on nickel induced
nephrotoxicity in rats. Chemico-Biological
Interactions, 193 (1): 57–64.
Asante, W.J.; Nasare, I.L.; Tom-Dery,
D.K.; Ochire-Boadu, D. and Kentil, K.B.
(2014): Nutrient composition of Moringa
oleifera leaves from two agro ecological zones
in Ghana. African Journal of Plant Science,
8(1): 65–71.
Athar, M.; Hasan, S.K. and Srivastava,
R.C. (1987): Evidence for the involvement of
hydroxyl radicals in nickel mediated
enhancement of lipid peroxidation:
Implications for nickel carcinogenesis.
Biochem. Biophys. Res. Commun., 147:
1276-1281.
El-Ballal et al. / Minufiya Vet. J. 2015, 9: 114-131
127
Bancroft, J.D. and Marilyn, G. (2002):
Theory and practice of histological
techniques, 5th edition, pp: 99-113.
Beutler, E.; Duron, O. and Kelly, B.M.
(1963): Improved method for the
determination of blood glutathione. J. Lab.
Clin. Med., 61: 882–888.
Bray, T.M. and Bettger, W.J. (1990): The
physiological role of zinc as an antioxidant.
Free Radic. Biol. Med., 8: 281- 291.
Cempel, M. and Janicka, K. (2002):
Distribution of nickel, zinc, and copper in rat
organs after oral administration of nickel (II)
chloride, Biol. Trace Elem. Res., 90 (1–3):
215–226.
Choi, H.; Chun, Y-S.; Kim, S-W.; Kim, M-
S. and Park, J-W. (2006): Curcumin Inhibits
Hypoxia-Inducible Factor-1 by Degrading
Aryl Hydrocarbon Receptor Nuclear
Translocator: A Mechanism of Tumor Growth
Inhibition. Molecular Pharmacology
(American Society for Pharmacology and
Experimental Therapeutics), 70(5): 1664-
1671.
Das, K.K.; Das, S.N. and Dasgupta, S.
(2001): The influence of ascorbic acid on
nickel induced hepatic lipid peroxidation in
rats. J Basic Clin Physiol Pharmacol., 12: 187-
194.
Das, K.K.; Gupta, A.D.; Dhundasi, S.A.;
Patil,A.M.; Das, S.N. and Ambekar, J.G.
(2007): Protective role of L-ascorbic acid on
antioxidant defense system in erythrocytes of
albino rats exposed to nickel sulphate.
Biometals, 20: 177- 84.
Das, K.K.; Das, S.N. and Dhundasi, S.A.
(2008): Nickel, its adverse health effects &
oxidative stress. Indian J Med Res., 128: 412-
425.
Dwivedi, J. and Sarkar, P.D. (2009): Study
of oxidative stress, homocysteine, copper &
zinc in nephrotic syndrome: therapy with
antioxidants, minerals and B-complex
vitamins J. Biochem. Tech., 1(4): 104-107.
El-Ballal, S.S.; Morgan, A.M. and
Ebrahim, N.B. (2012): Nickel hepatotoxicity
in rats and trials for protection using
antioxidants. Abstracts Toxins 2012/ Toxicon,
60 (2012): 95-248.
Farombi, E.O. and Ekor, M. (2006):
Curcumin attenuates gentamicin induced renal
oxidative damage in rats. Food Chem.
Toxicol., 44: 1443-1448.
Fridovich, I. (1998): Oxygen toxicity: A
radical explanation. J. Experimental Biology,
201: 1203 – 1209.
Goyer, R.A. (1991): Toxic effects of metals.
In: Amdur, M. O.; Doull, J.; Klaassen, C. D.,
eds. Casarett and Doull's toxicology: The
basic science of poisons. 4th ed. New York:
Pergamon Press, 623-681.
El-Ballal et al. / Minufiya Vet. J. 2015, 9: 114-131
128
Gross, J.L.; de Azevedo, M.J. Silveiro, S.P.
Canani, L.H. Caramori, M.L. and
Zelmanovitz, T. (2005): Diabetic
nephropathy: diagnosis, prevention, and
treatment. Diabetes Care, 28 (1): 164–176.
Gupta, A.D.; Patil, A.M.; Ambekar, J.G.;
Das, S.N.; Dhundasi, S.A. and Das, K.K.
(2006): L-ascorbic acid protects the
antioxidant defense system in nickel-exposed
albino rat lung tissues. J. Basic. Clin. Physiol.
Pharmacol., 17: 87-100.
Gupta, A.D.; Dhundasi, S.A.; Ambekar,
J.G.; Das, K.K. (2007): Effect of Lascorbic
acid on antioxidant defense system in testes of
albino rats exposed to nickel sulphate. J Basic
Clin Physiol Pharmacol, 18 : 87-95.
Hambidge, K.M. and Krebs, N.F. (2007):
Zinc deficiency: a special challenge. J. Nutr.,
137 (4): 1101-1105.
Hammermueller, J.D.; Bray, T.M. and
Bettger, W.J. (1987): Effect of zinc and
copper deficiency on microsomal NADPH-
deficient active oxygen generation in rat
lung and liver. J. Nutr., 116: 894-901.
Hostynek, J.J. (2006): Sensitization to
nickel: etiology, epidemiology, immune
reactions, prevention, and therapy. Rev
Environ Health, 21: 253-80.
Hussein, H.K. and Abu-Zinadah, O.A.
(2010): Antioxidant effect of curcumin
extracts in induced diabetic wister rats. Int. J.
Zool. Res., 6: 266 - 276.
Jabeen, G.; Javed, M. and Azmat, H.
(2012): Assessment of heavy metals in the fish
collected from the river Ravi, Pakistan. Pak.
Vet. J., 32: 107–111.
Jefremov, V.; Zilmer, M.; Zilmer, K.;
Bogdanovic, N. and Karelson, E. (2007):
Antioxidative effects of plant polyphe nols:
From protection of G protein signaling to
prevention of age-related pathologies.
Ann.N.Y. Acad Sci., 1095: 449 - 57.
Jia, J and Chen, J. (2008): Chronic nickel
induced DNA damage and cell death the
protection role of ascorbic acid.
Environmental Toxicology, 23 (3): 401-406.
Jiao,Y. ;Wilkinson, J. 4th; Pietsch, E.C.;
Buss, J. L. ,Wang, W.; Planalp, R.; Torti,
F.M. and Torti, S.V. (2006): Iron chelation
in the biological activity of curcumin. Free
Radic. Biol. Med., 40: 1152 – 1160.
Jiao, Y.; Wilkinson, J. and Di X, et al.
(2009): Curcumin, a cancer chemopreventive
and chemotherapeutic agent, is a biologically
active iron chelator. Blood, 113 (2): 462 – 9.
Kalpana, C. and Menon, V.P. (2004):
Curcumin ameliorates oxidative stress during
nicotine induced lung toxicity in Wistar rats,
Ital. J. Biochem., 53 (2): 82–86.
Kasprzak, K.S.; Sunderman, F.W. and
Salnikow, K. (2003): Nickel carcinogenesis.
El-Ballal et al. / Minufiya Vet. J. 2015, 9: 114-131
129
Fundamental and Molecular Mechanisms of
Mutagenesis, Mutation Research, 533: 67 - 97.
Leung, F.Y. (1998): Trace elements that act
as antioxidants in parenteral micronutrition.
Journal of nutritional biochemistry, 9(6): 304-
307.
M’Bemba-Meka, P.; Lemieux, N. and
Chakrabarti, S.K. (2005): Role of oxidative
stress, mitochondrial membrane potential, and
calcium homeostasis in nickel sulphate-
induced human lymphocyte death in vitro.
Chem. Biol. Interact., 156: 69 - 80.
Majeed, M.; Badmaev, V.; Shivakumar, U.
and Rajendran, R. (2000): Research Report
from Sabinsa Corporation in Curcuminoids:
Antioxidant phytonutrients, online edition
www. curcuminoids.com/antioxidant.htm.
Marotta, F.; Shield, Y.R.; Bamba, T.;
Naito,Y., Minelli, E.and Yoshioka A.
(2003): Hepatoprotective effect of a
curcumin/absinthium compound in
experimental severe liver injury. Chinese
Journal of Digestive Diseases (Blackwell
Publishing), 4 (3): 122-7.
Michael, P.W.; Kazimierz, S.K., Masato, O.
and Lionel A.P. (1985): Protective effects of
zinc acetate toward the toxicity of nickelous
acetate in rats. Toxicology, 34 (1): 29 - 41.
Milbury, P.E. and Richer, A.C. (2008):
Understanding the Antioxidant Controversy:
Scrutinizing the "fountain of Youth".
Greenwood Publishing Group. p. 99.
Mishra, S. and Dubey, R.S. (2006): Heavy
metal uptake and detoxification mechanisms
in plants. Int J Agric Res., 1:122–141.
Ohkawa, H.; Ohishi N. and Yagi, K. (1979):
Assay for lipid peroxides in animal tissues by
thiobarbituric acid reaction, Analytical
Biochemistry, 95: 351– 358.
Oteiza, P.I.; Olin, K.L.; Fraga, C.G. and
Keen, C.L. (1995): Zinc deficiency causes
oxidative damage to proteins, lipids and DNA
in rat testes. J. Nutr., 125: 823 - 829.
Parthiban, P and Muniyan, M. (2011):
Effect of heavy metal nickel on the lipid
peroxidation and antioxidant parameters in the
liver tissue of Cirrhinus mrigala (HAM.).
International Journal of Development
Research, 1 (1), pp.001-004.
Prasad, L.; Khan, T.H.; Jahangir, T. and
Sultana, S.(2006): Acorus calamus extracts
and nickel chloride Prevention of oxidative
damage and hyperproliferation response in rat
kidney. Biological Trace Element
Res.,113(1): 77- 91.
Prasad, L.; Khan, T.H.; Jahangir, T. and
Sultana, S. (2007): Effect of Luteolin on
Nickel Chloride–Induced Renal
Hyperproliferation and Biotransformation
Parameters in Wistar Rats. Pharmaceutical
Biology, 45(2): 116-123.
El-Ballal et al. / Minufiya Vet. J. 2015, 9: 114-131
130
Rao, M.V.; Parekh, S.S. and Chawla, S.L.
(2006):Vitamin-E supplementation
ameliorates Chromium and/or Nickel induced
oxidative stressing in vivo.J. of health science,
52(2): 142 -147.
Rao, M.V.; Jhala, D.D.; Patel, A. and
Chettiar, S.S. (2008): Cytogenetic Alteration
Induced by Nickel and Chromium in Human
Blood Cultures and its Amelioration by
Curcumin. Int. J. Hum. Genet., 8(3): 301-305.
Reddy, A. and Lokesh, B. R. (1994): Studies
on anti-inflammatory activity of spice
principles and dietary n-3 polyunsaturated
fatty acids on carrageenan-induced
inflammation in rats. Ann. Nutr. Metab., 38:
349 –358.
Rukkumani, R.; Balasubashini, S. and
Menon, V.P. (2003): Protetive effects of
curcumin and photoirradiated curcumin on
circulatory lipids and lipid peroxidation
products in alcohol and polyunsaturated fatty
acid-induced toxic ity. Phytother Res., 17:
925–929.
Savolainen, H. (1996): Biochemical and
clinical aspects of nickel toxicity. Rev.
Environ. Health, 11(4): 167-73.
Sevcikova, M.; Modra, H.; Slaninova, A.
and Svobodova, Z. (2011): Metals as a cause
of oxidative stress in fish: a review.
Veterinarni Medicina, 56 (11): 537–546.
Sidhu, P.; Garg, M.L. and Dhawan,
D.K.(2004): Protective role of zinc in nickel
induced hepatotoxicity in rats. Chemico-
Biological Interactions, 150: 199 – 209.
Snedecor, G.W. and Cochran, W.G. (1987):
Statistical methods. 6th Ames: Iowa State
University, 1987. 593p.
Sreejayan, N. and Rao, M.N. (1994):
Curcuminoids as potent inhibitors of lipid
peroxidation. J. Pharm. Pharmacol., 46: 1013
– 1016.
Stix, G. (2007): Spice Healer. Scientific
American Magazine.
www.scientificamerican.com/article.cfm?...s
pice-healer.
Szuster-Ciesielska, A.; Plewka, K.;
Daniluk, J. and Kandefer-Szerszeń, M.
(2009): Zinc supplementation attenuates
ethanol- and acetaldehyde induced liver
stellate cell activation by inhibiting reactive
oxygen species (ROS) production and by
influencing intracellular signaling. Biochem.
Pharmacol., 78(3): 301- 314.
Tainer, J.A.; Getzoff, E.D.; Richardson,
J.S. and Richardson, D.C. (1983): Structure
and mechanism of Cu, Zn superoxide
dismutase. Nature, 306: 284– 287.
Traber, M.G. (2006): Vitamin E. In: Shils
ME, Shike M, Ross AC, Caballero B, Cousins
R, eds. Modern Nutrition in Health and
El-Ballal et al. / Minufiya Vet. J. 2015, 9: 114-131
131
Disease. 10th ed. Baltimore, MD: Lippincott
Williams & Wilkins, 2006; 396- 411.
Velma, V.; Vutukuru, S.S. and
Tchounwou, P.B. (2009): Ecotoxicology of
Hexavalent Chromium in Freshwater Fish: A
Critical Review. Rev Environ Health; 24(2):
129–145.
Wintergerst, E.S.; Maggini, S. and Hornig,
D.H. (2007): Contribution of selected
vitamins and trace elements to immune
function. Ann. Nutr. Metab., 51: 301-323.
Young, D.S. (2001): Effects of disease on
Clinical Lab. Tests, 4th ed Washington, DC:
AACC 2001.
Zheng, S.; Yumei, F. and Chen, A. (2007):
De novo synthesis of glutathione is a
prerequisite for curcumin to inhibit hepatic
stellate cell (HSC) activation. Free Radic.
Biol. Med., 43(3): 444 -.453.
132
Introduction
Feed is one of the most important factors
responsible for both profitability and
environmental sustainability of a farm.
Therefore, there is a growing interest in
developing selection programs aimed at
selecting individuals that are more feed
efficient, i.e. that need to consume less feed to
achieve the same growth rates as less efficient
individuals. As a consequence less feed is
necessary to produce a unit of output (Wall et
al., 2010) and less waste is discharged into the
environment (Nkrumah et al., 2006).
In aquaculture feeding rate is an important
factor affecting the growth of fish, and thus
determining the optimal feeding rate is
essential to the success of any aquaculture
operation. The quality of the diet and feeding
management adopted by producers can
Effects of feeding rates on behavior and growth performance of Nile Tilapia (Oreochromis niloticus)
Hamada D.H. Mahboub*, Sameh G.A. Ramadan, Mohamed A.Y. Helal, Walaa S.H. Ahmed
Department of Husbandry and Animal Wealth Development, Faculty of Veterinary Medicine, University of Sadat City, Egypt *Corresponding Author: [email protected] Accepted: 11/8/2015
Abstract: The present study was carried out to investigate the effect of different feeding rates on behavior and
growth performance of Nile tilapia. Fish were classified into three groups (n=10/group, 2 replicates). 1st,
2nd and 3rd groups received 3.4%, 3.6% and 3.8% feeding rates, respectively. Behavior of fish, body
weight, body dimensions and water quality were recorded. Weight gain, relative growth rate and feed
conversion ratio were calculated. The results revealed that feeding, foraging and resting behaviors were
significantly higher in fish fed 3.8% than in 3.4% and 3.6% groups. However, chasing and mouth pushing
activities decreased in 3.8% group in comparison with 3.4% and 3.6% groups. Body weight of fish fed
3.8% and 3.6% feeding rates were significantly higher than 3.4%. Weight gain and relative growth rate
were significantly increased by increasing feeding rates. It was concluded that feeding Tilapia on 3.8%
gave the highest growth performance and enhanced the fish behavior with no effects on water quality. Keywords: Nile Tilapia, Feeding rates, Behavior and Growth performance.
Minufiya Veterinary Journal ISSN: 1110-9750
Mahboub et al. / Minufiya Vet. J. 2015, 9: 132-142
133
significantly affect growth, survival and feed
conversion of culture Tilapia fish.
Determining the optimum pattern of feed
added to fish ponds is one of the most
important tasks in pond management.
Therefore, some concern should be paid to
reduce this expense by feeding the correct
amount at the right time to insure maximum
efficiency. Meanwhile, realization of the
optimum feeding regime for cultured fish
would help to reduce feed wastes, costs and
maximizing feed conversion efficiency
(Abdel Hakim et al., 2004).
Feeding rate is an important factor affecting
the growth of fish, and thus determining the
optimal feeding rate is imperative to the
success of any aquaculture operation.
Consequently, some farmers used mixed
feeding timetable of varying high and low
dietary protein levels in feed (De Silva, 1985;
Gabriel et al., 2000) and optimizing feeding
rate (Qin and Fast, 1996; Dong-Fang et al.,
2003) to improve production with low cost.
However, poor fish farmers find these
methods difficult to apply and expensive to
achieve.
On the other hand, inappropriate feeding
practices in aquaculture may lead to overfed
which results in feed wastes in pond water and
consequently contamination of aquatic
environment as well as high production costs
(Ali et al., 2010). On contrary, insufficient
feeding lead to poor growth and high fish
mortalities which make losses in the
aquaculture business (Eroldogan et al., 2006;
Gandra et al., 2007). Additionally, the
patterns of ingestive behavior are related to
nature of its characteristic food (Hafez, 1975).
In the same time, every fish species has its
particular food preferences and feeding
behaviors. In general, feed management or
feeding techniques have two main objectives:
i) to encourage rapid and positive
consumption and thus reducing leaching of
nutrients wastage; ii) to provide greater
potential for growth by minimizing the
metabolic costs.
Fish perform all their bodily functions in
water. Because fish are totally dependent upon
water to breathe, feed and grow, excrete
wastes, maintain a salt balance, and reproduce,
understanding the physical and chemical
qualities of water is critical to successful
aquaculture. To a great extent, water
determines the success or failure of an
aquaculture operation (Swann, 1990). In the
same time, some water quality factors are
more likely to be involved with fish losses
such as dissolved oxygen, temperature, and
ammonia. Others, such as pH, alkalinity and
hardness affect fish, but usually are not
directly toxic. Each water quality factor
Mahboub et al. / Minufiya Vet. J. 2015, 9: 132-142
134
interacts with and influences other parameters,
sometimes in complex ways (Buttner et al.,
1993). The aim of this study was to investigate
the effect of different feeding rates on
behavior and growth performance of Nile
tilapia (Oreochromis niloticus) in relation to
water quality.
Materials and Methods
Sixty fish were randomly sampled and divided
into three groups [10 fish per aquarium (100
cm length x 30 cm width x 40cm height)] with
two replicates per treatment. Fish were fed
three different rates 3.4%, 3.6% and 3.8% of
fish body weight. The experiment lasted for 10
weeks to study the effect of these feeding rates
on Nile Tilapia behavior and their growth
performance. All groups were fed on
commercial diet. The amount of food given
was adjusted every two weeks after
determination of new fish weights in each
group.
Data recording: Behavioral observations
were recorded by using video camera (Sony,
Japan) for 10 minutes for each aquarium two
times per day at morning (9:00-11:30 am) and
at afternoon (2:00-4:30 pm); the recording
was twice per week. Sampled behavioral
categories for all fish were scanned by one
observer. The behavior of the fish in each
aquarium was recorded using instantaneous
sampling method. Each behavior was
observed at 60 second intervals.
Fish were taken from each aquarium for
individual weight every two weeks. Body
weights were taken at 0, 2, 4, 6, 8 and 10
weeks of experiment. Fish were handled by
using wetted towel to avoid stress then putted
in plastic container with wetted sponge on
electronic weighing balance (ACCULAB,
Sartorious group, Germany). According to
(Lee et al., 2000) the following items were
calculated: weight gain= Wf - Wi ; relative
growth rate= (Wf - Wi)/ 1/2 (Wf + Wi) X 100
and feed conversion ratio (FCR) = [dry feed
fed (g)/ weight gain (g)] where Wf= final
weight; Wi= initial weight.
Body dimensions of fish were measured at the
end of study. Fish were put in 20L worm water
(25°C) with Tricaine Methanoesulfonate
(0.5g/10 L, Finquel, USA) for anesthesia. Fish
left for about 5-10 minutes then taken to
measure body dimensions by using ruler and
electronic digital caliper (GENERAL,
Switzerland). According to (Ricker, 1979) the
body dimensions were described as the
followings: Total length: The length from the
tip of fish mouth till the end of the tail, with
mouth closed and the tail lobes pressed
together. Standard length: The length from
the tip of fish mouth with mouth closed till
caudal peduncle of tail. Length of jaw: The
Mahboub et al. / Minufiya Vet. J. 2015, 9: 132-142
135
length from the tip of fish mouth with mouth
closed till angle of mouth. Head length: The
length from the tip of fish mouth with mouth
closed till the operculum (gill cover) border.
Water quality parameters were measured daily
for each aquarium. PH was measured by
Water Proof PH-Temperature Pocket tester
with replaceable probe (AD12, Romania).
Dissolved oxygen (D.O) was measured by
Professional Portable Dissolved Oxygen
Meter (HD3030, Trans-instruments
Company, Singapore). Nitrite (NO2) and
Nitrate (NO3) concentrations were assayed
according to instruction of manufacture
(Hersteller, sera GmbhH D 52518 Heinsberg,
Germany).
Statistical analyses: Data were analyzed by
using SAS system (2001). The proportion of
fish that performed a behavioral pattern
(feeding, foraging, elimination, resting,
chafing, schooling, surfacing, chasing, mouth
pushing or fin tugging) per minute was
calculated. All data (behavioral patterns,
growth performance and water quality
parameters) were analyzed with ANOVA
using a generalized linear model (GLM-
procedure). Results were considered
statistically significant when p-values were
below 0.05.
Results
Results from Table (1) indicated that different
feeding rates had significant effect on fish
behavior. Feeding and foraging behaviors
were higher in fish fed 3.8% than fish fed
3.4% and 3.6% (P=0.001, P=0.02,
respectively). On the other hand, elimination
was significantly more in 3.6% than 3.4%
(8.92±0.87, 6.50±0.87%, respectively,
P=0.05). Comfort behavior generally was not
affected by different feeding rates except
resting (Table 1). Resting behavior was
significantly higher in 3.8% than 3.4%
(25.79±1.34, 20.67±1.34%, respectively,
P=0.007). However, surfacing, schooling and
chafing were not significant affected by
feeding rates (P>0.05). Feeding rates had
significant effects on aggressive behavior as
shown in Table (1). Chasing behavior was
more in 3.4% feeding rate than 3.8%
(34.47±2.05, 28.22±2.05%, respectively,
P=0.03). Additionally, proportion of mouth
pushing in 3.6% groups was high in compared
with 3.8% groups (13.52±1.46, 7.29±1.46%,
respectively, P=0.003). Conversely, fin
tugging (biting) was not affected by different
feeding rates.
Results from Table (2) showed that different
feeding rates had significant effects on Tilapia
body weight. At second and fourth weeks, fish
fed 3.8% feeding rate were heavier than fish
fed 3.6% feeding rate (P=0.05). On the other
Mahboub et al. / Minufiya Vet. J. 2015, 9: 132-142
136
hand, 3.8% and 3.6% feeding rates increased
fish body weight in comparison with 3.4%
feeding rate at 8th and 10th weeks (P=0.006
and P=0.04, respectively).
Feeding rates had significant effect on weight
gain and relative growth rate although, it had
no significant effect on feed conversion ratio
(P>0.05). The weight gain was more in
feeding rate 3.8% than 3.6% and 3.4%
(55.84±2.52, 48.48±2.39 and 41.29±2.39g,
respectively, P=0.038). Fish fed 3.8% had
higher relative growth rate than 3.6% and
3.4% (125.48±1.81, 120.02±1.72 and
112.48±1.72% respectively, P=0.033) (Table
3). In the same time, feeding rate 3.6%
improved weight gain and relative growth rate
in compared with feeding rate 3.4%.
Results summarized in Table (4) indicated that
different feeding rates had a significant effect
on fish body dimensions. Fish in 3.8% and
3.6% groups were longer than fish in 3.4%
group (15.71±0.25, 15.63±0.23 and
14.93±0.23cm, respectively, P=0.03). Also,
the standard length was more in 3.8% and
3.6% feeding rates than 3.4% feeding rate
(12.91±0.18, 12.73±0.17 and 12.23±0.17cm,
respectively, P=0.028). Conversely, head and
jaw lengths were not affected by different
feeding rates (Table 4).
Data presented in Table (5) revealed that water
quality parameters were not significantly
affected by feeding fish on different feeding
rates (P>0.05).
Discussion
The difference between feeding rates in this
study was very little (0.2%) however, a clear
effect on Tilapia behavior and performance
were recorded. Generally, feeding and
foraging behavioral activities were improved
by increasing feeding rates. These results
reflected on fish performance where body
weight, weight gain and relative growth rate
were enhanced. These findings were agreed
with Marimuthu et al., (2011) and Andem et
al., (2013) who reported that feeding rate
presented a significant effect on the growth
performance parameters. In group 3.8%,
aggressive behaviors including chasing and
mouth pushing were reduced. However, first
stage of aggressive behavior (chasing) in this
study was observed markedly in fish fed 3.4%
compared to fish fed 3.8% and 3.6%. These
results may be attributed to long stay of food
in front of fish that motivate the fish to spend
more time in feeding and foraging activities
than showing aggression. Similarly, Fanta
(1997) who reported that as soon as feeding
ends, B. soporator fish keep in repose and
aggressiveness becomes almost non-existent.
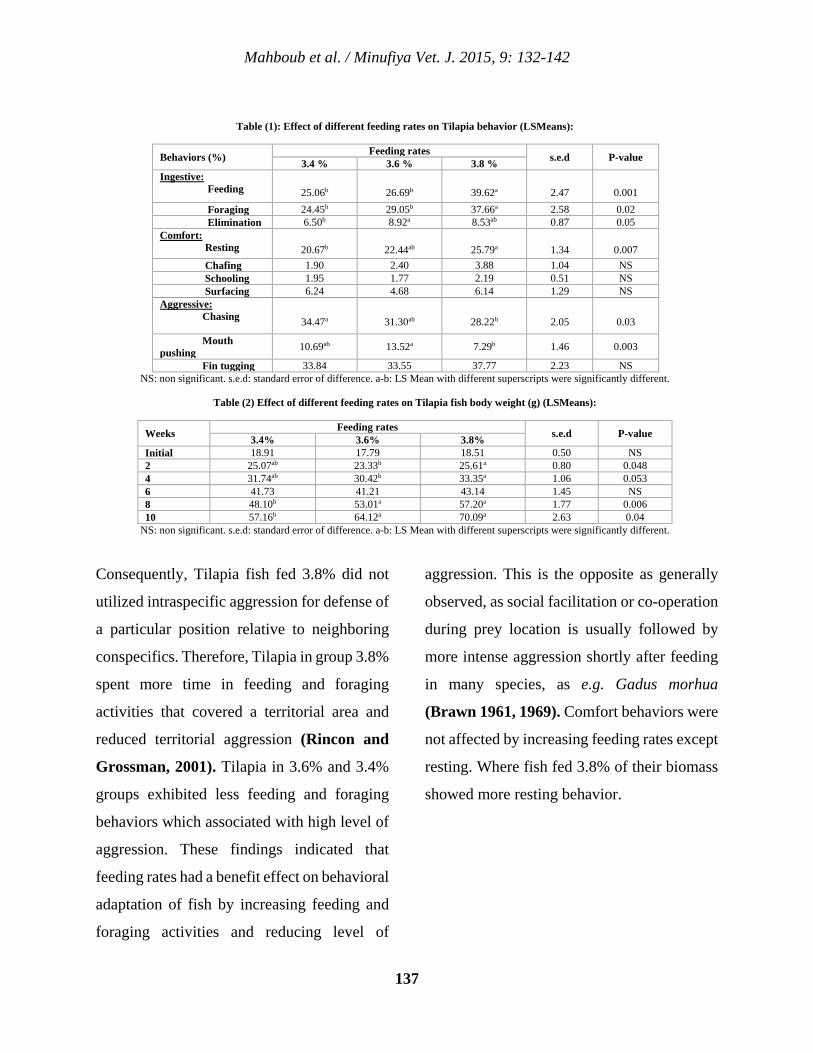
Mahboub et al. / Minufiya Vet. J. 2015, 9: 132-142
137
Consequently, Tilapia fish fed 3.8% did not
utilized intraspecific aggression for defense of
a particular position relative to neighboring
conspecifics. Therefore, Tilapia in group 3.8%
spent more time in feeding and foraging
activities that covered a territorial area and
reduced territorial aggression (Rincon and
Grossman, 2001). Tilapia in 3.6% and 3.4%
groups exhibited less feeding and foraging
behaviors which associated with high level of
aggression. These findings indicated that
feeding rates had a benefit effect on behavioral
adaptation of fish by increasing feeding and
foraging activities and reducing level of
aggression. This is the opposite as generally
observed, as social facilitation or co-operation
during prey location is usually followed by
more intense aggression shortly after feeding
in many species, as e.g. Gadus morhua
(Brawn 1961, 1969). Comfort behaviors were
not affected by increasing feeding rates except
resting. Where fish fed 3.8% of their biomass
showed more resting behavior.
Table (1): Effect of different feeding rates on Tilapia behavior (LSMeans):
Behaviors (%) Feeding rates s.e.d P-value 3.4 % 3.6 % 3.8 % Ingestive: Feeding
25.06b
26.69b
39.62a
2.47
0.001
Foraging 24.45b 29.05b 37.66a 2.58 0.02 Elimination 6.50b 8.92a 8.53ab 0.87 0.05 Comfort: Resting
20.67b
22.44ab
25.79a
1.34
0.007
Chafing 1.90 2.40 3.88 1.04 NS Schooling 1.95 1.77 2.19 0.51 NS Surfacing 6.24 4.68 6.14 1.29 NS Aggressive: Chasing
34.47a
31.30ab
28.22b
2.05
0.03
Mouth pushing 10.69ab 13.52a 7.29b 1.46 0.003
Fin tugging 33.84 33.55 37.77 2.23 NS NS: non significant. s.e.d: standard error of difference. a-b: LS Mean with different superscripts were significantly different.
Table (2) Effect of different feeding rates on Tilapia fish body weight (g) (LSMeans):
Weeks Feeding rates s.e.d P-value 3.4% 3.6% 3.8% Initial 18.91 17.79 18.51 0.50 NS 2 25.07ab 23.33b 25.61a 0.80 0.048 4 31.74ab 30.42b 33.35a 1.06 0.053 6 41.73 41.21 43.14 1.45 NS 8 48.10b 53.01a 57.20a 1.77 0.006 10 57.16b 64.12a 70.09a 2.63 0.04
NS: non significant. s.e.d: standard error of difference. a-b: LS Mean with different superscripts were significantly different.
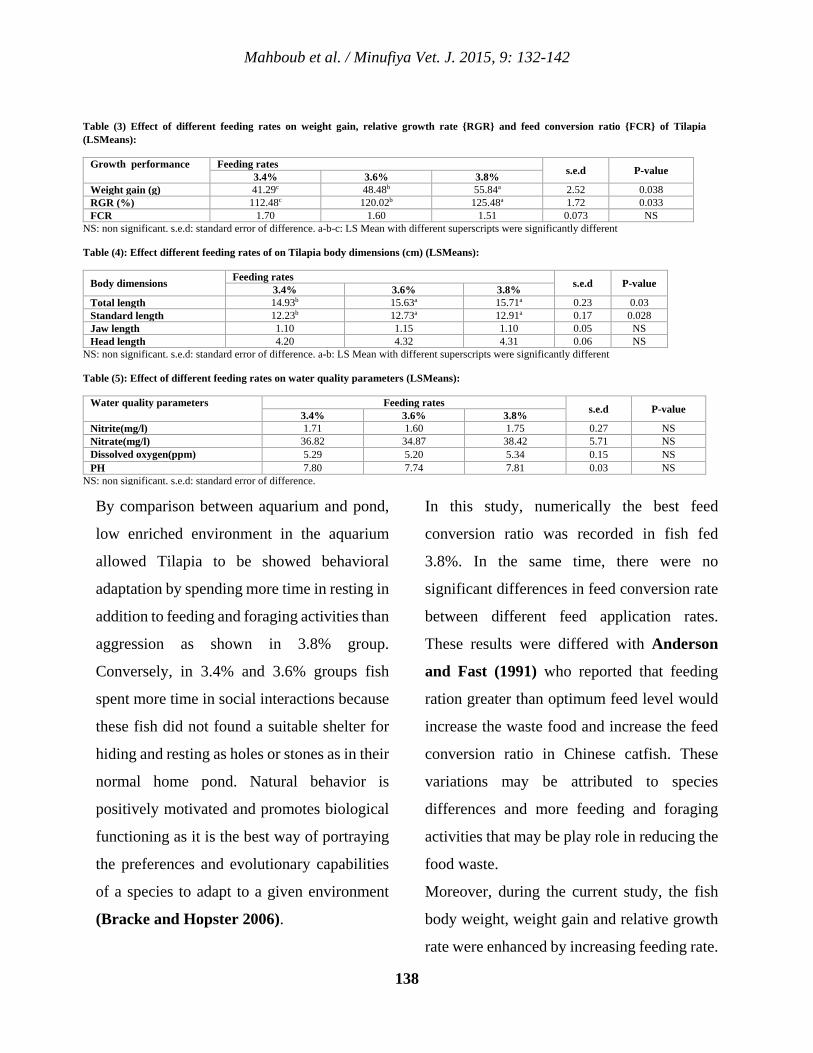
Mahboub et al. / Minufiya Vet. J. 2015, 9: 132-142
138
By comparison between aquarium and pond,
low enriched environment in the aquarium
allowed Tilapia to be showed behavioral
adaptation by spending more time in resting in
addition to feeding and foraging activities than
aggression as shown in 3.8% group.
Conversely, in 3.4% and 3.6% groups fish
spent more time in social interactions because
these fish did not found a suitable shelter for
hiding and resting as holes or stones as in their
normal home pond. Natural behavior is
positively motivated and promotes biological
functioning as it is the best way of portraying
the preferences and evolutionary capabilities
of a species to adapt to a given environment
(Bracke and Hopster 2006).
In this study, numerically the best feed
conversion ratio was recorded in fish fed
3.8%. In the same time, there were no
significant differences in feed conversion rate
between different feed application rates.
These results were differed with Anderson
and Fast (1991) who reported that feeding
ration greater than optimum feed level would
increase the waste food and increase the feed
conversion ratio in Chinese catfish. These
variations may be attributed to species
differences and more feeding and foraging
activities that may be play role in reducing the
food waste.
Moreover, during the current study, the fish
body weight, weight gain and relative growth
rate were enhanced by increasing feeding rate.
Table (3) Effect of different feeding rates on weight gain, relative growth rate {RGR} and feed conversion ratio {FCR} of Tilapia (LSMeans):
Growth performance Feeding rates s.e.d P-value 3.4% 3.6% 3.8% Weight gain (g) 41.29c 48.48b 55.84a 2.52 0.038 RGR (%) 112.48c 120.02b 125.48a 1.72 0.033 FCR 1.70 1.60 1.51 0.073 NS
NS: non significant. s.e.d: standard error of difference. a-b-c: LS Mean with different superscripts were significantly different
Table (4): Effect different feeding rates of on Tilapia body dimensions (cm) (LSMeans):
Body dimensions Feeding rates s.e.d P-value 3.4% 3.6% 3.8% Total length 14.93b 15.63a 15.71a 0.23 0.03 Standard length 12.23b 12.73a 12.91a 0.17 0.028 Jaw length 1.10 1.15 1.10 0.05 NS Head length 4.20 4.32 4.31 0.06 NS
NS: non significant. s.e.d: standard error of difference. a-b: LS Mean with different superscripts were significantly different
Table (5): Effect of different feeding rates on water quality parameters (LSMeans):
Water quality parameters Feeding rates s.e.d P-value 3.4% 3.6% 3.8% Nitrite(mg/l) 1.71 1.60 1.75 0.27 NS Nitrate(mg/l) 36.82 34.87 38.42 5.71 NS Dissolved oxygen(ppm) 5.29 5.20 5.34 0.15 NS PH 7.80 7.74 7.81 0.03 NS
NS: non significant. s.e.d: standard error of difference.
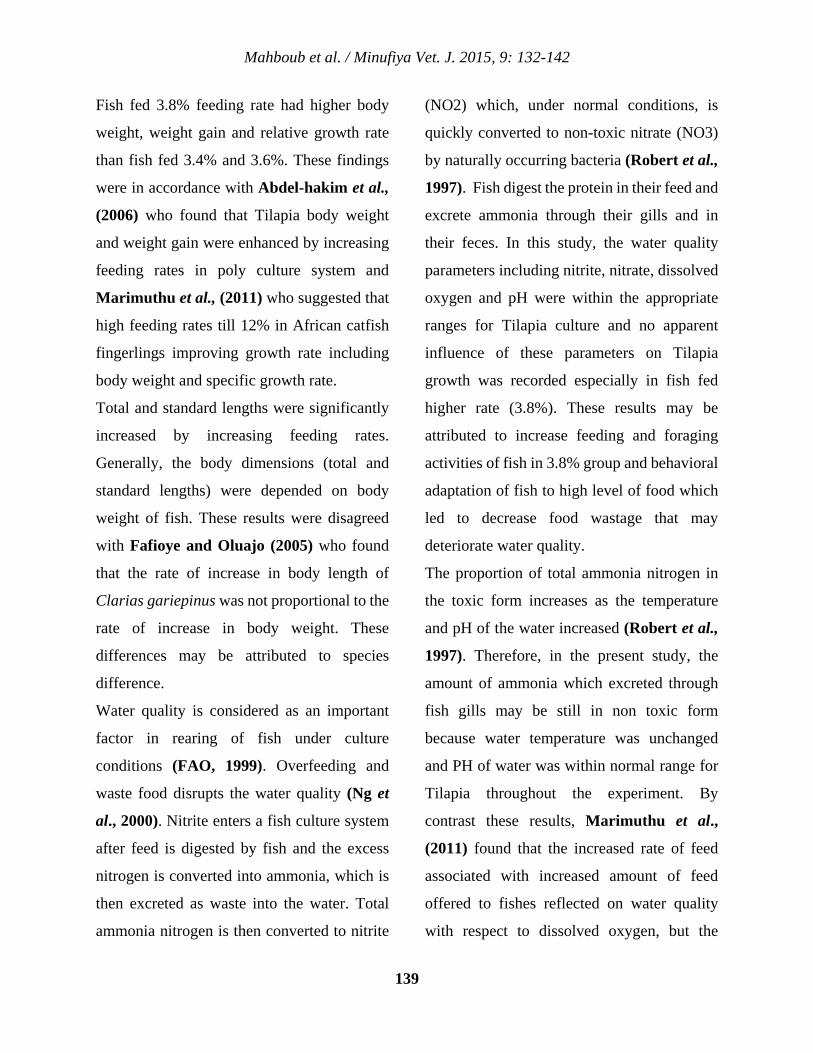
Mahboub et al. / Minufiya Vet. J. 2015, 9: 132-142
139
Fish fed 3.8% feeding rate had higher body
weight, weight gain and relative growth rate
than fish fed 3.4% and 3.6%. These findings
were in accordance with Abdel-hakim et al.,
(2006) who found that Tilapia body weight
and weight gain were enhanced by increasing
feeding rates in poly culture system and
Marimuthu et al., (2011) who suggested that
high feeding rates till 12% in African catfish
fingerlings improving growth rate including
body weight and specific growth rate.
Total and standard lengths were significantly
increased by increasing feeding rates.
Generally, the body dimensions (total and
standard lengths) were depended on body
weight of fish. These results were disagreed
with Fafioye and Oluajo (2005) who found
that the rate of increase in body length of
Clarias gariepinus was not proportional to the
rate of increase in body weight. These
differences may be attributed to species
difference.
Water quality is considered as an important
factor in rearing of fish under culture
conditions (FAO, 1999). Overfeeding and
waste food disrupts the water quality (Ng et
al., 2000). Nitrite enters a fish culture system
after feed is digested by fish and the excess
nitrogen is converted into ammonia, which is
then excreted as waste into the water. Total
ammonia nitrogen is then converted to nitrite
(NO2) which, under normal conditions, is
quickly converted to non-toxic nitrate (NO3)
by naturally occurring bacteria (Robert et al.,
1997). Fish digest the protein in their feed and
excrete ammonia through their gills and in
their feces. In this study, the water quality
parameters including nitrite, nitrate, dissolved
oxygen and pH were within the appropriate
ranges for Tilapia culture and no apparent
influence of these parameters on Tilapia
growth was recorded especially in fish fed
higher rate (3.8%). These results may be
attributed to increase feeding and foraging
activities of fish in 3.8% group and behavioral
adaptation of fish to high level of food which
led to decrease food wastage that may
deteriorate water quality.
The proportion of total ammonia nitrogen in
the toxic form increases as the temperature
and pH of the water increased (Robert et al.,
1997). Therefore, in the present study, the
amount of ammonia which excreted through
fish gills may be still in non toxic form
because water temperature was unchanged
and PH of water was within normal range for
Tilapia throughout the experiment. By
contrast these results, Marimuthu et al.,
(2011) found that the increased rate of feed
associated with increased amount of feed
offered to fishes reflected on water quality
with respect to dissolved oxygen, but the
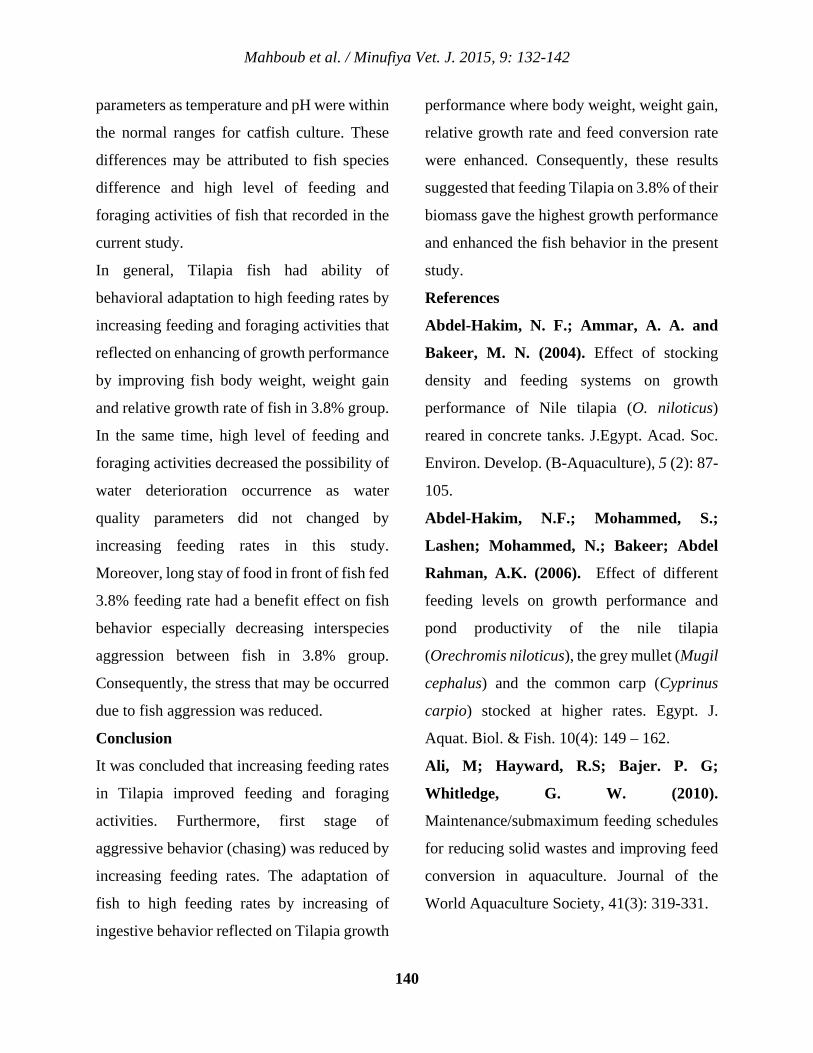
Mahboub et al. / Minufiya Vet. J. 2015, 9: 132-142
140
parameters as temperature and pH were within
the normal ranges for catfish culture. These
differences may be attributed to fish species
difference and high level of feeding and
foraging activities of fish that recorded in the
current study.
In general, Tilapia fish had ability of
behavioral adaptation to high feeding rates by
increasing feeding and foraging activities that
reflected on enhancing of growth performance
by improving fish body weight, weight gain
and relative growth rate of fish in 3.8% group.
In the same time, high level of feeding and
foraging activities decreased the possibility of
water deterioration occurrence as water
quality parameters did not changed by
increasing feeding rates in this study.
Moreover, long stay of food in front of fish fed
3.8% feeding rate had a benefit effect on fish
behavior especially decreasing interspecies
aggression between fish in 3.8% group.
Consequently, the stress that may be occurred
due to fish aggression was reduced.
Conclusion
It was concluded that increasing feeding rates
in Tilapia improved feeding and foraging
activities. Furthermore, first stage of
aggressive behavior (chasing) was reduced by
increasing feeding rates. The adaptation of
fish to high feeding rates by increasing of
ingestive behavior reflected on Tilapia growth
performance where body weight, weight gain,
relative growth rate and feed conversion rate
were enhanced. Consequently, these results
suggested that feeding Tilapia on 3.8% of their
biomass gave the highest growth performance
and enhanced the fish behavior in the present
study.
References
Abdel-Hakim, N. F.; Ammar, A. A. and
Bakeer, M. N. (2004). Effect of stocking
density and feeding systems on growth
performance of Nile tilapia (O. niloticus)
reared in concrete tanks. J.Egypt. Acad. Soc.
Environ. Develop. (B-Aquaculture), 5 (2): 87-
105.
Abdel-Hakim, N.F.; Mohammed, S.;
Lashen; Mohammed, N.; Bakeer; Abdel
Rahman, A.K. (2006). Effect of different
feeding levels on growth performance and
pond productivity of the nile tilapia
(Orechromis niloticus), the grey mullet (Mugil
cephalus) and the common carp (Cyprinus
carpio) stocked at higher rates. Egypt. J.
Aquat. Biol. & Fish. 10(4): 149 – 162.
Ali, M; Hayward, R.S; Bajer. P. G;
Whitledge, G. W. (2010).
Maintenance/submaximum feeding schedules
for reducing solid wastes and improving feed
conversion in aquaculture. Journal of the
World Aquaculture Society, 41(3): 319-331.
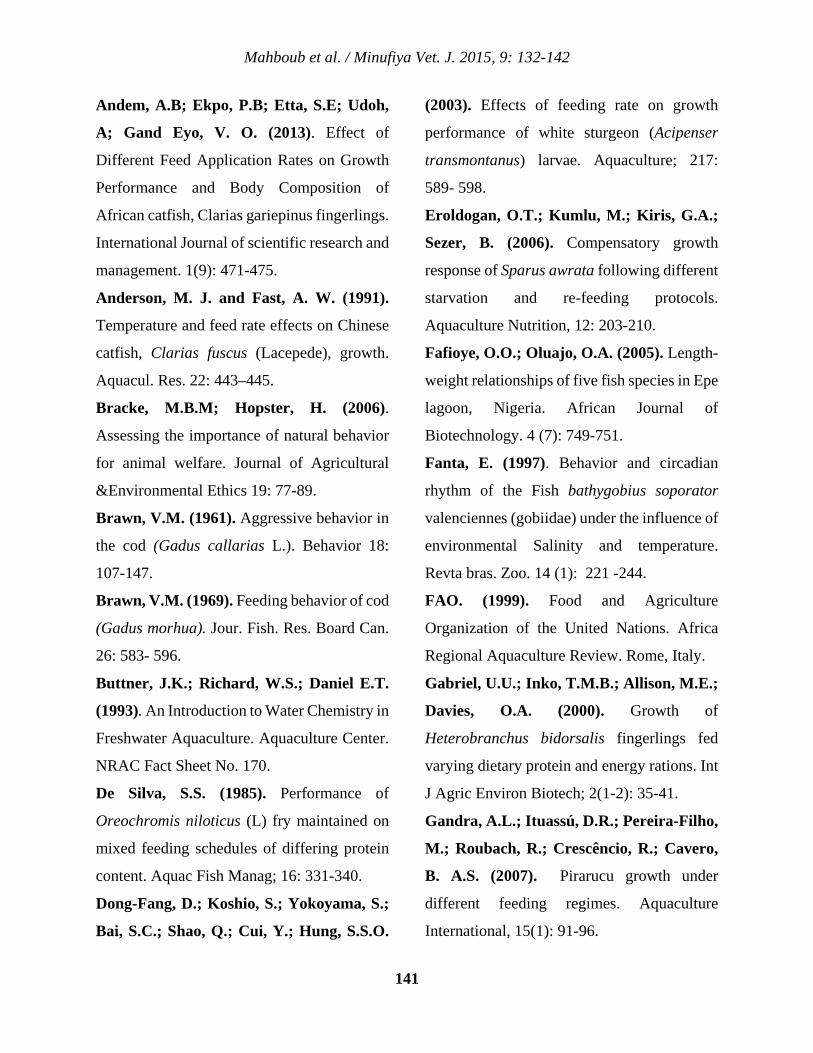
Mahboub et al. / Minufiya Vet. J. 2015, 9: 132-142
141
Andem, A.B; Ekpo, P.B; Etta, S.E; Udoh,
A; Gand Eyo, V. O. (2013). Effect of
Different Feed Application Rates on Growth
Performance and Body Composition of
African catfish, Clarias gariepinus fingerlings.
International Journal of scientific research and
management. 1(9): 471-475.
Anderson, M. J. and Fast, A. W. (1991).
Temperature and feed rate effects on Chinese
catfish, Clarias fuscus (Lacepede), growth.
Aquacul. Res. 22: 443–445.
Bracke, M.B.M; Hopster, H. (2006).
Assessing the importance of natural behavior
for animal welfare. Journal of Agricultural
&Environmental Ethics 19: 77-89.
Brawn, V.M. (1961). Aggressive behavior in
the cod (Gadus callarias L.). Behavior 18:
107-147.
Brawn, V.M. (1969). Feeding behavior of cod
(Gadus morhua). Jour. Fish. Res. Board Can.
26: 583- 596.
Buttner, J.K.; Richard, W.S.; Daniel E.T.
(1993). An Introduction to Water Chemistry in
Freshwater Aquaculture. Aquaculture Center.
NRAC Fact Sheet No. 170.
De Silva, S.S. (1985). Performance of
Oreochromis niloticus (L) fry maintained on
mixed feeding schedules of differing protein
content. Aquac Fish Manag; 16: 331-340.
Dong-Fang, D.; Koshio, S.; Yokoyama, S.;
Bai, S.C.; Shao, Q.; Cui, Y.; Hung, S.S.O.
(2003). Effects of feeding rate on growth
performance of white sturgeon (Acipenser
transmontanus) larvae. Aquaculture; 217:
589- 598.
Eroldogan, O.T.; Kumlu, M.; Kiris, G.A.;
Sezer, B. (2006). Compensatory growth
response of Sparus awrata following different
starvation and re-feeding protocols.
Aquaculture Nutrition, 12: 203-210.
Fafioye, O.O.; Oluajo, O.A. (2005). Length-
weight relationships of five fish species in Epe
lagoon, Nigeria. African Journal of
Biotechnology. 4 (7): 749-751.
Fanta, E. (1997). Behavior and circadian
rhythm of the Fish bathygobius soporator
valenciennes (gobiidae) under the influence of
environmental Salinity and temperature.
Revta bras. Zoo. 14 (1): 221 -244.
FAO. (1999). Food and Agriculture
Organization of the United Nations. Africa
Regional Aquaculture Review. Rome, Italy.
Gabriel, U.U.; Inko, T.M.B.; Allison, M.E.;
Davies, O.A. (2000). Growth of
Heterobranchus bidorsalis fingerlings fed
varying dietary protein and energy rations. Int
J Agric Environ Biotech; 2(1-2): 35-41.
Gandra, A.L.; Ituassú, D.R.; Pereira-Filho,
M.; Roubach, R.; Crescêncio, R.; Cavero,
B. A.S. (2007). Pirarucu growth under
different feeding regimes. Aquaculture
International, 15(1): 91-96.
Mahboub et al. / Minufiya Vet. J. 2015, 9: 132-142
142
Hafez, E.S.E. (1975). Behavior of Domestic
Animals. Third edition. Williams and Wilkins,
Baltimore.
Lee, S.M.; Hwang, U.G.; Cho, S.H. (2000).
Effects of feeding frequency and dietary
moisture content on growth, body
composition and gastric evacuation of
juvenile Korean rockfish (Sebastes schlegeli).
Aquacult. 187: 399–409.
Marimuthu, K.; Umah, R.;
Muralikrishnan, S.; Xavier, R.;
Kathiresan, S. (2011). Effect of different feed
application rate on growth, survival and
cannibalism of African catfish, Clarias
gariepinus fingerlings. 23 (4): 330-337.
Ng, W.K.; Lu, K.S.; Hashim, R.; Ali, A.
(2000). Effects of feeding rate on growth, feed
utilization and body composition of tropical
bagrid catfish. Aquacult. Internat. 8: 19–29.
Nkrumah, J.D.; Okine, E.K.; Mathison,
G.W.; Schmid, K.; Li, C.; Basarab, J.A.;
Price, M.A.; Wang, Z.; Moore, S.S. (2006).
Relationships of feedlot feed efficiency,
performance, and feeding behavior with
metabolic rate, methane production, and
energy partitioning in beef cattle. J. Anim. Sci.
84: 145–153.
Qin, J.; Fast, A.W. (1996). Effects of feed
application rates on growth, survival and feed
conversion of juvenile snakehead (Channa
striatus). J World Aquacult Soc; 27: 52-56.
Ricker, W.E. (1979). Growth rates and
models from Fish Physiology. (8): 766- 743.
Rincon, P.A.; Grossman, G.D. (2001).
Intraspecific aggression in rosyside dace, a
drift-feeding stream cyprinid. Journal of Fish
Biology (59): 968-986.
Robert, M.; Durborow; David, M.; Crosby;
Martin, W.; Brunson. (1997). Nitrite in Fish
Ponds. SRAC Publication No. 462. The work
reported in this publication was supported in
part by the Southern Regional Aquaculture
Center through Grant No. 94-38500-0045
from the United States Department of
Agriculture, Cooperative States Research,
Education and Extension Service.
SAS. (2001). Institute Inc. Cary, Nc, USA.
Swann, L. (1990). A Basic Overview of
Aquaculutre: History, Water Quality, Types
of Aquaculutee, and Production Methods.
Illinois-Indiana Sea Grant Program Extension
Bulletin AS-457 and IL-IN-SG-E-90-2.
Purdue University. West Lafayette, Indiana.
pp: 10.
Wall, E.; Simm, G.; Moran, D. (2010).
Developing breeding schemes to assist
mitigation of greenhouse gas emissions.
Animal 4: 366–376.