Embed Size (px)
Citation preview

SurinAlge
STAT
name in Cijemeen Bure
STAT
TISTIS
jfers no 337eau voor d
TISTIC
SCH JASUR
7-2018/02 de Statisitek
CAL YESUR
AARBORINAME
k
EARBORINAME
OEK 20E
Prijs pe
OOK 20E
016/201
Maarer exemplaa
016/201
17
rt 2018 ar SRD 70
17

H
AlgemeeAfdeling
STAT
STAT
©Het overnem
Data ma
en Bureau vo Sociaal-Cul
TISTISC
ISTICA
© Algemeenen van gege
© Generay be reprod
oor de Statistlturele Statis
CH JASURI
AL YESURI
n Bureau voevens, met d
ral Bureau duced with d
tiek stieken
AARBOINAME
EARBOINAME
oor de Statisduidelijke b
of Statisticsduly acknow
S
OEK 20E
OOK 2E
stiek – Surinronvermeld
s – Surinamwledgement
Suriname in
016/201
016/20
name ding, is toeg
me t from sourc
Cijfers no. 3Maart
17
17
estaan
ce
337-2018/02t 2018
2

iii
Inhoudsopgave Contents PaginaPage
Voorwoord Preface iv Statistische en onderzoeksafdelingen van het Algemeen Bureau voor de Statistiek
Statistical and Research Sections of the General Bureau of Statistics
v
Publicaties in de reeks “Suriname in cijfers” (2015 – 2017)
Publications in the series “Suriname in cijfers” (2015 – 2017)
vi
Symbolen Symbols viii Afkortingen Abbreviations viii Lijst van tabellen List of Tables ix Lijst van grafieken List of Graphs xxi 1.Algemeen 1.General 1 2.Oppervlakte, Klimaat & Milieu 2.Area, Climate & Environment 5 3.Bevolking 3.Population 19 4.Transport en Verkeer 4.Transport and Traffic 39 5.Economie 5.Economy 47 6.Landbouw en Veeteelt 6.Agriculture and Animal Husbandry 63 7.Prijzen en Lonen 7.Prices and Wages 71 8.Werkgelegenheid en Aanverwante Statistieken
8.Employment and Related Statistics 81
9.Onderwijs 9.Education 101 10.Sociale Voorzieningen 10.Social Benefits 171 11.Volksgezondheid 11.Public Health 179 12.Overheidsfinanciën 12.Government Finance 193 13.Criminaliteit 13.Crime 199


v

vi
STATISTISCHE EN ONDERZOEKS- AFDELINGEN VAN HET ALGEMEEN BUREAU VOOR DE STATISTIEK
STATISTICAL AND RESEARCH SECTIONS OF THE GENERAL BUREAU OF STATISTICS
Afdelingen voor Sociale Statistieken Social Statistics Sections - Bevolkingsstatistieken - Population Statistics - Huishoudonderzoeken - Household Surveys - Sociaal-Culturele Statistieken - Social and Cultural Statistics - Verkeers- en Vervoersstatistieken - Traffic and Transport Statistics Afdelingen voor Economische Statistieken Economics Statistics Sections - Bedrijvenstatistieken - Enterprises Statistics - Handelsstatistieken - Trade Statistics - Nationale Rekeningen - National Accounts Statistics - Prijsindexcijfer van de Gezinsconsumptie - Consumer Price Index Overige Remaining Wetenschappelijk Onderzoek en Planning Scientific Research and Planning Censuskantoor Census Office

vii
Publikaties in de reeks "Suriname in Cijfers" (2015 - 2017)
Publications in the Series "Suriname in Cijfers" (2015 - 2017)
Titel
Title Nr. Jaar/Year
Statistical Paper 14: De huisvestingssituatie van female headed households (FHH) in Paramaribo
The Housing situation of Female headed households (FHH) in Paramaribo 311-2015/01 2015
Lonen en Prijzen in de Bouwnijverheid 2010-2014
Wages and Prices in the Construction Industry 2010-2014 312-2015/02 2015
Suriname Basis Indicatoren 2015-1 Suriname Basis Indicators 2015-1 313-2015/03 2015 Huishoudens in Suriname: Paramaribo en Wanica 2009-2014
Households in Suriname: Paramaribo and Wanica 2009-2014 314-2015/04 2015
Handelsstatistieken 2012-1e Kwartaal 2015
Trade Statistics 2012 – 1st Quarter 2015 315- 2015/05 2015
Demografische data 2009-2014 Demographic Data 2009 - 2014 316-2015/06 2015 Verkeers- en Vervoersstatistieken 2010 – 2014
Traffic and Transport Statistics 2010 - 2014 317-2015/07 2015
Geselecteerde Gendersstatistieken 2015
Selected Gender Statistics 2015
318-2015/08
2015
Huishoudbudgetonderzoek 2013/2014 Volume 1
Household Budget Survey 2013/2014 Volume 1
319-2015/09
2015
Huishoudbudgetonderzoek 2013/2014 Volume 2
Household Budget Survey 2013/2014 Volume 2
320-2016/01
2016
Statistisch Jaarboek 2014 Suriname Statistical Yearbook 2014 Suriname 321-2016/02 2016 Statistical Papers #15: Een statistisch onderzoek vanuit gender perspectief over de Surinaamse vrouwen en mannen
Statistical Papers #15: A Statistical analysis from a gender perspective on the Surinamese women and men
322-2016/03
2016
Bedrijventelling 2016 Voorlopige resultaten Paramaribo en Wanica
Establishments Census 2016 Preli-minary results Paramaribo and Wanica
323/2016-04
2016
Bedrijventelling 2016 Voorlopige resultaten Nickerie, Coronie, Saramacca, Commewijne, Marowijne, Para,, Brokopondo en Sipaliwini
Establishments Census 2016 Preli-minary results Nickerie, Coronie, Saramacca, Commewijne, Marowijne, Para, Brokopondo and Sipaliwini
324/2016-05
2016
Bedrijventelling 2016 Definitieve resultaten Geheel Suriname en per district
Establishments Census 2016 Final results Suriname and per district 325/2016-06 2016

viii
Publikaties in de reeks "Suriname in Cijfers" (2015 - 2017) Publications in the Series "Suriname in Cijfers" (2015 - 2017)
Titel
Title Nr. Jaar/Year
Milieustatistieken 2016 Environment Statistics 2016 326/2016-07 2016
Statistisch Jaarboek 2015/2016 Statistical Yearbook 2015/2016 327/2017-01 2017
Basis Indicatoren 2017-1 Basis Indicators 2017-1 328/2017-02 2017
Visitor Exit Survey 2016/2017 (VES) Visitor Exit Survey 2016/2017 (VES) 329/2017-03 2017
Handelsstatistieken 2014 – 1ste kwartaal 2017
Trade Statistics 2014 – 1st Quarter 2017 330/2017-04 2017
Demografische Data 2013 - 2016 Demographic Data 2013 - 2016 331/2017-05 2017
Huishoudens in Suriname 2014 - 2016 Households in Suriname 2014 -2016 332/2017-06 2017
Geselecteerde statistieken over vrouwen en mannen in Suriname 2017
Selected Statistics of women and men in Suriname 2017 333/2017-07 2017
ix
Symbolen Symbols . = gegevens ontbreken . = data not available - = nul - = nil * = voorlopige cijfers * = provisional figures 2000 - 2005 = 2000 tot en met 2005 2000 - 2005 = 2000 up to 2005 2000/2001
= schooljaar beginnend in 2000 en eindigend in 2001
2000/2001
= school year starting in 2000 and closing in 2001
# = gereviseerde cijfers # = revised figures Afkortingen Abbrevations ABS
= Algemeen Bureau voor de Statistiek
GBS
= General Bureau of Statistics
n.e.g. = niet elders genoemd n.e.c. = not elsewhere classified M = Man M = Male V = Vrouw F = Female

x
Lijst van tabellen List of Tables Pagina Page 1 Algemeen General
1 Kerncijfers van Suriname Key Figures of Suriname 2
2 Oppervlakte, Klimaat & Milieu
Area, Climate & Environment
2.1a Oppervlakte per district Area per District 8
2.1b Oppervlakte (km2) per ressort Area (km2) per Ressort 9
2.2 Meteorologische waarnemingen te M.H.F. en J.A.P. luchthaven, 2011 - 2016
Meteorological Observations at M.H.F. Airstrip and J.A.P. Airport, 2011 - 2016
11
2.3a Waterconsumptie in alle verzorgingsgebieden via SWM (in 1000 kubieke meters), 2013 - 2016
Water Consumption in All Service Areas via SWM (in 1000 cubic meters), 2013 - 2016
13
2.3b Water productie en consumptie geëxploiteerd door SWM ( in 1000 kubieke meters), 2012 - 2016
Water Production and Consumption Operated by SWM ( in 1000 cubic meters), 2012 - 2016
16
3 Bevolking Population
3.1 Bevolking per Ressort, Oppervlakte en dichtheid, per district/ressort in 2004 en 2012
Population per Ressort, Area and Density, per District/Resort in 2004 and 2012
22
3.2 Geschatte (mid-jaarlijkse) bevolking naar leeftijdsklasse en geslacht, periode 2014 – 2016
Estimated Mid-year Population by Age Group and Sex, period 2014 - 2016
24
3.3 Leeftijdspecifiek vruchtbaarheidscijfer, Algemeen vruchtbaarheidscijfer, Totaal vruchtbaarheidscijfer en Bruto vervangingsfactor, 2010 - 2016
Age Specific Fertility Rate, General Fertility Rate, Total Fertility Rate and Gross Reproduction Rate, 2010 - 2016
26
3.4 Belangrijke bevolkingsstatistieken naar geslacht, 2011 – 2016
Relevant Vital Statistics by Sex, 2011 - 2016
27
3.5 Demografische indicatoren naar geslacht, 2011 - 2016
Demographic Indicators by Sex, 2011 - 2016
28
3.6 Totaal aantal levendgeborenen naar geboorte gewicht 2013 – 2016
Total Number of Live Births by Birth Weight 2013 - 2016
29
3.7a Levendgeborenen naar leeftijdsgroep van de moeder, 2005 – 2016
Live Births by Age Group of the Mother, 2005 - 2016
30

xi
3.7b Aantal levendgeborenen uit niet residerende moeders, 2005 – 2016
Number of Live Births from Non Resident Mothers, 2005 - 2016
30
3.8a Levendgeborenen naar leeftijdsgroep en woondistrict van de moeder, 2013 en 2014
Live Births by Age Group and District of Residence of the Mother, 2013 and 2014
31
3.8b Levendgeborenen naar leeftijdsgroep en woondistrict van de moeder, 2015 en 2016
Live Births by Age Group and District of Res idence of the Mother, 2015 and 2016
32
3.9 Overledenen naar woondistrict en geslacht, 2013 – 2016
Deaths by District of Residence and Sex, 2013- 2016
33
3.10a Overledenen naar leeftijdsgroep, woondistrict en geslacht, 2013
Deaths by Age Group, District of Residence and Sex, 2013
34
3.10b Overledenen naar leeftijdsgroep, woondistrict en geslacht, 2014
Deaths by Age Group, District of Residence and Sex, 2014
35
3.10c Overledenen naar leeftijdsgroep, woondistrict en geslacht, 2015
Deaths by Age Group, District of Residence and Sex, 2015
36
3.10d Overledenen naar leeftijdsgroep, woondistrict en geslacht, 2016
Deaths by Age Group, District of Residence and Sex, 2016
37
3.11 De bevolking in de gezinshuishoudens in de districten Paramaribo en Wanica naar etnische groep en geloofsovertuiging, 2014 - 2016
The Population in the Households in the Districts of Paramaribo and Wanica by Ethnic Group and Religion, 2014 - 2016
38
4 Transport en Verkeer Transport and Traffic
4.1 Totaal aantal aangekomen en vertrokken personen en luchtvracht naar soort via J.A.P. luchthaven, 1990 - 2016
Annual Number of Arrivals and Departures and Air Freight by Type via J.A.P. Airport, 1990 - 2016
41
4.2 De jaarlijkse hoeveelheid ingevoerde en uitgevoerde vracht (x 1.000 ton) naar haven/kade, 2000 - 2016
Annual Quantity of Imported and Exported Freight (x 1,000 ton) by Harbour/Quay, 2000 - 2016
42
4.3 Het jaarlijkse aantal afgehandelde schepen betrokken bij de internationale scheepvaart naar haven/kade, 1990 - 2016
Annual Number of Dispatched Ships Involved in International Shipping, by Harbour/Quay, 1990 - 2016
43
4.4 Aantal verzekerde motorvoertuigen op de openbare weg, 2010 - 2016
Number of Insured Motorvehicles on Public Roads, 2010 - 2016
44

xii
4.5 Aantal sterfgevallen ten gevolge van verkeersongevallen naar district, 2010 - 2017
Number of Deaths due to Traffic Accidents by District, 2010 - 2017
45
5 Economie Economy
5.1 Betalingsbalans in mln. US dollars, 2013 - 2016
Balance of Payments in Mln. US Dollars, 2013 - 2016
50
5.2 Bruto Binnenlands Product (BBP) en Bruto Nationaal Inkomen tegen basisprijzen, respectievelijk marktprijzen alsook het Nationaal Inkomen en het Inkomen per Capita, 2013 – 2016
Gross Domestic Product (GDP) and Gross National Income at Basic Prices, Respectively at Market Prices as well as National Income and Income per Capita, 2013 - 2016
51
5.3 De jaarlijkse waarde van importen, exporten, wederexporten en de handelsbalans (x 1US$) naar de belangrijkste handelsblokken, 2014 – 2016
Annual Value of Imports, Exports, Re-Exports and the Trade Balance (x 1US$) to the Main Trading Blocks, 2014 - 2016
52
5.4a De waarde van de jaarlijkse import (x 1US$) uit de Caricom landen, 2014 - 2016
Value of Annual Imports (x 1US$) from the Caricom Countries, 2014 - 2016
53
5.4b 5.4c
De waarde van de jaarlijkse export (x 1US$) uit de Caricom landen, 2014 - 2016 De waarde van de jaarlijkse weder-export (x 1 US$) naar de Caricom landen, 2014 – 2016
Value of Annual Exports (x 1US$) from the Caricom Countries, 2014 – 2016 Value of Annual Re-Exports (x 1US$) from the Caricom Countries, 2014 - 2016
54
55
5.5 De jaarlijkse exportwaarde (x 1US$) van de agrarische sector, 2011 - 2016
Annual Value of Exports (x 1US$) of the Agriculture Sector, 2011 – 2016
56
5.6a De jaarlijkse invoerwaarde (x 1US$) naar afdelingen van het geharmoniseerd systeem, 2014 - 2016
Annual Value of Imports (x 1US$) by Sections of the Harmonized System, 2014 - 2016
57
5.6b De jaarlijkse uitvoerwaarde (x 1US$) naar afdelingen van het geharmoniseerd systeem, 2014 - 2016
Annual Value of Exports (x 1US$) by Sections of the Harmonized System, 2014 - 2016
59
5.6c De jaarlijkse wederuitvoerwaarde (x 1US$) naar afdelingen van het geharmoniseerd systeem, 2014 - 2016
Annual Value of Re-Exports (x 1US$) by Sections of the Harmonized System, 2014 - 2016
61

xiii
6 Landbouw en Veeteelt Agriculture and Animal Husbandry
6.1 De oppervlakte van het beplante areaal in hectare naar gewas, 2013 – 2016
Area of Cultivated Land in hectare by Type of Crop, 2013 - 2016
65
6.2 De jaarlijkse fysieke produktie (x 1.000 kg) in de landbouw naar soort gewas, 2013 - 2016
Annual Output (x 1,000 kg) in Agriculture by Type of Crop, 2013 - 2016
66
6.3 Jaarlijkse beplante areaal in hectare en de productie in ton van groenten naar soort, 2011 - 2016
Annual Area of Cultivated Land in hectare and Production in Tonnes of Vegetables by Type, 2011 - 2016
67
6.4 Het jaarlijkse aantal gefokte dieren naar soort, 2013 - 2016
Annual Number of Bred Livestock by Type, 2013 - 2016
69
7 Prijzen en Lonen
Prices and Wages
7.1a Maandelijkse prijsindex van de gezinsconsumptie per hoofdgroep, januari –maart 2016, basisperiode: april – juni 2009 = 100 (1)
Monthly Consumer Price Indices by Major Group, January – March 2016, Base period: April – June 2009 = 100 (1)
73
7.1a Maandelijkse prijsindex van de gezinsconsumptie per hoofdgroep, april - juni 2016, basisperiode: april – juni 2009 = 100 (2)
Monthly Consumer Price Indices by Major Group, April -June 2016, Base period: April - June 2009 = 100 (2)
74
7.1a Maandelijkse prijsindex van de gezinsconsumptie per hoofdgroep, april - juni 2016, basisperiode: april - juni 2016 = 100 (3)
Monthly Consumer Price Indices by Major Group, April -June 2016, Base period: April - June 2016 = 100 (3)
75
7.1a Maandelijkse prijsindex van de gezinsconsumptie per hoofdgroep, juli – september 2016, basisperiode: april - juni 2016 = 100 (4)
Monthly Consumer Price Indices by Major Group, July – September 2016, Base period: April - June 2016 = 100 (4)
76
7.1a Maandelijkse prijsindex van de gezinsconsumptie per hoofdgroep, oktober – december 2016, basisperiode: april - juni 2016 = 100 (5)
Monthly Consumer Price Indices by Major Group, October – December 2016, Base period: April - June 2016 = 100 (5)
77
xiv
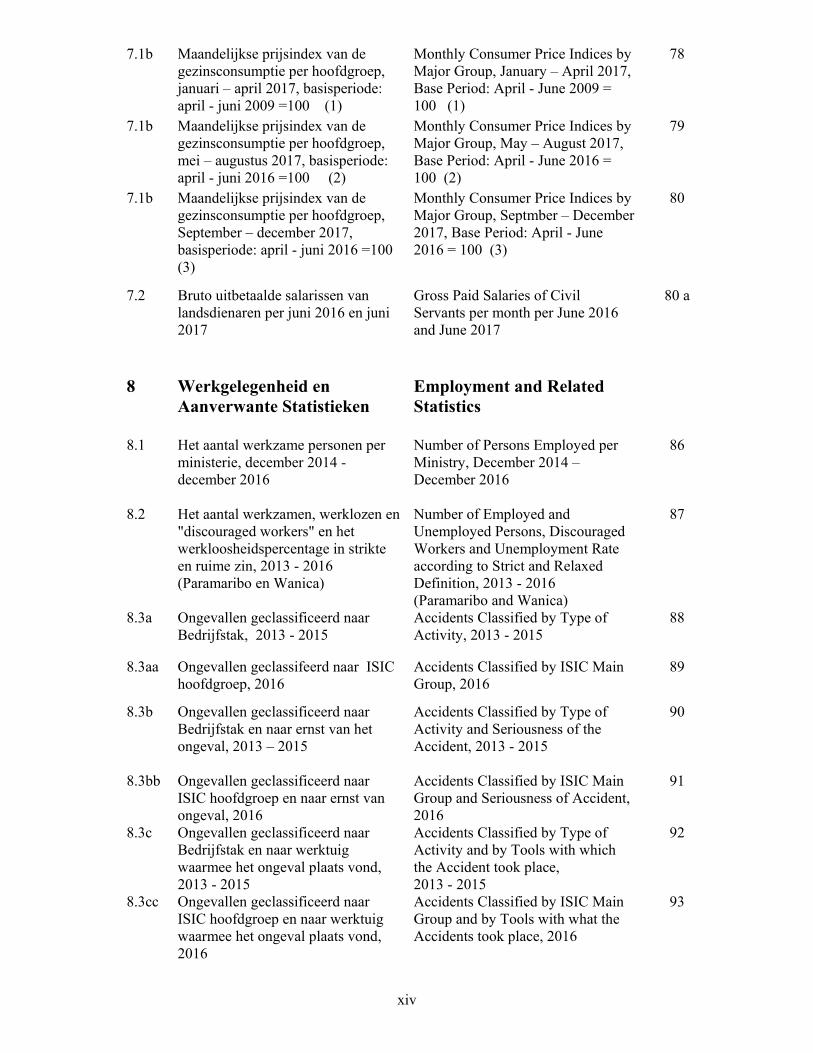
7.1b Maandelijkse prijsindex van de gezinsconsumptie per hoofdgroep, januari – april 2017, basisperiode: april - juni 2009 =100 (1)
Monthly Consumer Price Indices by Major Group, January – April 2017, Base Period: April - June 2009 = 100 (1)
78
7.1b Maandelijkse prijsindex van de gezinsconsumptie per hoofdgroep, mei – augustus 2017, basisperiode: april - juni 2016 =100 (2)
Monthly Consumer Price Indices by Major Group, May – August 2017, Base Period: April - June 2016 = 100 (2)
79
7.1b
Maandelijkse prijsindex van de gezinsconsumptie per hoofdgroep, September – december 2017, basisperiode: april - juni 2016 =100 (3)
Monthly Consumer Price Indices by Major Group, Septmber – December 2017, Base Period: April - June 2016 = 100 (3)
80
7.2 Bruto uitbetaalde salarissen van landsdienaren per juni 2016 en juni 2017
Gross Paid Salaries of Civil Servants per month per June 2016 and June 2017
80 a
8
Werkgelegenheid en Aanverwante Statistieken
Employment and Related Statistics
8.1 Het aantal werkzame personen per ministerie, december 2014 - december 2016
Number of Persons Employed per Ministry, December 2014 – December 2016
86
8.2 Het aantal werkzamen, werklozen en "discouraged workers" en het werkloosheidspercentage in strikte en ruime zin, 2013 - 2016 (Paramaribo en Wanica)
Number of Employed and Unemployed Persons, Discouraged Workers and Unemployment Rate according to Strict and Relaxed Definition, 2013 - 2016 (Paramaribo and Wanica)
87
8.3a Ongevallen geclassificeerd naar Bedrijfstak, 2013 - 2015
Accidents Classified by Type of Activity, 2013 - 2015
88
8.3aa Ongevallen geclassifeerd naar ISIC hoofdgroep, 2016
Accidents Classified by ISIC Main Group, 2016
89
8.3b Ongevallen geclassificeerd naar Bedrijfstak en naar ernst van het ongeval, 2013 – 2015
Accidents Classified by Type of Activity and Seriousness of the Accident, 2013 - 2015
90
8.3bb Ongevallen geclassificeerd naar ISIC hoofdgroep en naar ernst van ongeval, 2016
Accidents Classified by ISIC Main Group and Seriousness of Accident, 2016
91
8.3c
Ongevallen geclassificeerd naar Bedrijfstak en naar werktuig waarmee het ongeval plaats vond, 2013 - 2015
Accidents Classified by Type of Activity and by Tools with which the Accident took place, 2013 - 2015
92
8.3cc Ongevallen geclassificeerd naar ISIC hoofdgroep en naar werktuig waarmee het ongeval plaats vond, 2016
Accidents Classified by ISIC Main Group and by Tools with what the Accidents took place, 2016
93

xv
8.3d
Ongevallen geclassificeerd naar Bedrijfstak en naar getroffen lichaamsdeel, 2013 - 2015
Accidents Classified by Type of Activity and by Hit Part of the Body, 2013 – 2015
94
8.3dd Ongevallen geclassificeerd naar ISIC hoofdgroep en naar getroffen lichaamsdeel, 2016
Accidents Classified by ISIC Main Group and by Hit Part of the Body, 2016
95
8.3e
Ongevallen geclassificeerd naar Bedrijfstak en aard van letsel, 2013 - 2015
Accidents Classified by Type of Activity and Kind of Injury, 2013 - 2015
96
8.3ee Ongevallen geclassifeerd naar ISIC hoofdgroep en aard van letsel, 2016
Accidents Classified by ISIC Main Group and Kind of Injuries, 2016
98
9
Onderwijs
Education
9.1a Totaal aantal ingeschreven KO leerlingen naar ressort, klas en geslacht per district en aantal leerkrachten en scholen, schooljaar 2014/2015
Total Number of Enrolled KO Pupils by Ressort, Class and Sex per District and Number of Schools and Teachers, School Year 2014/2015
106
9.1b Totaal aantal ingeschreven GLO leerlingen naar ressort, klas en geslacht per district en aantal leerkrachten en scholen, schooljaar 2014/2015
Total Number of Enrolled GLO Pupils by Ressort, Class and Sex per District and Number of Teachers and Schools, School Year 2014/2015
110
9.1c Totaal aantal ingeschreven KO leerlingen naar ressort, klas en geslacht per district en aantal leerkrachten en scholen, schooljaar 2015/2016
Total Number of Enrolled KO Pupils by Ressort, Class and Sex per District and Number of Teachers and Schools, School Year 2015/2016
120
9.1d Totaal aantal ingeschreven GLO leerlingen naar ressort, klas en geslacht per district en aantal leerkrachten en scholen, schooljaar 2015/2016
Total Number of Enrolled GLO Pupils by Ressort, Class and Sex per District and Number of Teachers and Schools, School Year 2015/2016
124
9.2a Het totale aantal GLO leerlingen en zittenblijvers in het district Paramaribo naar klas en ressort, 2014/'15 -2015/'16
Total Number of GLO Pupils and Repeaters in the District of Paramaribo by Class and Ressort, 2014/'15 -2015/'16
134
9.2b Het totale aantal GLO leerlingen en zittenblijvers in het district Wanica naar klas en ressort, 2014/'15 -2015/'16
Total Number of GLO Pupils and Repeaters in the District of Wanica by Class and Ressort, 2014/'15 -2015/'16
135

xvi
9.2c Het totale aantal GLO leerlingen en zittenblijvers in het district Nickerie naar klas en ressort, 2014/'15 -2015/'16
Total Number of GLO Pupils and Repeaters in the District of Nickerie by Class and Ressort, 2014/'15 -2015/'16
136
9.2d Het totale aantal GLO leerlingen en zittenblijvers in het district Coronie naar klas en ressort, 2014/'15 -2015/'16
Total Number of GLO Pupils and Repeaters in the District of Coronie by Class and Ressort, 2014/'15 -2015/'16
136
9.2e
Het totale aantal GLO leerlingen en zittenblijvers in het district Saramacca naar klas en ressort, 2014/'15 -2015/'16
Total Number of GLO Pupils and Repeaters in the District of Saramacca by Class and Ressort, 2014/'15 -2015/'16
137
9.2f Het totale aantal GLO leerlingen en zittenblijvers in het district Commewijne naar klas en ressort, 2014/'15 -2015/'16
Total Number of GLO Pupils and Repeaters in the District of Commewijne by Class and Ressort, 2014/'15 -2015/'16
138
9.2g Het totale aantal GLO leerlingen en zittenblijvers in het district Marowijne naar klas en ressort, 2014/'15 -2015/'16
Total Number of GLO Pupils and Repeaters in the District of Marowijne by Class and Ressort, 2014/'15 -2015/'16
139
9.2h Het totale aantal GLO leerlingen en zittenblijvers in het district Para naar klas en ressort, 2014/'15 -2015/'16
Total Number of GLO Pupils and Repeaters in the District of Para by Class and Ressort, 2014/'15 -2015/'16
140
9.2i Het totale aantal GLO leerlingen en zittenblijvers in het district Brokopondo naar klas en ressort, 2014/'15 -2015/'16
Total Number of GLO Pupils and Repeaters in the District of Brokopondo by Class and Ressort, 2014/'15 -2015/'16
141
9.2j Het totale aantal GLO leerlingen en zittenblijvers in het district Sipaliwini naar klas en ressort, 2014/'15 -2015/'16
Total Number of GLO Pupils and Repeaters in the District of Sipaliwini by Class and Ressort, 2014/'15 -2015/'16
142
9.3a Het totale aantal GLO leerlingen en zittenblijvers naar klas per district, schooljaar 2014/’15
Total Number of GLO Pupils and Repeaters by Class per District, School Year 2014/'15
143
9.3b Het totale aantal GLO leerlingen en zittenblijvers naar klas per district, schooljaar 2015/'16
Total Number of GLO Pupils and Repeaters by Class per District, School Year 2015/'16
144
9.4a Leerlingen die hebben deelgenomen aan de G.L.O.-6 toets naar soort uitslag en district in 2014/2015
Pupils who Took Part in Examination of G.L.O.-6 Test by Kind of Result and District in 2014/2015
145

xvii
9.4b Leerlingen die hebben deelgenomen aan de G.L.O.-6 toets naar soort uitslag en district in 2015/2016
Pupils who Took Part in Examination of G.L.O.-6 Test by Kind of Result and District in 2015/2016
146
9.5 Aantal VOJ leerlingen naar geslacht, en type in de schooljaren 2014/ 2015 - 2015 / 2016
Number of pupils of VOJ by Sex , and Type in the School Years 2014/ 2015 - 2015 / 2016
148
9.5a Aantal LBO leerlingen naar geslacht en aantal scholen per district in de schooljaren 2014 / 2015 - 2015/2016
Number of Pupils of LBO by Sex and Number of Schools per District in the School Years 2014 / 2015 - 2015/2016
149
9.5b Aantal LBO leerlingen naar geslacht, klas en ressort per district in het schooljaar 2014 / 2015
Number of pupils of LBO by Sex , Class and Ressort per District in the School Year 2014 / 2015
150
9.5c Aantal LBO leerlingen naar geslacht, klas en ressort per district in het schooljaar 2015 / 2016
Number of pupils of LBO by Sex , Class and Ressort per District in the School Year 2015 / 2016
151
9.5d Aantal MULO leerlingen naar geslacht en aantal scholen, per district in de schooljaren 2014/2015 – 2015/2016
Number of Pupils of MULO by Sex and Number of Schools, per District in the School Years 2014/2015 – 2015/2016
152
9.5e Aantal MULO leerlingen naar geslacht, klas en ressort per district in het schooljaar 2014 / 2015
Number of pupils of MULO by Sex, Class and Ressort per District in the School Year 2014 / 2015
153
9.5f Aantal MULO leerlingen naar geslacht, klas en ressort per district in het schooljaar 2015 / 2016
Number of pupils of MULO by Sex, Class and Ressort per District in the School Year 2015 / 2016
155
9.6
Geslaagden/afgewezenen, en het slagingspercentage voor het eindexamen M.U.L.O., schooljaren 2006/2007 - 2015/2016
Results and the Pass Percentage of M.U.L.O. Completers’ Examination, School Years 2006/2007 - 2015/2016
157
9.7a VWMKO – Studenten naar geslacht per onderwijstype, schooljaren 2014/2015 - 2015/2016
VWMKO Students by Sex and Type of Education, School Years 2014/2015 - 2015/2016
158
9.7b
VWMKO – Afgestudeerde studenten naar geslacht en onderwijstype, schooljaren 2014/2015 - 2016/2017
VWMKO- Graduates by Sex and Type of Education, School Years 2014/2015 - 2016/2017
159
9.8a
Studenten naar geslacht en type tertiair onderwijs, 2013/2014 - 2016/2017
Students by Sex and Type of 3rd level Education, 2013/2014 - 2016/2017
160
xviii
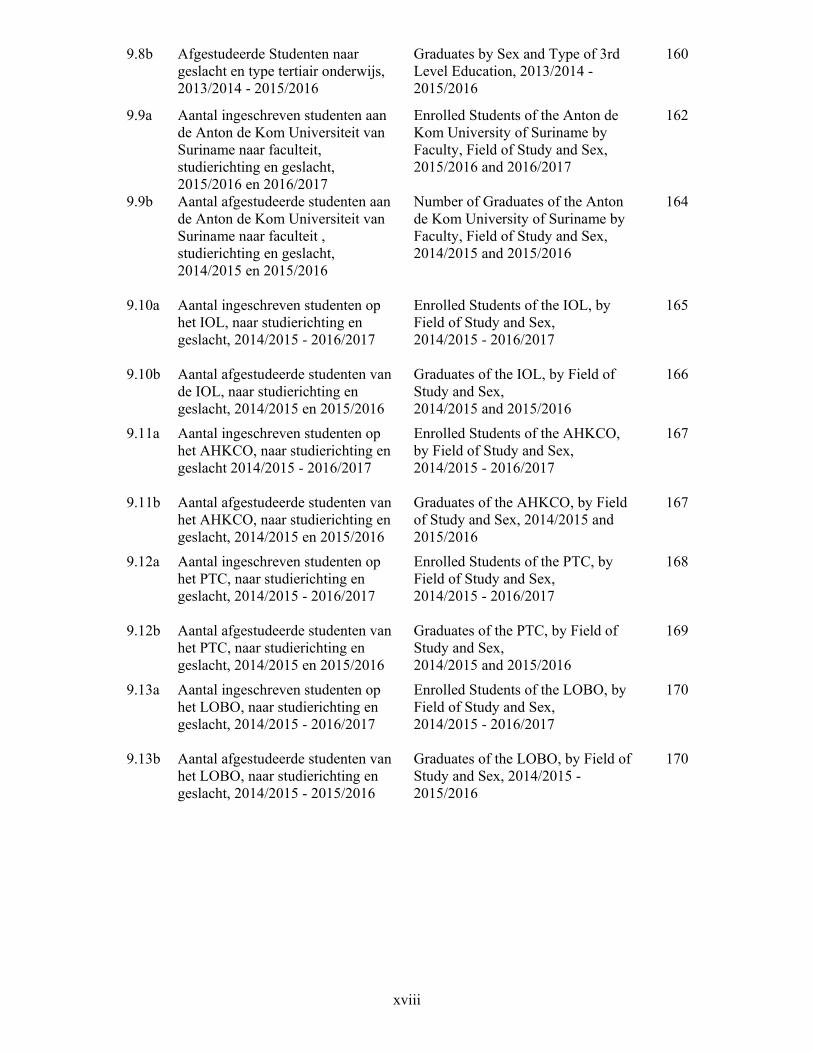
9.8b
Afgestudeerde Studenten naar geslacht en type tertiair onderwijs, 2013/2014 - 2015/2016
Graduates by Sex and Type of 3rd Level Education, 2013/2014 - 2015/2016
160
9.9a Aantal ingeschreven studenten aan de Anton de Kom Universiteit van Suriname naar faculteit, studierichting en geslacht, 2015/2016 en 2016/2017
Enrolled Students of the Anton de Kom University of Suriname by Faculty, Field of Study and Sex, 2015/2016 and 2016/2017
162
9.9b Aantal afgestudeerde studenten aan de Anton de Kom Universiteit van Suriname naar faculteit , studierichting en geslacht, 2014/2015 en 2015/2016
Number of Graduates of the Anton de Kom University of Suriname by Faculty, Field of Study and Sex, 2014/2015 and 2015/2016
164
9.10a Aantal ingeschreven studenten op het IOL, naar studierichting en geslacht, 2014/2015 - 2016/2017
Enrolled Students of the IOL, by Field of Study and Sex, 2014/2015 - 2016/2017
165
9.10b Aantal afgestudeerde studenten van de IOL, naar studierichting en geslacht, 2014/2015 en 2015/2016
Graduates of the IOL, by Field of Study and Sex, 2014/2015 and 2015/2016
166
9.11a Aantal ingeschreven studenten op het AHKCO, naar studierichting en geslacht 2014/2015 - 2016/2017
Enrolled Students of the AHKCO, by Field of Study and Sex, 2014/2015 - 2016/2017
167
9.11b Aantal afgestudeerde studenten van het AHKCO, naar studierichting en geslacht, 2014/2015 en 2015/2016
Graduates of the AHKCO, by Field of Study and Sex, 2014/2015 and 2015/2016
167
9.12a Aantal ingeschreven studenten op het PTC, naar studierichting en geslacht, 2014/2015 - 2016/2017
Enrolled Students of the PTC, by Field of Study and Sex, 2014/2015 - 2016/2017
168
9.12b Aantal afgestudeerde studenten van het PTC, naar studierichting en geslacht, 2014/2015 en 2015/2016
Graduates of the PTC, by Field of Study and Sex, 2014/2015 and 2015/2016
169
9.13a Aantal ingeschreven studenten op het LOBO, naar studierichting en geslacht, 2014/2015 - 2016/2017
Enrolled Students of the LOBO, by Field of Study and Sex, 2014/2015 - 2016/2017
170
9.13b Aantal afgestudeerde studenten van het LOBO, naar studierichting en geslacht, 2014/2015 - 2015/2016
Graduates of the LOBO, by Field of Study and Sex, 2014/2015 - 2015/2016
170

xix
10 Sociale voorzieningen Social Benefits
10.1 Het jaarlijkse aantal personen dat in aanmerking is gekomen voor A.O.V.- uitkeringen naar district, 2013 - 2016
Annual Number of Persons with Old Age Pension by District, 2013 - 2016
174
10.2 Het jaarlijkse aantal kinderen voor wie de overheid A.K.B. heeft uitbetaald naar district, 2013 - 2016
Annual Number of Children for whom the Government Paid Child Benefit by District, 2013 - 2016
175
10.3 Aantal rechthebbenden en rechthebbende personen op vrije geneeskundige hulp per district, 2012 - 2016
Number of Rightful Claimants and Claiming Persons for Free Health Care Benefits per District, 2012 - 2016
176
10.4 Het jaarlijkse aantal personen dat financiële bijstand heeft ontvangen naar district, 2013 - 2016
Annual Number of Persons that received Financial Support by District, 2013 - 2016
177
11 Volksgezondheid
Public Health
11.1 Het jaarlijkse aantal geneeskundigen naar soort, 2014 - 2017
Annual Number of Physicians by Type, 2014 - 2017
182
11.2 Aantal Verpleegkundigen en aantal verstrekte bevoegdheidsverklaringen aan Verpleegkundigen, 1996 - 2016
Number of Nurses and Number of Certificates of Qualification Provided to Nurses, 1996 - 2016
184
11.3 Aantal medische specialisten naar soort specialisatie en gezondheids-instelling, per juni 2017
Number of Medical Specialists by Type of Specialization and Health Institution, per Juni 2017
185
11.4 RGD poliklinieken en artsen naar district en RGD ressortsindeling, per juni 2016 en per juli 2017
RGD Policlinics and Physicians by District and RGD Ressort-classification, per June 2016 en per Julyi 2017
187
11.5 Het jaarlijkse aantal beschikbare ziekenhuisbedden naar gezondheidsinstelling en district, 2013 - 2016
Annual Number of Available Hospital Beds by Health Care Institution and District, 2013 - 2016
189
11.6 Aantal Suspecte gevallen van Leptospirose naar geslacht, 2011 - 2016
Number of Suspected Cases of Leptospirosis by Sex, 2011 - 2016
190
11.7 Aantal Suspecte gevallen van dengue naar geslacht, 2011 - 2016
Number of Suspected Cases of Dengue by Sex, 2011 - 2016
190
11.8 Aantal Malaria gevallen naar geslacht, 2011 - 2016
Number of Malaria Cases by Sex, 2011 - 2016
190

xx
11.9 Aantal Suspecte gevallen van Chikungunya, 2014 - 2016
Number of suspected cases of Chikungunya, 2014-2016
191
11.10 Aantal Suspecte gevallen van Zika, 2015 - 2016
Number of suspected cases of Zika, 2015 - 2016
191
12 Overheidsfinanciën Government Finances
12.1 De jaarlijkse geraamde uitgaven van de Overheid per categorie (x SRD. 1 miljoen), 2014 - 2018
Annual Budgeted Expenditures of the Government per Category (x SRD. 1 Million), 2014 - 2018
195
12.2 De jaarlijkse geraamde Apparaatsuitgaven van de Overheid per ministerie/department (x SRD. 1 miljoen), 2014 - 2018
Annual Budgeted Apparatus Expenditures of the Government by Ministry/Department (x SRD. 1 Million), 2014 - 2018
196
12.3 De jaarlijkse ramingen van de ontvangsten van de Overheid naar type (x SRD. 1 miljoen), 2015 – 2018
Annual Government Projected Revenues by Type (x SRD. 1 Million), 2015 - 2018
197
12.4
De jaarlijkse gerealiseerde ontvangsten van de Overheid naar type (x SRD 1 miljoen), 2013 - 1e helft 2017
Annual Government Actual Revenues by Type (x SRD 1 Million), 2013 – 1st half 2017
197
13
Criminaliteit
Crime
13.1a
Het totale aantal geregistreerde misdrijven (gepleegd) naar aard van misdrijf en district in Suriname, 2014 - 2016
Total Number of Registered Crimes
(Commited) by Type of Crime by District in Suriname, 2014 - 2016
201
13.1b Het totale aantal geregistreerde misdrijven (gepoogd) naar aard van misdrijf en district in Suriname, 2014 - 2016
Total Number of Registered Crimes
(Attempted) by Type of Crime and District in Suriname, 2014 - 2016
204
13.2a Het totale aantal geregistreerde en opgehelderde zaken (gepleegd) naar district, 2013 - 2016
Total Number of Registered and Solved Offences (Commited) by District, 2013 - 2016
207
13.2b Het totale aantal geregistreerde en opgehelderde zaken (gepoogd ) naar district, 2013 - 2016
Total Number of Registered and Solved Offences (Attempted) by District, 2013 - 2016
209

xxi
13.3a Het totale aantal geregistreerde misdrijven (gepleegd) en gepleegde misdrijven met bekende daders naar aard van misdrijf, 2013 - 2016
Total Number of Registered (Commited) Offences and Offences Commited by Known Offenders and Type of Crime, 2013 - 2016
210
13.3b Het totale aantal geregistreerde (gepoogd) misdrijven en gepoogde misdrijven met bekende daders naar aard van misdrijf, 2013 - 2016
Total Number of Registered (Attempted) Offences and Offences Attempted by Known Offenders and Type of Crime, 2013 - 2016
211
13.4
Aantal geregistreerde moord en doodslag gevallen per district, 2013 - 2016
Number of Registered Murder and Homicide Cases per District, 2013 – 2016
212
13.5a
Het totale aantal inverzekeringgestelde personen naar district, leeftijdsklasse en geslacht, 2013 en 2014
Total Number of Persons taken into Custody by District, Age Group and Sex, 2013 and 2014
213
13.5b
Het totale aantal inverzekeringgestelde personen naar district, leeftijdsklasse en geslacht, 2015 en 2016
Total Number of Persons taken into Custody by District, Age Group and Sex, 2015 and 2016
214
13.6a
Het totale aantal inverzekeringgestelde personen naar aard van misdrijf, leeftijdsklasse en geslacht, 2013 en 2014
Total Number of Persons taken into Custody by Type of Crime, Age Group and Sex, 2013 and 2014
215
13.6b
Het totale aantal inverzekeringgestelde personen naar aard van misdrijf, leeftijdsklasse en geslacht, 2015 en 2016
Total Number of Persons taken into Custody by Type of Crime, Age Group and Sex, 2015 and 2016
216

xxii
Lijst van grafieken
List of Graphs
Pagina Page
2.1 Gemiddelde temperatuur te M.H.F.
en J.A.P. Luchthaven, 2013 – 2016 Average Temperature at M.H.F. and J.A.P. Airport, 2013 – 2016
12
2.2 Totale waterconsumptie en waterconsumptie via huisaansluiting in alle verzorgingsgebieden van SWM (in 1000 kubieke meters), 2013 - 2016
Total Water Consumption and Water Consumption via House Connection in all Service Areas of SWM (in 1000 cubic meters), 2013 - 2016
15
2.3
Waterconsumptie en Waterproductie via SWM (in 1,000 kubieke meters) in Paramaribo, Wanica en Para, 2013 – 2016
Waterconsumption and Waterproduction via SWM (in 1,000 Cubic Meters) in Paramaribo, Wanica and Para, 2013 – 2016
17
3.1 Geschatte (mid-jaarlijkse) bevolking naar leeftijdsklasse en geslacht, 2016
Estimated Mid-year Population by Age Group and Sex, 2016
25
4.1
Aantal Verzekerde Motorvoertuigen op de openbare weg, 2016
Number of Insured Motor Vehicles on the Public Roads, 2016
44
4.2
Aantal sterfgevallen ten gevolge van Verkeersongevallen naar district, 2015 - 2017
Number of Deaths due to Traffic Accidents by District, 2015 - 2017
46
8.1 Het aantal werkzamen en werklozen, 2013 – 2016 (Paramaribo en Wanica)
Number of Employed and Unemployed Persons, 2013 - 2016 (Paramaribo and Wanica)
87
9.1
Geslaagden/Afgewezenen voor de GLO-6 toets naar geslacht, 2014/2015 - 2015/2016
Results of the GLO-6 Test by Sex, 2014/2015 - 2015/2016
147
9.2
Studenten naar geslacht en type tertiair onderwijs, 2014/2015 - 2016/2017
Students by Sex and Type of 3rd Level Education, 2014/2015 - 2016/2017
161
10.1
Jaarlijkse aantal kinderen voor wie de overheid AKB heeft uitbetaald naar district, 2014 - 2016
Annual Number of Children for whom the Government paid Child Benefit by District, 2014 - 2016
175
10.2
Jaarlijkse aantal personen dat financiële bijstand heeft ontvangen naar district, 2014 - 2016
Annual Number of Persons that received Financial Support by District, 2014 - 2016
178
11.1
Jaarlijkse aantal geneeskundigen naar soort, 2014 - 2017
Annual Number of Physicians by Type, 2014 - 201
183
13.1 Totale aantal geregistreerde en opgehelderde zaken (gepleegd), 2014 - 2016
Number of Registered and Solved Offences (Commited), 2014 - 2016
208

1
GENERAL
ALGEMEEN

2
Tabel 1: Kerncijfers van Suriname
Table 1: Key Figures of Suriname
Republiek Republic
Onafhankelijk November 25, 1975 Independent
Hoofdstad Paramaribo Capital
Oppervlakte 163,820 km² Area
Bevolking ( 8e Volks- en Woningtelling 2012) 541,638
Population ( 8th Population and Housing Census 2012)
Geschatte Midjaarlijkse bevolking, 2013* 550,222 Estimated Mid Year Population, 2013* Geschatte Midjaarlijkse bevolking, 2014* 558,773 Estimated Mid Year Population, 2014* Geschatte Midjaarlijkse bevolking, 2015* 567,291 Estimated Mid Year Population, 2015* Geschatte Midjaarlijkse bevolking, 2016* 575,763 Estimated Mid Year Population, 2016*
gemiddelde groei, 2014 1.55% Average Rate of Increase, 2014
gemiddelde groei, 2015 1.52 Average Rate of Increase, 2015
gemiddelde groei, 2016* 1.49 Average Rate of Increase, 2016*
Bevolkingsdichtheid, 2015 3.46 per km2 Population Density , 2015
Bevolkingsdichtheid, 2016 3.51 per km2 Population Density , 2016
Officiële taal Nederlands / Dutch Official Language
Andere gesproken talen Sranan tongo / Surinamese Other Languages Spoken Javaans / Javanese
Hindi / Hindi
Engels/English
Temperatuur in °C 2016 (gemiddeld) 28.2 °C Temperature in °C 2016 (average)
minimum 23.8 °C Minimum
maximum 31.5 °C Maximum Economie Economy
Munteenheid per 1 januari 2004 Surinaamse /Surinamese Dollar Currency per January 1, 2004 Wisselkoers :
Per 1 US$ Exchange Rate : Per 1US$
2017 (maandgem) SRD 7.55 2017 (Monthly Average )
januari, 2018 SRD 7.52 January, 2018
per 1 Euro per 1 Euro 2017 (maandgem) SRD 8.48 2017 (Monthly Average )
januari, 2018 SRD 9.12 January, 2018 Bruto Binnenlands Product 2016*
(basisprijzen ) 19,109,822 (x 1,000 SRD ) Gross Domestic Product 2016* (Basic prices )
Bruto Binnenlands Product 2016* (marktprijzen ) 20,420,222 (x 1,000 SRD)
Gross Domestic Product 2016* (Market Prices )
reële groei 2015 * (Basis jaar 2007 ) # -2.6% Real Growth 2015* (Basic year 2007) reële groei 2016 * (Basis jaar 2007 ) -5.1% Real Growth 2015*(Basic year 2007 )
Bruto Nationaal Inkomen ( basis prijzen) (2016) * 18,406,559 (x ,1000 SRD)
Gross National Income Basic Prices (2016) *
Bruto Nationaal Inkomen ( marktprijzen) (2016) * 19,716,959222 (x ,1000 SRD)
Gross National Income market price (2016) *
Nationaal Inkomen / capita (2016) * 34,245 SRD National Income / capita (2016) *
Handelsbalans 2016*(x 1US$) 60,372,838 Balance of Trade 2016*(x 1US$)
Export van goederen 2016* 1,235,283,177 Export of Goods 2016*
Import van goederen 2016* 1,174,910,339 Import of Goods 2016*

3
Tabel 1: Kerncijfers van Suriname (vervolg)
Table 1: Key Figures of Suriname (Continued)
Consumenten Prijsindex (april - juni 2016=100)
Consumer Price Index (April - June 2016=100)
2016 103.3 2016
2017 126.0 2017
januari 2018* 131.1 January 2018* Onderwijs Education
Ingeschrevenen KO (2014/2015) 17,901 Pre-primary Enrolment (2014/2015) Ingeschrevenen KO (2015/2016) 18,596 Pre-primary Enrolment (2015/2016)
Ingeschrevenen GLO (2014/2015) 70,611 Primary Enrolment (2014/2015) Ingeschrevenen GLO (2015/2016) 70,509 Primary Enrolment (2015/2016)
Ingeschrevenen V.O.J. (2014 /2015) 37,638 Junior Secondary Level Enrollment (2014/2015)
Ingeschrevenen V.O.J. (2015 /2016) 37,277 Junior Secondary Level Enrollment (2015/2016)
Ingeschrevenen VOS (2015/2016) 13,592 Upper Secondary Enrolment (2015/2016)
Ingeschrevenen VOS (2016/2017) 14,619 Upper Secondary Enrolment (2016/2017)
Inschrijvingen Tertiair Onderwijs (2015/2016) 8,129
Tertiary Enrolment (2015/2016)
Inschrijvingen Tertiair Onderwijs (2016/2017) 8,238
Tertiary Enrolment (2016/2017)
Sociale voorzieningen van het ministerie van
Sociale Zaken en Volkshuisvesting
Social Benefits from the Ministry of Social Affairs and Housing
Aantal A.O.V. geregistreerde personen (per december 2016) 55,254
Number of Persons registered for Old Age Pension (per December 2016)
Aantal personen dat financiele bijstand ontvangt
(per december 2016) 12,505
Number of Persons that receives Financial Support (per December 2016)
Aantal geregistreerde kinderen voor kinderbijslag
(in de tweede helft van 2016) 88,867
Number of Children registered for General Child Benefit (in the Second Half of 2016)
KO=Kleuteronderwijs/Pre‐PrimarySchool GLO = Gewoon Lager Onderwijs / Primary School VOJ = Voortgezet Onderwijs op Junioren niveau / Junior Secondary Level Education VOS = Voortgezet Onderwijs op Senioren nieveau / Senior Secondary Level Education AOV = Algemene Ouderdoms Voorziening / Old-Age Pension Scheme

4
Tabel 1: Kerncijfers van Suriname (vervolg)
Table 1: Key Figures of Suriname (Continued)
Gezondheid Health Gezondheidsfaciliteiten : Health facilities:
Aantal ziekenhuizen (2016) 6 Number of Hospitals (2016) Aantal bedden beschikbaar in
ziekenhuizen en andere gezondheidsinstellingen (2016) 1,708
Number of Beds Available in Hospitals and other Health Care Institutions (2016)
Gezondheidswerkers: Health workers:
Algemeen artsen (2016 ) 436 General Practitioners ( 2016)
Medische Specialisten ( 2016) 203 Medical Specialists ( 2016)
Verpleegkundigen (2015) 1,167 Nurses (2015)
Algemeen artsen (2017 ) 465 General Practitioners ( 2017)
Medische Specialisten ( 2017) 210 Medical Specialists ( 2017)
Verpleegkundigen (2016) 1,104 Nurses (2016)

5
OPPERVLAKTE, KLIMAAT & MILIEU
AREA, CLIMATE & ENVIRONMENT

6
J.A.P.luchthaven = Johan Adolf Pengel Luchthaven Johan Adolf Pengel Airport
M.H.F.vliegveld = Majoor Henry Fernandes vliegveld Majoor Henry Fernandes Airstrip
Gem./ Average = Gemiddeld / Average

7
2. Oppervlakte, Klimaat en Milieu De eerste tabellen geven ons een overzicht van de oppervlakte verdeling van Suriname naar district en ressort. Suriname heeft vier seizoenen, twee regen- en twee droge seizoenen. In tabel 2.2 zien we de meteorologische waarnemingen op het Majoor Henry Fernandes vliegveld en de Johan Adolf Pengel Luchthaven. Kijken we naar de gemiddelde temperatuur vanaf 2011 tot en met 2016, dan merken wij een stijging van de temperatuur. Anno 2016 merken wij dat het weer in Suriname warmer aanvoelt dan voorheen. Bij een vergelijking van de cijfers over neerslag vanaf het jaar 2014 tot en met 2016, dan merken wij dat het in het district Nickerie (M.H.F.) steeds meer regent.
2. Area, Climate and Environment The first tables give us an overview of the Area distribution of Suriname into Districts and Ressorts. Suriname has four seasons, two rainy and two dry seasons. In table 2.2 we see the meteorological observations of the Majoor Henry Fernandes airport and the Johan Adolf Pengel airport. If we look at the average temperature from 2011 up to 2016, we notice a rise in temperature. In 2016 we notice that the weather in Suriname feels warmer than before. When comparing the Rainfall figures from the year 2014 up to 2016, we notice that in the district Nickerie (M.H.F.) it is raining more and more..

Bron: Source
Tab
District/ District
Paramaribo
Wanica
Nickerie
Coronie
Saramacca
Commewijne
Marowijne
Para
Brokopondo
Sipaliwini
Totaal / Total
Algemeen Bue: General Bur
bel 2.1a: Opp
Table 2.1a: A
Opp
ureau voor de Sreau of Statisti
pervlakte per
Area per Dis
pervlakte / Ar
182
443
5,353
3,902
3,636
2,353
4,627
5,393
7,364
130,567
163,820
Statistiek ics
Wanica
r district
strict
rea (km2)
Paramaribbo

9
Tabel 2.1b: Oppervlakte (km2) per ressort (1)
Tabel 2.1b: Area (km2) per Ressort (1)
District / District Ressort/ Ressort1) Oppervlakte / Area (km2)
Paramaribo Blauwgrond 43
Rainville 31
Munder 14
Centrum 9
Beekhuizen 6
Weg naar Zee 41
Welgelegen 7
Tammenga 6
Flora 4
Latour 6
Pontbuiten 6
Livorno 9
Wanica Kwatta 62
Saramaccapolder 28
Koewarasan 71
De Nw. Grond 38
Lelydorp 149
Houttuin 58
Domburg 37
Nickerie Wageningen 1,613
Groot Henar 2,185
Oostelijke Polders 357
Nieuw Nickerie 30
Westelijke Polders 1,168
Coronie Welgelegen 2,143
Totness 173
Johanna Maria 1,586
Saramacca Calcutta 1,655
Tijgerkreek 241
Groningen 57
Kampong Baroe 684
Wayamboweg 872
Jarikaba 127 1) Ressort is de wettelijke geografische indeling binnen een district. (Kleinste eenheid bij wet vastgesteld) 1) Ressort is the legal subdivision within a district. (Smallest unit with a legal status) Bron: Algemeen Bureau voor de Statistiek Source: General Bureau of Statistics

10
Tabel 2.1b: Oppervlakte (km2) per ressort (2)
Tabel 2.1b: Area (km2) per Ressort (2)
District/ District Ressort/ Ressort1) Oppervlakte / Area (km2)
Commewijne Margaretha 191
Bakki 440
Nw. Amsterdam 48
Alkmaar 81
Tamanredjo 512
Meerzorg 1,081
Marowijne Moengo 1,117
Wanhatti 461
Galibi 1,014
Moengo Tapoe 455
Albina 397
Patamacca 1,183
Para Noord Para 236
Oost Para 446
Zuid Para 909
Bigi Poika 2,361
Carolina 1,441
Brokopondo Kwakoegron 1,050
Marechalskreek 354
Klaaskreek 349
Centrum 314
Brownsberg 731
Sarakreek 4,566
Sipaliwini Tapanahony 42,199
Boven-Suriname 7,512
Boven-Saramacca 5,929
Boven-Coppename 15,839
Kabalebo 25,955
Coeroeni 33,133
1) Ressort is de wettelijke geografische indeling binnen een district. (Kleinste eenheid bij wet vastgesteld) 1) Ressort is the legal subdivision within a district. (Smallest unit with a legal status) Bron: Algemeen Bureau voor de Statistiek Source: General Bureau of Statistics

11
Tabel 2.2 : Meteorologische waarnemingen te M.H.F. en J.A.P. luchthaven, 2011 – 2016
Table 2.2: Meteorological Observations at M.H.F. Airstrip and J.A.P. Airport,
2011 - 2016
2011 2012 2013
M.H.F. J.A.P. M.H.F. J.A.P. M.H.F. J.A.P.
Minimum temperatuur 1) /
Minimum Temperature 1) . 22.6 24.5 22.8 24.3 23
Gemiddelde temperatuur/
Average Temperature . 26.2 27.7 26.3 27.5 26.2
Maximum temperatuur/
Maximum Temperature . 32.2 29.7 32.3 29.6 32
Relatieve vochtigheid/
Relative Humidity . 83.8 81 82.9 80 84.9
Windsnelheid 2)/
Velocity 2) . 3.8 2.6 4.6 2.9 4.8
Neerslag in mm 3) /
Rainfall in mm 3) 184.6 179.1 139.5 178.4 142.8 231.9
2014 2015 2016
M.H.F. J.A.P. M.H.F. J.A.P. M.H.F. J.A.P.
Minimum temperatuur 1) /
Minimum Temperature 1) 24.2 23.0 24.3 23.1 24.4 23.4
Gemiddelde temperatuur/
Average Temperature 27.5 27.6 27.6 27.6 27.9 28.0
Maximum temperatuur/
Maximum Temperature 29.5 32.1 29.7 32.0 30.0 32.7
Relatieve vochtigheid/
Relative Humidity 79.0 77.0 79.0 78.0 79.0 77.0
Windsnelheid 2)/
Velocity 2) 2.9 2.1 2.9 1.9 2.5 1.7
Neerslag in mm 3) /
Rainfall in mm 3) 106.3 177.3 118.9 183.9 152.3 173.2 1) Temperatuur in graden Celsius (º C) / Temperature in degrees Celsius (º C) 2) Windsnelheid in Beaufort / Velocity in Beaufort
Bft m/s 0 0,0-0,2 1 0,3-1,5 2 1,6-3,3 3 3,4-5,4
3) Maandgemiddelde / Monthly Average Bron : Ministerie van Openbare Werken, afdeling Meteorologische Dienst Source : Ministry of Public Works, Meteorological Department

Gr
Gem
idd
elde
tem
per
atu
ur C
/ A
vera
ge T
empe
ratu
re C
afiek 2.1: Ge
Graph 2.1:
25.0
25.5
26.0
26.5
27.0
27.5
28.0
28.5
M.H.F. v
J.A.P. luc
emiddelde te
Average Tem
2013
vliegveld/air
chthaven/ai
mperatuur t
mperature at
20
rstrip
irport
te M.H.F. en
t M.H.F. and
014
J.A.P. Lucht
d J.A.P. Airp
2015
thaven, 2013
port, 2013 – 2
2
Ja
3 – 2016
2016
2016
aar / Year

13
Tabel 2.3a : Waterconsumptie in alle verzorgingsgebieden van SWM (in 1000 kubieke meters), 2013 – 2016 (1)
Table 2.3a : Water Consumption in All Service Areas of SWM
( in 1000 cubic meters), 2013 – 2016 (1)
Soort aansluiting / Type of Connection
Paramaribo, Wanica en Para 2013 2014 2015 2016
Erfaansluiting / Yard Connection 1570.5 1665.9 1824.6 1797.7
Huisaansluiting / House Connection 15559.5 16282.0 17103.9 16257.6
Huis met zwembad /
House with Swimming Pool 38.7 40.0 36.5 37.0
Industriële & Commerciële aansluiting / Industrial & Commercial Connection 3851.9 4224.3 4510.5 4733.5
Openbare aansluiting / Public Connection 1225.7 1210.5 1238.7 1345.9
Totaal / Total 22,246.3 23,422.7 24,714.2 24,171.7
Soort aansluiting / Type of Connection
Nickerie 2013 2014 2015 2016
Erfaansluiting / Yard Connection 61.6 62.9 56.7 52.5
Huisaansluiting / House Connection 1473.5 1495.7 1512.7 1429.6
Huis met zwembad /
House with Swimming Pool - - - -
Industriële & Commerciële aansluiting / Industrial & Commercial Connection 180.4 181.5 175.4 144.0
Openbare aansluiting / Public Connection 110.3 118.7 133.1 62.3
Totaal / Total 1,825.8 1,858.8 1,877.9 1,688.4
Opmerking / Remark: In Wanica,Para en Nickerie worden niet alle gebieden van water voorzien door de SWM / In Wanica,Para and Nickerie not all areas are provided with water by the SWM. Bron : Surinaamse Waterleiding Maatschappij (SWM) Source : Suriname Water Company (SWM)

14
Tabel 2.3a : Waterconsumptie in alle verzorgingsgebieden van SWM (in 1000 kubieke meters), 2013 – 2016 (2)
Table 2.3a : Water Consumption in All Service Areas of SWM
( in 1000 cubic meters), 2013 – 2016 (2)
Soort aansluiting / Type of Connection
Marowijne 2013 2014 2015 2016
Erfaansluiting / Yard Connection . . . 27.0
Huisaansluiting / House Connection 528.7 525.0 525.2 529.6
Huis met zwembad /
House with Swimming Pool . . . .
Industriële & Commerciële aansluiting / Industrial & Commercial Connection 75.8 63.7 51.8 47.8
Openbare aansluiting / Public Connection 68.8 78.5 70.9 79.4
Totaal / Total 673.3 667.2 647.9 656.8
Soort aansluiting /
Type of Connection
Totaal/Total
2013 2014 2015 2016
Erfaansluiting / Yard Connection 1,632.1 1,728.8 1,881.3 1,877.2
Huisaansluiting / House Connection 17,561.7 18,302.7 19,141.8 18,216.8
Huis met zwembad / House with Swimming Pool 38.7 40.0 36.5 37.0
Industriële & Commerciële aansluiting /
Industrial & Commercial Connection 4,108.1 4,469.5 4,737.7 4,925.3
Openbare aansluiting / Public Connection 1,404.8 1,407.7 1,442.7 1,487.6
Totaal / Total 24,745.4 25,948.7 27,240.0 26,516.9 Opmerking / Remark: In Wanica,Para en Nickerie worden niet alle gebieden van water voorzien door de SWM / In Wanica,Para and Nickerie not all areas are provided with water by the SWM
Bron : Surinaamse Waterleiding Maatschappij (SWM) Source : Suriname Water Company (SWM)

15
Grafiek 2.2: Totale waterconsumptie en waterconsumptie via huisaansluiting in alle verzorgingsgebieden van SWM ( in 1000 kubieke meters), 2013 – 2016
Graph 2.2: Total Water Consumption and Water Consumption via House Connection
in All Service Areas of SWM (in 1000 cubic meters), 2013 - 2016
0.0
5000.0
10000.0
15000.0
20000.0
25000.0
30000.0
2013 2014 2015 2016
in 1
00
0 k
ub
iek
e m
eter
s /
cub
ic m
eter
s
Jaar / Year
Waterconsumptie via huisaansluiting / Water Consumption via House ConnectionTotale waterconsumptie / Total Water Consumption

16
Tabel 2.3b : Water productie en consumptie geëxploiteerd door SWM ( in 1000 kubieke meters), 2012 – 2016
Table 2.3b : Water Production and Consumption Operated by SWM ( in 1000 cubic
meters), 2012 - 2016
Waterleidingnet / Distribution Network
Jaar/ Year
Productie/ Production
Consumptie / Consumption
Paramaribo, Wanica, Para 2012 37290.3 21376.3
2013 40292.4 22246.3 2014 42384.0 23422.8 2015 42606.1 24714.3 2016 43244.7 24171.6
Nickerie 2012 2275.3 1742.2 2013 2272.0 1825.7 2014 2239.6 1923.7 2015 2296.3 1877.9 2016 2223.2 1688.4
Marowijne 2012 841.7 652.8 2013 883.5 673.3 2014 852.1 667.2 2015 820.9 647.9 2016 739.3 656.8
Totaal / Total 2012 40407.3 23771.3 2013 43447.9 24745.3 2014 45475.7 26013.7 2015 45723.3 27240.1 2016 46207.2 26516.8 Opmerking / Remark: In Wanica,Para en Nickerie worden niet alle gebieden van water voorzien door de SWM / In Wanica,Para and Nickerie not all areas are provided with water by the SWM. Bron : Surinaamse Waterleiding Maatschappij (SWM) Source : Suriname Water Company (SWM)

Grafiek
Graph 2
in 1
,000
kub
iek
e m
eter
s /
in 1
,000
Cu
bic
Met
ers
W
W
k 2.3: Water
2.3: Waterco
0.
5000.
10000.
15000.
20000.
25000.
30000.
35000.
40000.
45000.
Waterproduc
Waterconsum
rconsumptiin Param
onsumptionin Param
.0
.0
.0
.0
.0
.0
.0
.0
.0
.0
2013
ctie / Waterp
mptie / Wate
e en Waterpmaribo, Wan
n and Wateraribo,Wani
3 201
production
erconsumpti
productie vnica en Para
rproductionica and Para
14 20
ion
ia SWM (ina, 2013 – 20
n via SWM a, 2013 – 20
015 2
n 1,000 kubi16
(in 1,000 Cu016
2016
Jaar/Y
ieke meters)
ubic Meters
Year
)
s)

18
“Statistical thinking will one day
be as necessary for efficient citizenship as the ability to read and write”
(H.G. Wells)
19
BEVOLKING
DEMOGRAPHY

20
BOG = Bureau voor Openbare Gezondheidszorg / Bureau of Public Health CBB = Centraal Bureau voor Burgerzaken / Civil Registry Office GFR = General Fertility Rate / Algemeen vruchtbaarheidscijfer TFR = Total Fertility Rate / Totaal vruchtbaarheidscijfer GRR = Gross Reproduction Rate / Bruto reproductie- of Bruto vervangingsfactor
GFR Algemeen vruchtbaarheidscijfer: Het aantal levendgeboren personen in een bepaald jaar onder alle vrouwen in de reproductieve leeftijdsklasse ( 15-49 of 15-44 jaar). TFR Totaal vruchtbaarheidscijfer: Het gemiddelde aantal kinderen dat een vrouw (of groep van vrouwen) ter wereld zou (den) brengen indien de (in een bepaald jaar) waargenomen leeftijdsspecifieke vruchtbaarheidscijfers onveranderd zouden blijven gelden voor vrouwen in de vruchtbare levensfase. GRR Bruto reproductie- of Bruto vervangingsfactor: Het gemiddelde aantal dochters dat een vrouw (of groep vrouwen) ter wereld zou(den) brengen indien de (in een bepaald jaar) waargenomen leeftijdsspecifieke vruchtbaarheidscijfers voor meisjesgeboorten onveranderd zouden blijven gelden voor vrouwen in de vruchtbare levensfase.
General Fertility Rate: The number of live births in a certain year to all women in the childbearing age group ( 15-49 or 15-44).
Total Fertility Rate: The average number of children a woman (or group of women) would deliver if the age specific fertility rates observed in a certain year were to apply during her (their) childbearing ages.
Gross Reproduction Rate: The average number of daughters a woman (or a group of women) would deliver if the age specific fertility rates for female births observed in a certain year were to apply during her (their) childbearing ages.
.

21
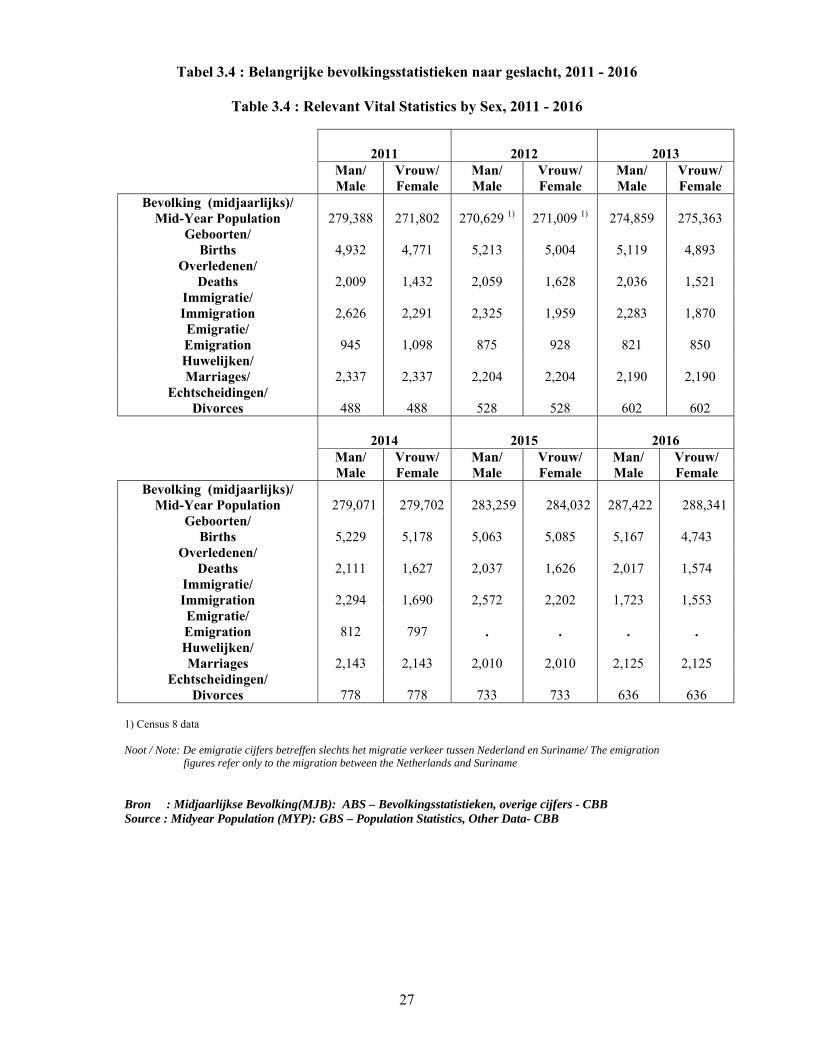
3. Bevolking Uit tabel 3.2, de Midjaarlijkse bevolking naar leeftijdsklasse en geslacht, zien we dat er naar schatting meer vrouwen zijn dan mannen. Over het algemeen zien we dat het aantal overledenen onder de mannen hoger ligt in vergelijking met vrouwen. Hierbij is ook te vermelden dat er verschillen zijn in de levensverwachting van de geslachten. Uit tabel 3.5 blijkt dat vrouwen naar schatting gemiddeld langer leven dan mannen. Als we kijken naar de zuigelingen sterfte gedurende de periode 2013-2015 dan zien we gelukkigerwijs een dalende trend. In tabel 3.6 zien wij dat de meeste baby’s bij geboorte, tussen de 2500 gram en 3500 gram wegen. Het jaarlijkse gemiddelde geboortegewicht, ligt rond de 3000 gram. .
3. Population Table 3.2, the estimated Mid-year population by age group and sex, shows that there are more women than men. Overall, we see that the number of deaths among men is higher than women. We can also mention that there are differences in the life expectancy between the sexes. Table 3.5 shows that on average, women live longer than men. Looking at infant mortality, we see that as of 2013 up to 2015, this figure shows a downward trend, fortunately. Table 3.6 shows us that the majority of babies weigh between 2500 grams and 3500 grams at birth. The annual average birth weight is about 3000 grams.

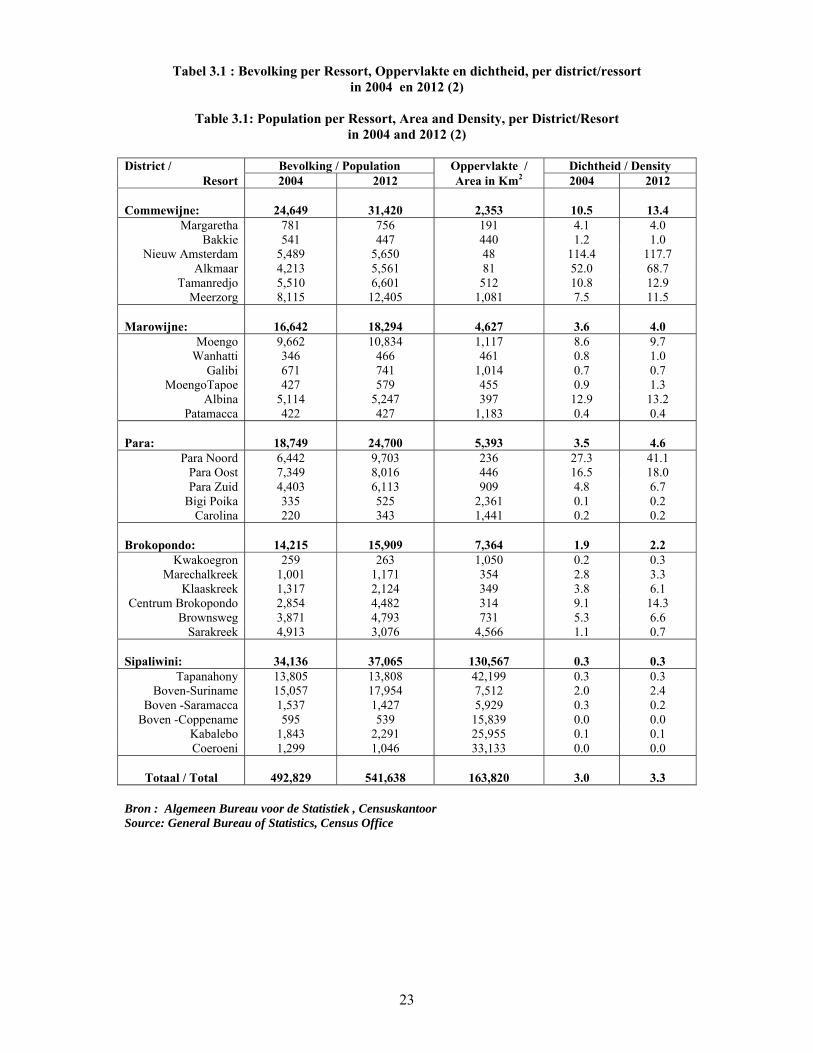
22
Tabel 3.1 : Bevolking per Ressort, Oppervlakte en dichtheid, per district/ressort in 2004 en 2012 (1)
Table 3.1: Population per Ressort, Area and Density, per District/Resort
in 2004 and 2012 (1)
District / Bevolking / Population Oppervlakte / Dichtheid / Density Resort 2004 2012 Area in Km2 2004 2012
Paramaribo:
242,946
240,924
182
1,334.9
1,323.8
Blauwgrond 28,436 31,483 43 661.3 732.2 Rainvile 28,853 22,747 31 930.7 733.8Munder 16,049 17,234 14 1,146.4 1,231.0
Centrum 29,274 20,631 9 3,252.7 2,292.3 Beekhuizen 19,783 17,185 6 3,297.2 2,864.2
Weg naar Zee 13,172 16,037 41 321.3 391.1 Welgelegen 23,709 19,304 7 3,387.0 2,757.7 Tammenga 14,313 15,819 6 2,385.5 2,636.5
Flora 15,346 19,538 4 3,3836.5 4,884.5 Latour 26,148 29,526 6 4,358.0 4,921.0
Pontbuiten 19,477 23,211 6 3,246.2 3,868.5 Livorno 8,386 8,209 9 931.8 912.1
Wanica:
85,986
118,222
443
194.1
266.9
Kwatta 10,091 14,151 62 162.8 228.2 Saramaccapolder 7,789 10,217 28 278.2 364.9
Koewarasan 16,161 27,713 71 227.6 390.3 De Nieuwe Grond 20,219 26,161 38 532.1 688.4
Lelydorp 15,945 18,663 149 107.0 125.3 Houttuin 10,227 15,656 58 176.3 269.9
Domburg 5,554 5,661 37 150.1 153.0 Nickerie:
36,639
34,233
5,353
6.8
6.4
Wageningen 3,428 2,937 1,613 2.1 1.8 Groot Henar 3,545 2,709 2,185 1.6 1.2
Oostelijke Polders 6,778 7,153 357 19.0 20.0Nieuw Nickerie 13,842 12,818 30 461.4 427.3
Westelijke Polders 9,046 8,616 1,168 7.7 7.4 Coronie:
2,887
3,391
3,902
0.7
0.9
Welgelegen 605 593 2,143 0.3 0.3 Totness 1,684 2,150 173 9.7 12.4
Johanna Maria 598 648 1,586 0.4 0.4 Saramacca:
15,980
17,480
3,636
4.4
4.8
Calcutta 1,918 1,647 1,655 1.2 1.0 Tijgerkreek 2,899 3,244 241 12.0 13.5 Groningen 2,825 2,818 57 49.6 49.4
Kampong Baroe 1,948 2,248 684 2.8 3.3 Wayamboweg 1,582 1,560 872 1.8 1.8
Jarikaba 4,808 5,963 127 37.9 47.0 Bron : Algemeen Bureau voor de Statistiek , Censuskantoor Source: General Bureau of Statistics, Census Office
23
Tabel 3.1 : Bevolking per Ressort, Oppervlakte en dichtheid, per district/ressort in 2004 en 2012 (2)
Table 3.1: Population per Ressort, Area and Density, per District/Resort
in 2004 and 2012 (2)
District / Bevolking / Population Oppervlakte / Dichtheid / Density Resort 2004 2012 Area in Km2 2004 2012
Commewijne:
24,649
31,420
2,353
10.5
13.4
Margaretha 781 756 191 4.1 4.0 Bakkie 541 447 440 1.2 1.0
Nieuw Amsterdam 5,489 5,650 48 114.4 117.7 Alkmaar 4,213 5,561 81 52.0 68.7
Tamanredjo 5,510 6,601 512 10.8 12.9Meerzorg 8,115 12,405 1,081 7.5 11.5
Marowijne:
16,642
18,294
4,627
3.6
4.0
Moengo 9,662 10,834 1,117 8.6 9.7 Wanhatti 346 466 461 0.8 1.0
Galibi 671 741 1,014 0.7 0.7 MoengoTapoe 427 579 455 0.9 1.3
Albina 5,114 5,247 397 12.9 13.2 Patamacca 422 427 1,183 0.4 0.4
Para:
18,749
24,700
5,393
3.5
4.6
Para Noord 6,442 9,703 236 27.3 41.1Para Oost 7,349 8,016 446 16.5 18.0 Para Zuid 4,403 6,113 909 4.8 6.7
Bigi Poika 335 525 2,361 0.1 0.2Carolina 220 343 1,441 0.2 0.2
Brokopondo:
14,215
15,909
7,364
1.9
2.2
Kwakoegron 259 263 1,050 0.2 0.3 Marechalkreek 1,001 1,171 354 2.8 3.3
Klaaskreek 1,317 2,124 349 3.8 6.1 Centrum Brokopondo 2,854 4,482 314 9.1 14.3
Brownsweg 3,871 4,793 731 5.3 6.6 Sarakreek 4,913 3,076 4,566 1.1 0.7
Sipaliwini:
34,136
37,065
130,567
0.3
0.3
Tapanahony 13,805 13,808 42,199 0.3 0.3Boven-Suriname 15,057 17,954 7,512 2.0 2.4
Boven -Saramacca 1,537 1,427 5,929 0.3 0.2 Boven -Coppename 595 539 15,839 0.0 0.0
Kabalebo 1,843 2,291 25,955 0.1 0.1 Coeroeni 1,299 1,046 33,133 0.0 0.0
Totaal / Total
492,829
541,638
163,820
3.0
3.3
Bron : Algemeen Bureau voor de Statistiek , Censuskantoor Source: General Bureau of Statistics, Census Office

24
Tabel 3.2: Geschatte (mid-jaarlijkse) bevolking naar leeftijdsklasse en geslacht, periode 2014 - 2016
Table 3.2: Estimated Mid-year Population by Age Group and Sex, period 2014 - 2016
2014 2015 # 2016 Leeftijdsklasse/ man vrouw/ totaal/ man vrouw/ totaal/ man vrouw/ totaal/
Age group Male Female Total Male Female Total Male Female Total
0-4 26,316 24,944 51,260 26,700 25,400 52,100 27,000 25,900 52,900
5-9 25,499 24,028 49,527 25,600 24,100 49,700 25,700 24,100 49,800
10-14 25,071 23,875 48,946 25,200 23,900 49,100 25,300 24,000 49,300
15-19 24,215 23,357 47,572 24,400 23,500 47,900 24,600 23,600 48,200
20-24 23,095 22,716 45,811 23,400 22,900 46,300 23,600 23,000 46,600
25-29 21,946 21,877 43,823 22,200 22,100 44,300 22,500 22,300 44,800
30-34 20,854 20,869 41,723 21,100 21,100 42,200 21,400 21,400 42,800
35-39 19,667 19,726 39,393 20,000 20,000 40,000 20,300 20,300 40,600
40-44 18,789 18,774 37,563 19,000 19,000 38,000 19,100 19,200 38,300
45-49 17,388 17,406 34,794 17,800 17,800 35,600 18,100 18,200 36,300
50-54 15,117 15,400 30,517 15,500 15,800 31,300 16,000 16,200 32,200
55-59 12,659 13,195 25,854 13,000 13,700 26,700 13,400 14,000 27,400
60-64 9,683 10,525 20,208 10,100 11,000 21,100 10,600 11,500 22,100
65-69 7,147 8,149 15,296 7,400 8,400 15,800 7,600 8,800 16,400
70-74 5,120 6,119 11,239 5,300 6,300 11,600 5,400 6,600 12,000
75-79 3,368 4,259 7,627 3,400 4,400 7,800 3,500 4,500 8,000
80+ 3,137 4,483 7,620 3,200 4,600 7,800 3,300 4,700 8,000
Total / Total 279,071 279,702 558,773 283,300 284,000 567,300 287,400 288,300 575,700 Bron : Algemeen Bureau voor de Statistiek Source: General Bureau of Statistics

25
Grafiek 3.1: Geschatte (mid-jaarlijkse) bevolking naar leeftijdsklasse en geslacht, 2016 Graph 3.1: Estimated Mid-year Population by Age Group and Sex, 2016
-30000 -20000 -10000 0 10000 20000 30000
00-04
05-09
10-14
15-19
20-24
25-29
30-34
35-39
40-44
45-49
50-54
55-59
60-64
65-69
70-74
75-79
80+
man/Male vrouw/Female

26
Tabel 3.3: Leeftijdspecifiek vruchtbaarheidscijfer, Algemeen vruchtbaarheidscijfer, Totaal vruchtbaarheidscijfer en Bruto vervangingsfactor, 2010 - 2016
Table 3.3: Age Specific Fertility Rate, General Fertility Rate, Total Fertility Rate
and Gross Reproduction Rate, 2010- 2016
Leeftijdsgroep moeder/ Age Group of the Mother
Leeftijdspecifiek vruchtbaarheidscijfer / Age Specific Fertility Rate
2010 2011 2012 2013 2014 2015 2016*
15 - 19 63.51 59.91 63.49 60.71 59.51 61.10 61.41
20 - 24 118.50 115.25 118.75 117.61 116.35 114.96 107.98
25 - 29 130.50 125.52 130.23 123.26 131.01 121.17 113.34
30 - 34 83.27 88.88 97.39 96.26 102.26 97.11 96.26
35 - 39 49.97 49.66 55.42 50.07 51.00 50.91 53.59
40 - 44 14.33 14.45 16.26 16.71 14.70 14.12 14.39
GFR 79.13 77.81 82.54 79.32 81.73 # 78.91 76.18
TFR 2.30 2.27 2.41 2.32 2.37 2.33 2.23
GRR 1.15 1.15 1.18 1.14 1.19 # 1.17 1.07 GFR = General Fertility Rate TFR = Total Fertility Rate GRR = Gross Reproduction Rate Bron: Algemeen Bureau voor de Statistiek, Bevolkingsstatistieken) Source: General Bureau of Statistics, Population Statistics
27
Tabel 3.4 : Belangrijke bevolkingsstatistieken naar geslacht, 2011 - 2016
Table 3.4 : Relevant Vital Statistics by Sex, 2011 - 2016
2011
2012
2013
Man/ Vrouw/ Man/ Vrouw/ Man/ Vrouw/ Male Female Male Female Male Female
Bevolking (midjaarlijks)/ Mid-Year Population 279,388 271,802 270,629 1) 271,009 1) 274,859 275,363
Geboorten/ Births 4,932 4,771 5,213 5,004 5,119 4,893
Overledenen/ Deaths 2,009 1,432 2,059 1,628 2,036 1,521
Immigratie/ Immigration 2,626 2,291 2,325 1,959 2,283 1,870 Emigratie/ Emigration 945 1,098 875 928 821 850 Huwelijken/ Marriages/ 2,337 2,337 2,204 2,204 2,190 2,190
Echtscheidingen/ Divorces 488 488 528 528 602 602
2014
2015
2016
Man/ Vrouw/ Man/ Vrouw/ Man/ Vrouw/ Male Female Male Female Male Female
Bevolking (midjaarlijks)/ Mid-Year Population 279,071 279,702 283,259 284,032 287,422 288,341
Geboorten/ Births 5,229 5,178 5,063 5,085 5,167 4,743
Overledenen/ Deaths 2,111 1,627 2,037 1,626 2,017 1,574
Immigratie/ Immigration 2,294 1,690 2,572 2,202 1,723 1,553 Emigratie/ Emigration 812 797 . . . . Huwelijken/ Marriages 2,143 2,143 2,010 2,010 2,125 2,125
Echtscheidingen/ Divorces 778 778 733 733 636 636
1) Census 8 data Noot / Note: De emigratie cijfers betreffen slechts het migratie verkeer tussen Nederland en Suriname/ The emigration figures refer only to the migration between the Netherlands and Suriname Bron : Midjaarlijkse Bevolking(MJB): ABS – Bevolkingsstatistieken, overige cijfers - CBB Source : Midyear Population (MYP): GBS – Population Statistics, Other Data- CBB

28
Tabel 3.5 : Demografische indicatoren naar geslacht, 2011 - 2016
Table 3.5 : Demographic Indicators by Sex, 2011 – 2016
Jaren / Years 2011 2012 2013 2014 2015 2016*
Gemiddelde leeftijd bij overlijden/ Mean Age at Death:
Man/Male 58.1 59.5 58.28 60.1 60.3 59.33Vrouw/Female 62.7 63.73 63.14 64.1 64.4 63.72
Zuigelingen sterfte1) (per 1000 levend-geborenen)/ Infant Mortality Rate1) (per1000 Live Births) 15.1 14.6 16.78 15.7 14.7
17.15
Perinatale sterfte1) (per 1000 levendgeborenen)/ Perinatal Mortality Rate1) (per1000 Live Births) 27.1 . . . . .
Gemiddelde leeftijd bij gesloten huwelijken/
Mean Age of contracted marriages Man/Male 35.0 35.7 35.8 35.4 35.1 35.99
Vrouw/Female 30.7 31.4 31.3 31.1 31.1 31.87
Gemiddelde Huwelijksduur in jaren bij echtscheidingen/verstoting/ Mean Marriage Duration in years for Divorces/Annulments 11.5 11.9 12.2 12.1 12.1
12.37
Centrummaat voor leeftijd van vrouwen bij geboorte 1e kind /
Average age of women at first birth Gemiddelde leeftijd/Mean Age 23.6 # 23.07 23.3 # 23.95 # 23.87 24.22
Mediane leeftijd/Median Age 22.7 22.2 22.61 # 22.97 # 22.95 23.29
Sex ratio bij geboorte/ Sex ratio at Birth 103.4 104.2 104.6 101.0 99.6 108.94 1) Volgens doodsoorzakenformulieren gecorrigeerd voor ziekenhuissurveillance / According to Death forms corrected
for hospital Surveillance Bron : Bewerkte CBB data en BOG mortaliteits data Source : Processed data from the Civil Registry Office and Mortality Data from Bureau of Public
Health

29
Tabel 3.6: Totaal aantal levend geboorten naar geboorte gewicht, 2013 – 2016 Table 3.6: Total Number of Live Births by Birth Weight, 2013 – 2016
Gewicht van het kind/ Weight by Child 2013# 2014# 2015# 2016
<1000 72 63 132 80
1000 - 1499 100 126 117 105
1500 - 1999 237 209 296 229
2000 - 2499 856 882 891 846
2500 - 2999 2,694 2,869 2,862 2,882
3000 - 3499 3,392 3,676 3,599 3,469
3500 - 3999 1,465 1,592 1,460 1,480
>4000 296 292 271 293
Onbekend/ Unknown 62 15 31 41
Totaal / Total 9,174 9,724 9,659 9,385
Gemiddelde gewicht /
Mean Weight 3,032 3,041 3,000 3,027 Bron: Demografische Data, afdeling Bevolkingsstatistieken Source: Demographic Data, Population Statistics Section

30
Tabel 3.7a: Levendgeborenen naar leeftijdsgroep van de moeder, 2005 - 2016
Table 3.7a: Live Births by Age Group of the Mother, 2005 - 2016
Leeftijdsgroep van de moeder/
Age Group of the Mother
Jaar / Year
2005 2006 2007 2008 2009 2010 <15 67 64 65 48 62 59
15 - 19 1,368 1,384 1,485 1,490 1,454 1,420 20 - 24 2,476 2,783 2,818 2,853 2,744 2,622 25 - 29 2,142 2,302 2,487 2,713 2,544 2,743 30 - 34 1,576 1,645 1,716 1,728 1,670 1,651 35 - 39 814 863 943 981 941 941 40 - 44 188 224 243 258 268 248
>45 26 20 12 26 17 16 Onbekend / Unknown - 26 - - 92 12
Totaal / Total 8,657 9,311 9,769 10,097 9,792 9,712
Leeftijdsgroep van de moeder/
Age Group of the Mother
Jaar / Year
2011 2012 2013 2014 2015 2016 <15 44 68 46 66 41 42
15 - 19 1,373 1,354 1,359 1,390 1,435 1,408 20 - 24 2,590 2,633 2,640 2,643 2,630 2,486 25 - 29 2,676 2,897 2,656 2,866 2,680 2,53330 - 34 1,790 1,923 1,976 2,134 2,052 2,05935 - 39 949 1,007 971 1,006 1,019 1,088 40 - 44 256 304 309 276 268 276
>45 15 18 19 13 23 18 Onbekend / Unknown 10 13 36 13 - -
Totaal / Total 9,703 10,217 10,012 10,407 10,148 9,910 Bron : Centraal Bureau voor Burgerzaken Source: Civil Registry Office
Tabel 3.7b: Aantal levendgeborenen uit niet residerende moeders, 2005 - 2016
Table 3.7b: Number of Live Births from Non Resident Mothers, 2005 - 2016
Jaar / Year 2005 2006 2007 2008 2009 2010 Aantal levendgeborenen / Number of Live Births 227 321 477 491 34 85 Jaar / Year 2011 2012 2013 2014 2015 2016 Aantal levendgeborenen / Number of Live Births 59 63 73 163 204 232 Bron : Centraal Bureau voor Burgerzaken Source: Civil Registry Office

31
Tabel 3.8a : Levendgeborenen naar leeftijdsgroep en woondistrict van de moeder, 2013 en 2014
Table 3.8a : Live Births by Age Group and District of Residence of the Mother,
2013 and 2014
20131) Leeftijdsgroep / Age Group
District/ District < 15 15 - 19 20 - 24 25 - 29 30 - 34 35 - 39 40 - 44 45 +
Onbek/ Unkn.
Totaal/Total
Paramaribo 12 513 1,159 1,269 944 437 117 9 2 4,462
Wanica 8 292 677 637 446 214 54 2 - 2,330
Nickerie 1 75 129 109 64 32 13 1 1 425
Coronie - 12 7 6 13 2 5 - - 45
Saramacca - 38 67 80 48 25 4 - 1 263
Commewijne 5 59 146 127 102 36 17 1 - 493
Marowijne 1 44 76 58 45 43 16 - 1 284
Para 3 100 121 124 93 47 17 2 - 507
Brokopondo 3 78 90 89 61 35 15 1 8 380
Sipaliwini 13 130 154 145 148 96 47 1 16 750
Totaal/Total 46 1,341 2,626 2,644 1,964 967 305 17 29 9,939
20142) Leeftijdsgroep / Age Group
District/ District < 15 15 - 19 20 - 24 25 - 29 30 - 34 35 - 39 40 - 44 45 +
Onbek/ Unkn.
Totaal/Total
Paramaribo 12 532 1133 1305 994 440 114 11 - 4,541
Wanica 9 272 616 699 501 202 53 5 - 2,357
Nickerie 6 70 130 131 79 33 6 - - 455
Coronie - 17 11 19 17 9 - - - 73
Saramacca - 41 74 68 44 20 9 2 - 258
Commewijne 3 62 152 121 96 44 7 1 - 486
Marowijne 3 51 74 58 50 36 10 1 - 283
Para 5 92 165 171 134 60 12 1 - 640
Brokopondo 7 67 94 100 72 41 16 4 - 401
Sipaliwini 18 156 153 149 120 109 44 1 - 750
Totaal/Total 66 1,390 2,643 2,866 2,134 1,006 276 26 - 10,244
1) Exclusief levendgeborenen uit niet residerende moeders: 73/Exclusive of Live Births from Non Resident Mothers: 73 2) Exclusief levendgeborenen uit niet residerende moeders: 163/Exclusive of Live Births from Non Resident Mothers:163
Bron : Centraal Bureau voor Burgerzaken Source: Civil Registry Office

32
Tabel 3.8b : Levendgeborenen naar leeftijdsgroep en woondistrict van de moeder, 2015 en 2016
Table 3.8b : Live Births by Age Group and District of Residence of the mother,
2015 and 2016
20153)
Leeftijdsgroep / Age Group District/ District < 15 15 - 19 20 - 24 25 - 29 30 - 34 35 - 39 40 - 44 45 +
Totaal/ Total
Paramaribo 10 508 1,075 1,195 919 465 118 14 4,304 Wanica 3 303 668 675 468 213 49 - 2,379 Nickerie 1 69 135 104 76 29 12 - 426 Coronie - 7 5 5 9 3 - - 29
Saramacca 1 33 65 76 44 21 9 1 250 Commewijne 2 69 144 148 95 43 6 - 507 Marowijne 4 68 67 58 51 39 13 1 301
Para 1 96 171 129 123 62 10 1 593 Brokopondo 3 74 78 72 82 49 11 2 371
Sipaliwini 16 184 164 158 144 76 38 4 784
Totaal/Total 41 1,411 2,572 2,620 2,011 1,000 266 23 9,944
20164) Leeftijdsgroep / Age Group
District/ District < 15 15 - 19 20 - 24 25 - 29 30 - 34 35 - 39 40 - 44 45 +
Totaal/ Total
Paramaribo 10 541 1,014 1,104 951 468 103 3 4,194 Wanica 11 261 601 674 512 238 65 5 2,367 Nickerie 2 48 125 103 103 37 7 1 426 Coronie - 7 14 14 8 5 1 - 49
Saramacca - 41 66 61 35 22 8 - 233 Commewijne - 74 137 127 93 47 10 - 488 Marowijne 1 51 70 49 33 32 11 1 248
Para 4 114 141 129 111 60 17 3 579 Brokopondo 3 75 77 80 70 54 17 1 377
Sipaliwini 11 159 181 130 105 98 29 4 717
Totaal/Total 42 1,371 2,426 2,471 2,021 1,061 268 18 9,678 4) Exclusief levendgeborenen uit niet residerende moeders: 204 /Exclusive of Live Births from Non Resident Mothers:204 5) Exclusief levendgeborenen uit niet residerende moeders: 232 /Exclusive of Live Births from Non Resident Mothers: 232
Bron : Centraal Bureau voor Burgerzaken Source: Civil Registry Office

33
Tabel 3.9: Overledenen naar woondistrict en geslacht, 2013 – 2016
Table 3.9: Deaths by District of Residence and Sex, 2013 - 2016
20131)
20142)
Woondistrict / District of Residence
Man/ Male
Vrouw/ Female
Totaal/ Total
Man/ Male
Vrouw/ Female
Totaal/ Total
Paramaribo 927 743 1,670 979 778 1,757
Wanica 408 293 701 450 312 762
Nickerie 158 104 262 164 109 273
Coronie 19 10 29 13 9 22
Saramacca 87 51 138 80 64 144
Commewijne 131 100 231 129 105 234
Marowijne 53 35 88 63 47 110
Para 76 59 135 55 73 128
Brokopondo 36 31 67 47 33 80
Sipaliwini 82 66 148 79 76 155
Totaal/ Total # 1,977 # 1,492 # 3,469 2,059 1,606 3,665
20153)
20164) Woondistrict /
District of Residence Man/ Male
Vrouw/ Female
Totaal/ Total
Man/ Male
Vrouw/ Female
Totaal/ Total
Paramaribo 964 840 1,804 979 809 1,788
Wanica 422 310 732 420 281 701
Nickerie 174 95 269 135 109 244
Coronie 12 10 22 17 10 27
Saramacca 68 43 111 70 43 113
Commewijne 128 104 232 73 64 137
Marowijne 38 33 71 127 87 214
Para 65 57 122 52 31 83
Brokopondo 34 33 67 25 29 54
Sipaliwini 81 79 160 74 85 159
Totaal/ Total 1,986 1,604 3,590 1,972 1,548 3,520
1) Exclusief de sterfte van niet residerenden: 88 /Exclusive of Deaths from Non Residents: 88
2) Exclusief de sterfte van niet residerenden: 73 /Exclusive of Deaths from Non Residents: 73
3) Exclusief de sterfte van niet residerenden: 73/Exclusive of Deaths from Non Residents: 73
4) Exclusief de sterfte van niet residerenden: 71 /Exclusive of Deaths from Non Residents: 71
Bron : Centraal Bureau voor Burgerzaken Source: Civil Registry Office

34
Tabel 3.10a : Overledenen naar leeftijdsgroep, woondistrict en geslacht, 20131)
Table 3.10a : Deaths by Age Group, District of Residence and Sex, 20131)
Paramaribo
Wanica
Nickerie
Coronie
Saramacca
Commewijne
Leeftijdsgroep/ M/ V/ M/ V/ M/ V/ M/ V/ M/ V/ M/ V/ Age Group M F M F M F M F M F M F
0 - 4 49 46 27 18 5 3 - - 6 4 4 45 - 9 2 4 1 1 1 - - - - - 1 2 10 - 14 5 2 4 - 2 - - - - 1 1 2 15 - 19 13 10 6 5 4 - - - 3 1 - 1 20 - 24 24 8 12 5 3 1 1 - 2 1 1 - 25 - 29 23 20 7 6 3 3 - - 1 1 2 1 30 - 34 24 19 10 5 10 2 - - 4 - - - 35 - 39 35 17 18 8 4 3 - 1 1 - 4 1 40 - 44 38 22 21 13 12 4 2 - 6 2 8 2 45 - 49 62 22 30 16 8 2 4 - 3 1 7 5 50 - 54 62 37 37 16 18 6 2 1 5 2 12 8 55 - 59 68 47 28 21 13 8 1 - 5 4 7 460 - 64 77 48 28 13 11 5 3 - 9 4 11 965 - 69 89 64 34 33 15 9 2 2 10 5 14 8 70 - 74 87 64 39 41 16 6 - - 7 8 12 15 75 -79 91 95 48 35 7 14 2 1 9 5 15 13
80+ 178 218 58 57 26 38 2 5 16 12 32 25
Totaal/ Total 927 743 408 293 158 104 19 10 87 51 131 100
Marowijne
Para
Brokopondo
Sipaliwini Totaal/Total
Totaal/
Leeftijdsgroep/ M/ V/ M/ V/ M/ V/ M/ V/ M/ V/ Total Age Group M F M F M F M F M F
0 - 4 3 1 1 3 2 6 14 6 111 91 202 5 - 9 - - - - 1 - 2 - 8 7 15 10 - 14 - - - - 1 - 2 - 15 5 20 15 - 19 - - 1 2 - 1 - 2 27 22 49 20 - 24 - - 3 2 1 - 2 1 49 18 67 25 - 29 2 - - 1 3 1 1 1 42 34 76 30 - 34 1 - 5 2 3 1 1 2 58 31 89 35 - 39 1 - 2 3 4 4 4 1 73 38 111 40 - 44 2 2 3 2 2 1 3 2 97 50 147 45 - 49 3 - 1 6 2 - 2 1 122 53 175 50 - 54 3 2 8 2 3 2 2 4 152 80 232 55 - 59 2 3 7 1 3 1 4 4 138 93 231 60 - 64 8 2 4 1 - 3 4 2 155 87 242 65 - 69 4 6 6 3 2 3 6 7 182 140 322 70 - 74 6 5 9 6 3 4 7 6 186 155 341 75 – 79 4 7 13 4 3 1 11 5 203 180 383
80+ 14 7 13 21 3 3 17 22 359 408 767
Totaal/Total 53 35 76 59 36 31 82 66 1,977 1,492 3,469
1) Exclusief de sterfte van niet residerenden : 88 /Exclusive of Deaths from Non Residents: 88 Bron : Centraal Bureau voor Burgerzaken Source: Civil Registry Office

35
Tabel 3.10b: Overledenen naar leeftijdsgroep, woondistrict en geslacht, 20141)
Table 3.10b: Deaths by Age Group, District of Residence and Sex, 20141)
Paramaribo
Wanica
Nickerie
Coronie
Saramacca
Commewijne
Leeftijdsgroep/ M/ V/ M/ V/ M/ V/ M/ V/ M/ V/ M/ V/ Age Group M F M F M F M F M F M F
0 - 4 49 38 28 21 1 3 1 - 1 1 5 45 - 9 4 3 2 - 1 - - - - - - 1 10 - 14 11 3 1 3 1 1 - - - - - - 15 - 19 6 4 3 4 3 - - - 2 1 2 - 20 - 24 8 4 3 4 1 3 - - 3 1 1 1 25 - 29 21 17 11 7 6 5 - - 1 1 3 2 30 - 34 23 23 14 5 4 2 - - 2 1 4 1 35 - 39 30 21 4 7 4 - - - 2 1 1 4 40 - 44 39 25 19 13 4 3 - - 2 1 6 4 45 - 49 54 39 22 20 10 3 - - 4 1 8 6 50 - 54 90 35 39 19 14 3 2 2 7 5 5 - 55 - 59 79 51 39 24 12 12 2 - 6 4 21 760 - 64 77 59 47 19 15 8 1 - 8 2 16 1565 - 69 85 61 45 30 16 11 1 - 5 11 14 8 70 - 74 73 75 51 33 18 10 1 2 7 9 8 13 75 - 79 112 79 52 35 13 10 1 - 11 10 17 18
80+ 218 241 70 68 41 35 4 5 19 15 18 21 Totaal/Total 979 778 450 312 164 109 13 9 80 64 129 105
Marowijne
Para
Brokopondo
Sipaliwini
Totaal/Total
Totaal/
Leeftijdsgroep/ M/ V/ M/ V/ M/ V/ M/ V/ M/ V/ Total Age Group M F M F M F M F M F
0 - 4 6 2 4 7 5 2 14 5 114 83 197 5 - 9 - - 2 - 1 - 1 - 11 4 15 10 - 14 - - 1 2 - - 1 - 15 9 24 15 - 19 1 - 1 1 1 1 2 3 21 14 35 20 - 24 1 2 3 - 1 1 3 - 24 16 40 25 - 29 1 - 2 - 4 - 2 1 51 33 84 30 - 34 5 - 1 3 3 1 1 - 57 36 93 35 - 39 - 1 1 4 4 1 2 3 48 42 90 40 - 44 3 1 1 1 4 2 1 1 79 51 130 45 - 49 1 3 6 3 3 1 6 4 114 80 194 50 - 54 5 5 3 3 2 - 1 2 168 73 24155 - 59 6 1 4 7 2 2 3 2 174 110 284 60 - 64 1 3 3 3 4 4 4 3 176 116 292 65 - 69 4 2 2 5 3 - 7 4 182 132 314 70 - 74 9 9 5 4 2 3 8 6 182 164 346 75 - 79 8 5 4 8 5 4 6 13 229 182 411
80+ 12 13 12 22 3 11 17 29 414 461 875
Totaal/Total 63 47 55 73 47 33 79 76 2,059 1,606 3,665
1) Exclusief de sterfte van niet residerenden : 73 /Exclusive of Deaths from Non Residents: 73
Bron : Centraal Bureau voor Burgerzaken Source: Civil Registry Office
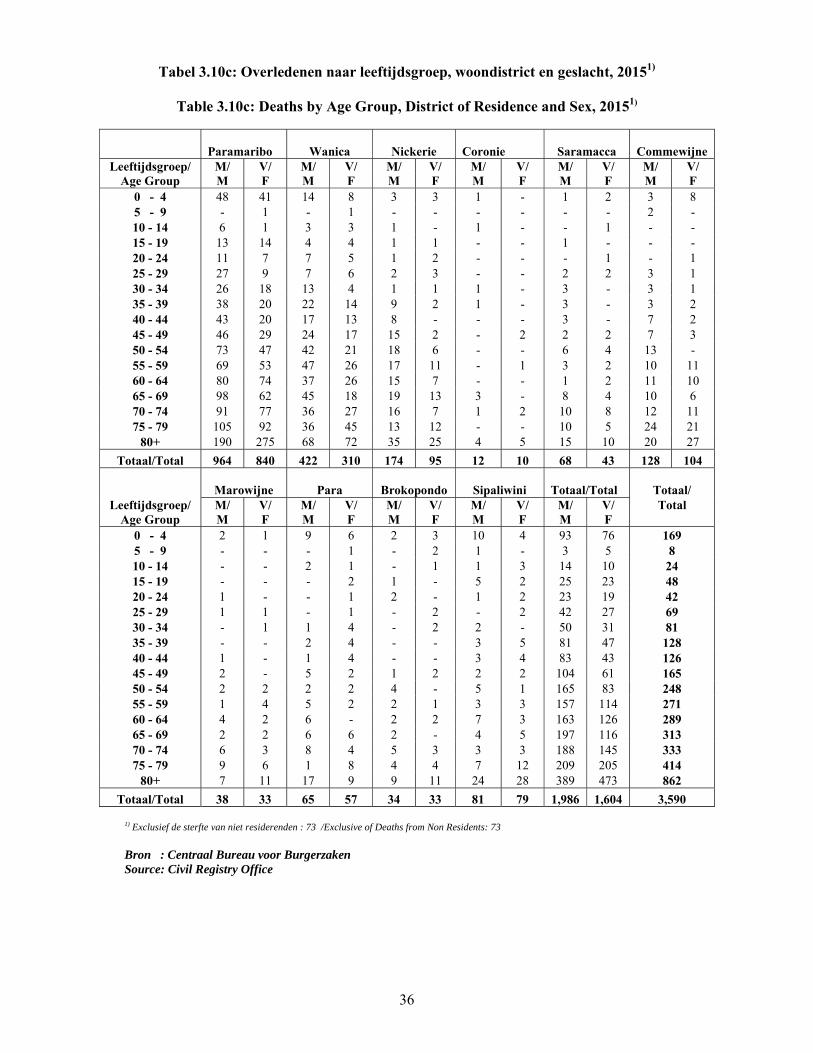
36
Tabel 3.10c: Overledenen naar leeftijdsgroep, woondistrict en geslacht, 20151)
Table 3.10c: Deaths by Age Group, District of Residence and Sex, 20151)
Paramaribo
Wanica
Nickerie
Coronie
Saramacca
Commewijne
Leeftijdsgroep/ M/ V/ M/ V/ M/ V/ M/ V/ M/ V/ M/ V/ Age Group M F M F M F M F M F M F
0 - 4 48 41 14 8 3 3 1 - 1 2 3 85 - 9 - 1 - 1 - - - - - - 2 - 10 - 14 6 1 3 3 1 - 1 - - 1 - - 15 - 19 13 14 4 4 1 1 - - 1 - - - 20 - 24 11 7 7 5 1 2 - - - 1 - 1 25 - 29 27 9 7 6 2 3 - - 2 2 3 1 30 - 34 26 18 13 4 1 1 1 - 3 - 3 1 35 - 39 38 20 22 14 9 2 1 - 3 - 3 2 40 - 44 43 20 17 13 8 - - - 3 - 7 2 45 - 49 46 29 24 17 15 2 - 2 2 2 7 3 50 - 54 73 47 42 21 18 6 - - 6 4 13 - 55 - 59 69 53 47 26 17 11 - 1 3 2 10 1160 - 64 80 74 37 26 15 7 - - 1 2 11 1065 - 69 98 62 45 18 19 13 3 - 8 4 10 6 70 - 74 91 77 36 27 16 7 1 2 10 8 12 11 75 - 79 105 92 36 45 13 12 - - 10 5 24 21
80+ 190 275 68 72 35 25 4 5 15 10 20 27
Totaal/Total 964 840 422 310 174 95 12 10 68 43 128 104
Marowijne
Para
Brokopondo
Sipaliwini Totaal/Total
Totaal/
Leeftijdsgroep/ M/ V/ M/ V/ M/ V/ M/ V/ M/ V/ Total Age Group M F M F M F M F M F
0 - 4 2 1 9 6 2 3 10 4 93 76 169 5 - 9 - - - 1 - 2 1 - 3 5 8 10 - 14 - - 2 1 - 1 1 3 14 10 24 15 - 19 - - - 2 1 - 5 2 25 23 48 20 - 24 1 - - 1 2 - 1 2 23 19 42 25 - 29 1 1 - 1 - 2 - 2 42 27 69 30 - 34 - 1 1 4 - 2 2 - 50 31 81 35 - 39 - - 2 4 - - 3 5 81 47 128 40 - 44 1 - 1 4 - - 3 4 83 43 126 45 - 49 2 - 5 2 1 2 2 2 104 61 165 50 - 54 2 2 2 2 4 - 5 1 165 83 248 55 - 59 1 4 5 2 2 1 3 3 157 114 271 60 - 64 4 2 6 - 2 2 7 3 163 126 289 65 - 69 2 2 6 6 2 - 4 5 197 116 313 70 - 74 6 3 8 4 5 3 3 3 188 145 333 75 - 79 9 6 1 8 4 4 7 12 209 205 414
80+ 7 11 17 9 9 11 24 28 389 473 862
Totaal/Total 38 33 65 57 34 33 81 79 1,986 1,604 3,590
1) Exclusief de sterfte van niet residerenden : 73 /Exclusive of Deaths from Non Residents: 73
Bron : Centraal Bureau voor Burgerzaken Source: Civil Registry Office

37
Tabel 3.10d: Overledenen naar leeftijdsgroep, woondistrict en geslacht, 20161)
Table 3.10d: Deaths by Age Group, District of Residence and Sex, 20161)
Paramaribo
Wanica
Nickerie
Coronie
Saramacca
Commewijne
Leeftijdsgroep/ M/ V/ M/ V/ M/ V/ M/ V/ M/ V/ M/ V/ Age Group M F M F M F M F M F M F
0 - 4 56 45 27 15 2 2 2 - 1 1 4 15 - 9 3 7 1 1 - - - - 1 - - 1 10 - 14 2 1 - 1 - - - - - - - 1 15 - 19 12 12 6 2 - - - - 2 - 1 2 20 - 24 16 15 7 2 4 - - - 1 1 - - 25 - 29 21 13 14 6 2 - - - 2 1 1 1 30 - 34 25 19 14 9 3 2 - - 1 - 6 5 35 - 39 32 10 11 12 5 3 - - 4 1 1 3 40 - 44 41 25 14 9 2 3 - - 3 1 3 2 45 - 49 49 23 23 15 7 6 - - 6 2 5 3 50 - 54 69 47 42 16 9 10 - - 8 3 18 3 55 - 59 92 54 53 21 15 7 1 4 7 4 8 760 - 64 97 59 44 18 19 7 1 1 7 2 13 865 - 69 89 64 35 26 13 9 1 1 6 2 8 6 70 - 74 97 75 28 34 15 16 3 2 7 4 10 10 75 - 79 92 100 34 38 13 15 - - 6 5 11 17
80+ 186 240 67 56 26 29 9 2 8 16 38 17
Totaal/Total 979 809 420 281 135 109 17 10 70 43 127 87
Marowijne
Para
Brokopondo
Sipaliwini Totaal/Total
Totaal/
Leeftijdsgroep/ M/ V/ M/ V/ M/ V/ M/ V/ M/ V/ Total Age Group M F M F M F M F M F
0 - 4 3 - 4 8 2 3 7 6 108 81 189 5 - 9 - - 1 1 - - 1 - 7 10 17 10 - 14 1 1 2 1 - - - 1 5 6 11 15 - 19 1 - - 3 - - 1 1 23 20 43 20 - 24 - - 3 3 - - 3 0 34 21 55 25 - 29 3 - 2 1 1 1 4 1 50 24 74 30 - 34 3 1 - 2 - 1 5 1 57 40 97 35 - 39 2 2 - 2 5 1 2 2 62 36 98 40 - 44 1 1 2 1 3 4 2 2 71 48 119 45 - 49 5 3 1 - 1 1 4 2 101 55 156 50 - 54 5 1 4 5 - 1 6 2 161 88 249 55 - 59 4 4 7 5 3 - 2 5 192 111 303 60 - 64 5 1 6 1 2 2 7 3 201 102 303 65 - 69 2 5 5 3 2 1 3 8 164 125 289 70 - 74 6 3 7 6 - 3 6 4 179 157 336 75 - 79 5 2 7 4 3 5 10 13 181 199 380
80+ 6 7 22 18 3 6 11 34 376 425 801
Totaal/Total 52 31 73 64 25 29 74 85 1,972 1,548 3,520
1) Exclusief de sterfte van niet residerenden : 71 /Exclusive of Deaths from Non Residents: 71
Bron : Centraal Bureau voor Burgerzaken Source: Civil Registry Office

38
Tabel 3.11 : De bevolking in de gezinshuishoudens in de districten Paramaribo en Wanica naar etnische groep en geloofsovertuiging, 2014 – 2016
Table 3.11: The Population in the Households in the Districts of Paramaribo and Wanica by
Ethnic Group and Religion, 2014 – 2016
Geloofsovertuiging / Religion Etnische groep/ Ethnic group
Jaar / Year
Christen/ Christian
Hindoe/ Hindu
Moslim/Muslim
Andere/ Other
Geen religie+ Onbekend / No Religion + Unknown
Totaal/Total
Inheems/ # 2014 4,153 107 303 61 72 4,696 Indigenous 2015 4,158 78 386 7 388 5,017 2016 4,699 37 16 139 - 4,891 Marron (boslandcreool)/ # 2014 49,864 40 339 1,797 5,934 57,974 Marroon 2015 47,563 155 266 3,853 6,988 58,825 2016 51,056 23 126 3,046 4,016 58,267 Creool / Creole (Negro) # 2014 72,030 118 296 1,369 1,364 75,177 2015 72,987 140 267 718 2,062 76,174 2016 72,109 110 227 1,520 1,710 75,676 Hindostaan / Hindustani # 2014 10,125 82,144 17,998 237 353 110,857 2015 9,133 85,735 17,179 79 720 112,846 2016 8,944 86,868 16,239 99 485 112,635 Javaan / Javanese # 2014 12,177 426 32,307 1,503 1,103 47,516 2015 15,226 930 27,989 1,299 2,038 47,482 2016 12,243 328 29,571 2,818 2,149 47,109 Chinees / Chinese # 2014 1,210 9 16 668 3,308 5,211 2015 1,347 32 46 14 4,173 5,612 2016 942 37 - 518 3,155 4,652 Gemengd / Mixed # 2014 48,130 2,444 4,171 1,015 1,932 57,692 2015 47,392 3,131 2,893 1,206 3,656 58,278 2016 49,097 2,101 3,173 1,185 2,621 58,177 Overige / Other # 2014 4,051 156 23 167 638 5,035 2015 2,348 57 397 821 1,435 5,058 2016 4,054 59 120 316 477 5,026 Onbekend / Unknown # 2014 104 - - - 41 145 2015 22 19 - - 15 56 2016 8 - - - 26 34 Totaal / Total # 2014 201,844 85,444 55,453 6,817 14,745 364,303 2015 200,176 90,277 49,423 7,997 21,475 369,348 2016 203,152 89,563 49,472 9,641 14,639 366,467
Bron : Algemeen Bureau voor de Statistiek, afdeling Huishoudonderzoeken Source : General Bureau of Statistics, Section of Houshold Surveys

39
TRANSPORT en
VERKEER
TRANSPORT and
TRAFFIC

40
4. Transport en Verkeer Het aantal aangekomen en vertrokken personen via de Johan Adolf Pengel Luchthaven vertonen vanaf het jaar 2006 tot en met 2015 een stijgende lijn; deze cijfers daalden ietwat in 2016. . Tabel 4.2 laat zien hoeveel vracht via de havens / kades, Suriname is binnen gebracht of uit Suriname is verzonden. Vergelijken we de cijfers vanaf 2010, dan zien wij dat zowel de totale import, als de totale export een daling vertoont tot en met 2016. De sterkste daling is geregistreerd in de periode 2015 naar 2016. Het totale aantal afgehandelde schepen betrokken bij de internationale scheepvaart te Paramaribo vertoont een daling als we de data van 2014 (1,175 schepen) met 2016 (899 schepen) vergelijken. Over het algemeen zien we dat het totale aantal verzekerde motorvoertuigen op de openbare weg van 2014 vergeleken met 2015 is gedaald. In 2016 nam dit cijfer weer toe. Alleen in de categorie “personenauto’s” zien we een stijgende trend van 2014 tot en met 2016. Het aantal sterfgevallen ten gevolge van verkeersongevallen is vanaf het jaar 2010 tot en met 2015 afgenomen van 87 naar 59. Jammergenoeg zien we in 2016 een stijging van het aantal verkeersdoden naar 74. (In 2017 is dit cijfer nog meer gestegen, naar 84.)
4. Transport and Traffic The number of arrivals and departures via the Johan Adolf Pengel Airport show an upward trend from 2006 up to 2015; these figures fell somewhat in 2016. Table 4.2 shows the amounts of cargo brought or sent out via Suriname’s ports / docks . If we compare the figures as of 2010 , we see that both, total imports as total exports show a decline up to 2016. The strongest decline has been registered in the period 2015 to 2016. The total number of dispatched ships involved in international shipping in Paramaribo shows a decrease when we compare the 2014 data (1,175 vessels) with 2016 (899 vessels). Overall, we see that the total number of Insured Vehicles on the Public Roads decreased when comparing 2014 to 2015. This figure increased in 2016. Only the category “passenger cars” shows an increase from 2014 up to 2016. The number of deaths from traffic accidents has decreased from 87 to 59 from the year 2010 to 2015. Unfortunately, in 2016 we see an increase in the number of fatalities to 74. (In 2017 this figure increased even more to 84.)

41
Tabel 4.1 : Totaal aantal aangekomen en vertrokken personen en luchtvracht naar soort via J.A.P. luchthaven, 1990 - 2016
Table 4.1: Annual Number of Arrivals and Departures and Air Freight by Type via
J.A.P. Airport, 1990 - 2016
Jaar/ Year
Personen/ Passengers Vracht/ Cargo (x 1000 kg) Post/ Mail (x 1000 kg) Aangekomen/
Arrivals Vertrokken/ Departures
Aangevoerd/ Supplied
Verzonden/ Dispatched
Aangevoerd/ Supplied
Verzonden/ Dispatched
1990 97,178 105,429 2,150 2,313 96 204
1991 103,747 111,571 2,076 2,810 87 182
1992 92,141 97,857 2,109 2,610 234 87
1993 65,402 70,961 2,011 2,910 94 78
1994 68,221 72,952 2,007 3,601 97 45
1995 83,671 87,117 2,299 3,495 101 42
1996 89,438 91,151 2,539 2,274 120 43
1997 104,828 105,079 . . . .
1998 113,135 115,085 . . . .
1999 112,368 113,801 . . . .
2000 119,115 121,905 2,471 3,964 119 41
2001 118,338 117,250 2,441 3,761 229 41
2002 129,135 128,135 . 3,505 576 45
2003 142,473 142,751 . 4,042 142 38
2004 149,589 148,353 3,765 3,811 100 80
2005 169,869 165,550 3, 273 3,807 132 56
2006 160,314 151,166 . . . .
2007 180,749 179,723 . . . .
2008 187,334 190,292 . . . .
2009 195,159 192,832 . . . .
2010 204,141 201,225 . . . .
2011 211,993 209,312 . . . .
2012# 215,990 214,111 . . . .
2013# 230,635 229,839 . . . .
2014# 230,787 230,647 . . . .
2015# 243,429 243,411 . . . .
2016 242,524 238,423 . . . . Bron : Ministerie van Transport, Communicatie en Toerisme, Stichting Toerisme (1990 - 2011); Luchthavenbeheer (vanaf 2012) Source: Ministry of Transport, Communication and Tourism, Tourism Foundation (1990 - 2011); Airport Management (Since 2012)

42
Tabel 4.2 : De jaarlijkse hoeveelheid ingevoerde en uitgevoerde vracht (x 1.000 ton) naar haven/kade, 2000 - 2016
Table 4.2: Annual Quantity of Imported and Exported Freight
(x 1,000 ton) by Harbour/Quay, 2000 - 2016
Haven, Kade / Harbour, Quay Jaar/ Year
Paramaribo en / and Paranam
Nickerie
Totaal/ Total
Import Export Import Export Import Export
2000 1,106 2,157 14 29 1,120 2,186
2001 1,200 2,283 12 23 1,212 2,306
2002 1,185 2,138 8 30 1,193 2,168
2003 1,317 2,174 8 22 1,325 2,196
2004 1,508 2,118 10 24 1,518 2,142
2005 1,961 2,201 7 12 1,968 2,213
2006 1,742 2,429 12 22 1,754 2,451
2007 1,861 2,566 7 25 1,868 2,591
2008 1,936 2,766 15 15 1,951 2,780
2009 1,689 2,120 14 16 1,703 2,136
2010 2,325 2,190 13 25 2,338 2,215
2011 2,112 2,140 20 5 2,132 2,145
2012 2,032 2,051 12 9 2,044 2,060
2013 1,996 1,974 17 24 2,013 1,998
2014 1,935 2,224 18 16 1,953 2,240
2015 1,802 1,803 15 13 1,817 1,816
2016 1,270 1,196 17 20 1,287 1,216 Bron : Ministerie van Transport, Communicatie en Toerisme, Maritieme Autoriteit Suriname Source: Ministry of Transport, Communication and Tourism, Maritime Authority Suriname

43
Tabel 4.3 : Het jaarlijkse aantal afgehandelde schepen betrokken bij de internationale scheepvaart naar haven/kade, 1990 - 2016
Table 4.3: Annual Number of Dispatched Ships Involved in International Shipping,
by Harbour/Quay, 1990 - 2016
Jaar/ Year
Haven, Kade / Harbour, Quay
Paramaribo Smalkalden Paranam Moengo Nickerie
1990 467 - 196 - 102
1991 482 1 180 - 114
1992 549 - 186 - 117
1993 471 - 180 2 121
1994 543 1 203 1 108
1995 532 2 204 1 111
1996 629 1 267 4 108
1997 646 3 235 3 120
1998 683 1 196 1 86
1999 724 - 198 - 82
2000 631 1 196 - 37
2001 659 - 187 - 25
2002 741 - - - 28
2003 742 - - - 28
2004 831 - - - 28
2005 856 - - - 14
2006 832 - - - 26
2007 831 - - - 26
2008 951 - - - 25
2009 939 - - - 46
2010 1,136 - - 17 52
2011 1,265 - - 2 44
2012 958 - - - 36
2013 1,010 . - 1 32
2014 1,175 . - 4 34
2015 967 . - 17 37
2016 899 . - 17 23 Bron : Ministerie van Transport, Communicatie en Toerisme, Maritieme Autoriteit Suriname Source : Ministry of Transport, Communication and Tourism, Maritime Authority Suriname

T
Ta
Soort moType
Ve
PersoPasse
VracL
Au
MotMo
BroM
TrTr
ToT
Bron : Source :
G
G
Tabel 4.4 : A
able 4.4: Nu
otorvoertuig/of Motor ehicle
onenauto/ enger Car
chtauto/
Lorry
utobus/ Bus
torfiets/ torbike
omfiets/
Moped
raktor/ ractor
otaal/
Total
Centrale BanCentral Bank
rafiek 4.1 :
Graph 4.1 : N
Vrachtau/Lorry, 34,
AutobuBus, 3,5
MoMo
Aantal verze
umber of In
/
2010
119,270
30,117
3,022
1,227
43,786
959
198,381
k van Surinamof Suriname
Aantal verz
Number of
uto 046
us / 590
otorfiets / otorbike, 1,798
ekerde mot
sured Moto
2011
124,994
31,386
3,229
1,308
44,149
986
206,052
me
zekerde mo
Insured MoBromfiets
Moped,40,708
orvoertuige
or Vehicles o
Jaa
2012
125,590 13
32,392 3
3,368 3
1,461
43,370 4
980
207,161 21
torvoertuig
otor Vehicle
s / , T
en op de ope
on Public R
ar / Year
2013 20
34,335 144
33,223 35
3,487 3,
1,535 1,
46,235 47
1,045 9
19,860 233
gen op de op
es on the Pu
Traktor / Tractor, 930
enbare weg,
Roads, 2010
014 201
4,789 146,1
,350 34,4
756 3,60
794 1,75
,056 41,5
978 980
3,723 228,3
penbare weg
ublic Roads,
Personenau/ Passenge
Car, 149,5
, 2010 - 201
– 2016
15 2016
110 149,56
434 34,046
08 3,590
52 1,798
504 40,708
0 930
388 230,63
g, 2016
, 2016
uto er
560
6
60
6
0
8
8
32

45
Tabel 4.5 : Aantal sterfgevallen ten gevolge van verkeersongevallen naar district, 2010 – 2017
Table 4.5: Number of Deaths due to Traffic Accidents by District,
2010 - 2017
District/ District
2010
2011
2012
2013
2014
2015
2016
2017
Paramaribo 36 25 29 28 20 19 24 21
Wanica 11 16 18 12 15 12 17 20
Nickerie 11 11 11 12 7 11 4 9
Coronie 7 5 2 1 - 1 - -
Saramacca 2 2 3 9 8 5 6 5
Commewijne 5 5 5 2 10 6 13 14
Marowijne 2 4 - 1 3 - 4 2
Para 11 11 10 8 4 2 4 9
Brokopondo - 6 4 2 4 3 1 4
Sipaliwini 2 1 - 1 - - 1 -
Totaal /Total 87 86 82 76 71 59 74 84
Bron : Ministerie van Justitie en Politie, afdeling Verkeersvoorlichting Source : Ministry of Justice and Police, Department of Traffic Information

Grafie
1
1
2
2
ek 4.2 : Aan
Graph 4.
0
5
10
15
20
25
ntal sterfgev
.2 : Number
vallen ten ge201
r of Deaths d201
evolge van v5 - 2017
due to Traf5 – 2017
verkeersong
ffic Acciden
gevallen naa
ts by Distric
ar district,
ct,
2015
2016
2017

47
ECONOMIE
ECONOMY

48
HS = Geharmoniseerd Systeem Harmonized System ASEAN = Associatie van Zuid Oost
Aziatische Landen Association of South East Asian Nations
Caricom = Caraïbische Gemeenschap Caribbean Community E.U. = Unie van Europese Staten European Union Mercosur = Gemeenschappelijke Markt van
Zuidamerikaanse Landen
Common Market of South America
Nafta
= Noordamerikaanse Vrijhandels Zone
North American Free Trade Agreement
SRD = Surinaamse Dollar
Surinamese Dollar

49
5. Economie 5. Economy Betalingsbalans (zie tabel 5.1) Bekijken we de cijfers van 2013 tot en met 2016, dan merken wij op, dat de betalingsbalans een neerwaartse trend vertoont; vanaf 2013 tot en met 2015 (US$ -148,8 mln.- US$ -265.8). In 2016 merken we een positieve ontwikkeling bij de betalingsbalans, namelijk een bedrag van US$ 79.4 mln. Handelsstatistieken De totale Import waarde, bekeken in tabel 5.4 daalde in 2014 t.o.v. 2013, terwijl wij in 2015 een stijging waarnemen. Als we de data van 2016 vergelijken met voorgaande jaren, dan merken we een daling bij zowel de totale importen als de exporten. Tabel 5.5a is een weergave van de importen uit de Caricom landen. Uit de totale waarden blijkt dat jaarlijks vanaf 2013 veel minder is geïmporteerd, vergeleken met 2016. Het meest wordt geïmporteerd uit Trinidad & Tobago (in 2014, 51.8% ; in 2015, 56.0%; in 2016, 67.7% ); uit St. Lucia (in 2014, 30.1%, in 2015, 21.5% en in 2016, 16.5%) . en uit Antigua ( in 2014, 8.0%, in 2015, 8.6% en in 2016, 6.5%). De vier belangrijkste goederengroepen in 2016 volgens het geharmoniseerd systeem zijn als volgt: Exporten: Parels, edelstenen, halfedelstenen, edele
metalen, bijouterie en munten Minerale producten Producten van het plantenrijk Hout, kurk en vlechtwerk
Importen: Machines,elektronische materiaal,
elektrische toestellen Minerale producten Chemische producten en aanverwante
industriëen Voedingswaren, dranken, tabak
Balance of Payments (see Table 5.1) Looking at the figures from 2013 till 2016, we notice that the balance of payments depicts a downward trend; from 2013 up to 2015 ( US$ 148.8 Million - US$ -265.8 Million). In 2016 we notice a positive development in the balance of payments, namely an amount of US $ 79.4 million. Trade Statistics The Total Import Value, as shown in table 5.4, decreased in 2014 compared to 2013, while we observed an increase in 2015. If we compare the data from 2016 with previous years, we notice a decrease in both total imports and exports. Table 5.5a shows, imports from CARICOM countries. From the Total Import Values becomes clear that annually since 2013 much less was imported compared with 2016. The figures show that the majority is imported from Trinidad & Tobago ( in 2014, 51.8%, in 2015, 56.0% and in 2016, 67.7%); from St. Lucia (in 2014, 30.1%, in 2015, 21.5% and in 2016, 16.5%) and from Antigua ( in 2014, 8.0%, in 2015, 8.6% and in 2016, 6.5%). The four main groups of goods in 2016 according to the harmonised system are as followed: Exports: Pearls, precious & semi-stones, precious
metals, imitation jewellery & coins Mineral Products Vegetable Products Wood, charcoal, cork, and art. thereof,
plaiting materials, basket- & wicker ware Imports: Machinery and appliances, electric
equipment Mineral Products Products of Chemical or allied Industries Foodstuffs, Beverages, Spirits, Tobacco
and Tobacco Substitutes.

50
Tabel 5.1 : Betalingsbalans in mln. US dollars, 2013 - 2016
Table 5.1 : Balance of Payments in Mln. US Dollars, 2013 - 2016
Omschrijving Jaar / Year Description 2013 2014 # 2015* 2016*
A. Lopende rekening: -196.0 - 416.4 - 798.2 -94.4 A. Current Account
Saldo goederen-, diensten- en inkomensrekening -262.6 -487.5 -863.5 -196.2
Balance on Goods, Services and Income
Saldo inkomensoverdrachten 66.6 71.2 65.3 101.8 Balance on Current Transfers
B.Vermogensoverdrachtenrekening 0.1 -0.4 1.3 19.4 B.Capital Account
Credit 0.1 0.1 1.3 19.4 Credit Debet 0.0 -0.5 0.0 0.0 Debit
C. Financiële rekening: 429.2 696.9 781.4 309.0 C. Financial Account
Totaal, A tot en met C (I) 233.3 280.1 -15.5 234.0 Total, A through C (I)
D. Statistische verschillen (II) -382.1 -430.3 -250.3 -154.6D. Net Errors and Omissions (II)
E.Financiërings items E. Financing Items (Internationale reserves) (I) + (II) -148.8 -150.2 -265.8 79.4 (Reserve Assets) (I) + (II)
Bron : Centrale Bank van Suriname Source: Central Bank of Suriname

51
Tabel 5.2: Bruto Binnenlands Product (BBP) en Bruto Nationaal Inkomen tegen basisprijzen, respectievelijk marktprijzen alsook het Nationaal Inkomen en het
Inkomen per Capita, 2013 - 2016
Table 5.2 : Gross Domestic Product (GDP) and Gross National Income at Basic Prices, Respectively at Market Prices as well as National Income and Income
per Capita, 2013 - 2016
Omschrijving/Description 2013 2014* # 2015* 2016* Bruto Binnenlands Product (basisprijzen)/ Gross Domestic Product (Basic Prices) # 15,542,259 15,891,496 14,905,191 19,109,822 Bruto Binnenlands Product (basisprijzen; 2007=100)/ Gross Domestic Product (Basis Prices; 2007=100) 9,156,481 # 9,159,420 8,958,968 8,172,499 Bruto Binnenlands Product (marktprijzen)/ Gross Domestic Product (Market Prices) # 16,980,663 17,294,421 16,490,521 20,420,222 Bruto Binnenlands Product (marktprijzen; 2007=100)/ Gross Domestic Product (Market Prices; 2007=100) # 10,175,962 # 10,201,809 9,936,662 9,425,992 Bruto Nationaal Inkomen (basisprijzen)/ Gross National Income (Basic Prices) 15,103,119 15,659,006 14,809,131 18,406,559 Bruto Nationaal Inkomen (marktprijzen)/ Gross National Income (Market Prices) 16,541,523 17,061,931 16,394,461 19,716,959 Beschikbaar Inkomen/ Disposable Income 16,764,440 17,300,451 16,619,289 20,361,353 Nationaal Inkomen per capita in SRD./ National Income per capita in SRD 30,063 30,535 28,900 34,245 Opmerking:
Met uitzondering van het per capita nationaal inkomen dat in Surinaamse Dollars is uitgedrukt, zijn alle cijfers in duizend Surinaamse dollars. Nationale Rekeningen schattingen per September 2017.
Remark: With the exception of the per capita national income, which is expressed in Surinamese Dollars, all data are in thousands of Surinamese dollars. National Accounts estimates as at September 2017.
Bron : Algemeen Bureau voor de Statistiek, afdeling Nationale Rekeningen Source : General Bureau of Statistics, Section of National Accounts Statistics

52
Tabel 5.3: De jaarlijkse waarde van importen, exporten, wederexporten en de handelsbalans (x 1US$) naar de belangrijkste handelsblokken, 2014 - 2016
Table 5.3: Annual Value of Imports, Exports, Re-Exports and the Trade Balance
(x 1US$) to the Main Trading Blocks, 2014 - 2016
2014 Handelsblokken / Trading Blocks
Importen/ Import
Exporten/ Exports
Wederexporten/ Re-Exports
Handelsbalans/ Trade Balance
Value Value Value Value ASEAN 41,784,580 1,286,149 3,226,813 -37,271,618
CARICOM 375,629,337 263,972,244 29,357,398 -82,299,695E.U. 354,552,751 248,935,309 8,155,350 -97,462,092
MERCOSUR 47,401,558 3,692,179 12,751,914 -30,957,465NAFTA 523,587,119 570,962,625 5,917,613 53,293,119
Overigen/Others 483,772,598 758,392,714 11,021,627 285,641,743
Totaal/Total 1,826,727,942 1,847,241,220 70,430,716 90,943,994
2015 Handelsblokken/ Trading Blocks
Importen / Import
Exporten / Exports
Wederexporten/ Re-Exports
Handelsbalans/ Trade Balance
Value Value Value Value
ASEAN 37,679,163 3,891,634 2,814,462 -30,973,067
CARICOM 296,736,149 139,793,781 19,029,530 -137,912,838
E.U. 437,695,615 247,440,402 7,788,049 -182,467,164
MERCOSUR 46,374,952 3,216,036 10,125,734 -33,033,182
NAFTA 630,032,047 206,020,760 14,051,183 -409,960,104
Overigen/Others 455,965,214 1,149,822,010 10,323,091 704,179,887
Totaal/Total 1,904,483,139 1,750,184,624 64,132,048 -90,166,467
2016 Handelsblokken / Trading Blocks
Importen/ Import
Exporten/ Exports
Wederexporten/ Re-Exports
Handelsbalans/ Trade Balance
Value Value Value Value ASEAN 26,241,468 11,590,005 3,724,846 -10,926,616
CARICOM 273,347,196 165,682,663 7,139,425 -100,525,108 E.U. 241,745,381 149,883,628 6,287,552 -85,574,201
MERCOSUR 31,978,494 3,341,043 1,551,743 -27,085,708 NAFTA 346,757,246 25,535,303 7,774,807 -313,447,135
Overigen/Others 254,840,553 848,552,868 4,219,292 597,931,607
Totaal/Total 1,174,910,339 1,204,585,512 30,697,665 60,372,838 Opmerking: verschil in de totalen door afrondingen/ Remark: difference in totals due to roundings Noot/Note: Ruwe douane data / Raw Customs Data
Bron : Algemeen Bureau voor de Statistiek, afdeling Handelsstatistieken (op transactie basis) Source : General Bureau of Statistics, Section of Trade Statistics (on accrual base)

53
Tabel 5.4a : De waarde van de jaarlijkse import (x 1US$) uit de Caricom landen, 2014 - 2016
Table 5.4a: Value of Annual Imports (x 1US$) from the Caricom Countries,
2014 - 2016
Landen/ Countries 2014 2015 2016
Antigua 30,039,042 25,493,018 17,718,085
Bahamas, The 3,244,875 - -
Barbados 2,699,331 4,052,133 5,290,837
Belize 1,408,816 2,217,767 120,116
Dominica 1,412,932 1,523,712 1,496,205
Grenada 130,670 110,183 89,598
Guyana 8,853,313 14,884,238 10,326,887
Haiti 438 27,714 12,923
Jamaica 19,794,159 18,321,858 7,651,876
Montserrat - - -
St.Kitts & Nevis - 8,225 2,231
St.Lucia 113,018,218 63,723,066 45,063,596
St. Vincent 490,461 179,048 139,435 Trinidad and
Tobago 194,537,083 166,195,187 185,435,408
Totaal / Total 375,629,338 296,736,149 273,347,197
Noot/Note: Ruwe douane data / Raw Customs Data Bron : Algemeen Bureau voor de Statistiek, afdeling Handelsstatistieken Source : General Bureau of Statistics, Section of Trade Statistics

54
Tabel 5.4b: De waarde van de jaarlijkse export (x 1US$) naar de Caricom landen, 2014 – 2016
Table 5.4b: Value of Annual Exports (x 1US$) to the Caricom Countries, 2014 – 2016
Landen/
Countries 2014 2015 2016
Antigua 321,016 330,770 302,690
Bahamas, The 3,000 6,931 1,072,009
Barbados 35,630,380 # 23,178,410 7,429,912
Belize 30,500 175 28,649
Dominica 65,702 189,216 200,379
Grenada # 6,5280 125,658 204,732
Guyana # 119,211,064 # 43,590,616 64,308,735
Haiti 2,343,879 2,495,016 4,700,064
Jamaica 43,470,756 # 37,858,329 27,061,688
Montserrat - 109,679 204,941
St.Kitts & Nevis 34,898 774,235 1,392,721
St.Lucia # 117,135 # 411,471 822,584
St. Vincent 303,056 330,282 224,841 Trinidad and
Tobago # 62,375,578 # 30,392,996 57,728,718
Totaal / Total # 263,972,244 # 139,793,781 165,682,663
1) Exclusief wederexport / Exclusive of Re-Exports Noot/Note: Ruwe douane data / Raw Customs Data
Bron : Algemeen Bureau voor de Statistiek, afdeling Handelsstatistieken Source : General Bureau of Statistics, Section of Trade Statistics

55
Tabel 5.4c: De waarde van de jaarlijkse weder-export (x 1US$) naar de Caricom landen, 2014 – 2016
Table 5.4c: Value of Annual Re-Exports (x 1US$) to the Caricom Countries,
2014 – 2016
Landen/ Countries 2014 2015 2016
Antigua - - 1,306,374
Bahamas, The - - -
Barbados - 136,358 4,295
Belize - - 168
Dominica - - -
Grenada 88,444 - 168
Guyana 20,757,070 13,687,054 2,842,256
Haiti - - -
Jamaica - 19,501 1,550
Montserrat - - -
St.Kitts & Nevis - - -
St.Lucia 1,156,273 1,806,806 -
St. Vincent - - - Trinidad and
Tobago 7,355,611 3,379,810 2,984,614
Totaal / Total 29,357,398 19,029,529 7,139,425
Noot/Note: Ruwe douane data / Raw Customs Data
Bron : Algemeen Bureau voor de Statistiek, afdeling Handelsstatistieken Source : General Bureau of Statistics, Section of Trade Statistics
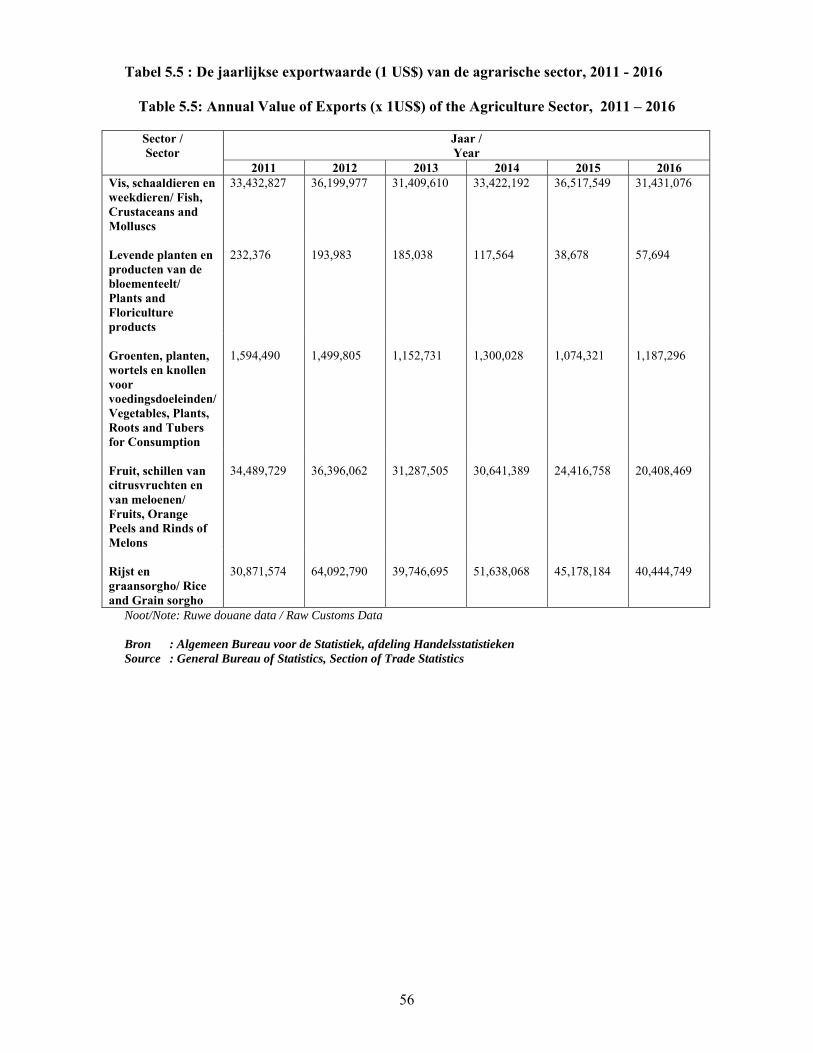
56
Tabel 5.5 : De jaarlijkse exportwaarde (1 US$) van de agrarische sector, 2011 - 2016
Table 5.5: Annual Value of Exports (x 1US$) of the Agriculture Sector, 2011 – 2016
Sector / Sector
Jaar / Year
2011 2012 2013 2014 2015 2016 Vis, schaaldieren en weekdieren/ Fish, Crustaceans and Molluscs
33,432,827 36,199,977 31,409,610 33,422,192 36,517,549 31,431,076
Levende planten en producten van de bloementeelt/ Plants and Floriculture products
232,376
193,983
185,038
117,564
38,678
57,694
Groenten, planten, wortels en knollen voor voedingsdoeleinden/ Vegetables, Plants, Roots and Tubers for Consumption
1,594,490
1,499,805
1,152,731
1,300,028
1,074,321
1,187,296
Fruit, schillen van citrusvruchten en van meloenen/ Fruits, Orange Peels and Rinds of Melons
34,489,729
36,396,062
31,287,505
30,641,389
24,416,758
20,408,469
Rijst en graansorgho/ Rice and Grain sorgho
30,871,574
64,092,790
39,746,695
51,638,068
45,178,184
40,444,749
Noot/Note: Ruwe douane data / Raw Customs Data
Bron : Algemeen Bureau voor de Statistiek, afdeling Handelsstatistieken Source : General Bureau of Statistics, Section of Trade Statistics

57
Tabel 5.6a : De jaarlijkse invoerwaarde (x 1US$) naar afdelingen van het geharmoniseerd systeem, 2014 - 2016
Table 5.6a: Annual Value of Imports (x 1 US$) by Sections of the Harmonized System,
2014 - 2016
HS Group Omschrijving / Description
Jaar / Year
2014 2015 2016 1 Levende dieren en producten van het dierenrijk/
Live animals and animal products 47,609,985 49,915,206 34,972,055 2
Producten van het plantenrijk/ Vegetable Products 38,323,091 41,323,900 33,271,149
3
Vetten en oliën van dierlijk of plantaardige oorsprong/ Animal or vegetable fats and oils + their products, edible 18,947,001 20,411,505 14,738,053
4
Voedingswaren, dranken, tabak / Foodstuffs, beverages, spirits, tobacco and tobacco substitutes 147,372,037 153,564,622 112,417,396
5 Minerale producten /Mineral Products 414,983,096 298,413,891 248,075,881
6 Chemische producten en aanverwante industrieën/ Products of chemical or allied industries 170,489,040 184,729,345 115,203,158
7
Kunststof en rubber / Plastics, rubber and articles thereof 87,565,907 105,660,998 63,065,882
8
Huiden, leder, bont, werken v. darmen/ Hides and skins, leather, art.thereof, travel goods, art.of animal gut 2,344,766 3,185,640 1,126,055
9
Hout, kurk en vlechtwerk / Wood, charcoal, cork, and art.thereof, plaiting materials, basket- & wicker ware 3,669,573 5,479,505 3,943,135
10
Pulp, papier, en karton / Pulp, paper, paperboard and art.thereof 38,961,310 39,428,199 28,728,424
11
Textielstoffen en -waren/ Textiles and textiles articles 29,473,741 30,112,812 18,895,658
12
Schoeisel, paraplu's, wandelstokken, hoeden, kunstbloemen etc./ Footwear, headgear etc., feathers, artificial flowers, art. of human hair 8,098,130 9,428,770 4,583,202
13
Steen, keramiek, cement, glas en glaswaren/ Stoneware, plaster, cement, ceramic products, glass and glassware 23,438,849 25,162,567 16,192,558
Bron : Algemeen Bureau voor de Statistiek, afdeling Handelsstatistieken Source : General Bureau of Statistics, Section of Trade Statistics

58
Tabel 5.6a : De jaarlijkse invoerwaarde (x 1US$) naar afdelingen van het geharmoniseerd systeem, 2014 - 2016 (vervolg)
Table 5.6a: Annual Value of Imports (x 1 US$) by Sections of the Harmonized System,
2014 - 2016 (continued)
HS Group Omschrijving / Description
Jaar / Year
2014 2015 2016 14 Parels, edelstenen, halfedelstenen, edele
metalen, bijouterie, munten/ Pearls, precious & semi- stones, precious metals, imitation jewellery,coins 160,560 899,345 775,105
15
Onedele metalen, en metalen voorwerpen / Base metals and articles of base metal 142,480,525 198,579,497 101,474,534
16
Machines, elektronische materiaal,elektrische toestellen/ Machinery and appliances, electric. equipment 400,598,405 457,498,876 257,897,021
17
Vervoermaterieel / Vehicles, aircraft, vessels and associated equipment 188,947,305 195,545,140 82,711,470
18
Optische instrumenten, precisie-en andere apparaten en fotografie/ Optical, photographic, measuring and precision equipment, musical instruments
19 Wapens en munitie/ Arms and ammunition 57,368,552 73,471,828 34,799,810
20
Diverse goederen en producten, speelgoed/ Miscellaneous manufactured articles, toys
21
Kunstvoorwerpen/ Art objects 50,876 41,130 194,933
22
Niet elders genoemd/ Not Elsewhere Classified 5,845,196 11,630,363 1,844,860
Totaal/ Total 1,826,727,945 1,904,483,139 1,174,910,339
Opmerking: verschil in de totalen door afrondingen/ Remark: difference in totals due to roundings Noot/Note: Ruwe douane data / Raw Customs Data Bron : Algemeen Bureau voor de Statistiek, afdeling Handelsstatistieken Source : General Bureau of Statistics, Section of Trade Statistics

59
Tabel 5.6b : De jaarlijkse uitvoerwaarde (x 1US$) naar afdelingen van het geharmoniseerd systeem, 2014 - 2016
Table 5.6b: Annual Value of Exports (x 1 US$) by Sections of the Harmonized System,
2014 - 2016
HS Group Omschrijving / Description
Jaar / Year
2014 2015 2016 1 Levende dieren en producten van het dierenrijk/
Live animals and animal products 35,234,841 39,394,604 34,884,279 2
Producten van het plantenrijk/Vegetable Products 84,024,396 71,486,274 62,732,939
3
Vetten en oliën van dierlijk of plantaardige oorsprong/ Animal or vegetable fats and oils + their products, edible 799,130 4,011,170 1,647,065
4
Voedingswaren, dranken, tabak / Foodstuffs, beverages, spirits, tobacco and tobacco substitutes 6,980,467 7,232,615 9,034,204
5 Minerale producten /Mineral Products 199,733,764 246,265,429 118,221,324
6 Chemische producten en aanverwante industrieën/ Products of chemical or allied industries 371,691,167 208,769,418 5,640,599
7
Kunststof en rubber / Plastics, rubber and articles thereof 6,018,389 5,686,970 4,859,299
8
Huiden, leder, bont, werken v. darmen/ Hides and skins, leather, art.thereof, travel goods, art.of animal gut 143,490 127,789 112,421
9
Hout, kurk en vlechtwerk / Wood, charcoal, cork, and art.thereof, plaiting materials, basket- & wicker ware 26,781,935 30,856,594 37,820,571
10
Pulp, papier, en karton / Pulp, paper, paperboard and art.thereof 987,382 1,059,200 1,152,373
11
Textielstoffen en -waren/ Textiles and textiles articles 653,493 746,991 658,852
12
Schoeisel, paraplu's, wandelstokken, hoeden, kunstbloemen etc./ Footwear, headgear etc., feathers, artificial flowers, art. of human hair 161,904 209,280 252,533
13
Steen, keramiek, cement, glas en glaswaren/ Stoneware, plaster, cement, ceramic products, glass and glassware 555,026 99,254 365,840
Bron : Algemeen Bureau voor de Statistiek, afdeling Handelsstatistieken Source : General Bureau of Statistics, Section of Trade Statistics

60
Tabel 5.6b : De jaarlijkse uitvoerwaarde (x 1US$) naar afdelingen van het geharmoniseerd systeem, 2014 - 2016 (vervolg)
Table 5.6b: Annual Value of Exports (x 1 US$) by Sections of the Harmonized System,
2014 – 2016 (continued)
HS Group Omschrijving / Description
Jaar / Year
2014 2015 2016 14 Parels, edelstenen, halfedelstenen, edele
metalen, bijouterie, munten/ Pearls, precious & semi- stones, precious metals, imitation jewellery,coins 1,069,823,884 1,021,900,181 880,769,702
15
Onedele metalen, en metalen voorwerpen / Base metals and articles of base metal 10,495,254 12,690,078 10,903,991
16
Machines, elektronische materiaal,elektrische toestellen/ Machinery and appliances, electric.equipment 19,172,803 41,406,800 20,981,902
17
Vervoermaterieel / Vehicles, aircraft, vessels and associated equipment 4,250,183 53,736,481 3,898,260
18
Optische instrumenten, precisie-en andere apparaten en fotografie/ Optical, photographic, measuring and precision equipment, musical instruments
19 Wapens en munitie/ Arms and ammunition 8,410,001 3,881,096 9,550,128
20
Diverse goederen en producten, speelgoed/ Miscellaneous manufactured articles, toys
21
Kunstvoorwerpen/ Art objects 3,764 12,963 28,481
22
Niet elders genoemd/ Not Elsewhere Classified 1,319,945 611,438 1,070,751
Totaal/ Total 1,847,241,220 1,750,184,624 1,204,585,512
Opmerking: verschil in de totalen door afrondingen/ Remark: difference in totals due to roundings Noot/Note: Ruwe douane data / Raw Customs Data
Bron : Algemeen Bureau voor de Statistiek, afdeling Handelsstatistieken Source : General Bureau of Statistics, Section of Trade Statistics

61
Tabel 5.6c : De jaarlijkse wederuitvoerwaarde (x 1US$) naar afdelingen van het geharmoniseerd systeem, 2014 - 2016
Table 5.6c: Annual Value of Re-Exports (x 1 US$) by Sections of the Harmonized
System, 2014 - 2016
HS Group Omschrijving / Description
Jaar / Year
2014 2015 2016 1 Levende dieren en producten van het dierenrijk/
Live animals and animal products 5,996,621 4,112,942 1,000,058 2
Producten van het plantenrijk/Vegetable Products 952,292 974,712 272,675
3
Vetten en oliën van dierlijk of plantaardige oorsprong/ Animal or vegetable fats and oils + their products, edible 4,400,831 1,030,885 131,117
4
Voedingswaren, dranken, tabak / Foodstuffs, beverages, spirits, tobacco and tobacco substitutes 34,008,915 35,805,180 14,146,730
5 Minerale producten /Mineral Products 4,008,944 1,988,052 1,391,821
6 Chemische producten en aanverwante industrieën/ Products of chemical or allied industries 2,077,702 3,503,877 2,938,471
7
Kunststof en rubber / Plastics, rubber and articles thereof 1,591,308 972,946 128,398
8
Huiden, leder, bont, werken v. darmen/ Hides and skins, leather, art.thereof, travel goods, art.of animal gut 2,223 5,152 3,234
9
Hout, kurk en vlechtwerk / Wood, charcoal, cork, and art.thereof, plaiting materials, basket- & wicker ware 5,351 5,462 527
10
Pulp, papier, en karton / Pulp, paper, paperboard and art.thereof 179,395 412,990 154,350
11
Textielstoffen en -waren/ Textiles and textiles articles 79,126 203,564 54,125
12
Schoeisel, paraplu's, wandelstokken, hoeden, kunstbloemen etc./ Footwear, headgear etc., feathers, artificial flowers, art. of human hair 1,407 10,780 11,766
13
Steen, keramiek, cement, glas en glaswaren/ Stoneware, plaster, cement, ceramic products, glass and glassware 16,956 17,394 6,697
Bron : Algemeen Bureau voor de Statistiek, afdeling Handelsstatistieken Source : General Bureau of Statistics, Section of Trade Statistics

62
Tabel 5.6c : De jaarlijkse wederuitvoerwaarde (x 1US$) naar afdelingen van het geharmoniseerd systeem, 2014 – 2016 (vervolg)
Table 5.6c: Annual Value of Re-Exports (x 1 US$) by Sections of the Harmonized
System, 2014 – 2016 (continued)
HS Group Omschrijving / Description
Jaar / Year
2014 2015 2016 14 Parels, edelstenen, halfedelstenen, edele
metalen, bijouterie, munten/ Pearls, precious & semi- stones, precious metals, imitation jewellery,coins - 24,516 635
15
Onedele metalen, en metalen voorwerpen / Base metals and articles of base metal 1,057,928 1,048,903 549,051
16
Machines, elektronische materiaal,elektrische toestellen/ Machinery and appliances, electric.equipment 3,505,895 1,761,736 2,262,108
17
Vervoermaterieel / Vehicles, aircraft, vessels and associated equipment 3,113,086 2,998,579 917,915
18
Optische instrumenten, precisie-en andere apparaten en fotografie/ Optical, photographic, measuring and precision equipment, musical instruments
19 Wapens en munitie/ Arms and ammunition 9,398,645 9,254,375 6,581,649
20
Diverse goederen en producten, speelgoed/ Miscellaneous manufactured articles, toys
21
Kunstvoorwerpen/ Art objects 30,410 - 146,340
22
Niet elders genoemd/ Not Elsewhere Classified 3,681 1 -
Totaal/ Total 70,430,716 64,132,048 30,697,665
Opmerking: verschil in de totalen door afrondingen/ Remark: difference in totals due to roundings Noot/Note: Ruwe douane data / Raw Customs Data Bron : Algemeen Bureau voor de Statistiek, afdeling Handelsstatistieken Source : General Bureau of Statistics, Section of Trade Statistics
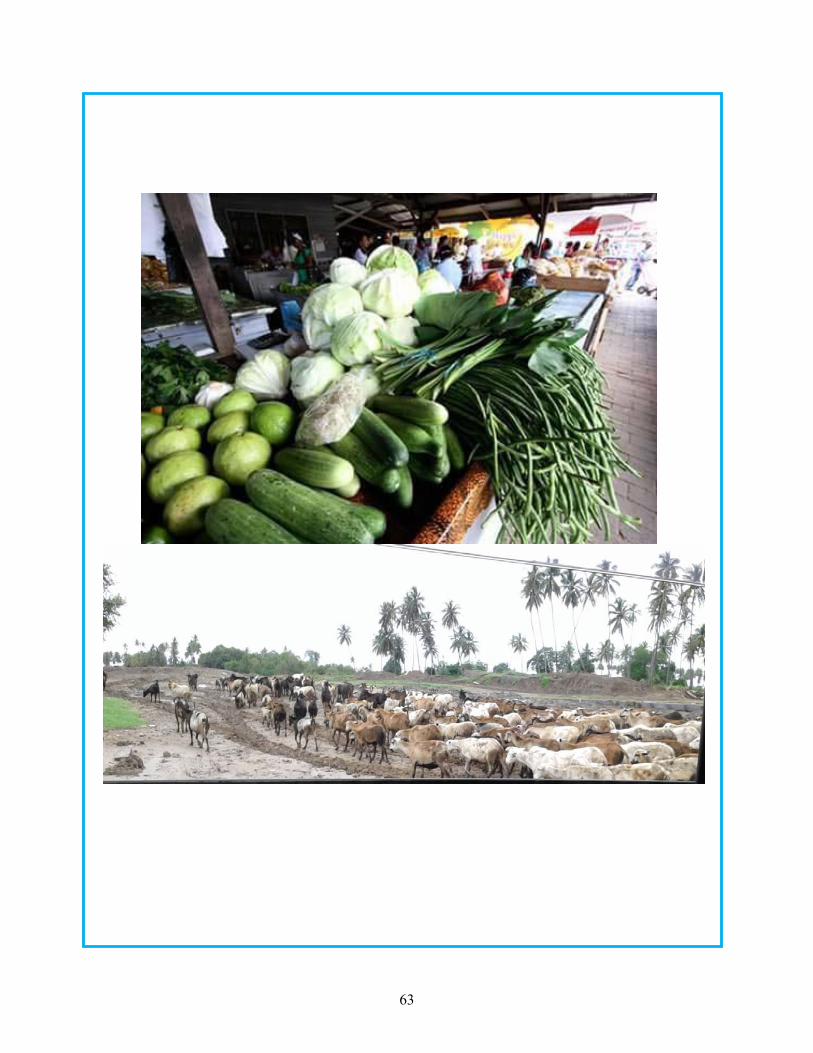
63
LANDBOUW en VEETEELT
LANDBOUW en VEETEELT
AGRICULTURE and ANIMAL HUSBANDRY

64
6. Landbouw en Veeteelt De oppervlakte van het beplante areaal van zowel padie als de totale landbouw vertoont vanaf 2013 tot en met 2016 een toename. De oppervlakte van het beplante areaal van bacoven door de Stichting Behoud Bananen Sector ( SBBS), is vanaf 2013 tot en met 2016 afgenomen. In 2013 ging het om een oppervlakte van 2173ha en in 2016 ging het om 1993 ha. De totale jaarlijkse (fysieke) productie van landbouwgewassen ( tabel 6.2) steeg in 2014 ten opzichte van 2013. Vanaf 2014 tot en met 2016 merken wij dat dit cijfer is afgenomen. In 2016: De 5 gewassen ( tabel 6.2) die het “zwaarste gewicht” dragen voor wat betreft de productie, zijn:
- Padie - Bacoven - Groenten - Bananen - Kokosnoten
In 2016: De 5 groenten ( tabel 6.3) die het “zwaarste gewicht” dragen, voor wat betreft de productie, zijn:
- Boulanger - Peper - Kouseband - Oker - Pompoen
Uit tabel 6.4 valt op dat het aantal gefokte runderen, sterk is afgenomen vanaf 2013 (46,060) tot en met 2016 (35,763). Bij de categorie varkens zien we vanaf 2013 tot en met 2015 een stabiele stijging in de aantallen, terwijl in 2016 dit cijfer ietwat is gedaald.
6. Agriculture and Animal Husbandry The Area of Cultivated Land for both paddy as well as the total agricultural area shows an increase from 2013 to 20116. The Area Cultivated for Bananas mainly planted by the Foundation Behoud Bananen Sector (SBBS), has been reduced from 2013 to 2016. In 2013 this involved an area of 2173ha and in 2016 it was about 1993 ha. The Annual (physicial) crop production (Table 6.2) increased in 2014 compared with 2013. From 2014 to 2016 we notice that this figure has decreased. The year 2016: The 5 crops (Table 6.2) carrying the “heaviest weight’ with regards to the production are:
- Paddy - Bananas - Vegetables - Plantains - Coconuts
The year 2016: The 5 Vegetables (Table 6.3) carrying the “heaviest weight’ with regards to the production are:
- Aubergine/Eggplant - Pepper - Long Beans - Okra - Pumpkin
Table 6.4 shows that the number of Bred Live Stock has a sharp decline from 2013 (40.060 through 2016 (35.763). In the category of Pigs, we see a stable increase in the numbers from 2013 to 2015, while in 2016 this figure has decreased somewhat.

65
Tabel 6.1 : De oppervlakte van het beplante areaal in hectare naar gewas1), 2013 - 2016
Table 6.1: Area of Cultivated Land in hectare by Type of Crop1), 2013 - 2016
Soort gewas / Crop Jaar / Year
2013 2014 2015 2016 Eenjarige gewassen / Annual Crops:
Padie (14% vocht) / Paddy (14% humidity) 58,274 62,211 # 62,348 62,713
Maïs / Maize 19 36 35 36
Aardvruchten / Roots 404 464 435 489
Pinda / Peanuts 30 21 16 16 Overige peulvruchten (n.e.g.) Other Pulses (n.e.c.) 115 168 178 147
Groenten1) / Vegetables1) 1,021 1,436 1,399 1,471 Overige éénjarige gewassen (n.e.g.) / Other Annual Crops (n.e.c.) 84 129 128 94
Totaal / Total 59,947 64,465 64,539 64,966 Semi-meerjarige gewassen / Semi-Perennial Crops:
Bacoven / Bananas 2,173 2,164 1,993 1,993
Bananen / Plantains 762 781 640 640 Overige semi-meerjarige gewassen (n.e.g.) / Other Semi- Perennial Crops (n.e.c.) 128 170 149 126
Totaal / Total 3,063 3,115 2,782 2,759
Meerjarige gewassen / Perennial Crops:
Sinaasappelen / Oranges 1,235 1,108 854 839
Grapefruit / Grapefruit 84 83 85 82
Overig fruit / Other Fruit 487 713 829 635
Kokospalm / Coconut Palm 953 1,099 1,081 1,095 Overige meerjarige gewassen (n.e.g.) / Other Perennial Crops (n.e.c) 141 149 148 182
Totaal / Total 2,900 3,152 2,997 2,833
Generaal Totaal / Total 65,910 70,732 70,318 70,558
Bevolkingslandbouw/ Smallholding 31,994 33,026 # 35,086 33,629
Grootlandbouw/ Large-Scale Farming 33,916 37,706 # 35,232 36,929
1) Inclusief dubbelgewas w.o. kool en tomaten / Including double Crop such as Cabbage and Tomatoes Bron : Ministerie van Landbouw, Veeteelt en Visserij, afdeling Landbouwstatistieken Source: Ministry of Agriculture, Animal Husbandry and Fishery, Section of Agricultural Statistics

66
Tabel 6.2 : De jaarlijkse fysieke productie (x 1.000 kg) in de landbouw naar gewas, 2013 - 2016
Table 6.2: Annual Output (x 1,000 kg) in Agriculture by Type of Crop, 2013 - 2016
Soort Gewas/ Crop Jaar / Year
2013 2014 2015 2016
Eenjarige gewassen / Annual Crops:
Padie (14% vocht) / Paddy (14% humidity) 262,029 # 275,851 # 276,458 278,077
Maïs / Maize 47 87 82 89
Aardvruchten / Roots 9,401 9,498 8,189 9,929
Pinda / Peanuts 33 31 25 22
Overige peulgewassen / Other Pulses 166 # 260 220 163
Groenten1) / Vegetables1) 18,695 24,569 24,142 26,839
Watermeloen / Watermelon 1,615 2,202 2,204 1,867
Totaal/Total 291,986 312,498 311,320 316,986 Semi-meerjarige gewassen / Semi-Perennial Crops:
Bacoven / Bananas 85,584 77,014 68,991 61,073
Bananen / Plantains 23,426 24,688 20,447 19,856 Overige semi-meerjarige gewassen / Other Semi - Perennial Crops 2,238 2,955 2,691 2,401
Totaal/Total 111,248 104,657 92,129 83,330
Meerjarige gewassen / Perennial Crops:
Kokosnoten / Coconuts 10,786 12,880 12,689 14,672
Sinaasappelen / Oranges 17,502 14,599 10,455 10,340
Grapefruit / Grapefruit 1,171 1,053 1,057 1,032 Overige citrusvruchten / Other Citrus Fruits 4,927 6,417 7,484 6,487 Overige meerjarige gewassen / Other Perennial Crops 5,012 5,192 5,283 5,792
Totaal/Total 39,398 40,141 36,968 38,323
Generaal Totaal / Total 442,632 457,296 # 440,417 438,639
Bevolkingslandbouw/ Smallholding 442,632 457,296 # 440,417 438,639
Grootlandbouw/ Large-Scale Farming 225,185 234,246 # 232,025 233,338 1) w.o. kool en tomaten / Including Cabbage and Tomatoes Bron : Ministerie van Landbouw, Veeteelt en Visserij, afdeling Landbouwstatistieken Source: Ministry of Agriculture, Animal Husbandry and Fishery, Section of Agricultural Statistics
1,000 kg kokosnoten = 1,000 stuks / 1,000 kg Coconuts = 1,000 pcs 1,000 kg sinaasappels = 4,000 stuks / 1,000 kg Oranges = 4,000 pcs 1,000 kg grapefruit = 2,000 stuks / 1,000 kg Grapefruit = 2,000 pcs 1000 kg overig citrus = 6,350 stuks / 1,000 kg Other Citrus Fruits = 6,350 pcs

67
Tabel 6.3: Jaarlijkse beplante areaal in hectare en de productie in ton van groenten naar soort, 2011 – 2016 (1)
Table 6.3: Annual Area of Cultivated Land in hectares and Production in Tonnes of
Vegetables by Type, 2011 – 2016 (1)
Soort groenten/ 2011 2012 2013 Vegetables by Type Beplant
areaal in ha / Cultivated Land in ha
Produktie in Ton / Production in Tonnes
Beplant areaal in ha / Cultivated Land in ha
Produktie in Ton / Production in Tonnes
Beplant areaal in ha / Cultivated Land in ha
Produktie in Ton / Production in Tonnes
Tomaat/ Tomato 59 741 55 654 102 1,284 Kool / Cabbage 33 851 22 595 39 1,021 Snijbonen / Snap Beans 19 317 18 300 25 417 Kouseband / Long beans 78 1,228 79 1,386 130 1,814 Tayerblad / Tayer Sheet 65 1,548 23 533 45 933 Amsoi, Kaisoi en/and Paksoi 18 217 19 232 40 442Boulanger / Aubergine / Eggplant 35 1,163 37 1,087 71 2,242 Komkommer / Cucumber 26 602 21 494 46 1,131 Peper / Pepper 62 1,462 44 1,107 98 2,308 Pompoen / Pumpkin 36 568 35 543 72 1,083 Sopropo / Bitter Melon 64 1,242 57 978 73 1,259Oker / Okra 96 1,468 92 1,356 121 1,654 Antroewa / African Eggplant 35 741 26 580 40 877 Overige groenten / Other vegetables 92 1,643 80 1,590 119 2,230 Totaal / Total 718 13,791 608 11,435 1,021 18,695 Bron : Ministerie van Landbouw, Veeteelt en Visserij, afdeling Landbouwstatistieken Source : Ministry of Agriculture, Animal Husbandry and Fishery, Section of Agricultural Statistics

68
Tabel 6.3: Jaarlijkse beplante areaal in hectare en de productie in ton van groenten naar soort, 2011 – 2016 (2)
Table 6.3: Anual Area of Cultivated Land in hectares and Production in Tonnes of
Vegetables by Type, 2011 – 2016 (2)
Soort groenten/ 2014 2015 2016 Vegetables by Type
Beplant areaal in ha / Cultivated Land in ha
Produktie in Ton / Production in Tonnes
Beplant areaal in ha / Cultivated Land in ha
Produktie in Ton / Production in Tonnes
Beplant areaal in ha / Cultivated Land in ha
Produktie in Ton / Production in Tonnes
Tomaat/ Tomato 126 1,475 129 1,526 126 1,500 Kool / Cabbage 57 1,306 56 1,284 63 1,448 Snijbonen / Snap Beans 29 399 39 576 37 550 Kouseband / Long beans 176 2,464 168 2,367 171 2,657Tayerblad / Tayer Sheet 70 1,765 56 1,437 58 1,574 Amsoi, Kaisoi en/and Paksoi 73 647 66 593 62 574 Boulanger / Aubergine / Eggplant 96 2,732 108 3,057 111 3,528 Komkommer / Cucumber 70 1,583 74 1,688 75 1,687Peper / Pepper 127 2,821 126 2,648 134 3,051 Pompoen / Pumpkin 116 1,533 116 1,530 121 1,841 Sopropo / Bitter Melon 93 1,515 89 1,417 87 1,413 Oker / Okra 137 1,928 135 1,909 146 1,915 Antroewa / African Eggplant 62 1,248 58 1,130 55 1,136 Overige groenten / Other vegetables 204 3,153 179 2,980 225 3,965Totaal / Total 1,436 24,569 1,399 24,142 1,471 26,839 Bron : Ministerie van Landbouw, Veeteelt en Visserij, afdeling Landbouwstatistieken Source : Ministry of Agriculture, Animal Husbandry and Fishery, Section of Agricultural Statistics

69
Tabel 6.4 : Het jaarlijkse aantal gefokte dieren naar soort, 2013 - 2016
Table 6.4: Annual Number of Bred Livestock by Type, 2013 - 2016
Soort / Type Jaar / Year
2013 2014 2015 2016
Runderen / Cattle: 46,060 36,138 37,620 35,763
Varkens / Pigs:
Zeugen / Sows 3,252 3,642 3,672 3,540
Beren / Boars 325 364 # 367 353
Biggen / Piglets 28,946 32,416 # 32,677 31,502
Totaal / Total Varkens/Pigs 32,523 36,422 36,716 35,395
Pluimvee (x 1.000 st)1) / Poultry ( x 1,000 pcs.)1):
Slachtkippen / Slaughter poultry
Legkippen / Laying Hens 4,861 5,098 # 5,439 4,697 Overige Pluimvee (x 1.000 st) / Other Poultry ( x 1,000 pcs.)
Overig vee / Other Livestocks:
Karbouwen / Water Buffaloes 743 817 # 865 786
Paarden / Horses 159 156 # 261 279 Ezels en Muilezels / Donkeys and Mules 6 8 # 5 5
Geiten / Goats 4,024 4,058 # 4,233 3,923
Schapen / Sheep 5,977 5,773 # 6,473 6,311
Bron : Ministerie van Landbouw, Veeteelt en Visserij, afdeling Landbouwstatistieken Source: Ministry of Agriculture, Animal Husbandry and Fishery, Section of Agricultural Statistics

70

71
PRIJZEN en LONEN
PRICES and WAGES

72
7. Prijzen en Lonen Het CPI “basispakket” met basisperiode april-juni 2009=100 bevat circa 300 “Goederen en Diensten”. De berekende index is een gewogen gemiddelde van die 300 “items”, en is een maat voor de gemiddelde prijsverandering tussen basisperiode en lopende periode. Van sommige “items” is de prijs gelijk gebleven, sommige zijn in prijs gedaald en andere zijn in prijs gestegen. De indeling van de items van de hoofdgroepen, subgroepen, etc is volgens COICOP: Classification of Individual Consumption According to Purpose. Vanaf april 2016 heeft het ABS een nieuw CPI “basispakket” met basisperiode april-juni 2016=100. Dat pakket bevat circa 316 “Goederen en Diensten”. Volgens voorlopige cijfers van het ABS zijn de consumentenprijzen op maandbasis (basis: april – juni 2016=100) in december 2017 t.o.v. november 2017 gemiddeld met 0.2% gestegen. De hoogste prijsstijgingen waren waar te nemen in de hoofdgroepen, “Transport” (1.8%) en “Buitenshuis eten” (1.4%).
7. Prices and Wages The CPI “basket” with base period April-June 2009=100 contains circa 300 “Goods and Services”. The calculated Index is an average of the 300 Items and is a measure of the Average Price change between the base period and the current period. Prices of some items have remained stable, prices of some items decreased, while prices of some items have risen. The classification of the item, in Major Groups, Subgroups, etc is according to COICOP: Classification of Individual Consumption According to Purpose. Since April 2016, the GBS has a new CPI “basket” with base period April-June 2016=100. That basket contains circa 316 “Goods and Services”. According to the provisional figures of the GBS, the Monthly Consumer Prices (base: April – June 2016=100) in December 2017, comparing with November 2017, decreased with an average of 0.2%. The highest price increases in this period were observed in the main groups, “Transportation” (1.8%) and “Food Away from Home” (1.4%).
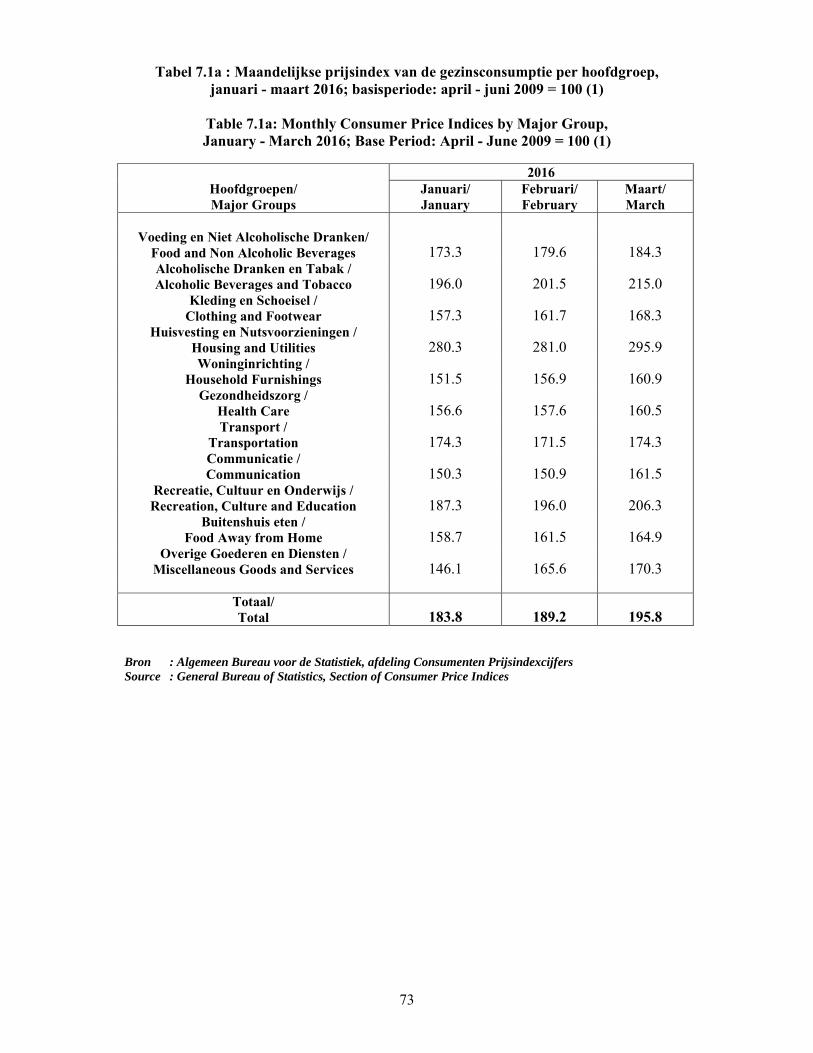
73
Tabel 7.1a : Maandelijkse prijsindex van de gezinsconsumptie per hoofdgroep, januari - maart 2016; basisperiode: april - juni 2009 = 100 (1)
Table 7.1a: Monthly Consumer Price Indices by Major Group, January - March 2016; Base Period: April - June 2009 = 100 (1)
2016
Hoofdgroepen/ Major Groups
Januari/ January
Februari/ February
Maart/ March
Voeding en Niet Alcoholische Dranken/
Food and Non Alcoholic Beverages 173.3 179.6 184.3 Alcoholische Dranken en Tabak / Alcoholic Beverages and Tobacco 196.0 201.5 215.0
Kleding en Schoeisel / Clothing and Footwear 157.3 161.7 168.3
Huisvesting en Nutsvoorzieningen / Housing and Utilities 280.3 281.0 295.9 Woninginrichting /
Household Furnishings 151.5 156.9 160.9 Gezondheidszorg /
Health Care 156.6 157.6 160.5 Transport /
Transportation 174.3 171.5 174.3 Communicatie / Communication 150.3 150.9 161.5
Recreatie, Cultuur en Onderwijs / Recreation, Culture and Education 187.3 196.0 206.3
Buitenshuis eten / Food Away from Home 158.7 161.5 164.9
Overige Goederen en Diensten / Miscellaneous Goods and Services 146.1 165.6 170.3
Totaal/ Total 183.8 189.2 195.8
Bron : Algemeen Bureau voor de Statistiek, afdeling Consumenten Prijsindexcijfers Source : General Bureau of Statistics, Section of Consumer Price Indices

74
Tabel 7.1a : Maandelijkse prijsindex van de gezinsconsumptie per hoofdgroep,
april - juni 2016; basisperiode: april - juni 2009 = 100 (2)
Table 7.1a: Monthly Consumer Price Indices by Major Group, April - June 2016; Base Period: April - June 2009 = 100 (2)
2016
Hoofdgroepen/ Major Groups
April / April
Mei/ May
Juni / June
Voeding en Niet Alcoholische Dranken/
Food and Non Alcoholic Beverages 194.3 219.7 231.6 Alcoholische Dranken en Tabak / Alcoholic Beverages and Tobacco 229.3 255.9 281.7
Kleding en Schoeisel / Clothing and Footwear 200.0 207.1 215.0
Huisvesting en Nutsvoorzieningen / Housing and Utilities 316.8 332.9 335.2 Woninginrichting /
Household Furnishings 167.8 182.0 196.2 Gezondheidszorg /
Health Care 192.0 193.8 211.3 Transport /
Transportation 189.8 194.1 198.6 Communicatie / Communication 195.5 198.3 209.5
Recreatie, Cultuur en Onderwijs / Recreation, Culture and Education 227.1 228.5 258.0
Buitenshuis eten / Food Away from Home 171.5 176.5 184.1
Overige Goederen en Diensten / Miscellaneous Goods and Services 202.7 216.1 215.4
Totaal/ Total 214.2 228.9 238.0
Bron : Algemeen Bureau voor de Statistiek, afdeling Consumenten Prijsindexcijfers Source : General Bureau of Statistics, Section of Consumer Price Indices

75
Tabel 7.1a : Maandelijkse prijsindex van de gezinsconsumptie per hoofdgroep, april - juni 2016; basisperiode: april - juni 2016 = 100 (3)
Table 7.1a: Monthly Consumer Price Indices by Major Group,
April - June 2016; Base Period: April - June 2016 =100 (3)
2016 Hoofdgroepen/ Major Groups
April / April
Mei/ May
Juni / June
Voeding en Niet Alcoholische Dranken/
Food and Non Alcoholic Beverages 90.3 102.1 107.6 Alcoholische Dranken en Tabak / Alcoholic Beverages and Tobacco 89.7 100.1 110.2
Kleding en Schoeisel / Clothing and Footwear 96.5 99.9 103.7
Huisvesting en Nutsvoorzieningen / Housing and Utilities 96.5 101.4 102.1 Woninginrichting /
Household Furnishings 92.2 100.0 107.8 Gezondheidszorg /
Health Care 96.5 97.4 106.2 Transport /
Transportation 97.8 100.0 102.3 Communicatie / Communication 96.9 98.6 104.2
Recreatie, Cultuur en Onderwijs / Recreation, Culture and Education 95.5 96.1 108.5
Buitenshuis eten / Food Away from Home 96.7 99.5 103.8
Overige Goederen en Diensten / Miscellaneous Goods and Services 95.9 102.2 101.9
Totaal/ Total 94.3 100.8 104.8
Bron : Algemeen Bureau voor de Statistiek, afdeling Consumenten Prijsindexcijfers Source : General Bureau of Statistics, Section of Consumer Price Indices

76
Tabel 7.1a : Maandelijkse prijsindex van de gezinsconsumptie per hoofdgroep, juli - september 2016; basisperiode: april - juni 2016 = 100 (4)
Table 7.1a: Monthly Consumer Price Indices by Major Group, July - September 2016; Base Period: April - June 2016 = 100 (4)
2016
Hoofdgroepen/ Major Groups
Juli / July
Augustus / August
September / September
Voeding en Niet Alcoholische Dranken/
Food and Non Alcoholic Beverages 110.1 116.2 124.8 Alcoholische Dranken en Tabak / Alcoholic Beverages and Tobacco 113.4 127.7 145.2
Kleding en Schoeisel / Clothing and Footwear 106.0 107.5 112.8
Huisvesting en Nutsvoorzieningen / Housing and Utilities 102.4 103.0 103.6 Woninginrichting /
Household Furnishings 108.3 114.3 121.5 Gezondheidszorg /
Health Care 107.0 110.0 115.0 Transport /
Transportation 104.6 106.2 110.9 Communicatie / Communication 106.2 107.1 117.6
Recreatie, Cultuur en Onderwijs / Recreation, Culture and Education 110.0 112.2 117.6
Buitenshuis eten / Food Away from Home 109.2 113.6 119.3
Overige Goederen en Diensten / Miscellaneous Goods and Services 104.1 107.7 113.1
Totaal/ Total 106.6 110.1 115.8
Bron : Algemeen Bureau voor de Statistiek, afdeling Consumenten Prijsindexcijfers Source : General Bureau of Statistics, Section of Consumer Price Indices

77
Tabel 7.1a : Maandelijkse prijsindex van de gezinsconsumptie per hoofdgroep, oktober - december 2016; basisperiode: april - juni 2016 = 100 (5)
Table 7.1a: Monthly Consumer Price Indices by Major Group,
October - December 2016; Base Period: April - June 2016 = 100 (5)
2016 Hoofdgroepen/ Major Groups
Oktober / October
November / November
December/ December
Voeding en Niet Alcoholische Dranken/
Food and Non Alcoholic Beverages 128.3 128.4 129.3 Alcoholische Dranken en Tabak / Alcoholic Beverages and Tobacco 151.3 150.1 149.6
Kleding en Schoeisel / Clothing and Footwear 113.1 112.8 113.5
Huisvesting en Nutsvoorzieningen / Housing and Utilities 104.0 109.9 109.9 Woninginrichting /
Household Furnishings 124.7 125.4 126.2 Gezondheidszorg /
Health Care 113.3 113.3 113.1 Transport /
Transportation 110.7 114.0 112.5 Communicatie / Communication 117.1 116.7 116.8
Recreatie, Cultuur en Onderwijs / Recreation, Culture and Education 119.3 117.7 117.8
Buitenshuis eten / Food Away from Home 121.2 121.3 121.8
Overige Goederen en Diensten / Miscellaneous Goods and Services 116.5 116.3 116.5
Totaal/ Total 117.5 119.2 119.4
Bron : Algemeen Bureau voor de Statistiek, afdeling Consumenten Prijsindexcijfers Source : General Bureau of Statistics, Section of Consumer Price Indices

78
Tabel 7.1b: Maandelijkse prijsindex van de gezinsconsumptie per hoofdgroep, januari – april 2017, basisperiode: april – juni 2016 = 100 (1)
Table 7.1b : Monthly Consumer Price Indices by Major Group, January – April 2017, Base period: April – June 2016 = 100 (1)
2017 Hoofdgroepen/ Major Groups
Januari/ January
Februari/ February
Maart/ March
April/ April
Voeding en Niet Alcoholische Dranken/
Food and Non Alcoholic Beverages 129.9 129.7 130.3 130.7 Alcoholische Dranken en Tabak / Alcoholic Beverages and Tobacco 149.6 149.7 150.0 150.1
Kleding en Schoeisel / Clothing and Footwear 114.0 114.1 115.0 115.1
Huisvesting en Nutsvoorzieningen / Housing and Utilities 109.9 109.9 110.0 110.0 Woninginrichting /
Household Furnishings 127.7 128.8 129.4 130.6 Gezondheidszorg /
Health Care 113.3 113.6 114.0 114.2 Transport /
Transportation 115.4 116.5 118.2 123.6 Communicatie / Communication 117.0 117.3 117.3 117.3
Recreatie, Cultuur en Onderwijs / Recreation, Culture and Education 119.7 121.1 123.6 126.2
Buitenshuis eten / Food Away from Home 122.0 122.6 122.7 123.8
Overige Goederen en Diensten / Miscellaneous Goods and Services 118.2 123.5 130.0 131.7
Totaal/ Total 120.3 121.0 122.2 123.4
Bron : Algemeen Bureau voor de Statistiek, afdeling Consumenten Prijsindexcijfers Source : General Bureau of Statistics, Section of Consumer Price Indices

79
Tabel 7.1b: Maandelijkse prijsindex van de gezinsconsumptie per hoofdgroep, mei - augustus 2017, basisperiode: april - juni 2016 = 100 (2)
Table 7.1b : Monthly Consumer Price Indices by Major Group,
May - August 2017, Base Period: April – June 2016 = 100 (2)
2017 Hoofdgroepen/ Major Groups
Mei/ May
Juni/ June
Juli/ July
Augustus/August
Voeding en Niet Alcoholische Dranken/
Food and Non Alcoholic Beverages 131.6 135.7 139.6 140.6 Alcoholische Dranken en Tabak / Alcoholic Beverages and Tobacco 150.2 150.2 150.6 150.6
Kleding en Schoeisel / Clothing and Footwear 115.4 115.4 115.8 116.1
Huisvesting en Nutsvoorzieningen / Housing and Utilities 110.2 110.2 110.4 110.6 Woninginrichting /
Household Furnishings 130.9 131.0 131.2 131.8 Gezondheidszorg /
Health Care 114.5 114.9 115.1 116.6 Transport /
Transportation 124.5 125.2 125.7 127.2 Communicatie / Communication 117.3 117.3 125.6 125.7
Recreatie, Cultuur en Onderwijs / Recreation, Culture and Education 127.9 128.5 128.8 129.7
Buitenshuis eten / Food Away from Home 125.1 128.6 130.3 131.0
Overige Goederen en Diensten / Miscellaneous Goods and Services 132.7 132.9 133.1 133.4
Totaal/ Total 124.0 125.5 127.2 127.9
Bron : Algemeen Bureau voor de Statistiek, afdeling Consumenten Prijsindexcijfers Source : General Bureau of Statistics, Section of Consumer Price Indices

80
Tabel 7.1b: Maandelijkse prijsindex van de gezinsconsumptie per hoofdgroep, september - december 2017, basisperiode: april - juni 2016 = 100 (3)
Table 7.1b : Monthly Consumer Price Indices by Major Group,
September - December 2017, Base Period: April – June 2016 = 100 (3)
2017 Hoofdgroepen/ Major Groups
September/September
Oktober/October
November/ November
December December
Voeding en Niet Alcoholische Dranken/
Food and Non Alcoholic Beverages 144.0 145.1 145.4 145.3 Alcoholische Dranken en Tabak / Alcoholic Beverages and Tobacco 150.8 151.5 152.0 152.0
Kleding en Schoeisel / Clothing and Footwear 117.2 117.2 117.3 118.2
Huisvesting en Nutsvoorzieningen / Housing and Utilities 110.6 110.8 110.9 111.1 Woninginrichting /
Household Furnishings 131.9 132.2 132.5 132.8 Gezondheidszorg /
Health Care 116.5 116.5 116.5 116.5 Transport /
Transportation 128.5 131.2 129.4 131.2 Communicatie / Communication 125.7 125.8 125.8 125.8
Recreatie, Cultuur en Onderwijs / Recreation, Culture and Education 129.8 131.1 131.3 131.7
Buitenshuis eten / Food Away from Home 132.3 132.5 1135.6 137.0
Overige Goederen en Diensten / Miscellaneous Goods and Services 134.2 134.9 135.0 135.1
Totaal/ Total 129.3 130.2 130.2 130.5
Bron : Algemeen Bureau voor de Statistiek, afdeling Consumenten Prijsindexcijfers Source : General Bureau of Statistics, Section of Consumer Price Indices

81

82
Tabel 7.2: Bruto uitbetaalde salarissen van landsdienaren per juni, 2016 en 2017 Table 7.2: Gross Paid Salaries of Civil Servants per month per June, 2016 and 2017
Salaris Interval Juni 2016 / June 2016
(in Srd)/ Salaries Interval (in SRD)
Aantal landsdienaren Salarissen/ Gemiddelde/
Number of Civil
Servants Salaries Average
00000 -- 00480 1,602 578,987.96 361.42
00481 -- 00960 2,190 1,804,961.88 824.18
00961 -- 01440 8,635 10,651,609.08 1,233.54
01441 -- 01920 7,487 12,301,390.78 1,643.03
01921 -- 02400 6,887 15,019,807.81 2,180.89
02401 -- 02880 8,712 23,001,798.78 2,640.24
02881 -- 03360 5,689 17,594,498 3,092.72
03361-- 03840 3,180 11,380,224.25 3,578.69
03841 -- 04320 1,825 7,416,934.36 4,064.07
04321 -- 04800 1,196 5,437,181.27 4,546.14
04801 -- 05280 861 4,312,290.00 5,008.47
05281 -- 05760 587 3,241,308.36 5,521.82
05761 -- 06240 324 1,943,632.32 5,998.87
06241 -- 06720 214 1,387,868.14 6,485.37
06721 -- 07200 158 1,099,397.42 6,958.21
> 07201 1,100 14,543,223.45 13,221.11
Totaal/Total 50,647 131,715,113.67 2,600.65
Salaris Interval juni 2017 / June 2017
(in Srd)/ Salaries Interval (in SRD)
Aantal landsdienaren Salarissen/ Gemiddelde/
Number of Civil
Servants Salaries Average
00000 -- 00480 1,628 592,790.08 364.12
00481 -- 00960 1,846 1,436,785.75 778.32
00961 -- 01440 3,284 4,303,899.21 1,310.57
01441 -- 01920 8,684 15,034,243.67 1,731.26
01921 -- 02400 5,840 12,541,678.56 2,147.55
02401 -- 02880 6,172 16,185,810.19 2,622.46
02881 -- 03360 3,915 12,182,376.92 3,111.72
03361-- 03840 4,831 17,422,115.75 3,606.32
03841 -- 04320 4,012 16,376,649.97 4,081.92
04321 -- 04800 3,144 14,378,210.96 4,573.22
04801 -- 05280 1,562 7,819,498.35 5,006.08
05281 -- 05760 1,599 8,894,970.53 5,562.83
05761 -- 06240 1,227 7,333,175.59 5,976.51
06241 -- 06720 694 4,493,520.01 6,474.81
06721 -- 07200 475 3,296,772.36 6,940.57
> 07201 1,907 20,786,970.60 10,900.35

83
Totaal/Total 50,820 163,079,468.50 3,208.96
Bron: Centraal Bureau Mechanische Administratie/
Source: Central Bureau for Electronic Administration
WERKGELEGENHEID & AANVERWANTE ZAKEN
EMPLOYMENT & RELATED MATTES

84
Bedrijfsclassificatie / Enterprise Classification
International Standard Industrial Classification of All Economic Activities ISIC-Rev. 2 (II)
Omschrijving Hoofdgroep/
Main group Description
Landbouw, Bosbouw, Visserij en jacht
1 Agriculture, Forestry, Fishing and Hunting
Mijnbouw
2 Mining
Industrie
3 Industry
Electriciteit, Gas en Water
4 Electricity, Gas and Water Supply
Constructie- en Bouwwerken
5 Construction
Groot- en kleinhandel, Restaurants en Hotels
6 Wholesale and Retail Trade, Restaurants and Hotels
Transport, Opslag en Communicatie
7 Transport, Storage and Communications
Financiering, Verzekering en Zakelijke diensten
8 Financial, Insurance and
Sociale en Persoonlijk diensten
9 Social and Personal Service Activities
Niet adekwaat gedefinieerd
10 Not adequate defined
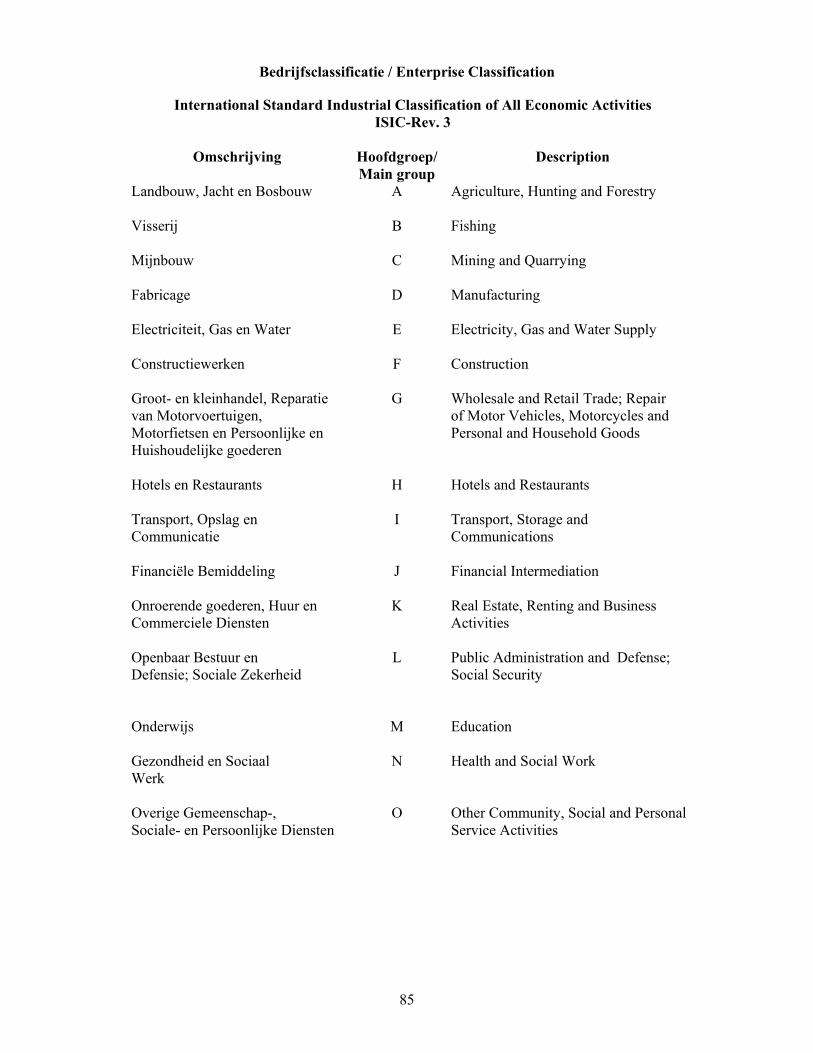
85
Bedrijfsclassificatie / Enterprise Classification
International Standard Industrial Classification of All Economic Activities ISIC-Rev. 3
Omschrijving Hoofdgroep/
Main group Description
Landbouw, Jacht en Bosbouw
A Agriculture, Hunting and Forestry
Visserij
B Fishing
Mijnbouw
C Mining and Quarrying
Fabricage
D Manufacturing
Electriciteit, Gas en Water
E Electricity, Gas and Water Supply
Constructiewerken
F Construction
Groot- en kleinhandel, Reparatie van Motorvoertuigen, Motorfietsen en Persoonlijke en Huishoudelijke goederen
G Wholesale and Retail Trade; Repair of Motor Vehicles, Motorcycles and Personal and Household Goods
Hotels en Restaurants
H Hotels and Restaurants
Transport, Opslag en Communicatie
I Transport, Storage and Communications
Financiële Bemiddeling
J Financial Intermediation
Onroerende goederen, Huur en Commerciele Diensten
K Real Estate, Renting and Business Activities
Openbaar Bestuur en Defensie; Sociale Zekerheid
L Public Administration and Defense; Social Security
Onderwijs
M Education
Gezondheid en Sociaal Werk
N Health and Social Work
Overige Gemeenschap-, Sociale- en Persoonlijke Diensten
O Other Community, Social and Personal Service Activities

86
Bedrijfsclassificatie / Enterprise Classification
International Standard Industrial Classification of All Economic Activities ISIC-Rev. 4
Omschrijving Hoofdgroep/
Main group Description
Landbouw, jacht, bosbouw & visserij
A Agriculture, forestry & fishing
Mijnbouw B Mining and quarrying
Industrie & Fabricage C Manufacturing
Electriciteit, gas, stoom en gekoelde lucht
D Electricity, gas, steam and air conditioning supply
Watervoorziening: riolering, afvalbeheer en sanering
E Water supply; sewerage, waste management and remediation activities
Constructie F Construction
Groot- & Kleinhandel en markten (Handel)
G Wholesale & retail (Trade)
Accomodatie & voedings diensten en gerelateerde zaken
H Accommodation & food service activities
Transport & opslag I Transportation & storage
Informatie & communicatie J Information & communication
Verzekerings- en andere financiele instellingen
K Financial and insurance activities
Woon- en commerciele diensten en hieraan gerelateerde diensten
L Real estate activities
Proffesionele, wetenschappelijke en technische activiteiten
M Professional, scientific and technical activities
Administratieve en ondersteunende diensten
N Administrative and support service activities
Overheid (excl onderwijs en gezondheidszorg)
O Public administration and defence; compulsory social security
Onderwijs P Education
Gezondheidszorg en sociale activiteiten
Q Human health and social work activities
Kunst, entertainment en recreatie R Arts, entertainment and recreation
Overige diensten S Other service activities
Prive huishoudens met vaste krachten
T Activities of households as employers
Activities of extraterritorial organizations and bodies
U Activities of extraterritorial organizations and bodies

87
8. Werkgelegenheid en Aanverwante Statistieken De tabellen 8.4a tot en met 8.4e, geven aan hoeveel Bedrijfsongevallen jaarlijks plaats vinden tijdens werkuren. De data in deze tabellen is voor de jaren 2013-2015 verwerkt middels het coderingssysteem van ISIC revisie II. In 2016 ging het Ministerie van Arbeid, afdeling Medisch Bureau, er toe over om de data volgens de ISIC revisie IV te verwerken. Kijken we naar ongevallen in de categorie “getroffen lichaamsdeel” (tabel 8.5d), dan zien we dat bij de meeste ongevallen de boven ledematen worden getroffen, gevolgd door de onder ledematen.
8. Employment and Related Statistics Tables 8.4a to 8.4e indicate how many Accidents take place annually during working hours. For the years 2013-2015, the data in these tables has been processed using the ISIC revision II coding system. In 2016, the Ministry of Labor, Department Medical Bureau, proceeded to process the data according to the ISIC revision IV. If we look at accidents in the category "affected body part" (table 8.5d), we see that in most accidents the upper limbs are affected, followed by the lower limbs.

88
Tabel 8.1: Het aantal werkzame personen per ministerie, december 2014 - december 2016
Table 8.1: Number of Persons Employed per Ministry,
December 2014 - December 2016
Ministerie / Ministry dec/Dec 2014 dec/Dec 2015 dec/Dec 2016 Justitie & Politie / Justice & Police 5,110 5,146 5,083Binnenlandse Zaken / Home Affairs 2,316 3,190 3,423 Regionale Ontwikkeling / Regional Development 5,573 6,835 6,803 Defensie / Defence 3,948 4,361 4,598 Buitenlandse Zaken /Foreign Affairs 234 249 229 Financiën /Finance 1,370 1,387 1,327 Handel & Industrie / Trade & Industry 408 647 620 Landbouw Veeteelt & Visserij / Agriculture, Animal Husbandry & Fishery 1,109 1,418 1,364 Natuurlijke Hulpbronnen /Natural Resources 769 913 868 Arbeid / Labour 344 405 389 Sociale Zaken & Volkshuisvesting / Social Affairs and Housing 2,306 2,705 2,685 Onderwijs /Education 17,150 18,417 18,208 Sport & Jeugdzaken/ Sports & Youth Welfare Volksgezondheid /Public Health 5,820 5,952 5,852 Openbare Werken /Public Works 1,541 1,634 1,523 Transport, Communicatie en Toerisme / Transport, Communication & Tourism 698 1,099 1,031 Ruimtelijke Ordening, Grond- en Bosbeheer / Physical Planning, Land and Forest Management 525 554 526
Totaal / Total 49,221 54,912 54,529
Bron: Centraal Bureau Mechanische Administratie (Cebuma) Source: Central Bureau of Mechanical Administration (Cebuma)

T
Tab
Jaar/ Year
2013
2014 #
2015 #
2016
Bron : ASource : G
Graf
Tabel 8.2: Hwer
ble 8.2: NumbUnemploym
r WerkzamEmploy
[a]
140,89
146,25
138,05
135,21
Algemeen BuGeneral Bure
fiek 8.1: Het
Graph 8.
0
20,000
40,000
60,000
80,000
100,000
120,000
140,000
160,000
Werkzam
Werklozen
Het aantal werkloosheidspe
ber of Emploment Rate ac
men yed
WerUnem
95 9
53 8
51 10
14 14
ureau voor deeau of Statist
aantal werk
1: Number o
2013
en / Employe
n / Unemploy
rkzamen, weercentage in
(Paramari
oyed and Uneccording to S
(Paramarib
rklozen mployed
O
[b]
9,960
8,482
0,621
4,410
e Statistiek, aftics, Section o
kzamen en we
of Employed (Paramarib
2014
ed
yed
erklozen en "strikte en ruibo en Wanic
employed Petrict and Relbo and Wani
Ontmoedigden
Discouraged workers
[c]
5,456
6,754
6,904
8,748
afdeling Huishof Houshold S
erklozen, 201
and Unemplbo and Wani
201
"discourageduime zin, 201ca)
ersons, Discolaxed Definitica)
n/ StriWerkloo
percenUnempl
rate, Sdefini
[b/(a+b)
7
5
7
10
houdonderzoSurveys
13 - 2016 (Pa
loyed Personica)
15
d workers" e13 – 2016
ouraged Wortion, 2013 - 2
ikt osheids-ntage / oyment Strict ition
R
) x 100]
7
5
7
0
oeken
aramaribo en
ns, 2013 - 201
2016
en het
rkers and 2016
Ruim Werklopercentag
UnemploymeRelaxed defi
[(b+c)/(a+b+c
10
9
11
15
n Wanica)
16
osheids-ge /
ent rate, inition
c) x 100]

90
Tabel 8.3a: Ongevallen geclassificeerd naar Bedrijfstak, 2013 – 2015
Table 8.3a: Accidents Classified by Type of Activity, 2013 – 2015
Type ongeval / Jaar / Bedrijfstak / Type of Activity Totaal / Type of Accident Year 1 2 3 4 5 6 7 8 9 0 Total Val van personen/ 2013 112 14 48 11 35 57 9 10 12 - 308 Falling of Persons 2014 79 11 46 5 33 58 11 13 10 - 266 2015 112 10 44 12 28 49 7 5 7 - 274 Gevallen voorwerpen/ 2013 37 9 36 1 43 26 3 2 6 - 163 Falling Objects 2014 38 11 32 1 28 26 3 3 6 - 148 2015 46 3 24 3 17 21 3 2 2 - 121 Trappen op voorwerpen; getroffen 2013 98 29 77 12 50 40 6 4 16 - 332 worden door bewegende 2014 52 23 62 5 50 22 6 10 9 - 239 voorwerpen/ Stepping on objects; 2015 86 37 75 15 53 35 7 6 6 - 320 Being struck by Striking objects Bekneld geraakt tussen voorwerpen/ 2013 6 3 18 1 13 17 2 - 2 - 62 Caught in or between Objects 2014 10 5 15 2 6 7 2 2 1 - 50 2015 9 2 8 - 7 14 2 - - - 42 Grote inspanning of verkeerde 2013 1 6 5 1 12 15 1 1 1 - 43 Bewegingen/ Overexerction or 2014 2 4 6 1 10 11 - 3 4 - 41 wrong movements 2015 6 3 5 - 3 8 - 4 - - 29 Blootgesteld zijn aan of in contact 2013 - 2 3 - 3 3 - - - - 11 gekomen zijn met extreme 2014 - 2 5 1 - 1 1 - 2 - 12 temperatuur/ Exposure to or contact 2015 - - - - 1 1 1 - - - 3 with extreme temperature Blootgesteld zijn aan of in contact 2013 - - 1 - 2 - - - - - 3 gekomen zijn met electrische 2014 - 1 - - - - - - - - 1stroom/ Exposure to or contact with 2015 - - - 1 2 1 - - - - 4 electricity Schadelijke stoffen of stralingen/ 2013 - 4 - - 3 - - - - - 7 Harmful substances or radiations 2014 - 4 - - 7 - - 4 - - 15 2015 - 2 2 - - 1 - - - - 5 Andere ongevallen, niet elders 2013 31 8 24 16 19 55 14 13 12 - 192 geclassificeerd/ 2014 49 30 39 16 47 43 9 24 12 - 269Other accidents not classified 2015 59 10 38 18 18 45 11 28 13 1 241 elsewhere Total 2013 285 75 212 42 180 213 35 30 49 - 1,121 2014 230 91 205 31 181 168 32 59 44 - 1,041 2015 321 68 197 49 130 175 31 45 28 1 1,045
Noot/Note: Bedrijfstak volgens ISIC Revisie II / Type of Activity according to ISIC, Revision II Bron : Ministerie van Arbeid, Medisch Bureau Source : Ministry of Labour, Medical Bureau

91
Tabel 8.3aa: Ongevallen geclassifeerd naar ISIC hoofdgroep, 2016
Table 8.3aa: Accidents Classified by ISIC Main Group, 2016
Type ongeval / Type of Accidents Hoofdgroep / Main Group (ISIC Rev 4)
Val
van
per
son
en /
Fal
ling
of P
erso
ns
Gev
alle
n v
oorw
erpe
n/ F
allin
g ob
ject
s
Tra
ppen
op
voo
rwer
pen
; ge
trof
fen
wor
den
doo
r b
eweg
end
e vo
orw
erp
en /
Ste
ppin
g on
ob
ject
s; B
ein
g st
ruck
by
Str
ikin
g ob
ject
s
Bek
nel
d g
eraa
kt t
uss
en v
oorw
erp
en/ C
augh
t in
or
bet
wee
n o
bje
cts
Gro
te in
span
nin
g of
ver
kee
rde
bew
egin
gen
/ O
vere
xerc
tion
or
wro
ng
mov
emen
ts
Blo
otge
stel
d z
ijn
aan
of
in c
onta
ct g
ekom
en z
ijn
met
ext
rem
e te
mpe
ratu
ur /
Exp
osu
re t
o or
con
tact
wit
h e
xtre
me
tem
per
atu
re
Blo
otge
stel
d z
ijn
aan
of
in c
onta
ct g
ekom
en z
ijn
met
ele
ctri
sche
st
room
/ Exp
osu
re t
o or
con
tact
wit
h e
lect
rici
ty
Sch
adel
ijk
e st
offe
n o
f st
ralin
gen
/ Har
mfu
l su
bst
ance
s of
ra
dia
tion
s
An
der
e on
geva
llen
, nie
t el
der
s ge
clas
sife
erd
/ Oth
er a
ccid
ents
not
cl
assi
fied
els
ewh
ere
On
beke
nd
/ U
nk
now
n
Totaal/ Total
A 95 39 84 5 3 1 - 2 35 6 270
B 5 3 15 8 2 1 - 4 9 2 49
C 39 17 44 11 6 - - - 24 4 145
D 6 1 4 2 2 2 - - 13 - 30
E 9 - 5 1 - - - - 8 - 23
F 18 19 37 6 2 2 - 1 20 4 109
G 28 19 35 4 6 3 - - 44 1 140
H 4 3 2 - 1 - - - 3 2 15
I 10 3 3 1 3 7 - - 7 1 35
J 1 - - - - - - - - - 1
K 4 - - - - - - - 2 - 6
L - - - - - - - - - - -
M 3 - 5 1 1 - - - 3 - 13
N 10 1 4 2 1 - - - 17 1 36
O - - - - - - - - - - -
P - - 1 - - - - - 2 - 3
Q 2 - 2 - 1 - - - 2 - 7
R - - - - - - - - 1 - 1
S - - 2 - - 1 - - 1 - 4
T - - - - - - - - - - -
U - - - - - - - - - - - Totaal/ Total 234 105 243 41 28 17 - 7 191 21 887
Noot/Note: Bedrijfstak volgens ISIC Revisie IV / Type of Activity according to ISIC, Revision IV
Bron: Ministerie van Arbeid, Medisch Bureau Source: Ministry of Labour, Medical Bureau

92
Tabel 8.3b: Ongevallen geclassificeerd naar Bedrijfstak en naar ernst van het ongeval, 2013 – 2015
Table 8.3b: Accidents Classified by Type of Activity and Seriousness of the Accident,
2013 – 2015
Ernst van ongeval/ Jaar/
Bedrijfstak / Type of Activity Totaal/
Seriousness of Accidents
Year 1 2 3 4 5 6 7 8 9 0
Total
Niet ernstig / 2013 240 43 131 34 93 128 14 14 28 - 725 Not Serious 2014 202 61 123 19 106 110 24 35 23 - 703 2015 249 45 101 31 69 100 12 20 16 1 644 Matig / 2013 28 21 49 5 55 47 9 8 12 - 234 Nearly Serious 2014 17 22 44 3 37 27 2 7 8 - 167
2015 46 15 51 10 28 39 4 10 4 - 207
Zeer ernstig / 2013 14 11 32 3 29 37 9 7 9 - 151 Very Serious 2014 9 6 31 1 32 29 6 13 12 - 139 2015 16 8 36 2 22 26 9 6 5 - 130 Dodelijk / 2013 3 - - - 3 1 3 1 - - 11 Fatal 2014 2 1 2 - 4 1 - 2 - - 12 2015 1 - 1 1 - 1 1 2 - - 7 Onbekend/ 2013 - - - - - - - - - - - Unknown 2014 - 1 5 8 2 1 - 2 1 - 20 2015 9 - 8 5 11 9 5 7 3 - 57 Total 2013 285 75 212 42 180 213 35 30 49 - 1,121 2014 230 91 205 31 181 168 32 59 44 - 1,041 2015 321 68 197 49 130 175 31 45 28 1 1,045 Verloren man- 2013 26,059 1,258 3,851 442 26,311 11,678 23,261 8,302 1,248 - 102,410 dagen / 2014 25,100 7,923 16,944 82 31,637 9,727 255 15,305 643 - 107,616 Lost Man Days 2015 . . . . . . . . . . .
Noot/Note: Bedrijfstak volgens ISIC Revisie II / Type of Activity according to ISIC, Revision II Bron : Ministerie van Arbeid, Medisch Bureau Source : Ministry of Labour, Medical Bureau

93
Tabel 8.3bb : Ongevallen geclassificeerd naar ISIC hoofdgroep en naar ernst van ongeval, 2016
Table 8.3bb : Accidents Classified by ISIC Main Group and Seriousness of Accident,
2016
Ernst van ongeval / Seriousness of Accidents Hoofdgroep / Main Group (ISIC Rev 4)
Niet ernstig/ Not Serious
Matig/ Nearly Serious
Zeer ernstig/ Very Serious
Dodelijk/ Fatal
Onbekend/ Unknown
Totaal/ Total
Verloren mandagen/
Lost Man Days A 246 13 8 3 - 270 24,414 B 42 2 4 1 - 49 7,672 C 99 27 14 1 4 145 8,542 D 21 8 1 - - 30 95 E 17 5 1 - - 23 135 F 86 15 8 - - 109 1,050 G 99 20 19 2 - 140 16,412 H 10 3 2 - - 15 227 I 28 4 3 - - 35 324 J - 1 - - - 1 - K 2 3 1 - - 6 92 L - - - - - - - M 11 1 1 - - 13 24 N 28 3 4 1 - 36 7,855 O - - - - - - - P 2 - - 1 - 3 7,507 Q 4 1 2 - - 7 13 R - - 1 - - 1 34 S 2 2 - - - 4 24 T - - - - - - - U - - - - - - -
Totaal/ Total 697 108 69 9 4 887 74,420
Noot/Note: Bedrijfstak volgens ISIC Revisie IV / Type of Activity according to ISIC, Revision IV Bron : Ministerie van Arbeid, Medisch Bureau Source : Ministry of Labour, Medical Bureau

94
Tabel 8.3c : Ongevallen geclassificeerd naar Bedrijfstak en naar werktuig waarmee het ongeval plaats vond, 2013- 2015
Table 8.3c : Accidents Classified by Type of Activity and by Tools with what the Accident took
place, 2013 -2015
Type ongeval/ Jaar/ Bedrijfstak / Type of Activity Totaal/ Type of Accidents Year 1 2 3 4 5 6 7 8 9 0 Total Machines / 2013 12 4 23 1 15 9 - - 3 - 67 Engines 2014 7 2 17 - 7 5 - 1 1 - 40 2015 7 7 25 2 8 5 2 1 - - 57 Transportmiddelen en hef- 2013 44 3 9 7 17 22 4 6 4 - 116 werktuigen / Vehicles and 2014 34 3 14 1 13 21 2 3 2 - 93 Lifting Tools 2015 57 3 19 4 4 26 3 3 5 - 124 Andere werktuigen / 2013 55 8 14 3 15 7 - - 5 - 107 Other Tools 2014 42 7 11 1 18 10 3 3 5 - 100 2015 59 4 17 4 20 17 3 2 3 1 130 Materialen, stoffen en 2013 82 37 88 8 84 58 10 4 17 - 388 stralingen / Materials, 2014 22 24 50 4 47 26 8 9 8 - 198 substances and Radiations 2015 62 35 60 10 51 53 60 9 4 - 344 Werkomgeving/ 2013 82 16 73 16 45 113 21 20 18 - 404 Work Environments 2014 116 39 109 16 85 104 18 39 25 - 551 2015 114 16 67 22 44 74 17 30 13 - 397 Andere zaken, niet elders 2013 10 7 5 7 4 4 - - 2 - 39 geclassificeerd / Other 2014 9 16 4 9 11 2 1 4 3 - 59 Matters, not Classified 2015 20 3 9 7 2 - - - 3 - 44 Elsewhere Totaal / Total 2013 285 75 212 42 180 213 35 30 49 - 1,121 2014 230 91 205 31 181 168 32 59 44 - 1,041 2015 321 68 197 49 130 175 31 45 28 1 1,045
Noot/Note: Bedrijfstak volgens ISIC Revisie II / Type of Activity according to ISIC, Revision II Bron : Ministerie van Arbeid, Medisch Bureau Source : Ministry of Labour, Medical Bureau

95
Tabel 8.3cc: Ongevallen geclassificeerd naar ISIC hoofdgroep en naar werktuig waarmee het ongeval plaats vond, 2016
Table 8.3cc: Accidents Classified by ISIC Main Group and by Tools with what the Accidents
took place, 2016
Type ongeval (werktuig) / Type of Accidents (Tools) Hoofdgroep / Main Group (ISIC Rev 4)
Mac
hin
es /
En
gin
es
Tra
nsp
ortm
idd
en e
n h
efw
erk
tuig
en /
Veh
icle
s an
d L
ifti
ng T
ools
And
ere
wer
ktu
igen
/ O
ther
Too
ls
Mat
eria
len,
sto
ffen
en
str
alin
gen/
M
ater
ials
, su
bst
ance
s an
d R
adia
tion
s
Wer
kom
gevi
ng /
Wor
k E
nvir
onm
ents
An
der
e za
kn
e, n
iet
eld
ers
gecl
assi
feer
d
/ O
ther
Mat
ters
, not
cla
ssif
ied
el
sew
here
Onb
eken
d /
Unk
now
n
Totaal/ Total
A 19 34 73 45 77 19 3 270 B 3 4 1 29 10 1 1 49 C 17 15 13 43 51 5 1 145 D 1 2 4 3 16 - 4 30 E - 8 - 5 4 6 - 23 F 8 11 15 45 27 2 1 109 G 9 16 4 45 60 4 2 140 H - 1 - 6 7 - 1 15 I 2 3 2 12 16 - - 35 J - 1 - - - - - 1 K - - 1 - 5 - - 6 L - - - - - - - - M - 1 1 2 6 3 - 13 N 1 3 1 7 24 - - 36 O - - - - - - - - P - - - - 2 1 - 3 Q - - - 4 3 - - 7 R - - - - 1 - - 1 S - 1 1 - 2 - - 4 T - - - - - - - - U - - - - - - - -
Totaal/ Total 60 100 116 246 311 41 13 887 Noot/Note: Bedrijfstak volgens ISIC Revisie IV / Type of Activity according to ISIC, Revision IV Bron : Ministerie van Arbeid, Medisch Bureau Source : Ministry of Labour, Medical Bureau

96
Tabel 8.3d : Ongevallen geclassificeerd naar Bedrijfstak en naar getroffen lichaamsdeel, 2013 – 2015
Table 8.3d : Accidents Classified by Type of Activity and by Hit Part of the Body,
2013 – 2015
Getroffen lichaamsdeel/ Jaar/ Bedrijfstak / Type of Activity Totaal/ Hit Part of the Body Year 1 2 3 4 5 6 7 8 9 0 Total Hoofd / 2013 34 7 29 4 22 20 3 - 5 - 124 Head 2014 27 22 28 2 29 10 4 9 7 - 138 2015 40 15 21 4 19 15 3 7 3 - 127 Hals / 2013 1 1 - - 2 1 - - - - 5 Neck 2014 4 2 - - 3 2 - - - - 11 2015 2 1 - - - - - - - - 3 Romp / 2013 15 5 10 2 9 17 2 4 4 - 68 Trunk 2014 10 2 8 1 13 7 3 2 2 - 48 2015 23 5 4 1 4 12 3 6 3 - 61 Boven ledematen / 2013 109 26 99 14 73 77 11 9 21 - 439 Upper Limps 2014 73 27 89 7 58 46 9 13 14 - 336 2015 96 22 92 14 42 57 8 8 8 - 347 Onder ledematen / 2013 78 25 49 17 52 56 13 7 11 - 308 Lower Limps 2014 85 19 55 12 46 65 8 18 12 - 320 2015 104 11 51 16 39 54 9 9 5 1 299 Meervoudige Locaties / 2013 45 7 24 4 18 40 4 9 7 - 158 Multiple Locations 2014 27 15 22 8 23 37 7 9 9 - 157 2015 47 12 20 10 23 33 4 12 7 - 168 Algemene Locaties / 2013 - 1 - - 2 - - - - - 3 General Locations 2014 - - 1 - 1 - - 2 - - 4 2015 - 1 1 - - - - - 1 - 3 Niet nader gespecificeerd / 2013 3 3 1 1 2 2 2 1 1 - 16 Not Specificied further 2014 4 4 2 1 8 1 1 6 - - 27 2015 5 1 5 1 1 3 2 2 1 - 21 Totaal / 2013 285 75 212 42 180 213 35 30 49 - 1,121 Total 2014 230 91 205 31 181 168 32 59 44 - 1,041 2015 321 68 197 49 130 175 31 45 28 1 1,045 Noot/Note: Bedrijfstak volgens ISIC Revisie II / Type of Activity according to ISIC, Revision II Bron : Ministerie van Arbeid, Medisch Bureau Source : Ministry of Labour, Medical Bureau
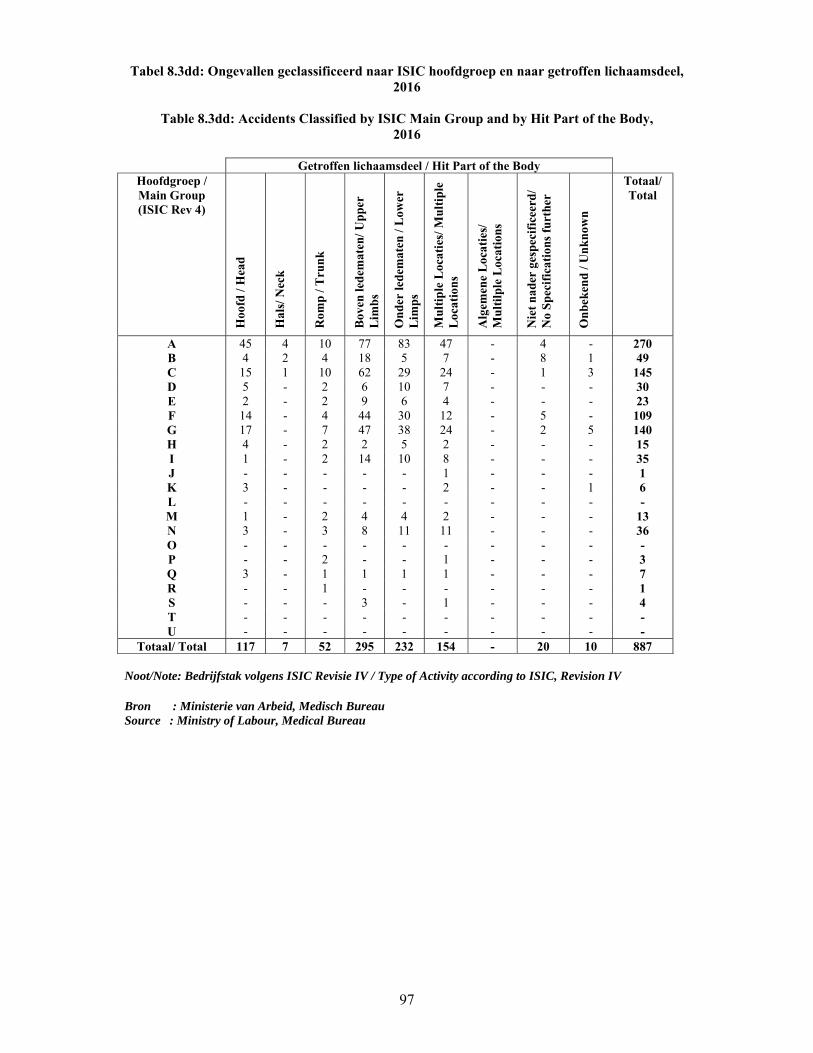
97
Tabel 8.3dd: Ongevallen geclassificeerd naar ISIC hoofdgroep en naar getroffen lichaamsdeel, 2016
Table 8.3dd: Accidents Classified by ISIC Main Group and by Hit Part of the Body,
2016
Getroffen lichaamsdeel / Hit Part of the Body Hoofdgroep / Main Group (ISIC Rev 4)
Hoo
fd /
Hea
d
Hal
s/ N
eck
Rom
p / T
run
k
Bov
en le
dem
aten
/ Up
per
L
imbs
On
der
led
emat
en /
Low
er
Lim
ps
Mul
tip
le L
ocat
ies/
Mul
tipl
e L
ocat
ion
s
Alg
emen
e L
ocat
ies/
M
ulti
lple
Loc
atio
ns
Nie
t n
ader
ges
peci
fice
erd
/ N
o S
pec
ific
atio
ns f
urth
er
On
bek
end
/ U
nk
now
n
Totaal/ Total
A 45 4 10 77 83 47 - 4 - 270 B 4 2 4 18 5 7 - 8 1 49 C 15 1 10 62 29 24 - 1 3 145 D 5 - 2 6 10 7 - - - 30 E 2 - 2 9 6 4 - - - 23 F 14 - 4 44 30 12 - 5 - 109 G 17 - 7 47 38 24 - 2 5 140 H 4 - 2 2 5 2 - - - 15 I 1 - 2 14 10 8 - - - 35 J - - - - - 1 - - - 1 K 3 - - - - 2 - - 1 6 L - - - - - - - - - - M 1 - 2 4 4 2 - - - 13 N 3 - 3 8 11 11 - - - 36 O - - - - - - - - - - P - - 2 - - 1 - - - 3 Q 3 - 1 1 1 1 - - - 7 R - - 1 - - - - - - 1 S - - - 3 - 1 - - - 4 T - - - - - - - - - - U - - - - - - - - - -
Totaal/ Total 117 7 52 295 232 154 - 20 10 887 Noot/Note: Bedrijfstak volgens ISIC Revisie IV / Type of Activity according to ISIC, Revision IV Bron : Ministerie van Arbeid, Medisch Bureau Source : Ministry of Labour, Medical Bureau
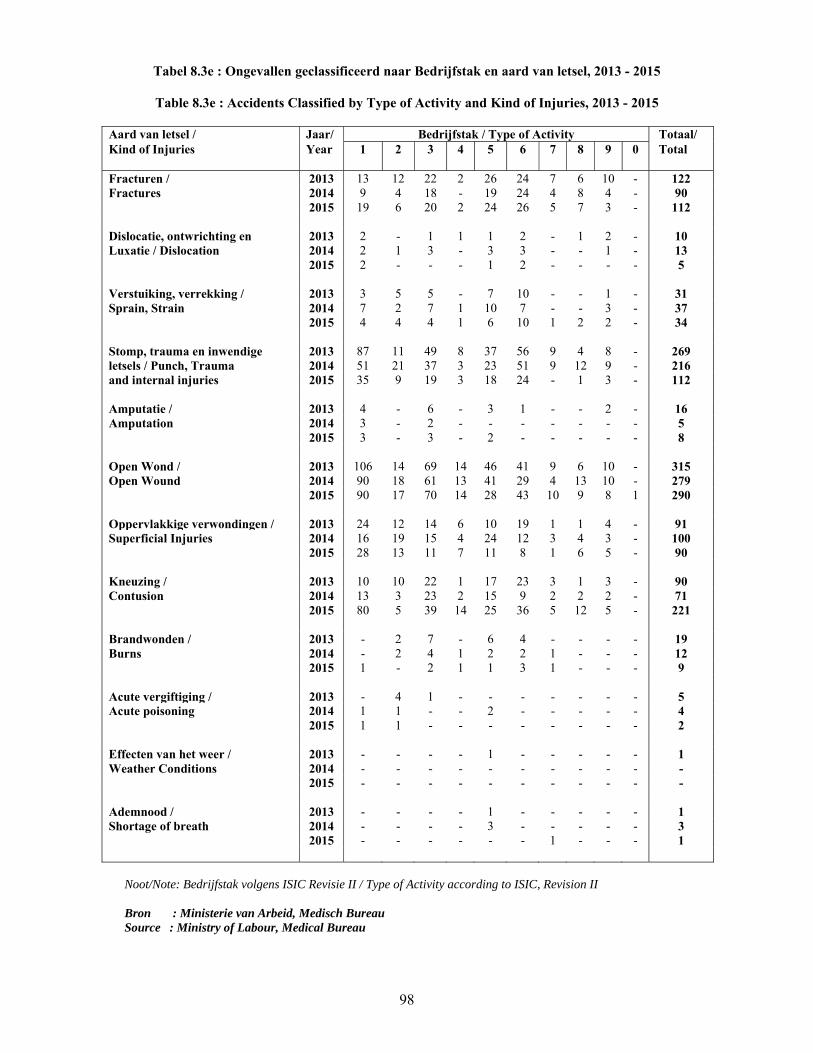
98
Tabel 8.3e : Ongevallen geclassificeerd naar Bedrijfstak en aard van letsel, 2013 - 2015
Table 8.3e : Accidents Classified by Type of Activity and Kind of Injuries, 2013 - 2015
Aard van letsel / Jaar/ Bedrijfstak / Type of Activity Totaal/ Kind of Injuries
Year 1 2 3 4 5 6 7 8 9 0 Total
Fracturen / 2013 13 12 22 2 26 24 7 6 10 - 122 Fractures 2014 9 4 18 - 19 24 4 8 4 - 90 2015 19 6 20 2 24 26 5 7 3 - 112 Dislocatie, ontwrichting en 2013 2 - 1 1 1 2 - 1 2 - 10 Luxatie / Dislocation 2014 2 1 3 - 3 3 - - 1 - 13 2015 2 - - - 1 2 - - - - 5 Verstuiking, verrekking / 2013 3 5 5 - 7 10 - - 1 - 31 Sprain, Strain 2014 7 2 7 1 10 7 - - 3 - 37 2015 4 4 4 1 6 10 1 2 2 - 34 Stomp, trauma en inwendige 2013 87 11 49 8 37 56 9 4 8 - 269 letsels / Punch, Trauma 2014 51 21 37 3 23 51 9 12 9 - 216 and internal injuries 2015 35 9 19 3 18 24 - 1 3 - 112 Amputatie / 2013 4 - 6 - 3 1 - - 2 - 16 Amputation 2014 3 - 2 - - - - - - - 5 2015 3 - 3 - 2 - - - - - 8 Open Wond / 2013 106 14 69 14 46 41 9 6 10 - 315 Open Wound 2014 90 18 61 13 41 29 4 13 10 - 279 2015 90 17 70 14 28 43 10 9 8 1 290 Oppervlakkige verwondingen / 2013 24 12 14 6 10 19 1 1 4 - 91Superficial Injuries 2014 16 19 15 4 24 12 3 4 3 - 100 2015 28 13 11 7 11 8 1 6 5 - 90 Kneuzing / 2013 10 10 22 1 17 23 3 1 3 - 90 Contusion 2014 13 3 23 2 15 9 2 2 2 - 71 2015 80 5 39 14 25 36 5 12 5 - 221 Brandwonden / 2013 - 2 7 - 6 4 - - - - 19 Burns 2014 - 2 4 1 2 2 1 - - - 12 2015 1 - 2 1 1 3 1 - - - 9 Acute vergiftiging / 2013 - 4 1 - - - - - - - 5Acute poisoning 2014 1 1 - - 2 - - - - - 4 2015 1 1 - - - - - - - - 2 Effecten van het weer / 2013 - - - - 1 - - - - - 1 Weather Conditions 2014 - - - - - - - - - - - 2015 - - - - - - - - - - - Ademnood / 2013 - - - - 1 - - - - - 1 Shortage of breath 2014 - - - - 3 - - - - - 3 2015 - - - - - - 1 - - - 1
Noot/Note: Bedrijfstak volgens ISIC Revisie II / Type of Activity according to ISIC, Revision II Bron : Ministerie van Arbeid, Medisch Bureau Source : Ministry of Labour, Medical Bureau

99
Tabel 8.3e : Ongevallen geclassificeerd naar Bedrijfstak en aard van letsel, 2013 - 2015 (vervolg)
Table 8.3e : Accidents Classified by Type of Activity and Kind of Injuries,
2013 - 2015 (continued)
Aard van letsel / Jaar/ Bedrijfstak / Type of Activity Totaal/ Kind of Injuries
Year 1 2 3 4 5 6 7 8 9 0 Total
Effecten van electrische stroom/ 2013 - - - 1 2 - - 1 - - 4 Effects of Electricity 2014 1 1 1 - - - - - 1 - 4 2015 - - - 1 2 1 - - - - 4 Effecten van Stralingen/ 2013 - - - - - - - - - - - Effects of Radiations 2014 - - - - - - - - - - - 2015 - - - - - - - - - - - Meervoudige letsels/ 2013 36 2 15 6 18 30 2 9 8 - 126 Multiple Injuries 2014 34 11 28 5 31 30 8 11 9 - 167 2015 47 8 21 1 7 16 2 3 2 - 107 Niet nader gespecificeerde letsels/ 2013 - 3 1 3 5 3 4 1 1 - 21 Not further Classified Injuries 2014 3 8 6 2 8 1 1 9 2 - 40 2015 5 5 7 2 4 4 2 4 - - 33 Totaal / Total 2013 285 75 212 42 180 213 35 30 49 - 1,121 2014 230 91 205 31 181 168 32 59 44 - 1,041 2015 321 68 197 49 130 175 31 45 28 1 1,045
Noot/Note: Bedrijfstak volgens ISIC Revisie II / Type of Activity according to ISIC, Revision II Bron : Ministerie van Arbeid, Medisch Bureau Source : Ministry of Labour, Medical Bureau

100
Tabel 8.3ee: Ongevallen geclassifeerd naar ISIC hoofdgroep en aard van letsel, 2016
Table 8.3ee: Accidents Classified by ISIC Main Group and Kind of Injuries, 2016
Aard van letsel / Kind of Injuries Hoofdgroep / Main Group (ISIC Rev 4)
Fra
ctu
ren
/ F
ract
ures
Dis
loca
tie,
on
twri
chti
ng
en L
uxat
ie /
Dis
loca
tion
Ver
stu
ikin
g, v
erre
kki
ng
/ Sp
rain
, S
trai
n
Sto
mp
, tra
um
a en
inw
endi
ge le
tsel
s/
Pu
nch
, Tra
uma
and
In
tern
al in
juri
es
Am
pu
tati
e / A
mp
uta
tion
Ope
n w
ond
/ O
pen
Wou
nd
Opp
ervl
akki
ge v
erw
ondi
nge
n /
Su
per
fici
al I
nju
ries
Kne
uzin
g / C
ontu
sion
Bra
ndw
onde
n/ B
urns
Sub totaal/ Sub Total
A 10 1 4 32 3 95 29 60 3 237 B 3 2 4 5 - 8 5 4 1 32 C 16 - 4 14 6 34 21 30 1 126 D - 1 3 2 - 5 5 8 2 26 E - - - 2 - 6 6 5 - 19 F 14 2 2 7 - 31 14 20 3 93 G 26 - 4 16 3 27 16 24 4 120 H 2 - 2 3 - 2 2 1 1 13 I 4 1 3 1 2 3 2 7 8 31 J - - - - - - 1 - - 1 K 2 - - - 1 1 - 1 - 5 L - - - - - - - - - - M 1 - 2 2 - 2 3 2 - 12 N 5 - 2 4 2 5 3 9 - 30 O - - - - - - - - - - P - - - 1 - - - 1 - 2 Q 1 - 1 1 - 1 1 2 - 6 R 1 - - - - - - - - 1 S - - - - - 1 1 - 1 3 T - - - - - - - - - - U - - - - - - - - - -
Totaal/ Total 85 7 31 90 17 221 109 174 24 758 Noot/Note: Bedrijfstak volgens ISIC Revisie IV / Type of Activity according to ISIC, Revision IV
Bron : Ministerie van Arbeid, Medisch Bureau Source : Ministry of Labour, Medical Bureau

101
Tabel 8.3ee: Ongevallen geclassifeerd naar ISIC hoofdgroep en aard van letsel, 2016 vervolg
Table 8.3ee: Accidents Classified by ISIC Main Group and Kind of Injuries,
2016 continued
Aard van letsel / Kind of Injuries Hoofdgroep / Main Group (ISIC Rev 4)
Su
b t
otaa
l/ Su
b T
otal
Acu
te v
ergi
ftig
ing
/ Acu
te T
oxif
icat
ion
Eff
ecte
n v
an h
et w
eer
/ Wea
ther
C
ond
itio
ns
Ad
emn
ood
/ Sh
orta
ge o
f br
eath
Eff
ecte
n v
an e
lect
risc
he s
troo
m /
Eff
ects
of
Ele
ctri
city
Eff
ecte
n v
an s
tral
inge
n /
Eff
ects
of
Rad
iati
ons
Mu
ltip
le le
tsel
s/ M
ult
iple
In
juri
es
Nie
t na
der
ges
pec
ific
eerd
e le
tsel
s / N
ot
furt
her
cla
ssif
ied
Inju
ries
onb
eken
d / U
nkno
wn
Totaal / Total
A 237 1 - 1 - - 25 3 3 270 B 32 1 - - - - 4 11 1 49 C 126 - - - - - 14 2 3 145 D 26 - - - - - 4 - - 30 E 19 - - - - - 4 - - 23 F 93 - - - - - 6 9 1 109 G 120 - - - - - 13 5 2 140 H 13 - - - - - 2 - - 15 I 31 - - - - - 3 1 - 35 J 1 - - - - - - - - 1 K 5 - - - - - - - 1 6 L - - - - - - - - - - M 12 - - - - - - 1 - 13 N 30 - - - - - 4 - 2 36 O - - - - - - - - - - P 2 - - - - - 1 - - 3 Q 6 - - - - - - - - 7 R 1 - - - - - - - - 1 S 3 - - - - - 1 - - 4 T - - - - - - - - - - U - - - - - - - - - -
Totaal/ Total 758 2 - 1 - - 81 32 13 887 Noot/Note: Bedrijfstak volgens ISIC Revisie IV / Type of Activity according to ISIC, Revision IV Bron : Ministerie van Arbeid, Medisch Bureau Source : Ministry of Labour, Medical Bureau

102
Ons leuze:
Zonder statistieken…… Geen planning Zonder planning…….
Geen toekomst

103
ONDERWIJS
EDUCATION

104
Tot.lln / Pup.
= Totaal aantal Leerlingen
Total Number of Pupils
Zit. / Rep. = Zittenblijvers Repeaters Resp School = Respons School Response School j/y = Jaar Year K.O. = Kleuteronderwijs Pre-Primary School G.L.O. = Gewoon Lager Onderwijs Primary School L.B.G.O. = Lager Beroepsgericht Onderwijs Junior Secondary Vocational School L.B.O. = Lager Beroeps Onderwijs
Junior Secondary Vocational School
M.U.L.O. = Meer Uitgebreid Lager Onderwijs Junior Secondary General School L.T.O. = Lager Technisch Onderwijs Junior Secondary Technical School E.B.O. = Elementair Beroeps Onderwijs Junior Elementary Vocational School E.T.O. = Elementair Technisch Onderwijs Junior Elementary Technical School E.N.O. = Eenvoudig Nijverheids Onderwijs Junior Simple Home Economics E.T.S. = Eenvoudig Technische School Simple Technical School L.H.N.O. = Lager Huishoud- en
Nijverheids Onderwijs Junior Secondary Vocational Home Economics
N.O. = Nijverheids Onderwijs School for Domestic Sciences VOJ = Voortgezet Onderwijs op Junioren
niveau Junior Secondary Level Education
V.W.M.K.O
= Voorbereidend Wetenschappelijk Middelbaar en Kweekschool Onderwijs
Pre-University and Teacher Training College
-V.W.O.
= Voorbereidend Wetenschappelijk Onderwijs
Senior Secondary-General Academic
-H.A.V.O.
= Hoger Algemeen Vormend Onderwijs
Senior Secondary-General Ordinary
-N.A.T.I.N.
= Natuur Technisch Instituut
Senior Secondary-Technical College

105
S.G.N. = Scholen Gemeenschap Nickerie School Community Nickerie
H.N.H.S
= Henry Noer Hassankhan Scholengemeenschap
Henry Noer Hassankhan Scholengemeenschap
I.M.E.A.O. = Instituut voor Middelbaar
Economisch en Administratief Onderwijs
Institution for Secondary Economic and Administrative Education
A.C.I. = Albert Cameron Instituut Albert Cameron Institution C.P.I. = Christelijke Pedagogische Instituut Christian Pedagogical Institution S.P.I. = Surinaamse Pedagogische Instituut Surinamese Pedagogical Institution A.M.S. = Algemene Middelbare School Algemene Middelbare School M.B.O.
= Middelbaar Beroepsgericht Onderwijs
Intermediate Vocational Education
AdeK Univ. = Anton de Kom Universiteit Anton de Kom University of Suriname
van Suriname
I.O.L. = Instituut voor de Opleiding van Leraren
Institute for Advanced Teacher Training
P.T.C. = Poly Technische College Poly Technical College L.O.B.O. = Lerarenopleiding voor
Beroepsgericht Onderwijs
Training College for Teachers of Vocational Schools
A.H.K.C.O. = Akademie voor Hoger Kunst- en Cultuur Onderwijs
Academy of Arts

106
Kl.6 over = Deze studenten zijn niet geslaagd voor de G.L.O.-6 toets, maar zijn jong genoeg om de G.L.O. 6e klas over te doen en kunnen opnieuw deelnemen aan de toets
These students failed the G.L.O.- 6 test, but can retake it and are young enough to repeat G.L.O.- grade 6
Schooladv. = Deze studenten slaagden met lage
cijfers voor de toets. De school kan hen adviseren een lagere technische beroepsopleiding te volgen
These students received a low pass, the school can advise them into a lower technical junior secondary option
Kl.6 S adv. = Deze studenten zijn niet geslaagd,
maar kunnen de G.L.O.- toets opnieuw maken. Zij zijn reeds 13 jaren oud, maar nog geen 14, waardoor zij de 6e klas kunnen overdoen of het advies kunnen krijgen een lagere technische beroepsopleiding te volgen.
Students failed the G.L.O.-6 test, but can retake it. These students are older than 13 but not yet 14, so they can repeat grade 6 or the school can advise them into a lower technical junior secondary option
LBO/ORT = Lager Beroeps Onderwijs / Orientatie jaar
Junior Secondary Vocational school / Orientation year

107
9. Onderwijs Het totaal aantal inschrijvingen voor het KO vertoont een stijging in het schooljaar 2015/2016 (18,596) t.o.v. 2014/2015 (17,901). In het schooljaar 2014/2015 werden er 70,611 leerlingen ingeschreven op het GLO. Dit aantal daalde, in het schooljaar 2015/2016 tot 70,509. Vanaf het schooljaar 2013/2014 werden de EBO en LTO leerlingen bij het LBGO geïncorporeerd en het type onderwijs, LBGO werd veranderd in LBO door het Ministerie van Onderwijs, Wetenschap en Cultuur. Vanaf dat schooljaar bestaat het VOJ uit LBO en MULO. Evenals, in het vorig “Statistisch Jaarboek, 2015/2016” zijn behalve het aantal ingeschreven studenten op de VWMKO en het Tertiair onderwijs, ook het aantal afgestudeerden in 2014/2015 en 2015/2016 opgenomen. Jammer genoeg ontbreekt de data naar geslacht van de nieuwe scholen. .
9. Education The Total Enrollment at the Pre-Primary Education shows an increase in the school year 2015/2016 (18,596) compared to 2014/2015 (17,901). In the schoolyear 2014/2015, 70,611 pupils were enrolled in Primary Education. This number decreased to 70,509 in the schoolyear 2015/2016. Since the school year 2013/2014 the EBO and LTO students were incorporated at the LBGO and the type of school LBGO were changed in LBO by the Ministry of Education, Science and Culture. Since that school year, the VOJ consists of LBO and MULO. As in the previous "Statistical Yearbook 2015/2016", in addition to the number of enrolled students at the VWMKO and Tertiary education, the number of graduates in 2014/2015 and 2015/2016 was also included. Unfortunately, the data by Sex is missing regarding enrollments at the new schools.

108
Tabel 9.1a : Totaal aantal ingeschreven KO leerlingen naar, ressort, klas, en geslacht per district en aantal leerkrachten en scholen per district, schooljaar 2014/2015 (1)
Table 9.1a : Total Number of Enrolled KO Pupils by Ressort, Class and Sex per District and
Number of Teachers and Schools, School Year 2014/2015 (1)
District / Ressort Kleuter A Kleuter B Totaal M+V/
Aantal leerkrachten/
Number of teachers
Aantal scholen/ Resp scholen/
M / M V / F M / M V / F Total M+ F M / M V / F
Number of
Schools Response Schools
Blauwgrond 93 89 115 101 398 - 14 7 6
Rainville 340 325 331 308 1,304 - 36 19 18
Munder 76 89 103 96 364 - 17 6 6
Centrum 430 398 425 395 1,648 2 43 27 19
Beekhuizen 184 205 202 222 813 - 24 13 10
Weg naar Zee 72 59 51 55 237 - 2 3 3
Welgelegen 100 86 74 85 345 - 9 4 4
Tammenga 70 74 93 87 324 - 11 5 5
Flora 73 71 93 74 311 - 12 6 6
Latour 319 321 345 327 1,312 - 35 13 12
Pontbuiten 144 134 149 133 560 - 17 7 7
Livorno 71 74 110 106 361 - 9 6 5 District
Paramaribo 1,972 1,925 2,091 1,989 7,977 2 229 116 101
Kwatta 118 116 102 135 471 - 8 6 6
Saramaccapolder 52 55 68 66 241 - 11 4 4
Koewarasan 203 201 259 267 930 - 42 10 8
De Nieuwe Grond 232 229 224 224 909 - 19 12 11
Lelydorp 197 185 218 234 834 - 22 12 12
Houttuin 95 77 104 84 360 - 10 5 5
Domburg 47 47 58 53 205 - 8 5 3 District Wanica 944 910 1,033 1,063 3,950 - 120 54 49
Bron : Ministerie van Onderwijs, Wetenschap en Cultuur, afdeling Onderzoek en Planning Source : Ministry of Education, Science and Culture, Section of Research and Planning

109
Tabel 9.1a : Totaal aantal ingeschreven KO leerlingen naar, ressort, klas en geslacht per district en aantal leerkrachten en scholen, schooljaar 2014/2015 (2)
Table 9.1a : Total Number of Enrolled KO Pupils by Ressort, Class and Sex per District and
Number of Teachers and Schools, School Year 2014/2015 (2)
District / Ressort Kleuter A Kleuter B Totaal M+V/
Aantal leerkrachten/
Number of Teachers
Aantal scholen/
Resp scholen/
M / M V / F M / M V / F Total M+F M / M V / F
Number of Schools
Response Schools
Wageningen 26 26 26 24 102 - 7 4 4
Groot Henar 17 21 20 29 87 - 3 3 3
Oostelijke Polder 30 38 31 42 141 - 6 6 5
Nieuw Nickerie 84 80 80 80 324 - 15 8 8
Westelijke Polder 60 55 55 62 232 - 11 10 7 District
Nickerie 217 220 212 237 886 - 42 31 27
Welgelegen 13 17 7 7 44 - 2 1 1
Totness 10 5 8 9 32 - - 1 1
Johanna Maria 3 6 2 2 13 - 1 1 1 District Coronie 26 28 17 18 89 - 3 3 3
Calcutta 14 9 20 29 72 - 2 2 2
Tijgerkreek 16 18 22 16 72 - 4 2 2
Groningen 32 26 30 42 130 - 6 3 3
Kampong Baroe 22 16 21 20 79 - 2 2 2
Wayamboweg 19 7 15 19 60 - 2 2 2
Jarikaba 35 29 34 35 133 - 5 3 2 District
Saramacca 138 105 142 161 546 - 21 14 13
Bron : Ministerie van Onderwijs, Wetenschap en Cultuur, afdeling Onderzoek en Planning Source : Ministry of Education, Science and Culture, Section of Research and Planning

110
Tabel 9.1a : Totaal aantal ingeschreven KO leerlingen naar ressort, klas en geslacht per district en aantal leerkrachten en scholen, schooljaar 2014/2015 (3)
Table 9.1a : Total Number of Enrolled KO Pupils by Sex, Ressort, Class per District and
Number of Teachers and Schools, School Year 2014/2015 (3)
District / Ressort Kleuter A Kleuter B Totaal M+V/
Aantal leerkrachten /
Number of Teachers Aantal scholen/
Resp scholen/
M / M V / F M / M V / F Total M+F M / M V / F
Number of Schools
Response Schools
Margaretha 4 3 8 6 21 - 1 2 2
Bakkie 3 3 5 3 14 - 2 2 2
Nieuw Amsterdam 51 42 44 44 181 - 6 3 3
Alkmaar 46 33 46 36 161 - 7 5 5
Tamanredjo 65 52 68 91 276 - 10 5 5
Meerzorg 86 75 82 88 331 - 6 7 6 District
Commewijne 255 208 253 268 984 - 32 24 23
Moengo 133 109 148 148 538 - 15 11 10
Wanhatti - 7 2 5 14 - 1 2 2
Galibi 5 6 7 9 27 - 1 1 1
Moengo Tapu - - - - - - - 1 1
Albina 35 38 55 46 174 - 6 5 4
Patamacca - - - - - - - 2 1 District
Marowijne 173 160 212 208 753 - 23 22 19
Bigi Poika 3 1 1 5 10 - - 1 1
Carolina 1 6 1 3 11 - 1 1 1
Para Noord 63 65 76 71 275 - 10 4 4
Para Oost 101 99 112 109 421 - 14 9 9
Para Zuid 48 61 78 70 257 - 11 6 6 District
Para 213 232 268 258 974 - 36 21 21
Bron : Ministerie van Onderwijs, Wetenschap en Cultuur, afdeling Onderzoek en Planning Source : Ministry of Education, Science and Culture, Section of Research and Planning

111
Tabel 9.1a : Totaal aantal ingeschreven KO leerlingen naar ressort, klas en geslacht per district en aantal leerkrachten en scholen, schooljaar 2014/2015 (4)
Table 9.1a : Total Number of Enrolled KO Pupils by Ressort, Class and Sex per District and
Number of Teachers and Schools, School Year 2014/2015 (4)
District / Ressort Kleuter A Kleuter B Totaal M+V/
Aantal leerkrachten/
Number of Teachers
Aantal scholen/
Resp scholen/
M / M V / F M / M V / F Total M+F M / M V / F
Number of Schools
Response Schools
Kwakoegron 2 - 3 2 7 - - 1 1
Marechalkreek 24 14 24 23 85 1 2 3 3
Klaaskreek 13 23 8 8 52 - 3 2 2
Brokopondo Centrum 34 31 48 53 166 - 8 4 4
Brownsweg 73 46 45 75 239 - 5 4 4
Sarakreek 19 27 14 21 81 - 4 1 1 District
Brokopondo 165 141 142 182 630 1 22 15 15
Tapanahony 44 59 72 77 252 1 10 16 12
Boven-Suriname 174 154 187 212 727 - 14 22 17
Boven-Saramacca 2 5 1 5 13 - 1 3 2
Boven-Coppename 2 2 3 4 11 - 1 3 2
Kabalebo 12 10 20 15 57 - 2 2 2
Coeroeni 10 17 18 7 52 - 2 2 2 District
Sipaliwini 244 247 301 320 1,112 1 30 48 37
Geheel Suriname/ General Total 4,347 4,176 4,671 4,704 17,901 4 558 348 308
Bron : Ministerie van Onderwijs, Wetenschap en Cultuur, afdeling Onderzoek en Planning Source : Ministry of Education, Science and Culture, Section of Research and Planning

112
Tabel 9.1b : Totaal aantal ingeschreven GLO leerlingen naar ressort, klas en geslacht per district aantal leerkrachten en scholen, schooljaar 2014/2015 (1)
Table 9.1b : Total Number of Enrolled GLO Pupils by Ressort, Class and Sex per district and
Number of Teachers and Schools, School Year 2014/2015 (1)
District Paramaribo Klasse / Class 1 Klasse / Class 2 Klasse / Class 3 Ressort M / M V / F M / M V / F M / M V / F Blauwgrond 155 111 123 97 136 131 Rainville 434 367 343 346 374 343 Munder 132 143 125 116 125 98 Centrum 572 541 503 453 505 508 Beekhuizen 300 283 279 236 269 271 Weg naar Zee 74 58 68 55 60 39 Welgelegen 98 99 88 80 73 79 Tammenga 117 91 86 79 84 91 Flora 125 105 134 94 124 106 Latour 476 466 409 425 454 389 Pontbuiten 246 202 215 223 213 198 Livorno 143 118 126 87 139 112
Totaal / Total 2,872 2,584 2,499 2,291 2,556 2,365
Klasse / Class 4 Klasse / Class 5 Klasse / Class 6 Ressort M / M V / F M / M V / F M / M V / F Blauwgrond 109 119 119 116 97 110 Rainville 365 314 365 331 369 400Munder 129 94 123 110 107 125 Centrum 535 485 481 480 532 555 Beekhuizen 282 242 247 251 249 266Weg naar Zee 67 57 60 66 73 52 Welgelegen 84 77 84 76 82 81 Tammenga 101 72 85 84 113 120 Flora 124 100 101 90 107 87 Latour 439 440 376 390 375 484 Pontbuiten 198 189 194 178 163 170 Livorno 144 97 102 103 101 115
Totaal / Total 2,577 2,286 2,337 2,275 2,368 2,565
Totaal / Total Leerkrachten / Teachers Scholen / Schools Ressort M /M + V/F M / M V / F Totaal/Total Response Blauwgrond 1,423 4 146 7 6Rainville 4,351 13 362 20 20 Munder 1,427 4 130 6 6 Centrum 6,150 23 502 30 26Beekhuizen 3,175 11 245 14 14 Weg naar Zee 729 1 78 3 3 Welgelegen 1,001 2 89 4 4Tammenga 1,123 2 97 5 5 Flora 1,297 3 120 6 6 Latour 5,123 13 342 17 14Pontbuiten 2,389 5 147 8 7 Livorno 1,387 5 109 6 6
Totaal / Total Paramaribo 29,575 86 2,367 126 117
Bron : Ministerie van Onderwijs, Wetenschap en Cultuur, afdeling Onderzoek en Planning Source : Ministry of Education, Science and Culture, Section of Research and Planning

113
Tabel 9.1b : Totaal aantal ingeschreven GLO leerlingen naar ressort, klas en geslacht per district aantal leerkrachten en scholen, schooljaar 2014/2015 (2)
Table 9.1b : Total Number of Enrolled GLO Pupils by Ressort, Class and Sex per district and
Number of Teachers and Schools, School Year 2014/2015 (2)
District Wanica Klasse / Class 1 Klasse / Class 2 Klasse / Class 3 Ressort M / M V / F M / M V / F M / M V / F Kwatta 148 119 123 110 122 121 Saramaccapolder 80 73 78 61 71 75 Koewarasan 346 288 341 299 394 327 De Nieuwe Grond 298 279 285 237 288 236 Lelydorp 282 251 244 230 252 225 Houttuin 123 122 121 114 131 108 Domburg 62 51 65 56 61 47
Totaal/ Total 1,339 1,183 1,257 1,107 1,319 1,139
Klasse / Class 4 Klasse / Class 5 Klasse / Class 6 Ressort M / M V / F M / M V / F M / M V / F Kwatta 139 115 128 142 147 161Saramaccapolder 72 70 62 69 98 79 Koewarasan 318 301 320 319 304 300 De Nieuwe Grond 309 224 253 251 307 298Lelydorp 241 242 291 274 263 259 Houttuin 120 100 85 90 106 134 Domburg 38 52 66 59 73 56
Totaal/ Total 1,237 1,104 1,205 1,204 1,298 1,287
Totaal / Total Leerkrachten / Teachers Scholen / Schools Ressort M /M + V/F M / M V / F Totaal/Total Response Kwatta 1,575 2 119 6 6 Saramaccapolder 888 2 87 4 4Koewarasan 3,857 5 258 10 9 De Nieuwe Grond 3,265 11 217 11 11 Lelydorp 3,054 9 250 12 12Houttuin 1,354 3 114 5 5 Domburg 686 - 63 5 4
Totaal / Total Wanica 14,679 32 1,108 53 51
Bron : Ministerie van Onderwijs, Wetenschap en Cultuur, afdeling Onderzoek en Planning Source : Ministry of Education, Science and Culture, Section of Research and Planning

114
Tabel 9.1b : Totaal aantal ingeschreven GLO leerlingen naar ressort, klas en geslacht per district aantal leerkrachten en scholen, schooljaar 2014/2015 (3)
Table 9.1b : Total Number of Enrolled GLO Pupils by Ressort, Class and Sex per district and
Number of Teachers and Schools, School Year 2014/2015 (3)
District Nickerie Klasse / Class 1 Klasse / Class 2 Klasse / Class 3 Ressort M / M V / F M / M V / F M / M V / F Wageningen 24 35 34 20 36 31 Groot Henar 25 23 20 14 23 20 Oostelijke Polder 55 43 53 45 37 47 Nieuw Nickerie 134 119 99 91 111 97 Westelijke Polder 70 67 51 60 77 58
Totaal/ Total 308 287 257 230 284 253
Klasse / Class 4 Klasse / Class 5 Klasse / Class 6 Ressort M / M V / F M / M V / F M / M V / F Wageningen 29 25 44 26 23 35 Groot Henar 19 18 19 27 36 33 Oostelijke Polder 58 44 52 38 44 62Nieuw Nickerie 131 113 134 117 133 149 Westelijke Polder 76 76 91 68 75 90
Totaal/ Total 313 276 340 276 311 369
Totaal / Total Leerkrachten / Teachers Scholen / Schools Ressort M /M + V/F M / M V / F Totaal/Total Response Wageningen 362 3 40 4 4 Groot Henar 277 1 32 3 2 Oostelijke Polder 578 4 68 6 5 Nieuw Nickerie 1,428 11 126 8 8 Westelijke Polder 859 14 94 10 7
Totaal / Total Nickerie 3,504 33 360 31 26
Bron : Ministerie van Onderwijs, Wetenschap en Cultuur, afdeling Onderzoek en Planning Source : Ministry of Education, Science and Culture, Section of Research and Planning

115
Tabel 9.1b : Totaal aantal ingeschreven GLO leerlingen naar ressort, klas en geslacht per district aantal leerkrachten en scholen, schooljaar 2014/2015 (4)
Table 9.1b : Total Number of Enrolled GLO Pupils by Ressort, Class and Sex per district and
Number of Teachers and Schools, School Year 2014/2015 (4)
District Coronie Klasse / Class 1 Klasse / Class 2 Klasse / Class 3 Ressort M / M V / F M / M V / F M / M V / F Welgelegen 9 6 7 7 13 9 Totness 11 12 5 14 12 15 Johanna Maria 3 6 6 4 8 4
Totaal/ Total 23 24 18 25 33 28
Klasse / Class 4 Klasse / Class 5 Klasse / Class 6 Ressort M / M V / F M / M V / F M / M V / F Welgelegen 17 7 18 13 23 17 Totness 23 12 16 18 16 22Johanna Maria 6 5 10 2 6 4
Totaal/ Total 46 24 44 33 45 43
Totaal / Total Leerkrachten / Teachers Scholen / Schools Ressort M /M + V/F M / M V / F Totaal/Total Response Welgelegen 146 1 17 2 2 Totness 176 1 20 1 1 Johanna Maria 64 - 9 1 1
Totaal / Total Coronie 386 2 46 4 4
Bron : Ministerie van Onderwijs, Wetenschap en Cultuur, afdeling Onderzoek en Planning Source : Ministry of Education, Science and Culture, Section of Research and Planning

116
Tabel 9.1b : Totaal aantal ingeschreven GLO leerlingen naar ressort, klas en geslacht per district aantal leerkrachten en scholen, schooljaar 2014/2015 (5)
Table 9.1b : Total Number of Enrolled GLO Pupils by Ressort, Class and Sex per district and
Number of Teachers and Schools, School Year 2014/2015 (5)
District Saramacca Klasse / Class 1 Klasse / Class 2 Klasse / Class 3 Ressort M / M V / F M / M V / F M / M V / F Calcutta 23 20 17 14 14 14 Tijgerkreek 35 25 33 24 29 21 Groningen 48 44 42 43 46 29 Kampong Baroe 23 24 27 14 21 18 Wayamboweg 22 16 20 17 15 17 Jarikaba 51 65 42 45 53 46
Totaal/ Total 202 194 181 157 178 145
Klasse / Class 4 Klasse / Class 5 Klasse / Class 6 Ressort M / M V / F M / M V / F M / M V / F Calcutta 21 17 17 17 20 9 Tijgerkreek 32 17 32 25 26 33Groningen 32 38 41 45 39 63 Kampong Baroe 22 16 16 26 15 33 Wayamboweg 14 16 16 15 8 26Jarikaba 64 38 50 43 46 49
Totaal/ Total 185 142 172 171 154 213
Totaal / Total Leerkrachten / Teachers Scholen / Schools Ressort M /M + V/F M / M V / F Totaal/Total Response Calcutta 203 2 23 3 3 Tijgerkreek 332 - 34 2 2 Groningen 510 4 42 3 3 Kampong Baroe 255 4 31 2 2Wayamboweg 202 - 32 2 2 Jarikaba 592 2 30 3 3
Totaal / Total Saramacca 2,094 12 192 15 15
Bron : Ministerie van Onderwijs, Wetenschap en Cultuur, afdeling Onderzoek en Planning Source : Ministry of Education, Science and Culture, Section of Research and Planning

117
Tabel 9.1b : Totaal aantal ingeschreven GLO leerlingen naar ressort, klas en geslacht per district aantal leerkrachten en scholen, schooljaar 2014/2015 (6)
Table 9.1b : Total Number of Enrolled GLO Pupils by Ressort, Class and Sex per district and
Number of Teachers and Schools, School Year 2014/2015 (6)
District Commewijne Klasse / Class 1 Klasse / Class 2 Klasse / Class 3 Ressort M / M V / F M / M V / F M / M V / F Margaretha 4 3 3 6 4 8 Bakkie 3 2 4 1 2 5 Nieuw Amsterdam 60 51 46 43 48 53 Alkmaar 44 43 58 46 60 42 Tamanredjo 82 72 87 79 82 70 Meerzorg 102 94 103 98 106 83
Totaal/ Total 295 265 301 273 302 261
Klasse / Class 4 Klasse / Class 5 Klasse / Class 6 Ressort M / M V / F M / M V / F M / M V / F Margaretha 6 4 11 3 2 7 Bakkie 7 2 - 5 7 4Nieuw Amsterdam 51 44 64 43 58 66 Alkmaar 71 48 54 66 63 61 Tamanredjo 75 72 108 89 94 117Meerzorg 106 85 88 79 108 108
Totaal/ Total 316 255 325 285 332 363
Totaal / Total Leerkrachten / Teachers Scholen / Schools Ressort M /M + V/F M / M V / F Totaal/Total Response Margaretha 61 - 18 2 2 Bakkie 42 2 20 2 2 Nieuw Amsterdam 627 1 68 3 3 Alkmaar 656 5 75 5 5Tamanredjo 1,027 3 98 5 5 Meerzorg 1,160 5 129 7 6
Totaal / Total Commewijne 3,573 16 408 24 23
Bron : Ministerie van Onderwijs, Wetenschap en Cultuur, afdeling Onderzoek en Planning Source : Ministry of Education, Science and Culture, Section of Research and Planning

118
Tabel 9.1b : Totaal aantal ingeschreven GLO leerlingen naar ressort, klas en geslacht per district aantal leerkrachten en scholen, schooljaar 2014/2015 (7)
Table 9.1b : Total Number of Enrolled GLO Pupils by Ressort, Class and Sex per district and
Number of Teachers and Schools, School Year 2014/2015 (7)
District Marowijne Klasse / Class 1 Klasse / Class 2 Klasse / Class 3 Ressort M / M V / F M / M V / F M / M V / F Moengo 191 147 170 143 220 138 Wanhatti 8 4 5 8 7 5 Galibi 9 1 4 2 9 6 Moengo Tapu 4 5 9 5 9 3 Albina 108 88 67 67 61 64 Patamacca 3 4 2 9 2 -
Totaal/ Total 323 249 257 234 308 216
Klasse / Class 4 Klasse / Class 5 Klasse / Class 6 Ressort M / M V / F M / M V / F M / M V / F Moengo 168 122 204 163 171 207 Wanhatti 10 3 3 6 10 5Galibi 7 7 8 5 17 7 Moengo Tapu 3 1 6 2 8 5 Albina 79 85 87 61 70 88Patamacca 1 4 3 1 - -
Totaal/ Total 268 222 311 238 276 312
Totaal / Total Leerkrachten / Teachers Scholen / Schools Ressort M /M + V/F M / M V / F Totaal/Total Response Moengo 2,044 6 125 12 11 Wanhatti 74 - 5 2 2 Galibi 82 - 4 1 1 Moengo Tapu 60 1 6 1 1Albina 925 3 50 6 6 Patamacca 29 1 1 2 1
Totaal / Total Marowijne 3,214 11 191 24 22
Bron : Ministerie van Onderwijs, Wetenschap en Cultuur, afdeling Onderzoek en Planning Source : Ministry of Education, Science and Culture, Section of Research and Planning

119
Tabel 9.1b : Totaal aantal ingeschreven GLO leerlingen naar ressort, klas en geslacht per district aantal leerkrachten en scholen, schooljaar 2014/2015 (8)
Table 9.1b : Total Number of Enrolled GLO Pupils by Ressort, Class and Sex per district and
Number of Teachers and Schools, School Year 2014/2015 (8)
District Para Klasse / Class 1 Klasse / Class 2 Klasse / Class 3 Ressort M / M V / F M / M V / F M / M V / F Bigi Poika 1 6 1 1 6 2 Carolina 3 4 8 2 9 3 Para Noord 109 92 97 99 103 101 Para Oost 166 147 118 124 148 147 Para Zuid 108 92 88 79 105 89
Totaal/ Total 387 341 312 305 371 342
Klasse / Class 4 Klasse / Class 5 Klasse / Class 6 Ressort M / M V / F M / M V / F M / M V / F Bigi Poika 3 4 5 4 3 8 Carolina 5 4 3 3 3 7 Para Noord 100 88 101 99 100 114 Para Oost 158 109 127 120 125 164 Para Zuid 117 77 110 96 104 104
Totaal/ Total 383 282 346 322 335 397
Totaal / Total Leerkrachten / Teachers Scholen / Schools Ressort M /M + V/F M / M V / F Totaal/Total Response Bigi Poika 44 - 7 1 1 Carolina 54 - 5 1 1 Para Noord 1,203 6 83 4 4 Para Oost 1,653 7 121 9 8 Para Zuid 1,169 4 98 6 6
Totaal / Total Para 4,123 17 314 21 20
Bron : Ministerie van Onderwijs, Wetenschap en Cultuur, afdeling Onderzoek en Planning Source : Ministry of Education, Science and Culture, Section of Research and Planning

120
Tabel 9.1b : Totaal aantal ingeschreven GLO leerlingen naar ressort, klas en geslacht per district aantal leerkrachten en scholen, schooljaar 2014/2015 (9)
Table 9.1b : Total Number of Enrolled GLO Pupils by Ressort, Class and Sex per district and
Number of Teachers and Schools, School Year 2014/2015 (9)
District Brokopondo Klasse / Class 1 Klasse / Class 2 Klasse / Class 3 Ressort M / M V / F M / M V / F M / M V / F Kwakoegron 4 4 3 1 3 - Marchalkreek 41 36 31 21 40 32 Klaaskreek 41 37 26 24 31 35 Brokopondo Centrum 96 69 68 73 92 68 Brownsweg 104 73 80 83 100 66 Sarakreek 51 27 43 22 37 39
Totaal/ Total 337 246 251 224 303 240
Klasse / Class 4 Klasse / Class 5 Klasse / Class 6 Ressort M / M V / F M / M V / F M / M V / F Kwakoegron 5 2 5 5 2 4 Marchalkreek 42 29 30 28 20 24Klaaskreek 27 27 26 36 28 36 Brokopondo Centrum 60 62 66 68 48 57 Brownsweg 59 67 62 52 40 73Sarakreek 42 22 31 15 20 28
Totaal/ Total 235 209 220 204 158 222
Totaal / Total Leerkrachten / Teachers Scholen / Schools Ressort M /M + V/F M / M V / F Totaal/Total Response Kwakoegron 38 - 7 1 1 Marchalkreek 374 1 28 3 3 Klaaskreek 374 1 24 2 2 Brokopondo Centrum 827 6 51 5 5Brownsweg 859 2 48 4 4 Sarakreek 377 1 14 1 1
Totaal / Total Brokopondo 2,849 11 172 16 16
Bron : Ministerie van Onderwijs, Wetenschap en Cultuur, afdeling Onderzoek en Planning Source : Ministry of Education, Science and Culture, Section of Research and Planning

121
Tabel 9.1b : Totaal aantal ingeschreven GLO leerlingen naar ressort, klas en geslacht per district aantal leerkrachten en scholen, schooljaar 2014/2015 (10)
Table 9.1b : Total Number of Enrolled GLO Pupils by Ressort, Class and Sex per district and
Number of Teachers and Schools, School Year 2014/2015 (10)
District Sipaliwini Klasse / Class 1 Klasse / Class 2 Klasse / Class 3 Ressort M / M V / F M / M V / F M / M V / F Tapanahony 242 143 177 133 168 160 Boven -Suriname 497 371 395 321 368 345 Boven -Saramacca 4 1 4 1 4 6 Boven -Coppename 5 6 5 3 9 8 Kabalebo 31 50 31 24 34 28 Coeroeni 25 28 24 26 30 25
Totaal/ Total 804 599 636 508 613 572
Klasse / Class 4 Klasse / Class 5 Klasse / Class 6 Ressort M / M V / F M / M V / F M / M V / F Tapanahony 142 146 109 127 96 122 Boven -Suriname 364 349 255 303 197 254 Boven -Saramacca 2 2 6 1 1 2 Boven -Coppename 8 10 8 7 12 4 Kabalebo 35 32 44 31 50 51 Coeroeni 24 17 23 17 14 17
Totaal/ Total 575 556 445 486 370 450
Totaal / Total Leerkrachten / Teachers Scholen / Schools Ressort M /M + V/F M / M V / F Totaal/Total ResponseTapanahony 1,765 13 73 16 14 Boven -Suriname 4,019 32 144 25 23 Boven -Saramacca 34 4 11 3 3 Boven -Coppename 85 4 11 3 3 Kabalebo 441 3 21 2 2 Coeroeni 270 6 13 2 2
Totaal / Total Sipaliwini 6,614 62 273 51 47
Geheel Suriname / General Total Klasse / Class 1 Klasse / Class 2 Klasse / Class 3 M / M V / F M / M V / F M / M V / F
Totaal / Total 6,890 5,972 5,969 5,354 6,267 5,561
Klasse / Class 4
Klasse / Class 5
Klasse / Class 6
M / M V / F M / M V / F M / M V / F Totaal /
Total 6,135 5,356 5,745 5,494 5,647 6,221
Totaal/ Total
Leerkrachten / Teachers Scholen / Schools M / M + V / F M / M V / F Totaal/Total Response
Totaal / Total 70,611 282 5,431 365 341
Bron : Ministerie van Onderwijs, Wetenschap en Cultuur, afdeling Onderzoek en Planning Source : Ministry of Education, Science and Culture, Section of Research and Planning

122
Tabel 9.1c : Totaal aantal ingeschreven KO leerlingen naar ressort, klas en geslacht per district en aantal leerkrachten en scholen, schooljaar 2015/2016 (1)
Table 9.1c : Total Number of Enrolled KO Pupils by Ressort, Class and Sex per District and
Number of Teachers and Schools, School Year, 2015/2016 (1)
District / Ressort Kleuter A Kleuter B Totaal M+V/
Aantal scholen/
Resp scholen/
M / M V / F M / M V / F Total M+ F Number of
Schools Response Schools
Blauwgrond 96 105 93 103 397 6 6
Rainville 318 337 353 333 1,341 19 18
Munder 99 85 93 93 370 6 6
Centrum 443 420 474 442 1,779 29 21
Beekhuizen 200 177 220 243 840 14 13
Weg naar Zee 61 43 67 62 233 3 3
Welgelegen 96 90 101 88 375 4 4
Tammenga 67 66 72 66 271 6 5
Flora 77 85 74 77 313 5 5
Latour 344 324 340 326 1,334 15 13
Pontbuiten 138 127 144 138 547 7 7
Livorno 97 86 97 110 390 6 6 District
Paramaribo 2,036 1,945 2,128 2,081 8,190 120 107
Kwatta 123 123 125 139 510 7 7
Saramaccapolder 62 46 53 58 219 4 4
Koewarasan 243 215 239 255 952 9 9
De Nieuwe Grond 234 233 245 228 940 11 11
Lelydorp 231 214 256 262 963 16 12
Houttuin 77 81 96 79 333 5 5
Domburg 41 50 45 44 180 4 4 District Wanica 1,011 962 1,059 1,065 4,097 56 52
Bron : Ministerie van Onderwijs, Wetenschap en Cultuur, afdeling Onderzoek en Planning Source : Ministry of Education, Science and Culture, Section of Research and Planning

123
Tabel 9.1c : Totaal aantal ingeschreven KO leerlingen naar ressort, klas en geslacht per district en aantal leerkrachten en scholen, schooljaar 2015/2016 (2)
Table 9.1c : Total Number of Enrolled KO Pupils by Ressort, Class and Sex per District and
Number of Teachers and Schools, School Year, 2015/2016 (2)
District / Ressort Kleuter A Kleuter B Totaal M+V/
Aantal scholen/
Resp scholen/
M / M V / F M / M V / F Total M+F
Number of Schools
Response Schools
Wageningen 21 17 28 25 91 4 3 Groot Henar 21 23 18 23 85 3 2 Oostelijke Polder 43 34 37 49 163 5 5 Nieuw Nickerie 88 74 115 113 390 8 8 Westelijke Polder 62 70 61 58 251 7 7
District Nickerie 235 218 259 268 980 27 25
Welgelegen 11 17 13 13 54 2 2 Totness 8 8 10 6 32 1 1 Johanna Maria 2 4 3 6 15 1 1
District Coronie 21 29 26 25 101 4 4
Calcutta 10 15 12 8 45 3 2 Tijgerkreek 20 22 18 21 81 2 2 Groningen 34 17 38 38 127 3 3 Kampong Baroe 14 15 22 19 70 2 2 Wayamboweg 3 2 17 8 30 2 2 Jarikaba 39 29 33 28 129 3 2
District Saramacca 120 100 140 122 482 15 13
Bron : Ministerie van Onderwijs, Wetenschap en Cultuur, afdeling Onderzoek en Planning Source : Ministry of Education, Science and Culture, Section of Research and Planning

124
Tabel 9.1c : Totaal aantal ingeschreven KO leerlingen naar ressort, klas en geslacht per district en aantal leerkrachten en scholen, schooljaar 2015/2016 (3)
Table 9.1c : Total Number of Enrolled KO Pupils by Ressort, Class and Sex per District and
Number of Teachers and Schools, School Year, 2015/2016 (3)
District / Ressort Kleuter A Kleuter B Totaal M+V/ Aantal
scholen/ Resp
scholen/
M / M V / F M / M V / F Total M+F Number of
Schools Response Schools
Margaretha 8 6 5 3 22 2 2 Bakkie 1 4 2 3 10 2 2 Nieuw Amsterdam 38 38 52 44 172 3 3 Alkmaar 37 36 52 39 164 5 5 Tamanredjo 68 72 74 65 279 5 5 Meerzorg 76 90 90 71 327 6 6
District Commewijne 228 246 275 225 974 23 23
Moengo 114 107 136 110 467 12 11 Wanhatti 3 - 3 8 14 2 2 Galibi 5 3 4 6 18 1 1 Moengo Tapu - - - - - 1 1 Albina 49 40 40 44 173 6 5 Patamacca - - - - - 1 -
District Marowijne 171 150 183 168 672 23 20
Bigi Poika 2 - 4 1 7 1 1 Carolina - - 1 6 7 1 1 Para Noord 79 94 62 79 314 4 4 Para Oost 103 117 99 99 418 8 8 Para Zuid 64 66 78 91 299 6 6
District Para 248 277 244 276 1,045 20 20
Bron : Ministerie van Onderwijs, Wetenschap en Cultuur, afdeling Onderzoek en Planning Source : Ministry of Education, Science and Culture, Section of Research and Planning

125
Tabel 9.1c : Totaal aantal ingeschreven KO leerlingen naar ressort, klas en geslacht per district en aantal leerkrachten en scholen, schooljaar 2015/2016 (4)
Table 9.1c : Total Number of Enrolled KO Pupils by Ressort, Class and Sex per District and
Number of Teachers and Schools, School Year, 2015/2016 (4)
District / Ressort Kleuter A Kleuter B Totaal M+V/ Aantal
scholen/ Resp
scholen/
M / M V / F M / M V / F Total M+F Number of
Schools Response Schools
Kwakoegron 3 4 2 - 9 1 1 Marchalskreek 14 11 25 14 64 4 4 Klaaskreek 14 21 14 21 70 2 2 Brokopondo Centrum 56 65 54 50 225 5 5 Brownsweg 64 64 79 61 268 4 4 Sarakreek 15 16 19 26 76 1 1
District Brokopondo 166 181 193 172 712 17 17
Tapanahony 53 72 83 80 288 14 12 Boven Suriname 235 188 217 201 841 24 23 Boven Saramacca 2 5 3 4 14 3 3 Boven Coppename 7 3 5 2 17 3 3 Kabalebo 29 24 32 23 108 2 2 Coeroeni 21 12 18 24 75 2 2
District Sipaliwini 347 304 358 334 1,343 48 45
Geheel Suriname/
General Total 4,583 4,412 4,865 4,736 18,596 353 325 Bron : Ministerie van Onderwijs, Wetenschap en Cultuur, afdeling Onderzoek en Planning Source : Ministry of Education, Science and Culture, Section of Research and Planning
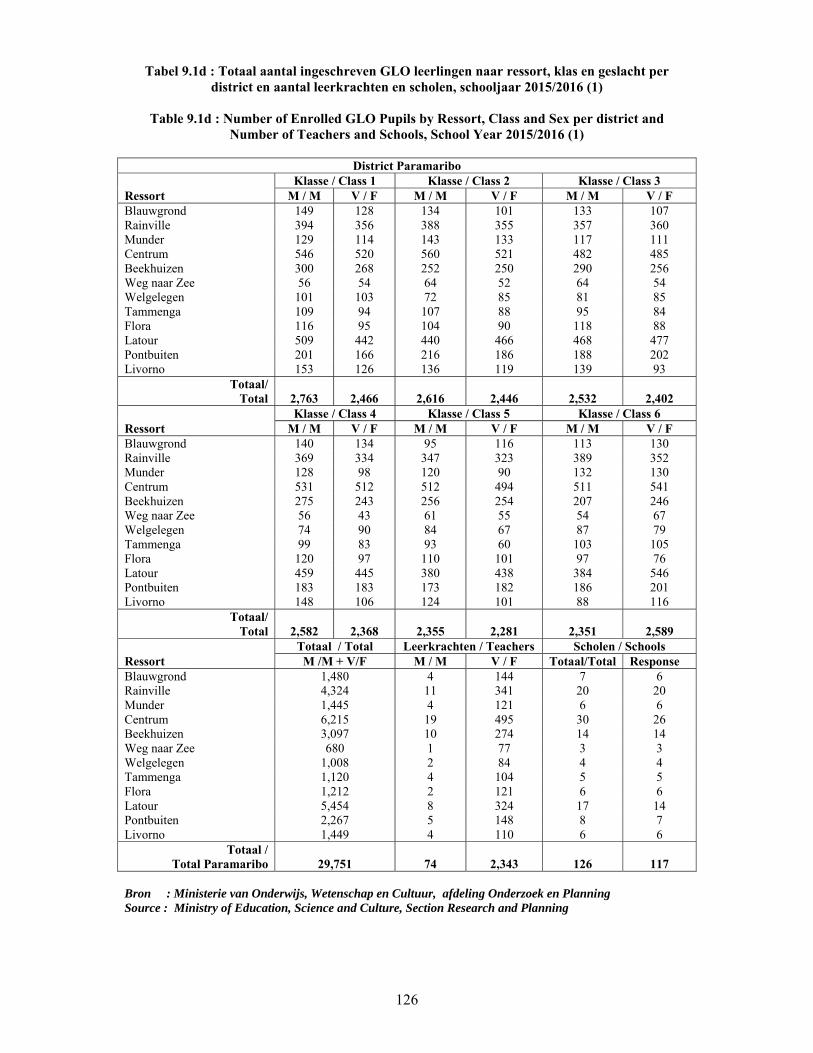
126
Tabel 9.1d : Totaal aantal ingeschreven GLO leerlingen naar ressort, klas en geslacht per district en aantal leerkrachten en scholen, schooljaar 2015/2016 (1)
Table 9.1d : Number of Enrolled GLO Pupils by Ressort, Class and Sex per district and
Number of Teachers and Schools, School Year 2015/2016 (1)
District Paramaribo Klasse / Class 1 Klasse / Class 2 Klasse / Class 3 Ressort M / M V / F M / M V / F M / M V / F Blauwgrond 149 128 134 101 133 107 Rainville 394 356 388 355 357 360 Munder 129 114 143 133 117 111 Centrum 546 520 560 521 482 485 Beekhuizen 300 268 252 250 290 256 Weg naar Zee 56 54 64 52 64 54 Welgelegen 101 103 72 85 81 85 Tammenga 109 94 107 88 95 84 Flora 116 95 104 90 118 88 Latour 509 442 440 466 468 477 Pontbuiten 201 166 216 186 188 202 Livorno 153 126 136 119 139 93
Totaal/ Total 2,763 2,466 2,616 2,446 2,532 2,402
Klasse / Class 4 Klasse / Class 5 Klasse / Class 6 Ressort M / M V / F M / M V / F M / M V / F Blauwgrond 140 134 95 116 113 130 Rainville 369 334 347 323 389 352Munder 128 98 120 90 132 130 Centrum 531 512 512 494 511 541 Beekhuizen 275 243 256 254 207 246Weg naar Zee 56 43 61 55 54 67 Welgelegen 74 90 84 67 87 79 Tammenga 99 83 93 60 103 105 Flora 120 97 110 101 97 76 Latour 459 445 380 438 384 546 Pontbuiten 183 183 173 182 186 201 Livorno 148 106 124 101 88 116
Totaal/ Total 2,582 2,368 2,355 2,281 2,351 2,589
Totaal / Total Leerkrachten / Teachers Scholen / Schools Ressort M /M + V/F M / M V / F Totaal/Total Response Blauwgrond 1,480 4 144 7 6Rainville 4,324 11 341 20 20 Munder 1,445 4 121 6 6 Centrum 6,215 19 495 30 26Beekhuizen 3,097 10 274 14 14 Weg naar Zee 680 1 77 3 3 Welgelegen 1,008 2 84 4 4Tammenga 1,120 4 104 5 5 Flora 1,212 2 121 6 6 Latour 5,454 8 324 17 14Pontbuiten 2,267 5 148 8 7 Livorno 1,449 4 110 6 6
Totaal / Total Paramaribo 29,751 74 2,343 126 117
Bron : Ministerie van Onderwijs, Wetenschap en Cultuur, afdeling Onderzoek en Planning Source : Ministry of Education, Science and Culture, Section Research and Planning

127
Tabel 9.1d : Totaal aantal ingeschreven GLO leerlingen naar ressort, klas en geslacht per district en aantal leerkrachten en scholen, schooljaar 2015/2016 (2)
Table 9.1d : Number of Enrolled GLO Pupils by Ressort, Class and Sex per district and
Number of Teachers and Schools, School Year 2015/2016 (2)
District Wanica Klasse / Class 1 Klasse / Class 2 Klasse / Class 3 Ressort M / M V / F M / M V / F M / M V / F Kwatta 189 188 172 156 194 169 Saramaccapolder 81 71 75 70 79 67 Koewarasan 350 313 327 271 386 310 De Nieuwe Grond 311 271 288 293 318 262 Lelydorp 298 282 288 252 271 256 Houttuin 135 101 123 118 140 114 Domburg 68 59 47 48 63 53
Totaal/ Total 1,432 1,285 1,320 1,208 1,451 1,231
Klasse / Class 4 Klasse / Class 5 Klasse / Class 6 Ressort M / M V / F M / M V / F M / M V / F Kwatta 151 160 155 142 153 200Saramaccapolder 72 76 59 70 79 72 Koewarasan 334 301 313 292 223 279 De Nieuwe Grond 299 256 312 245 282 319Lelydorp 294 239 230 242 300 309 Houttuin 127 110 96 103 85 102 Domburg 60 52 39 51 57 60
Totaal/ Total 1,337 1,194 1,204 1,145 1,179 1,341
Totaal / Total Leerkrachten / Teachers Scholen / Schools Ressort M /M + V/F M / M V / F Totaal/Total Response Kwatta 2,029 2 198 6 6 Saramaccapolder 871 6 78 4 4Koewarasan 3,699 8 222 10 9 De Nieuwe Grond 3,456 10 222 11 11 Lelydorp 3,261 7 268 12 12Houttuin 1,354 2 122 5 5 Domburg 657 1 66 5 4
Totaal / Total Wanica 15,327 36 1,176 53 51
Bron : Ministerie van Onderwijs, Wetenschap en Cultuur, afdeling Onderzoek en Planning Source : Ministry of Education, Science and Culture, Section of Research and Planning

128
Tabel 9.1d : Totaal aantal ingeschreven GLO leerlingen naar ressort, klas en geslacht per district en aantal leerkrachten en scholen, schooljaar 2015/2016 (3)
Table 9.1d : Number of Enrolled GLO Pupils by Ressort, Class and Sex per district and
Number of Teachers and Schools, School Year 2015/2016 (3)
District Nickerie Klasse / Class 1 Klasse / Class 2 Klasse / Class 3 Ressort M / M V / F M / M V / F M / M V / F Wageningen 26 31 23 27 40 23 Groot Henar 23 35 23 17 22 16 Oostelijke Polder 39 46 54 39 52 46 Nieuw Nickerie 124 124 127 109 113 99 Westelijke Polder 70 73 63 69 73 61
Totaal/ Total 282 309 290 261 300 245
Klasse / Class 4 Klasse / Class 5 Klasse / Class 6 Ressort M / M V / F M / M V / F M / M V / F Wageningen 28 23 36 21 34 24 Groot Henar 21 17 23 18 16 31 Oostelijke Polder 39 48 57 41 61 51Nieuw Nickerie 132 106 131 114 128 137 Westelijke Polder 62 62 72 67 84 80
Totaal/ Total 282 256 319 261 323 323
Totaal / Total Leerkrachten / Teachers Scholen / Schools Ressort M /M + V/F M / M V / F Totaal/Total Response Wageningen 336 3 40 4 4 Groot Henar 262 2 28 3 2 Oostelijke Polder 573 3 68 6 5 Nieuw Nickerie 1,444 12 139 8 8 Westelijke Polder 836 14 106 10 7
Totaal / Total Nickerie 3,451 34 381 31 26
Bron : Ministerie van Onderwijs, Wetenschap en Cultuur, afdeling Onderzoek en Planning Source : Ministry of Education, Science and Culture, Section of Research and Planning

129
Tabel 9.1d: Totaal aantal ingeschreven GLO leerlingen naar ressort, klas en geslacht per district en aantal leerkrachten en scholen, schooljaar 2015/2016 (4)
Table 9.1d: Number of Enrolled GLO Pupils by Ressort, Class and Sex per district and Number
of Teachers and Schools, School Year 2015/2016 (4)
District Coronie Klasse / Class 1 Klasse / Class 2 Klasse / Class 3 Ressort M / M V / F M / M V / F M / M V / F Welgelegen 14 10 10 9 13 11 Totness 10 13 10 12 4 13 Johanna Maria 2 - 3 6 4 4
Totaal/ Total 26 23 23 27 21 28
Klasse / Class 4 Klasse / Class 5 Klasse / Class 6 Ressort M / M V / F M / M V / F M / M V / F Welgelegen 16 6 19 9 28 22 Totness 17 15 21 11 13 20Johanna Maria 5 5 8 4 10 3
Totaal/ Total 38 26 48 24 51 45
Totaal / Total Leerkrachten / Teachers Scholen / Schools Ressort M /M + V/F M / M V / F Totaal/Total Response Welgelegen 167 - 16 2 2 Totness 159 1 21 1 1 Johanna Maria 54 - 9 1 1
Totaal / Total Coronie 380 1 46 4 4
Bron : Ministerie van Onderwijs, Wetenschap en Cultuur, afdeling Onderzoek en Planning Source : Ministry of Education, Science and Culture, Section of Research and Planning

130
Tabel 9.1d : Totaal aantal ingeschreven GLO leerlingen naar ressort, klas en geslacht per district en aantal leerkrachten en scholen, schooljaar 2015/2016 (5)
Table 9.1d : Number of Enrolled GLO Pupils by Ressort, Class and Sex per district and
Number of Teachers and Schools, School Year 2015/2016 (5)
District Saramacca Klasse / Class 1 Klasse / Class 2 Klasse / Class 3 Ressort M / M V / F M / M V / F M / M V / F Calcutta 21 24 18 19 15 12 Tijgerkreek 33 16 32 23 31 25 Groningen 39 44 49 40 50 43 Kampong Baroe 28 24 26 26 27 18 Wayamboweg 5 6 1 1 4 3 Jarikaba 46 45 53 66 43 49
Totaal/ Total 172 159 179 175 170 150
Klasse / Class 4 Klasse / Class 5 Klasse / Class 6 Ressort M / M V / F M / M V / F M / M V / F Calcutta 18 17 21 16 14 12 Tijgerkreek 27 19 32 15 27 29Groningen 37 32 41 41 37 58 Kampong Baroe 16 19 25 19 11 25 Wayamboweg 4 3 1 2 1 2Jarikaba 58 48 72 43 36 42
Totaal/ Total 160 138 192 136 126 168
Totaal / Total Leerkrachten / Teachers Scholen / Schools Ressort M /M + V/F M / M V / F Totaal/Total Response Calcutta 207 2 25 3 3 Tijgerkreek 309 - 31 2 2 Groningen 511 1 44 3 3 Kampong Baroe 264 3 30 2 2Wayamboweg 33 - 10 2 2 Jarikaba 601 2 63 3 3
Totaal / Total Saramacca 1,925 8 203 15 15
Bron : Ministerie van Onderwijs, Wetenschap en Cultuur, afdeling Onderzoek en Planning Source : Ministry of Education, Science and Culture, Section of Research and Planning
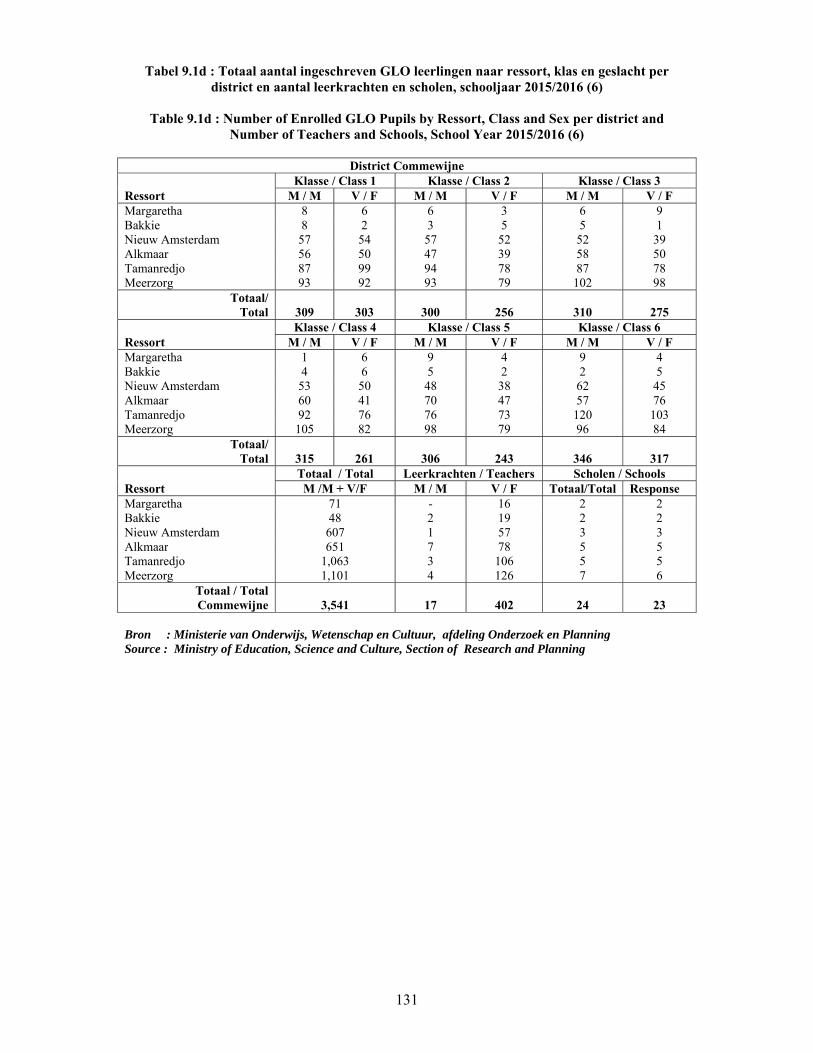
131
Tabel 9.1d : Totaal aantal ingeschreven GLO leerlingen naar ressort, klas en geslacht per district en aantal leerkrachten en scholen, schooljaar 2015/2016 (6)
Table 9.1d : Number of Enrolled GLO Pupils by Ressort, Class and Sex per district and
Number of Teachers and Schools, School Year 2015/2016 (6)
District Commewijne Klasse / Class 1 Klasse / Class 2 Klasse / Class 3 Ressort M / M V / F M / M V / F M / M V / F Margaretha 8 6 6 3 6 9 Bakkie 8 2 3 5 5 1 Nieuw Amsterdam 57 54 57 52 52 39 Alkmaar 56 50 47 39 58 50 Tamanredjo 87 99 94 78 87 78 Meerzorg 93 92 93 79 102 98
Totaal/ Total 309 303 300 256 310 275
Klasse / Class 4 Klasse / Class 5 Klasse / Class 6 Ressort M / M V / F M / M V / F M / M V / F Margaretha 1 6 9 4 9 4 Bakkie 4 6 5 2 2 5Nieuw Amsterdam 53 50 48 38 62 45 Alkmaar 60 41 70 47 57 76 Tamanredjo 92 76 76 73 120 103Meerzorg 105 82 98 79 96 84
Totaal/ Total 315 261 306 243 346 317
Totaal / Total Leerkrachten / Teachers Scholen / Schools Ressort M /M + V/F M / M V / F Totaal/Total Response Margaretha 71 - 16 2 2 Bakkie 48 2 19 2 2 Nieuw Amsterdam 607 1 57 3 3 Alkmaar 651 7 78 5 5Tamanredjo 1,063 3 106 5 5 Meerzorg 1,101 4 126 7 6
Totaal / Total Commewijne 3,541 17 402 24 23
Bron : Ministerie van Onderwijs, Wetenschap en Cultuur, afdeling Onderzoek en Planning Source : Ministry of Education, Science and Culture, Section of Research and Planning

132
Tabel 9.1d : Totaal aantal ingeschreven GLO leerlingen naar ressort, klas en geslacht per district en aantal leerkrachten en scholen, schooljaar 2015/2016 (7)
Table 9.1d : Number of Enrolled GLO Pupils by Ressort, Class and Sex per district and
Number of Teachers and Schools, School Year 2015/2016 (7)
District Marowijne Klasse / Class 1 Klasse / Class 2 Klasse / Class 3 Ressort M / M V / F M / M V / F M / M V / F Moengo 200 167 155 133 183 140 Wanhatti 8 5 4 7 8 9 Galibi 9 9 5 1 7 3 Moengo Tapu 3 6 7 1 7 6 Albina 98 85 59 56 69 57 Patamacca 1 1 1 2 2 6
Totaal/ Total 319 273 231 200 276 221
Klasse / Class 4 Klasse / Class 5 Klasse / Class 6 Ressort M / M V / F M / M V / F M / M V / F Moengo 176 126 169 129 168 199 Wanhatti 5 4 11 6 8 10Galibi 9 6 4 7 14 8 Moengo Tapu 7 1 4 1 5 7 Albina 82 75 65 51 72 81 Patamacca 0 0 1 2 1 0
Totaal/ Total 279 212 254 196 268 305
Totaal / Total Leerkrachten / Teachers Scholen / Schools Ressort M /M + V/F M / M V / F Totaal/Total Response Moengo 1,945 6 156 12 11 Wanhatti 85 1 11 2 2 Galibi 82 - 6 1 1 Moengo Tapu 55 - 11 1 1Albina 850 2 67 6 6 Patamacca 17 1 2 2 1
Totaal / Total Marowijne 3,034 10 253 24 22
Bron : Ministerie van Onderwijs, Wetenschap en Cultuur, afdeling Onderzoek en Planning Source : Ministry of Education, Science and Culture, Section of Research and Planning
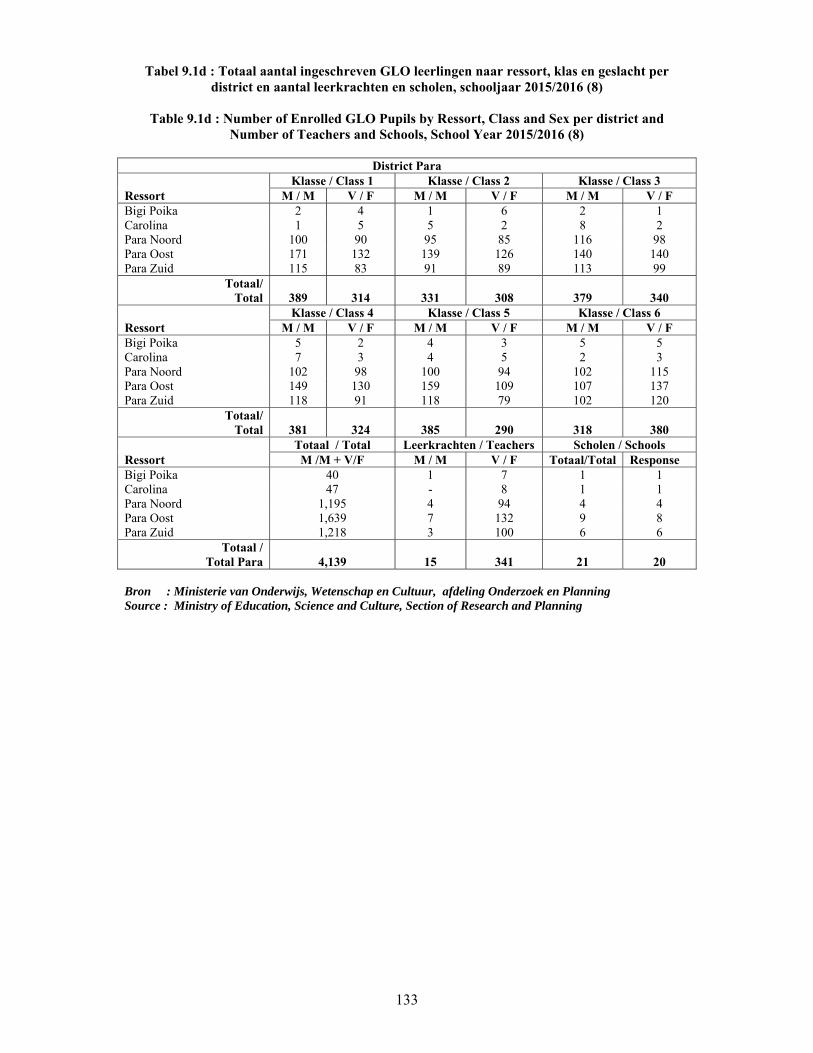
133
Tabel 9.1d : Totaal aantal ingeschreven GLO leerlingen naar ressort, klas en geslacht per district en aantal leerkrachten en scholen, schooljaar 2015/2016 (8)
Table 9.1d : Number of Enrolled GLO Pupils by Ressort, Class and Sex per district and
Number of Teachers and Schools, School Year 2015/2016 (8)
District Para Klasse / Class 1 Klasse / Class 2 Klasse / Class 3 Ressort M / M V / F M / M V / F M / M V / F Bigi Poika 2 4 1 6 2 1 Carolina 1 5 5 2 8 2 Para Noord 100 90 95 85 116 98 Para Oost 171 132 139 126 140 140 Para Zuid 115 83 91 89 113 99
Totaal/ Total 389 314 331 308 379 340
Klasse / Class 4 Klasse / Class 5 Klasse / Class 6 Ressort M / M V / F M / M V / F M / M V / F Bigi Poika 5 2 4 3 5 5 Carolina 7 3 4 5 2 3 Para Noord 102 98 100 94 102 115Para Oost 149 130 159 109 107 137 Para Zuid 118 91 118 79 102 120
Totaal/ Total 381 324 385 290 318 380
Totaal / Total Leerkrachten / Teachers Scholen / Schools Ressort M /M + V/F M / M V / F Totaal/Total Response Bigi Poika 40 1 7 1 1 Carolina 47 - 8 1 1 Para Noord 1,195 4 94 4 4 Para Oost 1,639 7 132 9 8 Para Zuid 1,218 3 100 6 6
Totaal / Total Para 4,139 15 341 21 20
Bron : Ministerie van Onderwijs, Wetenschap en Cultuur, afdeling Onderzoek en Planning Source : Ministry of Education, Science and Culture, Section of Research and Planning
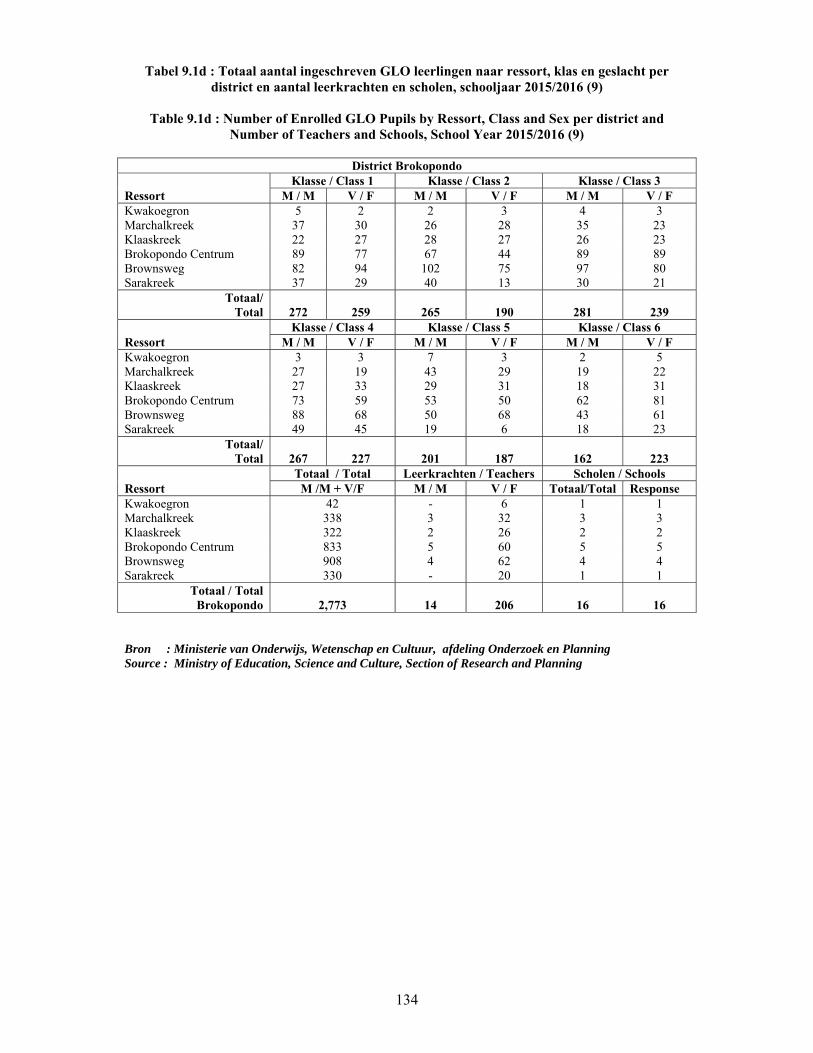
134
Tabel 9.1d : Totaal aantal ingeschreven GLO leerlingen naar ressort, klas en geslacht per district en aantal leerkrachten en scholen, schooljaar 2015/2016 (9)
Table 9.1d : Number of Enrolled GLO Pupils by Ressort, Class and Sex per district and
Number of Teachers and Schools, School Year 2015/2016 (9)
District Brokopondo Klasse / Class 1 Klasse / Class 2 Klasse / Class 3 Ressort M / M V / F M / M V / F M / M V / F Kwakoegron 5 2 2 3 4 3 Marchalkreek 37 30 26 28 35 23 Klaaskreek 22 27 28 27 26 23 Brokopondo Centrum 89 77 67 44 89 89 Brownsweg 82 94 102 75 97 80 Sarakreek 37 29 40 13 30 21
Totaal/ Total 272 259 265 190 281 239
Klasse / Class 4 Klasse / Class 5 Klasse / Class 6 Ressort M / M V / F M / M V / F M / M V / F Kwakoegron 3 3 7 3 2 5 Marchalkreek 27 19 43 29 19 22Klaaskreek 27 33 29 31 18 31 Brokopondo Centrum 73 59 53 50 62 81 Brownsweg 88 68 50 68 43 61Sarakreek 49 45 19 6 18 23
Totaal/ Total 267 227 201 187 162 223
Totaal / Total Leerkrachten / Teachers Scholen / Schools Ressort M /M + V/F M / M V / F Totaal/Total Response Kwakoegron 42 - 6 1 1 Marchalkreek 338 3 32 3 3 Klaaskreek 322 2 26 2 2 Brokopondo Centrum 833 5 60 5 5Brownsweg 908 4 62 4 4 Sarakreek 330 - 20 1 1
Totaal / Total Brokopondo 2,773 14 206 16 16
Bron : Ministerie van Onderwijs, Wetenschap en Cultuur, afdeling Onderzoek en Planning Source : Ministry of Education, Science and Culture, Section of Research and Planning

135
Tabel 9.1d : Totaal aantal ingeschreven GLO leerlingen naar ressort, klas en geslacht per district en aantal leerkrachten en scholen, schooljaar 2015/2016 (10)
Table 9.1d : Number of Enrolled GLO Pupils by Ressort, Class and Sex per district and
Number of Teachers and Schools, School Year 2015/2016 (10)
District Sipaliwini Klasse / Class 1 Klasse / Class 2 Klasse / Class 3 Ressort M / M V / F M / M V / F M / M V / F Tapanahony 191 145 186 106 181 158 Boven Suriname 439 366 385 310 392 376 Boven Saramacca 4 6 7 - 3 1 Boven Coppename 6 7 10 6 9 3 Kabalebo 28 26 31 40 37 25 Coeroeni 38 20 28 31 33 38
Totaal/ Total 706 570 647 493 655 601
Klasse / Class 4 Klasse / Class 5 Klasse / Class 6 Ressort M / M V / F M / M V / F M / M V / F Tapanahony 144 144 82 112 79 116 Boven Suriname 321 318 297 303 172 292 Boven Saramacca 4 7 3 2 2 1 Boven Coppename 6 5 7 8 9 10 Kabalebo 28 33 42 36 63 50 Coeroeni 27 15 23 10 13 19
Totaal/ Total 530 522 454 471 338 488
Totaal / Total Leerkrachten / Teachers Scholen / Schools Ressort M /M + V/F M / M V / F Totaal/Total ResponseTapanahony 1,644 11 101 16 14 Boven Suriname 3,971 28 215 25 23 Boven Saramacca 40 1 6 3 3 Boven Coppename 86 4 10 3 3 Kabalebo 439 3 31 2 2 Coeroeni 295 5 12 2 2
Totaal / Total Sipaliwini 6,475 52 375 51 47
Geheel Suriname / General Total
Klasse / Class 1 Klasse / Class 2 Klasse / Class 3 M / M V / F M / M V / F M / M V / F
Totaal / Total 6,670 5,961 6,202 5,564 6,375 5,732
Klasse / Class 4
Klasse / Class 5
Klasse / Class 6
M / M V / F M / M V / F M / M V / F Totaal /
Total 6,171 5,528 5,718 5,234 5,462 6,179
Totaal / Total
Leerkrachten / Teachers Scholen / Schools M / M + V / F M / M Totaal/Total Totaal/Total Response
Totaal / Total 70,796 261 5,726 365 341
Bron : Ministerie van Onderwijs, Wetenschap en Cultuur, afdeling Onderzoek en Planning Source : Ministry of Education, Science and Culture, Section of Research and Planning

136
Tabel 9.2a: Het totale aantal GLO leerlingen en zittenblijvers in het district Paramaribo naar klas en ressort, 2014/'15 -2015/'16
Tabel 9.2a: Total Number of GLO Pupils and Repeaters in the District of Paramaribo by Class
and Ressort, 2014/'15 -2015/'16
Ressort / Ressort
School- jaar /
School Year
Klas / Class
Aantal Scholen/ Number of Schools
1 2 3 4 5 6 Tot. lln./ Pup
Zit./ Rep
Tot. lln./ Pup
Zit./ Rep
Tot. lln./ Pup
Zit./ Rep
Tot. lln./ Pup
Zit./ Rep
Tot. lln./ Pup
Zit./ Rep
Tot. lln./ Pup
Zit./ Rep
Tot. Resp
Blauwgrond 2014/'15 266 40 220 15 267 42 228 40 235 21 207 32 7 6
2015/'16 277 32 235 10 240 39 274 48 211 24 243 61 7 6
Rainville 2014/'15 801 69 689 41 717 64 679 59 696 58 769 117 20 20
2015/'16 750 63 743 53 717 54 703 70 670 46 741 128 20 20
Munder 2014/'15 275 25 241 27 223 26 223 20 233 15 232 41 6 6
2015/'16 243 28 276 29 228 31 226 44 210 29 262 89 6 6
Centrum 2014/'15 1113 93 956 65 1013 86 1020 108 961 95 1087 169 30 26
2015/'16 1066 107 1081 52 967 99 1043 100 1006 117 1035 154 30 26
Beekhuizen 2014/'15 583 93 515 54 540 87 524 98 498 104 515 129 14 14
2015/'16 568 97 502 65 546 87 518 95 510 108 453 118 14 14
Weg naar 2014/'15 132 10 123 5 99 11 124 21 126 15 125 15 3 3 Zee
2015/'16 110 10 116 10 118 11 99 13 116 10 121 20 3 3
Welgelegen 2014/'15 197 45 168 5 152 7 161 20 160 10 163 15 4 4
2015/'16 204 10 157 10 166 11 164 13 151 10 166 20 4 4
Tammenga 2014/'15 208 22 165 14 175 21 173 24 169 18 233 47 5 5
2015/'16 203 31 195 16 179 26 182 15 153 13 208 55 5 5
Flora 2014/'15 230 32 228 13 230 31 224 42 191 33 194 34 6 6
2015/'16 211 37 194 19 206 37 217 41 211 26 173 38 6 6
Latour 2014/'15 942 199 834 127 843 177 879 198 766 108 859 573 17 14
2015/'16 935 206 878 118 876 169 860 174 768 133 867 254 17 14
Pontbuiten 2014/'15 448 78 438 83 411 75 387 68 372 50 333 90 8 7
2015/'16 367 67 402 54 390 65 366 62 355 29 387 95 8 7
Livorno 2014/'15 261 42 213 35 251 49 241 46 205 35 216 46 6 6
2015/'16 279 40 255 27 232 32 254 44 225 25 204 35 6 6 2014/'15 5,456 748 4,790 484 4,921 676 4,863 744 4,612 562 4,933 1,308 126 117
Totaal/ Total 2015/'16 5,213 688 5,034 436 4,865 629 4,906 675 4,586 545 4,860 1,032 126 117
Bron : Ministerie van Onderwijs, Wetenschap en Cultuur, afdeling Onderzoek en Planning Source : Ministry of Education, Science and Culture, Section of Research and Planning

137
Tabel 9.2b: Het totale aantal GLO leerlingen en zittenblijvers in het district Wanica naar klas en ressort, 2014/'15 -2015/'16
Tabel 9.2b: Total Number of GLO Pupils and Repeaters in the District of Wanica by Class and
Ressort, 2014/'15 -2015/'16
Ressort/ Ressort
School- jaar/ School Year
Klas / Class
Aantal Scholen/ Number of Schools
1 2 3 4 5 6 Tot. lln./ Pup
Zit./ Rep
Tot. lln./ Pup
Zit./ Rep
Tot. lln./ Pup
Zit./ Rep
Tot. lln./ Pup
Zit./ Rep
Tot. lln./ Pup
Zit./ Rep
Tot. lln./ Pup
Zit./ Rep
Tot. Resp
Kwatta 2014/'15 267 48 233 17 243 48 254 39 270 26 308 40 6 6
2015/'16 353 25 298 15 334 24 286 14 274 30 325 41 6 6
Saramacca-polder
2014/'15 153 12 139 5 146 18 142 30 131 15 177 40 4 4
2015/'16 152 20 145 11 146 22 148 32 129 9 151 26 4 4
Koewarasan 2014/'15 634 104 640 82 721 170 619 130 639 143 604 96 10 9
2015/'16 663 20 598 11 696 22 635 32 605 9 502 26 10 9 De Nieuwe
Grond 2014/'15 577 91 522 60 524 84 533 72 504 78 605 137 11 11
2015/'16 582 64 581 53 580 88 555 72 557 65 601 126 11 11
Lelydorp 2014/'15 533 73 474 49 477 66 483 96 565 59 522 125 12 12
2015/'16 580 72 540 47 527 66 533 70 472 48 609 145 12 12
Houttuin 2014/'15 245 33 235 34 239 58 220 43 175 31 240 47 5 5
2015/'16 236 32 241 27 254 55 237 44 199 29 187 31 5 5
Domburg 2014/'15 113 21 121 2 108 3 90 10 125 14 129 15 5 4
2015/'16 127 8 95 2 116 12 112 19 90 12 117 22 5 4
2014/'15 2,522 382 2,364 249 2,458 447 2,341 420 2,409 366 2,585 500 53 51 Totaal /
Total 2015/'16 2,693 241 2,498 166 2,653 289 2,506 283 2,326 202 2,492 417 53 51 Bron : Ministerie van Onderwijs, Wetenschap en Cultuur, afdeling Onderzoek en Planning Source : Ministry of Education, Science and Culture, Section of Research and Planning

138
Tabel 9.2c: Het totale aantal GLO leerlingen en zittenblijvers in het district Nickerie naar klas en ressort, 2014/'15 -2015/'16
Tabel 9.2c: Total Number of GLO Pupils and Repeaters in the District of Nickerie by Class and Ressort, 2014/'15 -2015/'16
Ressort/ Ressort
School- jaar/ School Year
Klas / Class
Aantal Scholen/ Number of Schools
1 4 5 6 Tot. lln./ Pup
Zit./ Rep.
Tot. lln./ Pup
Zit./ Rep.
Tot. lln./ Pup
Zit./ Rep.
Tot. lln./ Pup
Zit./ Rep.
Tot. lln./ Pup
Zit./ Rep.
Tot. lln./ Pup
Zit./ Rep.
Tot. Resp
Wageningen
2014/'15 59 8 54 0 67 9 54 8 70 15 58 11 4 4
2015/'16 61 5 51 7 65 15 59 5 61 11 60 9 4 4
Groot Henar 2014/'15 48 10 34 2 43 7 37 5 46 12 69 15 3 2
2015/'16 58 12 40 3 38 6 38 11 41 14 47 5 3 2 Oostelijke
Polders 2014/'15 98 9 98 4 84 5 102 6 90 3 106 19 6 5
2015/'16 85 5 93 2 98 3 87 4 98 4 112 13 6 5 Nieuw
Nickerie 2014/'15 253 25 190 10 208 20 244 28 251 25 282 44 8 8
2015/'16 248 26 236 10 212 21 238 28 245 23 265 40 8 8Westelijke
Polders 2014/'15 137 12 111 5 135 27 152 24 159 16 165 24 10 7
2015/'16 143 10 132 6 134 7 124 14 139 18 164 26 10 7
2014/'15 595 64 487 21 537 68 589 71 616 71 680 113 31 26 Totaal / Total 2015/'16 595 58 552 28 547 52 546 62 584 70 648 93 31 26
Bron : Ministerie van Onderwijs, Wetenschap en Cultuur, afdeling Onderzoek en Planning Source : Ministry of Education, Science and Culture, Section of Research and Planning Tabel 9.2d: Het totale aantal GLO leerlingen en zittenblijvers in het district Coronie naar klas
en ressort, 2014/'15 -2015/'16
Tabel 9.2d: Total Number of GLO Pupils and Repeaters in the District of Coronie by Class and Ressort, 2014/'15 -2015/'16
Ressort/ Ressort
School- jaar/ School Year
Klas / Class
Aantal Scholen/ Number of Schools
1 2 3 4 5 6 Tot. lln./ Pup
Zit./ Rep.
Tot. lln./ Pup
Zit./ Rep.
Tot. lln./ Pup
Zit./ Rep.
Tot. lln./ Pup
Zit./ Rep.
Tot. lln./ Pup
Zit./ Rep.
Tot. lln./ Pup
Zit./ Rep.
Tot. Resp
Welgelegen 2014/'15 15 3 14 3 22 7 24 6 31 3 40 23 2 2
2015/'16 24 4 19 4 24 1 22 2 28 7 50 22 2 2
Totness 2014/'15 23 6 19 3 27 1 35 7 34 6 38 12 1 1
2015/'16 23 2 22 3 17 - 32 6 32 10 33 14 1 1 Johanna Maria 2014/'15 9 - 10 -0 12 1 11 2 12 2 10 4 1 1
2015/'16 2 - 9 1 8 - 10 1 12 3 13 5 1 1
Totaal / Total
2014/'15 47 9 43 6 61 9 70 15 77 11 88 39 4 4
2015/'16 49 6 50 8 49 1 64 9 72 20 96 41 4 4 Bron : Ministerie van Onderwijs, Wetenschap en Cultuur, afdeling Onderzoek en Planning Source : Ministry of Education, Science and Culture, Section of Research and Planning

139
Tabel 9.2e: Het totale aantal GLO leerlingen en zittenblijvers in het district Saramacca naar klas en ressort, 2014/'15 -2015/'16
Tabel 9.2e: Total Number of GLO Pupils and Repeaters in the District of Saramacca by Class
and Ressort, 2014/'15 -2015/'16
Ressort/ Ressort
School- jaar/ School Year
Klas / Class
Aantal Scholen/ Number of Schools
1 2 3 4 5 6 Tot. lln./ Pup
Zit./ Rep.
Tot. lln./ Pup
Zit./ Rep.
Tot. lln./ Pup
Zit./ Rep.
Tot. lln./ Pup
Zit./ Rep.
Tot. lln./ Pup
Zit./ Rep.
Tot. lln./ Pup
Zit./ Rep.
Tot. Resp
Calcutta 2014/'15 43 7 31 6 28 1 38 6 34 7 29 - 3 3
2015/'16 45 8 37 1 27 5 35 8 37 7 26 1 3 3
Tijgerkreek 2014/'15 60 9 57 6 50 8 49 6 57 5 59 8 2 2
2015/'16 49 2 55 3 56 7 46 9 47 7 56 8 2 2
Groningen 2014/'15 92 12 85 9 75 13 70 10 86 15 102 32 3 3
2015/'16 83 9 89 9 93 9 69 9 82 7 95 20 3 3 Kampong
Baroe 2014/'15 47 9 41 5 39 4 38 3 42 9 48 5 2 2
2015/'16 52 3 52 2 45 4 35 3 44 4 36 7 2 2
Wayamboweg 2014/'15 38 5 37 2 32 4 30 6 31 6 34 7 2 2
2015/'16 35 4 32 1 36 4 32 5 26 1 31 2 2 2
Jarikaba 2014/'15 116 16 87 7 99 13 102 17 93 23 95 14 3 3
2015/'16 91 10 119 15 92 12 106 17 115 21 78 8 3 3 2014/'15 396 58 338 35 323 43 327 48 343 65 367 66 15 15
Totaal / Total 2015/'16 355 36 384 31 349 41 323 51 351 47 322 46 15 15 Bron : Ministerie van Onderwijs, Wetenschap en Cultuur, afdeling Onderzoek en Planning Source : Ministry of Education, Science and Culture, Section of Research and Planning

140
Tabel 9.2f: Het totale aantal GLO leerlingen en zittenblijvers in het district Commewijne naar klas en ressort, 2014/'15 -2015/'16
Tabel 9.2f: Total Number of GLO Pupils and Repeaters in the District of Commewijne by Class
and Ressort, 2014/'15 -2015/'16
Ressort/ Ressort
School- jaar/ School Year
Klas / Class
Aantal Scholen/ Number of Schools
1 2 3 4 5 6 Tot. lln./ Pup
Zit./ Rep.
Tot. lln./ Pup
Zit./ Rep.
Tot. lln./ Pup
Zit./ Rep.
Tot. lln./ Pup
Zit./ Rep.
Tot. lln./ Pup
Zit./ Rep.
Tot. lln./ Pup
Zit./ Rep.
Tot. Resp
Margaretha 2014/'15 7 1 9 1 12 6 10 1 14 3 9 3 2 2
2015/'16 14 1 9 - 15 1 7 - 13 1 13 6 2 2
Bakkie 2014/'15 5 5 5 5 7 7 9 9 5 5 11 11 2 2
2015/'16 10 1 8 - 6 - 10 2 7 1 7 1 2 2Nieuw
Amsterdam 2014/'15 111 11 89 5 101 12 95 12 107 11 124 10 3 3
2015/'16 111 8 109 8 91 12 103 10 86 16 107 25 3 3
Alkmaar 2014/'15 87 13 104 14 102 12 119 8 120 7 124 22 5 5
2015/'16 106 9 86 2 108 6 101 6 117 10 133 38 5 5
Tamanredjo 2014/'15 154 14 166 25 152 10 147 13 197 14 211 36 5 5
2015/'16 186 19 172 3 165 6 168 11 149 16 223 41 5 5
Meerzorg 2014/'15 196 19 201 6 189 13 191 18 167 16 216 31 7 6
2015/'16 185 11 172 5 200 28 187 17 177 11 180 28 7 6 2014/'15 560 63 574 56 563 60 571 61 610 56 695 113 24 23
Totaal / Total 2015/'16 612 49 556 18 585 53 576 46 549 55 663 139 24 23 Bron : Ministerie van Onderwijs, Wetenschap en Cultuur, afdeling Onderzoek en Planning Source : Ministry of Education, Science and Culture, Section of Research and Planning

141
Tabel 9.2g: Het totale aantal GLO leerlingen en zittenblijvers in het district Marowijne naar klas en ressort, 2014/'15 -2015/'16
Tabel 9.2g: Total Number of GLO Pupils and Repeaters in the District of Marowijne by Class
and Ressort, 2014/'15 -2015/'16
Ressort/ Ressort
School- jaar/ School Year
Klas / Class
Aantal Scholen/ Number of Schools
1 2 3 4 5 6 Tot. lln./ Pup
Zit./ Rep.
Tot. lln./ Pup
Zit./ Rep.
Tot.lln./ Pup
Zit./ Rep.
Tot.lln./ Pup
Zit./ Rep.
Tot.lln./ Pup
Zit./ Rep.
Tot. lln./ Pup
Zit./ Rep.
Tot. Resp
Moengo 2014/'15 338 83 317 63 313 59 363 85 358 94 306 70 12 11
2015/'16 367 87 288 43 323 82 302 70 298 53 367 116 12 11
Wanhatti 2014/'15 12 4 9 - 13 2 15 4 12 3 15 1 2 2
2015/'16 13 3 11 4 17 3 9 5 17 7 18 5 2 2
Galibi 2014/'15 10 2 5 - 6 - 11 3 15 4 13 4 1 1
2015/'16 18 7 6 - 10 1 15 5 11 - 22 3 1 1
Albina 2014/'15 196 71 155 44 134 21 128 29 125 32 143 50 1 1
2015/'16 183 40 115 25 126 42 157 42 116 18 153 61 1 1
Patamacca 2014/'15 7 2 6 1 11 - 11 1 2 1 1 - 6 6
2015/'16 2 - 3 2 8 1 - - 3 1 1 - 6 6
Moengotapu 2014/'15 9 2 14 5 14 4 14 2 12 3 6 1 2 1
2015/'16 9 3 8 2 13 4 8 5 5 - 12 2 2 1 2014/'15 572 164 506 113 491 86 542 124 524 137 484 126 24 22
Totaal / Total 2015/'16 592 140 431 76 497 133 491 127 450 79 573 187 24 22
Bron : Ministerie van Onderwijs, Wetenschap en Cultuur, afdeling Onderzoek en Planning Source : Ministry of Education, Science and Culture, Section of Research and Planning

142
Tabel 9.2h: Het totale aantal GLO leerlingen en zittenblijvers in het district Para naar klas en ressort, 2014/'15 -2015/'16
Tabel 9.2h: Total Number of GLO Pupils and Repeaters in the District of Para by Class and
Ressort, 2014/'15 -2015/'16
Ressort/ Ressort
School- jaar/ School Year
Klas / Class
Aantal Scholen/ Number of Schools
1 2 3 4 5 6 Tot. lln./ Pup
Zit./ Rep.
Tot. lln./ Pup
Zit./ Rep.
Tot. lln./ Pup
Zit./ Rep.
Tot. lln./ Pup
Zit./ Rep.
Tot. lln./ Pup
Zit./ Rep.
Tot. lln./ Pup
Zit./ Rep.
Tot. Resp
Noord 2014/'15 201 32 196 18 204 38 188 31 200 44 214 61 4 4
2015/'16 190 23 180 20 214 48 200 40 194 42 217 79 4 4
Oost 2014/'15 313 72 242 34 295 63 267 58 247 66 289 66 9 8
2015/'16 303 57 265 38 280 72 279 62 268 40 244 64 9 8
Zuid 2014/'15 200 41 167 19 194 45 194 41 206 33 208 50 6 6
2015/'16 198 28 180 26 212 42 209 21 197 27 222 70 6 6
Bigi Poika 2014/'15 7 1 2 1 8 - 7 - 9 2 11 3 1 1
2015/'16 6 1 7 2 3 - 7 - 7 1 10 7 1 1
Carolina 2014/'15 7 2 10 3 12 5 9 1 6 2 10 1 1 1
2015/'16 6 1 7 1 10 2 10 2 9 1 5 1 1 1
2014/'15 728 148 617 75 713 151 665 131 668 147 732 181 21 20 Totaal /
Total 2015/'16 703 110 639 87 719 164 705 125 675 111 698 221 21 20 Bron : Ministerie van Onderwijs, Wetenschap en Cultuur, afdeling Onderzoek en Planning Source : Ministry of Education, Science and Culture, Section of Research and Planning

143
Tabel 9.2i: Het totale aantal GLO leerlingen en zittenblijvers in het district Brokopondo naar klas en ressort, 2014/'15 -2015/'16
Tabel 9.2i: Total Number of GLO Pupils and Repeaters in the District of Brokopondo by Class
and Ressort, 2014/'15 -2015/'16
Ressort/ Ressort
School- jaar/ School Year
Klas / Class
Aant al Scholen/ Number of Schools
1 2 3 4 5 6 Tot. lln./ Pup
Zit./ Rep.
Tot. lln./ Pup
Zit./ Rep.
Tot. lln./ Pup
Zit./ Rep.
Tot. lln./ Pup
Zit./ Rep.
Tot. lln./ Pup
Zit./ Rep.
Tot. lln./ Pup
Zit./ Rep.
Tot. Resp
Marchalkreek 2014/'15 77 23 52 16 72 24 71 12 58 19 44 15 3 3
2015/'16 67 23 54 19 58 19 46 12 72 26 41 11 3 3
Klaaskreek 2014/'15 78 14 50 11 66 14 54 14 62 25 64 14 2 2
2015/'16 49 16 55 13 49 9 60 8 60 11 49 22 2 2
Brokopondo Centrum
2014/'15 165 52 141 22 160 60 122 44 134 27 105 30 5 5
2015/'16 166 48 111 20 178 50 132 33 103 22 143 41 5 5
Brownsweg 2014/'15 177 48 163 42 166 55 126 42 114 34 113 34 4 4
2015/'16 176 34 177 27 177 21 156 17 118 24 104 22 4 4
Sarakreek 2014/'15 78 33 65 24 76 12 64 32 46 10 48 15 1 1
2015/'16 66 23 53 16 51 27 94 39 25 9 41 12 1 1
Kwakoegron 2014/'15 8 1 4 - 3 - 7 1 10 2 6 1 1 1
2015/'16 7 1 5 2 7 1 6 3 10 2 7 2 1 1 2014/'15 583 171 475 115 543 165 444 145 424 117 380 109 16 16
Totaal / Total 2015/'16 531 145 455 97 520 127 494 112 388 94 385 110 16 16
Bron : Ministerie van Onderwijs, Wetenschap en Cultuur, afdeling Onderzoek en Planning Source : Ministry of Education, Science and Culture, Section of Research and Planning

144
Tabel 9.2j: Het totale aantal GLO leerlingen en zittenblijvers in het district Sipaliwini naar klas en ressort, 2014/'15 -2015/'16
Tabel 9.2j: Total Number of GLO Pupils and Repeaters in the District of Sipaliwini by Class
and Ressort, 2014/'15 -2015/'16
Ressort/ Ressort
School- jaar/ School Year
Klas / Class
Aant al Scholen/ Number of Schools
1 2 3 4 5 6 Tot. lln./ Pup
Zit./ Rep.
Tot. lln./ Pup
Zit./ Rep.
Tot. lln./ Pup
Zit./ Rep.
Tot. lln./ Pup
Zit./ Rep.
Tot. lln./ Pup
Zit./ Rep.
Tot. lln./ Pup
Zit./ Rep.
Tot. Resp
Tapanahony 2014/'15 385 164 310 86 328 128 288 91 236 30 218 35 16 14
2015/'16 336 87 292 64 339 100 288 59 194 33 195 67 16 14 Boven-
Suriname 2014/'15 868 320 716 182 713 245 713 202 558 138 451 111 25 23
2015/'16 805 280 695 143 768 231 639 195 600 117 464 122 25 23 Boven-
Coppename 2014/'15 11 1 8 3 17 6 18 3 15 1 16 4 3 3
2015/'16 13 1 16 - 12 - 11 - 15 - 19 - 3 3 Boven-
Saramacca 2014/'15 5 2 5 2 10 1 4 - 7 1 3 - 3 3
2015/'16 10 1 7 1 4 1 12 2 5 5 3 - 3 3
Kabalebo 2014/'15 81 17 55 8 62 16 67 7 75 15 101 51 2 2
2015/'16 50 7 70 5 60 10 53 12 74 8 111 54 2 2
Coeroeni 2014/'15 53 11 50 8 55 23 41 10 40 7 31 8 2 2
2015/'16 68 17 59 20 71 16 42 9 33 10 32 6 2 2 2014/'15 1,403 515 1144 289 1,185 419 1,131 313 931 192 820 209 51 47 Totaal / Total 2015/'16 1,282 393 1,139 233 1,254 358 1,045 277 921 173 824 249 51 47
Bron : Ministerie van Onderwijs, Wetenschap en Cultuur, afdeling Onderzoek en Planning
Source : Ministry of Education, Science and Culture, Section of Research and Planning

145
Tabel 9.3a: Het totale aantal GLO leerlingen en zittenblijvers naar klas per district, schooljaar 2014/'15
Tabel 9.3a: Total Number of GLO Pupils and Repeaters by Class per District,
School Year 2014/'15
Klas 1/ Class 1
Klas 2/ Class 2
Klas 3/ Class 3
District/ Aant.lln/ Zittenblijvers/ Aant.lln/ Zittenblijvers/ Aant.lln/ Zittenblijvers/ Resp District Pupils Repeaters Pupils Repeaters Pupils Repeaters School
Abs. in % Abs. in % Abs. in %
Paramaribo 5,457 748 13.7 4,790 484 10.1 4,921 676 13.7 117 Wanica 2,522 382 15.1 2,364 249 10.5 2,458 447 18.2 51 Nickerie 595 64 10.8 487 21 4.3 537 68 12.7 26 Coronie 47 9 19.1 43 6 14.0 61 9 14.8 4
Saramacca 396 58 14.6 338 35 10.4 323 43 13.3 15 Commewijne 560 63 11.3 574 56 9.8 563 60 10.7 23 Marowijne 572 164 28.7 506 113 22.3 491 86 17.5 22
Para 728 148 20.3 617 75 12.2 713 151 21.2 20 Brokopondo 583 171 29.3 475 115 24.2 543 165 30.4 16
Sipaliwini 1,403 515 36.7 1,144 289 25.3 1,185 419 35.4 47 Totaal/ Total 12,863 2,322 18.1 11,338 1,443 12.7 11,795 2,124 18.0 341
Klas 4/
Class 4 Klas 5/ Class 5
Klas 6/ Class 6
District/ Aant.lln/ Zittenblijvers/ Aant.lln/ Zittenblijvers/ Aant.lln/ Zittenblijvers/ Resp District Pupils Repeaters Pupils Repeaters Pupils Repeaters School
Abs. in % Abs. in % Abs. in %
Paramaribo 4,863 744 15.3 4,612 562 12.2 4,933 1,308 26.5 117 Wanica 2,341 420 17.9 2,409 366 15.2 2,585 500 19.3 51 Nickerie 589 71 12.1 616 71 11.5 680 113 16.6 26 Coronie 70 15 21.4 77 11 14.3 88 39 44.3 4
Saramacca 327 48 14.7 343 65 19.0 367 66 18.0 15 Commewijne 571 61 10.7 610 56 9.2 695 113 16.3 23 Marowijne 542 124 22.9 524 137 26.1 484 126 26.0 22
Para 665 131 19.7 668 147 22.0 732 181 24.7 20 Brokopondo 444 145 32.7 424 117 27.6 380 109 28.7 16
Sipaliwini 1,131 313 27.7 931 192 20.6 820 209 25.5 47 Totaal/ Total 11,543 2,072 18.0 11,214 1,724 15.4 11,764 2,764 23.5 341
Bron : Ministerie van Onderwijs, Wetenschap en Cultuur, afdeling Onderzoek en Planning Source : Ministry of Education, Science and Culture, Section of Research and Planning

146
Tabel 9.3b: Het Totale aantal GLO leerlingen en zittenblijvers naar klas per district, schooljaar 2015/'16
Tabel 9.3b: Total Number of GLO Pupils and Repeaters by Class per District,
School Year 2015/'16
Klas 1/ Class 1
Klas 2/ Class 2
Klas 3/ Class 3
District/ Aant.lln/ Zittenblijvers/ Aant.lln/ Zittenblijvers/ Aant.lln/ Zittenblijvers/ Resp District Pupils Repeaters Pupils Repeaters Pupils Repeaters School
Abs. in % Abs. in % Abs. in %
Paramaribo 5,213 688 13.2 5,034 436 8.7 4,865 629 12.9 117 Wanica 2,693 305 11.3 2,498 211 8.4 2,653 343 12.9 51 Nickerie 595 58 9.7 552 28 5.1 547 52 9.5 26 Coronie 49 6 12.2 50 8 16.0 49 1 2.0 4
Saramacca 355 36 10.1 384 31 8.1 349 41 11.7 15 Commewijne 612 49 8.0 556 18 3.2 585 53 9.1 23 Marowijne 592 140 23.6 431 76 17.6 489 132 27.0 22
Para 703 110 15.6 639 87 13.6 719 164 22.8 20 Brokopondo 531 145 27.3 455 97 21.3 520 127 24.4 16
Sipaliwini 1,282 393 30.7 1,139 233 20.5 1,254 358 28.5 47 Totaal/ Total 12,625 1,930 15.3 11,738 1,225 10.4 12,030 1,900 15.8 341
Klas 4/
Class 4 Klas 5/ Class 5
Klas 6/ Class 6
District/ Aant.lln/ Zittenblijvers/ Aant.lln/ Zittenblijvers/ Aant.lln/ Zittenblijvers/ Resp District Pupils Repeaters Pupils Repeaters Pupils Repeaters School
Abs. in % Abs. in % Abs. in %
Paramaribo 4,906 675 13.8 4,586 545 11.9 4,860 1,032 21.2 117 Wanica 2,506 334 13.3 2,326 238 10.2 2,492 540 21.7 51 Nickerie 546 62 11.4 584 70 12.0 648 93 14.4 26 Coronie 64 9 14.1 72 20 27.8 96 41 42.7 4
Saramacca 323 51 15.8 351 47 13.4 322 46 14.3 15 Commewijne 576 46 8.0 549 55 10.0 663 139 21.0 23 Marowijne 491 127 25.9 450 79 17.6 573 187 491 22
Para 705 125 17.7 675 111 16.4 698 221 31.7 20 Brokopondo 494 112 22.7 388 94 24.2 385 110 28.6 16
Sipaliwini 1,045 277 26.5 921 173 18.8 824 249 30.2 47 Totaal/ Total 11,656 1,818 15.6 10,902 1,432 13.1 11,561 2,658 23.0 341 Bron : Ministerie van Onderwijs, Wetenschap en Cultuur, afdeling Onderzoek en Planning Source : Ministry of Education, Science and Culture, Section of Research and Planning

147
Tabel 9.4a : Leerlingen die hebben deelgenomen aan de GLO - 6 toets naar soort uitslag en district in 2014/2015
Table 9.4a : Pupils who Took Part in Examination of GLO - 6 Test by Kind of Result and
District in 2014/2015
District/ Geslaagden / Passed District MULO Totaal LBO - ORT Totaal
M/M V/F Total M/M V/F Total Paramaribo 1,301 1,588 2,889 114 91 205
Wanica 747 823 1,570 64 48 112 Nickerie 186 256 442 13 10 23 Coronie 8 17 25 2 2 4
Saramacca 89 141 230 5 6 11 Commewijne 202 272 474 18 4 22 Marowijne 93 104 197 7 16 23
Para 133 197 330 10 24 34 Brokopondo 48 74 122 11 7 18
Sipaliwini 87 114 201 35 37 72 Totaal /
Total 2,894 3,586 6,480 279 245 524 District/ Afgewezenen/ Failed District Kl.6 ov/LBO-ORT Kl.6 overdoen Totaal Schooladvies
M/M V/F M/M V/F Total M/M V/F Totaal / Total Paramaribo 158 177 393 361 1,089 338 275 613
Wanica 69 88 205 194 556 164 109 273 Nickerie 20 13 40 42 115 36 33 69 Coronie 5 4 15 14 38 16 5 21
Saramacca 9 16 23 28 76 22 12 34 Commewijne 23 24 57 34 138 28 21 49 Marowijne 16 23 67 91 197 83 67 150
Para 33 28 62 74 197 86 72 158 Brokopondo 5 17 27 56 105 59 56 115
Sipaliwini 12 23 56 96 187 159 165 324 Totaal /
Total 350 413 945 990 2,698 991 815 1,806 District/ Geslaagden/Passed Afgewezenen/ Failed Totaal/ Total District
M/M V/F Tot. M/M V/F Tot. M/M V/F Tot.
Paramaribo 1,415 1,679 3,094 889 813 1,702 2,304 2,492 4,796 Wanica 811 871 1,682 438 391 829 1,249 1,262 2,511 Nickerie 199 266 465 96 88 184 295 354 649 Coronie 10 19 29 36 23 59 46 42 88
Saramacca 94 147 241 54 56 110 148 203 351 Commewijne 220 276 496 108 79 187 328 355 683 Marowijne 100 120 220 166 181 347 266 301 567
Para 143 221 364 181 174 355 324 395 719 Brokopondo 59 81 140 91 129 220 150 210 360
Sipaliwini 122 151 273 227 284 511 349 435 784 Totaal /
Total 3,173 3,831 7,004 2,286 2,218 4,504 5,459 6,049 11,508 LBO-ORT = Lager Beroeps Onderwijs-Orientatiejaar / Junior Secondary Vocational Orientation year Bron : Ministerie van Onderwijs, Wetenschap en Cultuur, afdeling Onderzoek en Planning en Cebuma Source : Ministry of Education, Science and Culture, Section of Research and Planning and Cebuma

148
Tabel 9.4b : Leerlingen die hebben deelgenomen aan de GLO - 6 toets naar soort uitslag en district in 2015/2016
Table 9.4b : Pupils who Took Part in Examination of GLO - 6 Test by Kind of Result and
District in 2015/2016
District/ Geslaagden / Passed District MULO Totaal LBO - ORT Totaal
M/M V/F Total M/M V/F Total Paramaribo 1,118 1,312 2,430 98 86 184
Wanica 636 856 1,492 63 53 116 Nickerie 217 218 435 10 8 18 Coronie 8 16 24 2 1 3
Saramacca 65 122 187 3 2 5 Commewijne 194 233 427 10 5 15 Marowijne 76 108 184 15 14 29
Para 114 171 285 21 10 31 Brokopondo 54 79 133 9 11 20
Sipaliwini 85 124 209 17 32 49 Totaal /
Total 2,567 3,239 5,806 248 222 470 District/ Afgewezenen/ Failed District Kl.6 ov/LBO-ORT Kl.6 overdoen Totaal Schooladvies
M/M V/F M/M V/F Total M/M V/F Totaal / Total Paramaribo 132 152 412 419 1,115 405 348 753
Wanica 68 80 252 269 669 856 218 1,074 Nickerie 18 20 41 34 113 25 18 43 Coronie 4 5 20 12 41 17 12 29
Saramacca 8 9 26 15 58 16 16 32 Commewijne 29 16 56 41 142 44 16 60 Marowijne 10 12 54 86 162 101 81 182
Para 18 31 75 98 222 73 58 131 Brokopondo 6 8 24 52 90 61 63 124
Sipaliwini 12 18 52 108 190 153 162 315 Totaal /
Total 305 351 1,012 1,134 2,802 1,751 992 2,743 District/ Geslaagden/Passed Afgewezenen/ Failed Totaal/ Total District
M/M V/F Tot. M/M V/F Tot. M/M V/F Tot.
Paramaribo 1,216 1,398 2,614 949 919 1,868 2,165 2,317 4,482 Wanica 699 909 1,608 1,176 567 1,743 1,875 1,476 3,351 Nickerie 227 226 453 84 72 156 311 298 609 Coronie 10 17 27 41 29 70 51 46 97
Saramacca 68 124 192 50 40 90 118 164 282 Commewijne 204 238 442 129 73 202 333 311 644 Marowijne 91 122 213 165 179 344 256 301 557
Para 135 181 316 166 187 353 301 368 669 Brokopondo 63 90 153 91 123 214 154 213 367
Sipaliwini 102 156 258 217 288 505 319 444 763 Totaal /
Total 2,815 3,461 6,276 3,068 2,477 5,545 5,883 5,938 11,821 LBO-ORT = Lager Beroeps Onderwijs-Orientatiejaar / Junior Secondary Vocational Orientation year Bron : Ministerie van Onderwijs, Wetenschap en Cultuur, afdeling Onderzoek en Planning en Cebuma Source : Ministry of Education, Science and Culture, Section of Research and Planning and Cebuma

G
1
1
2
2
3
3
4
201
Grafiek 9.1:
0
500
1000
1500
2000
2500
3000
3500
4000
14/2015
Geslaagden
Graph 9.1
M/M
Geslaagde
2015/2016
n/Afgewezen2014/201
1: Results o2014/201
V/F
en / Passed
nen voor de5 - 2015/201
of the GLO-5 - 2015/201
M
A
e GLO-6 toe16
6 Test by Se16
M/M
Afgewezenen
ets naar ges
ex,
V/F
n / Failed
slacht,

150
Tabel 9.5 : Aantal VOJ leerlingen naar geslacht, en type in de schooljaren 2014 / 2015 - 2015 / 2016
Table 9.5 : Number of pupils of VOJ by Sex , and Type in the School Years
2014 / 2015 - 2015 / 2016
Type VOJ/
Schooljaar / School Year
Type of VOJ/ 2014/2015 2015/2016 M/M V/F Totaal/Total M/M V/F Totaal/Total
LBO 7,415 4,283 11,698 8,060 4,865 12,925
MULO 10,688 15,252 25,940 10,080 14,272 24,352
Totaal / Total 18,103 19,535 37,638 18,140 19,137 37,277 Bron : Ministerie van Onderwijs, Wetenschap en Cultuur, afdeling Onderzoek en Planning Source : Ministry of Education, Science and Culture, Section of Research and Planning

151
Tabel 9.5a: Aantal LBO leerlingen naar geslacht en aantal scholen per district in de schooljaren 2014 / 2015 – 2015 / 2016
Table 9.5a: Number of Pupils of LBO by Sex and Number of Schools per District in
the School Years 2014 / 2015 – 2015 / 2016
2014/2015 District/ District
M/ M
V/ F
Totaal/ Total
Scholen/ Schools1)
Scholen/ Schools2)
Paramaribo 4,799 2,566 7,365 26 19
Wanica 912 698 1,610 9 8
Nickerie 4) 407 121 528 2 2
Coronie 52 14 66 1 1
Saramacca 121 54 175 1 1
Commewijne4) 229 125 354 4 3
Marowijne 414 292 706 2 2
Para 246 166 412 5 5
Brokopondo 3) 146 184 330 - -
Sipaliwini 4) 89 63 152 2 2
Totaal/Total 7,415 4,283 11,698 52 43
2015/2016 District/ District
M/ M
V/ F
Totaal/ Total
Scholen/ Schools1)
Scholen/ Schools2)
Paramaribo 5,322 3,056 8,378 26 25
Wanica 844 668 1,512 9 8
Nickerie 4) 409 133 542 2 2
Coronie 52 22 74 1 1
Saramacca 123 45 168 1 1
Commewijne4) 238 140 378 4 4
Marowijne 419 317 736 2 2
Para 393 207 600 5 3
Brokopondo 3) 138 175 313 - -
Sipaliwini 4) 122 102 224 2 2
Totaal/Total 8,060 4,865 12,925 52 48 1) Totaal aantal scholen / Total Number of Schools 2) Aantal responderende scholen / Number of Responding Schools 3) Betreft ll.v. LBO- klassen op de Mulo-school / Refer to pupil from the LBO-Classes on the Mulo Schools 4) Inclusief lln.v.LBO- klassen op de Mulo-school/ Inclusive of the pupils from the LBO-Classes at the Mulo Schools Bron : Ministerie van Onderwijs, Wetenschap en Cultuur, afdeling Onderzoek en Planning Source : Ministry of Education, Science and Culture, Section of Research and Planning
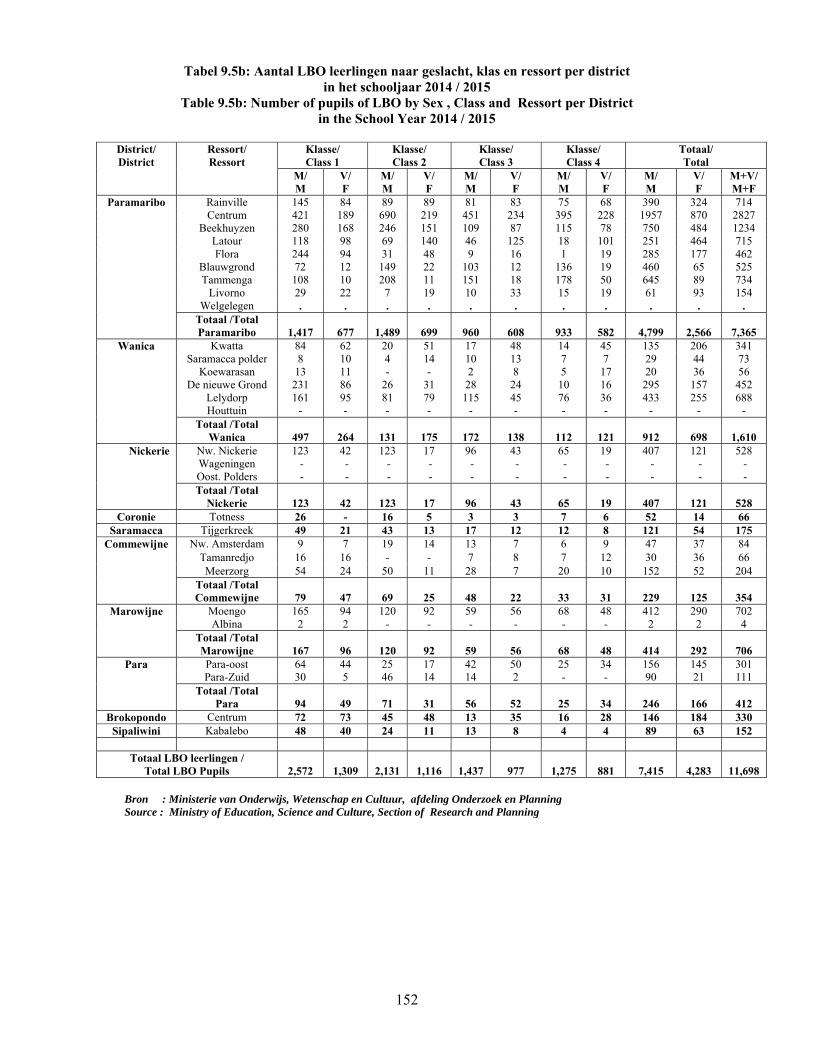
152
Tabel 9.5b: Aantal LBO leerlingen naar geslacht, klas en ressort per district in het schooljaar 2014 / 2015
Table 9.5b: Number of pupils of LBO by Sex , Class and Ressort per District in the School Year 2014 / 2015
District/ District
Ressort/ Ressort
Klasse/ Class 1
Klasse/ Class 2
Klasse/ Class 3
Klasse/ Class 4
Totaal/ Total
M/ M
V/ F
M/ M
V/ F
M/ M
V/ F
M/ M
V/ F
M/ M
V/ F
M+V/ M+F
Paramaribo Rainville 145 84 89 89 81 83 75 68 390 324 714 Centrum 421 189 690 219 451 234 395 228 1957 870 2827
Beekhuyzen 280 168 246 151 109 87 115 78 750 484 1234 Latour 118 98 69 140 46 125 18 101 251 464 715 Flora 244 94 31 48 9 16 1 19 285 177 462
Blauwgrond 72 12 149 22 103 12 136 19 460 65 525 Tammenga 108 10 208 11 151 18 178 50 645 89 734
Livorno 29 22 7 19 10 33 15 19 61 93 154 Welgelegen . . . . . . . . . . .
Totaal /Total Paramaribo 1,417 677 1,489 699 960 608 933 582 4,799 2,566 7,365
Wanica Kwatta 84 62 20 51 17 48 14 45 135 206 341 Saramacca polder 8 10 4 14 10 13 7 7 29 44 73
Koewarasan 13 11 - - 2 8 5 17 20 36 56 De nieuwe Grond 231 86 26 31 28 24 10 16 295 157 452
Lelydorp 161 95 81 79 115 45 76 36 433 255 688Houttuin - - - - - - - - - - -
Totaal /Total Wanica 497 264 131 175 172 138 112 121 912 698 1,610
Nickerie Nw. Nickerie 123 42 123 17 96 43 65 19 407 121 528 Wageningen - - - - - - - - - - - Oost. Polders - - - - - - - - - - - Totaal /Total
Nickerie 123 42 123 17 96 43 65 19 407 121 528 Coronie Totness 26 - 16 5 3 3 7 6 52 14 66
Saramacca Tijgerkreek 49 21 43 13 17 12 12 8 121 54 175 Commewijne Nw. Amsterdam 9 7 19 14 13 7 6 9 47 37 84
Tamanredjo 16 16 - - 7 8 7 12 30 36 66 Meerzorg 54 24 50 11 28 7 20 10 152 52 204
Totaal /Total Commewijne 79 47 69 25 48 22 33 31 229 125 354
Marowijne Moengo 165 94 120 92 59 56 68 48 412 290 702 Albina 2 2 - - - - - - 2 2 4
Totaal /Total Marowijne 167 96 120 92 59 56 68 48 414 292 706
Para Para-oost 64 44 25 17 42 50 25 34 156 145 301Para-Zuid 30 5 46 14 14 2 - - 90 21 111
Totaal /Total Para 94 49 71 31 56 52 25 34 246 166 412
Brokopondo Centrum 72 73 45 48 13 35 16 28 146 184 330 Sipaliwini Kabalebo 48 40 24 11 13 8 4 4 89 63 152
Totaal LBO leerlingen /
Total LBO Pupils 2,572 1,309 2,131 1,116 1,437 977 1,275 881 7,415 4,283 11,698 Bron : Ministerie van Onderwijs, Wetenschap en Cultuur, afdeling Onderzoek en Planning Source : Ministry of Education, Science and Culture, Section of Research and Planning

153
Tabel 9.5c: Aantal LBO leerlingen naar geslacht, klas en ressort per district in het schooljaar 2015 / 2016
Table 9.5c: Number of pupils of LBO by Sex , Class and Ressort per District
in the School Year 2015 / 2016 District/ District
Ressort/ Ressort
Klasse/ Class 1
Klasse/ Class 2
Klasse/ Class 3
Klasse/ Class 4
Totaal/ Total
M/ M
V/ F
M/ M
V/ F
M/ M
V/ F
M/ M
V/ F
M/ M
V/ F
M+V/ M+F
Paramaribo Rainville 157 92 105 84 53 72 63 52 378 300 678 Centrum 524 279 826 436 477 291 468 280 2,295 1,286 3,581
Beekhuyzen 261 139 237 163 126 155 139 65 763 522 1,285 Latour 124 116 67 127 46 133 29 102 266 478 744 Flora 300 93 66 87 8 23 - 6 374 209 583
Blauwgrond 71 2 146 14 98 13 129 20 444 49 493 Tammenga 110 8 196 17 186 11 233 53 725 89 814
Livorno 44 37 21 37 5 17 7 32 77 123 200 Welgelegen . . . . . . . . . . .
Totaal /Total Paramaribo 1,591 766 1,664 965 999 715 1,068 610 5,322 3,056 ,8378
Wanica Kwatta 100 58 22 51 25 58 13 38 160 205 365 Saramacca polder 10 10 5 7 1 9 1 14 17 40 57
Koewarasan 12 15 - - - - 5 15 17 30 47 De nieuwe Grond 227 102 8 18 12 23 4 20 251 163 414
Lelydorp 150 91 113 65 60 37 76 37 399 230 629Houttuin - - - - - - - - - - -
Totaal /Total Wanica 499 276 148 141 98 127 99 124 844 668 1,512
Nickerie Nw. Nickerie 131 53 97 31 106 28 75 21 409 133 542 Wageningen - - - - - - - - - - - Oost. Polders - - - - - - - - - - - Totaal /Total
Nickerie 131 53 97 31 106 28 75 21 409 133 542 Coronie Totness 23 9 22 13 7 - - - 52 22 74
Saramacca Tijgerkreek 36 5 51 23 26 9 10 8 123 45 168 Commewijne Nw. Amsterdam 7 9 11 14 14 12 7 11 39 46 85
Tamanredjo 38 23 - 9 - - 4 8 42 40 82 Meerzorg 55 18 61 19 19 9 22 8 157 54 211
Totaal /Total Commewijne 100 50 72 42 33 21 33 27 238 140 378
Marowijne Moengo 144 84 95 70 79 81 70 67 388 302 690 Albina 29 14 2 1 - - - - 31 15 46
Totaal /Total Marowijne 173 98 97 71 79 81 70 67 419 317 736
Para Para-oost 137 68 66 46 44 24 32 41 279 179 458Para-Zuid 18 12 48 7 31 7 17 2 114 28 142
Totaal /Total Para 155 80 114 53 75 31 49 43 393 207 600
Brokopondo Centrum 49 58 43 49 24 32 22 36 138 175 313 Sipaliwini Kabalebo 42 52 39 24 18 6 4 8 103 90 193
Atjoni 19 12 - - - - - - 19 12 31 Totaal Sipaliwini 61 64 39 24 18 6 4 8 122 102 224
Totaal LBO leerlingen / Total LBO Pupils 2,818 1,459 2,347 1,412 1,465 1,050 1,430 944 8,060 4,865 12,925
Bron : Ministerie van Onderwijs, Wetenschap en Cultuur, afdeling Onderzoek en Planning Source : Ministry of Education, Science and Culture, Section of Research and Planning

154
Tabel 9.5d: Aantal MULO leerlingen naar geslacht en aantal scholen, per district in de schooljaren 2014/2015 - 2015/2016
Table 9.5d: Number of Pupils of MULO by Sex and Number of Schools, per District in the
School Years 2014/2015 - 2015/2016
2014/2015 Scholen/ Schools District/ District
M/ M
V/ F
Totaal/ Total
Totaal / Total
Response
Paramaribo3) 5,637 8,097 13,734 33 33 Wanica 3) 2,147 3,151 5,298 7 7 Nickerie 850 993 1,843 5 5
Coronie 4) 52 96 148 - - Saramacca 3) 350 467 817 1 1
Commewijne 3) 717 927 1,644 4 4 Marowijne 3) 239 382 621 1 1
Para 3) 447 729 1,176 2 2 Brokopondo 130 243 373 1 1 Sipaliwini 3) 119 167 286 - - Totaal/Total 10,688 15,252 25,940 54 54
2015/2016 Scholen/ Schools District/ District
M/ M
V/ F
Totaal/ Total
Totaal / Total
Response
Paramaribo3) 4,853 6,909 11,762 33 33 Wanica 3) 2,227 3,108 5,335 8 8 Nickerie 804 965 1,769 7 7
Coronie 4) 48 77 125 - - Saramacca 3) 351 494 845 3 3
Commewijne 3) 746 975 1,721 4 4 Marowijne 3) 340 547 887 1 1
Para 3) 443 774 1,217 3 3 Brokopondo 136 259 395 1 1 Sipaliwini 3) 132 164 296 1 1 Totaal/Total 10,080 14,272 24,352 61 61
1) Totaal aantal scholen / Total Number of Schools 2) Aantal responderende scholen / Number of Responding Schools 3) Betreft ll.v. LBO- klassen op de Mulo-school / Refer to pupil from the LBO-Classes on the Mulo Schools 4) Inclusief lln.v.LBO- klassen op de Mulo-school/ Inclusive of the pupils from the LBO-Classes at the Mulo Schools Bron : Ministerie van Onderwijs, Wetenschap en Cultuur, afdeling Onderzoek en Planning Source : Ministry of Education, Science and Culture, Section of Research and Planning

155
Tabel 9.5e: Aantal MULO leerlingen naar geslacht, klas en ressort per district in het schooljaar 2014 / 2015 (1)
Table 9.5e: Number of pupils of MULO by Sex , Class and Ressort per District
in the School Year 2014 / 2015 (1)
District Paramaribo Ressort/Ressort Klasse/Class 1 Klasse/Class 2 Klasse/Class 3 Klasse/Class 4 Totaal/Total
M/ M
V/ F
M/ M
V/ F
M/ M
V/ F
M/ M
V/ F
M/ M
V/ F
M+V/ M+F
Blauwgrond 82 81 77 82 60 76 63 74 282 313 595 Rainville 325 444 296 477 262 357 224 342 1,107 1,620 2,727 Centrum 406 594 348 505 314 450 307 456 1,375 2,005 3,380
Beekhuizen 117 156 114 150 99 137 88 129 418 572 990 Weg naar Zee 91 148 75 101 71 82 47 74 284 405 689 Welgelegen 86 104 79 78 58 75 44 63 267 320 587
Flora 395 545 345 479 288 441 299 444 1,327 1,909 3,236 Latour 112 192 96 189 83 148 87 159 378 688 1,066
Livorno 51 72 67 69 36 71 45 53 199 265 464 Totaal/Total Paramaribo 1,665 2,336 1,497 2,130 1,271 1,837 1,204 1,794 5,637 8,097 13,734
District Wanica Kwatta 81 83 59 86 35 62 47 36 222 267 489
Saramacca-polder 131 218 103 146 98 114 109 169 441 647 1,088
Koewarasan 61 95 52 102 38 55 20 67 171 319 490De Nwe Grond 189 315 188 261 135 253 164 224 676 1,053 1,729
Lelydorp 122 138 139 146 83 123 95 137 439 544 983 Houttuin 30 47 30 41 19 38 31 37 110 163 273 Domburg 19 48 28 53 23 22 18 35 88 158 246
Totaal/Total Wanica 633 944 599 835 431 667 484 705 2,147 3,151 5,298
District Nickerie Wageningen 15 19 7 25 18 18 21 30 61 92 153 Groot Henar 28 21 29 25 29 19 26 23 112 88 200 West.Polders 38 34 44 45 28 36 20 25 130 140 270 Oost. Polders 26 40 48 35 34 35 33 40 141 150 291 Nw. Nickerie 134 128 96 139 88 127 88 129 406 523 929
Total Nickerie 241 242 224 269 197 235 188 247 850 993 1,843
District Coronie Totness 10 35 16 12 7 19 19 30 52 96 148
Totaal/Total Coronie 10 35 16 12 7 19 19 30 52 96 148 Bron : Ministerie van Onderwijs, Wetenschap en Cultuur, afdeling Onderzoek en Planning Source : Ministry of Education, Science and Culture, Section of Research and Planning

156
Tabel 9.5e: Aantal MULO leerlingen naar geslacht, klas en ressort per district in het schooljaar 2014 / 2015 (2)
Table 9.5e: Number of pupils of MULO by Sex , Class and Ressort per District
in the School Year 2014 / 2015 (2) District Saramacca
Ressort/Ressort Klasse/Class 1 Klasse/Class 2 Klasse/Class 3 Klasse/Class 4 Totaal/Total M/
M V/ F
M/ M
V/ F
M/ M
V/ F
M/ M
V/ F
M/ M
V/ F
M+V/ M+F
Tijgerkreek 12 5 26 36 19 38 34 48 91 127 218 Groningen 38 35 37 51 35 46 44 51 154 183 337
Jarikaba 34 38 32 42 18 47 21 30 105 157 262 Totaal/Total Saramacca 84 78 95 129 72 131 99 129 350 467 817
District Commewijne Alkmaar 100 113 85 110 60 87 65 109 310 419 729 Meerzorg 130 154 109 132 72 98 96 124 407 508 915
Totaal/Total Commewijne 230 267 194 242 132 185 161 233 717 927 1,644
District Marowijne Moengo 58 99 48 72 34 57 33 64 173 292 465 Albina 14 18 30 39 16 17 6 16 66 90 156
Totaal/Total Marowijne 72 117 78 111 50 74 39 80 239 382 621
District Para Para - Oost 60 91 42 68 39 52 46 81 187 292 479 Para - Zuid 83 107 69 122 58 91 50 117 260 437 697
Totaal/Total Para 143 198 111 190 97 143 96 198 447 729 1,176
District Brokopondo Centrum 36 82 27 59 29 37 38 65 130 243 373
Totaal/Total Brokopondo 36 82 27 59 29 37 38 65 130 243 373
District Sipaliwini Kabalebo 11 27 16 18 15 19 20 15 62 79 141
Boven Suriname 37 47 17 27 3 8 - 6 57 88 145 Totaal/Total
Sipaliwini 48 74 33 45 18 27 20 21 119 167 286 Generaal Totaal/
General Total 3,162 4,373 2,874 4,022 2,304 3,355 2,348 3,502 10,688 15,252 25,940 Bron : Ministerie van Onderwijs, Wetenschap en Cultuur, afdeling Onderzoek en Planning Source : Ministry of Education, Science and Culture, Section of Research and Planning

157
Tabel 9.5f: Aantal MULO leerlingen naar geslacht, klas en ressort per district in het schooljaar 2015 / 2016 (1)
Table 9.5f: Number of pupils of MULO by Sex , Class and Ressort per District
in the School Year 2015 / 2016 (1)
District Paramaribo Ressort/Ressort Klasse/Class 1 Klasse/Class 2 Klasse/Class 3 Klasse/Class 4 Totaal/Total
M/ M
V/ F
M/ M
V/ F
M/ M
V/ F
M/ M
V/ F
M/ M
V/ F
M+V/ M+F
Blauwgrond 93 88 75 76 55 69 61 72 284 305 589 Rainville 295 451 275 423 263 356 227 355 1,060 1,585 2,645 Centrum 432 574 360 550 288 395 270 431 1,350 1,950 3,300
Beekhuizen 112 161 89 147 93 125 101 138 395 571 966 Weg naar Zee 126 121 67 134 57 82 59 68 309 405 714 Welgelegen 89 85 88 103 60 75 56 67 293 330 623
Flora 152 152 120 166 86 158 86 148 444 624 1,068 Latour 104 179 108 187 74 171 125 197 411 734 1,145
Livorno 87 106 102 124 71 91 47 84 307 405 712 Totaal/Total Paramaribo 1,490 1,917 1,284 1,910 1,047 1,522 1,032 1,560 4,853 6,909 11,762
District Wanica Kwatta 76 98 71 88 37 58 31 51 215 295 510
Saramacca-polder 54 65 68 101 57 57 52 76 231 299 530
Koewarasan 57 67 53 82 35 47 32 47 177 243 420De Nwe Grond 352 426 220 377 179 286 180 279 931 1,368 2,299
Lelydorp 154 165 120 143 102 130 87 143 463 581 1,044 Houttuin 36 51 32 45 21 36 19 36 108 168 276 Domburg 45 51 22 42 25 34 10 27 102 154 256
Totaal/Total Wanica 774 923 586 878 456 648 411 659 2,227 3,108 5,335
District Nickerie Wageningen 21 26 11 18 7 21 19 24 58 89 147 Groot Henar 27 18 27 25 18 16 36 16 108 75 183
West. Polders 34 42 46 35 30 42 31 36 141 155 296 Oost. Polders 30 45 33 46 37 25 34 37 134 153 287 Nw. Nickerie 117 140 98 122 65 127 83 104 363 493 856
Total Nickerie 229 271 215 246 157 231 203 217 804 965 1,769
District Coronie Totness 10 16 9 24 20 15 9 22 48 77 125
Totaal/Total Coronie 10 16 9 24 20 15 9 22 48 77 125 Bron : Ministerie van Onderwijs, Wetenschap en Cultuur, afdeling Onderzoek en Planning Source : Ministry of Education, Science and Culture, Section of Research and Planning

158
Tabel 9.5f: Aantal MULO leerlingen naar geslacht, klas en ressort per district in het schooljaar 2015 / 2016 (2)
Table 9.5f: Number of pupils of MULO by Sex , Class and Ressort per District
in the School Year 2015 / 2016 (2)
District Saramacca Ressort/Ressort Klasse/Class 1 Klasse/Class 2 Klasse/Class 3 Klasse/Class 4 Totaal/Total
M/ M
V/ F
M/ M
V/ F
M/ M
V/ F
M/ M
V/ F
M/ M
V/ F
M+V/ M+F
Tijgerkreek 4 1 38 32 24 36 29 47 95 116 211 Groningen 38 56 34 37 38 61 37 56 147 210 357
Jarikaba 37 47 29 39 21 33 22 49 109 168 277 Totaal/Total Saramacca 79 104 101 108 83 130 88 152 351 494 845
District Commewijne Alkmaar 106 131 93 109 66 89 62 94 327 423 750Meerzorg 131 161 111 140 93 132 84 119 419 552 971
Totaal/Total Commewijne 237 292 204 249 159 221 146 213 746 975 1,721
District Marowijne Moengo 88 119 69 125 44 65 63 136 264 445 709 Albina 26 35 14 25 24 28 12 14 76 102 178
Totaal/Total Marowijne 114 154 83 150 68 93 75 150 340 547 887
District Para Para - Oost 60 107 41 78 36 55 37 69 174 309 483 Para - Zuid 100 125 70 109 37 106 62 125 269 465 734
Totaal/Total Para 160 232 111 187 73 161 99 194 443 774 1,217
District Brokopondo Centrum 50 82 31 68 30 60 25 49 136 259 395
Totaal/Total Brokopondo 50 82 31 68 30 60 25 49 136 259 395
District Sipaliwini Kabalebo 13 34 14 22 17 16 22 18 66 90 156
Boven Suriname 32 27 20 26 12 13 2 8 66 74 140 Totaal/Total
Sipaliwini 45 61 34 48 29 29 24 26 132 164 296 Generaal Totaal/
General Total 3,188 4,052 2,658 3,868 2,122 3,110 2,112 3,242 10,080 14,272 24,352 Bron : Ministerie van Onderwijs, Wetenschap en Cultuur, afdeling Onderzoek en Planning Source : Ministry of Education, Science and Culture, Section of Research and Planning

159
Tabel 9.6: Geslaagden/afgewezenen, en het slagingspercentage voor het eindexamen M.U.L.O., schooljaren 2006/2007 - 2015/2016
Table 9.6: Results and the Pass Percentage of M.U.L.O. Completers’ Examination,
School Years 2006/2007 - 2015/2016
Aantal leerlingen/ Number of Pupils
Jaar/ Geslaagd/ Afgewezen/ Totaal/ Slagingspercentage/
Year Passed Failed Total Pass-%
2006/2007 2,736 2,460 5,196 52.7
2007/2008 2,717 2,377 5,094 53.3
2008/2009 2,741 2,066 4,807 57.0
2009/2010 2,532 1,737 4,269 59.3
2010/2011 2,429 2,189 4,618 52.6
2011/2012 2,950 1,898 4,848 63.5
2012/2013 2,815 2,200 5,015 56.1
2013/2014 3,251 2,026 5,277 61.6
2014/2015 3,721 2,162 5,883 63.3
2015/2016 3,598 2,066 5,664 63.5
Bron : Ministerie van Onderwijs, Wetenschap en Cultuur, Examenbureau
Source : Ministry of Education, Science and Culture, Examenbureau

160
Tabel 9.7a: VWMKO – Studenten naar geslacht en onderwijstype, Schooljaren 2014/2015 - 2016/2017
Table 9.7a: VWMKO Students by Sex and Type of Education,
School Years 2014/2015 - 2016/2017
Type VWMKO-school/ 2014/2015 2015/2016 2016/2017 Type of VWMKO-school M/M V/F Total M/M V/F Total M/M V/F Total
Totaal / Total V.W.O.: 1,641 2,579 4,220 1,746 2,775 4,521 1,589 2,359 4,546
-A.M.S 199 355 554 213 414 627 176 341 517 -LYCEUM I 438 734 1,172 403 644 1,047 402 582 984 -LYCEUM II 385 526 911 304 482 786 323 474 797 -V.W.O. 4 161 256 417 187 249 436 168 223 391 -V.W.O - S.G. Nickerie (S.G.N.) 121 195 316 212 305 517 167 231 398 -VRIJE ATHENEUM 185 216 401 190 225 415 197 155 352-VWO. - S.G.Tamanredjo (S.G.T.) 39 70 109 57 108 165 51 131 182 -V.W.O. - H.N.H.S. 113 227 340 99 218 317 105 222 327 -V.W.O. - S.G. Kwatta (S.G.K.) 81 130 211 . . 295 1) -V.W.O. - S.G. Sanatan Dharm (S.G.S) . . 219 1) -V.W.O. - Saramacca - Maho (S.G.M.) . . 84 1)
Totaal / Total H.A.V.O.: 1,024 1,530 2,554 960 1,331 2,291 646 1,111 2,125
-H.A.V.O. I 385 585 970 433 530 963 280 473 753 -H.A.V.O.II 170 218 388 118 173 291 . . 219 1) -H.A.V.O.-III 179 280 459 139 246 385 107 192 299 -H.A.V.O.- Nickerie (S.G.N.) 80 116 196 74 97 171 72 132 204 -H.A.V.O.- TAMANREDJO 55 84 139 73 100 173 62 106 168 -H.A.V.O. - H.N.H.S. 155 247 402 123 185 308 125 208 333 -H.A.V.O. - Kwatta 32 43 75 . . 149 1)
Totaal / Total M.B.O.: 2,550 2,653 5,203 2,311 2,253 4,564 2,266 1,983 5,782
-N.A.T.I.N. - Paramaribo 1,390 771 2,161 1,376 793 2,169 1,432 804 2,236 -N.A.T.I.N. - Nickerie 52 20 72 58 31 89 59 37 96 -N.A.T.I.N.- Lelydorp 291 66 357 252 72 324 248 76 324 -I.M.E.A.O.-1 280 575 855 . . . . . 1,005 1)
-I.M.E.A.O.-2 168 450 618 158 450 608 . . . -I.M.E.A.O.-3 167 400 567 205 488 693 254 620 874 -I.M.E.A.O.-4 91 200 291 70 156 226 161 288 449 -I.M.E.A.O.-5 . . 245 1) -I.M.E.A.O.-Nickerie 57 76 133 84 111 195 112 158 270 -I.M.E.A.O.- Tamanredjo 54 95 149 108 152 260 . . 283 1)
Totaal / Total Leerkrachten Opleiding (Teacher Training Colleges) 133 2,252 2,385 121 2,095 2,216 86 1,736 2,166
A.C.I. 13 591 604 19 564 583 23 528 551 C.P.I. (Kweek A+B) 19 482 501 13 399 412 . . 344 1) S.P.I. (Kweek A+B) 80 946 1,026 72 943 1,015 51 1,059 1,110 Kweek -Nickerie (S.G.N.) 21 233 254 17 189 206 12 149 161 Totaal / Total 5,348 9,014 14,362 5,138 8,454 13,592 4,587 7,189 14,619
Bron : De desbetreffende VWMKO - scholen; 1) Deze totalen zijn afkomstig van Inspektie Voortgezet Onderwijs op Seniorenniveau Source : The VWMKO - Schools in Question; 1) These totals are from Inspection of Senior Secondary Level Education

161
Tabel 9.7b: VWMKO - Afgestudeerde Studenten naar geslacht per onderwijstype, schooljaren 2014/2015 - 2015/2016
Table 9.7b : VWMKO- Graduates by Sex and Type of Education,
School Years 2014/2015 - 2015/2016
Type VWMKO-school/ 2014/2015 2015/2016 Type of VWMKO-school M/M V/F Total M/M V/F Total
Totaal / Total V.W.O.: 301 490 791 282 592 954
-A.M.S 36 59 95 27 82 109 -LYCEUM I 89 157 246 94 164 258 -LYCEUM II 73 121 194 72 133 205 -V.W.O. 4 19 34 53 27 56 83 V.W.O. - S.G. Nickerie (S.G.N.) 23 42 65 27 46 73 -VRIJE ATHENEUM 31 27 58 19 47 66 -VWO. - S.G.Tamanredjo (S.G.T.) 4 6 10 . . 30 1) -V.W.O. - H.N.H.S. 26 44 70 16 57 73 -V.W.O. - S.G. Kwatta (S.G.K.) - 7 7 -V.W.O. - S.G. Sanatan Dharm (S.G.S) . . 50 1)
Totaal / Total H.A.V.O.: 141 352 493 161 269 609
-H.A.V.O. I 38 89 127 83 125 208 -H.A.V.O.II 33 48 81 . . 87 1) -H.A.V.O.-III 32 61 93 26 63 89-H.A.V.O.- Nickerie (S.G.N.) 6 26 32 13 31 44 -H.A.V.O.- Tamanredjo 4 25 29 . . 30 1) -H.A.V.O. - H.N.H.S. 28 103 131 35 48 83-H.A.V.O. - S.G. Kwatta 4 2 6 -H.A.V.O. - S.G. Sanatan Dharm . . 48 1) -H.A.V.O. - S.G. Maho . . 14 1)
Totaal / Total M.B.O.: 230 193 423 353 190 733
-N.A.T.I.N. - Paramaribo 177 89 266 248 76 324 -N.A.T.I.N. - Nickerie 8 2 10 12 7 19 -N.A.T.I.N.- Lelydorp 9 1 10 65 28 93 -I.M.E.A.O.-1 . . . . . 113 1) -I.M.E.A.O.-2 20 55 75 . . 77 1) -I.M.E.A.O.-3 7 21 28 8 37 45 -I.M.E.A.O.-4 3 12 15 15 30 45 -I.M.E.A.O.-(Nickerie) 4 6 10 5 12 17 -I.M.E.A.O.- Tamanredjo 2 7 9 . . .
Totaal / Total Leerkrachten Opleiding (Teacher Training Colleges) 5 242 247 10 202 437
A.C.I. 1 112 113 4 152 156 C.P.I. (Kweek A+B) 2 92 94 . . 80 1) S.P.I. (Kweek A+B) . . . . . 145 1) Kweek -Nickerie (S.G.N.) 2 38 40 6 50 56 Totaal / Total 677 1,277 1,954 806 1,253 2,733
Bron : De desbetreffende VWMKO - scholen; 1) Deze totalen zijn afkomstig van Inspectie Voortgezet Onderwijs op Seniorenniveau Source : The VWMKO - Schools in Question; 1) These totals are from Inspection of Senior Secondary Level Education

162
Tabel 9.8a: Studenten naar geslacht en type tertiair onderwijs, 2013/2014 - 2016/2017
Table 9.8a: Students by Sex and Type of 3rd level Education, 2013/2014 - 2016/2017
2013/2014 2014/2015 Type opleiding/
Type of Education Man/ Male
Vrouw/ Female
Totaal/ Total
Man/ Male
Vrouw/ Female
Totaal/ Total
Adek Univ. 1,213 2,697 3,910 1,100 2,475 3,575
I.O.L. 326 2,067 2,393 347 1,886 2233
P.T.C. 667 282 949 780 361 1,141
L.O.B.O. 243 233 476 315 370 685
A.H.K.C.O. 68 271 339 60 223 283
Totaal/Total 2,517 5,550 8,067 2,602 5,315 7,917
2015/2016 2016/2017 Type opleiding/
Type of Education Man/ Male
Vrouw/ Female
Totaal/ Total
Man/ Male
Vrouw/ Female
Totaal/ Total
Adek Univ. 1,227 2,462 3,689 1,344 2,838 4,182
I.O.L. 392 2,024 2,416 274 1,592 1,866
P.T.C. 860 411 1,271 933 485 1,418
L.O.B.O. 176 282 458 136 323 459
A.H.K.C.O. 50 245 295 49 264 313
Totaal/Total 2,705 5,424 8,129 2,736 5,502 8,238
Bron : Ministerie van Onderwijs, Wetenschap en Cultuur, de betreffende instellingen en voor AdeK Univ., Bureau Studentenzaken. Source : Ministry of Education, Science and Culture, the Institutions in question and for AdeK Univ., Bureau for Student Affairs.
Tabel 9.8b: Afgestudeerde Studenten naar geslacht en type tertiair onderwijs, 2013/2014 - 2015/2016
Table 9.8b: Graduates by Sex and Type of 3rd Level Education, 2013/2014 - 2015/2016
Type opleiding / 2013/2014 2014/2015 2015/2016 Type of Education M/
M V/ F
Totaal/ Total
M/ M
V/ F
Totaal/ Total
M/ M
V/ F
Totaal/ Total
Adek Univ. 175 381 556 136 390 526 120 336 456 I.O.L. 54 278 332 81 451 532 17 119 136 P.T.C 39 18 57 32 27 59 29 14 43
L.O.B.O. 17 3 20 5 16 21 6 13 19 A.H.K.C.O. # 7 #20 27 # 3 # 11 14 - 4 4
Totaal/Total 292 700 992 257 895 1,152 172 486
658
Bron : Ministerie van Onderwijs, Wetenschap en Cultuur, de betreffende instellingen en voor AdeK Univ., Bureau Studentenzaken. Source : Ministry of Education, Science and Culture, the Institutions in question and for AdeK Univ., Bureau for Student Affairs.

163
Grafiek 9.2: Studenten naar geslacht en type tertiair onderwijs, 2014/2015 - 2016/2017
Graph 9.2: Students by Sex and Type of 3rd Level Education,
2014/2015 - 2016/2017
0
500
1,000
1,500
2,000
2,500
3,000
Man/ Male Vrouw / Female
Man/ Male Vrouw / Female
Man/ Male Vrouw / Female
2014/2015 2015/2016 2016/2017
Adek Univ.
I.O.L.
P.T.C.
L.O.B.O.
A.H.K.C.O.

164
Tabel 9.9a : Aantal ingeschreven studenten aan de Anton de Kom Universiteit van Suriname naar faculteit, studierichting en geslacht, 2015/2016 en 2016/2017
Table 9.9a : Enrolled Students of the Anton de Kom University of Suriname by Faculty, Field of
Study and Sex, 2015/2016 and 2016/2017
Faculteit der Technologische Wetenschappen / Faculty of Technical Sciences
Studierichting/ 2015/2016 2016/2017 Field of Study
M/M V/F Totaal/ Total M/M V/F
Totaal/ Total
Delfstof Productie/ Mineral Production 86 150 236 60 104 164 Electrotechniek/ Electrical Engineering 103 40 143 100 52 152 Infrastructuur/ Infrastructure 111 122 233 86 121 207 Milieuwetenschappen/ Environmental Sciences
28 97 125 22 86 108
Werktuigbouwkunde/ Mechanical Engineering
96 35 131 81 31 112
Agrarische Productie/ Agricultural Production
23 80 103 26 94 120
Master Petroleum Geologie/Master in Petroleum Geology
8 3 11 12 18 30
Master Mineral Geosciences/ Master in Geo Sciences
11 22 33 10 15 25
Master Sustainable Management of Natural Resources
22 33 55 28 40 68
Totaal Faculteit der Technologische Wetenschappen/ Total Faculty of Technical Sciences 488 582 1070 425 561 986
Faculteit der Maatschappij Wetenschappen / Faculty of Social Sciences
Economie / Economics 150 322 472 163 338 501 Rechten / Law 190 399 589 188 424 612 Public Administration / Public Administration
80 193 273 72 189 261
Psychologie/ Psychology 19 76 95 20 77 97 Sociologie / Sociology 14 55 69 14 46 60 Agogische Wetenschappen & Onderwijskunde/ Agogic Sciences and Educational Learning
11 168 179 15 151 166
Bedrijfskunde/ Business Learning 27 89 116 24 88 112 Master Surinaams Recht / Master in Law 27 108 135 28 108 136 Master AAC/ Master Accounting, Auditing and Control
1 5 6 - - -
MERSD / Master in Education and Research for Sustainable Development
26 96 122 33 90 123
Totaal Faculteit der Maatschappij Wetenschappen / Total Faculty of Social Sciences 545 1,511 2056 557 1,511 2,068 Bron : Anton de Kom Universiteit van Suriname, Bureau Studentenzaken Source : Anton de Kom University of Suriname, Bureau for Student Affairs
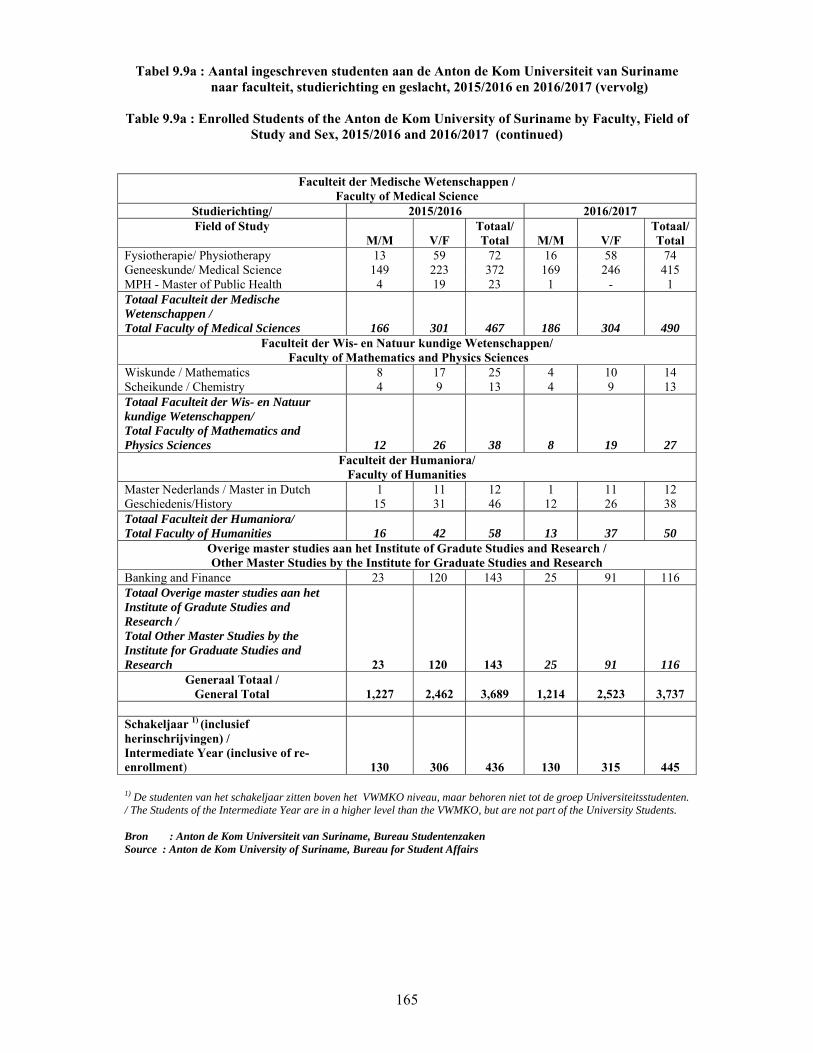
165
Tabel 9.9a : Aantal ingeschreven studenten aan de Anton de Kom Universiteit van Suriname naar faculteit, studierichting en geslacht, 2015/2016 en 2016/2017 (vervolg)
Table 9.9a : Enrolled Students of the Anton de Kom University of Suriname by Faculty, Field of
Study and Sex, 2015/2016 and 2016/2017 (continued)
Faculteit der Medische Wetenschappen / Faculty of Medical Science
Studierichting/ 2015/2016 2016/2017 Field of Study
M/M V/F Totaal/ Total M/M V/F
Totaal/ Total
Fysiotherapie/ Physiotherapy 13 59 72 16 58 74 Geneeskunde/ Medical Science 149 223 372 169 246 415 MPH - Master of Public Health 4 19 23 1 - 1Totaal Faculteit der Medische Wetenschappen / Total Faculty of Medical Sciences 166 301 467 186 304 490
Faculteit der Wis- en Natuur kundige Wetenschappen/ Faculty of Mathematics and Physics Sciences
Wiskunde / Mathematics 8 17 25 4 10 14 Scheikunde / Chemistry 4 9 13 4 9 13 Totaal Faculteit der Wis- en Natuur kundige Wetenschappen/ Total Faculty of Mathematics and Physics Sciences 12 26 38 8 19 27
Faculteit der Humaniora/ Faculty of Humanities
Master Nederlands / Master in Dutch 1 11 12 1 11 12 Geschiedenis/History 15 31 46 12 26 38 Totaal Faculteit der Humaniora/ Total Faculty of Humanities 16 42 58 13 37 50
Overige master studies aan het Institute of Gradute Studies and Research / Other Master Studies by the Institute for Graduate Studies and Research
Banking and Finance 23 120 143 25 91 116 Totaal Overige master studies aan het Institute of Gradute Studies and Research / Total Other Master Studies by the Institute for Graduate Studies and Research 23 120 143 25 91 116
Generaal Totaal / General Total 1,227 2,462 3,689 1,214 2,523 3,737
Schakeljaar 1) (inclusief herinschrijvingen) / Intermediate Year (inclusive of re- enrollment) 130 306 436 130 315 445 1) De studenten van het schakeljaar zitten boven het VWMKO niveau, maar behoren niet tot de groep Universiteitsstudenten. / The Students of the Intermediate Year are in a higher level than the VWMKO, but are not part of the University Students. Bron : Anton de Kom Universiteit van Suriname, Bureau Studentenzaken Source : Anton de Kom University of Suriname, Bureau for Student Affairs

166
Tabel 9.9b: Aantal afgestudeerde studenten aan de Anton de Kom Universiteit van Suriname naar faculteit , studierichting en geslacht, 2014/2015 en 2015/2016
Table 9.9b: Number of Graduates of the Anton de Kom University of Suriname by Faculty,
Field of Study and Sex, 2014/2015 and 2015/2016
Faculteit der Technologische Wetenschappen / Faculty of Technical Sciences
Studierichting/ 2014/2015 2015/2016 Field of Study
M/M V/F Totaal/ Total M/M V/F
Totaal/ Total
Delfstof Productie/ Mineral Production 5 14 19 7 26 33 Electrotechniek/ Electrical Engineering 4 9 13 9 5 14 Infrastructuur/ Infrastructure 7 13 20 25 16 41 Milieuwetenschappen/ Environmental Sciences - 12 12 3 20 23 Werktuigbouwkunde/ Mechanical Engineering 6 8 14 11 5 16 Agrarische Productie/ Agricultural Production 2 11 13 2 13 15 Master Petroleum Geologie/ Master in Petroleum Geology
- 2 2 2 2 4
Master Mineral Geosciences/ Master in Geo Sciences - 1 1 3 4 7 Master Sustainable Management of Natural Resources 1 1 2 2 7 9 Totaal Faculteit der Technologische Wetenschappen/ Total Faculty of Technical Sciences 25 71 96 64 98 162
Faculteit der Maatschappij Wetenschappen / Faculty of Social Sciences
Economie / Economics 13 60 73 17 64 81 Rechten / Law 20 68 88 15 48 63 Public Administration / Public Administration 12 79 91 7 28 35 Psychologie/ Psychology 2 8 10 1 14 15 Sociologie / Sociology 1 5 6 1 7 8 Agogische Wetenschappen & Onderwijskunde/ Agogic Sciences and Educational Learning
5 38 43 - 11 11
Bedrijfskunde/ Business Learning 7 18 25 4 29 33 Master Surinaams Recht / Master in Law 8 19 27 6 19 25 Master AAC / Master Accounting, Auditing and Control
3 6 9 1 5 6
MERSD/ Master in Education and Research for Sustainable Development
6 14 20 2 9 11
Totaal Faculteit der Maatschappij Wetenschappen / Total Faculty of Social Sciences 77 315 392 54 234 288
Faculteit der Medische Wetenschappen / Faculty of Medical Science
Fysiotherapie/ Physiotherapy - 4 4 - 1 1 Geneeskunde/ Medical Science 34 - 34 2 3 5MPH /Master of Public Health - - Totaal Faculteit der Medische Wetenschappen / Total Faculty of Medical Sciences 34 4 38 2 4 6
Generaal Totaal / General Total 136 390 526 120 336 456
Bron : Anton de Kom Universiteit van Suriname, Bureau Studentenzaken Source : Anton de Kom University of Suriname, Bureau for Student Affairs

167
Tabel 9.10a: Aantal ingeschreven studenten op het IOL, naar studierichting en geslacht, 2014/2015 - 2016/2017
Table 9.10a: Enrolled Students of the IOL, by Field of Study and Sex, 2014/2015 - 2016/2017
Studierichting/ 2014/2015 2015/2016 2016/2017 Field of Study
M/M V/F Totaal/ Total M/M V/F
Totaal/ Total M/M V/F
Totaal/ Total
Aardrijkskunde /Geography 26 106 132 24 109 133 19 89 108 Beeldende Vorming / Drawing,Textile, Handcraft + Sculpture 14 30 44 16 39 55 13 44 57
Biologie / Biology 25 114 139 35 134 169 33 107 140
Economie / Economics 42 310 352 24 204 228 25 208 233
Engels / English 27 111 138 27 123 150 11 126 137
Geschiedenis / History 19 127 146 28 149 177 22 122 144
Kleuter Pedagogiek / Kindergarten Teaching - 16 16 - - - - - -
Lichamelijke Opvoeding / Physical Education 68 50 118 59 38 97 53 31 84
Muziek / Music 7 9 16 2 7 9 - 3 3
Natuurkunde / Physics 39 42 81 55 41 96 32 33 65
Nederlands / Dutch 2 130 132 5 188 193 2 133 135
Pedagogiek / Pedagogy 14 285 299 46 451 497 11 159 170
Scheikunde / Chemistry 10 57 67 8 64 72 6 42 48
Spaans / Spanish 9 85 94 9 95 104 2 80 82
Wiskunde/Mathematics 40 268 308 45 305 350 33 274 307
Gezondheidsleer / Health Education 2 18 20 9 57 66 2 14 16
Logopedie / Speech Therapy - 21 21 - 20 20 - 9 9
Remedial Teaching - 25 25 - - - 2 2 4 Kantoor en Verkooppraktijk/ Office and Sales practice 3 82 85 - - - 8 116 124 Totaal / Total 347 1,886 2,233 392 2,024 2,416 274 1,592 1,866
Bron : Instituut voor de Opleiding van Leraren Source : Institute for Advanced Teacher Training

168
Tabel 9.10b: Aantal afgestudeerde studenten van de IOL, naar studierichting en geslacht, 2014/2015 en 2015/2016
Table 9.10b: Graduates of the IOL, by Field of Study and Sex,
2014/2015 and 2015/2016
Studierichting/ 2014/2015 2015/2016 Field of Study
M/M V/F Totaal/ Total M/M V/F
Totaal/ Total
Aardrijkskunde /Geography 3 32 35 2 7 9 Beeldende Vorming / Drawing,Textile, Handcraft + Sculpture 1 6 7 - 2 2
Biologie / Biology 5 27 32 1 8 9
Economie / Economics 10 68 78 2 23 25
Engels / English 3 30 33 2 4 6
Geschiedenis / History 3 5 8 - 11 11
Kleuter Pedagogiek / Kindergarten Teaching - - - - - -
Lichamelijke Opvoeding / Physical Education 3 4 7 - - -
Muziek / Music 4 4 8 - - -
Natuurkunde / Physics 3 6 9 2 1 3
Nederlands / Dutch - 25 25 - 6 6
Pedagogiek / Pedagogy # 31 #136 167 2 21 23
Scheikunde / Chemistry 7 11 18 1 7 8
Spaans / Spanish - 10 10 - 7 7
Wiskunde/Mathematics 7 80 87 5 20 25
Gezondheidsleer / Health Education 1 1 2 - 1 1
Logopedie / Speech Therapy - 2 2 - 1 1
Remedial Teaching - 4 4 - - - Kantoor en Verkooppraktijk/ Office and sales practice - - - - - - Totaal / Total 81 451 532 17 119 136 Bron : Instituut voor de Opleiding van Leraren Source : Institute for Advanced Teacher Training

169
Tabel 9.11a: Aantal ingeschreven studenten op het AHKCO, naar studierichting en geslacht, 2014/2015 - 2016/2017
Table 9.11a: Enrolled Students of the AHKCO, by Field of Study and Sex,
2014/2015 - 2016/2017
Studierichting/ 2014/2015 2015/2016 2016/2017 Field of Study
M/M V/F Totaal/ Total
M/M V/F
Totaal/ Total M/M V/F
Totaal/ Total
Journalistiek / Journalism 27 68 95 22 70 92 17 82 99 Sociaal Cultureel Vormingswerk/ Social Works 18 124 142 18 144 162 21 147 168 Beeldende Kunsten / Visual Arts 15 31 46 10 31 41 11 35 46 Totaal/Total 60 223 283 50 245 295 49 264 313
Bron : Academie voor Hoger Kunst en Cultuur Onderwijs Source : Academy of Arts
Tabel 9.11b: Aantal afgestudeerde studenten van het AHKCO, naar studierichting en geslacht,
2014/2015 - 2016/2017
Table 9.11b: Graduates of the AHKCO, by Field of Study and Sex, 2014/2015 - 2016/2017
Studierichting/ # 2013/2014 # 2014/2015 2015/2016 Field of Study
M/M V/F Totaal/ Total M/M V/F
Totaal/ Total M/M V/F
Totaal/ Total
Journalistiek / Journalism 4 3 7 2 3 5 - 1 1 Sociaal Cultureel Vormingswerk/ Social Works 3 14 17 - 7 7 - 3 3 Beeldende Kunsten / Visual Arts - 3 3 1 1 2 - - - Totaal/Total 7 20 27 3 11 14 - 4 4
Bron : Academie voor Hoger Kunst en Cultuur Onderwijs Source : Academy of Arts

170
Tabel 9.12a: Aantal ingeschreven studenten op het PTC, naar studierichting en geslacht, 2014/2015 - 2016/2017
Table 9.12a: Enrolled Students of the PTC, by Field of Study and Sex,
2014/2015 - 2016/2017
Studierichting/ 2014/2015 2015/2016 2016/2017 Field of Study
M/M V/F Totaal/ Total M/M V/F
Totaal/ Total M/M V/F
Totaal/ Total
Infrastruktuur / Infrastructure 152 62 214 160 85 245 177 103 280 Werktuigbouwkunde/ Mechanical Engineering 192 28 220 196 30 226 233 33 266 Elektrotechniek / Electrical Engineering 186 23 209 181 29 210 181 33 214 Hoger Laboratorium Onderwijs/ Advanced Laboratory Course 35 143 178 38 142 180 33 170 203 Informatie en Communicatie Technologie / Information and Communication Technology 147 58 205 198 60 258 233 86 319 Internationaal Ondernemerschap in de agroketen / International Agri Business 27 22 49 33 27 60 30 27 57 Pre-Internationaal Ondernemerschap in de agroketen / Pre-International Agri Business 5 - 5 Agronomy 8 1 9 9 7 16 10 6 16 Luchtverkeersdiensten / Airtraffic Services 17 19 36 21 14 35 8 1 9 Master in Business Administration 11 5 16 20 10 30 9 6 15 Voedingsmiddeltechnologie / Food Technology 4 7 11 6 13 19 Meteorologie en Hydologie/ Meteorology and Hydrology 13 7 20 Totaal / Total 780 361 1,141 860 411 1,271 933 485 1,418
Bron : Poly Technisch College Source : Poly Technical College

171
Tabel 9.12b: Aantal afgestudeerde studenten van de PTC, naar studierichting en geslacht, 2014/2015 en 2015/2016
Table 9.12b: Graduates of the PTC, by Field of Study and Sex,
2014/2015 and 2015/2016
Studierichting/ 2014/2015 2015/2016 Field of Study
M/M V/F
Totaal/
Total M/M V/F
Totaal/
Total Agronomy - - - - - - Internationaal Ondernemerschap in de agroketen / International Agri Business 1 - 1 1 - 1 Elektrotechniek / Electrical Engineering 8 2 10 3 - 3 Informatie en Communicatie Technologie / Information and Communication Technology 1 3 4 2 1 3 Hoger Laboratorium Onderwijs/ Advanced Laboratory Course 3 15 18 4 9 13 Infrastruktuur/ Infrastructure 11 6 17 8 3 11 Werktuigbouwkunde/ Mechanical Engineering 8 1 9 11 1 12 Totaal / Total 32 27 59 29 14 43
Bron : Poly Technisch College Source : Poly Technical College

172
Tabel 9.13a: Aantal ingeschreven studenten op de LOBO, naar studierichting en geslacht, 2014/2015 - 2016/2017
Table 9.13a: Enrolled Students of the LOBO, by Field of Study and Sex,
2014/2015 - 2016/2017
Studierichting/ 2014/2015 2015/2016 2016/2017 Field of Study M/
M V/ F
Totaal/ Total
M/ M
V/ F
Totaal/ Total
M/ M
V/ F
Totaal/ Total
Bouwkunde / Architecture 51 34 85 34 15 49 24 20 44 Elektrotechniek / Electrical Engineering 97 13 110 40 6 46 46 12 58 Werktuigbouwkunde / Mechanical Engineering 110 22 132 75 15 90 38 11 49 Wiskunde, mechanica en natuurkunde / Mathematics, Mechanics and Physics 49 40 89 13 19 32 15 27 42 Facilitaire dienstverlening / Facilitary Services 3 69 72 4 43 47 6 66 72 Horeca / Horeca 4 107 111 5 92 97 6 109 115 Mode en Creatie / Fashion and Creation 1 85 86 5 92 97 1 78 79 Totaal / Total 315 370 685 176 282 458 136 323 459
Bron :Leraren Opleiding voor Beroepsgericht Onderwijs Source :Training College for Teachers of Vocational Schools
Tabel 9.13b : Aantal afgestudeerde studenten van de LOBO, naar studierichting en geslacht, 2014/2015 - 2015/2016
Table 9.13b: Graduates of the LOBO, by Field of Study and Sex,
2014/2015 - 2015/2016
Studierichting/ 2014/2015 2015/2016 Field of Study M/
M V/ F
Totaal/ Total
M/ M
V/ F
Totaal/ Total
Bouwkunde / Architecture 2 - 2 - - - Elektrotechniek / Electrical Engineering 2 3 5 1 - 1 Werktuigbouwkunde / Mechanical Engineering 1 - 1 3 2 5 Wiskunde, mechanica en natuurkunde / Mathematics, Mechanics and Physics - - - 1 2 3 Facilitaire dienstverlening / Facilitary Services - 2 2 - 5 5 Horeca / Horeca - 9 9 1 2 3 Mode en Creatie / Fashion and Creation - 2 2 - 2 2 Totaal / Total 5 16 21 6 13 19 Bron :Leraren Opleiding voor Beroepsgericht Onderwijs Source :Training College for Teachers of Vocational Schools

SO
10. S
VO
OCIA
SOCIALE V10. SOCIA
SOOR
AL B
VOORZIENAL BENEFI
SOCRZIE
BEN
NINGEN ITS
CIALENI
NEF
LE ING
FITS
GEN
S

174
A.O.V. = Algemene Ouderdagsvoorziening / Old-Age Pension Scheme A.K.B. = Algemene Kinderbijslag/ General Child Benefit
‘Rechthebbende’ is de kaarthouder (de aanvrager). Rechthebbende Personen’: is het aantal personen (gezinsleden inclusief de aanvrager die aanspraak maakt op de (kaart) voorziening
The claimants are the holders of the card (the applicant). The persons who may claim: the number of persons (family members) including the applicant who lay claim to the (card) security.
Vanaf 01-03-'91 was de A.O.V. gerechtigde leeftijd 60 jaar en het A.O.V. bedrag Sf. 250,= per maand/ Since 01-03-'91 the Old-age Pension was paid to persons from age 60 and amounted to Sf. 250,= per month. Vanaf / Since 01-04-'05 ---------------------------------------------------------------- SRD. 175,00 per maand / month Vanaf / Since 01-10-'05 ---------------------------------------------------------------- SRD. 225,00 per maand / month Vanaf / Since 01-11-'07 ---------------------------------------------------------------- SRD. 250,00 per maand / month Vanaf / Since 07-05 -'08 --------------------------------------------------------------- SRD. 275,00 per maand / month Vanaf / Since 01-12-'10 ---------------------------------------------------------------- SRD. 350,00 per maand / month Vanaf / Since 01-02-'11 ---------------------------------------------------------------- SRD. 425,00 per maand / month Vanaf / Since 01-01-'12 ---------------------------------------------------------------- SRD. 525,00 per maand / month

175
10. Sociale Voorzieningen Het aantal 60 plussers geregistreerd bij het Ministerie van Sociale Zaken, om in aanmerking te komen voor Algemene Oudedags Voorziening, bedroeg 49,840 in het jaar 2013. Vanaf het jaar 2013 tot en met 2016 is dit cijfer gestadig gestegen naar 55,254. Het aantal kinderen dat via het ministerie van Sociale Zaken in aanmerking komt voor kinderbijslag is vanaf 2013 (77,973) toegenomen tot 88,867 in 2016. Voor wat betreft Vrije Geneeskundige Voorziening, werd in 2011 opnieuw een registratie gehouden door het ministerie van Sociale Zaken en Volkshuisvesting. Hierdoor kreeg men een opgeschoond bestand, waar de aantallen vanaf 2012 lager zijn komen te liggen tot en met 2014. De gegevens van 2015 betreffen cijfers tot 3 september 2015; de uitgifte van deze kaarten op Vrije Geneeskundige hulp is stopgezet per deze datum. Per kaart in een huishouding, maken meerdere huishoudleden aanspraak op Vrije Geneeskundige voorziening. Bij de personen die Financiële bijstand ontvangen, merken wij een stijging vanaf 2013 (11,638) tot 2015 (15,286). Na een opschoning van het bestand, daalde dit cijfer naar 12,505 in 2016.
10. Social Benefits The number of people over 60 registered at the Ministry of Social Affairs, in order to be eligible for Old Age Pension, amounted to 49.840 in the year 2013. From the year 2013 up to and including 2016, this figure has risen steadily to 55.254. The number of children eligible through the Ministry of Social Affairs for child benefit has increased since 2013 (77,973) to 88.867 in 2016. Regarding Free Medical Supply, a new registration was held in 2011 by the Ministry of Social Affairs and Housing. This resulted in a clean database, showing a lower number of registrants since 2012 up till 2014. The data from 2015 refer to figures till September 3, 2015; the providing of these cards on Free Medical Health Care is ended from this date. For each card in a household, multiple household members are entitled to the use of Free Health Care Benefits. Looking at the Number of Persons who receive Financial Support, we notice also an increase since 2013 (11,638) up to 2015 (15.286). After a clean-up of the database, this figure dropped to 12,505 in 2016.

176
Tabel 10.1: Het jaarlijkse aantal personen dat in aanmerking is gekomen voor A.O.V.- uitkeringen naar district, 2013 – 2016
Table 10.1: Annual Number of Persons with Old Age Pension by District, 2013 - 2016
District / Jaren / Years
District 2013 2014 2015 2016
Paramaribo 25,529 26,324 27,245 28,102 Wanica 8,335 8,806 9,302 9,796 Nickerie 3,719 3,836 3,999 4,104 Coronie 344 348 349 355
Saramacca 1,511 1,539 1,569 1,641 Commewijne 2,570 2,635 2,735 2,851 Marowijne 1,814 1,869 1,953 1,995
Para 1,766 1,851 1,950 2,018 Brokopondo 752 756 785 785
Sipaliwini 3,500 3,570 3,589 3,607 Totaal /Total 49,840 51,534 53,476 55,254
Opmerking / Remark: Cijfers per december elk jaar / Data per December each year Bron :Ministerie van Sociale Zaken en Volkshuisvesting, afdeling Wetenschappelijk Onderzoek en
Planning Source :Ministry of Social Affairs and Housing, Department of Scientific Research and Planning

Tabel 10
Table 10
DiD
ParaWNiCo
SarComMa
PBrok
Sip
Tota 1) Aantal
Bron :MPlanning Source :M
Graf
Gra
0
5,000
10,000
15,000
20,000
25,000
30,000
35,000
0.2: Het jaa
0.2: Annual
istrict / District
amaribo
Wanica ickerie oronie
ramacca mmewijne arowijne Para kopondo paliwini
aal /Total
l kinderen in de
Ministerie van
Ministry of Soci
fiek 10.1: Ja
aph 10.1: A
0
0
0
0
0
0
0
0
arlijkse aant
l Number of
20131)
25,595 16,064 5,092 190
1,780 3,703 3,322 4,577 3,277
14,373
77,973
tweede helft van
Sociale Zaken
ial Affairs and
aarlijkse aan
Annual NumBe
tal kinderennaar distri
f Children by Distric
2
215
3353
1
8
n het jaar / Numb
n en Volkshuis
d Housing, Dep
ntal kinderenaar distri
mber of Chilenefit by Di
n voor wie dict, 2013 – 2
for whom t
ct, 2013 – 20
Jaren / 20141)
27,859 17,569 5,025 209
1,952 3,972 3,482 5,072 3,505
14,079
82,724
ber of Children i
svesting, afdeli
partment of Sc
en voor wieict, 2014 - 2ldren for whistrict, 2014
de overheid 2016
the Governm016
Years 20151)
30,32219,0084,983220
2,0754,2703,3525,4303,755
13,805
87,220
in the second Ha
ing Wetenscha
cientific Resea
e de overheid016 hom the Go
4 - 2016
A.K.B. hee
ment Paid C
2
31
1
8
alf of The Year
appelijk Onder
arch and Plann
d AKB heef
overnment P
ft uitbetaald
Child Benefi
20161)
31,429 19,702 4,890 202
1,980 4,368 3,287 5,733 3,882
13,394
88,867
rzoek en
ning
ft uitbetaald
Paid Child
2014
2015
2016
d
it
d

178
Tabel 10.3: Aantal rechthebbenden en rechthebbende personen op Vrije geneeskundige hulp per district, 2013 – 2016
Table 10.3: Number of Rightful Claimants and Claiming Persons for Free Health Care
Benefits per District, 2013 – 2016
December 2013/ December 2013 December 2014/ December 2014 District/ District
Rechthebbenden/ Rightful Claimants
Rechthebbende personen/
Rightful Claimants and dependants
Rechthebbenden/ Rightful Claimants
Rechthebbende personen/
Rightful Claimants and dependants
Paramaribo 20,486 24,338 19,979 25,822
Wanica 20,541 43,904 20,701 37,920
Nickerie 7,699 12,708 7,380 10,516
Coronie 179 213 271 329
Saramacca 2,567 3,901 2,513 3,517
Commewijne 5,881 10,420 6,768 11,466
Marowijne 1,749 2,752 2,327 3,900
Para 3,836 5,206 4,321 5,497
Brokopondo 750 926 745 745
Sipaliwini 509 509 315 346
Totaal / Total 64,197 104,877 65,320 100,058
December 2015/ December 2015 December 2016/ December 2016 District / District
Rechthebbenden/ Rightful Claimants
Rechthebbende personen/
Rightful Claimants and dependants
Rechthebbenden/ Rightful Claimants
Rechthebbende personen/
Rightful Claimants and dependants
Paramaribo 7,791 9,280
Wanica 10,415 20,185
Nickerie 2,823 4,236
Coronie 51 55
Saramacca 1,081 1,529
Commewijne 5,247 10,006
Marowijne 1,015 1,226
Para 862 1,040
Brokopondo 102 102
Sipaliwini 78 78
Totaal / Total 29,465 47,737 Opmerking / Remark: De cijfers betreffen on- en minvermogenden die 1 of 2 maal per jaar geregistreerd zijn./ The figures refer to Rightful Claimants to Health Care Benefits who are registered either once or twice a Year. De gegevens van 2015 betreffen cijfers tot 3 september 2015; de uitgifte van deze kaarten op Vrije Geneeskundige hulp is stopgezet per deze datum / The data from 2015 refer to figures till September 3, 2015; the providing of these cards on Free Medical Health Care has ended from this date.
Bron :Ministerie van Sociale Zaken en Volkshuisvesting, afdeling Wetenschappelijk Onderzoek en
Planning Source : Ministry of Social Affairs and Housing, Department of Scientific Research and Planning

179
Tabel 10.4: Het jaarlijkse aantal personen1) dat financiële bijstand heeft ontvangen naar district, 2013 - 2016
Table 10.4: Annual Number of Persons1) that received Financial Support by District,
2013 - 2016
District / Jaren / Years District 2013 2014 2015 2016
Paramaribo 4,943 5,912 6,154 5,309
Wanica 2,877 3,570 3,959 3,697 Nickerie 711 733 519 537 Coronie 83 81 75 72
Saramacca 307 384 405 379 Commewijne 966 2,467 2,426 943 Marowijne 862 1,014 765 624
Para 889 1,141 983 944
Totaal /Total 11,638 15,302 15,286 12,505
1) Aantal personen per december elk jaar/ Number of Persons per December each Year Opmerkingen / Remarks: Brokopondo & Sipaliwini: . - Per gezin kan maar één persoon voor financiele bijstand in aanmerking komen./ In a family only one person is entitled to financial support./ - Per huishouden kunnen echter meerdere personen in aanmerking komen voor financiële bijstand./ However, several persons per household may be entitled. Bron :Ministerie van Sociale Zaken en Volkshuisvesting, afdeling Wetenschappelijk Onderzoek en
Planning Source :Ministry of Social Affairs and Housing, Department of Scientific Research and Planning

Grafiek
Graph
1,0
2,0
3,0
4,0
5,0
6,0
7,0
k 10.2: Jaar
h 10.2: Annu
0
000
000
000
000
000
000
000
rlijkse aanta
ual Number
al personendistrict,
r of Persons201
n dat financi 2014 – 201
s that receiv4 – 2016
iële bijstand6
ved Financia
d heeft ontv
al Support b
vangen naar
by District,
201420152016
r

181
VOLKSGEZONDHEID
PUBLIC HEALTH

182
H.I.V = Human Immune deficiency Virus H.I.V. = Human Immune deficiency Virus
SOA AIDS
= Sexueel Overdraagbare Aandoening =Acquired Immune Deficiency Syndrome
STD AIDS
= Sexually Transmitted Disease = Acquired Immune Deficiency Syndrome
AZP
= Academisch Ziekenhuis Paramaribo
AZP
= Academisch Ziekenhuis Paramaribo
DH = Diakonessenhuis DH = Diakonessenhuis LH = 's Lands Hospitaal LH = 's Lands Hospitaal SVZ = St. Vincentius Ziekenhuis SVZ = St. Vincentius Ziekenhuis SZN = Streek Ziekenhuis Nickerie SZN = Streek Ziekenhuis Nickerie PCS = Psychiatrisch Centrum Suriname PCS = Psychiatric Centre Suriname RGD = Regionale Gezondheidsdienst RGD = Regional Health Service DD = Dermatologische Dienst DD = Dermatology Service MVG/ BOG
= Ministerie van Volksgezondheid/ Bureau voor Openbare Gezondheidszorg
MVG/ BOG
= Ministry of Health / Bureau of Public Health
MWI/ ADEK
= Medisch Wetenschappelijk Instituut/ Anton de Kom Universiteit
MWI/ ADEK
= Institution of Medical Sciences / Anton de Kom University
Part. = Particulier Part. = Private Zh. = Ziekenhuis Zh. = Hospital g.c. = gezondheidscentrum g.c. = Health Centre

183
11. Volksgezondheid Bij het medisch personeel in tabel 11.1, merken we dat, zowel het aantal Algemene Artsen, als het aantal specialisten vanaf 2014 tot en met 2017 is toegenomen. Het aantal verpleegsters is vanaf 2010 (1,005) tot en met 2013 (922) afgenomen. Vanaf 2014 merken we een toename en in 2015 zitten we met een registratie van 1,167 verpleegkundigen. In 2016 daalde dit cijfer naar 1104. Uit de cijfers zien we dat Suriname voor wat het aantal suspecte gevallen van Dengue betreft, zeer goede resultaten boekt. Vanaf 2012 (1,180) tot en met 2016 (13) zien we een forse daling in de aantallen. Bij gevallen van Malaria zien we juist een verergering van de situatie, namelijk een stijging van 267 gevallen in 2014 naar 375 gevallen in 2015. Dit cijfer daalde naar 311 in 2016. In de 2 nieuwe tabellen (11.10 en 11.11) geven wij een overzicht van Suspecte gevallen van Chikungunya en Zika weer. Het cijfer van Chikungunya was heel hoog in 2014 (5554), maar gelukkig in de daarop volgende jaren was er sprake van een afname (2015,1254; 2016, 30). In 2015 waren er 349 gevallen van Zika en dit cijfer steeg enorm in 2016 en wel naar 2421 gevallen.
11. Public Health Regarding the medical staff (Table 11.1) we note that both the number of General Practitioners and the number of Specialists has increased as of 2012 up to 2015. Looking at the number of nurses, we see a declining trend as of 2010 (1,005) up to 2013 (922) . From 2014 to 2015, we notice an increase up to 1,167 registered nurses. In 2016 this figure dropped to 1104. Looking at the figures, we see that Suriname scores very well regarding the number of suspect cases of Dengue. From 2012 (1,189) to 2015 (13), we see a sharp decline in the data. In the case of Malaria we see that the situation has worsened, namely an increase from 267 cases in 2014 to 375 cases in 2015. This figure dropped to 311 in 2016. In the 2 new tables (11.10 and 11.11) we give an overview of Suspected cases of Chikungunya and Zika. The figure of Chikungunya was very high in 2014 (5554), but fortunately it decreased in the following years (2015,1254; 2016, 30). In 2015 there were 349 cases of Zika and this figure rose enormously in 2016 to 2421 cases.

184
Tabel 11.1: Het jaarlijkse aantal geneeskundigen naar soort, 2014 - 2017
Table 11.1: Annual Number of Physicians by Type, 2014 - 2017
Soort/ Type
Jaar / Year per aug. 2014 /
per August 2014
per aug. 2015 /
per August 2015
per aug. 2016/
per August 2016
per aug. 2017/
per August 2017
Huisartsen/
General Practitioners 360 401 436 465
Specialisten, waarvan: Specialists, of which: 166 184 203 210
Cardiologen / Cardiolologists 8 9 12 12
Internisten / Internists 18 19 19 22
Kinderartsen / Pediatricians 11 12 12 14
Chirurgen / Surgeons 12 12 14 14
Dermatologen / Dermalogists 10 10 10 5
Gynaecologen / Gynaecologists 17 15 16 16
KNO-artsen / Ear, Nose and Throat Specialists 6 7 8 6
Neurologen / Neurologists 5 5 8 7
Oogartsen / Ophthalmolgists 9 11 12 10
Orthopeden / Orthopaedists 6 5 5 7
Psychiaters / Psychiatrists 10 10 9 11
Anesthesiologen / Anaesthesists 14 14 11 14
Pathologen / Pathologists 2 1 1 4
Radiodiagnosten / Radiologists 5 5 4 6
Epidemiologen / Epidemiologists 3 2 3 4
Anderen / Others 30 47 59 58
Bron : Ministerie van Volksgezondheid, afdeling Onderzoek Planning en Monitoring Source : Ministry of Public Health, Division of Research Planning and Monitoring

Aan
tal/
Nu
mb
er
Grafiek 11
Graph
0
50
100
150
200
250
300
350
400
450
500A
anta
l/ N
um
ber
Huisartse
Specialist
.1: Jaarlijk
11.1: Annua
2014
en/General P
ten / Speciali
kse aantal ge
al Number
2015
ractitioners
sts
eneeskundig
of Physician
20
gen naar soo
ns by Type,
16
ort, 2014 - 2
2014 - 2017
2017Jaar
2017
7
r /Year

186
Tabel 11.2: Aantal Verpleegkundigen en aantal verstrekte bevoegdheidsverklaringen aan Verpleegkundigen1), 1996 -2016
Table 11.2: Number of Nurses and Number of Certificates of Qualification Provided to Nurses1), 1996 - 2016
Jaar/ Year
Aantal Verpleegkundigen/
Number of Nurses Aantal Bevoegdheidsverklaringen /
Number of Certificates of Qualification
3 jaar
gediplomeerd / < 3 jaar
gediplomeerd/ Totaal /
Total
1996 715 81 6 87
1997 739 69 11 80
1998 731 62 18 80
1999 717 57 9 66
2000 696 111 . 111
2001 733 43 . 43
2002 648 26 3 29
2003 762 24 2 26
2004 734 10 11 21
2005 808 11 3 14
2006 777 20 3 23
2007 847 13 1 14
2008 969 24 5 29
2009 835 10 3 13
2010 1,005 12 7 19
2011 937 25 5 30
2012 922 15 5 20
2013 922 15 1 16
2014 1,143 14 2 16
2015 1,167 17 - 17
2016 1,104 53 1 54
1) Aantal Bevoegdheidsverklaringen aan Verpleegkundigen en aantal verpleegkundigen nog geen 3 jaar gediplomeerd. Iemand vraagt een bevoegdheidsverklaring aan, met de intentie om in het buitenland te werken of te studeren.
1) Number of Certificates of Qualification to Nurses and Number of Certified Nurses graduated less than 3
years ago. Someone requesting a Certificate of Qualification has the intention to go working or studying abroad.
Bron : Ministerie van Volksgezondheid, afdeling Inspektie der Verplegende en Verzorgende Beroepen Source :Ministry of Public Health, Division of Inspection of Nursing and Caring Jobs

187
Tabel 11.3: Aantal medische specialisten naar soort specialisatie en gezondheidsinstelling, per juni 2017 (1)
Table 11.3: Number of Medical Specialists by Type of Specialization and Health Institution,
Per June 2017 (1)
Specialisatie / Specialization
AZP LH RKZ DH MMC PCS Sub Total
Interne specialisten / Intern Specialists:
Cardiologen / Cardiolologists 11 - - - 1 - 12
Internisten / Internists 8 1 3 7 3 - 22
Kinderartsen / Pediatricians 5 2 3 3 1 - 14
Longartsen / Pulmonologists 3 3 - - - - 6
Chirurgische specialisten / Surgeons Specialists:
Algemeen Chirurgen /Surgeons 7 2 2 2 1 - 14
Dermatologen / Dermalogists 3 - - - - - 3
Gynaecologen / Gynaecologists 5 3 3 4 1 - 16
Kaakchirurgen / Dental Surgeons 2 - - - - - 2
KNO-artsen / Ear, Nose and Throat Specialists 3 1 - 1 1 - 6
Neurologen / Neurologists 4 - 2 1 - - 7
Neurochirurgen / Neurosurgeons 2 - 2 - - - 4
Oogartsen / Ophthalmologists 10 - - - - - 10
Orthopeden / Orthopaedists 5 - 1 - 1 - 7
Plastisch chirurgen / Plastic surgeons 2 - - 1 - - 3
Psychiaters / Psychiatrists 2 - 1 - - 8 11
Urologen / Urologists 2 - - 1 1 - 4
Ondersteunende specialisten / Supporting Specialists:
Anaesthesisten / Anesthesiologists 7 3 1 2 1 - 14
Bacteriologen / Bacteriologists - - - - - - -
Klinische Chemici / Clinic Chemici - - - - - - -
Medisch bioloog / Medical biologist - - 1 - - - 1
Medisch Microbioloog / Medical Microbiologist 2 - - - - - 2
Medisch Parasitoloog / Medical Parasitologist - - - - - - -
Patholoog Anatomen / Pathologists 1 - - - - - 1
Radiodiagnosten / Radiologists 5 - 1 - - - 6
Radiotherapeuten / Radiation Oncologists 3 - - - - - 3
Revalidatie artsen /Rehabilitation specialists 1 - - - - - 1
Geriatrie 1 - - - - - 1
Intensivist 1 - - - - - 1
Overige / Other:
Consultatie bureau artsen / Maternity Centre Physicians - 2 - - - - 2
Epidemioloog / Epidemiologist - - - - - - -
Fysioloog / Fysiologist - - - - - - -
Thoraxchirurg /Thoracic surgeon 1 - - - - - 1
Psycholoog - - - - - 3 3
Onbekend / Unknown: - 2 - - - - 2
Totaal / Total 96 19 20 22 11 11 179 Bron : Ministerie van Volksgezondheid, afdeling Planning / Source : Ministry of Health, Section of Planning

188
Tabel 11.3: Aantal medische specialisten naar soort specialisatie en gezondheidsinstelling, per juni 2017 (2)
Table 11.3: Number of Medical Specialists by Type of Specialization and Health Institution,
Per June 2017 (2) Specialisatie / Specialization
DD
MVG/ BOG
MWI/ ADEK.
Sub. Tot.
Gen. Total
Interne specialisten / Intern Specialists:
Cardiologen / Cardiolologists - - - - 12
Internisten / Internists - - - - 22
Kinderartsen / Pediatricians - - - - 14
Longartsen / Pulmonologists - - - - 6
Chirurgische specialisten / Surgeons Specialists:
Algemeen Chirurgen /Surgeons - - - - 14
Dermatologen / Dermalogists 2 - - 2 5
Gynaecologen / Gynaecologists - - - - 16
Kaakchirurgen / Dental Surgeons - - - - 2
KNO-artsen / Ear, Nose and Throat Specialists - - - - 6
Neurologen / Neurologists - - - - 7
Neurochirurgen / Neurosurgeons - - - - 4
Oogartsen / Ophthalmologists - - - - 10
Orthopeden / Orthopaedists - - - - 7
Plastisch chirurgen / Plastic surgeons - - - - 3
Psychiaters / Psychiatrists - - - - 11
Urologen / Urologists - - - - 4
Ondersteunende specialisten / Supporting Specialists:
Anaesthesisten / Anesthesiologists - - - - 14
Bacteriologen / Bacteriologists - - - - -
Klinische Chemici / Clinic Chemici - - - - -
Medisch bioloog / Medical biologist - - - - 1
Medisch Microbioloog / Medical Microbiologist - - 2 2 4
Medisch Parasitoloog / Medical Parasitologist - - - - -
Patholoog Anatomen / Pathologists - - 3 3 4
Radiodiagnosten / Radiologists - - - - 6
Radiotherapeuten / Radiation Oncologists - - - - 3
Revalidatie artsen /Rehabilitation specialists - - - - 1
Geriatrie - - - - 1
Intensivist - - - - 1
Overige / Other: Consultatie bureau artsen /
Maternity Centre Physicians - - - - 2
Epidemioloog / Epidemiologist - 1 3 4 4 Fysioloog / Fysiologist - - 2 2 2
Thoraxchirurg /Thoracic surgeon - - - - 1
Pscholoog - - - - 3
Onbekend/ Unknown - 2 16 18 20
Totaal 2 3 26 31 210 Bron : Ministerie van Volksgezondheid, afdeling Planning / Source : Ministry of Health, Section of Planning

189
Tabel 11.4: RGD poliklinieken en artsen naar district en RGD ressortsindeling, per juni 2016 en per juli 2017 (1)
Table 11.4: RGD Policlinics and Physicians by District and RGD Ressort classification,
per June 2016 and July 2017 (1)
per juni/
per June 2016 per juli/
per July 2017
District/ District
Rayon/ Area
RGD Ressort/ RGD Ressort
Polikliniek (Hulppost)/ Policlinic
Artsen/ Physicians
Polikliniek (Hulppost)/ Policlinic
Artsen/ Physicians
Paramaribo I Buitengasthuis 1 2 1 2
I Redmondstraat 1 1 1 1
I Geyersvlijt (g.c) 1 3 1 2
I Heerenstraat 1 2 1 2
I Flustraat 1 2 1 2
II.a Flora (g.c) 1 3 1 3
II.a Uitvlugt 1 2 1 2
II.a Welgelegen 1(1) 2 1(1) 2
II.a Weg naar Zee 1 1 1 1
III Latour 1 3 1 4
III Pontbuiten 1 2 1 2
III Livorno 1 1 1 1
Paramaribo Totaal/Total 12 (1) 24 12 (1) 24
Wanica II.a Derde rijweg (g.c) 1 2 1 2
II.a Sophia's Lust 1 1 1 1
II.b Leiding 8a 1 1 1 1
II.b Koewarasan 1 3 1 3
II.b Santodorp 1 2 1 2
III Houttuin 1 1 1 1
III Domburg 1 1 1 1
IV Nieuwe Grond 1 2 1 2
IV Lelydorp (g.c) 1(3) 3 1(3) 5
Wanica Totaal/Total 9 (3) 16 9 (3) 18
Marowijne VI Wonoredjo 1(3) 3 1(3) 3
VI Albina (g.c) 1(7) 2 1(7) 2
Galibi (1) (1) -
Marowijne Totaal/Total 2(11) 5 2(11) 5 Bron/ Source : Regionale Gezondheidsdienst / Regional Health Services

190
Tabel 11.4: RGD poliklinieken en artsen naar district en RGD ressortsindeling, per juni 2016 en juli 2017 (2)
Table 11.4: RGD Policlinics and Physicians by District and RGD Ressortclassification,
per June 2016 and July 2017 (2)
per juni/
per June 2016 per juli/
per July 2017
District/ District
Rayon/ Area
RGD Ressort/ RGD Ressort
Polikliniek (Hulppost)/ Policlinic
Artsen/ Physicians
Polikliniek (Hulppost)/ Policlinic
Artsen/ Physicians
Para III La Vigelantia 1 1 1 1
IV Zanderij 1(4) 1 1(4) 1 IV Onverwacht 1(1) 1 1(1) 1 IV Bernarddorp 1 1 1 2
Para Totaal/Total 4 (5) 4 4 (5) 5
Saramacca II.b Jarikaba 1 1 1 1
II.b Chandishawweg 1 2 1 1 VII Tijgerkreek 1(2) 2 1(2) 3 VII Groningen 1(1) 2 1 (1) 2
VII Kampong Baroe (1) (1) VII Huwelijkzorg (1) (1)
Saramacca Totaal/Total 4 (5) 7 4 (5) 7
Commewijne V Ellen (g.c) 1(1) 1 1(1) 2 V Tamanredjo 1 1 1 1 V Alkmaar 1(2) 1 1(2) 1 V Nw. Amsterdam 1 1 1 1 V Meerzorg 1 2 1 2
Commewijne Totaal/Total 5(3) 6 5(3) 7
Coronie VIII Friendship (g.c) 1 2 1 2
Coronie Totaal/Total 1 2 1 2
VIII Wageningen (g.c) 1 1 1 2 Nickerie VIII Groot Henar 1 2 1 2
VIII Paradise 1 1 1 1 VIII Nw.Nickerie 1 2 1 2 VIII Margarethenburg 1 1 1 1 VIII Corantijnpolder 1 2 1 1
Nickerie Totaal/Total 6 (2) 9 6 (2) 9 Opmerking / Remark: De cijfers tussen haakjes betreffen aantal hulppoli's behorende bij een basispolikliniek / The figures between brackets are the numbers of supporting Policlinics, belonging to a Basic Policlinic. Bron/ Source : Regionale Gezondheidszorg / Regional Health Services

191
Tabel 11.5: Het jaarlijkse aantal beschikbare ziekenhuisbedden 1) naar gezondheidsinstelling en district, 2013 - 2016
Table 11.5: Annual Number of Available Hospital Beds 1) by Health Care Institution and
District, 2013 - 2016
District/ District
Gezondheidsinstelling/ Health Care Institution
Jaar / Year
2013 2014 2015 2016
Paramaribo Academisch Ziekenhuis Paramaribo / Academisch Ziekenhuis Paramaribo 484 484 484 486
's Lands Hospitaal / 's Lands Hospital 357 357 357 356
Diakonessen Ziekenhuis / Diakonessen Ziekenhuis 204 204 204 207
St. Vincentius Ziekenhuis/ St. Vincentius Ziekenhuis 186 186 186 186
Psychiatrisch Centrum Suriname en Kinderpaviljoen / Mental Hospital and Children's Pavilion 296 296 296 296
Nickerie Dr.L. Mungra Ziekenhuis / Dr.L.Mungra Ziekenhuis 100 100 100 112
Coronie Hospitaal Coronie / Coronie Hospital 7 7 7 8
Commewijne Gezondheidscentrum Ellen / Health Centre Ellen 7 7 7 8
Marowijne Gezondheidscentrum Albina / Health Centre Albina 2 2 2 2
Hospitaal Stoelmanseiland / Stoelmanseiland Hospital 18 18 18 20
Brokopondo Hospitaal Djoemoe / Djoemoe Hospital 16 16 16 18
Gezondheidscentrum Brownsweg/ Health Centre Brownsweg 8 8 8 9
Totaal /
Total 1,685 1,685 1,685 1,708 1) Exclusief Militair hospitaal en Moengo hospitaal / Exclusive of Military and Moengo Hospital Bron :Ministerie van Volksgezondheid, afdeling Inspektie der Verplegende en Verzorgende Beroepen Source :Ministry of Public Health, Division of Inspection of Nursing and Caring Occupations

192
Tabel 11.6 : Aantal Suspecte gevallen van Leptospirose naar geslacht, 2011 – 2016
Table 11.6 : Number of Suspected Cases of Leptospirosis by Sex, 2011 - 2016
Jaar / Year
Man / Male
Vrouw / Female
Totaal / Total
2011 65 16 81
2012 101 42 143
2013 45 21 66
2014 42 14 56
2015 22 3 25
2016 57 17 74 Bron / Source: Bureau voor Openbare Gezondheidszorg / Bureau for Public Health
Tabel 11.7 : Aantal Suspecte gevallen van dengue naar geslacht, 2011 – 2016
Table 11.7 : Number of Suspected Cases of Dengue by Sex, 2011 - 2016
Jaar / Year
Man / Male
Vrouw / Female
Totaal / Total
2011 253 153 406
2012 686 503 1,189
2013 190 144 334
2014 35 37 72
2015 7 8 15
2016 5 8 13 Bron / Source: Bureau voor Openbare Gezondheidszorg / Bureau for Public Health
Tabel 11.8 : Aantal Malaria gevallen naar geslacht, 2011 – 2016
Table 11.8 : Number of Malaria Cases by Sex, 2011 - 2016
Jaar / Year
Man / Male
Vrouw / Female
Gevallen / Cases
2011 416 358 774
2012 332 187 519
2013 333 191 524
2014 136 131 267
2015 243 132 375
2016 198 113 311 Bron / Source: Bureau voor Openbare Gezondheidszorg / Bureau for Public Health

193
Tabel 11.9: Aantal suspecte gevallen van Chikungunya, 2014 – 2016
Table 11.9: Number of Suspected Cases of Chikungunya, 2014 – 2016
Jaar / Year Totaal /Total
2014 5,554
2015 1,254
2016 30
Bron : Bureau voor Openbare Gezondheidszorg / Source : Bureau for Public Health
Tabel 11.10: Aantal suspecte gevallen van Zika, 2015 - 2016
Table 11.10:Number of Suspected cases of Zika, 2015 - 2016
Jaar / Year Totaal /Total
2015 349
2016 2, 421
Bron : Bureau voor Openbare Gezondheidszorg / Source : Bureau for Public Health

194

195
OVERHEIDSFINANCIEN
GOVERNMENT FINANCE

196
12. Overheidsfinanciën De Totale uitgaven van de Overheid bestaan uit: Apparaatsuitgaven en uitgaven van Beleidsprogramma’s. Apparaatsuitgaven zijn uitgaven, om het overheidsapparaat in stand te houden. Bij deze gaat het om salarissen, sociale premies, medische kosten, huisvesting, kantoorkosten en aanschaffingen. De Beleidsprogramma’s worden gefinanciëerd met eigen middelen en donorfinanciering (schenkingen ). In het jaar 2014, bedroegen de jaarlijkse geraamde overheidsfinancien SRD 7,254 miljoen, in 2015 SRD 8,521 miljoen, in 2016 daalden ze naar SRD 7,250 miljoen. In 2017 nam dit cijfer toe tot SRD 10,330 miljoen en voor 2018 is dit cijfer geraamd op SRD 10,300 miljoen. In tabel 12.2 zien wij de totale geraamde apparaatsuitgaven per ministerie van 2014 tot en met 2018. Deze geraamde uitgaven vertonen een stijgende trend (2,218.9 – 2,964 miljoen) In het jaar 2016, bedroeg de raming voor de belastingen SRD 3,544.4 miljoen, maar de overheid kreeg SRD 2,536.0 miljoen binnen aan de gerealiseerde belastingen. Voor de donorfinanciering was SRD 2,181.4 miljoen geraamd in 2016, maar de overheid kreeg niets gedoneerd.
12. Government Finance The Total Expenditures of the Government Consist of : Apparatus Expenditure and Expenditures for Policy Programs Apparatus Expenditures are expenditures to finance the Civil Service. These consist of Salaries, Social premiums, Medical Costs, Housing, Office costs and Procurements. Policy programs are financed with government funds and Donor grants. In the year 2014, the annual budgeted government expeditures amounted to SRD 7.254 Million, in 2015 SRD 8.521 Million, in 2016 decreased to SRD 7.250 Million. In 2017, this figure increased to SRD 10.330 Million and in 2018, this figure is budgeted at SRD 10.300 Million. In table 12.2, we see Budgeted Apparatus Expenditure per Ministry of 2014 to 2018. These Budgeted Expenditures show an increasing trend (2,218.9 – 2,964 Million) In the year 2016, the Budgeting for the taxes amounted to SRD 3,544.4 Million, but the Government received SRD 2,536.0 Million of the realized taxes. SRD 2,181.4 Million was Budgeted for donor financing in 2016, but the government did not receive any donations.

197
Tabel 12.1: De jaarlijkse geraamde uitgaven van de Overheid per categorie (x SRD. 1 miljoen), 2014 - 2018
Table 12.1: Annual Budgeted Expenditures of the Government per Category
(x SRD. 1 Million), 2014 - 2018
Jaar / Year Categorie/ Category 2014 2015 2016 2017 # 2018
Apparaatsuitgaven /Apparatus Expenditure 2,217 2,238 2,462 2,829 2,964
Beleidsprogramma / Policyprograms ( Financiëring met overheidsmiddelen/ Financing with Government Funds ) 3,513 4,093 2,607 5,645 5,659
SubTotaal/SubTotal 5,730 6,331 5,069 8,474 8,623
Beleidsprogramma/Policyprograms ( Donorfinanciëring/ Donorfinancing) 1,524 2,190 2,181 1,856 1,677
Totale uitgaven/Total Expenditure 7,254 8,521 7,250 10,330 10,300
Bron : Ministerie van Financiën Source : Ministry of Finance

198
Tabel 12.2: De jaarlijkse geraamde Apparaatsuitgaven van de Overheid per ministerie/departement (x SRD. 1 miljoen), 2014 - 2018
Table 12.2: Annual Budgeted Apparatus Expenditures of the Government by
Ministry/Department (x SRD. 1 Million), 2014 - 2018
Departement / Department
Jaar / Year 2014 2015 2016 2017 # 2018
Algemene Zaken / General Affairs 236.3 239.9 98.7 111.0 119.0
Financiën / Finance 97.4 99.2 101.7 92.0 104.0
Handel & Industrie / Trade & Industry 18.1 18.9 28.0 33.0 31.0 Landbouw, Veeteelt & Visserij/ Agriculture, Animal Husbandry & Fishery 53.6 56.8 53.7 55.0 56.0 Natuurlijke Hulpbronnen & Energie/ Natural Resources and Energy 55.8 66.8 88.7 54.0 62.0
Justitie en Politie / Justice and Police 364.0 378.2 380.3 369.0 369.0
Binnenlandse Zaken / Home affairs 59.2 63.5 90.3 96.0 97.0
Regionale Ontwikkeling / Regional Development 117.8 122.9 145.0 180.0 187.0
Openbare Werken / Public Works 85.7 87.3 83.3 71.0 70.0 Onderwijs & Volksontwikkeling/ Education & Development 506.2 515.6 764.5 1,051.0 1,127.0
Cultuur / Culture 11.6 12.4 11.5 12.0 12.0
Milieubeheer /Environmental and Sanitary Services 41.6 42.5 42.2 51.0 50.0 Sociale Zaken & Volkshuisvesting/ Social Affairs and Housing 82.6 80.0 103.1 119.0 127.0
Volksgezondheid / Public Health 43.8 41.5 34.9 44.0 49.0
Defensie / Defence 228.1 225.5 228.0 262.0 273.0
Arbeid / Labour 23.2 23.2 20.6 25.0 23.0
Buitenlandse Zaken / Foreign Affairs 82.1 82.0 95.2 102.0 97.0
Sport & Jeugdzaken / Sports & Youth Affairs 20.0 21.6 25.8 29.0 34.0 Transport, Communicatie en Toerisme/ Transport, Communication & Tourism 35.0 35.0 40.6 49.0 49.0 Ruimtelijke Ordening, Grond- en Bosbeheer/ Physical Planning, Land and Forest Management 29.8 26.1 26.0 27.0 28.0
Agrarische Ontwikkeling/ Agricultural Development . . . . .
Totaal/Total 2,218.9 2,238.9 2462.1 2,832.0 2,964.0
De Nationale Assemblee/ The National Assembly 25.8 34.7 . . . Bron : Ministerie van Financiën Source : Ministry of Finance

199
Tabel 12.3: De jaarlijkse ramingen van de ontvangsten van de Overheid naar type (x SRD. 1 miljoen), 2015 - 2018
Table 12.3: Annual Government Projected Revenues by Type
(x SRD. 1 Million), 2015 - 2018
Jaar / Year
2015 2016 2017 # 2018 A. Belastingen/ Taxes 2,866.8 3,544.4 2,958.0 3,578.0
B. Niet-Belastingsmiddelen /Non-Tax Revenues 1,658.6 1,020.1 1,918.0 1,926.0
C. Donormiddelen( schenkingen) /Donorfinancing (Grants ) 2,189.6 2,181.4 1,857.0 1,677.0 Totale ontvangsten ( A+B+C ) / Total Revenues ( A+B+C ) 6,715.0 6,745.9 6,733.0 7,181.0
Bron : Ministerie van Financiën Source : Ministry of Finance
Tabel 12.4: De jaarlijkse gerealiseerde ontvangsten van de Overheid naar type (x SRD. 1 miljoen), 2013 - 1e helft 2017
Table 12.4: Annual Government Actual Revenues by Type
(x SRD. 1 Million), 2013 - 1st half 2017
Jaar / Year
2013 2014 2015
1e helft 2017/
1st Half 2017
A. Belastingen/ Taxes 3,133.7 2,859.1 2,713.9 2,536.0
B. Niet-Belastingsmiddelen /Non-Tax Revenues 826.6 891.8 684.8 868.0
C. Donormiddelen( schenkingen) /Donorfinancing (Grants ) 0.0 0.0 0.0 0.0
Bron : Ministerie van Financiën Source : Ministry of Finance
200
201
CRIME
CRIMINALITEIT

202
13. Criminaliteit De verschillende tabellen geven ons een overzicht van:
- het aantal gepleegde misdrijven door bekende en onbekende daders en
- het aantal gepoogde misdrijven door bekende en onbekende daders.
Als we de cijfers in tabel 13.1a vergelijken, vanaf het jaar 2014 (22,507) tot en met 2016 (23,436), zien wij dat het aantal geregistreerde misdrijven (gepleegd) is toegenomen. Bij de opheldering van misdrijven, in 2013, constateren wij dat, van het totaal aantal misdrijven (Gepleegd en Gepoogd) 23.7 % werden opgehelderd, terwijl dit percentage in 2014, 28.0 % bedroeg. In 2015 daalde dit cijfer naar 25.2% en daalde verder in 2016 naar 24.0 %. Het totaal aantal inverzekeringsgestelden in 2014 nam toe ten opzichte van 2013, van 3,214 naar 3,507. In 2015 nam dit cijfer weer eens toe tot 3,787. Vervolgens in 2016 daalde het tot 3,149. Belangrijk! Per misdrijf kunnen één of meerdere personen in verzekering gesteld worden.
13. Crime The several tables give us an overview in:
- the number of crimes committed by known and unknown Offenders and
- the number of attempted offences by known and unknown Offenders.
If we compare the figures in Table 13.1a from the year 2014 (22,507) up to 2016 (23.436), we see that the Registered Crimes (Committed) have increased. Regarding the Solved Offences, in 2013, we find that, of the total number of crimes (Commited and Attempts) 23.7% were solved, while this percentage in 2014 was 28.0%. In 2015 this figure decreased to 25.2%, but decreased further in 2016 to 24.0%. The Total Number of Persons taken into custody increased in 2014 compared to 2013, from 3,214 to 3,507. In 2015 this figure increased again to 3,787. Then in 2016 it declined to 3,149. Important! Per crime one or more persons can be taken into Custody.

203
Tabel 13.1a : Het totale aantal geregistreerde misdrijven (gepleegd) naar aard van misdrijf en district in Suriname, 2014 – 2016 (1)
Table 13.1a: Total Number of Registered Crimes (Commited) by Type of Crime and District in
Suriname, 2014 - 2016 (1)
Aard van Misdrijf/ Paramaribo Wanica
Type of Crime 2014 2015 2016 2014 2015 2016
Totaal / Total 11,722 11,035 11,134 5,538 5,650 6,037
waarvan / Of which:
Misdrijven tegen openbare orde en gezag /
Criminal Offences against Public order 190 208 165 155 130 126
Misdrijven tegen leven en personen/
Homicides and Aggravated Assaults 2,572 2,179 1,824 1,232 1,086 1,135
Ruwheidsmisdr. / Vandalism and Menace 629 545 431 324 313 299
Sexuele misdrijven / Sexual Offences 510 403 496 121 103 137
Vermogensdelicten / Property Offences 7,702 7,526 8,064 3,636 3,955 4,252
Economische Delicten / Economic Offences 20 105 23 17 9 30
Overtreding v/d opiumwet / Drug Offences 66 49 33 42 40 42
Overige misdrijven / Other Crimes 33 20 73 11 14 16
Aard van Misdrijf/ Nickerie Coronie
Type of Crime 2014 2015 2016 2014 2015 2016
Totaal / Total 1,507 1,711 1,780 154 118 133
waarvan / Of which:
Misdrijven tegen openbare orde en gezag /
Criminal Offences against Public order 46 38 32 5 2 1
Misdrijven tegen leven en personen/
Homicides and Aggravated Assaults 413 385 323 45 33 35
Ruwheidsmisdr. / Vandalism and Menace 108 133 86 8 9 4
Sexuele misdrijven / Sexual Offences 28 25 14 - - 1
Vermogensdelicten / Property Offences 888 1,080 1,296 65 49 64
Economische Delicten / Economic Offences 3 31 5 16 17 24
Overtreding v/d opiumwet / Drug Offences 11 15 17 14 5 2
Overige misdrijven / Other Crimes 10 4 7 1 3 2 Bron :Ministerie van Justitie en Politie, afdeling Criminele Informatie Verzorging Source : Ministry of Justice and Police, Department of Crime Information

204
Tabel 13.1a : Het totale aantal geregistreerde misdrijven (gepleegd) naar aard van misdrijf en district in Suriname, 2014 – 2016 (2)
Table 13.1a: Total Number of Registered Crimes (Commited) by Type of Crime and District in
Suriname, 2014 – 2016 (2)
Aard van Misdrijf/ Saramacca Commewijne
Type of Crime 2014 2015 2016 2014 2015 2016
Totaal/ Total 484 670 542 936 930 1,140
waarvan / Of which:
Misdrijven tegen openbare orde en gezag/
Criminal Offences against Public order 13 22 12 32 12 30
Misdrijven tegen leven en personen/
Homicides and Aggravated Assaults 130 135 119 200 235 222
Ruwheidsmisdr. / Vandalism and Menace 18 60 33 69 71 59
Sexuele misdrijven / Sexual Offences 12 14 18 24 20 23
Vermogensdelicten / Property Offences 297 414 343 571 566 767
Economische Delicten / Economic Offences 6 15 5 7 7 21
Overtreding v/d opiumwet / Drug Offences 7 9 6 12 8 3
Overige misdrijven / Other Crimes 1 1 6 21 11 15
Aard van Misdrijf/ Marowijne Para
Type of Crime 2014 2015 2016 2014 2015 2016
Totaal/ Total 322 575 604 1,183 1,268 1,431
waarvan / Of which:
Misdrijven tegen openbare orde en gezag/
Criminal Offences against Public order 7 13 19 28 17 27
Misdrijven tegen leven en personen/
Homicides and Aggravated Assaults 125 194 217 291 268 318
Ruwheidsmisdr./ Vandalism and Menace 14 31 25 72 82 110
Sexuele misdrijven/ Sexual Offences 27 12 36 40 41 39
Vermogensdelicten/ Property Offences 126 311 292 705 805 876
Economische Delicten/ Economic Offences 3 10 1 4 37 6
Overtreding v/d opiumwet/ Drug Offences 7 2 7 9 6 9
Overige misdrijven/ Other Crimes 13 2 7 34 12 46 Bron :Ministerie van Justitie en Politie, afdeling Criminele Informatie Verzorging Source :Ministry of Justice and Police, Department of Crime Information
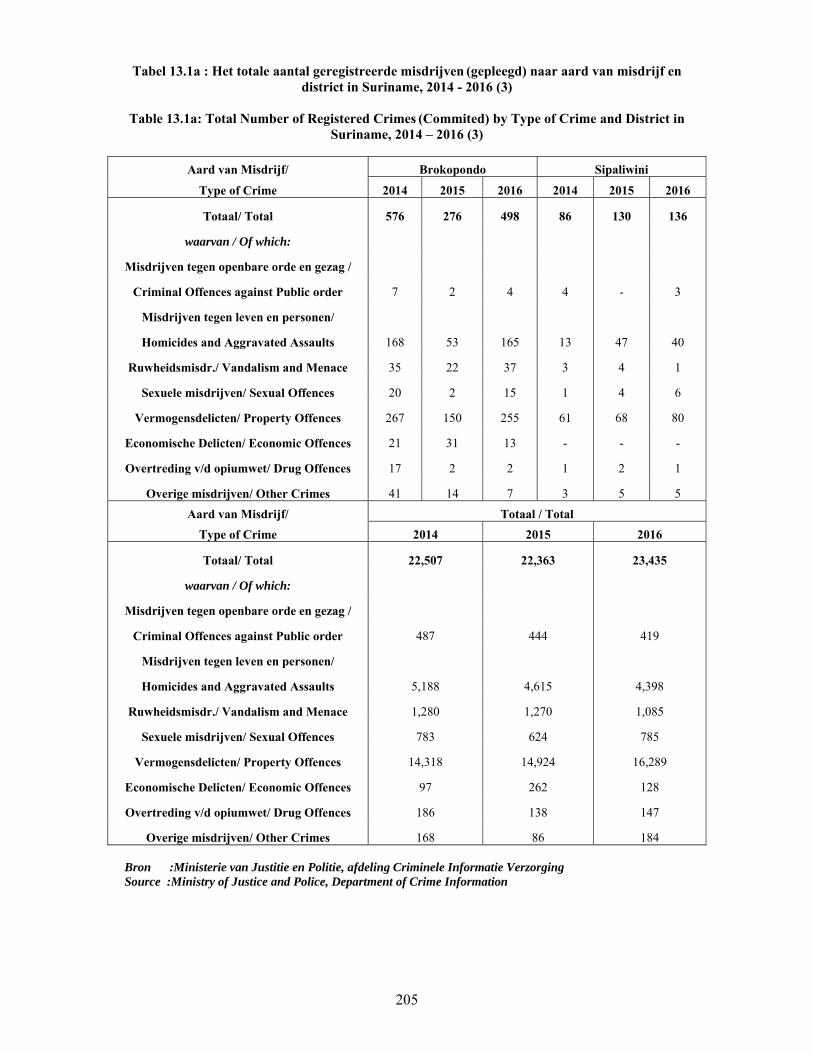
205
Tabel 13.1a : Het totale aantal geregistreerde misdrijven (gepleegd) naar aard van misdrijf en district in Suriname, 2014 - 2016 (3)
Table 13.1a: Total Number of Registered Crimes (Commited) by Type of Crime and District in
Suriname, 2014 – 2016 (3)
Aard van Misdrijf/ Brokopondo Sipaliwini
Type of Crime 2014 2015 2016 2014 2015 2016
Totaal/ Total 576 276 498 86 130 136
waarvan / Of which:
Misdrijven tegen openbare orde en gezag /
Criminal Offences against Public order 7 2 4 4 - 3
Misdrijven tegen leven en personen/
Homicides and Aggravated Assaults 168 53 165 13 47 40
Ruwheidsmisdr./ Vandalism and Menace 35 22 37 3 4 1
Sexuele misdrijven/ Sexual Offences 20 2 15 1 4 6
Vermogensdelicten/ Property Offences 267 150 255 61 68 80
Economische Delicten/ Economic Offences 21 31 13 - - -
Overtreding v/d opiumwet/ Drug Offences 17 2 2 1 2 1
Overige misdrijven/ Other Crimes 41 14 7 3 5 5
Aard van Misdrijf/ Totaal / Total
Type of Crime 2014 2015 2016
Totaal/ Total 22,507 22,363 23,435
waarvan / Of which:
Misdrijven tegen openbare orde en gezag /
Criminal Offences against Public order 487 444 419
Misdrijven tegen leven en personen/
Homicides and Aggravated Assaults 5,188 4,615 4,398
Ruwheidsmisdr./ Vandalism and Menace 1,280 1,270 1,085
Sexuele misdrijven/ Sexual Offences 783 624 785
Vermogensdelicten/ Property Offences 14,318 14,924 16,289
Economische Delicten/ Economic Offences 97 262 128
Overtreding v/d opiumwet/ Drug Offences 186 138 147
Overige misdrijven/ Other Crimes 168 86 184 Bron :Ministerie van Justitie en Politie, afdeling Criminele Informatie Verzorging Source :Ministry of Justice and Police, Department of Crime Information

206
Tabel 13.1b : Het totale aantal geregistreerde misdrijven (gepoogd) naar aard van misdrijf en district in Suriname, 2014 - 2016 (1)
Table 13.1b: Total Number of Registered Crimes (Attempted) by Type of Crime and District in
Suriname, 2014 - 2016 (1)
Aard van Misdrijf/ Paramaribo Wanica
Type of Crime 2014 2015 2016 2014 2015 2016
Totaal / Total 858 883 961 477 561 395
waarvan / Of which:
Misdrijven tegen openbare orde en gezag /
Criminal Offences against Public order - - - - 4 -
Misdrijven tegen leven en personen/
Homicides and Aggravated Assaults 309 318 335 196 171 146
Ruwheidsmisdr. / Vandalism and Menace 22 15 14 8 6 7
Sexuele misdrijven / Sexual Offences 18 15 8 12 20 9
Vermogensdelicten / Property Offences 509 535 604 261 360 233
Economische Delicten / Economic Offences - - - - - -
Overtreding v/d opiumwet / Drug Offences - - - - - -
Overige misdrijven / Other Crimes - - - - - -
Aard van Misdrijf/ Nickerie Coronie
Type of Crime 2014 2015 2016 2014 2015 2016
Totaal / Total 64 70 82 1 5 10
waarvan / Of which:
Misdrijven tegen openbare orde en gezag /
Criminal Offences against Public order - - - - - -
Misdrijven tegen leven en personen/
Homicides and Aggravated Assaults 38 35 34 - - 6
Ruwheidsmisdr. / Vandalism and Menace 1 2 1 - - -
Sexuele misdrijven / Sexual Offences - 2 - - - 1
Vermogensdelicten / Property Offences 25 31 47 1 5 3
Economische Delicten / Economic Offences - - - - - -
Overtreding v/d opiumwet / Drug Offences - - - - - -
Overige misdrijven / Other Crimes - - - - - -
Bron :Ministerie van Justitie en Politie, afdeling Criminele Informatie Verzorging Source : Ministry of Justice and Police, Department of Crime Information

207
Tabel 13.1b : Het totale aantal geregistreerde misdrijven (gepoogd) naar aard van misdrijf en district in Suriname, 2014 – 2016 (2)
Table 13.1b: Total Number of Registered Crimes (Attempted) by Type of Crime and District in
Suriname, 2014 – 2016 (2)
Aard van Misdrijf/ Saramacca Commewijne
Type of Crime 2014 2015 2016 2014 2015 2016
Totaal/ Total 49 41 40 49 51 70
waarvan / Of which:
Misdrijven tegen openbare orde en gezag/
Criminal Offences against Public order - - - - - -
Misdrijven tegen leven en personen/
Homicides and Aggravated Assaults 25 22 26 21 18 34
Ruwheidsmisdr. / Vandalism and Menace 2 1 - - 2 4
Sexuele misdrijven / Sexual Offences 3 5 2 2 2 -
Vermogensdelicten / Property Offences 19 13 12 26 29 32
Economische Delicten / Economic Offences - - - - - -
Overtreding v/d opiumwet / Drug Offences - - - - - -
Overige misdrijven / Other Crimes - - - - - -
Aard van Misdrijf/ Marowijne Para
Type of Crime 2014 2015 2016 2014 2015 2016
Totaal/ Total 36 58 25 70 61 71
waarvan / Of which:
Misdrijven tegen openbare orde en gezag/
Criminal Offences against Public order - - - - - -
Misdrijven tegen leven en personen/
Homicides and Aggravated Assaults 20 38 15 42 24 26
Ruwheidsmisdr./ Vandalism and Menace 8 - - - - 1
Sexuele misdrijven/ Sexual Offences - 2 - 3 - 3
Vermogensdelicten/ Property Offences 8 16 10 25 37 41
Economische Delicten/ Economic Offences - 2 - - - -
Overtreding v/d opiumwet/ Drug Offences - - - - - -
Overige misdrijven/ Other Crimes - - - - - - Bron :Ministerie van Justitie en Politie, afdeling Criminele Informatie Verzorging Source :Ministry of Justice and Police, Department of Crime Information

208
Tabel 13.1b : Het totale aantal geregistreerde misdrijven (gepoogd) naar aard van misdrijf en district in Suriname, 2014 - 2016 (3)
Table 13.1b: Total Number of Registered Crimes (Attempted) by Type of Crime and District in
Suriname, 2014 – 2016 (3)
Aard van Misdrijf/ Brokopondo Sipaliwini
Type of Crime 2014 2015 2016 2014 2015 2016
Totaal/ Total 13 - 30 19 19 8
waarvan / Of which:
Misdrijven tegen openbare orde en gezag /
Criminal Offences against Public order - - - - - -
Misdrijven tegen leven en personen/
Homicides and Aggravated Assaults 4 - 25 13 13 5
Ruwheidsmisdr./ Vandalism and Menace - - - 2 - -
Sexuele misdrijven/ Sexual Offences - - - 1 - -
Vermogensdelicten/ Property Offences 9 - 5 3 6 3
Economische Delicten/ Economic Offences - - - - - -
Overtreding v/d opiumwet/ Drug Offences - - - - - -
Overige misdrijven/ Other Crimes - - - - - -
Aard van Misdrijf/ Totaal / Total
Type of Crime 2014 2015 2016
Totaal/ Total 1,636 1,749 1,692
waarvan / Of which:
Misdrijven tegen openbare orde en gezag /
Criminal Offences against Public order - 4 -
Misdrijven tegen leven en personen/
Homicides and Aggravated Assaults 668 639 652
Ruwheidsmisdr./ Vandalism and Menace 43 26 27
Sexuele misdrijven/ Sexual Offences 39 46 23
Vermogensdelicten/ Property Offences 886 1,032 990
Economische Delicten/ Economic Offences - 2 -
Overtreding v/d opiumwet/ Drug Offences - - -
Overige misdrijven/ Other Crimes - - -
Bron :Ministerie van Justitie en Politie, afdeling Criminele Informatie Verzorging Source :Ministry of Justice and Police, Department of Crime Information

209
Tabel 13.2a: Het totale aantal geregistreerde en opgehelderde zaken (gepleegd) naar district, 2013 – 2016
Table 13.2a: Total Number of Registered and Solved Offences (Commited) by District,
2013 – 2016
2013 2014
District/ District
Geregistreerde zaken/ Registered offences
Opgehelderde zaken/ Solved
offences Geregistreerde zaken/
Registered offences
Opgehelderde zaken/ Solved offences
1 2 Total 1+2 Abs
% 1 2
Total 1+2 Abs
%
Paramaribo 5,443 6,994 12,437 2,457 19.8 4,734 6,988 11,722 3,063 26.1
Wanica 2,050 3,383 5,433 1,349 24.8 2,170 3,368 5,538 1,291 23.3 Nickerie 875 833 1,708 481 28.2 738 769 1,507 470 31.2 Coronie 93 64 157 71 45.2 103 51 154 95 61.7
Saramacca 276 310 586 207 35.3 229 255 484 169 34.9 Commewijne 357 409 766 258 33.7 444 492 936 330 35.3 Marowijne 489 305 794 276 34.8 244 78 322 151 46.9
Para 867 811 1,678 329 19.6 549 634 1,183 298 25.2 Brokopondo 387 271 658 208 31.6 374 202 576 261 45.3
Sipaliwini 101 59 160 43 26.9 39 46 85 19 22.4 Totaal/ Total 10,938 13,439 24,377 5,679 23.3 9,624 12,883 22,507 6,147 27.3
2015 2016
District/ District
Geregistreerde zaken/ Registered offences
Opgehelderde zaken/ Solved
offences Geregistreerde zaken/
Registered offences
Opgehelderde zaken/ Solved offences
1 2 Total 1+2 Abs
% 1 2
Total 1+2 Abs
%
Paramaribo 4,256 6,779 11,035 2,640 23.9 4,078 7,056 11,134 2,197 19.7
Wanica 1,941 3,709 5,650 1,176 20.8 2,027 4,010 6,037 1,650 27.3 Nickerie 683 1,028 1,711 449 26.2 601 1,179 1,780 517 29.0 Coronie 76 42 118 78 66.1 72 61 133 67 50.4
Saramacca 290 380 670 200 29.9 240 302 542 162 29.9 Commewijne 437 493 930 298 32.0 450 690 1,140 329 28.9 Marowijne 340 235 575 190 33.0 340 264 604 231 53.1
Para 518 750 1,268 313 24.7 607 824 1,431 231 16.1 Brokopondo 128 148 276 89 32.2 233 265 498 128 25.7
Sipaliwini 90 40 130 35 26.9 91 45 136 14 10.3 Totaal/ Total 8,759 13,604 22,363 5,468 24.0 8,739 14,696 23,435 5,526 24.0
1= bekende dader/ known Offender 2= onbekende dader/ unknown Offender Bron :Ministerie van Justitie en Politie, afdeling Criminele Informatie Verzorging Source :Ministry of Justice and Police, Department of Crime Information

Gr
5,0
10,0
15,0
20,0
25,0
Totaal / Total
afiek 13.1 :
Graph 13.
0
000
000
000
000
000
Totale aant
.1: Number
2014
tal geregistr 201
of Register201
2015
reerde en op14 – 2016
red and Solv4 – 2016
5
pgehelderde
ved Offence
2016
e zaken (gep
es (Commite
Jaa
GerezakenOffen
OpgezakenOffen
pleegd),
ed),
ar / Year
egistreerde n/Registerences
ehelderde n/ Solved nces
d

211
Tabel 13.2b: Het totale aantal geregistreerde en opgehelderde zaken (gepoogd) naar district, 2013 – 2016
Table 13.2b: Total Number of Registered and Solved Offences (Attempted) by District,
2013 – 2016
2013 2014
District/ District
Geregistreerde zaken/ Registered offences
Opgehelderde zaken/ Solved
offences Geregistreerde zaken/
Registered offences
Opgehelderde zaken/ Solved offences
1 2 Total 1+2 Abs
% 1 2
Total 1+2 Abs
%
Paramaribo 314 293 607 184 30.3 399 459 858 282 32.9
Wanica 197 187 384 108 28.1 253 224 477 164 34.4 Nickerie 53 99 152 41 27.0 44 20 64 34 53.1 Coronie 1 - 1 1 100.0 1 - 1 - 0.0
Saramacca 25 5 30 20 66.7 27 22 49 23 46.9 Commewijne 27 15 42 18 42.9 37 12 49 26 53.1 Marowijne 44 12 56 29 51.8 31 5 36 23 63.9
Para 29 29 58 16 27.6 44 26 70 35 50.0 Brokopondo 24 14 38 11 28.9 10 3 13 3 23.1
Sipaliwini 12 7 19 6 31.6 15 4 19 13 68.4 Totaal/ Total 726 661 1,387 434 31.3 861 775 1,636 603 36.9
2015 2016
District/ District
Geregistreerde zaken/ Registered offences
Opgehelderde zaken/ Solved
offences Geregistreerde zaken/
Registered offences
Opgehelderde zaken/ Solved offences
1 2 Total 1+2 Abs
% 1 2
Total 1+2 Abs
%
Paramaribo 392 491 883 285 32.3 423 538 961 157 16.3
Wanica 238 323 561 186 33.2 171 224 395 117 29.6 Nickerie 41 29 70 42 60.0 56 26 82 50 61.0 Coronie - 5 5 - 0.0 10 - 10 7 70.0
Saramacca 30 11 41 17 41.5 35 5 40 18 45.0 Commewijne 23 28 51 18 35.3 36 34 70 24 34.3 Marowijne 46 12 58 30 51.7 16 9 25 12 48.0
Para 31 30 61 17 27.9 29 42 71 12 16.9 Brokopondo - - - - 0.0 19 11 30 15 50.0
Sipaliwini 13 6 19 4 21.1 8 - 8 4 50.0 Totaal/ Total 814 935 1,749 599 34.2 803 889 1,692 416 24.6
1= bekende dader/ known Offender 2= onbekende dader/ unknown Offender Bron :Ministerie van Justitie en Politie, afdeling Criminele Informatie Verzorging Source :Ministry of Justice and Police, Department of Crime Information

212
Tabel 13.3a: Het totale aantal geregistreerde misdrijven (gepleegd) en gepleegde misdrijven met bekende daders naar aard van misdrijf, 2013 - 2016
Table 13.3a: Total Number of Registered (Commited) Offences and Commited Offences by
Known Offenders and Type of Crime, 2013 - 2016
Aard van Misdrijf/ 2013 2014
Type of Crime bek. dad. Totaal/ Total bek. dad.
Totaal/ Total
Misdrijven tegen openbare orde en gezag/
Criminal offences against public order 443 546 378 487
Misdrijven tegen leven en personen/
Homicides and Aggravated Assaults 5,236 5,906 4,535 5,188
Ruwheidsmisdrijven/ Vandalism and Menace 683 1,331 591 1,280
Sexuele misdrijven/ Sexual Offences 670 734 735 783
Vermogensdelicten/ Property Offences 3,327 15,218 2,981 14,318
Economische Delicten/ Economic Offences 159 205 66 97
Overtreding van de opiumwet/ Drug Offences 182 197 175 186
Overige misdrijven/ Other Crimes 238 240 163 168
Totaal/ Total 10,938 24,377 9,624 22,507
Aard van Misdrijf/ 2015 2016
Type of Crime bek. dad. Totaal/ Total bek. dad.
Totaal/ Total
Misdrijven tegen openbare orde en gezag/
Criminal offences against public order 370 444 336 420
Misdrijven tegen leven en personen/
Homicides and Aggravated Assaults 4,014 4,615 3,800 4,398
Ruwheidsmisdrijven/ Vandalism and Menace 670 1,270 573 1,085
Sexuele misdrijven/ Sexual Offences 580 624 732 785
Vermogensdelicten/ Property Offences 2,673 14,924 2,875 16,289
Economische Delicten/ Economic Offences 236 256 109 128
Overtreding van de opiumwet/ Drug Offences 129 138 137 147
Overige misdrijven/ Other Crimes 87 92 177 184
Totaal/ Total 8,759 22,363 8,739 23,436
bek.dad. = bekende dader / known offender Bron :Ministerie van Justitie en Politie, afdeling Criminele Informatie Verzorging Source :Ministry of Justice and Police, Department of Crime Information

213
Tabel 13.3b: Het totale aantal geregistreerde misdrijven (gepoogd) en gepoogde misdrijven met bekende daders naar aard van misdrijf, 2013 - 2016
Table 13.3b: Total Number of Registered (Attempted) Offences and Attempted Offences by
Known Offenders and Type of Crime, 2013 - 2016
Aard van Misdrijf/ 2013 2014
Type of Crime bek. dad. Totaal/ Total bek. dad.
Totaal/ Total
Misdrijven tegen openbare orde en gezag/
Criminal offences against public order - - - -
Misdrijven tegen leven en personen/
Homicides and Aggravated Assaults 590 682 590 668
Ruwheidsmisdrijven/ Vandalism and Menace 6 13 26 43
Sexuele misdrijven/ Sexual Offences 14 18 33 39
Vermogensdelicten/ Property Offences 116 616 212 886
Economische Delicten/ Economic Offences - - - -
Overtreding van de opiumwet/ Drug Offences - - - -
Overige misdrijven/ Other Crimes - - - -
Totaal/ Total 726 1,329 861 1,636
Aard van Misdrijf/ 2015 2016
Type of Crime bek. dad. Totaal/ Total bek. dad.
Totaal/ Total
Misdrijven tegen openbare orde en gezag/
Criminal offences against public order 4 4 - -
Misdrijven tegen leven en personen/
Homicides and Aggravated Assaults 555 639 594 652
Ruwheidsmisdrijven/ Vandalism and Menace 16 26 5 27
Sexuele misdrijven/ Sexual Offences 40 46 18 23
Vermogensdelicten/ Property Offences 197 1,032 186 990
Economische Delicten/ Economic Offences 2 2 - -
Overtreding van de opiumwet/ Drug Offences - - - -
Overige misdrijven/ Other Crimes - - -
Totaal/ Total 814 1,749 803 1,692
bek.dad. = bekende dader / known offender Bron :Ministerie van Justitie en Politie, afdeling Criminele Informatie Verzorging Source :Ministry of Justice and Police, Department of Crime Information

214
Tabel 13.4 : Aantal geregistreerde moord en doodslag gevallen per district, 2013 - 2016
Table 13.4 : Number of Registered Murder and Homicide Cases per District, 2013 - 2016
Jaren / Years
2013
2014
2015
2016
District/ Moord/ Doodslag/ Moord/ Doodslag/ Moord/ Doodslag/ Moord/ Doodslag/ District Murder Homicide Murder Homicide Murder Homicide Murder Homicide
Paramaribo 5 6 11 4 7 15
Wanica 2 3 2 - 8 1 6 -
Nickerie 1 - - - 2 - - 1
Coronie - - - - - - - -
Saramacca - - 1 - - - 2 -
Commewijne - - - - 1 1 1 2
Marowijne 1 2 - - - 1 - 1
Para 3 - - 1 - 1 -
Brokopondo 3 5 1 5 1 1 2 1
Sipaliwini 2 - - - - - 3 -
Totaal/ Total 17 16 15 10 19 19 15 5
Bron : Ministerie van Justitie en Politie, afdeling Criminele Informatie Verzorging Source: Ministry of Justice and Police, Department of Crime Information

215
Tabel 13.5a: Het totale aantal inverzekeringgestelde personen naar district, leeftijdsklasse en geslacht, 2013 en 2014
Table 13.5a: Total Number of Persons taken into Custody by District, Age Group and Sex,
2013 and 2014
2013
District/ 10 - 16 j/y 17 - 18 j/y > 19 j/y Totaal/ Total
District M/M V/F M/M V/F M/M V/F M/M V/F
Paramaribo 137 19 66 2 1,090 61 1,293 82
Wanica 14 3 24 1 529 19 567 23
Nickerie 6 - 11 - 415 9 432 9
Coronie 1 1 3 1 65 4 69 6
Saramacca 2 - 4 - 102 4 108 4
Commewijne 1 - 4 - 142 9 147 9
Marowijne 6 2 6 1 120 4 132 7
Para 2 - 1 - 103 12 106 12
Brokopondo 1 - - - 151 16 152 16
Sipaliwini 2 - - 1 35 2 37 3
Totaal/ Total 172 25 119 6 2,752 140 3,043 171
2014
District/ 10 - 16 j/y 17 - 18 j/y > 19 j/y Totaal/ Total
District M/M V/F M/M V/F M/M V/F M/M V/F
Paramaribo 233 28 78 9 1300 92 1611 129
Wanica 43 7 35 2 663 36 741 45
Nickerie 9 2 10 1 306 7 325 10
Coronie - - 4 - 23 - 27 -
Saramacca - - - - 115 3 115 3
Commewijne 3 1 - - 167 5 170 6
Marowijne - - 2 - 93 9 95 9
Para 4 1 5 - 146 7 155 8
Brokopondo - - - - 59 2 59 2
Sipaliwini - - - - - - - -
Totaal/ Total 292 39 134 12 2,872 161 3,298 212
Bron :Ministerie van Justitie en Politie, afdeling Criminele Informatie Verzorging Source :Ministry of Justice and Police, Department of Crime Information

216
Tabel 13.5b: Het totale aantal inverzekeringgestelde personen naar district, leeftijdsklasse en geslacht, 2015 en 2016
Table 13.5b: Total Number of Persons taken into Custody by District, Age Group and Sex,
2015 and 2016
2015
District/ 10 - 16 j/y 17 - 18 j/y > 19 j/y Totaal/ Total
District M/M V/F M/M V/F M/M V/F M/M V/F
Paramaribo 181 10 61 11 1,214 116 1,456 137
Wanica 47 3 73 6 1,071 121 1,191 130
Nickerie 4 - 6 - 285 2 295 2
Coronie - - - - 21 4 21 4
Saramacca 1 1 3 - 125 2 129 3
Commewijne - - 1 - 128 6 129 6
Marowijne 2 - 2 - 114 6 118 6
Para 4 - - - 95 6 99 6
Brokopondo 1 - - - 43 - 44 -
Sipaliwini - - - - 11 - 11 0-
Totaal/ Total 240 14 146 17 3,107 263 3,493 294
2016
District/ 10 - 16 j/y 17 - 18 j/y > 19 j/y Totaal/ Total
District M/M V/F M/M V/F M/M V/F M/M V/F
Paramaribo 179 15 62 6 1,338 60 1,579 81
Wanica 24 2 21 4 445 38 490 44
Nickerie 11 1 6 - 287 10 304 11
Coronie - - - - 20 1 20 1
Saramacca 2 1 2 - 117 7 121 8
Commewijne 2 1 3 - 145 3 150 4
Marowijne 10 1 - - 111 2 121 3
Para 5 1 1 - 89 3 95 4
Brokopondo 1 1 3 - 82 5 86 6
Sipaliwini - - - 1 18 2 18 3
Totaal/ Total 234 23 98 11 2,652 131 2,984 165
Bron :Ministerie van Justitie en Politie, afdeling Criminele Informatie Verzorging Source :Ministry of Justice and Police, Department of Crime Information

217
Tabel 13.6a: Het totale aantal inverzekeringgestelde personen naar aard van misdrijf, leeftijdsklasse en geslacht, 2013 en 2014
Table 13.6a: Total Number of Persons taken into Custody by Type of Crime, Age Group and
Sex, 2013 and 2014
Aard van misdrijf/
2013 Type of Crime 10 -16 j/y 17 – 18 j/y ≥ 19 j/y Totaal /Total
M/M V/F M/M V/F M/M V/F M/M V/F
Misdrijven tegen openbare orde en gezag/
Criminal offences against public order 13 11 18 - 140 13 171 24
Misdrijven tegen leven en personen/
Homicides and Aggravated Assaults 27 3 18 2 746 34 791 39
Ruwheidsmisdrijven/ Vandalism and Menace 9 1 2 - 103 3 114 4
Sexuele misdrijven/ Sexual Offences 29 1 13 - 143 8 185 9
Vermogensdelicten/ Property Offences 88 9 61 3 1,242 54 1,391 66
Economische Delicten/ Economic Offences - - 1 1 161 13 162 14
Verkeersdelicten / Traffic Offences - - - - 13 - 13 -
Overtreding van de opiumwet/ Drug Offences 6 - 6 - 88 5 100 5
Overige misdrijven/ Other Crimes - - - - 116 10 105 -
Totaal/ Total 172 25 119 6 2,752 140 3,043 171
Aard van misdrijf/
2014 Type of Crime 10 -16 j/y 17 – 18 j/y ≥ 19 j/y Totaal /Total
M/M V/F M/M V/F M/M V/F M/M V/F
Misdrijven tegen openbare orde en gezag/
Criminal offences against public order 18 6 14 3 132 18 164 27
Misdrijven tegen leven en personen/
Homicides and Aggravated Assaults 65 10 40 3 864 41 969 54
Ruwheidsmisdrijven/ Vandalism and Menace 11 - 8 - 107 4 126 4
Sexuele misdrijven/ Sexual Offences 32 - 14 - 195 8 241 8
Vermogensdelicten/ Property Offences 158 22 55 6 1289 74 1,502 102
Economische Delicten/ Economic Offences - - - - 50 2 50 2
Verkeersdelicten / Traffic Offences 6 - 1 - 69 5 76 5
Overtreding van de opiumwet/ Drug Offences 1 - 1 - 93 5 95 5
Overige misdrijven/ Other Crimes 1 1 1 - 73 4 75 5
Totaal/ Total 292 39 134 12 2,872 161 3,298 212 Bron :Ministerie van Justitie en Politie, afdeling Criminele Informatie Verzorging Source :Ministry of Justice and Police, Department of Crime Information

218
Tabel 13.6b: Het totale aantal inverzekeringgestelde personen naar aard van misdrijf, leeftijdsklasse en geslacht, 2015 en 2016
Table 13.6b: Total Number of Persons taken into Custody by Type of Crime, Age Group and
Sex, 2015 and 2016
Aard van misdrijf/
2015 Type of Crime 10 -16 j/y 17 – 18 j/y ≥ 19 j/y Totaal /Total
M/M V/F M/M V/F M/M V/F M/M V/F
Misdrijven tegen openbare orde en gezag/
Criminal offences against public order 9 2 23 9 131 25 163 36
Misdrijven tegen leven en personen/
Homicides and Aggravated Assaults 57 2 34 1 1,062 77 1,153 80
Ruwheidsmisdrijven/ Vandalism and Menace 4 1 1 2 120 6 125 9
Sexuele misdrijven/ Sexual Offences 32 - 18 1 166 11 216 12
Vermogensdelicten/ Property Offences 138 5 65 4 1,408 131 1,611 140
Economische Delicten/ Economic Offences - 3 - - 42 2 42 5
Verkeersdelicten / Traffic Offences - - - - 16 1 16 1
Overtreding van de opiumwet/ Drug Offences - - 2 - 66 6 68 6
Overige misdrijven/ Other Crimes - 1 3 - 96 4 99 5
Totaal/ Total 240 14 146 17 3,107 263 3,493 294
Aard van misdrijf/
2016 Type of Crime 10 -16 j/y 17 – 18 j/y ≥ 19 j/y Totaal /Total
M/M V/F M/M V/F M/M V/F M/M V/F
Misdrijven tegen openbare orde en gezag/
Criminal offences against public order 16 3 6 2 108 3 130 8
Misdrijven tegen leven en personen/
Homicides and Aggravated Assaults 63 4 22 4 824 48 909 56
Ruwheidsmisdrijven/ Vandalism and Menace 3 1 2 - 110 5 115 6
Sexuele misdrijven/ Sexual Offences 33 5 19 1 150 4 202 10
Vermogensdelicten/ Property Offences 115 9 45 2 1,246 53 1,406 64
Economische Delicten/ Economic Offences - - 2 - 63 1 65 1
Verkeersdelicten / Traffic Offences - - - - 3 - 3 -
Overtreding van de opiumwet/ Drug Offences 4 1 1 2 91 5 96 8
Overige misdrijven/ Other Crimes - - 1 - 57 12 58 12
Totaal/ Total 234 23 98 11 2,652 131 2,984 165 Bron :Ministerie van Justitie en Politie, afdeling Criminele Informatie Verzorging Source :Ministry of Justice and Police, Department of Crime Information