Embed Size (px)
Citation preview

J AB AT AN P E R AN GK AAN M AL AY S I A
DEPARTMENT OF STATISTICS, MALAYSIA

i
KATA PENGANTAR
Penerbitan ini merupakan usaha julung kali Jabatan Perangkaan Malaysia
menerbitkan data Keluaran Dalam Negeri Kasar (KDNK) mengikut Kaedah
Pendapatan. Statistik yang dibentangkan adalah bagi tempoh 2005 hingga 2013.
Statistik ini menjadi rujukan penting dalam mengukur prestasi ekonomi dari
perspektif pendapatan yang diterima oleh faktor pengeluaran dalam bentuk
Pampasan Pekerja dan Lebihan Kendalian Kasar. Penyusunan ini adalah
berdasarkan konsep yang disarankan oleh Sistem Akaun Negara (SNA) 1993
dan 2008, Pertubuhan Bangsa-Bangsa Bersatu.
Ringkasan penemuan dibentangkan di bahagian pertama penerbitan. Jadual
perangkaan Pampasan Pekerja dan Lebihan Kendalian Kasar mengikut jenis
aktiviti ekonomi dimuatkan pada bahagian kedua laporan ini. Nota teknikal
berkenaan konsep, definisi dan sumber data turut disediakan bagi memudahkan
pemahaman statistik berkenaan.
Jabatan merakamkan setinggi-tinggi penghargaan di atas kerjasama semua
pihak yang terlibat dalam menjayakan penerbitan ini. Sebarang cadangan dan
pandangan ke arah memperbaiki penerbitan ini pada masa hadapan amatlah
dihargai.
Datuk Dr. Haji Abdul Rahman Hasan
Ketua Perangkawan
Malaysia
Julai 2014
ii
PREFACE
This publication is the first attempt by the Department of Statistics, Malaysia
to publish data on Gross Domestic Product (GDP) by Income Approach.
The statistics presented is for the period of 2005 to 2013.
These statistics serve as an essential reference in gauging the economy from the
perspective of income received by factors of production in the form of
Compensation of Employees and Gross Operating Surplus. This compilation was
based on the concepts recommended by System of National Accounts (SNA)
1993 and 2008, United Nations.
Summary findings are highlighted in the first part of the publication. Statistical
tables on Compensation of Employees and Gross Operating Surplus by kind of
economic activity are included in the second part of this report. Technical notes
on concepts, definition and data sources are also provided in facilitating better
understanding of the statistics.
The Department gratefully acknowledges the cooperation of all parties concerned
in realising this publication. All comments and suggestions towards improving
future publications are greatly appreciated.
Datuk Dr. Haji Abdul Rahman Hasan
Chief Statistician
Malaysia
July 2014
iii
SINGKATAN/ ABBREVIATIONS
KDNK : Keluaran Dalam Negeri Kasar
SNA : Sistem Akaun Negara
PP : Pampasan Pekerja
GDP : Gross Domestic Product
SNA : System of National Accounts
CE : Compensation of Employees
GOS : Gross Operating Surplus
etc : and others
SIMBOL/ SYMBOLS
e : Anggaran/ Estimate
p : Permulaan/ Preliminary
NOTA/ NOTE
Jumlah angka komponen mungkin tidak bersamaan dengan angka jumlah kecil atau
jumlah besar disebabkan pembundaran angka.
The sum of the component figures may not tally with the sub-total or total figures due to
rounding.
iv
KANDUNGAN CONTENTS
Muka Surat Page
KATA PENGANTAR PREFACE
i
SINGKATAN ABBREVIATIONS
iii
KANDUNGAN CONTENTS
iv
SEKSYEN 1: RINGKASAN PENEMUAN SECTION 1: SUMMARY FINDINGS
1
SEKSYEN 2: JADUAL SECTION 2: TABLES
Jadual 1: Table 1:
Komponen Pendapatan bagi KDNK pada Harga Semasa Income Components of GDP at Current Prices
11
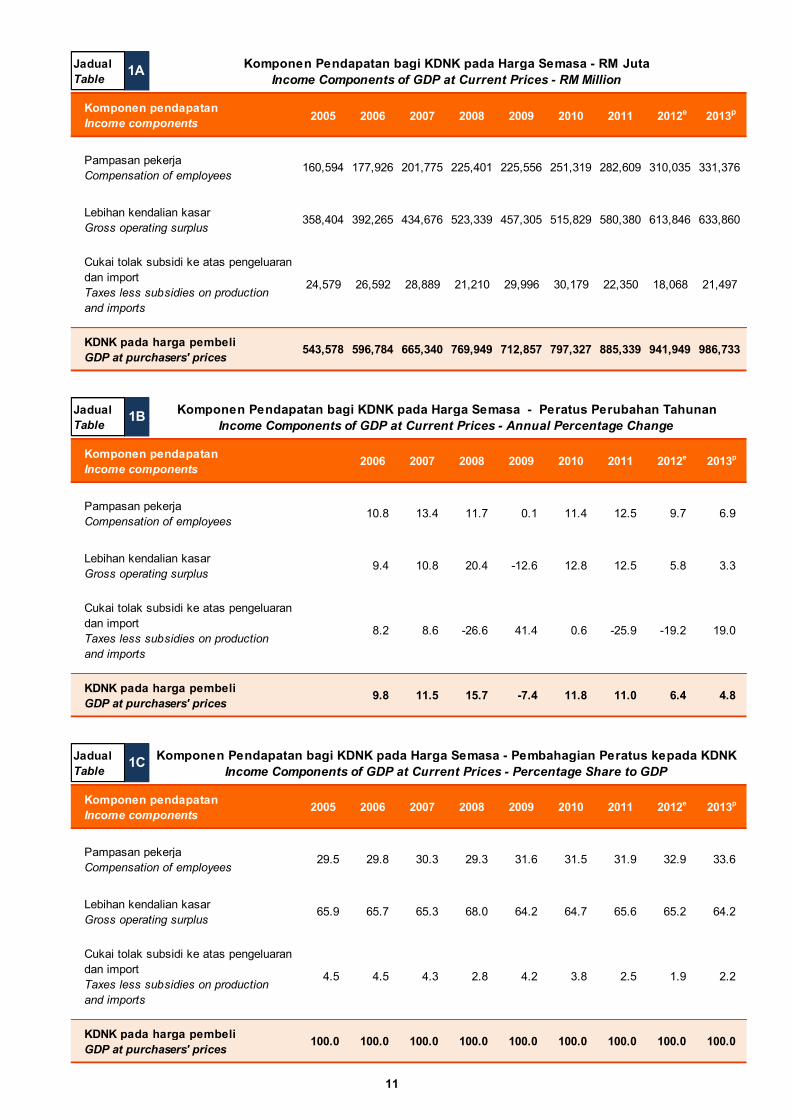
1A Komponen Pendapatan bagi KDNK pada Harga Semasa - RM Juta Income Components of GDP at Current Prices - RM Million
1B Komponen Pendapatan bagi KDNK pada Harga Semasa - Peratus Perubahan Tahunan Income Components of GDP at Current Prices - Annual Percentage Change
1C Komponen Pendapatan bagi KDNK pada Harga Semasa - Pembahagian Peratus kepada KDNK Income Components of GDP at Current Prices - Percentage Share to GDP
Jadual 2: Table 2:
Komponen Pendapatan mengikut Jenis Aktiviti Ekonomi pada Harga Semasa Income Components by Kind of Economic Activity at Current Prices
12
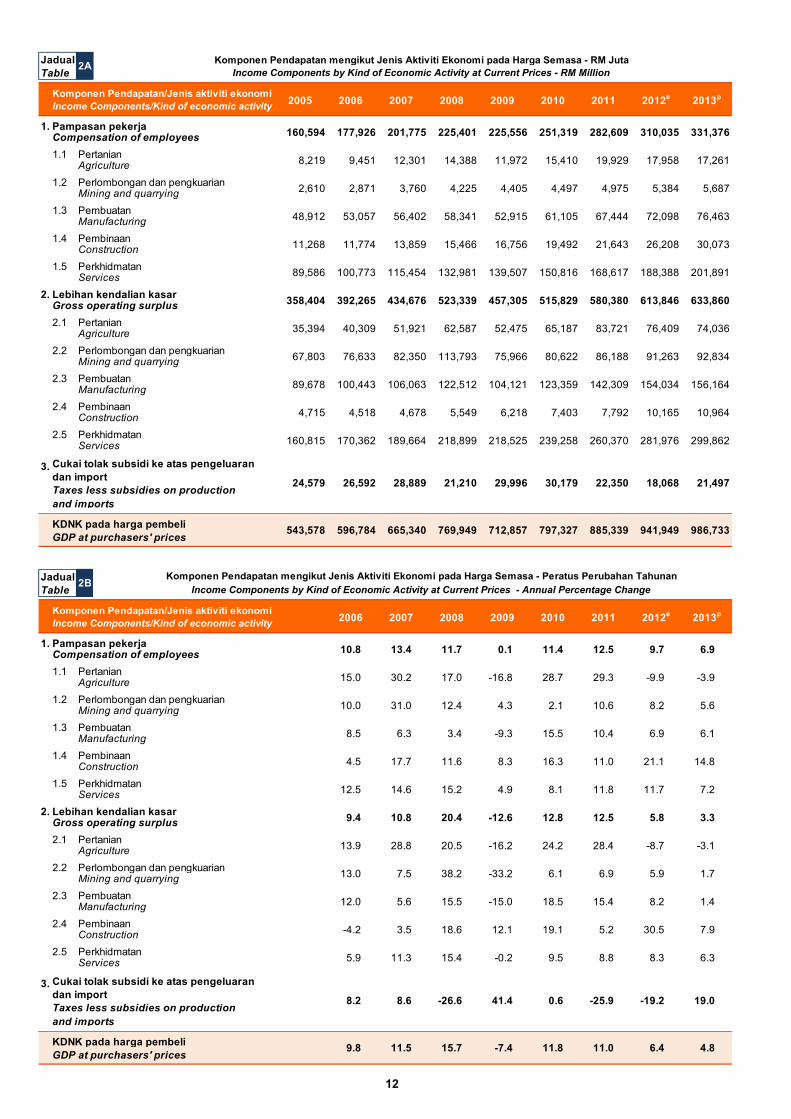
2A Komponen Pendapatan mengikut Jenis Aktiviti Ekonomi pada Harga Semasa - RM Juta Income Components by Kind of Economic Activity at Current Prices - RM Million
2B Komponen Pendapatan mengikut Jenis Aktiviti Ekonomi pada Harga Semasa - Peratus Perubahan Tahunan Income Components by Kind of Economic Activity at Current Prices - Annual Percentage Change
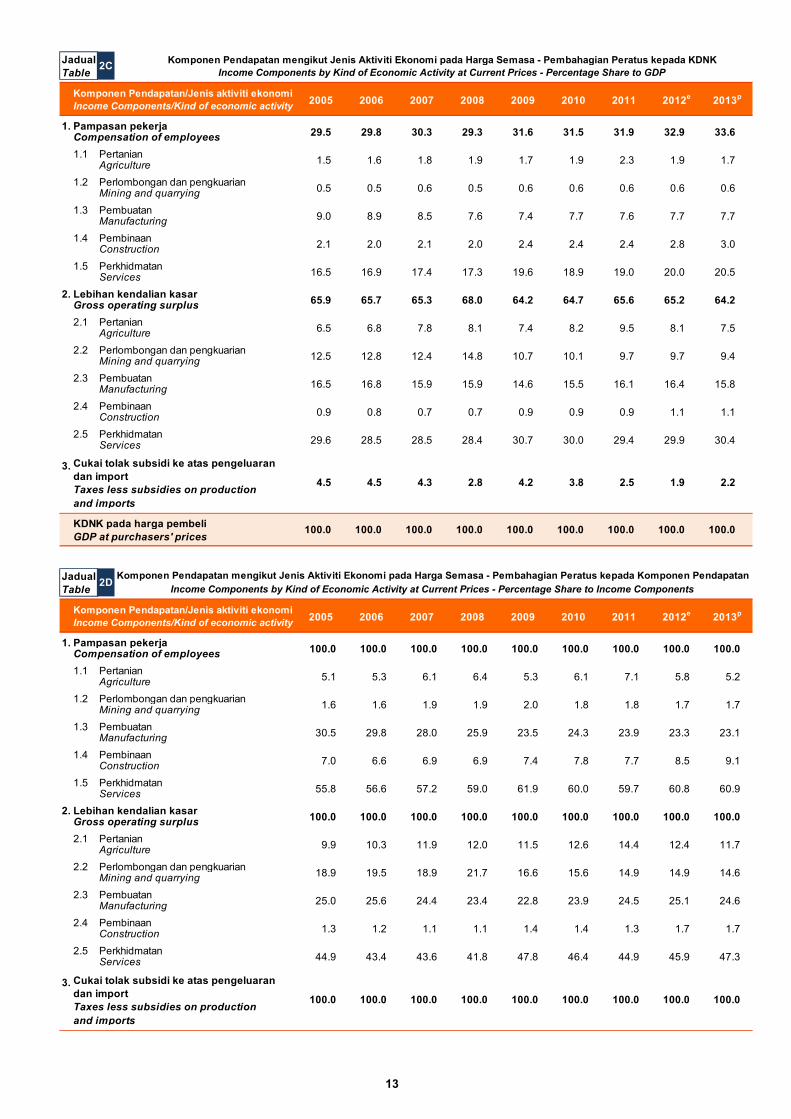
2C Komponen Pendapatan mengikut Jenis Aktiviti Ekonomi pada Harga Semasa - Pembahagian Peratus kepada KDNK Income Components by Kind of Economic Activity at Current Prices - Percentage Share to GDP
2D Komponen Pendapatan mengikut Jenis Aktiviti Ekonomi pada Harga Semasa - Pembahagian Peratus kepada Komponen Pendapatan Income Components by Kind of Economic Activity at Current Prices - Percentage Share to Income Components
Pampasan Pekerja mengikut Jenis Aktiviti Ekonomi pada Harga Semasa Compensation of Employees by Kind of Economic Activity at Current Prices
14 Jadual 3: Table 3:
3A Pampasan Pekerja mengikut Jenis Aktiviti Ekonomi pada Harga Semasa - RM Juta Compensation of Employees by Kind of Economic Activity at Current Prices - RM Million
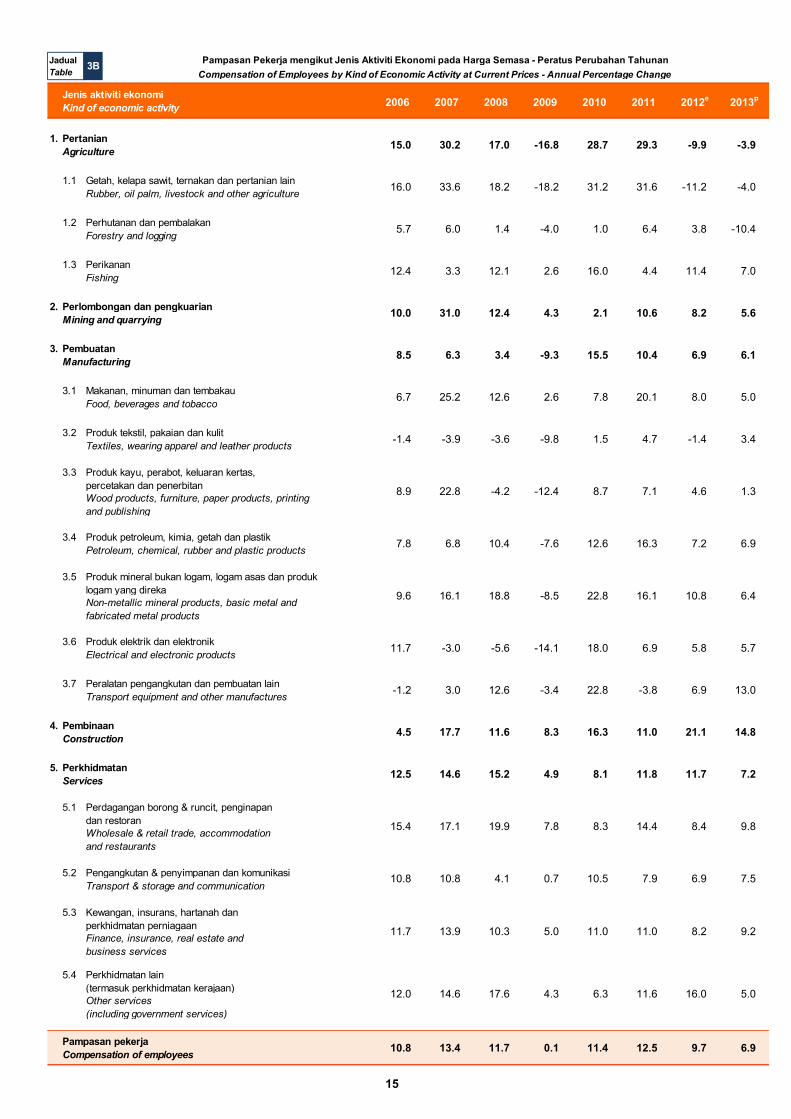
3B Pampasan Pekerja mengikut Jenis Aktiviti Ekonomi pada Harga Semasa - Peratus Perubahan Tahunan Compensation of Employees by Kind of Economic Activity at Current Prices - Annual Percentage Change
v
JADUAL TABLES
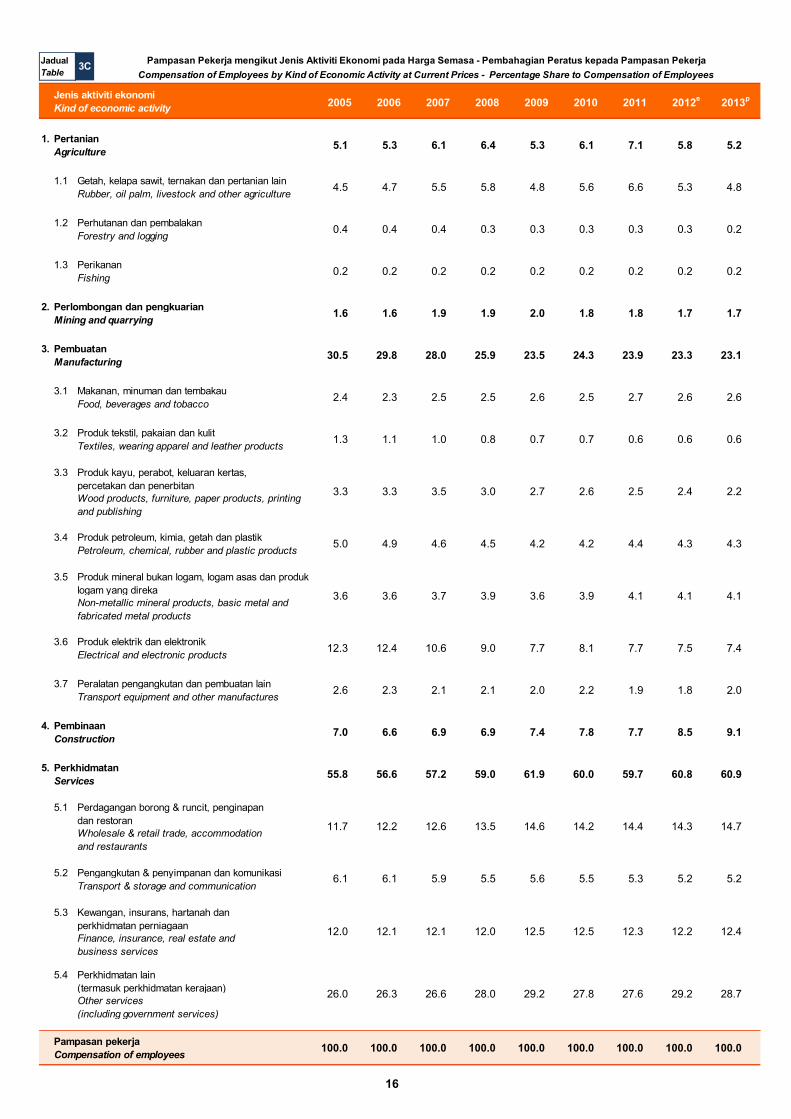
3C Pampasan Pekerja mengikut Jenis Aktiviti Ekonomi pada Harga Semasa - Pembahagian Peratus kepada Pampasan Pekerja Compensation of Employees by Kind of Economic Activity at Current Prices - Percentage Share to Compensation of Employees
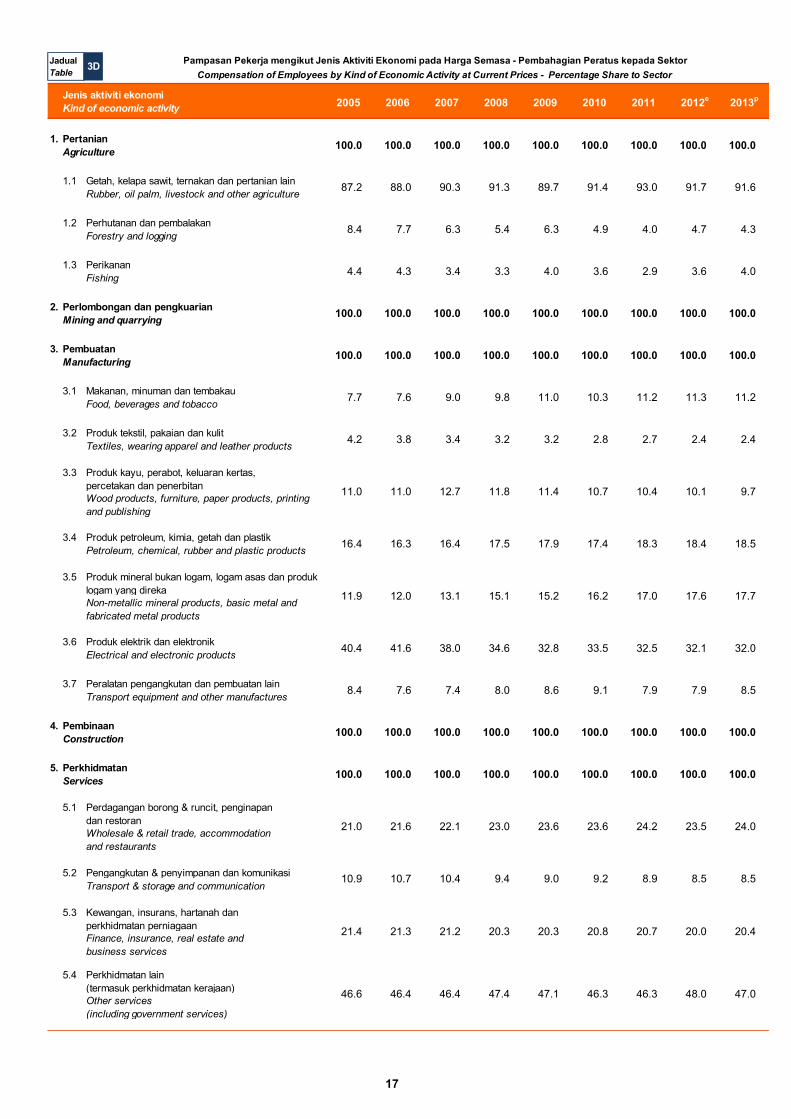
3D Pampasan Pekerja mengikut Jenis Aktiviti Ekonomi pada Harga Semasa - Pembahagian Peratus kepada Sektor Compensation of Employees by Kind of Economic Activity at Current Prices - Percentage Share to Sector
Lebihan Kendalian Kasar mengikut Jenis Aktiviti Ekonomi pada Harga Semasa Gross Operating Surplus by Kind of Economic Activity at Current Prices
18 Jadual 4: Table 4:
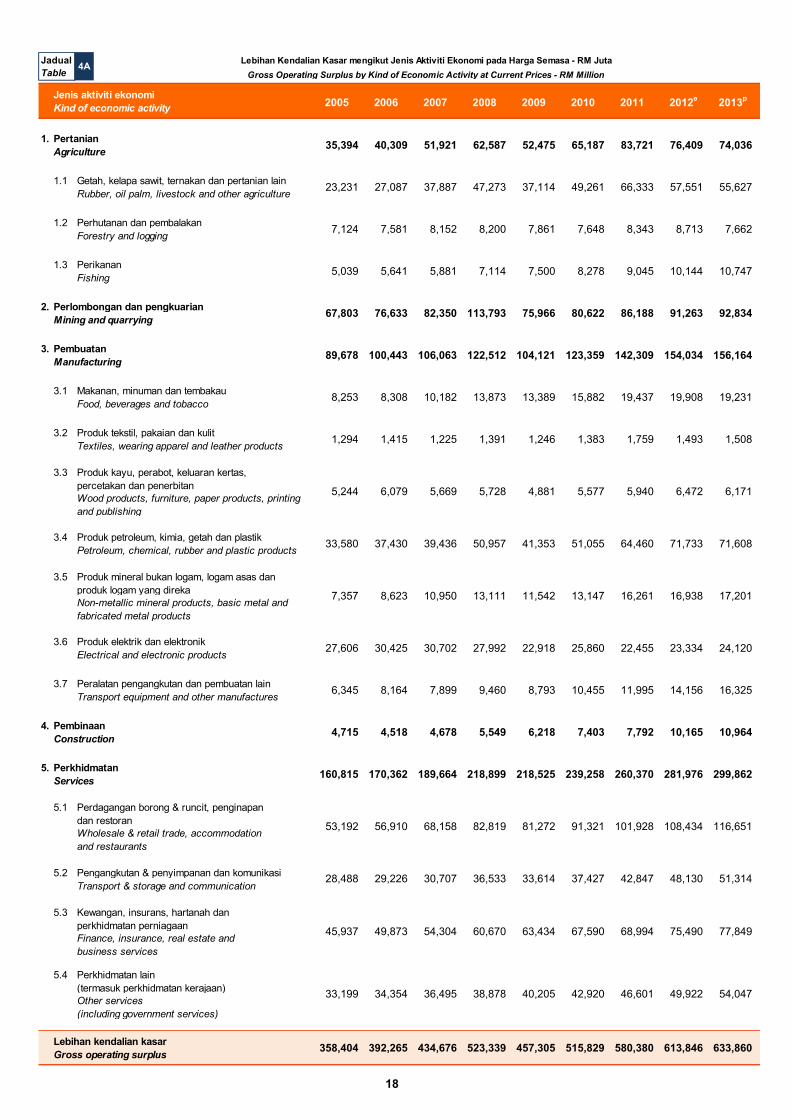
4A Lebihan Kendalian Kasar mengikut Jenis Aktiviti Ekonomi pada Harga Semasa - RM Juta Gross Operating Surplus by Kind of Economic Activity at Current Prices - RM Million
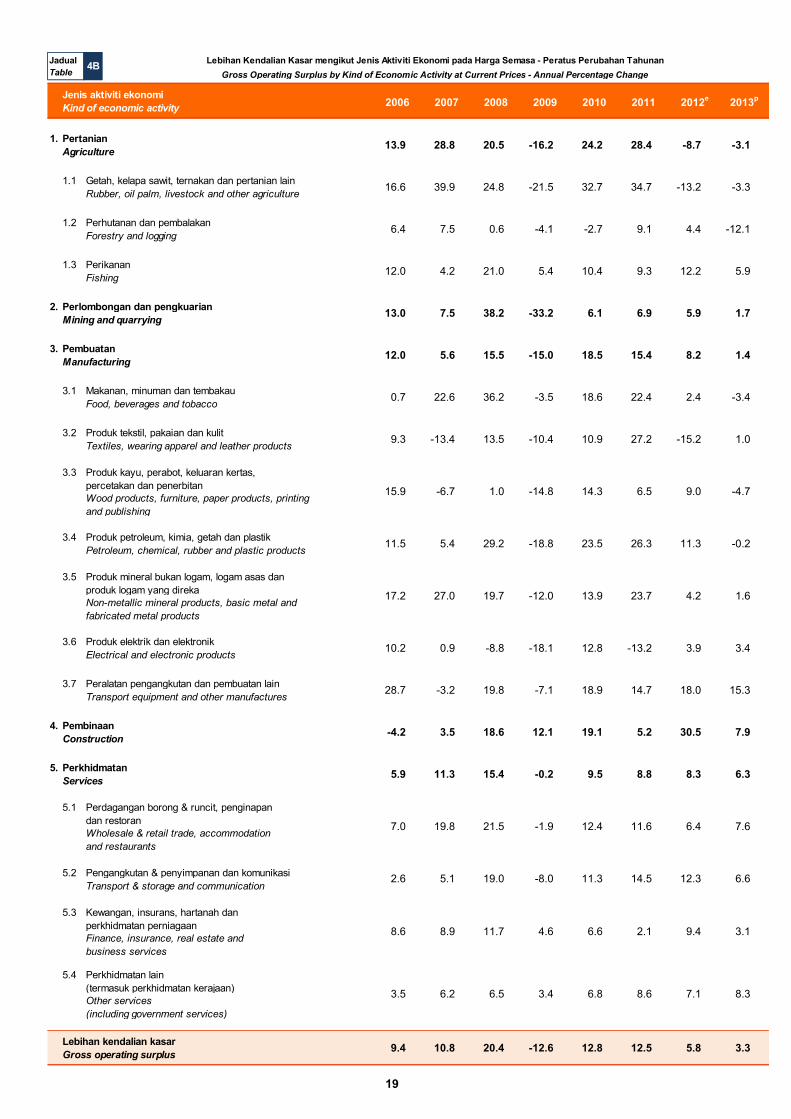
4B Lebihan Kendalian Kasar mengikut Jenis Aktiviti Ekonomi pada Harga Semasa - Peratus Perubahan Tahunan Gross Operating Surplus by Kind of Economic Activity at Current Prices - Annual Percentage Change
4C Lebihan Kendalian Kasar mengikut Jenis Aktiviti Ekonomi pada Harga Semasa - Pembahagian Peratus kepada Lebihan Kendalian Kasar Gross Operating Surplus by Kind of Economic Activity at Current Prices - Percentage Share to Gross Operating Surplus
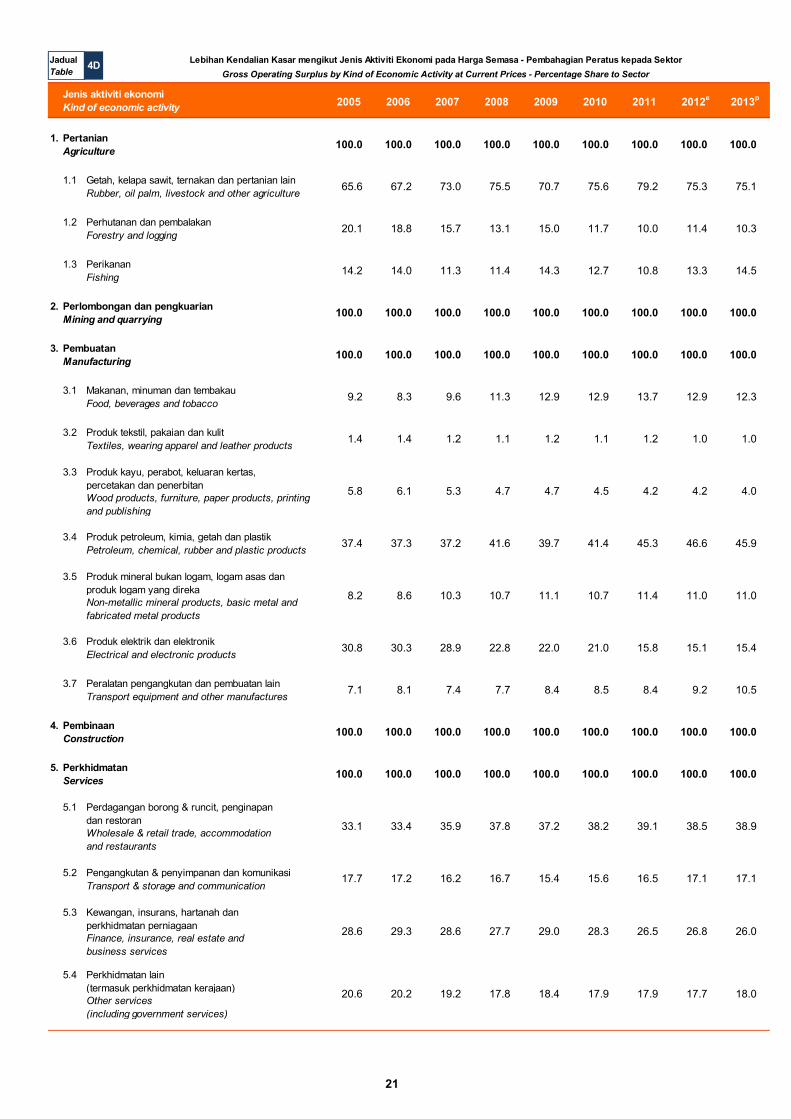
4D Lebihan Kendalian Kasar mengikut Jenis Aktiviti Ekonomi pada Harga Semasa - Pembahagian Peratus kepada Sektor Gross Operating Surplus by Kind of Economic Activity at Current Prices - Percentage Share to Sector
SEKSYEN 3: NOTA TEKNIKAL SECTION 3: TECHNICAL NOTES
23
SEKSYEN 4: SUMBER DATA SECTION 4: DATA SOURCES
35
Muka Surat Page
KANDUNGAN CONTENTS

vi
Muka surat ini sengaja dibiarkan kosong This page is deliberately left blank
1 1 RINGKASAN PENEMUAN
SUMMARY FINDINGS
2005-2013 GDP INCOME APPROACH KDNK KAEDAH PENDAPATAN

RINGKASAN PENEMUAN
1
2. PRESTASI KESELURUHAN 2013
1. PENGENALAN
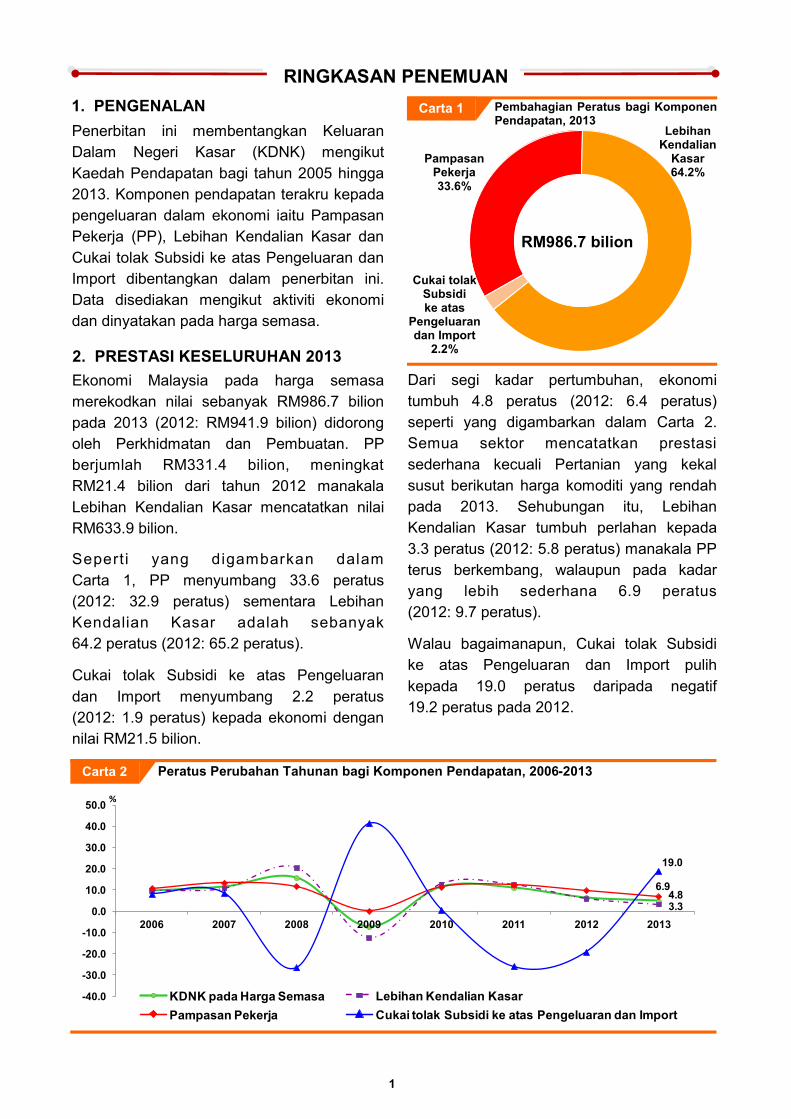
Penerbitan ini membentangkan Keluaran
Dalam Negeri Kasar (KDNK) mengikut
Kaedah Pendapatan bagi tahun 2005 hingga
2013. Komponen pendapatan terakru kepada
pengeluaran dalam ekonomi iaitu Pampasan
Pekerja (PP), Lebihan Kendalian Kasar dan
Cukai tolak Subsidi ke atas Pengeluaran dan
Import dibentangkan dalam penerbitan ini.
Data disediakan mengikut aktiviti ekonomi
dan dinyatakan pada harga semasa.
RM986.7 bilion
Pembahagian Peratus bagi Komponen Pendapatan, 2013 Carta 1
Ekonomi Malaysia pada harga semasa
merekodkan nilai sebanyak RM986.7 bilion
pada 2013 (2012: RM941.9 bilion) didorong
oleh Perkhidmatan dan Pembuatan. PP
berjumlah RM331.4 bilion, meningkat
RM21.4 bilion dari tahun 2012 manakala
Lebihan Kendalian Kasar mencatatkan nilai
RM633.9 bilion.
Seperti yang digambarkan dalam
Carta 1, PP menyumbang 33.6 peratus
(2012: 32.9 peratus) sementara Lebihan
Kendalian Kasar adalah sebanyak
64.2 peratus (2012: 65.2 peratus).
Cukai tolak Subsidi ke atas Pengeluaran
dan Import menyumbang 2.2 peratus
(2012: 1.9 peratus) kepada ekonomi dengan
nilai RM21.5 bilion.
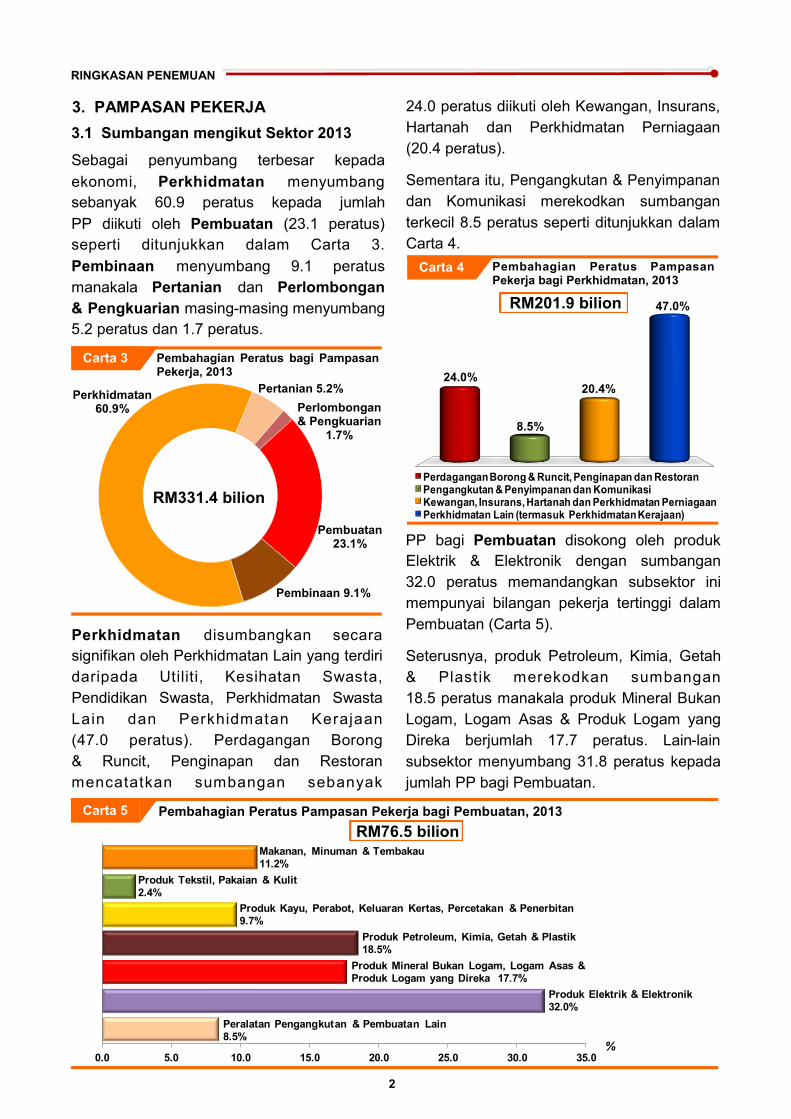
Dari segi kadar pertumbuhan, ekonomi
tumbuh 4.8 peratus (2012: 6.4 peratus)
seperti yang digambarkan dalam Carta 2.
Semua sektor mencatatkan prestasi
sederhana kecuali Pertanian yang kekal
susut berikutan harga komoditi yang rendah
pada 2013. Sehubungan itu, Lebihan
Kendalian Kasar tumbuh perlahan kepada
3.3 peratus (2012: 5.8 peratus) manakala PP
terus berkembang, walaupun pada kadar
yang lebih sederhana 6.9 peratus
(2012: 9.7 peratus).
Walau bagaimanapun, Cukai tolak Subsidi
ke atas Pengeluaran dan Import pulih
kepada 19.0 peratus daripada negatif
19.2 peratus pada 2012.
Pampasan Pekerja 33.6%
Cukai tolak Subsidi ke atas
Pengeluaran dan Import
2.2%
Lebihan Kendalian
Kasar 64.2%
4.83.3
6.9
19.0
-40.0
-30.0
-20.0
-10.0
0.0
10.0
20.0
30.0
40.0
50.0
2006 2007 2008 2009 2010 2011 2012 2013
%
Peratus Perubahan Tahunan bagi Komponen Pendapatan, 2006-2013 Carta 2
4.83.3
6.919.0
-40
-30
-20
-10
0
10
20
30
40
50
28-Jun-05 29-Jun-05 30-Jun-05 1-Jul-05 2-Jul-05 3-Jul-05 4-Jul-05 5-Jul-05
KDNK pada Harga Semasa Lebihan Kendalian Kasar
Pampasan Pekerja Cukai tolak Subsidi ke atas Pengeluaran dan Import
%
4.83.3
6.919.0
-40
-30
-20
-10
0
10
20
30
40
50
28-Jun-05 29-Jun-05 30-Jun-05 1-Jul-05 2-Jul-05 3-Jul-05 4-Jul-05 5-Jul-05
KDNK pada Harga Semasa Lebihan Kendalian Kasar
Pampasan Pekerja Cukai tolak Subsidi ke atas Pengeluaran dan Import
%
RINGKASAN PENEMUAN
2
Pembahagian Peratus bagi Pampasan Pekerja, 2013
RM331.4 bilion
Carta 3
Pertanian 5.2%
Perlombongan & Pengkuarian
1.7%
Pembuatan 23.1%
Pembinaan 9.1%
Perkhidmatan 60.9%
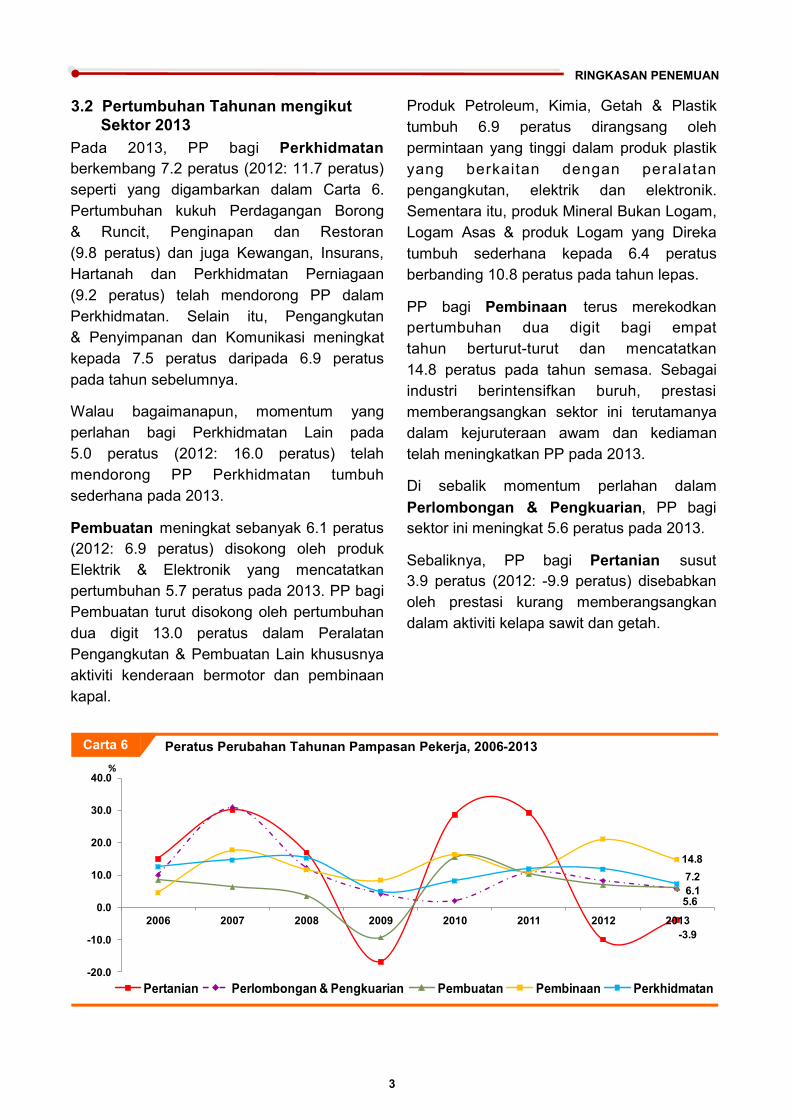
3. PAMPASAN PEKERJA
3.1 Sumbangan mengikut Sektor 2013
Sebagai penyumbang terbesar kepada
ekonomi, Perkhidmatan menyumbang
sebanyak 60.9 peratus kepada jumlah
PP diikuti oleh Pembuatan (23.1 peratus)
seperti ditunjukkan dalam Carta 3.
Pembinaan menyumbang 9.1 peratus
manakala Pertanian dan Perlombongan
& Pengkuarian masing-masing menyumbang
5.2 peratus dan 1.7 peratus.
PP bagi Pembuatan disokong oleh produk
Elektrik & Elektronik dengan sumbangan
32.0 peratus memandangkan subsektor ini
mempunyai bilangan pekerja tertinggi dalam
Pembuatan (Carta 5).
Seterusnya, produk Petroleum, Kimia, Getah
& Plastik merekodkan sumbangan
18.5 peratus manakala produk Mineral Bukan
Logam, Logam Asas & Produk Logam yang
Direka berjumlah 17.7 peratus. Lain-lain
subsektor menyumbang 31.8 peratus kepada
jumlah PP bagi Pembuatan.
24.0 peratus diikuti oleh Kewangan, Insurans,
Hartanah dan Perkhidmatan Perniagaan
(20.4 peratus).
Sementara itu, Pengangkutan & Penyimpanan
dan Komunikasi merekodkan sumbangan
terkecil 8.5 peratus seperti ditunjukkan dalam
Carta 4.
Perkhidmatan disumbangkan secara
signifikan oleh Perkhidmatan Lain yang terdiri
daripada Utiliti, Kesihatan Swasta,
Pendidikan Swasta, Perkhidmatan Swasta
Lain dan Perkhidmatan Kerajaan
(47.0 peratus). Perdagangan Borong
& Runcit, Penginapan dan Restoran
mencatatkan sumbangan sebanyak
0.0 5.0 10.0 15.0 20.0 25.0 30.0 35.0
Makanan, Minuman & Tembakau
11.2%
Produk Tekstil, Pakaian & Kulit
2.4%
Produk Kayu, Perabot, Keluaran Kertas, Percetakan & Penerbitan
9.7%
Produk Petroleum, Kimia, Getah & Plastik
18.5%
Produk Mineral Bukan Logam, Logam Asas &
Produk Logam yang Direka 17.7%
Produk Elektrik & Elektronik
32.0%
Peralatan Pengangkutan & Pembuatan Lain
8.5%%
Pembahagian Peratus Pampasan Pekerja bagi Pembuatan, 2013 Carta 5
RM76.5 bilion
Carta 4
RM201.9 bilion
Pembahagian Peratus Pampasan Pekerja bagi Perkhidmatan, 2013
24.0%
8.5%
20.4%
47.0%
Perdagangan Borong & Runcit, Penginapan dan Restoran Pengangkutan & Penyimpanan dan Komunikasi Kewangan, Insurans, Hartanah dan Perkhidmatan Perniagaan Perkhidmatan Lain (termasuk Perkhidmatan Kerajaan)
24.0%
8.5%
20.4%
47.0%
RINGKASAN PENEMUAN
3
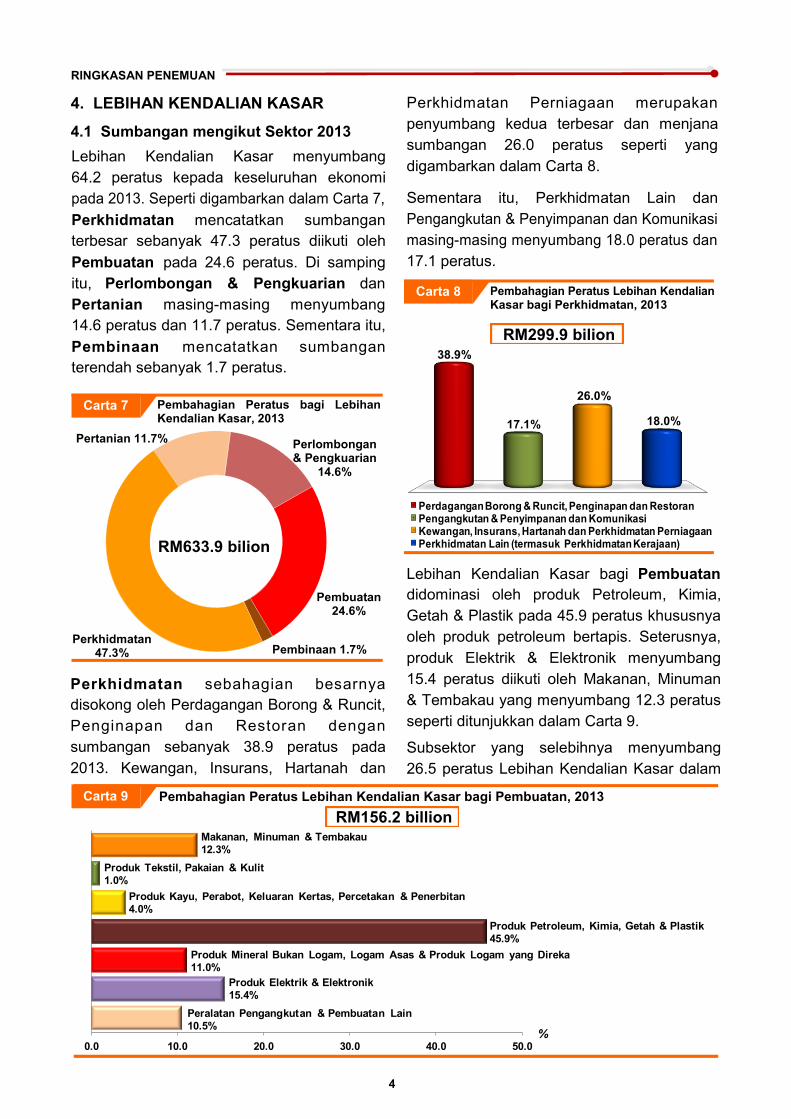
Produk Petroleum, Kimia, Getah & Plastik
tumbuh 6.9 peratus dirangsang oleh
permintaan yang tinggi dalam produk plastik
yang berkaitan dengan peralatan
pengangkutan, elektrik dan elektronik.
Sementara itu, produk Mineral Bukan Logam,
Logam Asas & produk Logam yang Direka
tumbuh sederhana kepada 6.4 peratus
berbanding 10.8 peratus pada tahun lepas.
PP bagi Pembinaan terus merekodkan
pertumbuhan dua digit bagi empat
tahun berturut-turut dan mencatatkan
14.8 peratus pada tahun semasa. Sebagai
industri berintensifkan buruh, prestasi
memberangsangkan sektor ini terutamanya
dalam kejuruteraan awam dan kediaman
telah meningkatkan PP pada 2013.
Di sebalik momentum perlahan dalam
Perlombongan & Pengkuarian, PP bagi
sektor ini meningkat 5.6 peratus pada 2013.
Sebaliknya, PP bagi Pertanian susut
3.9 peratus (2012: -9.9 peratus) disebabkan
oleh prestasi kurang memberangsangkan
dalam aktiviti kelapa sawit dan getah.
3.2 Pertumbuhan Tahunan mengikut
Sektor 2013
Pada 2013, PP bagi Perkhidmatan
berkembang 7.2 peratus (2012: 11.7 peratus)
seperti yang digambarkan dalam Carta 6.
Pertumbuhan kukuh Perdagangan Borong
& Runcit, Penginapan dan Restoran
(9.8 peratus) dan juga Kewangan, Insurans,
Hartanah dan Perkhidmatan Perniagaan
(9.2 peratus) telah mendorong PP dalam
Perkhidmatan. Selain itu, Pengangkutan
& Penyimpanan dan Komunikasi meningkat
kepada 7.5 peratus daripada 6.9 peratus
pada tahun sebelumnya.
Walau bagaimanapun, momentum yang
perlahan bagi Perkhidmatan Lain pada
5.0 peratus (2012: 16.0 peratus) telah
mendorong PP Perkhidmatan tumbuh
sederhana pada 2013.
Pembuatan meningkat sebanyak 6.1 peratus
(2012: 6.9 peratus) disokong oleh produk
Elektrik & Elektronik yang mencatatkan
pertumbuhan 5.7 peratus pada 2013. PP bagi
Pembuatan turut disokong oleh pertumbuhan
dua digit 13.0 peratus dalam Peralatan
Pengangkutan & Pembuatan Lain khususnya
aktiviti kenderaan bermotor dan pembinaan
kapal.
-3.9
5.66.1
14.8
7.2
-20.0
-10.0
0.0
10.0
20.0
30.0
40.0
2006 2007 2008 2009 2010 2011 2012 2013
%
Peratus Perubahan Tahunan Pampasan Pekerja, 2006-2013 Carta 6
-3.9
5.66.1
14.8
7.2
-20
-10
0
10
20
30
40
28-Jun-05 29-Jun-05 30-Jun-05 1-Jul-05 2-Jul-05 3-Jul-05 4-Jul-05 5-Jul-05
Pertanian Perlombongan & Pengkuarian Pembuatan Pembinaan Perkhidmatan
%
RINGKASAN PENEMUAN
4
4. LEBIHAN KENDALIAN KASAR
4.1 Sumbangan mengikut Sektor 2013
0.0 10.0 20.0 30.0 40.0 50.0%
Makanan, Minuman & Tembakau
12.3%
Produk Tekstil, Pakaian & Kulit
1.0%
Produk Kayu, Perabot, Keluaran Kertas, Percetakan & Penerbitan
4.0%
Produk Petroleum, Kimia, Getah & Plastik
45.9%
Produk Mineral Bukan Logam, Logam Asas & Produk Logam yang Direka
11.0%
Produk Elektrik & Elektronik
15.4%
Peralatan Pengangkutan & Pembuatan Lain
10.5%
Pembahagian Peratus Lebihan Kendalian Kasar bagi Pembuatan, 2013
Carta 9
RM156.2 billion
Lebihan Kendalian Kasar bagi Pembuatan
didominasi oleh produk Petroleum, Kimia,
Getah & Plastik pada 45.9 peratus khususnya
oleh produk petroleum bertapis. Seterusnya,
produk Elektrik & Elektronik menyumbang
15.4 peratus diikuti oleh Makanan, Minuman
& Tembakau yang menyumbang 12.3 peratus
seperti ditunjukkan dalam Carta 9.
Subsektor yang selebihnya menyumbang
26.5 peratus Lebihan Kendalian Kasar dalam
Lebihan Kendalian Kasar menyumbang
64.2 peratus kepada keseluruhan ekonomi
pada 2013. Seperti digambarkan dalam Carta 7,
Perkhidmatan mencatatkan sumbangan
terbesar sebanyak 47.3 peratus diikuti oleh
Pembuatan pada 24.6 peratus. Di samping
itu, Perlombongan & Pengkuarian dan
Pertanian masing-masing menyumbang
14.6 peratus dan 11.7 peratus. Sementara itu,
Pembinaan mencatatkan sumbangan
terendah sebanyak 1.7 peratus.
Perkhidmatan Perniagaan merupakan
penyumbang kedua terbesar dan menjana
sumbangan 26.0 peratus seperti yang
digambarkan dalam Carta 8.
Sementara itu, Perkhidmatan Lain dan
Pengangkutan & Penyimpanan dan Komunikasi
masing-masing menyumbang 18.0 peratus dan
17.1 peratus.
Carta 8 Pembahagian Peratus Lebihan Kendalian Kasar bagi Perkhidmatan, 2013
RM299.9 bilion
24.0%
8.5%
20.4%
47.0%
Perdagangan Borong & Runcit, Penginapan dan Restoran Pengangkutan & Penyimpanan dan Komunikasi Kewangan, Insurans, Hartanah dan Perkhidmatan Perniagaan Perkhidmatan Lain (termasuk Perkhidmatan Kerajaan)
38.9%
17.1%
26.0%
18.0%
Pembahagian Peratus bagi Lebihan Kendalian Kasar, 2013
RM633.9 bilion
Carta 7
Pertanian 11.7%
Pembuatan 24.6%
Pembinaan 1.7% Perkhidmatan
47.3%
Perlombongan & Pengkuarian
14.6%
Perkhidmatan sebahagian besarnya
disokong oleh Perdagangan Borong & Runcit,
Penginapan dan Restoran dengan
sumbangan sebanyak 38.9 peratus pada
2013. Kewangan, Insurans, Hartanah dan
RINGKASAN PENEMUAN
5
-3.1
1.7
1.4
7.9
6.3
-40.0
-30.0
-20.0
-10.0
0.0
10.0
20.0
30.0
40.0
50.0
2006 2007 2008 2009 2010 2011 2012 2013
%
Peratus Perubahan Tahunan Lebihan Kendalian Kasar, 2006-2013 Carta 10
-3.1
1.7
1.4
7.9
6.3
-40.0
-30.0
-20.0
-10.0
0.0
10.0
20.0
30.0
40.0
50.0
2006 2007 2008 2009 2010 2011 2012 2013
Pertanian Perlombongan & Pengkuarian Pembuatan Pembinaan Perkhidmatan
%
Pembuatan dengan 11.0 peratus disumbangkan
oleh produk Mineral Bukan Logam, Logam
Asas & produk Logam yang Direka.
Pembuatan tumbuh 1.4 peratus disokong
oleh pertumbuhan kukuh 15.3 peratus dalam
Peralatan Pengangkutan & Pembuatan Lain.
Begitu juga, produk Elektrik & Elektronik dan
produk Mineral Bukan Logam, Logam Asas
& produk Logam yang Direka menyokong
pertumbuhan dengan masing-masing
mencatatkan 3.4 peratus dan 1.6 peratus.
Walau bagaimanapun, produk Petroleum,
Kimia, Getah & Plastik susut 0.2 peratus
disebabkan oleh pengurangan permintaan
dan pengeluaran yang rendah dalam produk
petroleum bertapis. Oleh itu, ini telah
menjejaskan Lebihan Kendalian Kasar
Pembuatan pada 2013.
Sementara itu, pengeluaran yang rendah bagi
minyak mentah dan kondensat telah
menyebabkan Lebihan Kendalian Kasar
dalam Perlombongan & Pengkuarian
mencatatkan pertumbuhan perlahan
1.7 peratus (2012: 5.9 peratus).
Pembinaan meningkat sebanyak 7.9 peratus
(2012: 30.5 peratus) disokong oleh aktiviti
kejuruteraan awam dan kediaman.
Lebihan Kendalian Kasar dalam Pertanian
amat dipengaruhi oleh harga komoditi dan
pengeluaran. Justeru itu, Lebihan Kendalian
Kasar bagi sektor ini mencatatkan negatif
3.1 peratus (2012: -8.7 peratus) berikutan
kejatuhan harga komoditi pada 2013.
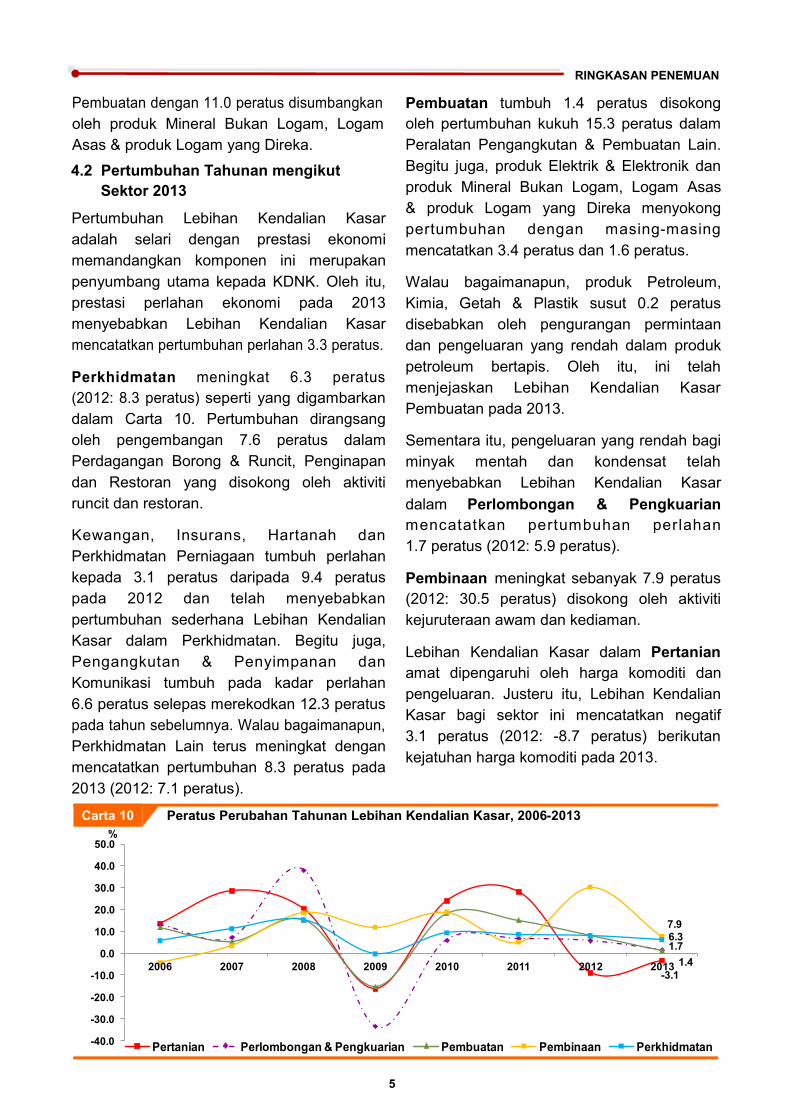
Pertumbuhan Lebihan Kendalian Kasar
adalah selari dengan prestasi ekonomi
memandangkan komponen ini merupakan
penyumbang utama kepada KDNK. Oleh itu,
prestasi perlahan ekonomi pada 2013
menyebabkan Lebihan Kendalian Kasar
mencatatkan pertumbuhan perlahan 3.3 peratus.
Perkhidmatan meningkat 6.3 peratus
(2012: 8.3 peratus) seperti yang digambarkan
dalam Carta 10. Pertumbuhan dirangsang
oleh pengembangan 7.6 peratus dalam
Perdagangan Borong & Runcit, Penginapan
dan Restoran yang disokong oleh aktiviti
runcit dan restoran.
Kewangan, Insurans, Hartanah dan
Perkhidmatan Perniagaan tumbuh perlahan
kepada 3.1 peratus daripada 9.4 peratus
pada 2012 dan telah menyebabkan
pertumbuhan sederhana Lebihan Kendalian
Kasar dalam Perkhidmatan. Begitu juga,
Pengangkutan & Penyimpanan dan
Komunikasi tumbuh pada kadar perlahan
6.6 peratus selepas merekodkan 12.3 peratus
pada tahun sebelumnya. Walau bagaimanapun,
Perkhidmatan Lain terus meningkat dengan
mencatatkan pertumbuhan 8.3 peratus pada
2013 (2012: 7.1 peratus).
4.2 Pertumbuhan Tahunan mengikut
Sektor 2013
SUMMARY FINDINGS
6
1. INTRODUCTION
2. OVERALL PERFORMANCE 2013
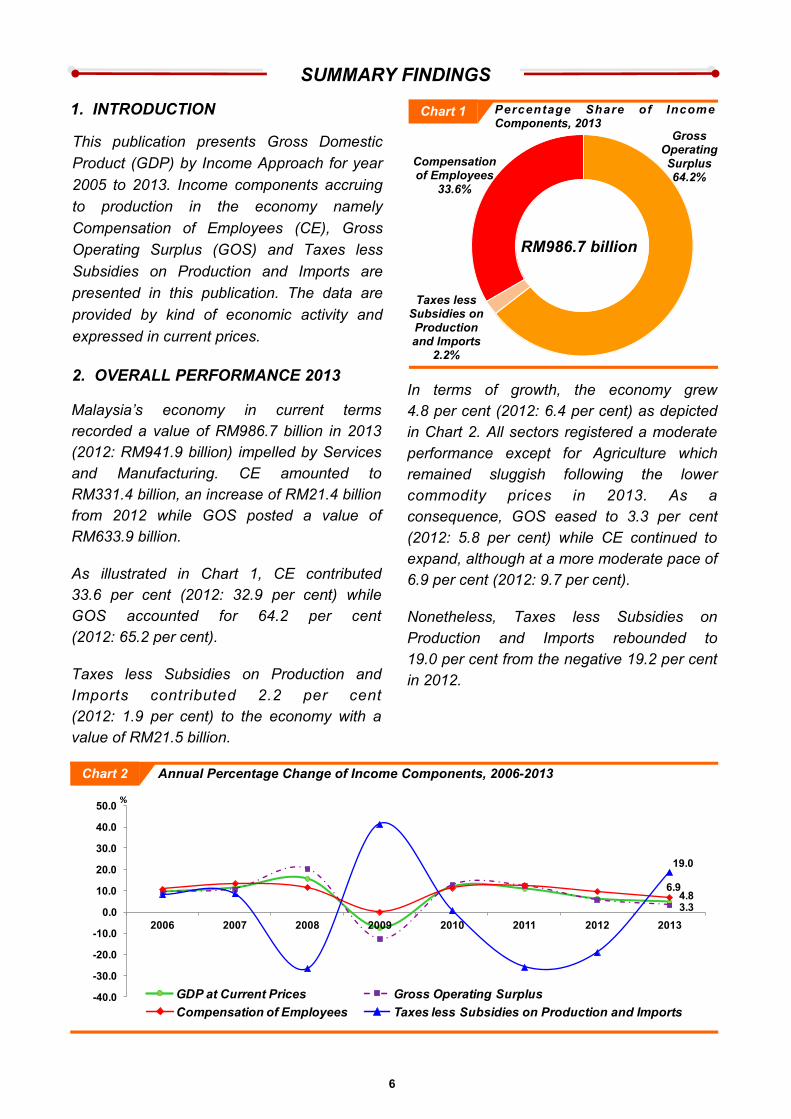
This publication presents Gross Domestic
Product (GDP) by Income Approach for year
2005 to 2013. Income components accruing
to production in the economy namely
Compensation of Employees (CE), Gross
Operating Surplus (GOS) and Taxes less
Subsidies on Production and Imports are
presented in this publication. The data are
provided by kind of economic activity and
expressed in current prices.
In terms of growth, the economy grew
4.8 per cent (2012: 6.4 per cent) as depicted
in Chart 2. All sectors registered a moderate
performance except for Agriculture which
remained sluggish following the lower
commodity prices in 2013. As a
consequence, GOS eased to 3.3 per cent
(2012: 5.8 per cent) while CE continued to
expand, although at a more moderate pace of
6.9 per cent (2012: 9.7 per cent).
Nonetheless, Taxes less Subsidies on
Production and Imports rebounded to
19.0 per cent from the negative 19.2 per cent
in 2012.
Malaysia’s economy in current terms
recorded a value of RM986.7 billion in 2013
(2012: RM941.9 billion) impelled by Services
and Manufacturing. CE amounted to
RM331.4 billion, an increase of RM21.4 billion
from 2012 while GOS posted a value of
RM633.9 billion.
As illustrated in Chart 1, CE contributed
33.6 per cent (2012: 32.9 per cent) while
GOS accounted for 64.2 per cent
(2012: 65.2 per cent).
Taxes less Subsidies on Production and
Imports contributed 2.2 per cent
(2012: 1.9 per cent) to the economy with a
value of RM21.5 billion.
Percentage Share of Income Components, 2013 Chart 1
RM986.7 billion
Compensation of Employees
33.6%
Taxes less Subsidies on Production and Imports
2.2%
Gross Operating Surplus 64.2%
4.83.3
6.9
19.0
-40.0
-30.0
-20.0
-10.0
0.0
10.0
20.0
30.0
40.0
50.0
2006 2007 2008 2009 2010 2011 2012 2013
%
Annual Percentage Change of Income Components, 2006-2013 Chart 2
4.83.3
6.9
19.0
-40
-30
-20
-10
0
10
20
30
40
50
28-Jun-05 29-Jun-05 30-Jun-05 1-Jul-05 2-Jul-05 3-Jul-05 4-Jul-05 5-Jul-05
GDP at Current Prices Gross Operating Surplus
Compensation of Employees Taxes less Subsidies on Production and Imports
%
4.83.3
6.9
19.0
-40
-30
-20
-10
0
10
20
30
40
50
28-Jun-05 29-Jun-05 30-Jun-05 1-Jul-05 2-Jul-05 3-Jul-05 4-Jul-05 5-Jul-05
GDP at Current Prices Gross Operating Surplus
Compensation of Employees Taxes less Subsidies on Production and Imports
%
SUMMARY FINDINGS
7
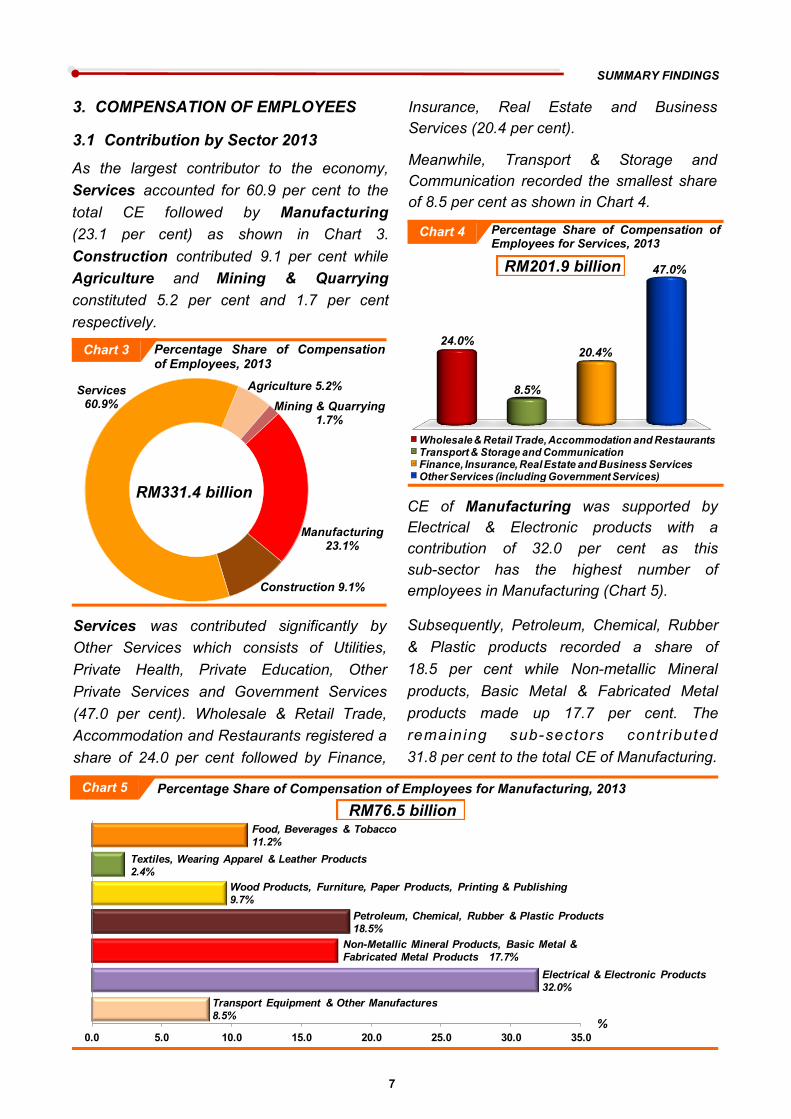
3. COMPENSATION OF EMPLOYEES
3.1 Contribution by Sector 2013
CE of Manufacturing was supported by
Electrical & Electronic products with a
contribution of 32.0 per cent as this
sub-sector has the highest number of
employees in Manufacturing (Chart 5).
Subsequently, Petroleum, Chemical, Rubber
& Plastic products recorded a share of
18.5 per cent while Non-metallic Mineral
products, Basic Metal & Fabricated Metal
products made up 17.7 per cent. The
remaining sub-sectors contr ibuted
31.8 per cent to the total CE of Manufacturing.
Insurance, Real Estate and Business
Services (20.4 per cent).
Meanwhile, Transport & Storage and
Communication recorded the smallest share
of 8.5 per cent as shown in Chart 4.
RM331.4 billion
Agriculture 5.2%
Mining & Quarrying 1.7%
Manufacturing 23.1%
Construction 9.1%
Services 60.9%
Percentage Share of Compensation of Employees, 2013
Chart 3
Services was contributed significantly by
Other Services which consists of Utilities,
Private Health, Private Education, Other
Private Services and Government Services
(47.0 per cent). Wholesale & Retail Trade,
Accommodation and Restaurants registered a
share of 24.0 per cent followed by Finance,
0.0 5.0 10.0 15.0 20.0 25.0 30.0 35.0
Food, Beverages & Tobacco
11.2%
Textiles, Wearing Apparel & Leather Products
2.4%
Wood Products, Furniture, Paper Products, Printing & Publishing
9.7%
Petroleum, Chemical, Rubber & Plastic Products
18.5%
Non-Metallic Mineral Products, Basic Metal &
Fabricated Metal Products 17.7%
Electrical & Electronic Products
32.0%
Transport Equipment & Other Manufactures
8.5%%
Percentage Share of Compensation of Employees for Manufacturing, 2013 Chart 5
RM76.5 billion
24.0%
8.5%
20.4%
47.0%
Wholesale & Retail Trade, Accommodation and RestaurantsTransport & Storage and CommunicationFinance, Insurance, Real Estate and Business ServicesOther Services (including Government Services)
Chart 4 Percentage Share of Compensation of Employees for Services, 2013
RM201.9 billion
24.0%
8.5%
20.4%
47.0%
As the largest contributor to the economy,
Services accounted for 60.9 per cent to the
total CE followed by Manufacturing
(23.1 per cent) as shown in Chart 3.
Construction contributed 9.1 per cent while
Agriculture and Mining & Quarrying
constituted 5.2 per cent and 1.7 per cent
respectively.
SUMMARY FINDINGS
8
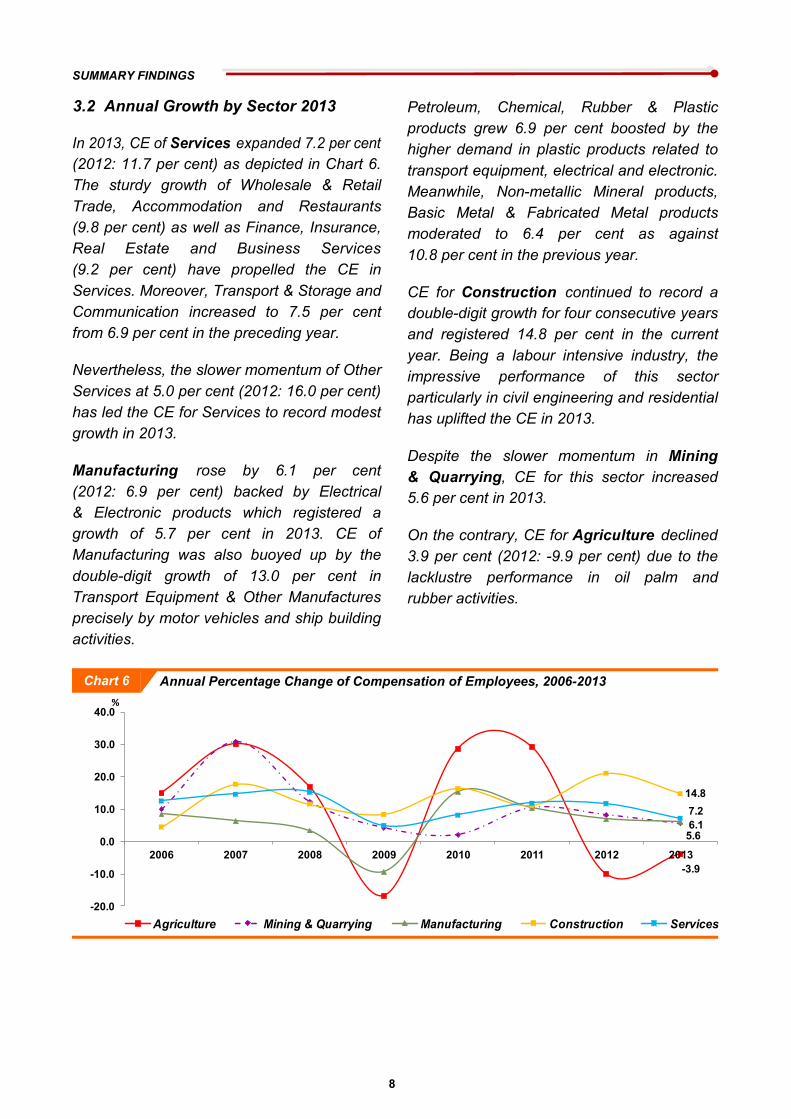
In 2013, CE of Services expanded 7.2 per cent
(2012: 11.7 per cent) as depicted in Chart 6.
The sturdy growth of Wholesale & Retail
Trade, Accommodation and Restaurants
(9.8 per cent) as well as Finance, Insurance,
Real Estate and Business Services
(9.2 per cent) have propelled the CE in
Services. Moreover, Transport & Storage and
Communication increased to 7.5 per cent
from 6.9 per cent in the preceding year.
Nevertheless, the slower momentum of Other
Services at 5.0 per cent (2012: 16.0 per cent)
has led the CE for Services to record modest
growth in 2013.
Manufacturing rose by 6.1 per cent
(2012: 6.9 per cent) backed by Electrical
& Electronic products which registered a
growth of 5.7 per cent in 2013. CE of
Manufacturing was also buoyed up by the
double-digit growth of 13.0 per cent in
Transport Equipment & Other Manufactures
precisely by motor vehicles and ship building
activities.
Petroleum, Chemical, Rubber & Plastic
products grew 6.9 per cent boosted by the
higher demand in plastic products related to
transport equipment, electrical and electronic.
Meanwhile, Non-metallic Mineral products,
Basic Metal & Fabricated Metal products
moderated to 6.4 per cent as against
10.8 per cent in the previous year.
CE for Construction continued to record a
double-digit growth for four consecutive years
and registered 14.8 per cent in the current
year. Being a labour intensive industry, the
impressive performance of this sector
particularly in civil engineering and residential
has uplifted the CE in 2013.
Despite the slower momentum in Mining
& Quarrying, CE for this sector increased
5.6 per cent in 2013.
On the contrary, CE for Agriculture declined
3.9 per cent (2012: -9.9 per cent) due to the
lacklustre performance in oil palm and
rubber activities.
3.2 Annual Growth by Sector 2013
Annual Percentage Change of Compensation of Employees, 2006-2013 Chart 6
-3.9
5.66.1
14.8
7.2
-20.0
-10.0
0.0
10.0
20.0
30.0
40.0
2006 2007 2008 2009 2010 2011 2012 2013
%
-3.9
5.66.1
14.8
7.2
-20
-10
0
10
20
30
40
28-Jun-05 29-Jun-05 30-Jun-05 1-Jul-05 2-Jul-05 3-Jul-05 4-Jul-05 5-Jul-05
Agriculture Mining & Quarrying Manufacturing Construction Services
%
SUMMARY FINDINGS
9
Percentage Share of Gross Operating Surplus, 2013 Chart 7
RM633.9 billion
Agriculture 11.7% Mining & Quarrying
14.6%
Manufacturing 24.6%
Construction 1.7% Services
47.3%
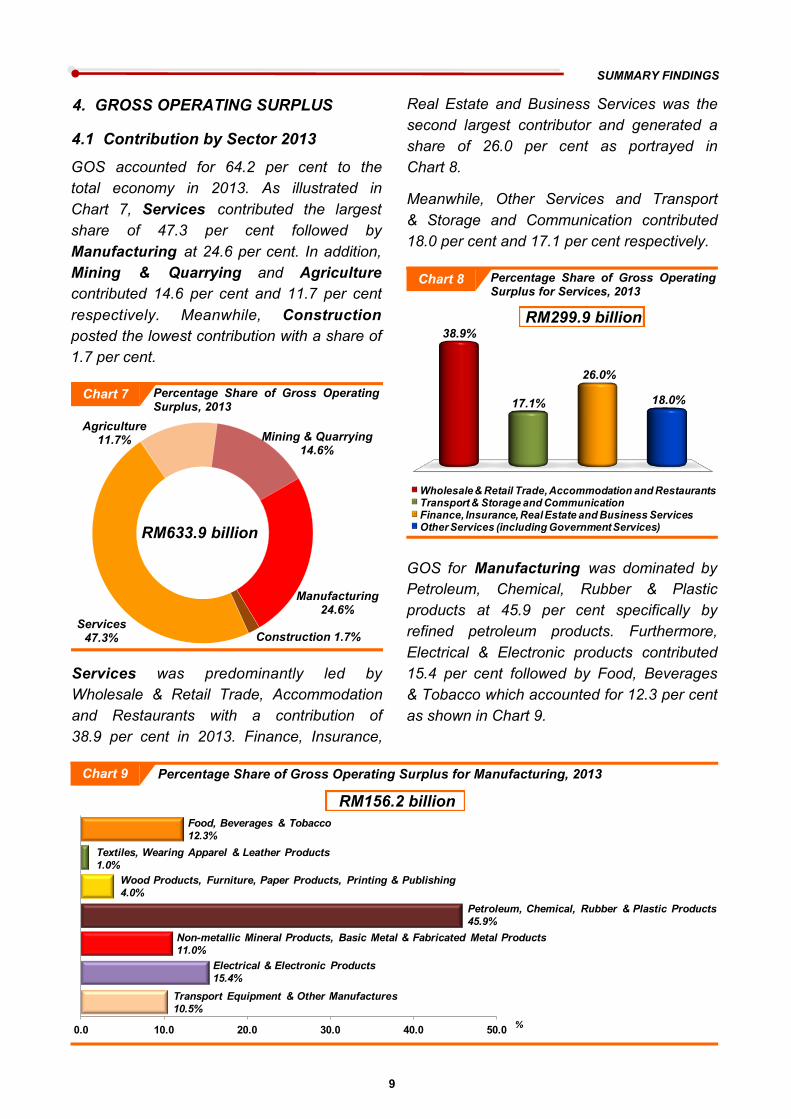
GOS accounted for 64.2 per cent to the
total economy in 2013. As illustrated in
Chart 7, Services contributed the largest
share of 47.3 per cent followed by
Manufacturing at 24.6 per cent. In addition,
Mining & Quarrying and Agriculture
contributed 14.6 per cent and 11.7 per cent
respectively. Meanwhile, Construction
posted the lowest contribution with a share of
1.7 per cent.
4. GROSS OPERATING SURPLUS
4.1 Contribution by Sector 2013
Real Estate and Business Services was the
second largest contributor and generated a
share of 26.0 per cent as portrayed in
Chart 8.
Meanwhile, Other Services and Transport
& Storage and Communication contributed
18.0 per cent and 17.1 per cent respectively.
Services was predominantly led by
Wholesale & Retail Trade, Accommodation
and Restaurants with a contribution of
38.9 per cent in 2013. Finance, Insurance,
GOS for Manufacturing was dominated by
Petroleum, Chemical, Rubber & Plastic
products at 45.9 per cent specifically by
refined petroleum products. Furthermore,
Electrical & Electronic products contributed
15.4 per cent followed by Food, Beverages
& Tobacco which accounted for 12.3 per cent
as shown in Chart 9.
0.0 10.0 20.0 30.0 40.0 50.0%
Food, Beverages & Tobacco
12.3%
Textiles, Wearing Apparel & Leather Products
1.0%
Wood Products, Furniture, Paper Products, Printing & Publishing
4.0%
Petroleum, Chemical, Rubber & Plastic Products
45.9%
Non-metallic Mineral Products, Basic Metal & Fabricated Metal Products
11.0%
Electrical & Electronic Products
15.4%
Transport Equipment & Other Manufactures
10.5%
Percentage Share of Gross Operating Surplus for Manufacturing, 2013 Chart 9
RM156.2 billion
Percentage Share of Gross Operating Surplus for Services, 2013 Chart 8
RM299.9 billion 38.9%
17.1%
26.0%
18.0%
24.0%
8.5%
20.4%
47.0%
Wholesale & Retail Trade, Accommodation and RestaurantsTransport & Storage and CommunicationFinance, Insurance, Real Estate and Business ServicesOther Services (including Government Services)
SUMMARY FINDINGS
10
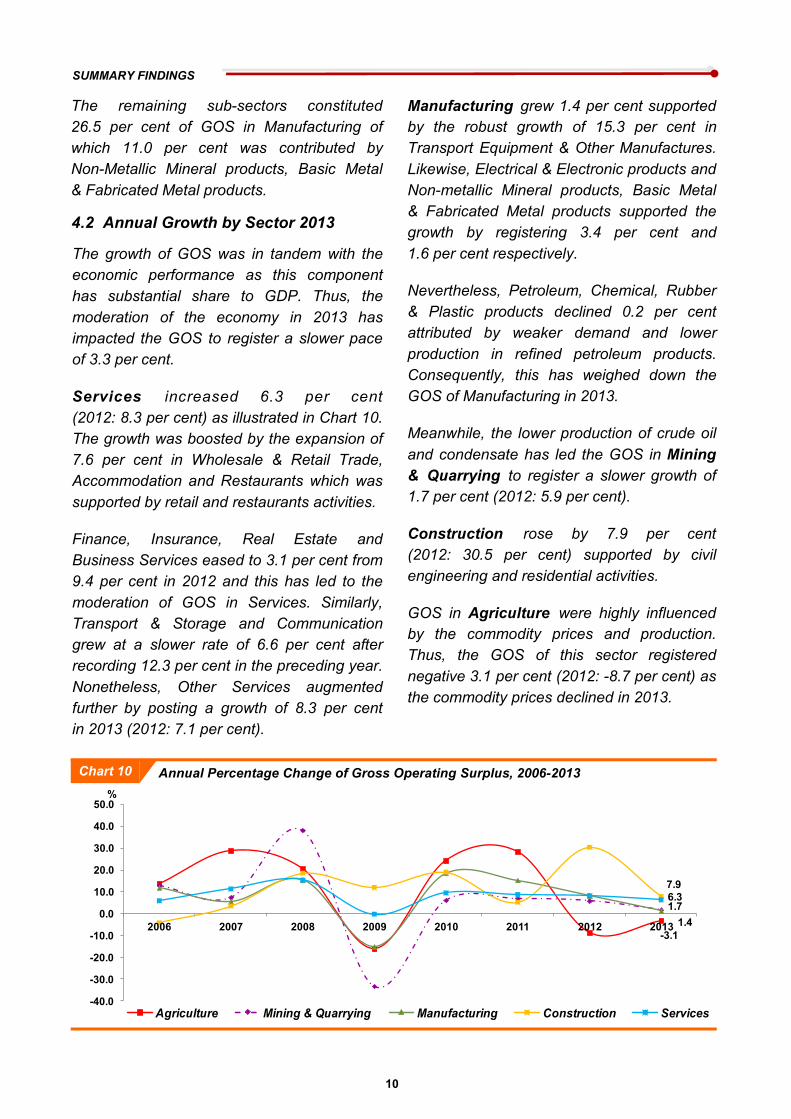
Manufacturing grew 1.4 per cent supported
by the robust growth of 15.3 per cent in
Transport Equipment & Other Manufactures.
Likewise, Electrical & Electronic products and
Non-metallic Mineral products, Basic Metal
& Fabricated Metal products supported the
growth by registering 3.4 per cent and
1.6 per cent respectively.
Nevertheless, Petroleum, Chemical, Rubber
& Plastic products declined 0.2 per cent
attributed by weaker demand and lower
production in refined petroleum products.
Consequently, this has weighed down the
GOS of Manufacturing in 2013.
Meanwhile, the lower production of crude oil
and condensate has led the GOS in Mining
& Quarrying to register a slower growth of
1.7 per cent (2012: 5.9 per cent).
Construction rose by 7.9 per cent
(2012: 30.5 per cent) supported by civil
engineering and residential activities.
GOS in Agriculture were highly influenced
by the commodity prices and production.
Thus, the GOS of this sector registered
negative 3.1 per cent (2012: -8.7 per cent) as
the commodity prices declined in 2013.
4.2 Annual Growth by Sector 2013
The remaining sub-sectors constituted
26.5 per cent of GOS in Manufacturing of
which 11.0 per cent was contributed by
Non-Metallic Mineral products, Basic Metal
& Fabricated Metal products.
The growth of GOS was in tandem with the
economic performance as this component
has substantial share to GDP. Thus, the
moderation of the economy in 2013 has
impacted the GOS to register a slower pace
of 3.3 per cent.
Services increased 6.3 per cent
(2012: 8.3 per cent) as illustrated in Chart 10.
The growth was boosted by the expansion of
7.6 per cent in Wholesale & Retail Trade,
Accommodation and Restaurants which was
supported by retail and restaurants activities.
Finance, Insurance, Real Estate and
Business Services eased to 3.1 per cent from
9.4 per cent in 2012 and this has led to the
moderation of GOS in Services. Similarly,
Transport & Storage and Communication
grew at a slower rate of 6.6 per cent after
recording 12.3 per cent in the preceding year.
Nonetheless, Other Services augmented
further by posting a growth of 8.3 per cent
in 2013 (2012: 7.1 per cent).
Annual Percentage Change of Gross Operating Surplus, 2006-2013 Chart 10
-3.1
1.7
1.4
7.9
6.3
-40.0
-30.0
-20.0
-10.0
0.0
10.0
20.0
30.0
40.0
50.0
2006 2007 2008 2009 2010 2011 2012 2013
%
-3.1
1.7
1.4
7.9
6.3
-40.0
-30.0
-20.0
-10.0
0.0
10.0
20.0
30.0
40.0
50.0
2006 2007 2008 2009 2010 2011 2012 2013
Agriculture Mining & Quarrying Manufacturing Construction Services
%
2 2 JADUAL TABLES
2005-2013 GDP INCOME APPROACH KDNK KAEDAH PENDAPATAN

11
4.8
2013p
33.6
64.2
2.2
100.0
Komponen Pendapatan bagi KDNK pada Harga Semasa - RM Juta
Income Components of GDP at Current Prices - RM Million
2013p
331,376
633,860
21,497
986,733
2013p
6.9
3.3
19.0
100.0 100.0 100.0GDP at purchasers' prices
3.8 2.5 1.9
64.7 65.6 65.2Gross operating surplus
Cukai tolak subsidi ke atas pengeluaran
dan import4.5 4.5 4.3 2.8 4.2
Lebihan kendalian kasar65.9 65.7 65.3 68.0 64.2
KDNK pada harga pembeli100.0 100.0 100.0 100.0 100.0
Pampasan pekerja29.5 29.8 30.3 29.3 31.6
Taxes less subsidies on production
and imports
31.5 31.9 32.9Compensation of employees
1C
Komponen pendapatan2005e 2006e 2007e 2008e 2009e 2010e 2011e 2012e
Income components
Komponen Pendapatan bagi KDNK pada Harga Semasa - Pembahagian Peratus kepada KDNK
Income Components of GDP at Current Prices - Percentage Share to GDP
Jadual
Table
-7.4 11.8 11.0 6.4GDP at purchasers' prices
41.4 0.6 -25.9 -19.2Taxes less subsidies on production
and imports
-12.6 12.8 12.5 5.8Gross operating surplus
Cukai tolak subsidi ke atas pengeluaran
dan import8.2 8.6 -26.6
Lebihan kendalian kasar9.4 10.8 20.4
KDNK pada harga pembeli9.8 11.5 15.7
2012e
Income components
Pampasan pekerja10.8 13.4 11.7 0.1 11.4 12.5 9.7
Compensation of employees
Komponen pendapatan2006e 2007e 2008e 2009e 2010e 2011e
Cukai tolak subsidi ke atas pengeluaran
dan import24,579 26,592 28,889 21,210 29,996
941,949GDP at purchasers' prices
1B
30,179 22,350 18,068Taxes less subsidies on production
and imports
KDNK pada harga pembeli543,578 596,784 665,340 769,949 712,857 797,327 885,339
Komponen Pendapatan bagi KDNK pada Harga Semasa - Peratus Perubahan Tahunan
Income Components of GDP at Current Prices - Annual Percentage Change
Jadual
Table
Lebihan kendalian kasar358,404 392,265 434,676 523,339 457,305 515,829 580,380 613,846
Gross operating surplus
Pampasan pekerja160,594 177,926 201,775 225,401 225,556 251,319 282,609 310,035
Compensation of employees
2011e 2012e
Income components
1A
Komponen pendapatan2005e 2006e 2007e 2008e 2009e 2010e
Jadual
Table
12
Table
1. Pampasan pekerjaCompensation of employees
1.1
1.2
1.3
1.4
1.5
72 73 74 75 78 79 80 802. Lebihan kendalian kasar
Gross operating surplus
2.1
2.2
2.3
2.4
2.5
3.e
Table
1. Pampasan pekerjaCompensation of employees
1.1
1.2
1.3
1.4
1.5
2. Lebihan kendalian kasarGross operating surplus
2.1
2.2
2.3
2.4
2.5
3.e
3.3
-3.1
1.7
1.4
7.9
6.3
19.0
4.8
156,164
10,964
299,862
21,497
986,733
2013p
6.9
-3.9
7.2
331,376
17,261
5,687
76,463
30,073
201,891
633,860
74,036
92,834
2010e
2011e
2012e
Income Components/Kind of economic activity
Komponen Pendapatan mengikut Jenis Aktiviti Ekonomi pada Harga Semasa - RM Juta
Income Components by Kind of Economic Activity at Current Prices - RM Million
160,594 177,926 201,775 225,401 225,556 251,319 282,609 310,035
Jadual 2A
Komponen Pendapatan/Jenis aktiviti ekonomi2005
e2006
e2007
e2008
e2009
e2013
p
Pertanian 8,219 9,451 12,301 14,388 11,972 15,410 19,929 17,958
Agriculture
Perlombongan dan pengkuarian2,610 2,871 3,760 4,225 4,405 4,497 4,975 5,384
Mining and quarrying
Pembuatan 48,912 53,057 56,402 58,341 52,915 61,105 67,444 72,098
Manufacturing
Pembinaan 11,268 11,774 13,859 15,466 16,756 19,492 21,643 26,208
Construction
Perkhidmatan 89,586 100,773 115,454 132,981 139,507 150,816 168,617 188,388
Services
613,846
Pertanian 35,394 40,309 51,921 62,587 52,475 65,187 83,721 76,409
358,404 392,265 434,676 523,339 457,305 515,829 580,380
Agriculture
91,263Mining and quarrying
Pembuatan 89,678 100,443 106,063 122,512 104,121 123,359 142,309 154,034
Manufacturing
Perlombongan dan pengkuarian67,803 76,633 82,350 113,793 75,966 80,622 86,188
Pembinaan 4,715 4,518 4,678 5,549 6,218 7,403 7,792 10,165
Construction
Perkhidmatan 160,815 170,362 189,664 218,899 218,525 239,258 260,370 281,976
Services
24,579 26,592 28,889 21,210 29,996 30,179 22,350 18,068
Cukai tolak subsidi ke atas pengeluaran
dan import
Taxes less subsidies on production
and imports
KDNK pada harga pembeli543,578 596,784 665,340 769,949
Jadual 2B
712,857 797,327 885,339 941,949GDP at purchasers' prices
Komponen Pendapatan mengikut Jenis Aktiviti Ekonomi pada Harga Semasa - Peratus Perubahan Tahunan
Income Components by Kind of Economic Activity at Current Prices - Annual Percentage Change
2010e
2011e
2012e
Income Components/Kind of economic activity
10.8 13.4 11.7 0.1 11.4
Komponen Pendapatan/Jenis aktiviti ekonomi2006
e2007
e2008
e2009
e
12.5 9.7
Agriculture
Perlombongan dan pengkuarian10.0 31.0 12.4 4.3 2.1 10.6 8.2
Mining and quarrying
Pertanian 15.0 30.2 17.0 -16.8 28.7 29.3 -9.9
5.6
21.1Construction
15.5 10.4 6.9Manufacturing
Pembinaan 4.5 17.7 11.6
Pembuatan 8.5 6.3 3.4 -9.3
8.3 16.3 11.0
6.1
14.8
8.1 11.8 11.7Services
9.4 10.8 20.4 -12.6 12.8
Perkhidmatan 12.5 14.6 15.2 4.9
12.5 5.8
Pertanian 13.9 28.8 20.5 -16.2 24.2 28.4 -8.7
Agriculture
Perlombongan dan pengkuarian13.0 7.5 38.2 -33.2 6.1 6.9 5.9
Mining and quarrying
Pembuatan 12.0 5.6 15.5 -15.0 18.5 15.4 8.2
Manufacturing
Pembinaan -4.2 3.5 18.6 12.1 19.1 5.2 30.5
Construction
Perkhidmatan 5.9 11.3 15.4 -0.2 9.5 8.8 8.3
Services
8.2 8.6 -26.6 41.4 0.6 -25.9
6.4GDP at purchasers' prices
-19.2
KDNK pada harga pembeli9.8 11.5 15.7 -7.4 11.8 11.0
Cukai tolak subsidi ke atas pengeluaran
dan import
Taxes less subsidies on production
and imports
13
Table
1. Pampasan pekerjaCompensation of employees
1.1
1.2
1.3
1.4
1.5
2. Lebihan kendalian kasarGross operating surplus
2.1
2.2
2.3
2.4
2.5
3.e
Table
1. Pampasan pekerjaCompensation of employees
1.1
1.2
1.3
1.4
1.5
2. Lebihan kendalian kasarGross operating surplus
2.1
2.2
2.3
2.4
2.5
3.e
2009e
2010e
2011e
2012e
2013p
Income Components/Kind of economic activity
Jadual 2C
Komponen Pendapatan mengikut Jenis Aktiviti Ekonomi pada Harga Semasa - Pembahagian Peratus kepada KDNK
Income Components by Kind of Economic Activity at Current Prices - Percentage Share to GDP
Komponen Pendapatan/Jenis aktiviti ekonomi2005
e2006
e2007
e2008
e
31.9 32.9 33.6
Pertanian 1.5 1.6 1.8 1.9 1.7 1.9
29.5 29.8 30.3 29.3 31.6 31.5
2.3 1.9 1.7Agriculture
7.7 7.7Manufacturing
0.6 0.6 0.6 0.6Mining and quarrying
Pembuatan 9.0 8.9 8.5 7.6
Perlombongan dan pengkuarian0.5 0.5 0.6 0.5 0.6
7.4 7.7 7.6
19.6 18.9 19.0 20.0 20.5Services
2.4 2.4 2.8 3.0Construction
Perkhidmatan 16.5 16.9 17.4 17.3
Pembinaan 2.1 2.0 2.1 2.0 2.4
65.6 65.2 64.2
Pertanian 6.5 6.8 7.8 8.1 7.4 8.2
65.9 65.7 65.3 68.0 64.2 64.7
9.5 8.1 7.5Agriculture
16.4 15.8Manufacturing
10.1 9.7 9.7 9.4Mining and quarrying
Pembuatan 16.5 16.8 15.9 15.9
Perlombongan dan pengkuarian12.5 12.8 12.4 14.8 10.7
14.6 15.5 16.1
30.7 30.0 29.4 29.9 30.4Services
0.9 0.9 1.1 1.1Construction
Perkhidmatan 29.6 28.5 28.5 28.4
Pembinaan 0.9 0.8 0.7 0.7 0.9
3.8 2.5 1.9 2.2Taxes less subsidies on production
and imports
KDNK pada harga pembeli100.0 100.0 100.0 100.0
Cukai tolak subsidi ke atas pengeluaran
dan import4.5 4.5 4.3 2.8 4.2
Jadual 2D
100.0 100.0 100.0 100.0 100.0GDP at purchasers' prices
Komponen Pendapatan mengikut Jenis Aktiviti Ekonomi pada Harga Semasa - Pembahagian Peratus kepada Komponen Pendapatan
Income Components by Kind of Economic Activity at Current Prices - Percentage Share to Income Components
2010e
2011e
2012e
2013p
Income Components/Kind of economic activity
100.0 100.0 100.0 100.0 100.0
Komponen Pendapatan/Jenis aktiviti ekonomi2005
e2006
e2007
e2008
e2009
e
6.1 7.1 5.8 5.2Agriculture
100.0 100.0 100.0 100.0
Pertanian 5.1 5.3 6.1 6.4 5.3
1.8 1.8 1.7 1.7Mining and quarryingPerlombongan dan pengkuarian
1.6 1.6 1.9 1.9 2.0
24.3 23.9 23.3 23.1Manufacturing Pembuatan
30.5 29.8 28.0 25.9 23.5
7.8 7.7 8.5 9.1Construction Pembinaan
7.0 6.6 6.9 6.9 7.4
60.0 59.7 60.8 60.9Services
100.0 100.0 100.0 100.0 100.0
Perkhidmatan 55.8 56.6 57.2 59.0 61.9
100.0 100.0 100.0 100.0
14.9 14.6Mining and quarrying
12.6 14.4 12.4 11.7Agriculture
Perlombongan dan pengkuarian18.9 19.5 18.9 21.7
Pertanian 9.9 10.3 11.9 12.0 11.5
16.6 15.6 14.9
1.4 1.4 1.3 1.7 1.7Construction
23.9 24.5 25.1 24.6Manufacturing
Pembinaan 1.3 1.2 1.1 1.1
Pembuatan 25.0 25.6 24.4 23.4 22.8
100.0 100.0 100.0 100.0 100.0Taxes less subsidies on production
and imports
46.4 44.9 45.9 47.3Services
Cukai tolak subsidi ke atas pengeluaran
dan import100.0 100.0 100.0 100.0
Perkhidmatan 44.9 43.4 43.6 41.8 47.8

14
Table
1.
1.1 Getah, kelapa sawit, ternakan dan pertanian lain
Rubber, oil palm, livestock and other agriculture
1.2
1.3
2.
3.
3.1
3.2
3.3
3.4
3.5
3.6
3.7
4.
5.
5.1
5.2
5.3
5.4
2009e
2010e
2011e
2012e
Kind of economic activity
Jenis aktiviti ekonomi2005
e2006
e2007
e2008
e
Forestry and logging
Perikanan
Fishing
Perlombongan dan pengkuarian
Mining and quarrying
Pertanian
Agriculture
Perhutanan dan pembalakan
Jadual3A
Textiles, wearing apparel and leather products
Produk kayu, perabot, keluaran kertas,
percetakan dan penerbitan
Wood products, furniture, paper products, printing
and publishing
Produk petroleum, kimia, getah dan plastik
Petroleum, chemical, rubber and plastic products
Pembuatan
Manufacturing
Makanan, minuman dan tembakau
Food, beverages and tobacco
Produk tekstil, pakaian dan kulit
Transport equipment and other manufactures
Pembinaan
Construction
Perkhidmatan
Services
Produk mineral bukan logam, logam asas dan produk
logam yang direka
Non-metallic mineral products, basic metal and
fabricated metal products
Produk elektrik dan elektronik
Electrical and electronic products
Peralatan pengangkutan dan pembuatan lain
Finance, insurance, real estate and
business services
Perkhidmatan lain
(termasuk perkhidmatan kerajaan)
Compensation of employees
Other services
(including government services)
Pampasan pekerja
Perdagangan borong & runcit, penginapan
dan restoran
Wholesale & retail trade, accommodation
and restaurants
Pengangkutan & penyimpanan dan komunikasi
Transport & storage and communication
Kewangan, insurans, hartanah dan
perkhidmatan perniagaan
15,410 19,929 17,958
2,610 2,871 3,760 4,225 4,405 4,497 4,975 5,384
758 807 837
362 406
8,219 9,451 12,301 14,388 11,972
652
11,268 11,774 13,859 15,466 16,756 19,492 21,643 26,208
2,048 2,019 1,940 1,870 1,686 1,711 1,791 1,766
5,359 5,833 7,162 6,859 6,011 6,532 6,995 7,317
150,816 168,617 188,388
7,169 8,318 11,110 13,135 10,739 14,091 18,538 16,469
688 727 771 782 751
89,586 100,773 115,454 132,981 139,507
61,105 67,444 72,098
3,785 4,038 5,055 5,690 5,836 6,291 7,557 8,163
420 471 483 560 585
48,912 53,057 56,402 58,341 52,915
10,639 12,374 13,262
5,821 6,379 7,409 8,800 8,051 9,883 11,472 12,706
8,038 8,666 9,258 10,218 9,446
20,477 21,897 23,157
4,102 4,051 4,171 4,696 4,536 5,572 5,358 5,726
19,760 22,071 21,406 20,208 17,349
35,660 40,788 44,219
9,755 10,806 11,974 12,460 12,541 13,854 14,951 15,980
18,855 21,750 25,461 30,538 32,924
282,609 310,035160,594 177,926 201,775 225,401 225,556
31,410 34,879 37,742
41,773 46,770 53,586 63,042 65,753 69,892 78,000 90,446
19,204 21,447 24,432 26,941 28,289 41,218
94,940
331,376
Compensation of Employees by Kind of Economic Activity at Current Prices - RM Million
Pampasan Pekerja mengikut Jenis Aktiviti Ekonomi pada Harga Semasa - RM Juta
7,411
14,177
13,525
24,485
6,472
30,073
201,891
48,551
17,181
2013p
17,261
15,814
750
697
5,687
76,463
8,568
1,825
251,319
15
Table
1.
1.1 Getah, kelapa sawit, ternakan dan pertanian lain
Rubber, oil palm, livestock and other agriculture
1.2
1.3
2.
3.
3.1
3.2
3.3
3.4
3.5
3.6
3.7
4.
5.
5.1
5.2
5.3
5.4
11.4 12.5 9.7 6.9Compensation of employees
Pampasan pekerja10.8 13.4 11.7 0.1
4.3 6.3 11.6 16.0 5.0Other services
(including government services)
11.0 11.0 8.2 9.2Finance, insurance, real estate and
business services
Perkhidmatan lain
(termasuk perkhidmatan kerajaan)12.0 14.6 17.6
Kewangan, insurans, hartanah dan
perkhidmatan perniagaan 11.7 13.9 10.3 5.0
0.7 10.5 7.9 6.9 7.5Transport & storage and communication
8.3 14.4 8.4 9.8Wholesale & retail trade, accommodation
and restaurants
Pengangkutan & penyimpanan dan komunikasi 10.8 10.8 4.1
Perdagangan borong & runcit, penginapan
dan restoran 15.4 17.1 19.9 7.8
4.9 8.1 11.8 11.7 7.2Services
16.3 11.0 21.1 14.8Construction
Perkhidmatan 12.5 14.6 15.2
Pembinaan 4.5 17.7 11.6 8.3
-3.4 22.8 -3.8 6.9 13.0Transport equipment and other manufactures
18.0 6.9 5.8 5.7Electrical and electronic products
Peralatan pengangkutan dan pembuatan lain-1.2 3.0 12.6
Produk elektrik dan elektronik 11.7 -3.0 -5.6 -14.1
-8.5 22.8 16.1 10.8 6.4Non-metallic mineral products, basic metal and
fabricated metal products
12.6 16.3 7.2 6.9Petroleum, chemical, rubber and plastic products
Produk mineral bukan logam, logam asas dan produk
logam yang direka9.6 16.1 18.8
Produk petroleum, kimia, getah dan plastik 7.8 6.8 10.4 -7.6
-12.4 8.7 7.1 4.6 1.3Wood products, furniture, paper products, printing
and publishing
1.5 4.7 -1.4 3.4Textiles, wearing apparel and leather products
Produk kayu, perabot, keluaran kertas,
percetakan dan penerbitan 8.9 22.8 -4.2
Produk tekstil, pakaian dan kulit-1.4 -3.9 -3.6 -9.8
2.6 7.8 20.1 8.0 5.0Food, beverages and tobacco
15.5 10.4 6.9 6.1Manufacturing
Makanan, minuman dan tembakau 6.7 25.2 12.6
Pembuatan 8.5 6.3 3.4 -9.3
4.3 2.1 10.6 8.2 5.6Mining and quarrying
16.0 4.4 11.4 7.0Fishing
Perlombongan dan pengkuarian10.0 31.0 12.4
Perikanan 12.4 3.3 12.1 2.6
-4.0 1.0 6.4 3.8 -10.4Forestry and logging
31.2 31.6 -11.2 -4.0
Perhutanan dan pembalakan 5.7 6.0 1.4
16.0 33.6 18.2 -18.2
-16.8 28.7 29.3 -9.9 -3.9Agriculture
2010e
2011e
2012e
2013p
Kind of economic activity
Pertanian 15.0 30.2 17.0
Jadual3B
Pampasan Pekerja mengikut Jenis Aktiviti Ekonomi pada Harga Semasa - Peratus Perubahan Tahunan
Compensation of Employees by Kind of Economic Activity at Current Prices - Annual Percentage Change
Jenis aktiviti ekonomi2006
e2007
e2008
e2009
e
16
Table
1.
1.1 Getah, kelapa sawit, ternakan dan pertanian lain
Rubber, oil palm, livestock and other agriculture
1.2
1.3
2.
3.
3.1
3.2
3.3
3.4
3.5
3.6
3.7
4.
5.
5.1
5.2
5.3
5.4
100.0 100.0 100.0 100.0Compensation of employees
Pampasan pekerja100.0 100.0 100.0 100.0 100.0
29.2 27.8 27.6 29.2 28.7Other services
(including government services)
12.5 12.3 12.2 12.4Finance, insurance, real estate and
business services
Perkhidmatan lain
(termasuk perkhidmatan kerajaan)26.0 26.3 26.6 28.0
Kewangan, insurans, hartanah dan
perkhidmatan perniagaan 12.0 12.1 12.1 12.0 12.5
5.6 5.5 5.3 5.2 5.2Transport & storage and communication
14.2 14.4 14.3 14.7Wholesale & retail trade, accommodation
and restaurants
Pengangkutan & penyimpanan dan komunikasi 6.1 6.1 5.9 5.5
Perdagangan borong & runcit, penginapan
dan restoran 11.7 12.2 12.6 13.5 14.6
61.9 60.0 59.7 60.8 60.9Services
7.8 7.7 8.5 9.1Construction
Perkhidmatan 55.8 56.6 57.2 59.0
Pembinaan 7.0 6.6 6.9 6.9 7.4
2.0 2.2 1.9 1.8 2.0Transport equipment and other manufactures
8.1 7.7 7.5 7.4Electrical and electronic products
Peralatan pengangkutan dan pembuatan lain2.6 2.3 2.1 2.1
Produk elektrik dan elektronik 12.3 12.4 10.6 9.0 7.7
3.6 3.9 4.1 4.1 4.1Non-metallic mineral products, basic metal and
fabricated metal products
4.2 4.4 4.3 4.3Petroleum, chemical, rubber and plastic products
Produk mineral bukan logam, logam asas dan produk
logam yang direka3.6 3.6 3.7 3.9
Produk petroleum, kimia, getah dan plastik 5.0 4.9 4.6 4.5 4.2
2.7 2.6 2.5 2.4 2.2Wood products, furniture, paper products, printing
and publishing
0.7 0.6 0.6 0.6Textiles, wearing apparel and leather products
Produk kayu, perabot, keluaran kertas,
percetakan dan penerbitan 3.3 3.3 3.5 3.0
Produk tekstil, pakaian dan kulit1.3 1.1 1.0 0.8 0.7
2.6 2.5 2.7 2.6 2.6Food, beverages and tobacco
24.3 23.9 23.3 23.1Manufacturing
Makanan, minuman dan tembakau 2.4 2.3 2.5 2.5
Pembuatan 30.5 29.8 28.0 25.9 23.5
2.0 1.8 1.8 1.7 1.7Mining and quarrying
0.2 0.2 0.2 0.2Fishing
Perlombongan dan pengkuarian1.6 1.6 1.9 1.9
Perikanan 0.2 0.2 0.2 0.2 0.2
0.3 0.3 0.3 0.3 0.2Forestry and logging
5.6 6.6 5.3 4.8
Perhutanan dan pembalakan 0.4 0.4 0.4 0.3
4.5 4.7 5.5 5.8 4.8
5.3 6.1 7.1 5.8 5.2Agriculture
2010e
2011e
2012e
2013p
Kind of economic activity
Pertanian 5.1 5.3 6.1 6.4
Jadual3C
Pampasan Pekerja mengikut Jenis Aktiviti Ekonomi pada Harga Semasa - Pembahagian Peratus kepada Pampasan Pekerja
Compensation of Employees by Kind of Economic Activity at Current Prices - Percentage Share to Compensation of Employees
Jenis aktiviti ekonomi2005
e2006
e2007
e2008
e2009
e
17
Table
1.
1.1 Getah, kelapa sawit, ternakan dan pertanian lain
Rubber, oil palm, livestock and other agriculture
1.2
1.3
2.
3.
3.1
3.2
3.3
3.4
3.5
3.6
3.7
4.
5.
5.1
5.2
5.3
5.4
47.1 46.3 46.3 48.0 47.0Other services
(including government services)
20.8 20.7 20.0 20.4Finance, insurance, real estate and
business services
Perkhidmatan lain
(termasuk perkhidmatan kerajaan)46.6 46.4 46.4 47.4
Kewangan, insurans, hartanah dan
perkhidmatan perniagaan 21.4 21.3 21.2 20.3 20.3
9.0 9.2 8.9 8.5 8.5Transport & storage and communication
23.6 24.2 23.5 24.0Wholesale & retail trade, accommodation
and restaurants
Pengangkutan & penyimpanan dan komunikasi 10.9 10.7 10.4 9.4
Perdagangan borong & runcit, penginapan
dan restoran 21.0 21.6 22.1 23.0 23.6
100.0 100.0 100.0 100.0 100.0Services
100.0 100.0 100.0 100.0Construction
Perkhidmatan 100.0 100.0 100.0 100.0
Pembinaan 100.0 100.0 100.0 100.0 100.0
8.6 9.1 7.9 7.9 8.5Transport equipment and other manufactures
33.5 32.5 32.1 32.0Electrical and electronic products
Peralatan pengangkutan dan pembuatan lain8.4 7.6 7.4 8.0
Produk elektrik dan elektronik 40.4 41.6 38.0 34.6 32.8
15.2 16.2 17.0 17.6 17.7Non-metallic mineral products, basic metal and
fabricated metal products
17.4 18.3 18.4 18.5Petroleum, chemical, rubber and plastic products
Produk mineral bukan logam, logam asas dan produk
logam yang direka11.9 12.0 13.1 15.1
Produk petroleum, kimia, getah dan plastik 16.4 16.3 16.4 17.5 17.9
11.4 10.7 10.4 10.1 9.7Wood products, furniture, paper products, printing
and publishing
2.8 2.7 2.4 2.4Textiles, wearing apparel and leather products
Produk kayu, perabot, keluaran kertas,
percetakan dan penerbitan 11.0 11.0 12.7 11.8
Produk tekstil, pakaian dan kulit4.2 3.8 3.4 3.2 3.2
11.0 10.3 11.2 11.3 11.2Food, beverages and tobacco
100.0 100.0 100.0 100.0Manufacturing
Makanan, minuman dan tembakau 7.7 7.6 9.0 9.8
Pembuatan 100.0 100.0 100.0 100.0 100.0
100.0 100.0 100.0 100.0 100.0Mining and quarrying
3.6 2.9 3.6 4.0Fishing
Perlombongan dan pengkuarian100.0 100.0 100.0 100.0
Perikanan 4.4 4.3 3.4 3.3 4.0
6.3 4.9 4.0 4.7 4.3Forestry and logging
91.4 93.0 91.7 91.6
Perhutanan dan pembalakan 8.4 7.7 6.3 5.4
87.2 88.0 90.3 91.3 89.7
100.0 100.0 100.0 100.0 100.0Agriculture
2010e
2011e
2012e
2013p
Kind of economic activity
Pertanian 100.0 100.0 100.0 100.0
Jadual3D
Pampasan Pekerja mengikut Jenis Aktiviti Ekonomi pada Harga Semasa - Pembahagian Peratus kepada Sektor
Compensation of Employees by Kind of Economic Activity at Current Prices - Percentage Share to Sector
Jenis aktiviti ekonomi2005
e2006
e2007
e2008
e2009
e
18
Table
1.
1.1 Getah, kelapa sawit, ternakan dan pertanian lain
Rubber, oil palm, livestock and other agriculture
1.2
1.3
2.
3.
3.1
3.2
3.3
3.4
3.5
3.6
3.7
4.
5.
5.1
5.2
5.3
5.4
515,829 580,380 613,846 633,860Gross operating surplus
Lebihan kendalian kasar358,404 392,265 434,676 523,339 457,305
40,205 42,920 46,601 49,922 54,047Other services
(including government services)
67,590 68,994 75,490 77,849Finance, insurance, real estate and
business services
Perkhidmatan lain
(termasuk perkhidmatan kerajaan)33,199 34,354 36,495 38,878
Kewangan, insurans, hartanah dan
perkhidmatan perniagaan 45,937 49,873 54,304 60,670 63,434
33,614 37,427 42,847 48,130 51,314Transport & storage and communication
91,321 101,928 108,434 116,651Wholesale & retail trade, accommodation
and restaurants
Pengangkutan & penyimpanan dan komunikasi 28,488 29,226 30,707 36,533
Perdagangan borong & runcit, penginapan
dan restoran 53,192 56,910 68,158 82,819 81,272
218,525 239,258 260,370 281,976 299,862Services
7,403 7,792 10,165 10,964Construction
Perkhidmatan 160,815 170,362 189,664 218,899
Pembinaan 4,715 4,518 4,678 5,549 6,218
8,793 10,455 11,995 14,156 16,325Transport equipment and other manufactures
25,860 22,455 23,334 24,120Electrical and electronic products
Peralatan pengangkutan dan pembuatan lain6,345 8,164 7,899 9,460
Produk elektrik dan elektronik 27,606 30,425 30,702 27,992 22,918
11,542 13,147 16,261 16,938 17,201Non-metallic mineral products, basic metal and
fabricated metal products
51,055 64,460 71,733 71,608Petroleum, chemical, rubber and plastic products
Produk mineral bukan logam, logam asas dan
produk logam yang direka7,357 8,623 10,950 13,111
Produk petroleum, kimia, getah dan plastik 33,580 37,430 39,436 50,957 41,353
4,881 5,577 5,940 6,472 6,171Wood products, furniture, paper products, printing
and publishing
1,383 1,759 1,493 1,508Textiles, wearing apparel and leather products
Produk kayu, perabot, keluaran kertas,
percetakan dan penerbitan 5,244 6,079 5,669 5,728
Produk tekstil, pakaian dan kulit1,294 1,415 1,225 1,391 1,246
13,389 15,882 19,437 19,908 19,231Food, beverages and tobacco
123,359 142,309 154,034 156,164Manufacturing
Makanan, minuman dan tembakau 8,253 8,308 10,182 13,873
Pembuatan 89,678 100,443 106,063 122,512 104,121
75,966 80,622 86,188 91,263 92,834Mining and quarrying
8,278 9,045 10,144 10,747Fishing
Perlombongan dan pengkuarian67,803 76,633 82,350 113,793
Perikanan 5,039 5,641 5,881 7,114 7,500
7,861 7,648 8,343 8,713 7,662Forestry and logging
49,261 66,333 57,551 55,627
Perhutanan dan pembalakan 7,124 7,581 8,152 8,200
23,231 27,087 37,887 47,273 37,114
52,475 65,187 83,721 76,409 74,036Agriculture
2010e
2011e
2012e
2013p
Kind of economic activity
Pertanian 35,394 40,309 51,921 62,587
Jadual4A
Lebihan Kendalian Kasar mengikut Jenis Aktiviti Ekonomi pada Harga Semasa - RM Juta
Gross Operating Surplus by Kind of Economic Activity at Current Prices - RM Million
Jenis aktiviti ekonomi2005
e2006
e2007
e2008
e2009
e
19
Table
1.
1.1 Getah, kelapa sawit, ternakan dan pertanian lain
Rubber, oil palm, livestock and other agriculture
1.2
1.3
2.
3.
3.1
3.2
3.3
3.4
3.5
3.6
3.7
4.
5.
5.1
5.2
5.3
5.4
Jadual4B
Lebihan Kendalian Kasar mengikut Jenis Aktiviti Ekonomi pada Harga Semasa - Peratus Perubahan Tahunan
Gross Operating Surplus by Kind of Economic Activity at Current Prices - Annual Percentage Change
Jenis aktiviti ekonomi2006
e2007
e2008
e2009
e
-16.2 24.2 28.4 -8.7 -3.1Agriculture
2010e
2011e
2012e
2013p
Kind of economic activity
Pertanian 13.9 28.8 20.5
-4.1 -2.7 9.1 4.4 -12.1Forestry and logging
32.7 34.7 -13.2 -3.3
Perhutanan dan pembalakan 6.4 7.5 0.6
16.6 39.9 24.8 -21.5
-33.2 6.1 6.9 5.9 1.7Mining and quarrying
10.4 9.3 12.2 5.9Fishing
Perlombongan dan pengkuarian13.0 7.5 38.2
Perikanan 12.0 4.2 21.0 5.4
-3.5 18.6 22.4 2.4 -3.4Food, beverages and tobacco
18.5 15.4 8.2 1.4Manufacturing
Makanan, minuman dan tembakau 0.7 22.6 36.2
Pembuatan 12.0 5.6 15.5 -15.0
-14.8 14.3 6.5 9.0 -4.7Wood products, furniture, paper products, printing
and publishing
10.9 27.2 -15.2 1.0Textiles, wearing apparel and leather products
Produk kayu, perabot, keluaran kertas,
percetakan dan penerbitan 15.9 -6.7 1.0
Produk tekstil, pakaian dan kulit9.3 -13.4 13.5 -10.4
-12.0 13.9 23.7 4.2 1.6Non-metallic mineral products, basic metal and
fabricated metal products
23.5 26.3 11.3 -0.2Petroleum, chemical, rubber and plastic products
Produk mineral bukan logam, logam asas dan
produk logam yang direka17.2 27.0 19.7
Produk petroleum, kimia, getah dan plastik 11.5 5.4 29.2 -18.8
-7.1 18.9 14.7 18.0 15.3Transport equipment and other manufactures
12.8 -13.2 3.9 3.4Electrical and electronic products
Peralatan pengangkutan dan pembuatan lain28.7 -3.2 19.8
Produk elektrik dan elektronik 10.2 0.9 -8.8 -18.1
-0.2 9.5 8.8 8.3 6.3Services
19.1 5.2 30.5 7.9Construction
Perkhidmatan 5.9 11.3 15.4
Pembinaan -4.2 3.5 18.6 12.1
-8.0 11.3 14.5 12.3 6.6Transport & storage and communication
12.4 11.6 6.4 7.6Wholesale & retail trade, accommodation
and restaurants
Pengangkutan & penyimpanan dan komunikasi 2.6 5.1 19.0
Perdagangan borong & runcit, penginapan
dan restoran 7.0 19.8 21.5 -1.9
3.4 6.8 8.6 7.1 8.3Other services
(including government services)
6.6 2.1 9.4 3.1Finance, insurance, real estate and
business services
Perkhidmatan lain
(termasuk perkhidmatan kerajaan)3.5 6.2 6.5
Kewangan, insurans, hartanah dan
perkhidmatan perniagaan 8.6 8.9 11.7 4.6
12.8 12.5 5.8 3.3Gross operating surplus
Lebihan kendalian kasar9.4 10.8 20.4 -12.6

20
Table
1.
1.1 Getah, kelapa sawit, ternakan dan pertanian lain
Rubber, oil palm, livestock and other agriculture
1.2
1.3
2.
3.
3.1
3.2
3.3
3.4
3.5
3.6
3.7
4.
5.
5.1
5.2
5.3
5.4
Jadual4C
Lebihan Kendalian Kasar mengikut Jenis Aktiviti Ekonomi pada Harga Semasa - Pembahagian Peratus kepada Lebihan Kendalian Kasar
Gross Operating Surplus by Kind of Economic Activity at Current Prices - Percentage Share to Gross Operating Surplus
Jenis aktiviti ekonomi2005
e2006
e2007
e2008
e2009
e
11.5 12.6 14.4 12.4 11.7Agriculture
2010e
2011e
2012e
2013p
Kind of economic activity
Pertanian 9.9 10.3 11.9 12.0
1.7 1.5 1.4 1.4 1.2Forestry and logging
9.5 11.4 9.4 8.8
Perhutanan dan pembalakan 2.0 1.9 1.9 1.6
6.5 6.9 8.7 9.0 8.1
16.6 15.6 14.9 14.9 14.6Mining and quarrying
1.6 1.6 1.7 1.7Fishing
Perlombongan dan pengkuarian18.9 19.5 18.9 21.7
Perikanan 1.4 1.4 1.4 1.4 1.6
2.9 3.1 3.3 3.2 3.0Food, beverages and tobacco
23.9 24.5 25.1 24.6Manufacturing
Makanan, minuman dan tembakau 2.3 2.1 2.3 2.7
Pembuatan 25.0 25.6 24.4 23.4 22.8
1.1 1.1 1.0 1.1 1.0Wood products, furniture, paper products, printing
and publishing
0.3 0.3 0.2 0.2Textiles, wearing apparel and leather products
Produk kayu, perabot, keluaran kertas,
percetakan dan penerbitan 1.5 1.5 1.3 1.1
Produk tekstil, pakaian dan kulit0.4 0.4 0.3 0.3 0.3
2.5 2.5 2.8 2.8 2.7Non-metallic mineral products, basic metal and
fabricated metal products
9.9 11.1 11.7 11.3Petroleum, chemical, rubber and plastic products
Produk mineral bukan logam, logam asas dan
produk logam yang direka2.1 2.2 2.5 2.5
Produk petroleum, kimia, getah dan plastik 9.4 9.5 9.1 9.7 9.0
1.9 2.0 2.1 2.3 2.6Transport equipment and other manufactures
5.0 3.9 3.8 3.8Electrical and electronic products
Peralatan pengangkutan dan pembuatan lain1.8 2.1 1.8 1.8
Produk elektrik dan elektronik 7.7 7.8 7.1 5.3 5.0
47.8 46.4 44.9 45.9 47.3Services
1.4 1.3 1.7 1.7Construction
Perkhidmatan 44.9 43.4 43.6 41.8
Pembinaan 1.3 1.2 1.1 1.1 1.4
7.4 7.3 7.4 7.8 8.1Transport & storage and communication
17.7 17.6 17.7 18.4Wholesale & retail trade, accommodation
and restaurants
Pengangkutan & penyimpanan dan komunikasi 7.9 7.5 7.1 7.0
Perdagangan borong & runcit, penginapan
dan restoran 14.8 14.5 15.7 15.8 17.8
8.8 8.3 8.0 8.1 8.5Other services
(including government services)
13.1 11.9 12.3 12.3Finance, insurance, real estate and
business services
Perkhidmatan lain
(termasuk perkhidmatan kerajaan)9.3 8.8 8.4 7.4
Kewangan, insurans, hartanah dan
perkhidmatan perniagaan 12.8 12.7 12.5 11.6 13.9
100.0 100.0 100.0 100.0Gross operating surplus
Lebihan kendalian kasar100.0 100.0 100.0 100.0 100.0
21
Table
1.
1.1 Getah, kelapa sawit, ternakan dan pertanian lain
Rubber, oil palm, livestock and other agriculture
1.2
1.3
2.
3.
3.1
3.2
3.3
3.4
3.5
3.6
3.7
4.
5.
5.1
5.2
5.3
5.4
Jadual4D
Lebihan Kendalian Kasar mengikut Jenis Aktiviti Ekonomi pada Harga Semasa - Pembahagian Peratus kepada Sektor
Gross Operating Surplus by Kind of Economic Activity at Current Prices - Percentage Share to Sector
Jenis aktiviti ekonomi2005
e2006
e2007
e2008
e2009
e
100.0 100.0 100.0 100.0 100.0Agriculture
2010e
2011e
2012e
2013p
Kind of economic activity
Pertanian 100.0 100.0 100.0 100.0
15.0 11.7 10.0 11.4 10.3Forestry and logging
75.6 79.2 75.3 75.1
Perhutanan dan pembalakan 20.1 18.8 15.7 13.1
65.6 67.2 73.0 75.5 70.7
100.0 100.0 100.0 100.0 100.0Mining and quarrying
12.7 10.8 13.3 14.5Fishing
Perlombongan dan pengkuarian100.0 100.0 100.0 100.0
Perikanan 14.2 14.0 11.3 11.4 14.3
12.9 12.9 13.7 12.9 12.3Food, beverages and tobacco
100.0 100.0 100.0 100.0Manufacturing
Makanan, minuman dan tembakau 9.2 8.3 9.6 11.3
Pembuatan 100.0 100.0 100.0 100.0 100.0
4.7 4.5 4.2 4.2 4.0Wood products, furniture, paper products, printing
and publishing
1.1 1.2 1.0 1.0Textiles, wearing apparel and leather products
Produk kayu, perabot, keluaran kertas,
percetakan dan penerbitan 5.8 6.1 5.3 4.7
Produk tekstil, pakaian dan kulit1.4 1.4 1.2 1.1 1.2
11.1 10.7 11.4 11.0 11.0Non-metallic mineral products, basic metal and
fabricated metal products
41.4 45.3 46.6 45.9Petroleum, chemical, rubber and plastic products
Produk mineral bukan logam, logam asas dan
produk logam yang direka8.2 8.6 10.3 10.7
Produk petroleum, kimia, getah dan plastik 37.4 37.3 37.2 41.6 39.7
8.4 8.5 8.4 9.2 10.5Transport equipment and other manufactures
21.0 15.8 15.1 15.4Electrical and electronic products
Peralatan pengangkutan dan pembuatan lain7.1 8.1 7.4 7.7
Produk elektrik dan elektronik 30.8 30.3 28.9 22.8 22.0
100.0 100.0 100.0 100.0 100.0Services
100.0 100.0 100.0 100.0Construction
Perkhidmatan 100.0 100.0 100.0 100.0
Pembinaan 100.0 100.0 100.0 100.0 100.0
15.4 15.6 16.5 17.1 17.1Transport & storage and communication
38.2 39.1 38.5 38.9Wholesale & retail trade, accommodation
and restaurants
Pengangkutan & penyimpanan dan komunikasi 17.7 17.2 16.2 16.7
Perdagangan borong & runcit, penginapan
dan restoran 33.1 33.4 35.9 37.8 37.2
18.4 17.9 17.9 17.7 18.0Other services
(including government services)
28.3 26.5 26.8 26.0Finance, insurance, real estate and
business services
Perkhidmatan lain
(termasuk perkhidmatan kerajaan)20.6 20.2 19.2 17.8
Kewangan, insurans, hartanah dan
perkhidmatan perniagaan 28.6 29.3 28.6 27.7 29.0

Muka surat ini sengaja dibiarkan kosong This page is deliberately left blank
22
3 3 NOTA
TEKNIKAL
TECHNICAL NOTES
2005-2013 GDP INCOME APPROACH KDNK KAEDAH PENDAPATAN

23
NOTA TEKNIKAL
1. PENGENALAN Penerbitan ini membentangkan data Keluaran Dalam Negeri
Kasar (KDNK) Kaedah Pendapatan bagi tahun 2005 hingga
2013. Data dibentangkan mengikut jenis aktiviti ekonomi pada
harga semasa. Perangkaan disusun berdasarkan konsep dan
panduan seperti yang digariskan dalam Sistem Akaun Negara
(SNA) 1993 serta saranan tertentu daripada SNA 2008 yang
dikeluarkan oleh Pertubuhan Bangsa-Bangsa Bersatu.
2. KONSEP KELUARAN
DALAM NEGERI
KASAR
KDNK boleh diukur dengan menggunakan tiga kaedah iaitu
Kaedah Pengeluaran, Perbelanjaan dan Pendapatan. Secara
konsepnya, KDNK berdasarkan ketiga-tiga kaedah ini
memberikan hasil yang sama.
Kaedah Pengeluaran KDNK berasaskan Kaedah Pengeluaran didefinisikan sebagai
jumlah nilai barangan dan perkhidmatan yang dikeluarkan
dalam ekonomi setelah ditolak dengan nilai penggunaan
perantaraan. Kaedah ini turut dikenali sebagai kaedah nilai
ditambah.
Kaedah
Perbelanjaan
KDNK berasaskan Kaedah Perbelanjaan ialah hasil jumlah
semua komponen perbelanjaan akhir (termasuk eksport)
ke atas barangan dan perkhidmatan ditolak nilai import ke atas
barangan dan perkhidmatan. Kaedah ini mengukur nilai
barangan dan perkhidmatan yang digunakan oleh pengguna
akhir ke atas barangan dan perkhidmatan yang dikeluarkan
oleh residen.
Kaedah Pendapatan KDNK berasaskan Kaedah Pendapatan ialah hasil jumlah
semua pendapatan terakru pengeluaran dalam ekonomi.
Justeru itu, kaedah ini membolehkan faktor pendapatan dan
pulangan kepada faktor pengeluaran diukur mengikut aktiviti
ekonomi. Komponen pendapatan ialah Pampasan Pekerja,
Lebihan Kendalian Kasar dan Cukai tolak Subsidi ke atas
Pengeluaran dan Import.
KDNK Kaedah Pendapatan dikira seperti berikut:
di mana;
PP - Pampasan Pekerja
LKK - Lebihan Kendalian Kasar
(C - S) - Cukai tolak Subsidi ke atas Pengeluaran dan Import
KDNK Kaedah Pendapatan = PP + LKK + ( C - S )
NOTA TEKNIKAL
24
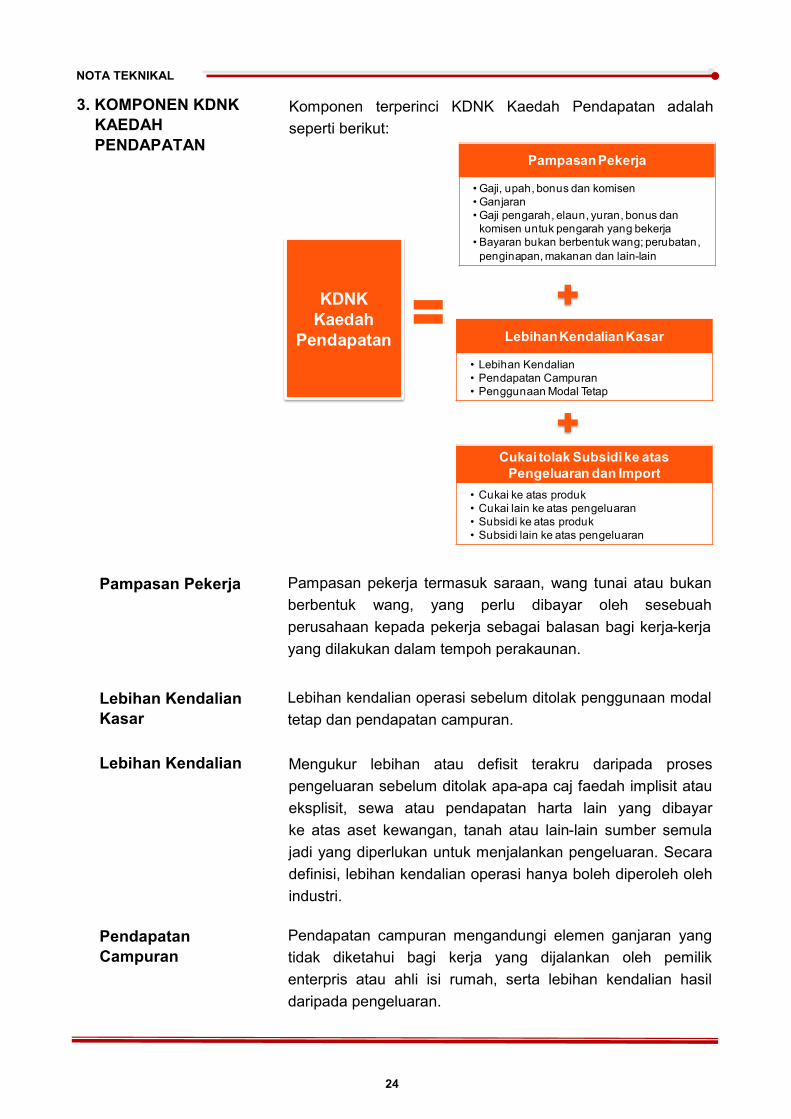
Pampasan Pekerja Pampasan pekerja termasuk saraan, wang tunai atau bukan
berbentuk wang, yang perlu dibayar oleh sesebuah
perusahaan kepada pekerja sebagai balasan bagi kerja-kerja
yang dilakukan dalam tempoh perakaunan.
Lebihan Kendalian Mengukur lebihan atau defisit terakru daripada proses
pengeluaran sebelum ditolak apa-apa caj faedah implisit atau
eksplisit, sewa atau pendapatan harta lain yang dibayar
ke atas aset kewangan, tanah atau lain-lain sumber semula
jadi yang diperlukan untuk menjalankan pengeluaran. Secara
definisi, lebihan kendalian operasi hanya boleh diperoleh oleh
industri.
Lebihan Kendalian
Kasar
Lebihan kendalian operasi sebelum ditolak penggunaan modal
tetap dan pendapatan campuran.
Pendapatan
Campuran
Pendapatan campuran mengandungi elemen ganjaran yang
tidak diketahui bagi kerja yang dijalankan oleh pemilik
enterpris atau ahli isi rumah, serta lebihan kendalian hasil
daripada pengeluaran.
3. KOMPONEN KDNK
KAEDAH
PENDAPATAN
Komponen terperinci KDNK Kaedah Pendapatan adalah
seperti berikut:
PampasanPekerja
• Gaji, upah, bonus dan komisen
• Ganjaran
• Gaji pengarah, elaun, yuran, bonus dan
komisen untuk pengarah yang bekerja
• Bayaran bukan berbentuk wang; perubatan,
penginapan, makanan dan lain-lain
LebihanKendalianKasar
• Lebihan Kendalian
• Pendapatan Campuran
• Penggunaan Modal Tetap
Cukai tolak Subsidi ke atas
Pengeluaran dan Import
• Cukai ke atas produk
• Cukai lain ke atas pengeluaran
• Subsidi ke atas produk
• Subsidi lain ke atas pengeluaran
KDNK
Kaedah
Pendapatan
NOTA TEKNIKAL
25
Penggunaan Modal
Tetap
Penggunaan modal tetap didefinisikan sebagai penurunan nilai
semasa stok aset tetap yang dimiliki dan digunakan oleh pengeluar
dalam tempoh perakaunan disebabkan oleh kerosakan fizikal,
keusangan biasa atau kerosakan biasa yang tidak disengajakan.
Cukai tolak Subsidi
ke atas Pengeluaran
dan Import
Terdiri daripada cukai ke atas produk dan cukai lain ke atas
pengeluaran ditolak subsidi ke atas produk dan subsidi
ke atas pengeluaran.
Cukai ke atas Produk Cukai yang dibayar bagi satu unit barangan atau
perkhidmatan dan biasanya akan dibayar apabila ia
dikeluarkan, dihantar, dijual, dipindah atau sebaliknya
dilupuskan oleh pihak pengeluar. Cukai tersebut mungkin
merupakan satu amaun yang spesifik bagi setiap unit kuantiti
barang atau perkhidmatan, atau ia mungkin dikira ad valorem,
sebagai peratusan spesifik harga satu unit atau nilai barang
atau perkhidmatan yang diniagakan. Contohnya, cukai jualan,
cukai eksais, duti import, duti eksport dan lain-lain.
Cukai lain ke atas
Pengeluaran
Cukai lain ke atas pengeluaran meliputi semua cukai kecuali
cukai ke atas produk yang ditanggung oleh perusahaan hasil
penglibatan dalam pengeluaran seperti bayaran ke atas
tanah, aset tetap atau buruh yang digunakan dalam proses
pengeluaran atau untuk aktiviti atau transaksi tertentu.
Contoh cukai lain ke atas pengeluaran adalah cukai yang
dibayar oleh perusahaan bagi lesen perniagaan, cukai gaji,
duti setem dan lain-lain.
Subsidi ke atas
Produk
Subsidi yang dibayar bagi satu unit barang atau
perkhidmatan. Subsidi ini mungkin dalam amaun spesifik bagi
satu unit kuantiti barang atau perkhidmatan, atau ia mungkin
dikira ad valorem sebagai peratusan spesifik harga satu unit
barang atau perkhidmatan. Subsidi ke atas produk biasanya
dibayar apabila barang atau perkhidmatan dikeluarkan, dijual
atau diimport, tetapi ia juga dibayar dalam keadaan lain
seperti apabila barang dipindah, dipajak, dihantar atau untuk
penggunaan sendiri atau pembentukan modal sendiri.
Subsidi mungkin diberikan untuk mempengaruhi tahap
pengeluaran pengusahaan residen atau harga di mana output
mereka dijual.
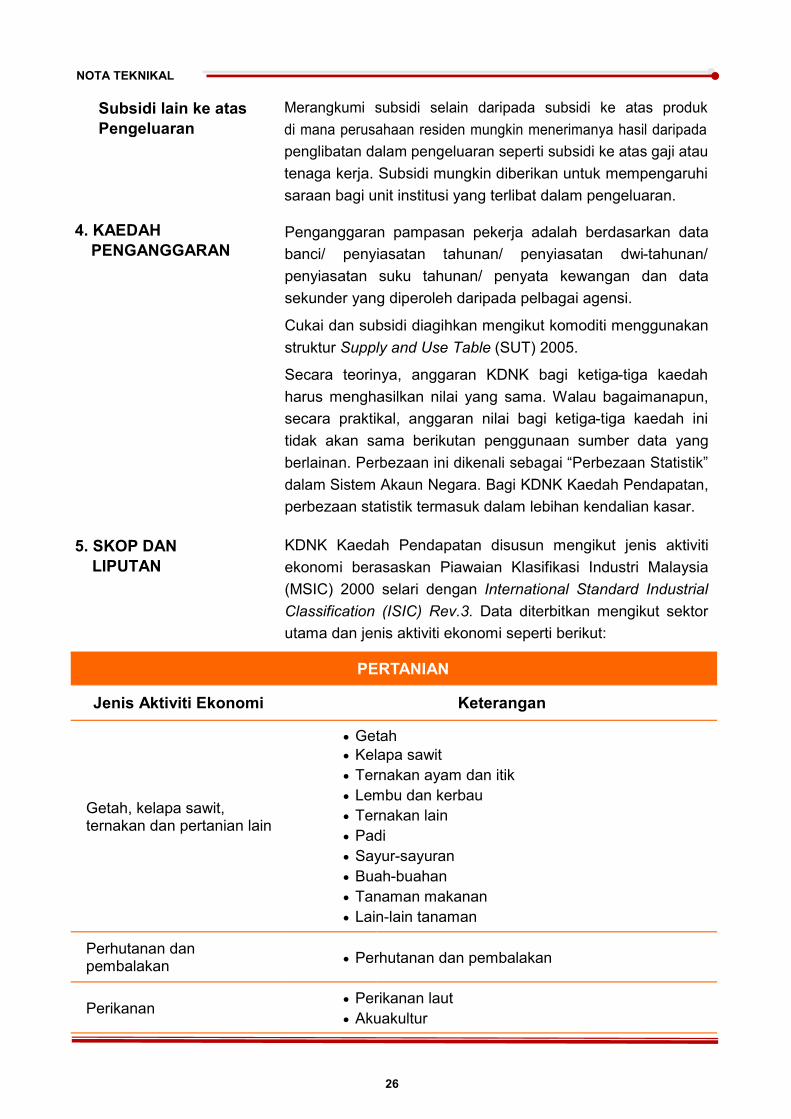
NOTA TEKNIKAL
26
Subsidi lain ke atas
Pengeluaran
Merangkumi subsidi selain daripada subsidi ke atas produk
di mana perusahaan residen mungkin menerimanya hasil daripada
penglibatan dalam pengeluaran seperti subsidi ke atas gaji atau
tenaga kerja. Subsidi mungkin diberikan untuk mempengaruhi
saraan bagi unit institusi yang terlibat dalam pengeluaran.
4. KAEDAH
PENGANGGARAN
Penganggaran pampasan pekerja adalah berdasarkan data
banci/ penyiasatan tahunan/ penyiasatan dwi-tahunan/
penyiasatan suku tahunan/ penyata kewangan dan data
sekunder yang diperoleh daripada pelbagai agensi.
Cukai dan subsidi diagihkan mengikut komoditi menggunakan
struktur Supply and Use Table (SUT) 2005.
Secara teorinya, anggaran KDNK bagi ketiga-tiga kaedah
harus menghasilkan nilai yang sama. Walau bagaimanapun,
secara praktikal, anggaran nilai bagi ketiga-tiga kaedah ini
tidak akan sama berikutan penggunaan sumber data yang
berlainan. Perbezaan ini dikenali sebagai “Perbezaan Statistik”
dalam Sistem Akaun Negara. Bagi KDNK Kaedah Pendapatan,
perbezaan statistik termasuk dalam lebihan kendalian kasar.
5. SKOP DAN
LIPUTAN
KDNK Kaedah Pendapatan disusun mengikut jenis aktiviti
ekonomi berasaskan Piawaian Klasifikasi Industri Malaysia
(MSIC) 2000 selari dengan International Standard Industrial
Classification (ISIC) Rev.3. Data diterbitkan mengikut sektor
utama dan jenis aktiviti ekonomi seperti berikut:
PERTANIAN
Jenis Aktiviti Ekonomi Keterangan
Getah, kelapa sawit, ternakan dan pertanian lain
Getah
Kelapa sawit
Ternakan ayam dan itik
Lembu dan kerbau
Ternakan lain
Padi
Sayur-sayuran
Buah-buahan
Tanaman makanan
Lain-lain tanaman
Perhutanan dan pembalakan
Perhutanan dan pembalakan
Perikanan Perikanan laut
Akuakultur
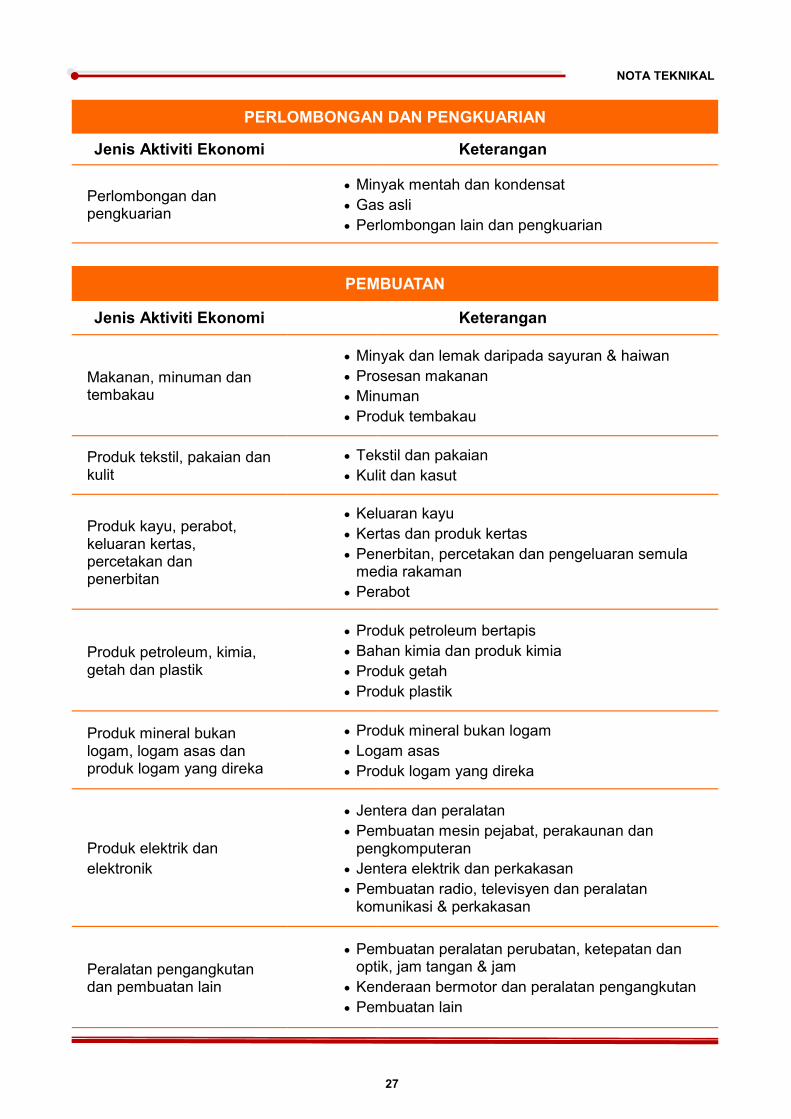
NOTA TEKNIKAL
27
PEMBUATAN
Jenis Aktiviti Ekonomi Keterangan
Makanan, minuman dan tembakau
Minyak dan lemak daripada sayuran & haiwan
Prosesan makanan
Minuman
Produk tembakau
Produk tekstil, pakaian dan kulit
Tekstil dan pakaian
Kulit dan kasut
Produk kayu, perabot, keluaran kertas, percetakan dan penerbitan
Keluaran kayu
Kertas dan produk kertas
Penerbitan, percetakan dan pengeluaran semula media rakaman
Perabot
Produk petroleum, kimia, getah dan plastik
Produk petroleum bertapis
Bahan kimia dan produk kimia
Produk getah
Produk plastik
Produk mineral bukan logam, logam asas dan produk logam yang direka
Produk mineral bukan logam
Logam asas
Produk logam yang direka
Produk elektrik dan
elektronik
Jentera dan peralatan
Pembuatan mesin pejabat, perakaunan dan pengkomputeran
Jentera elektrik dan perkakasan
Pembuatan radio, televisyen dan peralatan komunikasi & perkakasan
Peralatan pengangkutan dan pembuatan lain
Pembuatan peralatan perubatan, ketepatan dan optik, jam tangan & jam
Kenderaan bermotor dan peralatan pengangkutan
Pembuatan lain
PERLOMBONGAN DAN PENGKUARIAN
Jenis Aktiviti Ekonomi Keterangan
Perlombongan dan pengkuarian
Minyak mentah dan kondensat
Gas asli
Perlombongan lain dan pengkuarian

NOTA TEKNIKAL
28
PEMBINAAN
Jenis Aktiviti Ekonomi Keterangan
Pembinaan
Bangunan kediaman
Bangunan bukan kediaman
Kejuruteraan awam
Pertukangan khas
PERKHIDMATAN
Jenis Aktiviti Ekonomi Keterangan
Perdagangan borong & runcit, penginapan dan restoran
Borong
Runcit
Kenderaan bermotor
Penginapan
Restoran
Pengangkutan & penyimpanan dan komunikasi
Pengangkutan darat
Pengangkutan air
Pengangkutan udara
Pelabuhan dan operasi lapangan terbang
Lain-lain aktiviti sokongan pengangkutan
Pos dan kurier
Telekomunikasi
Kewangan, insurans, hartanah & perkhidmatan perniagaan
Kewangan
Insurans
Hartanah
Profesional
Perkhidmatan komputer
Lain-lain perkhidmatan perniagaan
Perkhidmatan lain
Utiliti
Perkhidmatan kesihatan swasta
Perkhidmatan pendidikan swasta
Perkhidmatan swasta lain
Perkhidmatan kerajaan
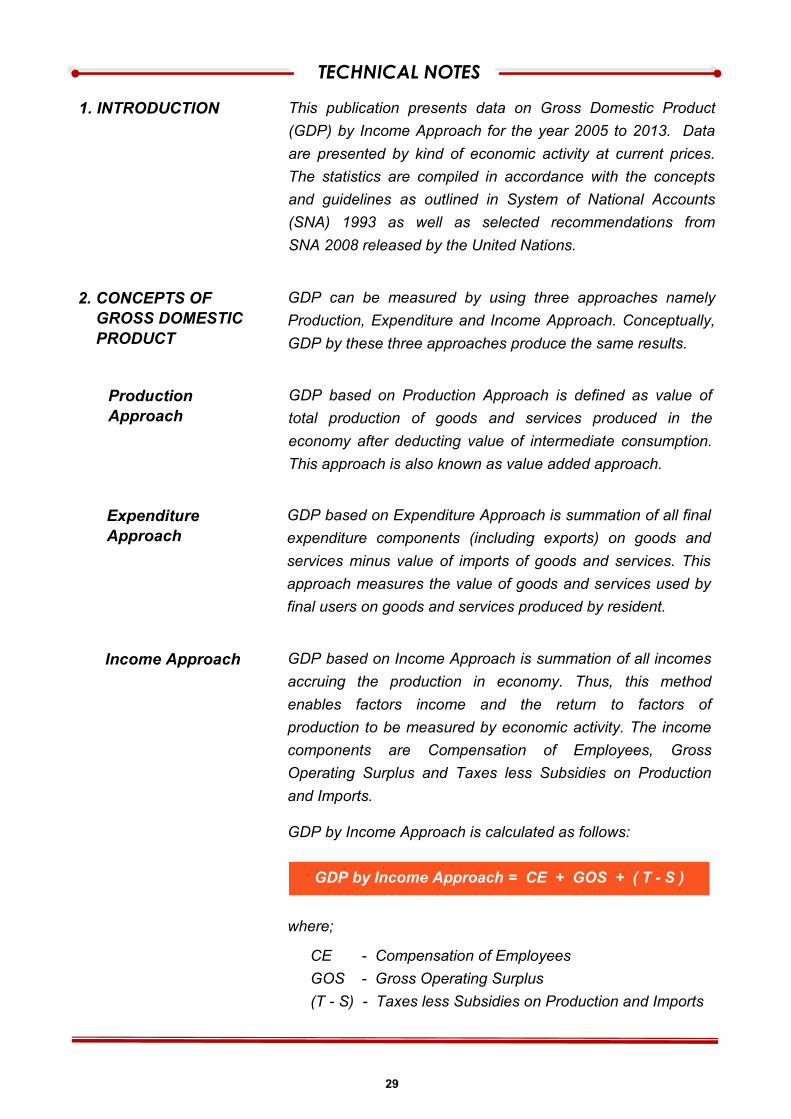
29
TECHNICAL NOTES
1. INTRODUCTION This publication presents data on Gross Domestic Product
(GDP) by Income Approach for the year 2005 to 2013. Data
are presented by kind of economic activity at current prices.
The statistics are compiled in accordance with the concepts
and guidelines as outlined in System of National Accounts
(SNA) 1993 as well as selected recommendations from
SNA 2008 released by the United Nations.
2. CONCEPTS OF
GROSS DOMESTIC
PRODUCT
GDP can be measured by using three approaches namely
Production, Expenditure and Income Approach. Conceptually,
GDP by these three approaches produce the same results.
Production
Approach
GDP based on Production Approach is defined as value of
total production of goods and services produced in the
economy after deducting value of intermediate consumption.
This approach is also known as value added approach.
Expenditure
Approach
GDP based on Expenditure Approach is summation of all final
expenditure components (including exports) on goods and
services minus value of imports of goods and services. This
approach measures the value of goods and services used by
final users on goods and services produced by resident.
Income Approach GDP based on Income Approach is summation of all incomes
accruing the production in economy. Thus, this method
enables factors income and the return to factors of
production to be measured by economic activity. The income
components are Compensation of Employees, Gross
Operating Surplus and Taxes less Subsidies on Production
and Imports.
GDP by Income Approach is calculated as follows:
where;
CE - Compensation of Employees
GOS - Gross Operating Surplus
(T - S) - Taxes less Subsidies on Production and Imports
GDP by Income Approach = CE + GOS + ( T - S )
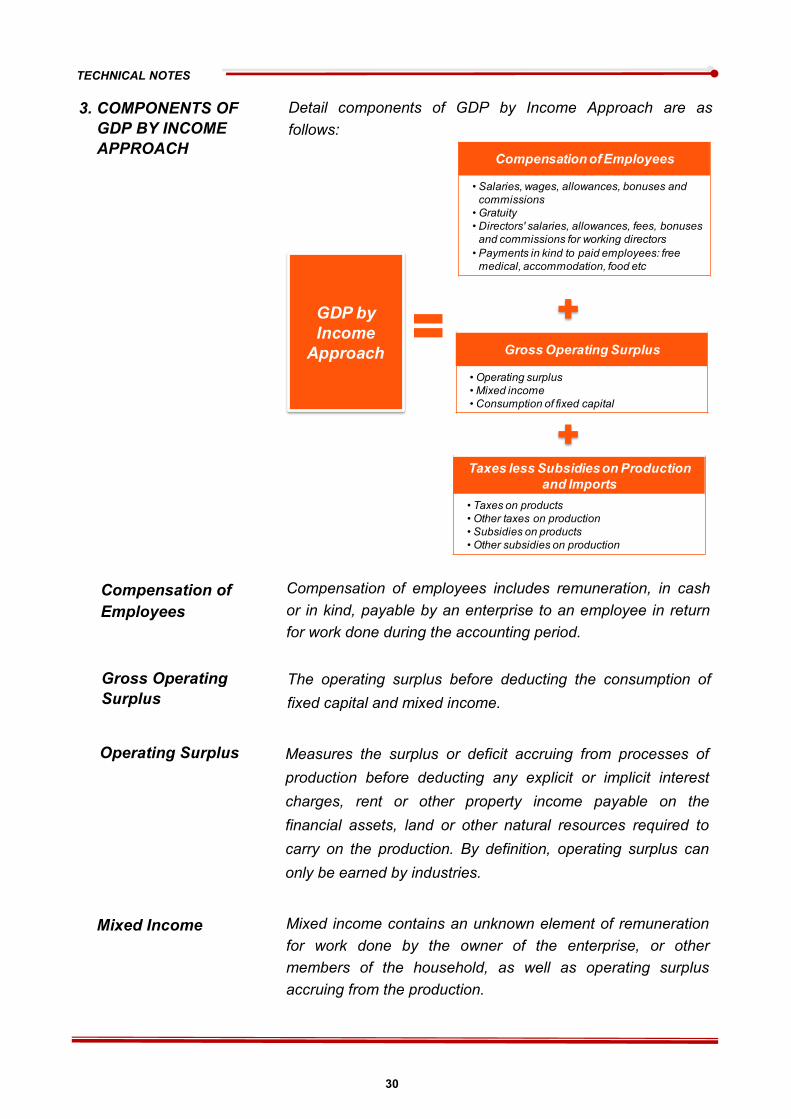
TECHNICAL NOTES
30
3. COMPONENTS OF
GDP BY INCOME
APPROACH
Detail components of GDP by Income Approach are as
follows:
Compensation of
Employees
Compensation of employees includes remuneration, in cash
or in kind, payable by an enterprise to an employee in return
for work done during the accounting period.
Operating Surplus Measures the surplus or deficit accruing from processes of
production before deducting any explicit or implicit interest
charges, rent or other property income payable on the
financial assets, land or other natural resources required to
carry on the production. By definition, operating surplus can
only be earned by industries.
Gross Operating
Surplus
The operating surplus before deducting the consumption of
fixed capital and mixed income.
Mixed Income Mixed income contains an unknown element of remuneration
for work done by the owner of the enterprise, or other
members of the household, as well as operating surplus
accruing from the production.
Compensation of Employees
• Salaries, wages, allowances, bonuses and
commissions
• Gratuity
• Directors' salaries, allowances, fees, bonuses
and commissions for working directors
• Payments in kind to paid employees: free
medical, accommodation, food etc
Gross Operating Surplus
• Operating surplus
• Mixed income
• Consumption of fixed capital
Taxes less Subsidies on Production
and Imports
• Taxes on products
• Other taxes on production
• Subsidies on products
• Other subsidies on production
GDP by
Income
Approach

TECHNICAL NOTES
31
Consumption of
Fixed Capital
Consumption of fixed capital is defined as the decline, during
the course of the accounting period, in the current value of the
stock of fixed assets owned and used by a producer as a
result of physical deterioration, normal obsolescence or
nominal accidental damage.
Taxes less Subsidies
on Production and
Imports
Consists of taxes on products and other taxes on production
less subsidies on product and other subsidies on production.
Taxes on Products Taxes that are payable per unit of some goods or services
and usually become payable when they are produced,
delivered, sold, transferred or otherwise disposed by their
producer. The tax may be a specific amount of money per unit
of quantity of a good or service, or it may be calculated
ad valorem as a specified percentage of the price per unit or
value of the goods or services transacted. For example, sales
taxes, excise taxes, import duties, export duties, etc.
Other Taxes on
Production
Other taxes on production consist of all taxes except taxes on
products that enterprises incur as a result of engaging in
production such as taxes payable on land, fixed assets or
labour employed in the production process or certain
activities or transactions. Examples of other taxes on
production are taxes payable by enterprises for business
licenses, payroll taxes, stamp duties, etc.
Subsidies on
Products
A subsidy payable per unit of a good or service. The subsidy
may be a specific amount of money per unit of quantity of a
good or service, or it may be calculated ad valorem as a
specified percentage of the price per unit of the goods or
services. A subsidy on products usually becomes payable
when the good or service is produced, sold or imported, but it
may be also payable in other circumstances such as when a
good is transferred, leased, delivered or used for own
consumption or own capital formation.
The subsidy may be designed to influence resident
enterprises’ levels of production or the prices at which their
outputs are sold.
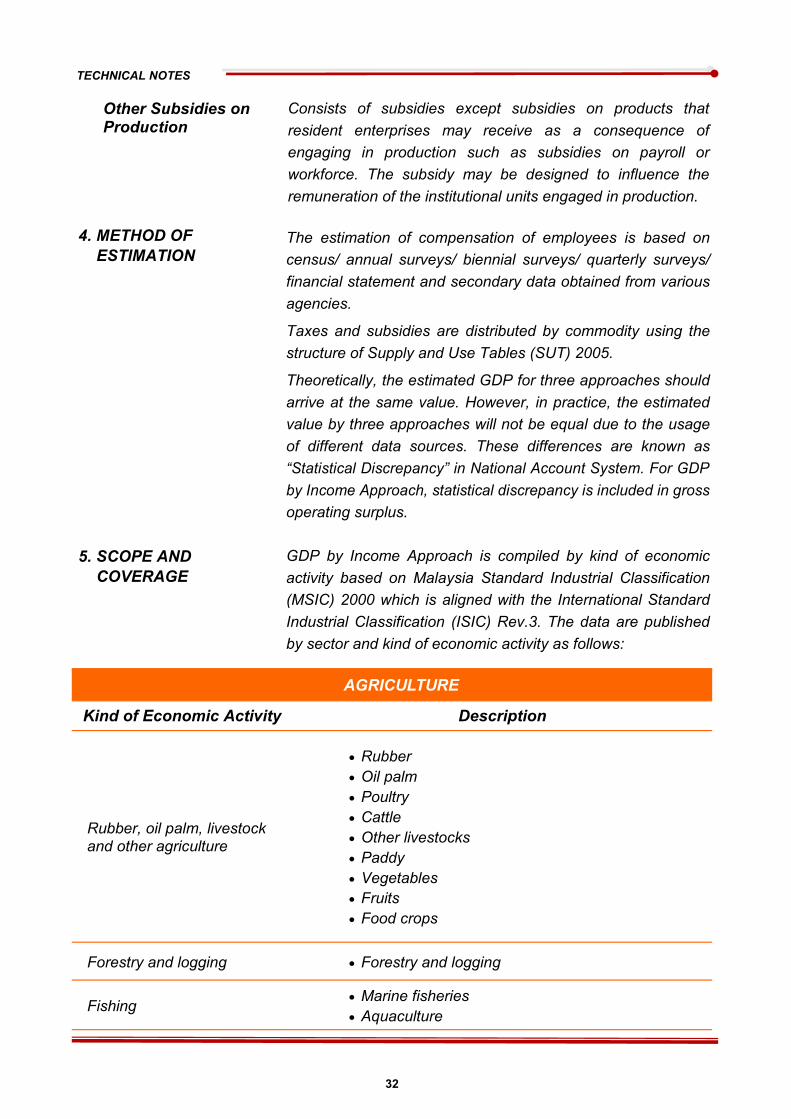
TECHNICAL NOTES
32
4. METHOD OF
ESTIMATION
The estimation of compensation of employees is based on
census/ annual surveys/ biennial surveys/ quarterly surveys/
financial statement and secondary data obtained from various
agencies.
Taxes and subsidies are distributed by commodity using the
structure of Supply and Use Tables (SUT) 2005.
Theoretically, the estimated GDP for three approaches should
arrive at the same value. However, in practice, the estimated
value by three approaches will not be equal due to the usage
of different data sources. These differences are known as
“Statistical Discrepancy” in National Account System. For GDP
by Income Approach, statistical discrepancy is included in gross
operating surplus.
5. SCOPE AND
COVERAGE
GDP by Income Approach is compiled by kind of economic
activity based on Malaysia Standard Industrial Classification
(MSIC) 2000 which is aligned with the International Standard
Industrial Classification (ISIC) Rev.3. The data are published
by sector and kind of economic activity as follows:
AGRICULTURE
Kind of Economic Activity Description
Rubber, oil palm, livestock and other agriculture
Rubber
Oil palm
Poultry
Cattle
Other livestocks
Paddy
Vegetables
Fruits
Food crops
Forestry and logging Forestry and logging
Fishing Marine fisheries
Aquaculture
Other Subsidies on Production
Consists of subsidies except subsidies on products that
resident enterprises may receive as a consequence of
engaging in production such as subsidies on payroll or
workforce. The subsidy may be designed to influence the
remuneration of the institutional units engaged in production.
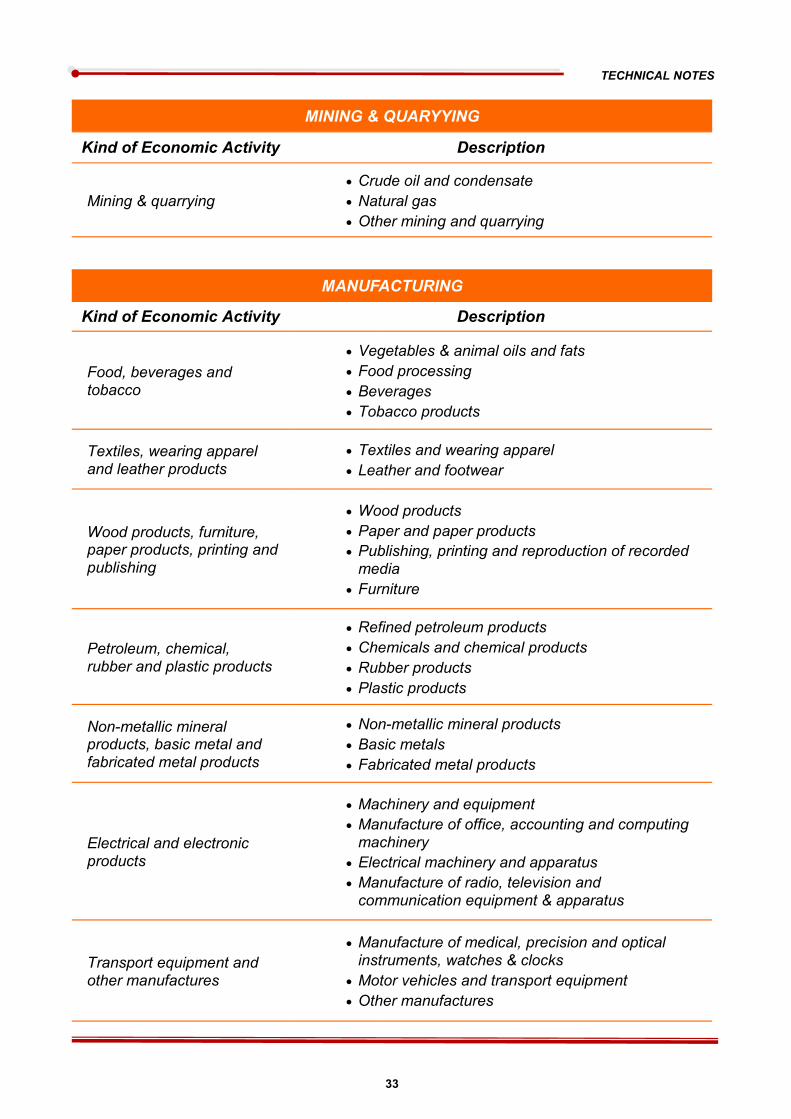
TECHNICAL NOTES
33
MANUFACTURING
Kind of Economic Activity Description
Food, beverages and tobacco
Vegetables & animal oils and fats
Food processing
Beverages
Tobacco products
Textiles, wearing apparel and leather products
Textiles and wearing apparel
Leather and footwear
Wood products, furniture, paper products, printing and publishing
Wood products
Paper and paper products
Publishing, printing and reproduction of recorded media
Furniture
Petroleum, chemical, rubber and plastic products
Refined petroleum products
Chemicals and chemical products
Rubber products
Plastic products
Non-metallic mineral products, basic metal and fabricated metal products
Non-metallic mineral products
Basic metals
Fabricated metal products
Electrical and electronic products
Machinery and equipment
Manufacture of office, accounting and computing machinery
Electrical machinery and apparatus
Manufacture of radio, television and communication equipment & apparatus
Transport equipment and other manufactures
Manufacture of medical, precision and optical instruments, watches & clocks
Motor vehicles and transport equipment
Other manufactures
MINING & QUARYYING
Kind of Economic Activity Description
Mining & quarrying
Crude oil and condensate
Natural gas
Other mining and quarrying
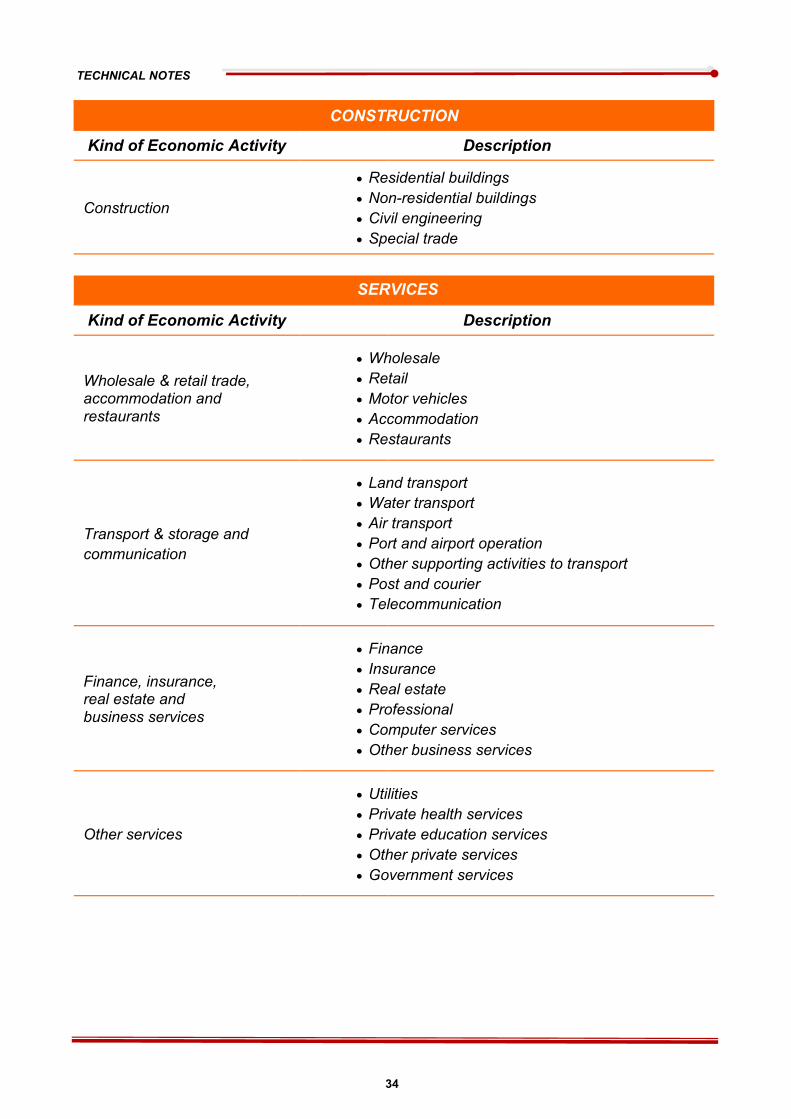
TECHNICAL NOTES
34
CONSTRUCTION
Kind of Economic Activity Description
Construction
Residential buildings
Non-residential buildings
Civil engineering
Special trade
SERVICES
Kind of Economic Activity Description
Wholesale & retail trade, accommodation and restaurants
Wholesale
Retail
Motor vehicles
Accommodation
Restaurants
Transport & storage and
communication
Land transport
Water transport
Air transport
Port and airport operation
Other supporting activities to transport
Post and courier
Telecommunication
Finance, insurance, real estate and business services
Finance
Insurance
Real estate
Professional
Computer services
Other business services
Other services
Utilities
Private health services
Private education services
Other private services
Government services
2005-2013 4 4 SUMBER
DATA
DATA SOURCES
GDP INCOME APPROACH KDNK KAEDAH PENDAPATAN

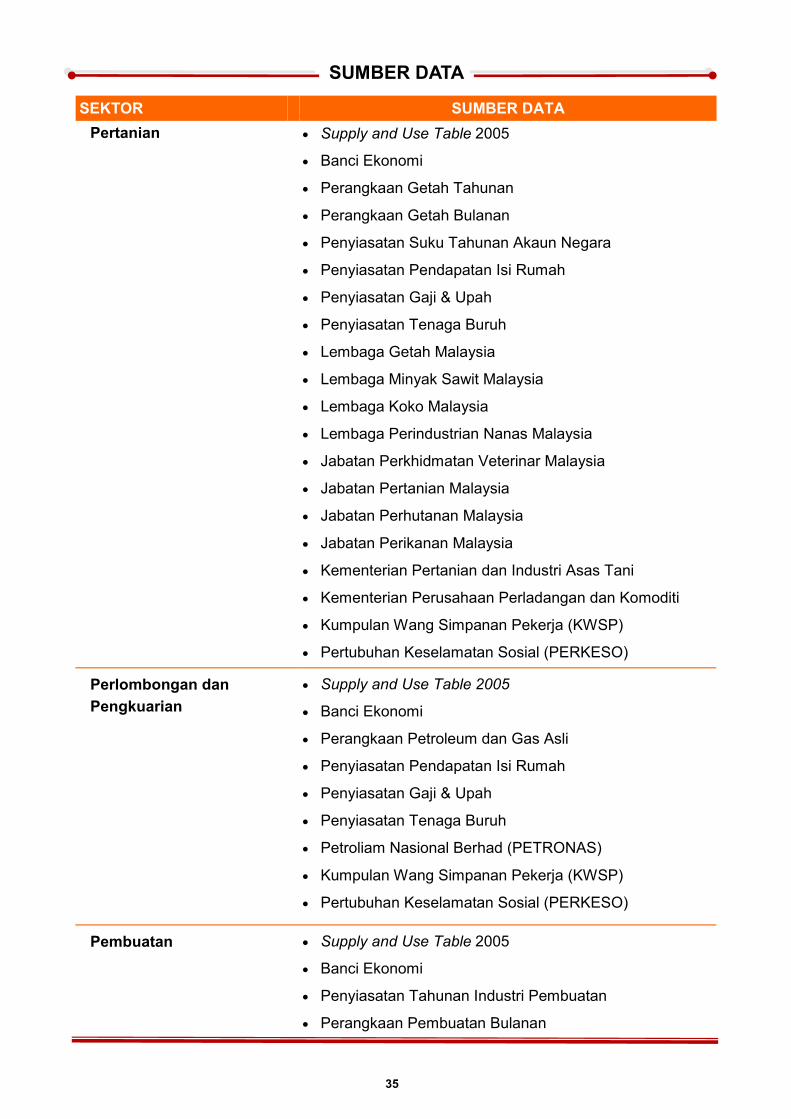
35
SUMBER DATA
Pertanian Supply and Use Table 2005
Banci Ekonomi
Perangkaan Getah Tahunan
Perangkaan Getah Bulanan
Penyiasatan Suku Tahunan Akaun Negara
Penyiasatan Pendapatan Isi Rumah
Penyiasatan Gaji & Upah
Penyiasatan Tenaga Buruh
Lembaga Getah Malaysia
Lembaga Minyak Sawit Malaysia
Lembaga Koko Malaysia
Lembaga Perindustrian Nanas Malaysia
Jabatan Perkhidmatan Veterinar Malaysia
Jabatan Pertanian Malaysia
Jabatan Perhutanan Malaysia
Jabatan Perikanan Malaysia
Kementerian Pertanian dan Industri Asas Tani
Kementerian Perusahaan Perladangan dan Komoditi
Kumpulan Wang Simpanan Pekerja (KWSP)
Pertubuhan Keselamatan Sosial (PERKESO)
Perlombongan dan
Pengkuarian
Supply and Use Table 2005
Banci Ekonomi
Perangkaan Petroleum dan Gas Asli
Penyiasatan Pendapatan Isi Rumah
Penyiasatan Gaji & Upah
Penyiasatan Tenaga Buruh
Petroliam Nasional Berhad (PETRONAS)
Kumpulan Wang Simpanan Pekerja (KWSP)
Pertubuhan Keselamatan Sosial (PERKESO)
Pembuatan Supply and Use Table 2005
Banci Ekonomi
Penyiasatan Tahunan Industri Pembuatan
Perangkaan Pembuatan Bulanan
SEKTOR SUMBER DATA
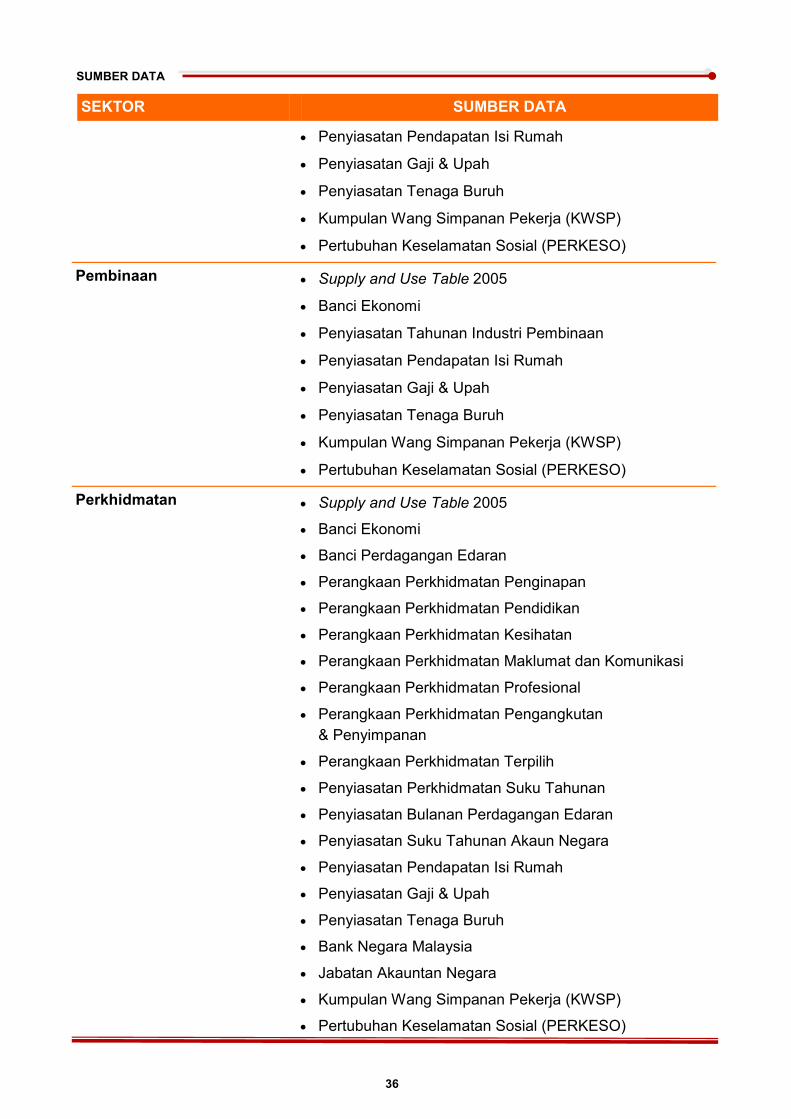
SUMBER DATA
36
Penyiasatan Pendapatan Isi Rumah
Penyiasatan Gaji & Upah
Penyiasatan Tenaga Buruh
Kumpulan Wang Simpanan Pekerja (KWSP)
Pertubuhan Keselamatan Sosial (PERKESO)
Pembinaan Supply and Use Table 2005
Banci Ekonomi
Penyiasatan Tahunan Industri Pembinaan
Penyiasatan Pendapatan Isi Rumah
Penyiasatan Gaji & Upah
Penyiasatan Tenaga Buruh
Kumpulan Wang Simpanan Pekerja (KWSP)
Pertubuhan Keselamatan Sosial (PERKESO)
Perkhidmatan Supply and Use Table 2005
Banci Ekonomi
Banci Perdagangan Edaran
Perangkaan Perkhidmatan Penginapan
Perangkaan Perkhidmatan Pendidikan
Perangkaan Perkhidmatan Kesihatan
Perangkaan Perkhidmatan Maklumat dan Komunikasi
Perangkaan Perkhidmatan Profesional
Perangkaan Perkhidmatan Pengangkutan
& Penyimpanan
Perangkaan Perkhidmatan Terpilih
Penyiasatan Perkhidmatan Suku Tahunan
Penyiasatan Bulanan Perdagangan Edaran
Penyiasatan Suku Tahunan Akaun Negara
Penyiasatan Pendapatan Isi Rumah
Penyiasatan Gaji & Upah
Penyiasatan Tenaga Buruh
Bank Negara Malaysia
Jabatan Akauntan Negara
Kumpulan Wang Simpanan Pekerja (KWSP)
Pertubuhan Keselamatan Sosial (PERKESO)
SEKTOR SUMBER DATA
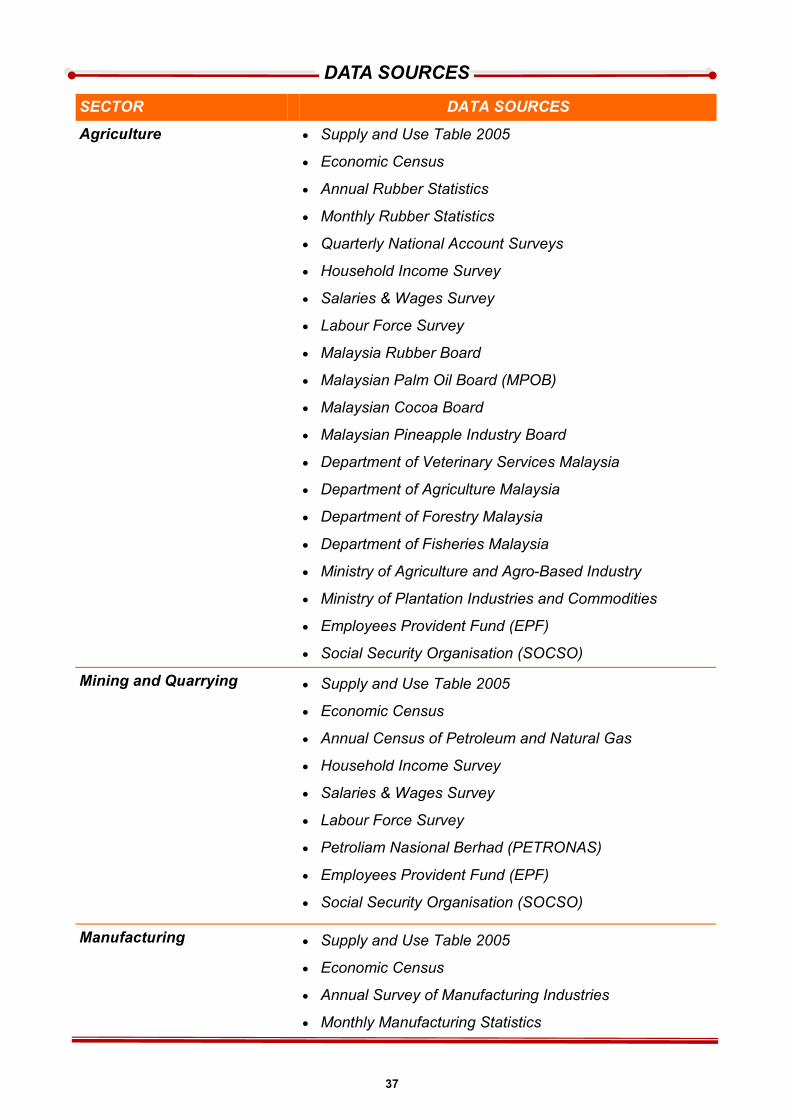
37
DATA SOURCES
Agriculture Supply and Use Table 2005
Economic Census
Annual Rubber Statistics
Monthly Rubber Statistics
Quarterly National Account Surveys
Household Income Survey
Salaries & Wages Survey
Labour Force Survey
Malaysia Rubber Board
Malaysian Palm Oil Board (MPOB)
Malaysian Cocoa Board
Malaysian Pineapple Industry Board
Department of Veterinary Services Malaysia
Department of Agriculture Malaysia
Department of Forestry Malaysia
Department of Fisheries Malaysia
Ministry of Agriculture and Agro-Based Industry
Ministry of Plantation Industries and Commodities
Employees Provident Fund (EPF)
Social Security Organisation (SOCSO)
Mining and Quarrying Supply and Use Table 2005
Economic Census
Annual Census of Petroleum and Natural Gas
Household Income Survey
Salaries & Wages Survey
Labour Force Survey
Petroliam Nasional Berhad (PETRONAS)
Employees Provident Fund (EPF)
Social Security Organisation (SOCSO)
Manufacturing Supply and Use Table 2005
Economic Census
Annual Survey of Manufacturing Industries
Monthly Manufacturing Statistics
SECTOR DATA SOURCES
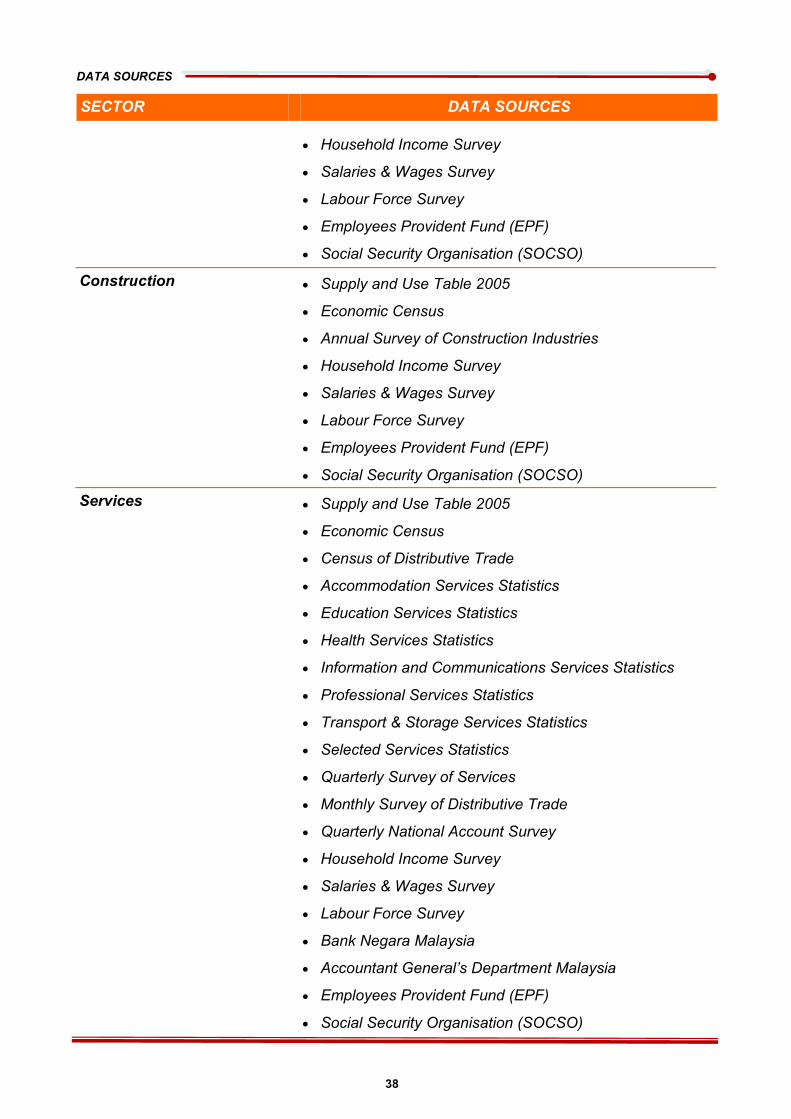
DATA SOURCES
38
Household Income Survey
Salaries & Wages Survey
Labour Force Survey
Employees Provident Fund (EPF)
Social Security Organisation (SOCSO)
Construction Supply and Use Table 2005
Economic Census
Annual Survey of Construction Industries
Household Income Survey
Salaries & Wages Survey
Labour Force Survey
Employees Provident Fund (EPF)
Social Security Organisation (SOCSO)
Services Supply and Use Table 2005
Economic Census
Census of Distributive Trade
Accommodation Services Statistics
Education Services Statistics
Health Services Statistics
Information and Communications Services Statistics
Professional Services Statistics
Transport & Storage Services Statistics
Selected Services Statistics
Quarterly Survey of Services
Monthly Survey of Distributive Trade
Quarterly National Account Survey
Household Income Survey
Salaries & Wages Survey
Labour Force Survey
Bank Negara Malaysia
Accountant General’s Department Malaysia
Employees Provident Fund (EPF)
Social Security Organisation (SOCSO)
SECTOR DATA SOURCES