Embed Size (px)
Citation preview
Japan’s Experience with
Human Resources for Health Policies
Japan International Cooperation Agency (JICA)
HM
JR
13-65

Except where permitted by the Copyright Law for “personal use” or “quotation” purposes, no part of
this paper may be reproduced in any form or by any means without the permission. Any quotation
from this paper requires indication of the source.
The report was prepared under the editorial supervision of Kiyoshi Kodera, Vice-President, Japan
International Cooperation Agency. The contents of the report were written by Kiyoshi Kodera and
other JICA staff members: Yojiro Ishii, JICA Visiting Advisor; Tsunenori Aoki, Deputy Director, Health
Division 4, Human Development Department; Tatsuya Ashida, Deputy Director, Grant Aid Project
Management Division 2, Financing Facilitation and Procurement Supervision Department; and
Chiharu Abe, an HRH consultant in the Human Development Department.
The views expressed in this paper do not necessarily reflect the views of the Japan International
Cooperation Agency.
Contact
Japan International Cooperation Agency (JICA)
(Human Development Department)
Nibancho Center Building
5-25, Niban-cho, Chiyoda-ku, Tokyo 102-8012, Japan
TEL: +81-3-5226-6660
URL: http://www.jica.go.jp
■ Preface
This report reviews Japan‟s history of Human Resources for Health (HRH) policies during the
period from 1945 to 1980 to draw lessons for today‟s developing countries as a contribution to the Annual
Meetings of the International Monetary Fund and the World Bank Group in 2012.
Although a number of studies has been published on Japan‟s experiences with HRH in the
Japanese language, those written in English are yet to be disseminated broadly in the international
community. The Japan International Cooperation Agency (JICA) published "History of Public Health and
Medical Systems in Japan" in 2004, reviewing the progress of health systems in Japan and drawing
implications for development assistance, though the attempt was not necessarily adequate.
In this report, the review of Japan‟s HRH development focuses on the period from the post-war
through the 1980s, and it considers proximity with today‟s developing countries in terms of per capita
GDP. It has also attempted to extract lessons from Japan‟s HRH history, taking into account today‟s HRH
issues in developing countries and the global HRH policy framework of the 21st century.
The report has been prepared by staff members of JICA, who are not academic experts of health
economics and finance, but have worked in the field of development aid. It is our wish that the report, as
Japan‟s contribution to global health, should be read as a reference by many HRH policy makers and
partners in developing countries.
We acknowledge the helpful comments made by Professor Keizo Takemi, Senior Fellow, Japan
Center for International Exchange; Professor Naoki Ikegami, Keio University; Professor Hideki
Hashimoto, University of Tokyo; Professor Shuzo Nishimura, Director General, National Institute of
Population and Social Security Research; and the members of Japan - World Bank Joint Research for
universal health coverage. We are also very grateful for suggestions and advice from the members of the
Ministry of Finance, Ministry of Foreign Affairs, and Ministry of Health, Labor and Welfare of Japan.
Various information on HRH was provided by JICA staff: experts, advisors and staff members of the
Human Development Department. Detailed information on nurses, public health nurses and midwives of
Japan and developing countries were given by Ms. Satoko Horii and Ms. Maki Agawa, ex-Associate
Experts of JICA. The advice on description and composition of the report was given by Mr. Hiroshi Kato,
Senior Special Advisor.
We are very grateful that the report could be completed with all this cooperation.
April, 2013
Kiyoshi Kodera
Vice-President
Japan International Cooperation Agency

Table of contents
■ Preface
■ Introduction ................................................................................................................................................. 1
1. Purpose of the Report ............................................................................................................................... 1
2. Scope and Focal Points of the Report ...................................................................................................... 1
3. Features of Japan‟s Health Systems and HRH ........................................................................................ 2
■ Part I Historical Background 1868 to 1945 Meiji Restoration to the end of World War II................. 9
Chapter 1 Medical Doctors ..................................................................................................................... 11
Chapter 2 Midwives ................................................................................................................................ 15
Chapter 3 Nurses ................................................................................................................................... 17
Chapter 4 Public Health Nurses ............................................................................................................. 18
■ Part II From 1945 to 1980 Post-War Reconstruction to the end of high economic growth ............. 20
Socio-Economic Conditions and Issues in Health Administration .............................................................. 20
Chapter 1 From post-war reconstruction to high economic growth, 1945 to 1960 (Per capita GDP
$1,300-$4,000 era) ............................................................................................................................. 24
1. Medical Doctors ....................................................................................................................................... 25
(1) Response to excessive number of medical colleges............................................................................. 25
(2) Unification of the educational system and reduction of student quotas ................................................ 26
(3) Introduction of public health education and determination of the duration of education....................... 26
(4) Introduction of the intern system and the national qualification examinations ...................................... 27
2. Nurses, Midwives and Public Health Nurses .......................................................................................... 28
(1) The need for regulation .......................................................................................................................... 28
(2) Enactment of the Law for Public Health Nurses, Midwives and Nurses and introduction of the
system of assistant nurses ................................................................................................................. 29
(3) Expansion of public health activities based on health centers .............................................................. 30
(4) Community health activities by public health nurses and midwives ...................................................... 31
(5) Changing needs and roles of public health nurses and midwives ........................................................ 32
Chapter 2 From 1960 to 1970 High Growth Period (Per capita GDP $ 4,000 - $ 10,000 era)................... 34
1. Medical Doctors ....................................................................................................................................... 34
(1) Changing perceptions of the number of medical doctors (from surplus to shortage) ......................... 34
(2) Expanded quotas at existing medical schools (medical faculties) ........................................................ 36
(3) Abolishment of the internship system and implementation of the clinical training system ................... 38
(4) Embryonic stage of specialized doctor system ..................................................................................... 38
2. Nurses ..................................................................................................................................................... 39
(1) Need for improving the working environment surrounding nurses and assistant nurses ..................... 39
(2) Reinforcing education for assistant nurses and support for nurses who are re-entering the work
force .................................................................................................................................................... 42
(3) Upgrading of training schools and support for assistant nurses to become nurses ............................. 43
(4) Improvements in working environment and salary conditions............................................................... 44
3. Midwives .................................................................................................................................................. 45
(1) Rapid increase in hospital deliveries and medicalized deliveries ......................................................... 45
(2) Sharp decrease in the number of self-employed midwives and the gradual increase of employed
midwives ............................................................................................................................................. 47
4. Public Health Nurses ............................................................................................................................... 47
(1) Expansion of health centers according to local characteristics and collaboration with local
municipalities ...................................................................................................................................... 48
(2) Diversification of the work of public health nurses and cooperation between public health nurses at
health centers and public health nurses employed by national health insurance societies. ............. 48
Chapter 3 From 1970 to 1980 Period of Stable Growth (GDP $10,000 to $13,000 era) ........................... 50
1 Medical Doctors ........................................................................................................................................ 50
(1) Shortage and geographical maldistribution of medical doctors ............................................................ 50
(2) Increase of medical education capacity by establishing new medical universities ............................... 51
(3) Measures for Health and Medical Services in Remote Areas ............................................................... 53
(4) Incentive mechanism of Jichi Medical University .................................................................................. 54
(5) Medical education focused on community health and primary care. .................................................... 56
2. Nurses ..................................................................................................................................................... 56
(1) Prolonged shortage of nurses and improvement in the quality of nursing education ........................... 56
(2) Formulation of medium-term or long-term development program of nurses and the increase in
nursing-related budgets ...................................................................................................................... 56
(3) Improvement in quality of nursing education ......................................................................................... 57
3. Midwives and Public Health Nurses ........................................................................................................ 58
(1) Development of “national health promotion program” and the changing role of health centers and
local municipalities .............................................................................................................................. 58
(2) Further diversification of the work of public health nurses and the expansion of their activities in
municipalities. ..................................................................................................................................... 59
(3) Change in the role of midwives.............................................................................................................. 59
■Part III HRH political measures in Japan and lessons for developing countries ...................................... 61
1. Summary of periods ................................................................................................................................ 61
(1) 1868 to 1945 From the Meiji Restoration to the end of World War II (Per capita GDP
$500-$3,000-$1,300era) ..................................................................................................................... 61
(2) 1945 to 1960 From Post-War Reconstruction to high economic growth (Per capita GDP
$1,300-$4,000 era) ............................................................................................................................. 61
(3) 1960 to 1970 Period of high economic growth (Per capita GDP $4,000-$10,000 era) ........................ 61
(4) 1970 to 1980 Period of stable growth (Per capita GDP $10,000-$13,000 era) .................................... 62
2. Lessons from Japan's HRH experiences for developing countries ........................................................ 62
(1) Characteristics of Japan's HRH policies until 1980 ............................................................................... 62
(2) Lessons from Japan's HRH experiences for developing countries ....................................................... 63
■Remarks .................................................................................................................................................... 68

■References ................................................................................................................................................ 69
(1) Transition of the Ministries in charge ..................................................................................................... 69
(2) Transition of relevant laws ..................................................................................................................... 69
(3) Chronicle ................................................................................................................................................ 69
(4) Per Capita GDP 2008 (1990 International Geary-Khamis dollars) ....................................................... 72
List of figures and tables
Fig. 1 International trends in numbers of medical doctors and nurses ......................................................... 7
Fig. 2 Trends in numbers of medical doctors per 100,000 in selected countries ......................................... 8
Fig. 3 Numbers of medical doctors and nurses per beds in selected countries 2008 .................................. 8
Fig. 4 Trends in per capita GDP in selected countries 1868-1950 ............................................................... 9
Fig. 5 Trends in population by urban/rural areas 1898-1940 ........................................................................ 9
Fig. 6 Trends in numbers of medical doctors by background 1874-1944 .................................................. 12
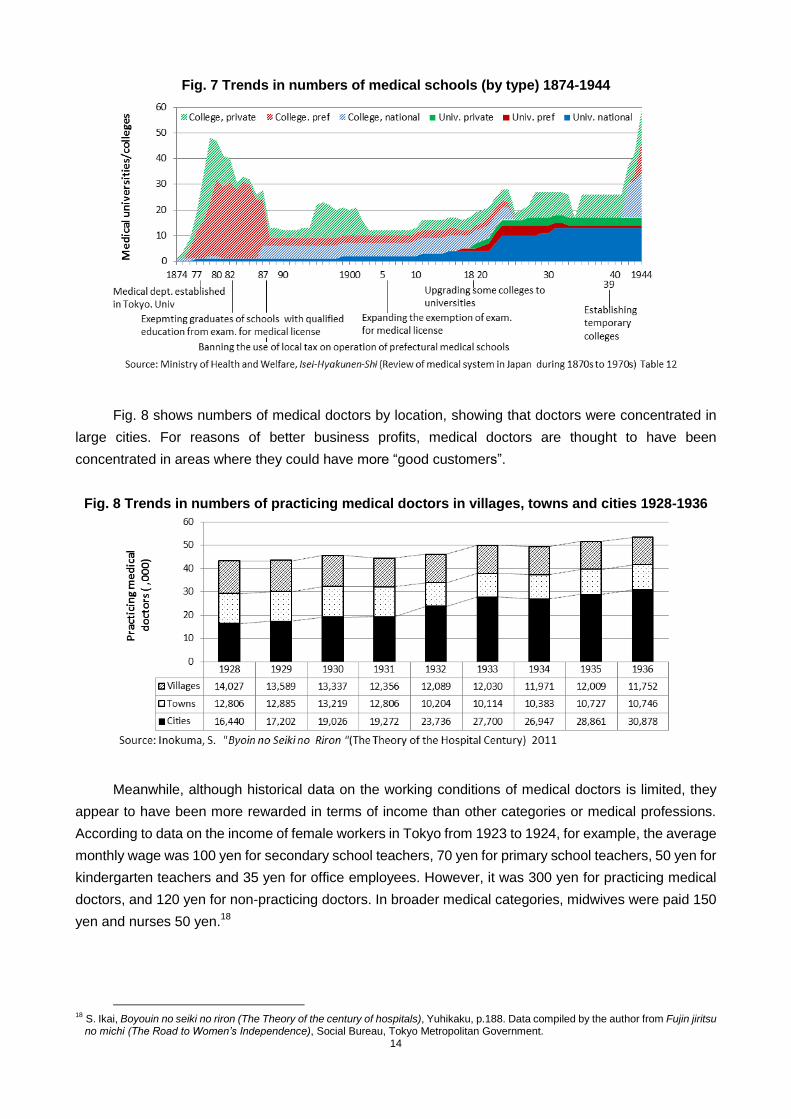
Fig. 7 Trends in numbers of medical schools (by type) 1874-1944 ............................................................ 14
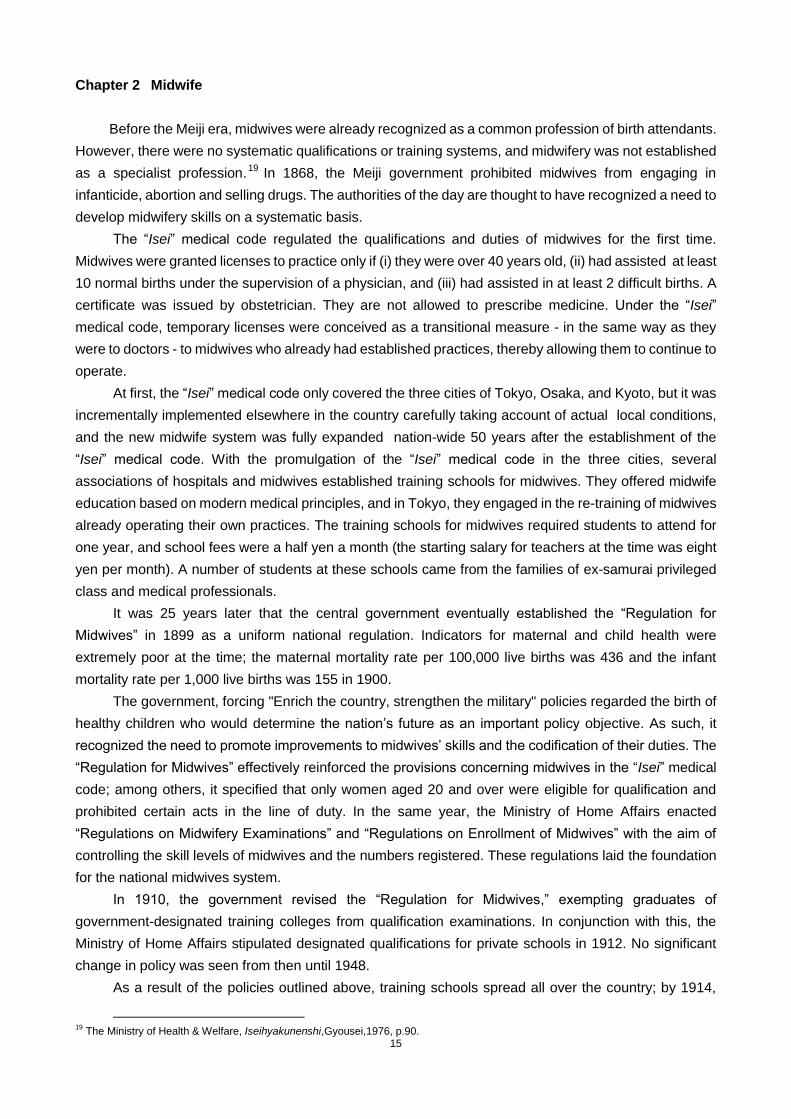
Fig. 8 Trends in numbers of practicing medical doctors in villages, towns and cities 1928-1936 .............. 14
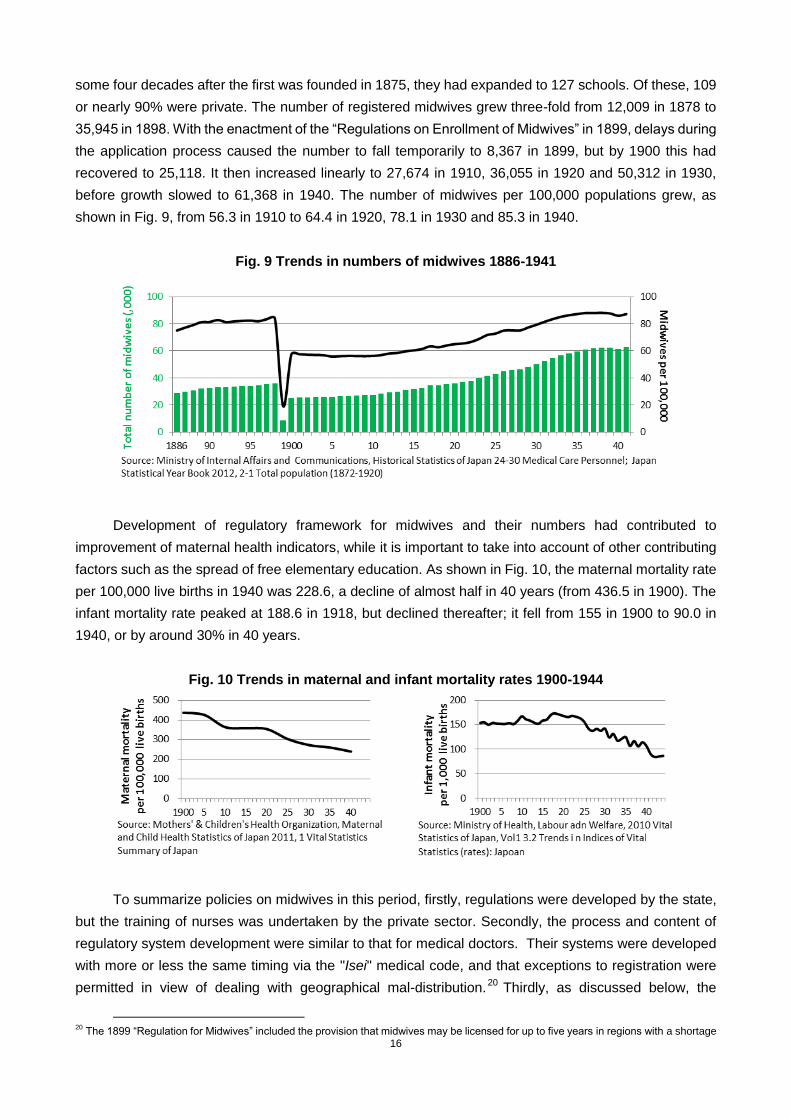
Fig. 9 Trends in numbers of midwives 1886-1941 ...................................................................................... 16
Fig. 10 Trends in maternal and infant mortality rates 1900-1944 ............................................................... 16
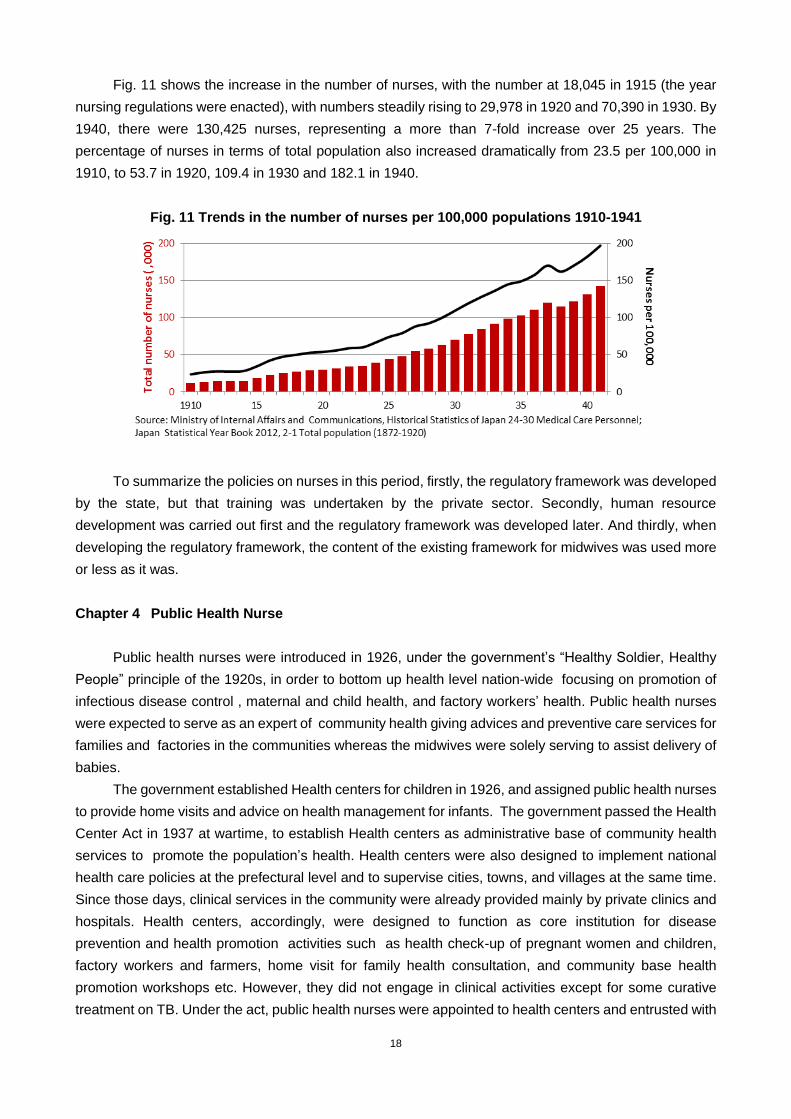
Fig. 11 Trends in the number of nurses per 100,000 population 1910-1941 ............................................. 18
Fig. 12 Trends in per capita GDP in selected countries 1945-1980 ........................................................... 21
Fig. 13 Trends in population by urban/rural areas 1947-1980 .................................................................... 21
Fig. 14 Trends in total fertility rate and life expectancy at birth 1947-1980 ................................................ 22
Fig. 15 Trends in national medical expenditure 1955-1980 ........................................................................ 22
Fig. 16 Trends in the number of medical facilities and hospital beds ......................................................... 23
Fig. 17 Trends in the number of healthcare centers and of their employees ............................................. 23
Fig. 18 Trends in numbers of educational institutions for medical doctors and students 1938-1962 ........ 25
Fig. 19 Trends in numbers of candidates in national examinations to become medical doctors
1946-1960 ........................................................................................................................................... 28
Fig. 20 Trends in numbers of nurses, assistant nurses and beds 1940-1962 ........................................... 30
Fig. 21 Trends in the amount of subsidies to healthcare centers and the ratio in the budget of the
Ministry of Health and Welfare ........................................................................................................... 31
Fig. 22 Trends in maternal mortality rate and infant mortality rate 1947-1980 ........................................... 32
Fig. 23 Change in the rates of home and institutional deliveries 1947-1980 ............................................. 33
Fig. 24 Trends in treatment ratios and the number of medical doctors 1948-1980.................................... 35
Fig. 25 Trends in number of medical schools and their total capacity 1960-1969 ..................................... 37
Fig. 26 Trends in number and ratio of medical doctors 1940-1980 ............................................................ 37
Fig. 27 Trends in numbers of medical doctors per 100,000 in selected countries ..................................... 38
Fig. 28 Changes in cause-specific mortality 1947-1980 ............................................................................. 39
Fig. 29 Trends in numbers of medical institutions and hospital beds 1950-1980 ...................................... 40
Fig. 30 Quota and enrollments in nursing schools 1964 ............................................................................ 41
Fig. 31 Trends in numbers of nurses and assistant nurses 1945-1980 ..................................................... 43
Fig. 32 Trends in numbers of nursing schools 1950-1980 ......................................................................... 44
Fig. 33 Trends in the number of births, of midwives and of births by place (1950-2000) .......................... 46
Fig. 34 Change in numbers of midwives by work place 1955-1986 ........................................................... 47
Fig. 35 Change in numbers of public health nurses by work place 1960-1980 .......................................... 49
Fig. 36 Trends in number of medical schools and their total capacity 1970-1980 ..................................... 53
Fig. 37 Trends in number and ratio of medical doctors 1940-1980 ............................................................ 53
Fig. 38 Trends in number of medically underserved areas and population 1966-1984エラー! ブックマークが定義されていません。
Fig. 39 Trends in numbers of medical doctors per 100,000 by prefecture 1935-1978 .............................. 55
Fig. 40 Trends in numbers of medical doctors in major cities and villages 1958-1978 .............................. 55
Fig. 41 Change in the number of health centers and municipal health centers ......................................... 59
Fig. 42 Change in the number of public health nurses by workplace ......................................................... 59
Fig. 43 Change in the number of midwives and of births............................................................................ 60
Table 1 Leading causes of death from 1900 to 1945 ................................................................................. 10
Table 2 Nursing-related budget of the Ministry of Health and Welfare in the 1960s .................................. 45
Table 3 Transition of the Ministry of Health and Welfare budget for nurses in the 1970s ......................... 57

1
■ Introduction
1. Purpose of the Report
Building effective and efficient health systems is essential for achieving sustainable universal
health coverage. Many developing countries, however, face shortages and a mal-distribution of Human
Resources for Health (HRH), including medical doctors, nurses and other health professionals, which is
one of the most crucial elements of a health system. The World Health Organization (WHO) reported a
global shortage of 4.25 million health professionals in their annual report “Working together for health” in
2006, and called for urgent actions to be taken against a shortage of 2.4 million medical doctors,
midwives and nurses in 57 HRH crisis countries suffering from serious problems of human resources.1 In
Sub-Saharan Africa particularly, the number of medical doctors, midwives and nurses was less than 11.2
per 10,000 people in 2010. This is far from the 23 per 10,000 people ratio targeted by WHO.
There exist various challenges to overcoming HRH difficulties: national plans for HRH are
developed without supportive evidence and budget; education is not effective due to lack of facilities and
shortage of teachers; students lack knowledge of basic education; students and their parents cannot pay
tuition; quality of educational institutions is not standardized; health professionals are not assigned in
remote areas; unsafe working environment causes accidents; needs of healthcare cannot be satisfied
due to the poor quality of the health workforce; workers are not motivated for their work.
Experiences in a country with a different history and at different times may not necessarily suggest
possible solutions to the present problems of developing countries. However, those involved in HRH
policies in Japan in the past also faced the aforementioned problems. This report reviews Japan‟s history
of HRH policies during the period from 1945 to 1980 to draw lessons for today‟s developing countries.
During that period, through high economic growth, the country changed from one in a post-conflict stage
to one with the longest life expectancy of the world. Specifically, Japan's HRH policies covered not only
medical doctors, but also midwives, nurses and public health nurses in the said period.
2. Scope and Focal Points of the Report
This report mainly reviews the years from 1945 to 1980. According to the historical statistics of per
capita GDP in 1990 International Geary Khamis dollars by Angus Maddison, Japan‟s economy expanded
ten times from $1,300 to $13,000 during this period. This change corresponds to a shift from a low to an
upper middle income country in the world today. The values of per capita GDP of 2008 in the same
statistics are $1,000 or below in Somalia, Afghanistan and Haiti; $1,000 to $2,000 in Sudan, Laos and
Nicaragua; $2,000 to $3,000 in Mozambique, Vietnam and Bolivia; $3,000 to $4,000 in Egypt, Myanmar
and Ecuador; $4,000 to $5,000 in South Africa, Indonesia and Guatemala; $5,000 to $10,000 in Turkey,
Thailand, China and Brazil; and $10,000 to $13,000 in Malaysia and Argentina.2 This report focuses on
Japan‟s policy experience in the said period to draw some lessons for developing countries in respective
stages corresponding to those of economic growth in Japan, although their social situation and level of
1 The criteria of HRH crisis countries are “on average, countries with fewer than 2.5 health care professionals (counting only doctors, nurses and midwives) per 1,000 populations failed to achieve an 80% coverage rate for deliveries by skilled birth attendants or for measles immunization”. WHO, The World Health Report, WHO, 2006.
2 Source: Angus Maddison, Historical Statistics of the World Economy: 1-2008 AD. For more detail, see Appendices. The values of per capita GDP in the report are all shown in 1990 International GK$ by Maddison.
2
available current technologies are different from those of Japan at respective periods in the past.
The period from 1945 to 1980 in Japan were that of reconstruction after the war and continued
economic growth. During this time, though poor, Japan quickly rose to become a country with the longest
life expectancy in the world. The Japanese government worked with the General Headquarters of the
Supreme Command of the Allied Powers (GHQ) and pro-actively invested in public health. Citizens‟
health remarkably improved as a result. In the early 1950s, although the national income was low, life
expectancy began to rise considerably (14 years gained from 1947 to 1955) through improvements in
maternal and child health, free treatment of tuberculosis, and other necessary interventions including the
improvement of water and sewage systems. Universal health insurance coverage was achieved in 1961.
Geographical and economic disparities in health status remained small.
To facilitate the understanding of readers, the report also looks at HRH policies in the pre-war
period as necessary. The report overviews the period since the Meiji Restoration in 1868, including the
introduction of qualification standards for HRH, development of medical education at national universities,
and the rapid increase of HRH including nurses backed by the “ healthy people, healthy soldier” policy in
1930s and early 1940s, and it sees how such policies have been restructured after 1945.
The report focuses not only on Japanese medical doctors, but also nurses and midwives, as well as
public health nurses. The report also refers to the three steps of HRH education - entry, workforce and
exit, based on the “working lifespan approach” mentioned in the 2006 WHO report. 3
It should be noted that since the 1980s, as Japan‟s aging society became evident, new health
issues such as elderly care and controlling social welfare spending have gained attention. Consequently,
most researchers on Japanese health policies are interested in the review of the period after 1980,
although this report focuses the post-war period when Japan was poor.
3. Features of Japan’s Health System and HRH
For the benefit of non-Japanese readers, key features of Japan's health system and HRH are
summarized in this section.
First, the features of Japan's health system until 1980 are as follows.
(1) During the pre-war period, the health insurance system was developed to cover 70% of the
population and HRH increased to 3.68 per 1,000 persons by 1940. The transition from a traditional
to a modern medical system took sixty years.
Japan established free compulsory primary education at the beginning of the 20th century and the
standard of women's education and literacy rates among mothers, which was important for maternal and
child health, was already high from that time. The insurance system was introduced in 1922, and 70% of
citizens were covered by health insurance before 1945. Universal health insurance coverage was
achieved in 1961.
Training systems of HRH for medical doctors, nurses, and midwives were refined through the
pre-war period, and the total number of health workers reached to 3.68 per 1,000 persons by 1940.
Transition from traditional medicine to western medicine took some sixty years since the Meiji
Restoration in mid-19th century, as mentioned in Part I.
3 WHO, The World Health Report 2006, WHO, 2006, Overview xvii.

3
(2) The private sector runs the majority of hospitals and clinics.
In Japan, most health facilities are private. Doctors can open clinics at their liberty as long as they
have license. As of 1980, out of total 9,055 hospitals in Japan, 7,233 (79.9%) were private while 1,822
(20%) were public. Out of 77,611 general clinics, 73,321 (94.5%) were private and 4,290 (5.5%) were
public. 4 In contrast to this, most health facilities in developing countries are public.
Though national hospitals were founded following the introduction of a modern medical system in
1874, private physicians remained the main actor of service delivery. Later in the 1950s and 1960s, the
proportion of private hospitals increased further, through granting corporate status to private hospitals
and introducing low interest loans to establish and expand private hospitals.
Such dominance of private services was rooted in the law, which allowed a qualified medical doctor
to set up his/her clinic in any place with minimum requirements. In addition, it was difficult to meet the
growing needs of healthcare only through the expansion of public hospitals/clinics.
(3) Relatively low national medical expenditures among OECD countries as a share of GDP (5% in
1980). Central government subsidizes the health insurance schemes and controls the fee
schedule, which contributes to low health expenditures.
The proportion of GDP allocated to total health expenditures was 8.5% (2008) in Japan. Japan was
ranked 20th among member states of the Organization for Economic Co-operation and Development
(OECD).
Healthcare expenditures have remained relatively low, in spite of the dominant private health
service delivery and pay-for-service system. The reasons for the low level of health expenditures were
explained by a notion that the Japanese public tends to avoid expensive surgical treatment, and the cost
of health care was strictly controlled by the unified fee schedule system in the Ministry of Health and
Finance.
In revising the fee schedule, it was common that the Ministry of Finance requested a lowering of
expenditures, organizations such as medical and nursing associations requested an increase in
expenditures, and the Ministry of Health and Welfare provided expert knowledge and played a leading
role in arbitrating different interests.
Regulating medical fees by sub-specialty was one of the tools of the Ministry of Health and Welfare
to control HRH policy. National medical expenditures constantly increased after the war. The proportion
of expenditures borne by patients, however, was 30.0% in 1960, fell to 19.3% in 1970 because of
measures such as free healthcare for elderly, and further fell to 11.3% by 1980. On the other hand, the
proportion of expenditures paid by insurers remained around 50% (50.4%, 53.0%, 53.2%) and the
proportion borne by the national and local governments gradually rose (19.6%, 27.6%, 35.5%) in the
same period.
* Comparing the relationship between medical service delivery and cost burdens with those of USA, UK, France and
Germany, the USA has the same system as Japan with health services provided by the private sector, but it is also
characterized by private burdens of cost. In UK, France and Germany, unlike Japan, medical service delivery is
covered by a public system, but costs are also borne by public system as well. In terms of finance, France and Germany
have a social insurance system like Japan, while UK system is based on tax. In Japan‟s case, a social insurance
4 The Ministry of Health and Welfare, Annual Report on Health and Welfare, JFY 1981 and JFY 2010.
4
system started with the enactment of the Health Insurance Act in 1922, and was implemented from 1927. This was
modeled on the German social insurance system and aimed at working people (employees). In 1938, the National
Health Insurance Act aimed at inhabitants of rural areas and self-employed people was enacted and brought into force.
Up to around 1955, 30 million citizens (about 30% of the general population) were uninsured, but since universal
medical care insurance was achieved in 1961, no major changes have been made to the system until the present day.
(4) Public health nurses and community health centers played a key role in improving the health
status of individuals through home visit care for TB patients, vaccinations, mother and child
health checks, and health promotion activities.
Public/municipal health centers and public health nurses who worked there had a role in
administration at the prefecture/municipal level. At the same time, they carried out health services in the
community such as health check-ups, vaccinations, and health consultations for disease prevention and
health promotion.
The functions of public/municipal health centers were diversified responding to the health needs in
the community. There were much fewer public health centers (845) and municipal health centers (303)
than private facilities in 1980. Therefore they collaborated with private health facilities in the community
and played an important role to coordinate planned health activities of maternal and child health,
non-communicable diseases, elderly care, environmental health and others. Ccollaboration between the
public sector and private sector in respective prefectures/municipalities was considered most important in
improving the population‟s health status in the period after 1945.
The characteristics of Japan‟s HRH development are as follows.
(1) Regulations on health professions are legislated mainly by the central government, neither by
professional associations nor local governments.
The central government plays a main role in regulating HRH in Japan. In the US, professional
duties and licensing of medical doctors are governed by respective states, while examinations for
qualifications are regulated by the federal government. In the UK, all of these processes are operated by
the General Medical Council, a non-profit organization. In contrast to these examples, all the regulations
are legislated and managed by the central government in Japan.
In Japan, rregulations for medical doctors and midwives were initially established in 1874, followed
by that for nurses in 1915 and public health nurses in 1941. In 1948, all of the existing systems were
consolidated.
The Ministry of Education was in charge at the beginning in 1872. The administration was shifted to
the Ministry of Internal Affairs, in charge of local administration and polices, in 1874, because it was
urgent to establish a social quarantine system to prevent imported infectious diseases. Later in 1938, the
Ministry of Health and Welfare, a special ministry for health administration, was established.
(2) Nationwide examinations are conducted to accredit health professionals.
In Japan, it is required to pass a national qualifying examination in order to obtain a health
professional license. There are many countries that have no nationwide qualifying examinations. For
instance, in Egypt and Honduras, licenses are granted upon graduation from educational and training
institutions. In the US, licenses are periodically examined and renewed by states.

5
In Japan, although qualifying examinations had been given by the local government before 1945, a
national examination for medical doctors was established by law in 1946 and for nurses, midwives and
public health nurses in 1948. These licenses are valid for life. Assistant nurses acquire licenses from
prefectural bodies, and their licenses are valid nationwide.
(3) Central government leads medical education, while private sector plays key role in nursing
and midwifery education.
Medical education is led by the central government in Japan. Out of all the medical universities all
over the country5, 50 universities (60%) are established by the central and local governments. The central
government has continued to subsidize current expenses of local governmental and private medical
universities since FY1970. On the other hand, many training schools for nurses, midwives and public
health nurses are managed by local governments and the private sector. As of 2011, 20% and 75% of the
1,037 nursing schools (3 year and 2 year courses) are managed by local governments and the private
sector respectively. Similarly, 23% and 65% of the 75 of midwifery schools are managed by local
governments and the private sector, and all of the training schools of public health nurses are founded by
either local governments or the private sector.6 Moreover, 79% of the universities and colleges that have
four year courses for nurses, midwives and public health nurses are run either by local governments or
the private sector.7
The central government developed the guidelines for private midwife schools in 1912, nursing
schools in 1915, and schools of public health nurses in 1941.
Incidentally, private training schools are increasing in the Philippines, Vietnam and other countries,
but most of those training schools in Asia, Africa and Latin America are public.
(4) Medical doctors can proclaim their sub-specialties without legal restriction, except for
anesthesiology.
In Japan, medical doctors can legally proclaim any of the sub-specialties except for anesthesiology.
Accreditation systems for specialties are provided not by law but by academic societies with their own
respective criteria and examinations. Korea and France have governmental accreditations of specialists,
while the US and UK have accreditations by third parties subsidized by the central government. In Japan,
the accreditation of specialists only began in the 1980s and the accreditation process, including training,
varies by academic society. Furthermore, general practice is not recognized as a sub-specialty. The skills
of specialist as being of a certain standard are evaluated with those accreditation systems. It is
considered that such a system would not obstruct patients‟ free access to medical care while inhibit
attempts to create more efficiency by differentiating medical facilities.
(5) Strong and implicit control of university’s medical department over doctors’ career formation
and human resources allocation
In Japan, doctors tend to have a sense of belonging to the medical departments in universities
where they graduated rather than to academic societies or their work places. This trend has continued
5 As of 2012, there were 79 medical universities in Japan, and 29 of these were private institutions. These figures have not changed since 1979. "Medical university" in the report means a medical university and a university with a medical department.
6The Ministry of Health, Labour and Welfare, 2011 Kangoshitou gakkouyouseijyo nyugakujyokou oyobi sotsugyousei syugyou jyoukyou cyousa (Survey on the status of enrollment into nurse training schools and the status of employment of the graduates in 2011), 2011.
7 Tallied up data based on the web page (http://nurse.shikakuseek.com/school.html) for seeking qualifications.
6
since the 1960s. Young doctors develop their careers and get promoted within a closed network in the
medical departments of their universities and related local hospitals. In this context, medical departments
have provided reserves of doctors that can be dispatched to hospitals which face serious shortages of
personnel. On the other hand, some believe that developing medical techniques in respective medical
departments of universities hinders the standardization of special treatments. Others suggest that
working in local hospitals prevents doctors from enhancing their skills as specialists.
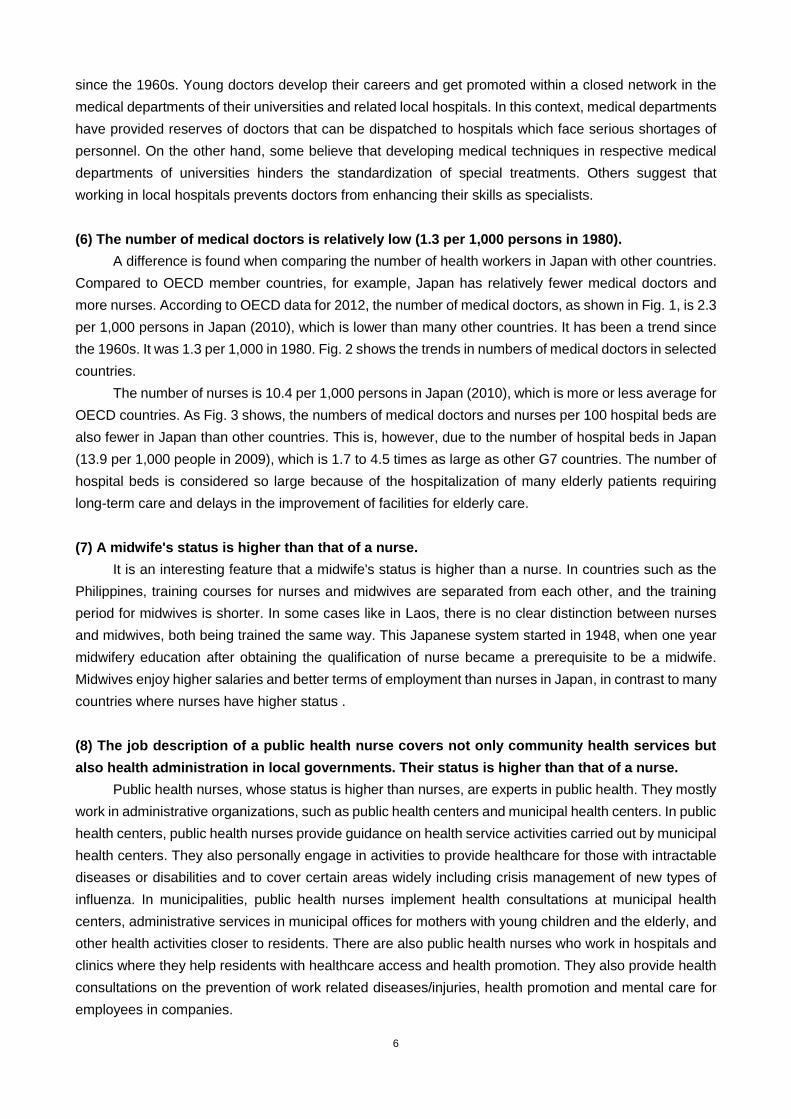
(6) The number of medical doctors is relatively low (1.3 per 1,000 persons in 1980).
A difference is found when comparing the number of health workers in Japan with other countries.
Compared to OECD member countries, for example, Japan has relatively fewer medical doctors and
more nurses. According to OECD data for 2012, the number of medical doctors, as shown in Fig. 1, is 2.3
per 1,000 persons in Japan (2010), which is lower than many other countries. It has been a trend since
the 1960s. It was 1.3 per 1,000 in 1980. Fig. 2 shows the trends in numbers of medical doctors in selected
countries.
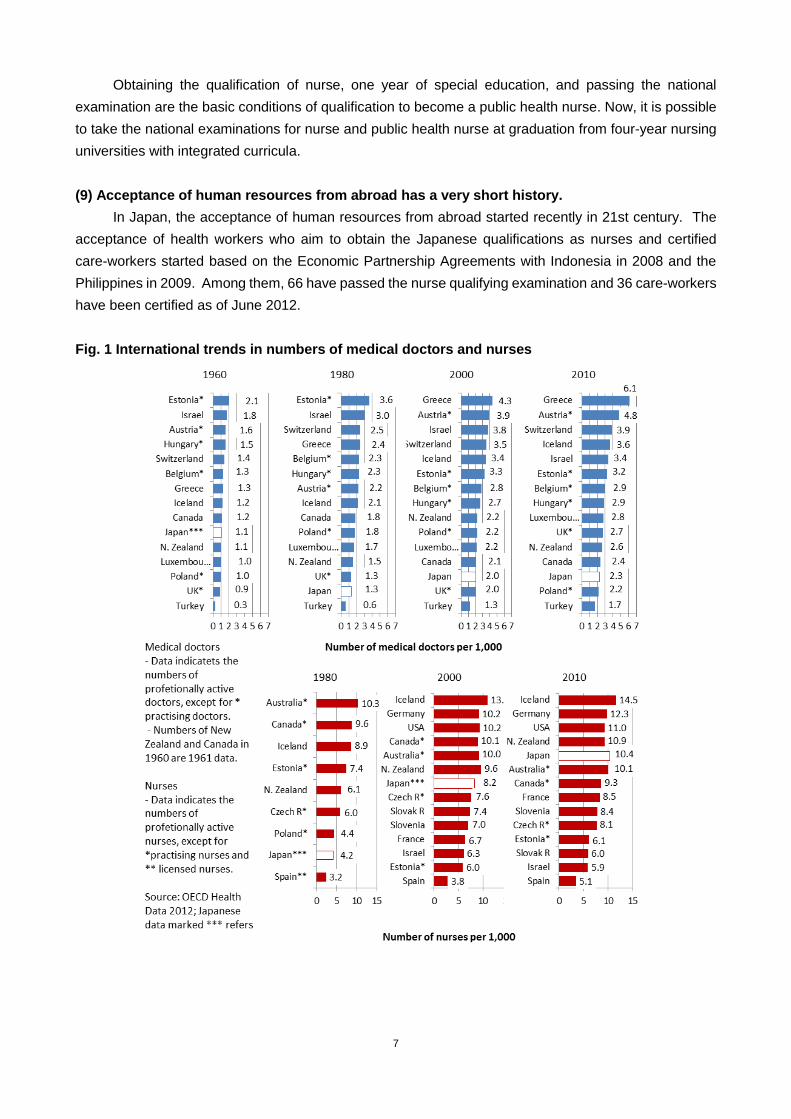
The number of nurses is 10.4 per 1,000 persons in Japan (2010), which is more or less average for
OECD countries. As Fig. 3 shows, the numbers of medical doctors and nurses per 100 hospital beds are
also fewer in Japan than other countries. This is, however, due to the number of hospital beds in Japan
(13.9 per 1,000 people in 2009), which is 1.7 to 4.5 times as large as other G7 countries. The number of
hospital beds is considered so large because of the hospitalization of many elderly patients requiring
long-term care and delays in the improvement of facilities for elderly care.
(7) A midwife's status is higher than that of a nurse.
It is an interesting feature that a midwife's status is higher than a nurse. In countries such as the
Philippines, training courses for nurses and midwives are separated from each other, and the training
period for midwives is shorter. In some cases like in Laos, there is no clear distinction between nurses
and midwives, both being trained the same way. This Japanese system started in 1948, when one year
midwifery education after obtaining the qualification of nurse became a prerequisite to be a midwife.
Midwives enjoy higher salaries and better terms of employment than nurses in Japan, in contrast to many
countries where nurses have higher status .
(8) The job description of a public health nurse covers not only community health services but
also health administration in local governments. Their status is higher than that of a nurse.
Public health nurses, whose status is higher than nurses, are experts in public health. They mostly
work in administrative organizations, such as public health centers and municipal health centers. In public
health centers, public health nurses provide guidance on health service activities carried out by municipal
health centers. They also personally engage in activities to provide healthcare for those with intractable
diseases or disabilities and to cover certain areas widely including crisis management of new types of
influenza. In municipalities, public health nurses implement health consultations at municipal health
centers, administrative services in municipal offices for mothers with young children and the elderly, and
other health activities closer to residents. There are also public health nurses who work in hospitals and
clinics where they help residents with healthcare access and health promotion. They also provide health
consultations on the prevention of work related diseases/injuries, health promotion and mental care for
employees in companies.
7
Obtaining the qualification of nurse, one year of special education, and passing the national
examination are the basic conditions of qualification to become a public health nurse. Now, it is possible
to take the national examinations for nurse and public health nurse at graduation from four-year nursing
universities with integrated curricula.
(9) Acceptance of human resources from abroad has a very short history.
In Japan, the acceptance of human resources from abroad started recently in 21st century. The
acceptance of health workers who aim to obtain the Japanese qualifications as nurses and certified
care-workers started based on the Economic Partnership Agreements with Indonesia in 2008 and the
Philippines in 2009. Among them, 66 have passed the nurse qualifying examination and 36 care-workers
have been certified as of June 2012.
Fig. 1 International trends in numbers of medical doctors and nurses
8
Fig. 2 Trends in numbers of medical doctors per 100,000 in selected countries
Fig. 3 Numbers of medical doctors and nurses per beds in selected countries 2008
9
■ Part I Historical Background: the Meiji Restoration (1868) to the end of World War II (1945)
(Per capita GDP $500-$3,000-$1,300)
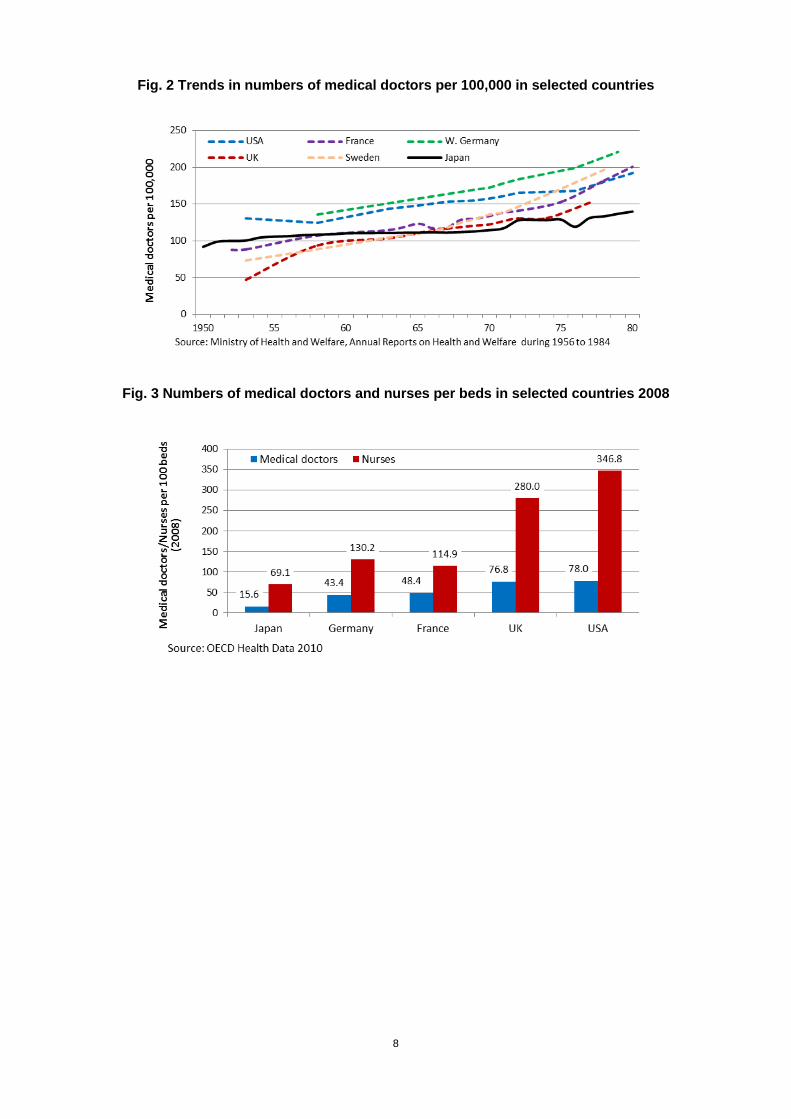
Part I represents the historical background for Part II, the core of the report. This part may be
referred to after reading Part II, and it covers the years from 1868 to 1945, or from the Meiji Restoration to
the end of World War II. Fig. 4 shows Japan‟s economic development from 1868 to 1945 in terms of per
capita GDP (1990 International GK$), based on Angus Maddison‟s Historical Statistics of the World
Economy: 1-2008 AD. The graph reveals gradual growth over time. In 1870, the per capita GDP was
around $500, but it had increased to $1,000 by 1890 and $2,000 by 1933. This gradual growth was built
upon steady expansion of textiles or raw silk and other light industries, as well as a boom in demand
during World War I. By 1940, the per capita GDP had reached nearly $3,000, equivalent to around
six-fold growth during 70 years. However, it had fallen to just over $1,300 by the time World War II ended
in 1945.
Fig. 4 Trends in per capita GDP in selected countries 1868-1950
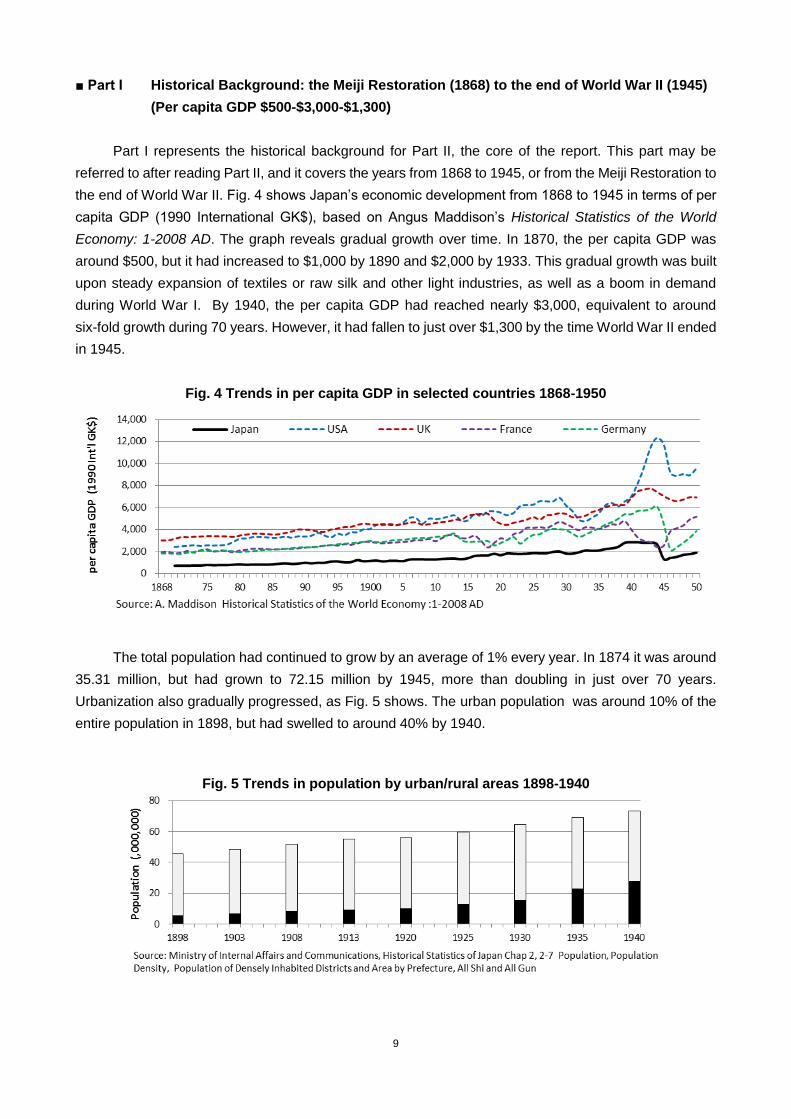
The total population had continued to grow by an average of 1% every year. In 1874 it was around
35.31 million, but had grown to 72.15 million by 1945, more than doubling in just over 70 years.
Urbanization also gradually progressed, as Fig. 5 shows. The urban population was around 10% of the
entire population in 1898, but had swelled to around 40% by 1940.
Fig. 5 Trends in population by urban/rural areas 1898-1940
10
In order to catch up with the advanced western nations, the Meiji government implemented a nation
building strategy known as “Fukoku Kyouhei (Enrich the country, strengthen the military ”, which became
an important backbone of national health care strategy. As the country opened itself to outside trade, the
government used the health office of the Ministry of Home Affairs and the police force to establish a
centralized quarantine system to manage the spread of foreign infectious diseases like cholera, plague,
and dysentery. In 1880 the population of Japan was 36.65 million people, whereas the health office of the
Ministry of Home Affairs operated with a full strength of 31 officers (103 including pharmaceutical
technicians).8 In addition, just under 500 health officers were assigned to 23 of the 63 prefectures in
existence at the time, and by around 1900, the spread of foreign infectious diseases had been brought
under control.
Thereafter, the Ministry of Home Affairs strengthened the epidemiological data system, and the
statistics revealed the high infant mortality rate and the situation regarding chronic diseases, such as
tuberculosis as shown in Table 1. Sanitation policy planning was implemented based upon this data until
the 1920s, and under the later military system, a focus was placed on chronic infections (particularly
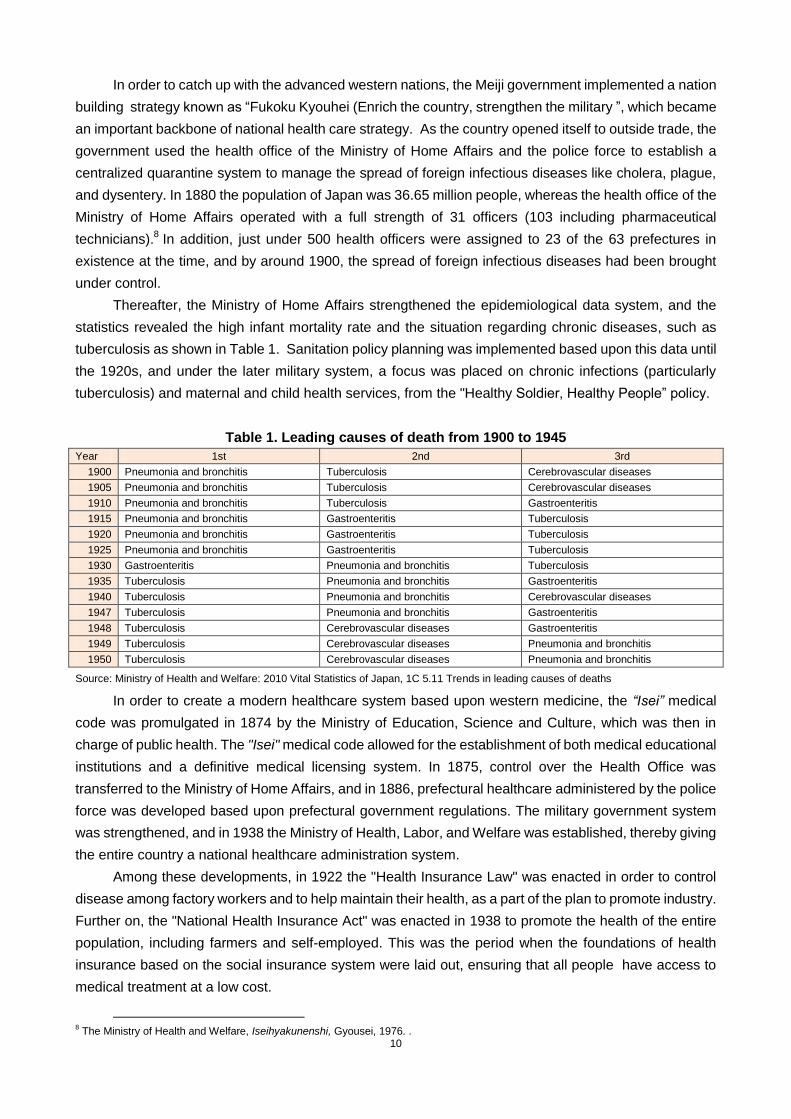
tuberculosis) and maternal and child health services, from the "Healthy Soldier, Healthy People” policy.
Table 1. Leading causes of death from 1900 to 1945
Year 1st 2nd 3rd
1900 Pneumonia and bronchitis Tuberculosis Cerebrovascular diseases
1905 Pneumonia and bronchitis Tuberculosis Cerebrovascular diseases
1910 Pneumonia and bronchitis Tuberculosis Gastroenteritis
1915 Pneumonia and bronchitis Gastroenteritis Tuberculosis
1920 Pneumonia and bronchitis Gastroenteritis Tuberculosis
1925 Pneumonia and bronchitis Gastroenteritis Tuberculosis
1930 Gastroenteritis Pneumonia and bronchitis Tuberculosis
1935 Tuberculosis Pneumonia and bronchitis Gastroenteritis
1940 Tuberculosis Pneumonia and bronchitis Cerebrovascular diseases
1947 Tuberculosis Pneumonia and bronchitis Gastroenteritis
1948 Tuberculosis Cerebrovascular diseases Gastroenteritis
1949 Tuberculosis Cerebrovascular diseases Pneumonia and bronchitis
1950 Tuberculosis Cerebrovascular diseases Pneumonia and bronchitis
Source: Ministry of Health and Welfare: 2010 Vital Statistics of Japan, 1C 5.11 Trends in leading causes of deaths
In order to create a modern healthcare system based upon western medicine, the “Isei” medical
code was promulgated in 1874 by the Ministry of Education, Science and Culture, which was then in
charge of public health. The "Isei" medical code allowed for the establishment of both medical educational
institutions and a definitive medical licensing system. In 1875, control over the Health Office was
transferred to the Ministry of Home Affairs, and in 1886, prefectural healthcare administered by the police
force was developed based upon prefectural government regulations. The military government system
was strengthened, and in 1938 the Ministry of Health, Labor, and Welfare was established, thereby giving
the entire country a national healthcare administration system.
Among these developments, in 1922 the "Health Insurance Law" was enacted in order to control
disease among factory workers and to help maintain their health, as a part of the plan to promote industry.
Further on, the "National Health Insurance Act" was enacted in 1938 to promote the health of the entire
population, including farmers and self-employed. This was the period when the foundations of health
insurance based on the social insurance system were laid out, ensuring that all people have access to
medical treatment at a low cost.
8 The Ministry of Health and Welfare, Iseihyakunenshi, Gyousei, 1976. .
11
Chapter 1 Medical Doctor
The starting point of Japan‟s modern healthcare system, including the system of qualifications for
medical doctors, was the Comprehensive Medical Code "Isei" promulgated by the Meiji government in
1874. The "Isei" medical code was formulated through the invitation of foreign educators, mainly from
Germany, and through study visits and scholarship program by Japanese government officials and
educators to foreign countries. There were certain reasons why the Meiji government chose German
medicine as the model for the Japanese system. At the time, Germany was leading the medical field in
the western world, and as both countries had similar constitutional monarchies that could facilitate the
smooth introduction of a new medical administration system. In addition, even before the Meiji
Restoration, western medicine in Japan essentially stemmed from the Dutch medical practice which was
similar to that of German‟s.
The "Isei" medical code was intended to modernize the healthcare system of the entire nation. It
allowed for the establishment of both medical educational institutions and a definitive medical licensing
system. Doctors can open clinics at their liberty as long as they have license. This is the significant
building block for private sector dominance in medical delivery, which is key feature of the Japanese
medical care system. The “Isei” was very comprehensive setting up regulations for centralized
healthcare administration, criteria for healthcare facility installations, practice qualifications for doctors,
pharmacists, and midwives, and finally, a western medical education system, drug management and
pharmaceutical licensing.9 In terms of the qualification of medical doctors, it was innovative in a sense
that it introduced transitional measures for licensing with a view to adopting western medicine. In other
word, firstly, a license to practice would be granted on condition of two years practical experience after
graduating from authorized medical school based on western medicine. Secondly, as a temporary
measure until adequate numbers of medical schools were in place, practices would be licensed based on
national examination passes, irrespective of graduation qualifications from new medical schools. Thirdly,
provisional licenses would be granted for physicians practicing traditional medicines, which were
predominant at the time.10
It is worth noting that policymakers those days allowed traditional doctors in
the system in order to respond to the healthcare demands of the day.
The central government gradually abolished these transitional measures and took steps to unify the
system of qualifications. In 1882 it promulgated the “Regulation for Medical License” and the “Regulation
for Medical License Examinations,” amending the system so that only those who had studied western
medicine would be permitted to start medical practices. In 1914, moreover, it decided to abolish the
medical practice examinations and grant qualifications only to graduates of medical universities and
medical colleges.11
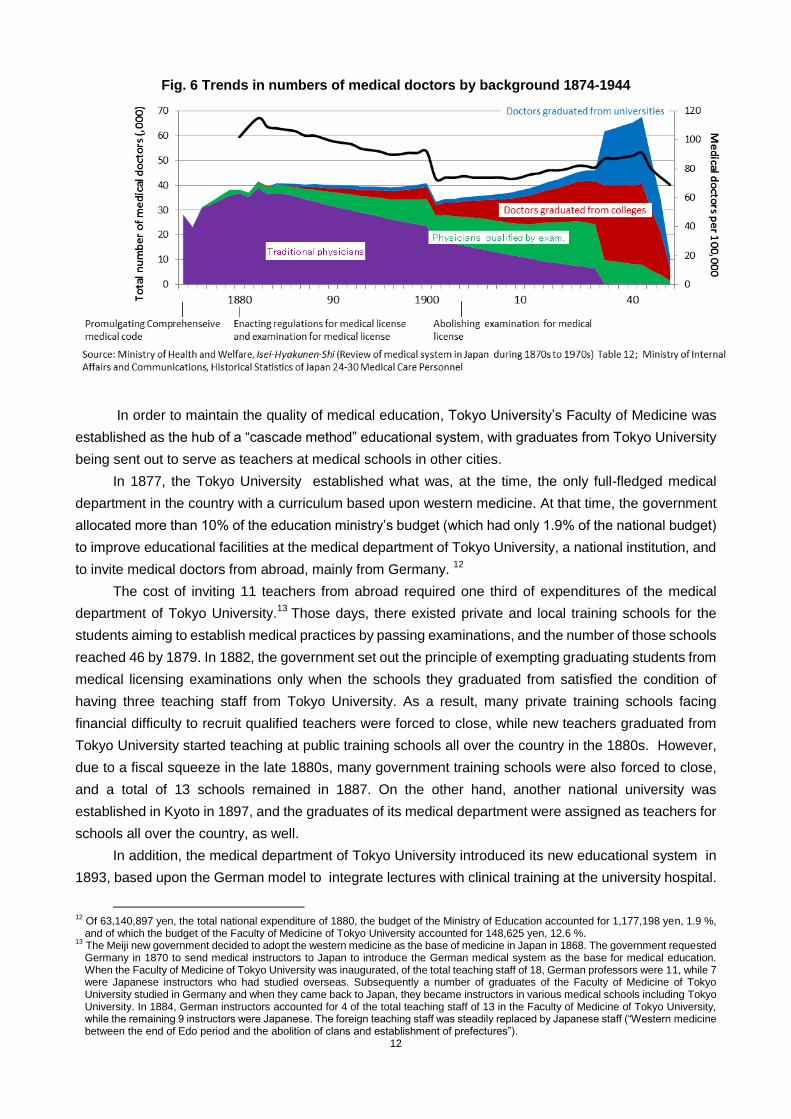
As Fig. 6 shows, these policies led to a gradual decline in the number of practitioners
of traditional medicine, while the number of those graduating from medical schools increased. Out of total
50,676 in 1942, 44,897 (88.6%) were graduates of medical schools. After all, the fundamental national
reform of the medical profession, namely a transition from traditional medicine to modern medicine, took
some 50 to 60 years.
9 The Ministry of Health and Welfare, Iseihyakunenshi, Gyousei, 1976. In Iseihyakunenshi, the “Medical System” is characterized as “having the nature of a directive that indicates the aims of health administration, rather than a law as we would know it today.”
10 In 1882, practitioners‟ apprentices aged 25 and over were also added to eligibility for exemption from examinations. As of 1874, about 80% of all medical doctors in Japan (23,015 of a total of 28,262) were kampo practitioners unfamiliar with western medicine.
11 The entry requirement for medical college was graduation from junior high school, and the course length was 4 years. As such, medical colleges were distinct from education in medical faculties of universities (senior high school graduates, course length 4 years).
12
Fig. 6 Trends in numbers of medical doctors by background 1874-1944
In order to maintain the quality of medical education, Tokyo University‟s Faculty of Medicine was
established as the hub of a “cascade method” educational system, with graduates from Tokyo University
being sent out to serve as teachers at medical schools in other cities.
In 1877, the Tokyo University established what was, at the time, the only full-fledged medical
department in the country with a curriculum based upon western medicine. At that time, the government
allocated more than 10% of the education ministry‟s budget (which had only 1.9% of the national budget)
to improve educational facilities at the medical department of Tokyo University, a national institution, and
to invite medical doctors from abroad, mainly from Germany. 12
The cost of inviting 11 teachers from abroad required one third of expenditures of the medical
department of Tokyo University.13
Those days, there existed private and local training schools for the
students aiming to establish medical practices by passing examinations, and the number of those schools
reached 46 by 1879. In 1882, the government set out the principle of exempting graduating students from
medical licensing examinations only when the schools they graduated from satisfied the condition of
having three teaching staff from Tokyo University. As a result, many private training schools facing
financial difficulty to recruit qualified teachers were forced to close, while new teachers graduated from
Tokyo University started teaching at public training schools all over the country in the 1880s. However,
due to a fiscal squeeze in the late 1880s, many government training schools were also forced to close,
and a total of 13 schools remained in 1887. On the other hand, another national university was
established in Kyoto in 1897, and the graduates of its medical department were assigned as teachers for
schools all over the country, as well.
In addition, the medical department of Tokyo University introduced its new educational system in
1893, based upon the German model to integrate lectures with clinical training at the university hospital.
12
Of 63,140,897 yen, the total national expenditure of 1880, the budget of the Ministry of Education accounted for 1,177,198 yen, 1.9 %, and of which the budget of the Faculty of Medicine of Tokyo University accounted for 148,625 yen, 12.6 %.
13 The Meiji new government decided to adopt the western medicine as the base of medicine in Japan in 1868. The government requested Germany in 1870 to send medical instructors to Japan to introduce the German medical system as the base for medical education. When the Faculty of Medicine of Tokyo University was inaugurated, of the total teaching staff of 18, German professors were 11, while 7 were Japanese instructors who had studied overseas. Subsequently a number of graduates of the Faculty of Medicine of Tokyo University studied in Germany and when they came back to Japan, they became instructors in various medical schools including Tokyo University. In 1884, German instructors accounted for 4 of the total teaching staff of 13 in the Faculty of Medicine of Tokyo University, while the remaining 9 instructors were Japanese. The foreign teaching staff was steadily replaced by Japanese staff (“Western medicine between the end of Edo period and the abolition of clans and establishment of prefectures”).
13
Similar systems were adopted in other medical universities afterwards. After the war, professors held
strong control over medical personnel assignments and graduates‟ career development, and each course
placed the professor as the top authoritative figure, creating an independent and reclusive educational
research system that continues to the present day.
The Ministry of Education enacted the Law for Special Colleges in 1903. Under this law, eight
schools of the central/local governments and two private schools were designated as the legitimate
medical colleges.14
In 1900, the budget for the Ministry of Education was approximately 5,835,000 yen, while the cost
of building a new medical specialist school was around 1,300,000 yen, with additional operational
expenses running into the hundreds of thousands of yen.15
Because of this high cost, establishing a medical college required not only national funding but also
municipal funding from local governments looking to invite a school, and even donations from the public.
Two designated private medical colleges were added to the list of the schools exempted from licensing
examinations in 1905. The licensing examination was abolished in 1914, and thereafter that licenses
were granted upon graduation from medical universities or designated medical colleges.
Before 1940, there was a shortage of military physicians for the wartime regime, causing the
Ministry of Education to attach temporary colleges of medicine to national universities in 1939, and in
1942 new temporary medical schools were established at 13 different national universities, with more
established later at both public and private universities. In 1945, there were 18 medical universities with
8,480 students in total, and 51 medical colleges with 19,781 students. This dramatic increase in medical
doctors in such a short period caused problems later in terms of both the number of doctors and their
technical quality.
Fig. 7 illustrates the trends in numbers of medical schools from the enactment of the “Isei” (Medical
code) until the end of the Second World War.
How was the geographical distribution of medical doctors? Although it is difficult to obtain detailed
and consistent data covering long period, the number of Japanese villages without doctor amounted to
3,655 in 1936. This number corresponded to approximately 30% of all Japanese cities and villages,
showing clear geographical mal-distribution.16
This was mainly because medical service was delivered
mostly by the private doctors. There was no legal restriction for the new opening of clinics, and the
geographical locations of clinics, and medical fee schedules were unrestricted.17
14 University medical departments at the time required students to attend for 4 years after spending 7 years in high school and university
preparatory school, whereas medical specialist schools required 4 years of attendance after graduation from a 5 year middle school. So, there was a difference in the length of school attended even before students entered a school of higher learning.
15 Kyushu University, Kyusyudaigaku shiryoushitsu news(Kyusyu University History Room News), 31 March 2004, Kyushu University.
16 The Ministry of Health and Welfare, Iseihyakunenshi, Gyousei,1976, p.278.
17 In healthcare facilities as of 1937, 96% of general hospitals and 95% of clinics were operated by individual medical doctors. The Ministry
of Health and Welfare, Eiseinepou (Annual Health Data),1937.
14
Fig. 7 Trends in numbers of medical schools (by type) 1874-1944
Fig. 8 shows numbers of medical doctors by location, showing that doctors were concentrated in
large cities. For reasons of better business profits, medical doctors are thought to have been
concentrated in areas where they could have more “good customers”.
Fig. 8 Trends in numbers of practicing medical doctors in villages, towns and cities 1928-1936
Meanwhile, although historical data on the working conditions of medical doctors is limited, they
appear to have been more rewarded in terms of income than other categories or medical professions.
According to data on the income of female workers in Tokyo from 1923 to 1924, for example, the average
monthly wage was 100 yen for secondary school teachers, 70 yen for primary school teachers, 50 yen for
kindergarten teachers and 35 yen for office employees. However, it was 300 yen for practicing medical
doctors, and 120 yen for non-practicing doctors. In broader medical categories, midwives were paid 150
yen and nurses 50 yen.18
18
S. Ikai, Boyouin no seiki no riron (The Theory of the century of hospitals), Yuhikaku, p.188. Data compiled by the author from Fujin jiritsu no michi (The Road to Women’s Independence), Social Bureau, Tokyo Metropolitan Government.
15
Chapter 2 Midwife
Before the Meiji era, midwives were already recognized as a common profession of birth attendants.
However, there were no systematic qualifications or training systems, and midwifery was not established
as a specialist profession.19
In 1868, the Meiji government prohibited midwives from engaging in
infanticide, abortion and selling drugs. The authorities of the day are thought to have recognized a need to
develop midwifery skills on a systematic basis.
The “Isei” medical code regulated the qualifications and duties of midwives for the first time.
Midwives were granted licenses to practice only if (i) they were over 40 years old, (ii) had assisted at least
10 normal births under the supervision of a physician, and (iii) had assisted in at least 2 difficult births. A
certificate was issued by obstetrician. They are not allowed to prescribe medicine. Under the “Isei”
medical code, temporary licenses were conceived as a transitional measure - in the same way as they
were to doctors - to midwives who already had established practices, thereby allowing them to continue to
operate.
At first, the “Isei” medical code only covered the three cities of Tokyo, Osaka, and Kyoto, but it was
incrementally implemented elsewhere in the country carefully taking account of actual local conditions,
and the new midwife system was fully expanded nation-wide 50 years after the establishment of the
“Isei” medical code. With the promulgation of the “Isei” medical code in the three cities, several
associations of hospitals and midwives established training schools for midwives. They offered midwife
education based on modern medical principles, and in Tokyo, they engaged in the re-training of midwives
already operating their own practices. The training schools for midwives required students to attend for
one year, and school fees were a half yen a month (the starting salary for teachers at the time was eight
yen per month). A number of students at these schools came from the families of ex-samurai privileged
class and medical professionals.
It was 25 years later that the central government eventually established the “Regulation for
Midwives” in 1899 as a uniform national regulation. Indicators for maternal and child health were
extremely poor at the time; the maternal mortality rate per 100,000 live births was 436 and the infant
mortality rate per 1,000 live births was 155 in 1900.
The government, forcing "Enrich the country, strengthen the military" policies regarded the birth of
healthy children who would determine the nation‟s future as an important policy objective. As such, it
recognized the need to promote improvements to midwives‟ skills and the codification of their duties. The
“Regulation for Midwives” effectively reinforced the provisions concerning midwives in the “Isei” medical
code; among others, it specified that only women aged 20 and over were eligible for qualification and
prohibited certain acts in the line of duty. In the same year, the Ministry of Home Affairs enacted
“Regulations on Midwifery Examinations” and “Regulations on Enrollment of Midwives” with the aim of
controlling the skill levels of midwives and the numbers registered. These regulations laid the foundation
for the national midwives system.
In 1910, the government revised the “Regulation for Midwives,” exempting graduates of
government-designated training colleges from qualification examinations. In conjunction with this, the
Ministry of Home Affairs stipulated designated qualifications for private schools in 1912. No significant
change in policy was seen from then until 1948.
As a result of the policies outlined above, training schools spread all over the country; by 1914,
19
The Ministry of Health & Welfare, Iseihyakunenshi,Gyousei,1976, p.90.
16
some four decades after the first was founded in 1875, they had expanded to 127 schools. Of these, 109
or nearly 90% were private. The number of registered midwives grew three-fold from 12,009 in 1878 to
35,945 in 1898. With the enactment of the “Regulations on Enrollment of Midwives” in 1899, delays during
the application process caused the number to fall temporarily to 8,367 in 1899, but by 1900 this had
recovered to 25,118. It then increased linearly to 27,674 in 1910, 36,055 in 1920 and 50,312 in 1930,
before growth slowed to 61,368 in 1940. The number of midwives per 100,000 populations grew, as
shown in Fig. 9, from 56.3 in 1910 to 64.4 in 1920, 78.1 in 1930 and 85.3 in 1940.
Fig. 9 Trends in numbers of midwives 1886-1941
Development of regulatory framework for midwives and their numbers had contributed to
improvement of maternal health indicators, while it is important to take into account of other contributing
factors such as the spread of free elementary education. As shown in Fig. 10, the maternal mortality rate
per 100,000 live births in 1940 was 228.6, a decline of almost half in 40 years (from 436.5 in 1900). The
infant mortality rate peaked at 188.6 in 1918, but declined thereafter; it fell from 155 in 1900 to 90.0 in
1940, or by around 30% in 40 years.
Fig. 10 Trends in maternal and infant mortality rates 1900-1944
To summarize policies on midwives in this period, firstly, regulations were developed by the state,
but the training of nurses was undertaken by the private sector. Secondly, the process and content of
regulatory system development were similar to that for medical doctors. Their systems were developed
with more or less the same timing via the "Isei" medical code, and that exceptions to registration were
permitted in view of dealing with geographical mal-distribution.20
Thirdly, as discussed below, the
20
The 1899 “Regulation for Midwives” included the provision that midwives may be licensed for up to five years in regions with a shortage

17
regulatory system for midwives was developed before those for nurses and public health nurses. This
system for midwives was later used as a template when creating the regulatory systems for nurses and
public health nurses.
Chapter 3 Nurse
Many nursing schools were established by the private sector responding to the actual demand of
nurses in the process of constructing a modern state, and regulations on qualifications and job
descriptions were developed in 1915: 50 years after the Meiji Restoration in 1915.
There were several opportunities for nursing work to become recognized by society at large. The
first arose from wars both at home and abroad. Attention was drawn to emergency first aid work in the
various wars occurring between the civil war around 1868 and the outbreak of World War I in 1914. The
second arose from natural disasters. Disaster relief operations were carried out after the eruption of
Mount Bandai in 1888 and an earthquake in the Nobi region in 1891, among others. The third lay in
nursing work for sufferers of cholera, typhoid, dysentery and other serious infectious diseases that had
spread between 1868 and around 1920.
But despite these incidents during the Meiji era, there were no regulations until 1915. On the other
hand, nurse training was advanced from an early stage of medical modernization. Five training schools
were opened between 1886 and 1890 (one by the government, one by the Japanese Red Cross Society,
and three by private parties). This was the start of scientific and practical nursing education based on the
Nightingale method, which was spreading across the world at that time. However, there were no
regulations on the content or length of required training; independent nursing schools were subsequently
established by local authorities, medical schools, private hospitals and others. As of 1915, when the
“Regulation for Nurses” was enacted, there were 330 schools. Of these, 271 were private training
institutions (including 40 belonging to the Japanese Red Cross Society), accounting for 70% of the total.
In other words, the majority of training was undertaken by the private sector.
Under such circumstances, the Ministry of Home Affairs, recognizing the need for national
regulation of the numbers and quality of nurses, enacted the Regulation for Nurses in 1915. The Ministry
issued guidelines for qualifications, licenses, examinations, and the scope of works for nurses referring to
that for midwives. Considering the fact that there had been many nursing schools‟ graduates before the
enactment of the regulation, the Ministry introduced transitional measures for those who were already
engaged in nursing as long as they met certain conditions.
The same year, the Ministry of Home Affairs, again following the example of midwifery regulations,
laid out the requirements for private schools offering nursing education. Student entry requirement was a
higher elementary school completion, or completion of two years in a girls‟ high school. Nursing schools
were often operated in parallel with medical institutions and, with a few exceptions, educated their
students in small-scale boarding-style schools using apprenticeship-style methods. Students paid neither
entry fees nor class fees, and they were offered a monthly stipend (five to ten yen a month in 1920, when
the average monthly pay for an elementary girls‟ school teacher was 21 yen). However, upon graduation,
students were obliged to work for the institution for the same number of years as their education had
taken. Many of the students who took advantage of these training institutions were from rural areas.21
of midwives, with the same provision for medical doctors. There was no such provision for nurses or public health nurses.
21 Sugita, Kidou et al, Kangoshi (History of Nursing), Igakushoin, 2011.
18
Fig. 11 shows the increase in the number of nurses, with the number at 18,045 in 1915 (the year
nursing regulations were enacted), with numbers steadily rising to 29,978 in 1920 and 70,390 in 1930. By
1940, there were 130,425 nurses, representing a more than 7-fold increase over 25 years. The
percentage of nurses in terms of total population also increased dramatically from 23.5 per 100,000 in
1910, to 53.7 in 1920, 109.4 in 1930 and 182.1 in 1940.
Fig. 11 Trends in the number of nurses per 100,000 populations 1910-1941
To summarize the policies on nurses in this period, firstly, the regulatory framework was developed
by the state, but that training was undertaken by the private sector. Secondly, human resource
development was carried out first and the regulatory framework was developed later. And thirdly, when
developing the regulatory framework, the content of the existing framework for midwives was used more
or less as it was.
Chapter 4 Public Health Nurse
Public health nurses were introduced in 1926, under the government‟s “Healthy Soldier, Healthy
People” principle of the 1920s, in order to bottom up health level nation-wide focusing on promotion of
infectious disease control , maternal and child health, and factory workers‟ health. Public health nurses
were expected to serve as an expert of community health giving advices and preventive care services for
families and factories in the communities whereas the midwives were solely serving to assist delivery of
babies.
The government established Health centers for children in 1926, and assigned public health nurses
to provide home visits and advice on health management for infants. The government passed the Health
Center Act in 1937 at wartime, to establish Health centers as administrative base of community health
services to promote the population‟s health. Health centers were also designed to implement national
health care policies at the prefectural level and to supervise cities, towns, and villages at the same time.
Since those days, clinical services in the community were already provided mainly by private clinics and
hospitals. Health centers, accordingly, were designed to function as core institution for disease
prevention and health promotion activities such as health check-up of pregnant women and children,
factory workers and farmers, home visit for family health consultation, and community base health
promotion workshops etc. However, they did not engage in clinical activities except for some curative
treatment on TB. Under the act, public health nurses were appointed to health centers and entrusted with

19
providing health advice to the general population in the area.
In 1941, the Ministry of Health and Welfare enacted the Regulation for Public Health Nurses with a
view to standardizing the work of public health nurses. The Ministry of Health and Welfare, following the
Regulation for Midwives and the Regulation for Nurses, set out provisions for qualifications, licenses,
examinations and the scope of work of public health nurses.
Training of public health nurses, like that of nurses, was not regulated by the government in early
days. Following the enactment of the regulation in 1941, the Ministry of Health and Welfare introduced
regulations for private schools for public health nurses, clarifying the conditions for establishing those
schools.22
The number of public health nurses increased after the enactment of the Health Center Act in 1937.
The “National Health Insurance Act” enacted in 1938 further boosted their increase because the law
allowed public health nurse to undertake health insurance administration. In urban health centers, public
health nurses were categorized as prefectural employees, but in rural areas they were employed by
National Health Insurance Associations created under the National Health Insurance Act (earning them
the name kokuho hokenfu or “national insurance public health nurses”). As such, their number expanded
rapidly. The number of public health nurses registered to national insurance was 334 in February 1941
and increased almost ten-fold to 3,272 in December 1943. The number more than doubled to 7,172 in
December 1944 and to 9,641 in 1945.23
Amid the shortage of medical doctors during wartime, their
presence increased through health promotion activities for local residents that could not be covered by
medical doctors.
The essential points of policies on public health nurses in this period can be summarized: firstly,
their status was formalized to make them a driving force in the national policy of promoting community
health activities during wartime; secondly, the regulatory development came late, long after a period of
unregulated training institutions; and thirdly, the system was developed following the same pattern as the
system for midwives.
22
A variety of training colleges existed in 1941, including a one-year course created by the Japanese Red Cross Society in 1929 and a two-year course by Osaka Prefectural Institute of Social Hygiene in 1937.
23 C.Uchibori, Hokenshinoayumi to kousyueisei no rekishi – kousyueiseijissen series 2 (Progress of public health nurses and the history of public health: Public Health Practice Series 2), Igakushoin,1985.
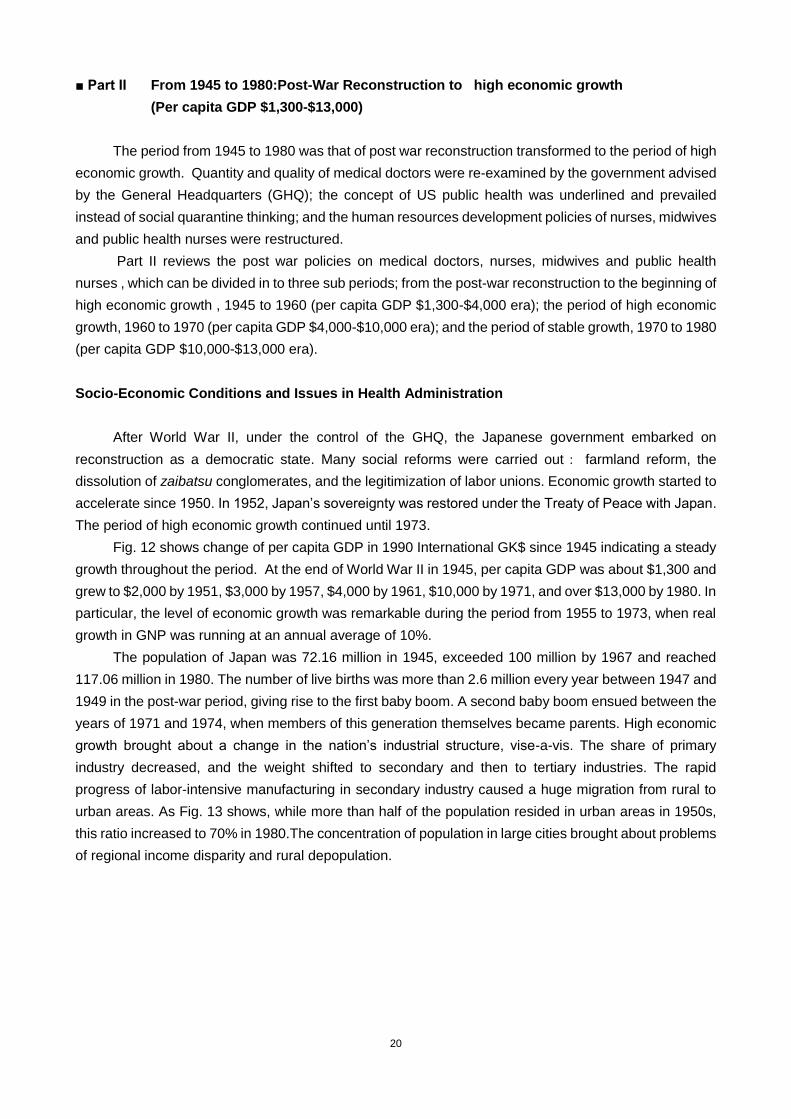
20
■ Part II From 1945 to 1980:Post-War Reconstruction to high economic growth
(Per capita GDP $1,300-$13,000)
The period from 1945 to 1980 was that of post war reconstruction transformed to the period of high
economic growth. Quantity and quality of medical doctors were re-examined by the government advised
by the General Headquarters (GHQ); the concept of US public health was underlined and prevailed
instead of social quarantine thinking; and the human resources development policies of nurses, midwives
and public health nurses were restructured.
Part II reviews the post war policies on medical doctors, nurses, midwives and public health
nurses , which can be divided in to three sub periods; from the post-war reconstruction to the beginning of
high economic growth , 1945 to 1960 (per capita GDP $1,300-$4,000 era); the period of high economic
growth, 1960 to 1970 (per capita GDP $4,000-$10,000 era); and the period of stable growth, 1970 to 1980
(per capita GDP $10,000-$13,000 era).
Socio-Economic Conditions and Issues in Health Administration
After World War II, under the control of the GHQ, the Japanese government embarked on
reconstruction as a democratic state. Many social reforms were carried out: farmland reform, the
dissolution of zaibatsu conglomerates, and the legitimization of labor unions. Economic growth started to
accelerate since 1950. In 1952, Japan‟s sovereignty was restored under the Treaty of Peace with Japan.
The period of high economic growth continued until 1973.
Fig. 12 shows change of per capita GDP in 1990 International GK$ since 1945 indicating a steady
growth throughout the period. At the end of World War II in 1945, per capita GDP was about $1,300 and
grew to $2,000 by 1951, $3,000 by 1957, $4,000 by 1961, $10,000 by 1971, and over $13,000 by 1980. In
particular, the level of economic growth was remarkable during the period from 1955 to 1973, when real
growth in GNP was running at an annual average of 10%.
The population of Japan was 72.16 million in 1945, exceeded 100 million by 1967 and reached
117.06 million in 1980. The number of live births was more than 2.6 million every year between 1947 and
1949 in the post-war period, giving rise to the first baby boom. A second baby boom ensued between the
years of 1971 and 1974, when members of this generation themselves became parents. High economic
growth brought about a change in the nation‟s industrial structure, vise-a-vis. The share of primary
industry decreased, and the weight shifted to secondary and then to tertiary industries. The rapid
progress of labor-intensive manufacturing in secondary industry caused a huge migration from rural to
urban areas. As Fig. 13 shows, while more than half of the population resided in urban areas in 1950s,
this ratio increased to 70% in 1980.The concentration of population in large cities brought about problems
of regional income disparity and rural depopulation.
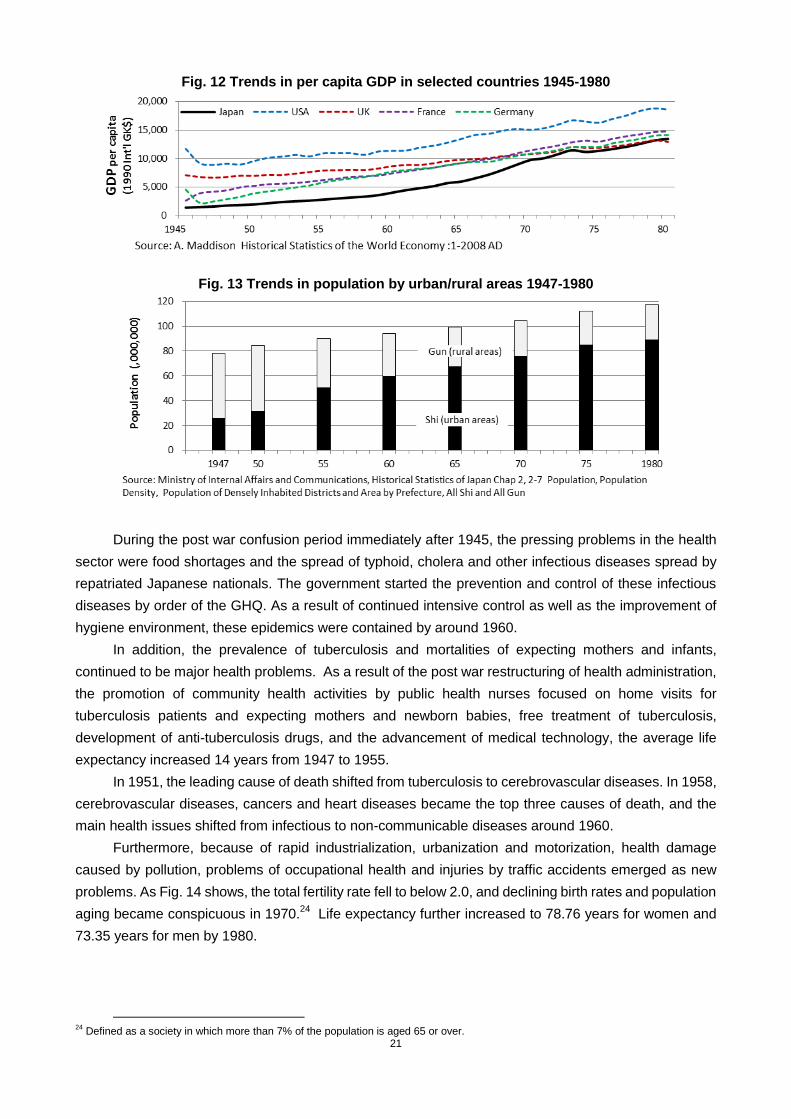
21
Fig. 12 Trends in per capita GDP in selected countries 1945-1980
Fig. 13 Trends in population by urban/rural areas 1947-1980
During the post war confusion period immediately after 1945, the pressing problems in the health
sector were food shortages and the spread of typhoid, cholera and other infectious diseases spread by
repatriated Japanese nationals. The government started the prevention and control of these infectious
diseases by order of the GHQ. As a result of continued intensive control as well as the improvement of
hygiene environment, these epidemics were contained by around 1960.
In addition, the prevalence of tuberculosis and mortalities of expecting mothers and infants,
continued to be major health problems. As a result of the post war restructuring of health administration,
the promotion of community health activities by public health nurses focused on home visits for
tuberculosis patients and expecting mothers and newborn babies, free treatment of tuberculosis,
development of anti-tuberculosis drugs, and the advancement of medical technology, the average life
expectancy increased 14 years from 1947 to 1955.
In 1951, the leading cause of death shifted from tuberculosis to cerebrovascular diseases. In 1958,
cerebrovascular diseases, cancers and heart diseases became the top three causes of death, and the
main health issues shifted from infectious to non-communicable diseases around 1960.
Furthermore, because of rapid industrialization, urbanization and motorization, health damage
caused by pollution, problems of occupational health and injuries by traffic accidents emerged as new
problems. As Fig. 14 shows, the total fertility rate fell to below 2.0, and declining birth rates and population
aging became conspicuous in 1970.24
Life expectancy further increased to 78.76 years for women and
73.35 years for men by 1980.
24
Defined as a society in which more than 7% of the population is aged 65 or over.
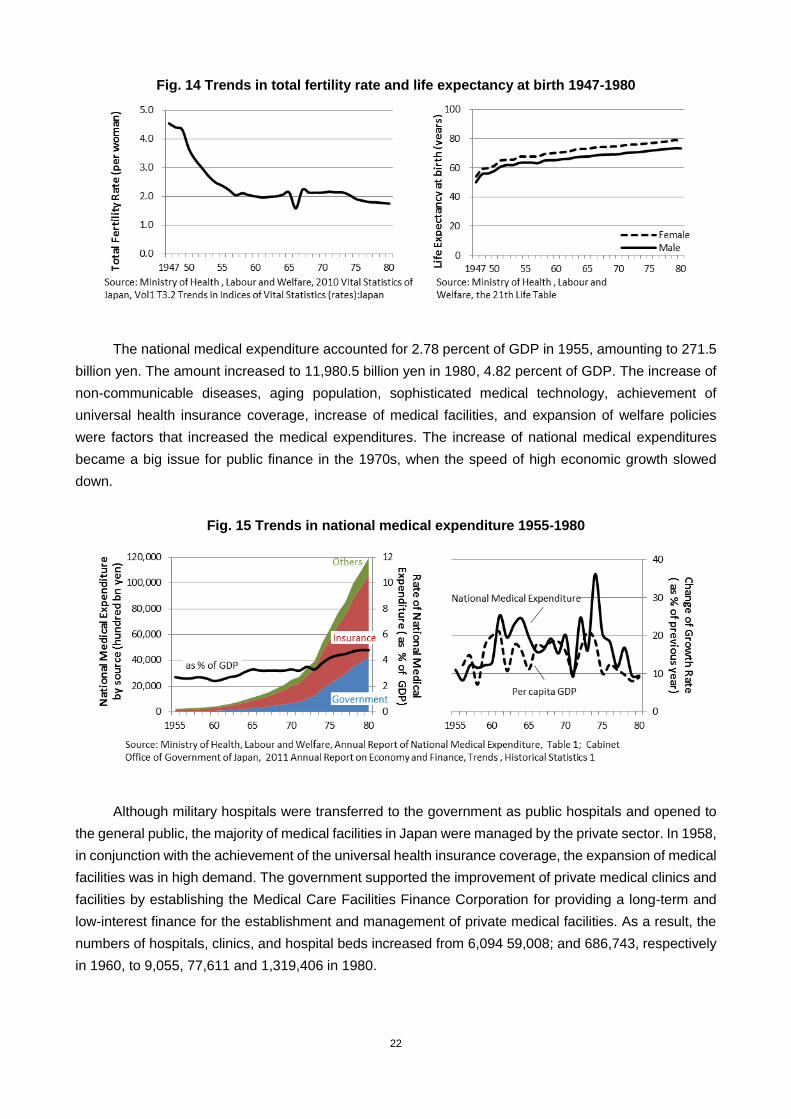
22
Fig. 14 Trends in total fertility rate and life expectancy at birth 1947-1980
The national medical expenditure accounted for 2.78 percent of GDP in 1955, amounting to 271.5
billion yen. The amount increased to 11,980.5 billion yen in 1980, 4.82 percent of GDP. The increase of
non-communicable diseases, aging population, sophisticated medical technology, achievement of
universal health insurance coverage, increase of medical facilities, and expansion of welfare policies
were factors that increased the medical expenditures. The increase of national medical expenditures
became a big issue for public finance in the 1970s, when the speed of high economic growth slowed
down.
Fig. 15 Trends in national medical expenditure 1955-1980
Although military hospitals were transferred to the government as public hospitals and opened to
the general public, the majority of medical facilities in Japan were managed by the private sector. In 1958,
in conjunction with the achievement of the universal health insurance coverage, the expansion of medical
facilities was in high demand. The government supported the improvement of private medical clinics and
facilities by establishing the Medical Care Facilities Finance Corporation for providing a long-term and
low-interest finance for the establishment and management of private medical facilities. As a result, the
numbers of hospitals, clinics, and hospital beds increased from 6,094 59,008; and 686,743, respectively
in 1960, to 9,055, 77,611 and 1,319,406 in 1980.

23
Fig. 16 Trends in the number of medical facilities and hospital beds
With support from the GHQ immediately after the war, the prefectural public health center was
given additional functions and authorities including forcible food and environmental hygiene inspection
which used be a mandate of local police offices. Curative care of some infectious diseases was also
additionally assigned to the health centers. .
To establish one public health center for a population of 100,000 residents was the criteria at that
time. Numbers of staff members per center in the guideline were 31 to 60. Experts with various
specialties in public health centers worked in a team: medical doctors, dentists, midwives, veterinarians,
environmental health officers, nutritionists, social workers, radiologists, and office clerks.
The number of public health centers was 675 in 1946 and increased to 854 in 1980. The number of
personnel of public health centers was 9,484 in 1958 and 11,868 in 1980. In 1978, main and routine
health care services such as home visit of public health nurse and health check-up were transferred from
prefectural public health centers to municipal health centers aiming to strengthen the capacity of health
care services of municipalities which is much closer to the communities. 303 municipal health centers
were established by 1980.
Fig. 17 Trends in the numbers of Healthcare Centers and of their employees
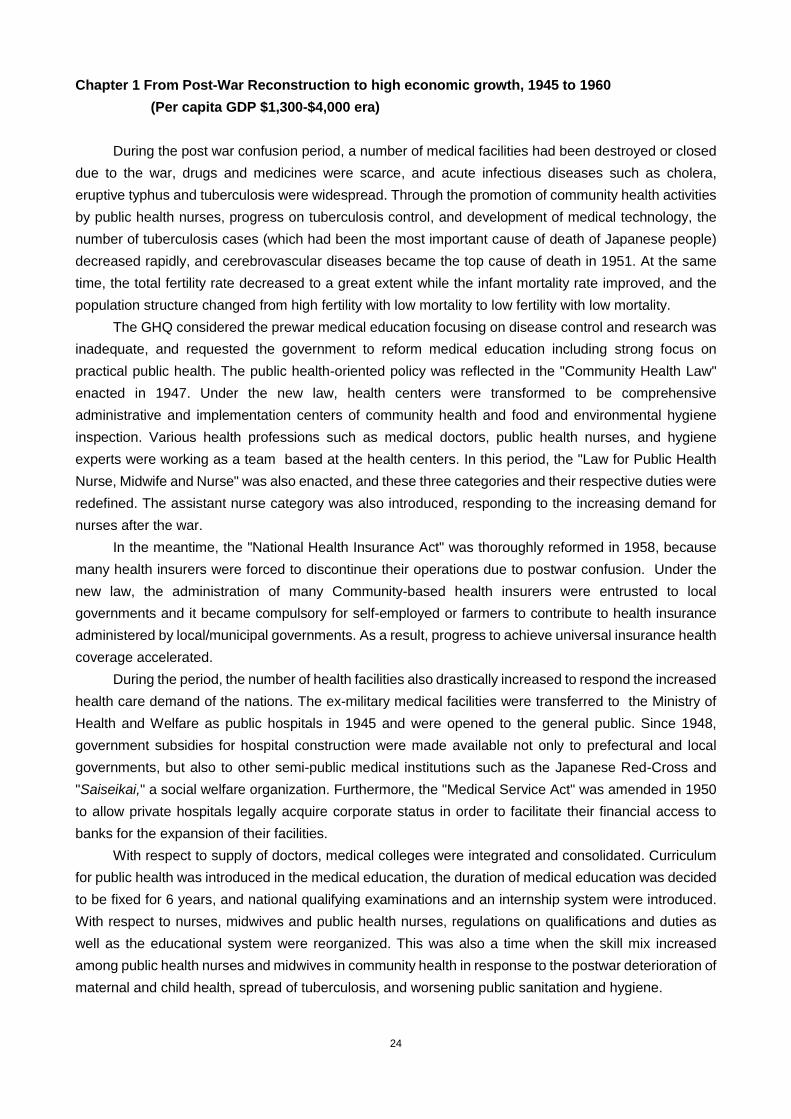
24
Chapter 1 From Post-War Reconstruction to high economic growth, 1945 to 1960
(Per capita GDP $1,300-$4,000 era)
During the post war confusion period, a number of medical facilities had been destroyed or closed
due to the war, drugs and medicines were scarce, and acute infectious diseases such as cholera,
eruptive typhus and tuberculosis were widespread. Through the promotion of community health activities
by public health nurses, progress on tuberculosis control, and development of medical technology, the
number of tuberculosis cases (which had been the most important cause of death of Japanese people)
decreased rapidly, and cerebrovascular diseases became the top cause of death in 1951. At the same
time, the total fertility rate decreased to a great extent while the infant mortality rate improved, and the
population structure changed from high fertility with low mortality to low fertility with low mortality.
The GHQ considered the prewar medical education focusing on disease control and research was
inadequate, and requested the government to reform medical education including strong focus on
practical public health. The public health-oriented policy was reflected in the "Community Health Law"
enacted in 1947. Under the new law, health centers were transformed to be comprehensive
administrative and implementation centers of community health and food and environmental hygiene
inspection. Various health professions such as medical doctors, public health nurses, and hygiene
experts were working as a team based at the health centers. In this period, the "Law for Public Health
Nurse, Midwife and Nurse" was also enacted, and these three categories and their respective duties were
redefined. The assistant nurse category was also introduced, responding to the increasing demand for
nurses after the war.
In the meantime, the "National Health Insurance Act" was thoroughly reformed in 1958, because
many health insurers were forced to discontinue their operations due to postwar confusion. Under the
new law, the administration of many Community-based health insurers were entrusted to local
governments and it became compulsory for self-employed or farmers to contribute to health insurance
administered by local/municipal governments. As a result, progress to achieve universal insurance health
coverage accelerated.
During the period, the number of health facilities also drastically increased to respond the increased
health care demand of the nations. The ex-military medical facilities were transferred to the Ministry of
Health and Welfare as public hospitals in 1945 and were opened to the general public. Since 1948,
government subsidies for hospital construction were made available not only to prefectural and local
governments, but also to other semi-public medical institutions such as the Japanese Red-Cross and
"Saiseikai," a social welfare organization. Furthermore, the "Medical Service Act" was amended in 1950
to allow private hospitals legally acquire corporate status in order to facilitate their financial access to
banks for the expansion of their facilities.
With respect to supply of doctors, medical colleges were integrated and consolidated. Curriculum
for public health was introduced in the medical education, the duration of medical education was decided
to be fixed for 6 years, and national qualifying examinations and an internship system were introduced.
With respect to nurses, midwives and public health nurses, regulations on qualifications and duties as
well as the educational system were reorganized. This was also a time when the skill mix increased
among public health nurses and midwives in community health in response to the postwar deterioration of
maternal and child health, spread of tuberculosis, and worsening public sanitation and hygiene.
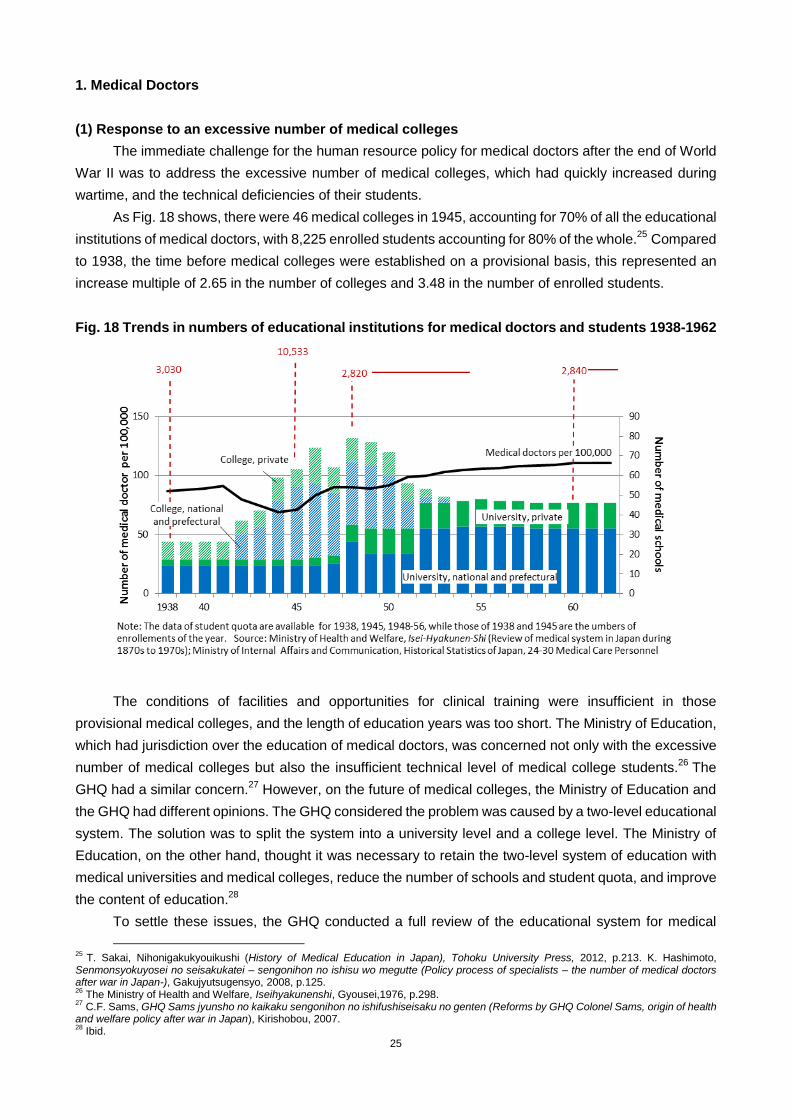
25
1. Medical Doctors
(1) Response to an excessive number of medical colleges
The immediate challenge for the human resource policy for medical doctors after the end of World
War II was to address the excessive number of medical colleges, which had quickly increased during
wartime, and the technical deficiencies of their students.
As Fig. 18 shows, there were 46 medical colleges in 1945, accounting for 70% of all the educational
institutions of medical doctors, with 8,225 enrolled students accounting for 80% of the whole.25
Compared
to 1938, the time before medical colleges were established on a provisional basis, this represented an
increase multiple of 2.65 in the number of colleges and 3.48 in the number of enrolled students.
Fig. 18 Trends in numbers of educational institutions for medical doctors and students 1938-1962
The conditions of facilities and opportunities for clinical training were insufficient in those
provisional medical colleges, and the length of education years was too short. The Ministry of Education,
which had jurisdiction over the education of medical doctors, was concerned not only with the excessive
number of medical colleges but also the insufficient technical level of medical college students.26
The
GHQ had a similar concern.27
However, on the future of medical colleges, the Ministry of Education and
the GHQ had different opinions. The GHQ considered the problem was caused by a two-level educational
system. The solution was to split the system into a university level and a college level. The Ministry of
Education, on the other hand, thought it was necessary to retain the two-level system of education with
medical universities and medical colleges, reduce the number of schools and student quota, and improve
the content of education.28
To settle these issues, the GHQ conducted a full review of the educational system for medical
25
T. Sakai, Nihonigakukyouikushi (History of Medical Education in Japan), Tohoku University Press, 2012, p.213. K. Hashimoto, Senmonsyokuyosei no seisakukatei – sengonihon no ishisu wo megutte (Policy process of specialists – the number of medical doctors after war in Japan-), Gakujyutsugensyo, 2008, p.125. 26
The Ministry of Health and Welfare, Iseihyakunenshi, Gyousei,1976, p.298. 27
C.F. Sams, GHQ Sams jyunsho no kaikaku sengonihon no ishifushiseisaku no genten (Reforms by GHQ Colonel Sams, origin of health and welfare policy after war in Japan), Kirishobou, 2007. 28
Ibid.
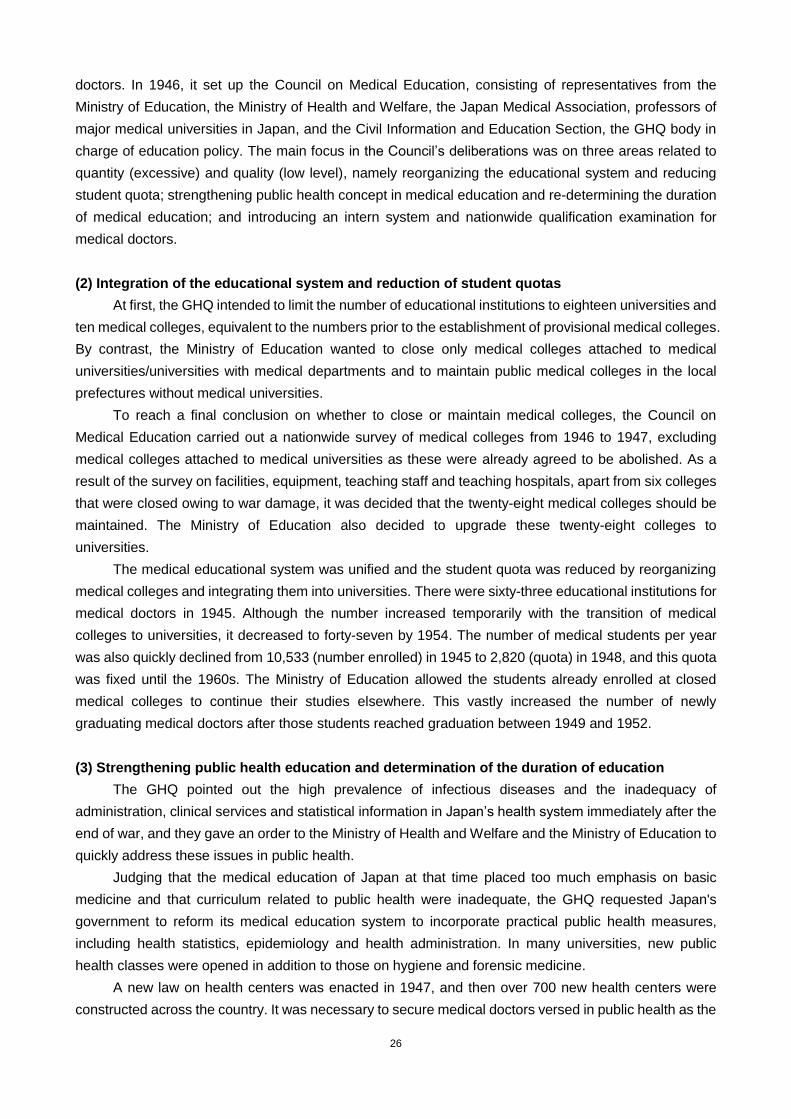
26
doctors. In 1946, it set up the Council on Medical Education, consisting of representatives from the
Ministry of Education, the Ministry of Health and Welfare, the Japan Medical Association, professors of
major medical universities in Japan, and the Civil Information and Education Section, the GHQ body in
charge of education policy. The main focus in the Council‟s deliberations was on three areas related to
quantity (excessive) and quality (low level), namely reorganizing the educational system and reducing
student quota; strengthening public health concept in medical education and re-determining the duration
of medical education; and introducing an intern system and nationwide qualification examination for
medical doctors.
(2) Integration of the educational system and reduction of student quotas
At first, the GHQ intended to limit the number of educational institutions to eighteen universities and
ten medical colleges, equivalent to the numbers prior to the establishment of provisional medical colleges.
By contrast, the Ministry of Education wanted to close only medical colleges attached to medical
universities/universities with medical departments and to maintain public medical colleges in the local
prefectures without medical universities.
To reach a final conclusion on whether to close or maintain medical colleges, the Council on
Medical Education carried out a nationwide survey of medical colleges from 1946 to 1947, excluding
medical colleges attached to medical universities as these were already agreed to be abolished. As a
result of the survey on facilities, equipment, teaching staff and teaching hospitals, apart from six colleges
that were closed owing to war damage, it was decided that the twenty-eight medical colleges should be
maintained. The Ministry of Education also decided to upgrade these twenty-eight colleges to
universities.
The medical educational system was unified and the student quota was reduced by reorganizing
medical colleges and integrating them into universities. There were sixty-three educational institutions for
medical doctors in 1945. Although the number increased temporarily with the transition of medical
colleges to universities, it decreased to forty-seven by 1954. The number of medical students per year
was also quickly declined from 10,533 (number enrolled) in 1945 to 2,820 (quota) in 1948, and this quota
was fixed until the 1960s. The Ministry of Education allowed the students already enrolled at closed
medical colleges to continue their studies elsewhere. This vastly increased the number of newly
graduating medical doctors after those students reached graduation between 1949 and 1952.
(3) Strengthening public health education and determination of the duration of education
The GHQ pointed out the high prevalence of infectious diseases and the inadequacy of
administration, clinical services and statistical information in Japan‟s health system immediately after the
end of war, and they gave an order to the Ministry of Health and Welfare and the Ministry of Education to
quickly address these issues in public health.
Judging that the medical education of Japan at that time placed too much emphasis on basic
medicine and that curriculum related to public health were inadequate, the GHQ requested Japan's
government to reform its medical education system to incorporate practical public health measures,
including health statistics, epidemiology and health administration. In many universities, new public
health classes were opened in addition to those on hygiene and forensic medicine.
A new law on health centers was enacted in 1947, and then over 700 new health centers were
constructed across the country. It was necessary to secure medical doctors versed in public health as the
27
heads of those centers, but the number of medical doctors specialized in public health was very limited at
the time. Under the circumstances, the Ministry of Health‟s National Institute of Public Health established
a three-month training course on public health administration targeted at medical doctors working in
health centers. It held a total of 27 classes over 9 years until 1955 and trained 886 medical doctors, of
which the number was nearly equivalent to the number of health centers all over the country. In 1949, a
one year comprehensive course on public health was established to foster about 10 public health
specialists every year.
Furthermore, the GHQ wanted to introduce the American medical educational system, with a total
of seven years, including three years of basic training and four years of specialist training. While the
Ministry of Education agreed to revise the curriculum, it planned an integrated educational system
consisting of 6 years of education after graduation from high-school instead. This would incur a smaller
economic burden for students. It also coincided with its planned reform of the pre-war complex national
education system and its transition to a new, streamlined system (6-3-3-4 years from primary to higher
education). In the end, a six-year system was adopted, on a condition that the duration would be
extended in future.
(4) Introduction of an intern system and national qualification examinations
Under the guidance of the GHQ, an intern system and national qualifying examination were
introduced with a view to improving clinical education and the quality of medical doctors. Although a
qualification examination had been implemented until 1914, it was abolished when automatic licensing at
graduation started. Both the GHQ and the Japanese side agreed to introduce both systems as soon as
possible to improve the quality of medical doctors. In 1946, the intern system was launched, and in 1947
the government launched national qualification examinations targeted at those who had completed the
internship.
Because the intern system was introduced hastily and inadequately before details had been
thoroughly designed on such matters as securing the teaching staff, developing the suitable training
curriculum, and status/treatment/remuneration of the interns at recipient hospitals, the system came
under severe criticism and became a social issue in the 1960s.
On the other hand, national qualification examinations were thought to be effective in managing the
quality of education. Fig. 19 shows numbers of successful and failed candidates. The pass rates were
81%-86% in the three years from 1947 to 1949 and improved to 87%-98% from the mid-1950s until the
1960s. The relatively low pass rate in 1947 to 1949, when new graduates increased rapidly, was thought
to reveal the effect of poor quality management. The pass rate has not fallen below 90% after 1960.
28
Fig. 19 Trends in numbers of candidates in national examinations to become medical doctors
1946-1960
2. Nurses, midwives and public health nurses
(1) The need for an integrated regulation
After World War II, policymakers had diverse perceptions concerning the qualifications and duties
of nurses, midwives and public health nurses. The GHQ thought it desirable to develop a system
integrating these three professions29
because they saw common underdeveloped problems for
respective systems of these professions. The problems included a lack of skill among nurses, unclear
skill-mix with medical doctors, and under-regulated training systems. On the Japanese side, meanwhile,
there were great hopes among nurses and public health nurses for the up-grading of the qualification and
their status that would embody gender equality and women‟s right to work, as clearly stated in the new
Constitution.30
On the other hand, there were also opposing moves among midwives, who were already
independent and active as specialists at the time. They opposed an integrated system with nurses and
public health nurses, who differed from midwives both in historical context and education system.
Preparation for an integrated system was led by the GHQ. In 1948, responding to the order of the
Nursing Affairs Division (NAD) set up within the GHQ, the Ministry of Health and Welfare set up a nursing
division. That division consisted of seventeen members headed by a director with nurse qualification in
the Bureau of Medical Affairs in the Ministry, and nursing sector reform was carried forward by the
initiative of this division.
NAD wanted to introduce a new model of nurse, which was still only at the introductory stage even
in the USA. The proposed model of nurses by NAD was a profession whose scope of work was basically
equivalent to that of public health nurses of Japan at that time. The scope of the work included not only
the augmented assistant functions of nurses in medical clinics but also disease prevention and health
promotion in the community.31
NAD had an idea that the entry requirement for nursing schools would be
raised to senior high school graduates; education for the proposed nurses would be a three-year
integrated curriculum of clinical nursing, public health and midwifery; and students would choose their
fields of specialty after graduation. The Japanese side, however, held the view that midwifery education
29
A.Sugiyama, Senryoki no iryoukaikaku (Healthcare reform during the occupation period), Seisoshobo,1995. 30
Ibid. 31
In the U.S.A, nursing activities with emphasis on social medicine and healthcare had been introduced in 1923, based on the recommendations of the “Winslow-Goldmark Report” on nursing and nursing education in the U.S.A.. This triggered improvements in the social status of nurses. In 1945, meanwhile, the National League for Nursing (NLN) was formed, and the “Brown Report” was published, indicating directions for nursing education as a specialist profession and the future expansion of the role of nursing in society.
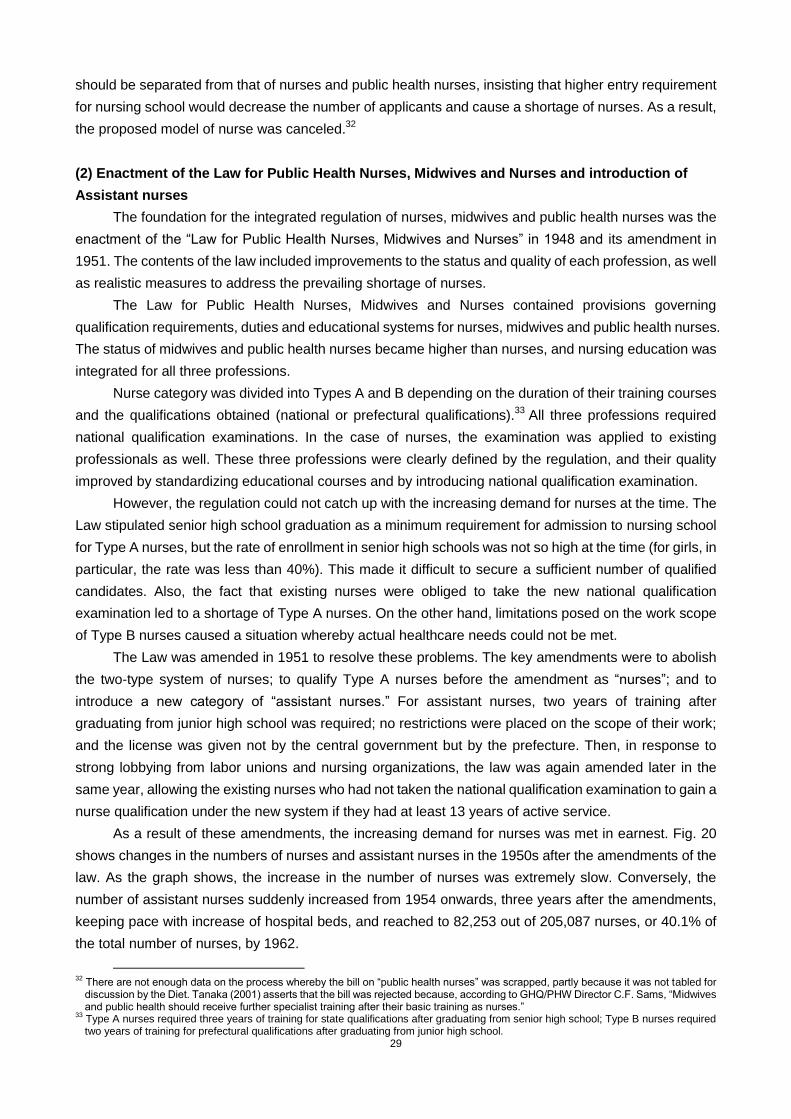
29
should be separated from that of nurses and public health nurses, insisting that higher entry requirement
for nursing school would decrease the number of applicants and cause a shortage of nurses. As a result,
the proposed model of nurse was canceled.32
(2) Enactment of the Law for Public Health Nurses, Midwives and Nurses and introduction of
Assistant nurses
The foundation for the integrated regulation of nurses, midwives and public health nurses was the
enactment of the “Law for Public Health Nurses, Midwives and Nurses” in 1948 and its amendment in
1951. The contents of the law included improvements to the status and quality of each profession, as well
as realistic measures to address the prevailing shortage of nurses.
The Law for Public Health Nurses, Midwives and Nurses contained provisions governing
qualification requirements, duties and educational systems for nurses, midwives and public health nurses.
The status of midwives and public health nurses became higher than nurses, and nursing education was
integrated for all three professions.
Nurse category was divided into Types A and B depending on the duration of their training courses
and the qualifications obtained (national or prefectural qualifications).33
All three professions required
national qualification examinations. In the case of nurses, the examination was applied to existing
professionals as well. These three professions were clearly defined by the regulation, and their quality
improved by standardizing educational courses and by introducing national qualification examination.
However, the regulation could not catch up with the increasing demand for nurses at the time. The
Law stipulated senior high school graduation as a minimum requirement for admission to nursing school
for Type A nurses, but the rate of enrollment in senior high schools was not so high at the time (for girls, in
particular, the rate was less than 40%). This made it difficult to secure a sufficient number of qualified
candidates. Also, the fact that existing nurses were obliged to take the new national qualification
examination led to a shortage of Type A nurses. On the other hand, limitations posed on the work scope
of Type B nurses caused a situation whereby actual healthcare needs could not be met.
The Law was amended in 1951 to resolve these problems. The key amendments were to abolish
the two-type system of nurses; to qualify Type A nurses before the amendment as “nurses”; and to
introduce a new category of “assistant nurses.” For assistant nurses, two years of training after
graduating from junior high school was required; no restrictions were placed on the scope of their work;
and the license was given not by the central government but by the prefecture. Then, in response to
strong lobbying from labor unions and nursing organizations, the law was again amended later in the
same year, allowing the existing nurses who had not taken the national qualification examination to gain a
nurse qualification under the new system if they had at least 13 years of active service.
As a result of these amendments, the increasing demand for nurses was met in earnest. Fig. 20
shows changes in the numbers of nurses and assistant nurses in the 1950s after the amendments of the
law. As the graph shows, the increase in the number of nurses was extremely slow. Conversely, the
number of assistant nurses suddenly increased from 1954 onwards, three years after the amendments,
keeping pace with increase of hospital beds, and reached to 82,253 out of 205,087 nurses, or 40.1% of
the total number of nurses, by 1962.
32
There are not enough data on the process whereby the bill on “public health nurses” was scrapped, partly because it was not tabled for discussion by the Diet. Tanaka (2001) asserts that the bill was rejected because, according to GHQ/PHW Director C.F. Sams, “Midwives and public health should receive further specialist training after their basic training as nurses.”
33 Type A nurses required three years of training for state qualifications after graduating from senior high school; Type B nurses required two years of training for prefectural qualifications after graduating from junior high school.
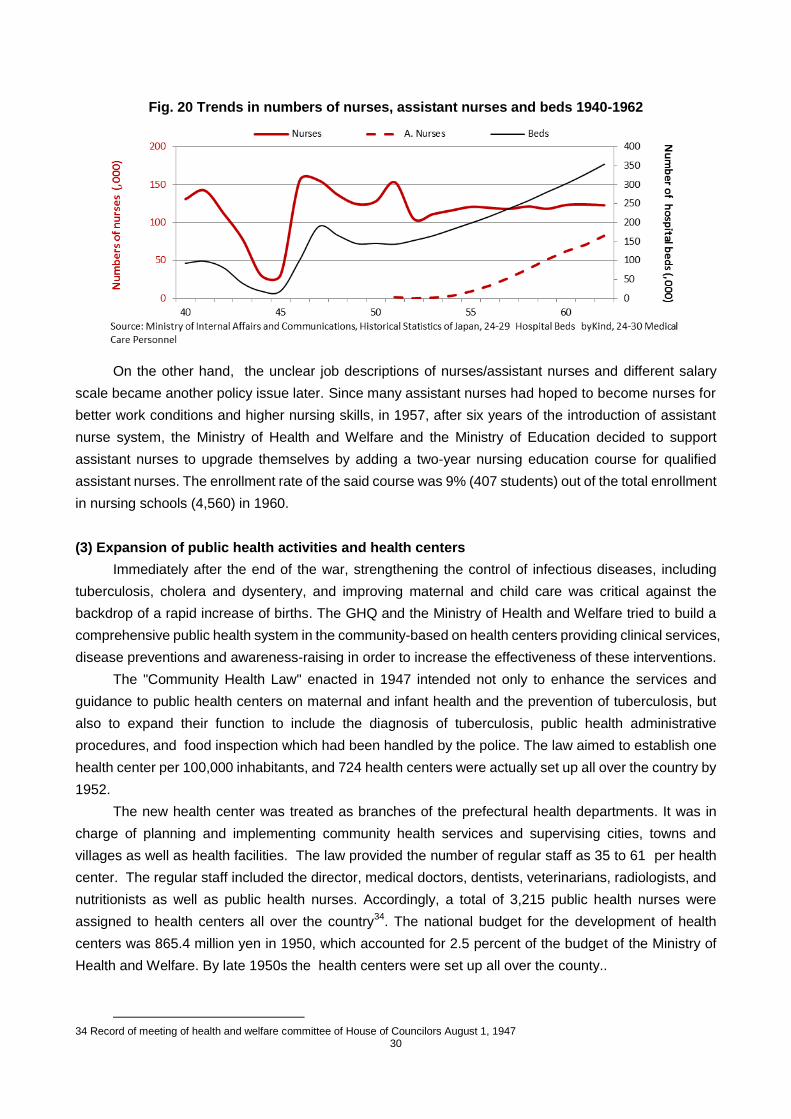
30
Fig. 20 Trends in numbers of nurses, assistant nurses and beds 1940-1962
On the other hand, the unclear job descriptions of nurses/assistant nurses and different salary
scale became another policy issue later. Since many assistant nurses had hoped to become nurses for
better work conditions and higher nursing skills, in 1957, after six years of the introduction of assistant
nurse system, the Ministry of Health and Welfare and the Ministry of Education decided to support
assistant nurses to upgrade themselves by adding a two-year nursing education course for qualified
assistant nurses. The enrollment rate of the said course was 9% (407 students) out of the total enrollment
in nursing schools (4,560) in 1960.
(3) Expansion of public health activities and health centers
Immediately after the end of the war, strengthening the control of infectious diseases, including
tuberculosis, cholera and dysentery, and improving maternal and child care was critical against the
backdrop of a rapid increase of births. The GHQ and the Ministry of Health and Welfare tried to build a
comprehensive public health system in the community-based on health centers providing clinical services,
disease preventions and awareness-raising in order to increase the effectiveness of these interventions.
The "Community Health Law" enacted in 1947 intended not only to enhance the services and
guidance to public health centers on maternal and infant health and the prevention of tuberculosis, but
also to expand their function to include the diagnosis of tuberculosis, public health administrative
procedures, and food inspection which had been handled by the police. The law aimed to establish one
health center per 100,000 inhabitants, and 724 health centers were actually set up all over the country by
1952.
The new health center was treated as branches of the prefectural health departments. It was in
charge of planning and implementing community health services and supervising cities, towns and
villages as well as health facilities. The law provided the number of regular staff as 35 to 61 per health
center. The regular staff included the director, medical doctors, dentists, veterinarians, radiologists, and
nutritionists as well as public health nurses. Accordingly, a total of 3,215 public health nurses were
assigned to health centers all over the country34
. The national budget for the development of health
centers was 865.4 million yen in 1950, which accounted for 2.5 percent of the budget of the Ministry of
Health and Welfare. By late 1950s the health centers were set up all over the county..
34 Record of meeting of health and welfare committee of House of Councilors August 1, 1947
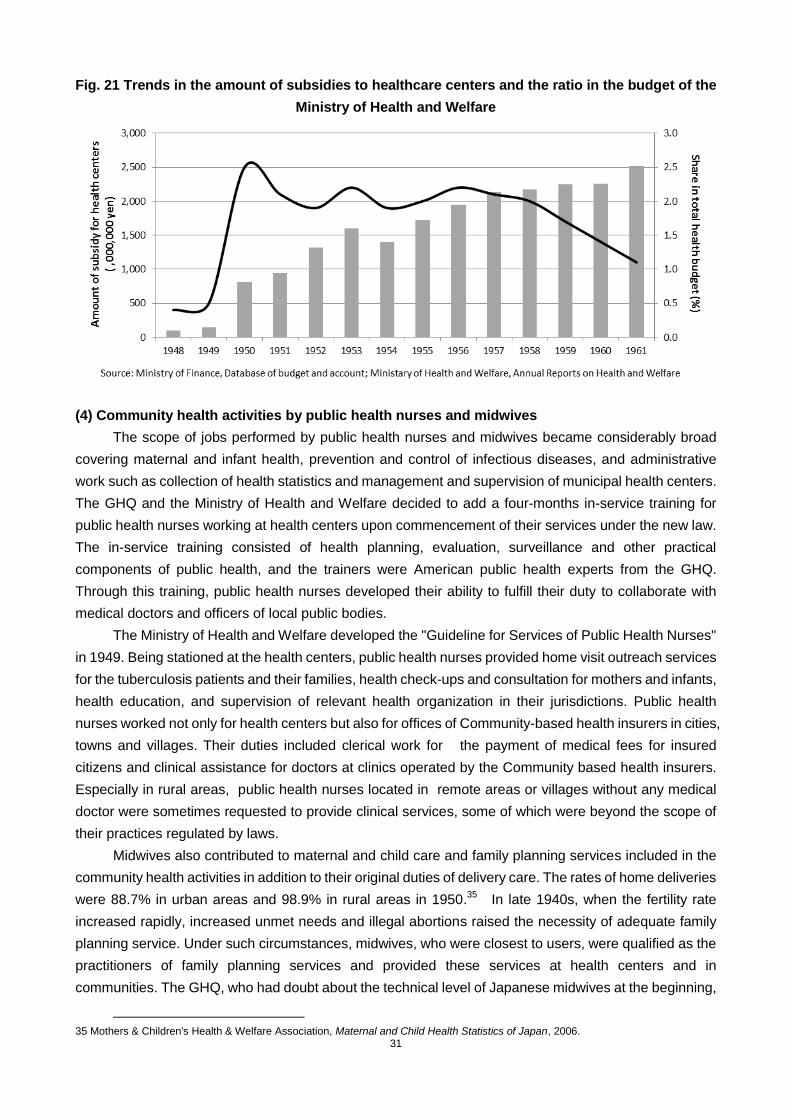
31
Fig. 21 Trends in the amount of subsidies to healthcare centers and the ratio in the budget of the
Ministry of Health and Welfare
(4) Community health activities by public health nurses and midwives
The scope of jobs performed by public health nurses and midwives became considerably broad
covering maternal and infant health, prevention and control of infectious diseases, and administrative
work such as collection of health statistics and management and supervision of municipal health centers.
The GHQ and the Ministry of Health and Welfare decided to add a four-months in-service training for
public health nurses working at health centers upon commencement of their services under the new law.
The in-service training consisted of health planning, evaluation, surveillance and other practical
components of public health, and the trainers were American public health experts from the GHQ.
Through this training, public health nurses developed their ability to fulfill their duty to collaborate with
medical doctors and officers of local public bodies.
The Ministry of Health and Welfare developed the "Guideline for Services of Public Health Nurses"
in 1949. Being stationed at the health centers, public health nurses provided home visit outreach services
for the tuberculosis patients and their families, health check-ups and consultation for mothers and infants,
health education, and supervision of relevant health organization in their jurisdictions. Public health
nurses worked not only for health centers but also for offices of Community-based health insurers in cities,
towns and villages. Their duties included clerical work for the payment of medical fees for insured
citizens and clinical assistance for doctors at clinics operated by the Community based health insurers.
Especially in rural areas, public health nurses located in remote areas or villages without any medical
doctor were sometimes requested to provide clinical services, some of which were beyond the scope of
their practices regulated by laws.
Midwives also contributed to maternal and child care and family planning services included in the
community health activities in addition to their original duties of delivery care. The rates of home deliveries
were 88.7% in urban areas and 98.9% in rural areas in 1950.35
In late 1940s, when the fertility rate
increased rapidly, increased unmet needs and illegal abortions raised the necessity of adequate family
planning service. Under such circumstances, midwives, who were closest to users, were qualified as the
practitioners of family planning services and provided these services at health centers and in
communities. The GHQ, who had doubt about the technical level of Japanese midwives at the beginning,
35 Mothers & Children's Health & Welfare Association, Maternal and Child Health Statistics of Japan, 2006.
32
observed their actual work and outcomes, and came to recognize their competence.36
The trends in the maternal mortality ratio and infant mortality rate at the time are shown in Figure 22.
The maternal mortality ratio increased for several years and then starts decreasing continuously. The
infant mortality rate also decreased in the period, from 76.7 per 1,000 lives in 1947 to 40.0 per 1,000 lives
in 1957. Although there were multiple factors that caused this change in mortality rates at that time, the
services of public health nurses and midwives in disease prevention and maternal and child health care
could be an important factor in these improved health outcomes.
Fig. 22 Trends in maternal mortality ratio and infant mortality rate 1947-1980
(5) Changing needs and roles of public health nurses and midwives
The role and work scope of public health nurses and midwives changed as public health conditions
improved and the number of clinics/medical facilities increased in the late 1950s. Maternal and infant
mortalities decreased (See Fig. 19), mortality from tuberculosis decreased (See Fig. 26), and other health
indicators also rapidly improved by the end of 1950s. At the same time, the fertility rate decreased during
the period (See Fig. 14).
The promotion of national health insurance and the increase of the number of hospitals and clinics
increased health care access at the time. Accordingly, curative care service at health centers and home
visit consultations of public health nurses declined. The demand for home delivery care by midwives also
decreased as more pregnant women preferred hospitals with more advanced equipment.
In the midst of such a change in medical needs, the functions of health centers were adjusted to
specific needs of their responsible areas: urban, rural, or remote areas. Accordingly, environmental
health in urban area, elderly care, health services in remote areas, industry-specific health care at
factories, became more prominent among the duties of public health nurses. Some midwives shifted their
work place from maternities to hospitals as deliveries at hospitals and clinics increased.
36 M.Obayashi, Josanpu no Sengo (Midwives in post-war),Keisoshobo, 2006.

33
Fig. 23 Change in the rates of home and institutional deliveries 1947-1980
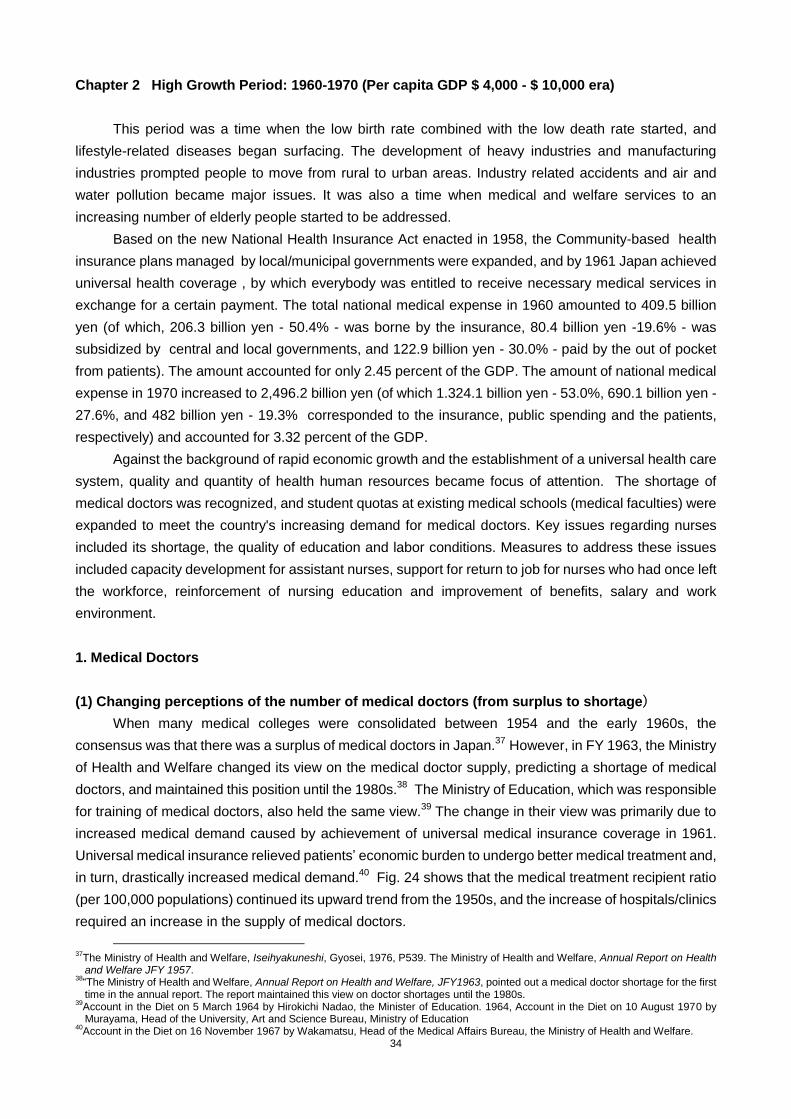
34
Chapter 2 High Growth Period: 1960-1970 (Per capita GDP $ 4,000 - $ 10,000 era)
This period was a time when the low birth rate combined with the low death rate started, and
lifestyle-related diseases began surfacing. The development of heavy industries and manufacturing
industries prompted people to move from rural to urban areas. Industry related accidents and air and
water pollution became major issues. It was also a time when medical and welfare services to an
increasing number of elderly people started to be addressed.
Based on the new National Health Insurance Act enacted in 1958, the Community-based health
insurance plans managed by local/municipal governments were expanded, and by 1961 Japan achieved
universal health coverage , by which everybody was entitled to receive necessary medical services in
exchange for a certain payment. The total national medical expense in 1960 amounted to 409.5 billion
yen (of which, 206.3 billion yen - 50.4% - was borne by the insurance, 80.4 billion yen -19.6% - was
subsidized by central and local governments, and 122.9 billion yen - 30.0% - paid by the out of pocket
from patients). The amount accounted for only 2.45 percent of the GDP. The amount of national medical
expense in 1970 increased to 2,496.2 billion yen (of which 1.324.1 billion yen - 53.0%, 690.1 billion yen -
27.6%, and 482 billion yen - 19.3% corresponded to the insurance, public spending and the patients,
respectively) and accounted for 3.32 percent of the GDP.
Against the background of rapid economic growth and the establishment of a universal health care
system, quality and quantity of health human resources became focus of attention. The shortage of
medical doctors was recognized, and student quotas at existing medical schools (medical faculties) were
expanded to meet the country's increasing demand for medical doctors. Key issues regarding nurses
included its shortage, the quality of education and labor conditions. Measures to address these issues
included capacity development for assistant nurses, support for return to job for nurses who had once left
the workforce, reinforcement of nursing education and improvement of benefits, salary and work
environment.
1. Medical Doctors
(1) Changing perceptions of the number of medical doctors (from surplus to shortage)
When many medical colleges were consolidated between 1954 and the early 1960s, the
consensus was that there was a surplus of medical doctors in Japan.37
However, in FY 1963, the Ministry
of Health and Welfare changed its view on the medical doctor supply, predicting a shortage of medical
doctors, and maintained this position until the 1980s.38
The Ministry of Education, which was responsible
for training of medical doctors, also held the same view.39
The change in their view was primarily due to
increased medical demand caused by achievement of universal medical insurance coverage in 1961.
Universal medical insurance relieved patients‟ economic burden to undergo better medical treatment and,
in turn, drastically increased medical demand.40
Fig. 24 shows that the medical treatment recipient ratio
(per 100,000 populations) continued its upward trend from the 1950s, and the increase of hospitals/clinics
required an increase in the supply of medical doctors.
37
The Ministry of Health and Welfare, Iseihyakuneshi, Gyosei, 1976, P539. The Ministry of Health and Welfare, Annual Report on Health and Welfare JFY 1957.
38“The Ministry of Health and Welfare, Annual Report on Health and Welfare, JFY1963, pointed out a medical doctor shortage for the first time in the annual report. The report maintained this view on doctor shortages until the 1980s.
39Account in the Diet on 5 March 1964 by Hirokichi Nadao, the Minister of Education. 1964, Account in the Diet on 10 August 1970 by Murayama, Head of the University, Art and Science Bureau, Ministry of Education
40Account in the Diet on 16 November 1967 by Wakamatsu, Head of the Medical Affairs Bureau, the Ministry of Health and Welfare.

35
Fig. 24 Trends in the treatment ratio and the number of medical doctors 1948-1980
An increase in medical institutions was prompted by the new institutional framework for medical
education established by the central government. In 1948, a “Medical Service Law” was enacted. The
law aimed to prepare and stipulate the regulatory framework for medical institutions, such as hospitals,
general clinics and midwifery centers, health care planning and medical corporations. Nevertheless,
under tight fiscal constraints, the establishment of new public hospitals was delayed, and in 1950, the law
was revised to set a legal framework to encourage new openings of private medical institutions by
granting them corporate status and providing tax incentives. In addition, in 1960, a “Law on Medical Care
Facilities Financing Corporation” was stipulated to provide low-interest, long-term loans for private
medical institutions . Although medical institutions had been able to start practice anywhere in the country
once it met facility criteria even before 1945, the pre-war government aimed at controlling supply side.
During the expansion of health insurance coverage, local governments which functioned as insurer
and manager of the Community-based health insurance plans decided to build their own hospitals and
clinics, using the funds from insurance premium, in rural areas where private sector medical facilities
were scarce. They were called “National health insurance hospital or clinic”. As of 1966, the former
number was about 550, and the latter number was 2,050. They contributed to mitigate the intra-regional
gap in the number of medical facilities.
In analyzing medical doctor supply and demand, the then policy-makers in the Ministry of Health
and Welfare appear to have used a relatively simple model to formulate policies - the number of
newly-trained entrants into the labor market minus the exits from the labor market due to death and other
reasons.41
The ministry seemed to have lacked a rigorous definition for medical doctor supply and
demand or a detail simulation model, and statistics on important variables such as employment rate of
medical school graduates by sex, medical doctors‟ labor productivity and medical examination rate of
general public. It was only in 1984 when the Ministry of Health and Welfare started a rigorous study on
the supply and demand of medical doctors in earnest with establishment of “Study Committee
Concerning Future Supply and Demand of Medical Doctors". During the 1960s, policy-makers seemed to
have largely depended on simple estimates and tacit judgment, but not on evidence.
41
The Ministry of Health and Welfare, Iseihyakuneshi, Gyosei, 1976, P539 states that “since about 3,000 students graduated from medical schools every year around 1955, (…) supply and demand of medical doctors would continue to be appropriate in future.”. The Ministry of Health and Welfare, Annual Report on Health and Welfare, JFY 1964, states that “currently, 3,000-3,500 medical doctors are produced every year, while medical doctors decrease in number by more than 1,000 every year due to death and other reasons. As a result, there is a net increase of 1,000-2,000 doctors. However, given Japan‟s medical trends, demand for medical doctors is expected to jump in future. Therefore, future supply and demand of medical doctors must be carefully examined.”

36
In FY1963, the Ministry of Health and Welfare and the Ministry of Education came to acknowledge
that the country would face a serious medical doctor shortage in the future and started to take specific
actions. The Ministry of Health and Welfare used the number of medical doctors per 100,000 population
as an indicator to measure the adequacy of medical doctors‟ supply by making comparison with
advanced counties.42 43
Nevertheless, both ministries did not set clear and specific targets or a timeframe,
citing difficulties in objective estimates.44
(2) Expanded student quotas at existing medical schools and medical faculties
The policy instrument used by the Ministry of Health and Welfare and the Ministry of Education to
increase the number of medical doctors was to expand student quotas at existing medical schools
(medical faculties). This was probably because it required less administrative changes and fiscal burdens
than other policy options such as creation of new medical schools or medical faculties. 45
Revision of a
ministerial ordinance from of the Ministry of Health and Welfare was easier and sufficient to quickly
change the quotas at existing medical schools (medical faculties), and legislation was not required. The
typical cost of establishing a new university, including land acquisition, the construction of a university
building and its university hospital was approximately 4 billion-5 billion JPY in those days.
The Ministry of Health and Welfare examined the medical doctor supply and demand, and then
requested the Ministry of Education to examine and plan medical student quotas.46
The Ministry of Health and Welfare started to consider an increase in medical student quotas in late
1962.47
As Fig. 25 shows, the Ministry of Education gradually expanded the quotas at existing medical
schools between FY1963 and FY1969, and the number of medical students increased at a total of 46
medical schools (24 national, 9 public and 13 private medical schools). In this process, the Ministry of
Education standardized the quota increase by school size: schools with a quota of less than 60 students
were allowed to expand their respective quotas to 60 and schools with that of 80 to 100. The medical
student quotas increased 1.4 times from 1,200 to 2,840 in FY1963 to 4,040 in FY1969.
42
Account in the Diet 25 March 1966, Atsumi, Head of the Medical Affairs Bureau, the Ministry of Health and Welfare 43
The Ministry of Health and Welfare, Annual Reports on Health and Welfare JFY1963 and JFY1964.
44Account in the Diet on 29 March 1963 by Ozaki, Head of the Medical Affairs Bureau, the Ministry of Health and Welfare. Account in the Diet on 23 March 1965 by Murayama, Head of the University, Art and Science Bureau, the Ministry of Education.
45 Accounts in the Diet on 10 August 1970 by Murayama, Head of the University, Art and Science Bureau, the Ministry of Education, and by Tsuneo Uchida, the Minister of Health and Welfare.
46 Account in the Diet on 29 March 1963 by Ozaki, Head of the Medical Affairs Bureau, the Ministry of Health and Welfare. Account in the Diet on 5 March 1964 by Hirokichi Nadao, the Minister of Education. Account in the Diet on 16 November 1967 by Hideo Bo, the Minister of Health and Welfare. Account in the Diet on 16 November 1967 by Miyaji, Head of the University, Art and Science Bureau, the Ministry of Education.
47 Account in the Diet on 29 March 1963 by Ozaki, Head of the Medical Affairs Bureau, the Ministry of Health and Welfare.
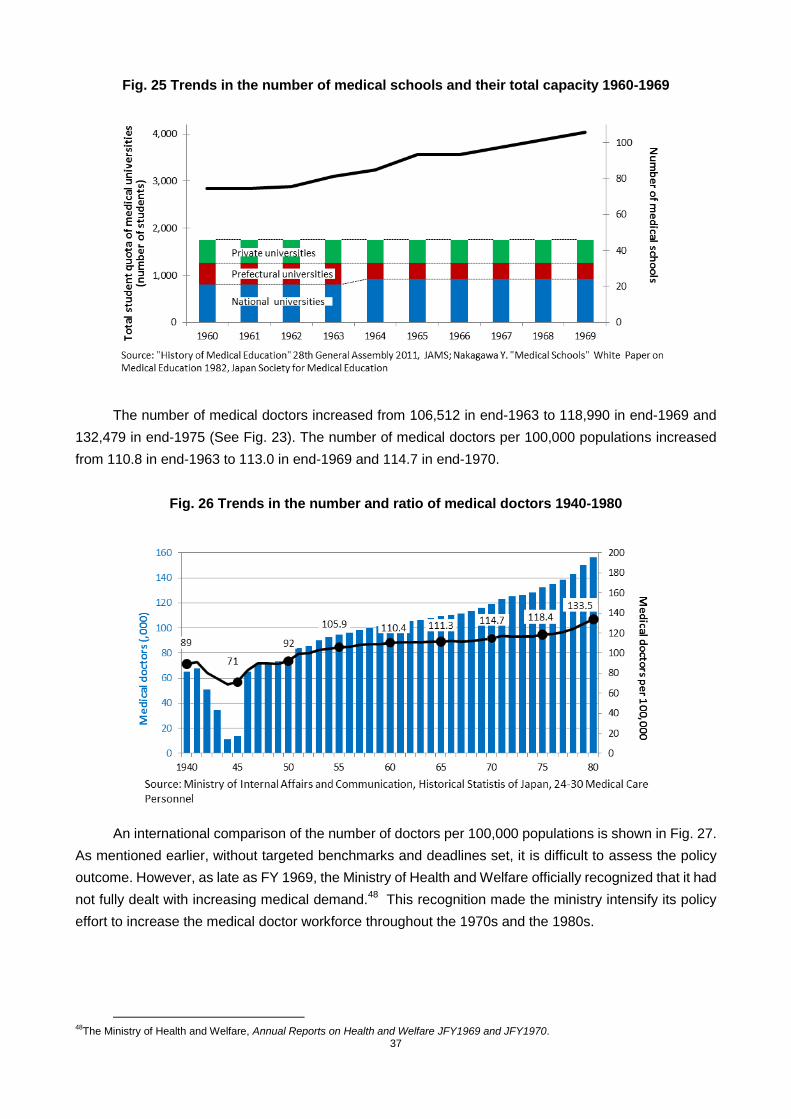
37
Fig. 25 Trends in the number of medical schools and their total capacity 1960-1969
The number of medical doctors increased from 106,512 in end-1963 to 118,990 in end-1969 and
132,479 in end-1975 (See Fig. 23). The number of medical doctors per 100,000 populations increased
from 110.8 in end-1963 to 113.0 in end-1969 and 114.7 in end-1970.
Fig. 26 Trends in the number and ratio of medical doctors 1940-1980
An international comparison of the number of doctors per 100,000 populations is shown in Fig. 27.
As mentioned earlier, without targeted benchmarks and deadlines set, it is difficult to assess the policy
outcome. However, as late as FY 1969, the Ministry of Health and Welfare officially recognized that it had
not fully dealt with increasing medical demand.48
This recognition made the ministry intensify its policy
effort to increase the medical doctor workforce throughout the 1970s and the 1980s.
48
The Ministry of Health and Welfare, Annual Reports on Health and Welfare JFY1969 and JFY1970.
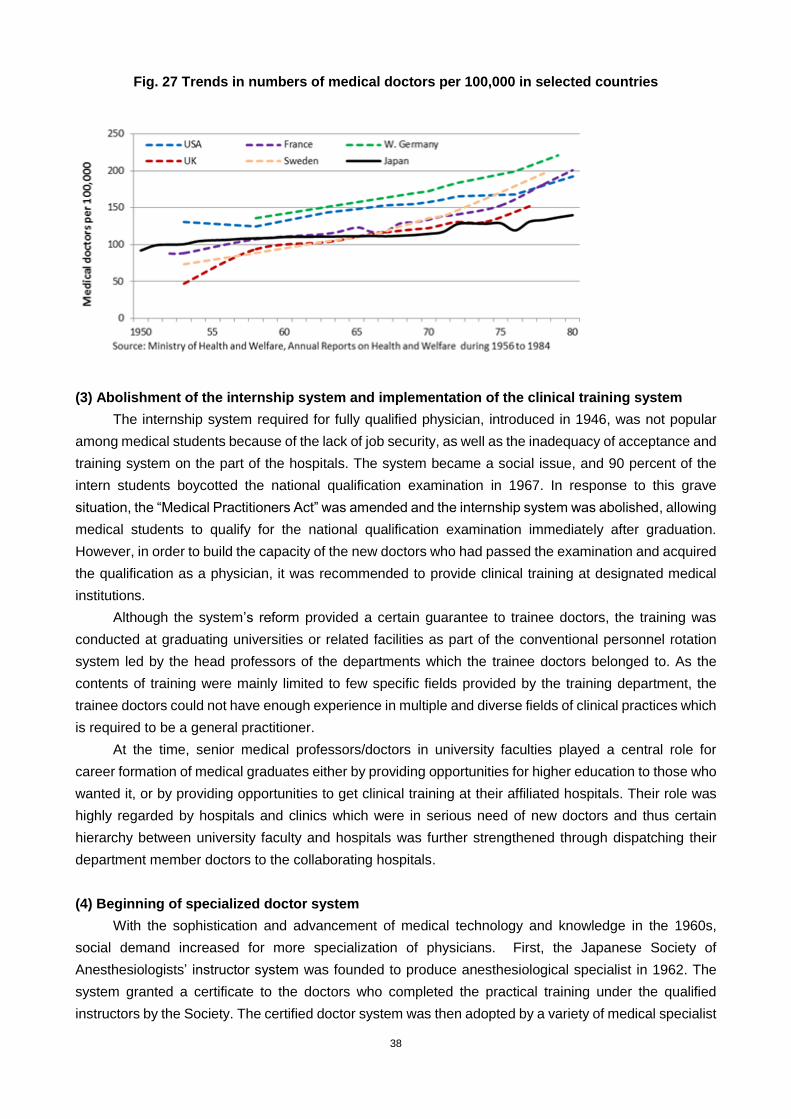
38
Fig. 27 Trends in numbers of medical doctors per 100,000 in selected countries
(3) Abolishment of the internship system and implementation of the clinical training system
The internship system required for fully qualified physician, introduced in 1946, was not popular
among medical students because of the lack of job security, as well as the inadequacy of acceptance and
training system on the part of the hospitals. The system became a social issue, and 90 percent of the
intern students boycotted the national qualification examination in 1967. In response to this grave
situation, the “Medical Practitioners Act” was amended and the internship system was abolished, allowing
medical students to qualify for the national qualification examination immediately after graduation.
However, in order to build the capacity of the new doctors who had passed the examination and acquired
the qualification as a physician, it was recommended to provide clinical training at designated medical
institutions.
Although the system‟s reform provided a certain guarantee to trainee doctors, the training was
conducted at graduating universities or related facilities as part of the conventional personnel rotation
system led by the head professors of the departments which the trainee doctors belonged to. As the
contents of training were mainly limited to few specific fields provided by the training department, the
trainee doctors could not have enough experience in multiple and diverse fields of clinical practices which
is required to be a general practitioner.
At the time, senior medical professors/doctors in university faculties played a central role for
career formation of medical graduates either by providing opportunities for higher education to those who
wanted it, or by providing opportunities to get clinical training at their affiliated hospitals. Their role was
highly regarded by hospitals and clinics which were in serious need of new doctors and thus certain
hierarchy between university faculty and hospitals was further strengthened through dispatching their
department member doctors to the collaborating hospitals.
(4) Beginning of specialized doctor system
With the sophistication and advancement of medical technology and knowledge in the 1960s,
social demand increased for more specialization of physicians. First, the Japanese Society of
Anesthesiologists‟ instructor system was founded to produce anesthesiological specialist in 1962. The
system granted a certificate to the doctors who completed the practical training under the qualified
instructors by the Society. The certified doctor system was then adopted by a variety of medical specialist
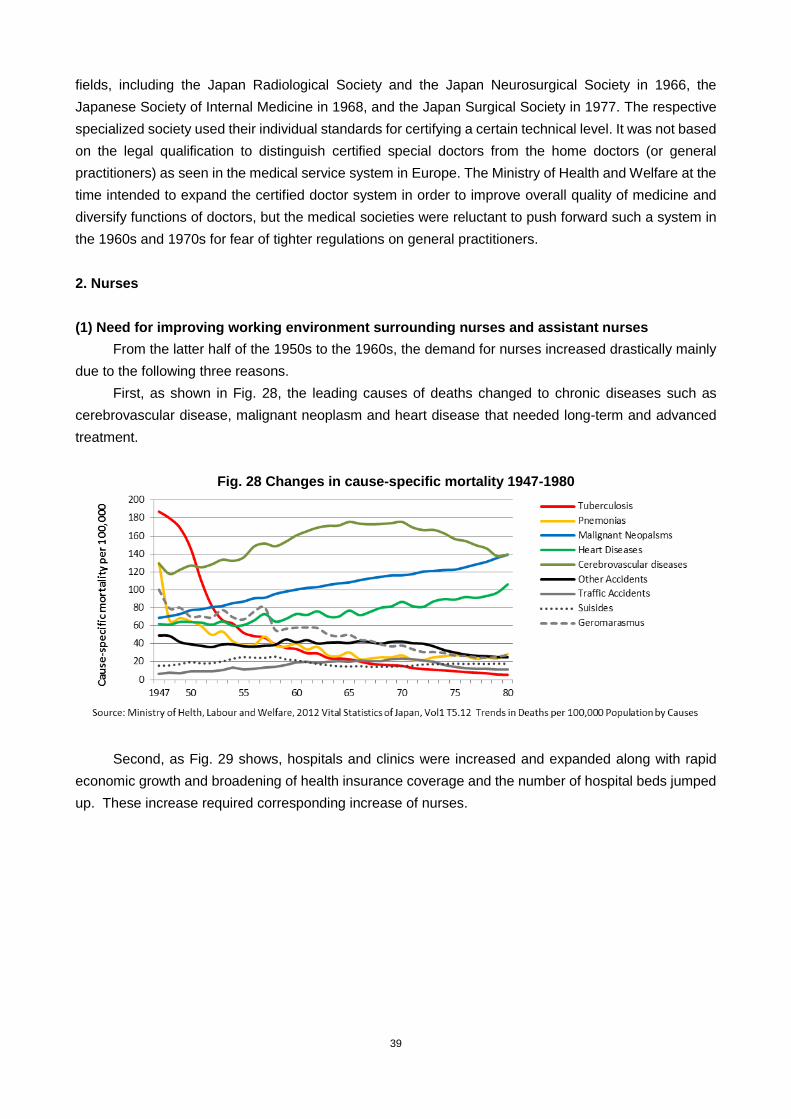
39
fields, including the Japan Radiological Society and the Japan Neurosurgical Society in 1966, the
Japanese Society of Internal Medicine in 1968, and the Japan Surgical Society in 1977. The respective
specialized society used their individual standards for certifying a certain technical level. It was not based
on the legal qualification to distinguish certified special doctors from the home doctors (or general
practitioners) as seen in the medical service system in Europe. The Ministry of Health and Welfare at the
time intended to expand the certified doctor system in order to improve overall quality of medicine and
diversify functions of doctors, but the medical societies were reluctant to push forward such a system in
the 1960s and 1970s for fear of tighter regulations on general practitioners.
2. Nurses
(1) Need for improving working environment surrounding nurses and assistant nurses
From the latter half of the 1950s to the 1960s, the demand for nurses increased drastically mainly
due to the following three reasons.
First, as shown in Fig. 28, the leading causes of deaths changed to chronic diseases such as
cerebrovascular disease, malignant neoplasm and heart disease that needed long-term and advanced
treatment.
Fig. 28 Changes in cause-specific mortality 1947-1980
Second, as Fig. 29 shows, hospitals and clinics were increased and expanded along with rapid
economic growth and broadening of health insurance coverage and the number of hospital beds jumped
up. These increase required corresponding increase of nurses.
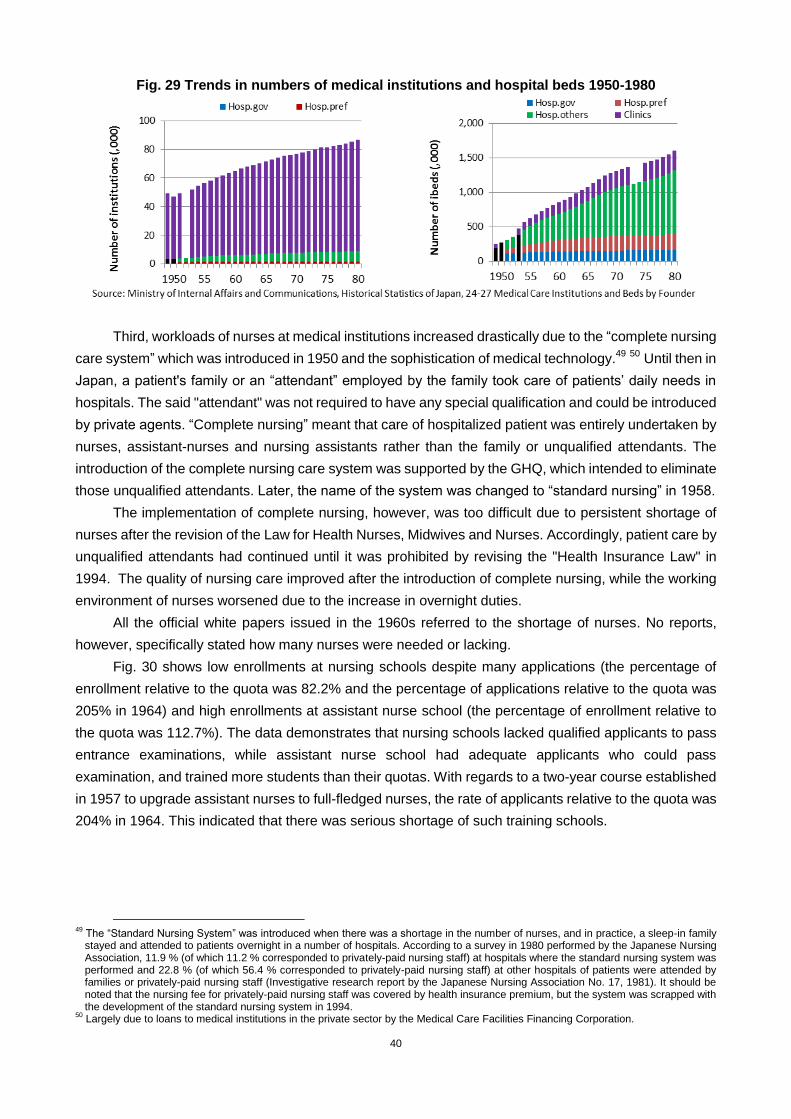
40
Fig. 29 Trends in numbers of medical institutions and hospital beds 1950-1980
Third, workloads of nurses at medical institutions increased drastically due to the “complete nursing
care system” which was introduced in 1950 and the sophistication of medical technology.49
50
Until then in
Japan, a patient's family or an “attendant” employed by the family took care of patients‟ daily needs in
hospitals. The said "attendant" was not required to have any special qualification and could be introduced
by private agents. “Complete nursing” meant that care of hospitalized patient was entirely undertaken by
nurses, assistant-nurses and nursing assistants rather than the family or unqualified attendants. The
introduction of the complete nursing care system was supported by the GHQ, which intended to eliminate
those unqualified attendants. Later, the name of the system was changed to “standard nursing” in 1958.
The implementation of complete nursing, however, was too difficult due to persistent shortage of
nurses after the revision of the Law for Health Nurses, Midwives and Nurses. Accordingly, patient care by
unqualified attendants had continued until it was prohibited by revising the "Health Insurance Law" in
1994. The quality of nursing care improved after the introduction of complete nursing, while the working
environment of nurses worsened due to the increase in overnight duties.
All the official white papers issued in the 1960s referred to the shortage of nurses. No reports,
however, specifically stated how many nurses were needed or lacking.
Fig. 30 shows low enrollments at nursing schools despite many applications (the percentage of
enrollment relative to the quota was 82.2% and the percentage of applications relative to the quota was
205% in 1964) and high enrollments at assistant nurse school (the percentage of enrollment relative to
the quota was 112.7%). The data demonstrates that nursing schools lacked qualified applicants to pass
entrance examinations, while assistant nurse school had adequate applicants who could pass
examination, and trained more students than their quotas. With regards to a two-year course established
in 1957 to upgrade assistant nurses to full-fledged nurses, the rate of applicants relative to the quota was
204% in 1964. This indicated that there was serious shortage of such training schools.
49
The “Standard Nursing System” was introduced when there was a shortage in the number of nurses, and in practice, a sleep-in family stayed and attended to patients overnight in a number of hospitals. According to a survey in 1980 performed by the Japanese Nursing Association, 11.9 % (of which 11.2 % corresponded to privately-paid nursing staff) at hospitals where the standard nursing system was performed and 22.8 % (of which 56.4 % corresponded to privately-paid nursing staff) at other hospitals of patients were attended by families or privately-paid nursing staff (Investigative research report by the Japanese Nursing Association No. 17, 1981). It should be noted that the nursing fee for privately-paid nursing staff was covered by health insurance premium, but the system was scrapped with the development of the standard nursing system in 1994.
50 Largely due to loans to medical institutions in the private sector by the Medical Care Facilities Financing Corporation.
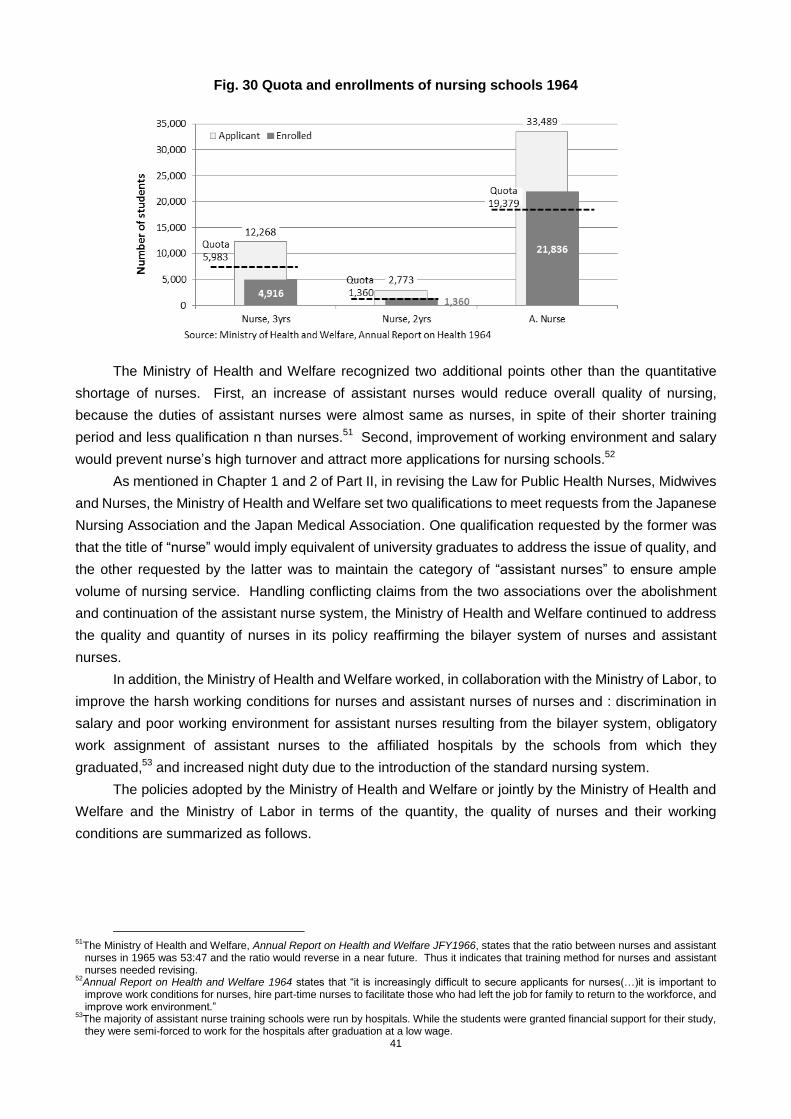
41
Fig. 30 Quota and enrollments of nursing schools 1964
The Ministry of Health and Welfare recognized two additional points other than the quantitative
shortage of nurses. First, an increase of assistant nurses would reduce overall quality of nursing,
because the duties of assistant nurses were almost same as nurses, in spite of their shorter training
period and less qualification n than nurses.51
Second, improvement of working environment and salary
would prevent nurse‟s high turnover and attract more applications for nursing schools.52
As mentioned in Chapter 1 and 2 of Part II, in revising the Law for Public Health Nurses, Midwives
and Nurses, the Ministry of Health and Welfare set two qualifications to meet requests from the Japanese
Nursing Association and the Japan Medical Association. One qualification requested by the former was
that the title of “nurse” would imply equivalent of university graduates to address the issue of quality, and
the other requested by the latter was to maintain the category of “assistant nurses” to ensure ample
volume of nursing service. Handling conflicting claims from the two associations over the abolishment
and continuation of the assistant nurse system, the Ministry of Health and Welfare continued to address
the quality and quantity of nurses in its policy reaffirming the bilayer system of nurses and assistant
nurses.
In addition, the Ministry of Health and Welfare worked, in collaboration with the Ministry of Labor, to
improve the harsh working conditions for nurses and assistant nurses of nurses and : discrimination in
salary and poor working environment for assistant nurses resulting from the bilayer system, obligatory
work assignment of assistant nurses to the affiliated hospitals by the schools from which they
graduated,53
and increased night duty due to the introduction of the standard nursing system.
The policies adopted by the Ministry of Health and Welfare or jointly by the Ministry of Health and
Welfare and the Ministry of Labor in terms of the quantity, the quality of nurses and their working
conditions are summarized as follows.
51
The Ministry of Health and Welfare, Annual Report on Health and Welfare JFY1966, states that the ratio between nurses and assistant nurses in 1965 was 53:47 and the ratio would reverse in a near future. Thus it indicates that training method for nurses and assistant nurses needed revising.
52Annual Report on Health and Welfare 1964 states that “it is increasingly difficult to secure applicants for nurses(…)it is important to improve work conditions for nurses, hire part-time nurses to facilitate those who had left the job for family to return to the workforce, and improve work environment.”
53The majority of assistant nurse training schools were run by hospitals. While the students were granted financial support for their study, they were semi-forced to work for the hospitals after graduation at a low wage.
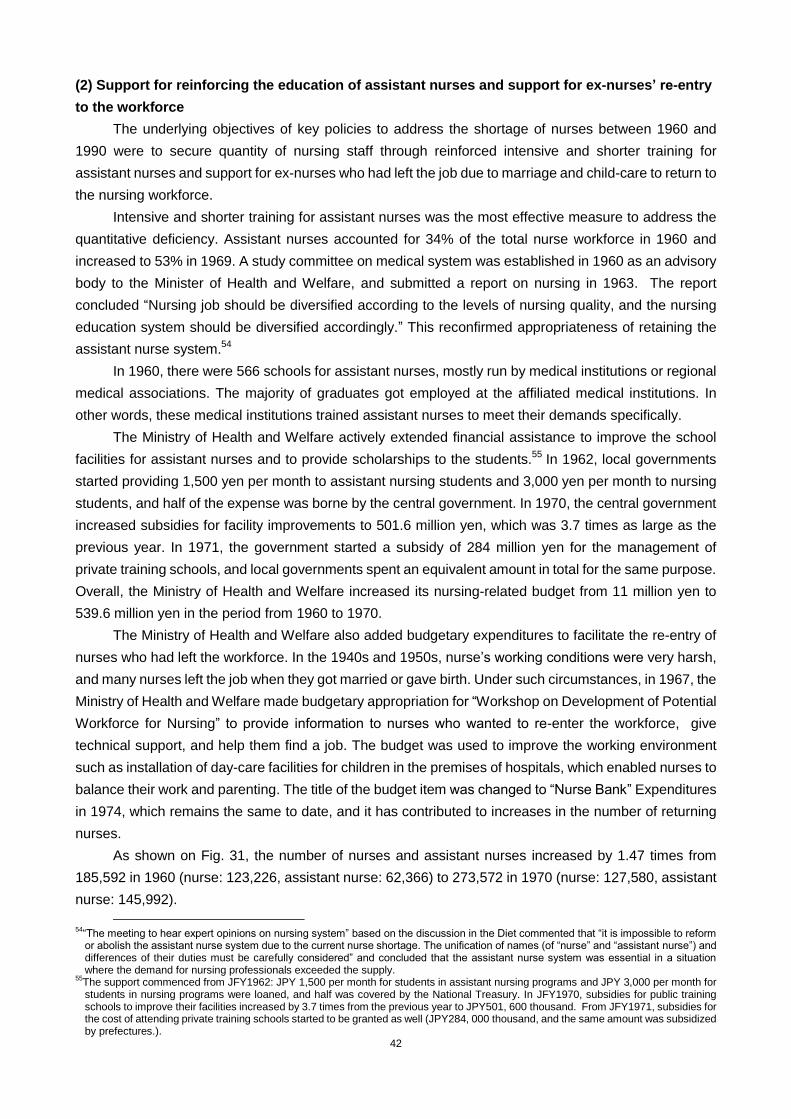
42
(2) Support for reinforcing the education of assistant nurses and support for ex-nurses’ re-entry
to the workforce
The underlying objectives of key policies to address the shortage of nurses between 1960 and
1990 were to secure quantity of nursing staff through reinforced intensive and shorter training for
assistant nurses and support for ex-nurses who had left the job due to marriage and child-care to return to
the nursing workforce.
Intensive and shorter training for assistant nurses was the most effective measure to address the
quantitative deficiency. Assistant nurses accounted for 34% of the total nurse workforce in 1960 and
increased to 53% in 1969. A study committee on medical system was established in 1960 as an advisory
body to the Minister of Health and Welfare, and submitted a report on nursing in 1963. The report
concluded “Nursing job should be diversified according to the levels of nursing quality, and the nursing
education system should be diversified accordingly.” This reconfirmed appropriateness of retaining the
assistant nurse system.54
In 1960, there were 566 schools for assistant nurses, mostly run by medical institutions or regional
medical associations. The majority of graduates got employed at the affiliated medical institutions. In
other words, these medical institutions trained assistant nurses to meet their demands specifically.
The Ministry of Health and Welfare actively extended financial assistance to improve the school
facilities for assistant nurses and to provide scholarships to the students.55
In 1962, local governments
started providing 1,500 yen per month to assistant nursing students and 3,000 yen per month to nursing
students, and half of the expense was borne by the central government. In 1970, the central government
increased subsidies for facility improvements to 501.6 million yen, which was 3.7 times as large as the
previous year. In 1971, the government started a subsidy of 284 million yen for the management of
private training schools, and local governments spent an equivalent amount in total for the same purpose.
Overall, the Ministry of Health and Welfare increased its nursing-related budget from 11 million yen to
539.6 million yen in the period from 1960 to 1970.
The Ministry of Health and Welfare also added budgetary expenditures to facilitate the re-entry of
nurses who had left the workforce. In the 1940s and 1950s, nurse‟s working conditions were very harsh,
and many nurses left the job when they got married or gave birth. Under such circumstances, in 1967, the
Ministry of Health and Welfare made budgetary appropriation for “Workshop on Development of Potential
Workforce for Nursing” to provide information to nurses who wanted to re-enter the workforce, give
technical support, and help them find a job. The budget was used to improve the working environment
such as installation of day-care facilities for children in the premises of hospitals, which enabled nurses to
balance their work and parenting. The title of the budget item was changed to “Nurse Bank” Expenditures
in 1974, which remains the same to date, and it has contributed to increases in the number of returning
nurses.
As shown on Fig. 31, the number of nurses and assistant nurses increased by 1.47 times from
185,592 in 1960 (nurse: 123,226, assistant nurse: 62,366) to 273,572 in 1970 (nurse: 127,580, assistant
nurse: 145,992).
54
“The meeting to hear expert opinions on nursing system” based on the discussion in the Diet commented that “it is impossible to reform or abolish the assistant nurse system due to the current nurse shortage. The unification of names (of “nurse” and “assistant nurse”) and differences of their duties must be carefully considered” and concluded that the assistant nurse system was essential in a situation where the demand for nursing professionals exceeded the supply.
55The support commenced from JFY1962: JPY 1,500 per month for students in assistant nursing programs and JPY 3,000 per month for students in nursing programs were loaned, and half was covered by the National Treasury. In JFY1970, subsidies for public training schools to improve their facilities increased by 3.7 times from the previous year to JPY501, 600 thousand. From JFY1971, subsidies for the cost of attending private training schools started to be granted as well (JPY284, 000 thousand, and the same amount was subsidized by prefectures.).
43
Fig. 31 Trends in numbers of nurses and assistant nurses 1945-1980
(3) Upgrading of training schools and support for assistant nurses upgrading to be full- fledged
nurses
To improve the quality of nurses, the Ministry of Health and Welfare launched a number of policies
including the framing their education in the general education system (university, college and high school)
based on the "School Education Law," and the opening of a two-year course for assistant nurses
upgrading to full-fledged nurses.
In the 1950s, only two universities had nursing courses.56
Later, St. Luke's Junior College of
Nursing became St. Luke‟s College of Nursing to offer Bachelor of Nursing degree in 1963, and the
Japanese Red Cross Junior College of Nursing was established in 1964. Furthermore, between 1966 and
1969, four national universities opened courses for nursing teachers under their respective education
faculties. In 1968, one national university and one private university respectively established a school of
nursing. Thus, the framework to train teachers of nursing in higher education was gradually established.
Fig. 32 represents the changes in the number of training institutions.
Along with these developments, the Ministry of Health and Welfare established a long-term training
course for university teachers of nursing at the National Institute of Public Health to support and
strengthen their educational functions at universities.
56
In 1952, Kochi Women's University opened a course on sanitary science and nursing science in the department of domestic science. In 1953, Tokyo University‟s medical department opened course on sanitary science and nursing science. In 1954, St. Luke's Junior College
of Nursing(which was to become a “College” in 1964)and the Japanese Red Cross Junior College for Women (which was to become
a “College” in 1986) were established.

44
Fig. 32 Trends in numbers of nursing schools 1950-1980
The Ministry of Health and Welfare and the Ministry of Education expanded the two-year nursing
education course for assistant nurses as stipulated in Chapter 1, (2). As a result, the enrollment rate
increased from 9.1% (407 students out of 4,560 total enrollments) in 1960 to 22% (1,360 out of 6,276) in
1964.
(4) Improvement in working environment and salary conditions
Working conditions for nurses at that time were very hard. In the 1950s,57
the heavy workload of
nurses became even heavier due to additional night duties, and the salaries of nurses were kept low.
These factors increased the dissatisfaction among nurses, and a number of nation-wide hospital strikes
broke out.
Under the circumstances, in response to the recommendation of the National Personnel Authority
which acknowledged the demand by nurses for “mandating two nurses for overnight duties, restricting the
days of overnight shifts to less than eight days per month,” the Ministry of Health and Welfare reinforced
policies and support for installation of nap facilities for nursing staff on night duty and increase in the
number of nurses to mitigate the burden of night duty in national hospitals.58
Through the policy review on nurses by the Ministry of Health and Welfare throughout the 1960s as
shown in the above (2) to (4), supporting the demands of nursing schools and labor unions produced
positive results on the increase of nurses to respond rapidly grown needs of health care services during
the period.
On the other hand, since the main focus of the Ministry of Health and Welfare‟s policy on nurses
was the increase of the number of nurses, it is undeniable that there were certain delay in improvement to
quality of nursing education and working environment of hospital nurses. Particularly, the latter was only
pursued in the national hospitals, and those in private hospitals did not improve. Table 2 shows changes
in the nurse-related budgets of the Ministry of Health and Welfare. In 1950 12.04 million yen was
allocated for implementing the Law for Public Health Nurses, Midwives and Nurses, and this budget item
increased significantly from 11 million yen in 1960 to 1.668 billion yen in 1967, and 5.396 billion yen in
1970. The budgets were mainly distributed to public hospitals and training institutions.
57
In 1950, research by the Agency for Labour reported that ward nurses worked an average of 56.2 hours per week on two shifts, and outpatient nurses averaged 54.6 hours. These figures exceeded by far the work time regulated by the Labor Standards Act, i.e. 8 hours per day, 44 hours per week.
58 From 1966 to 1968, the Ministry of Health and Welfare appropriated JPY55,370 thousand to improve hospital facilities including nap facilities and in 1969, then the Ministry increased the number of nurses by 261 to improve night shifts.
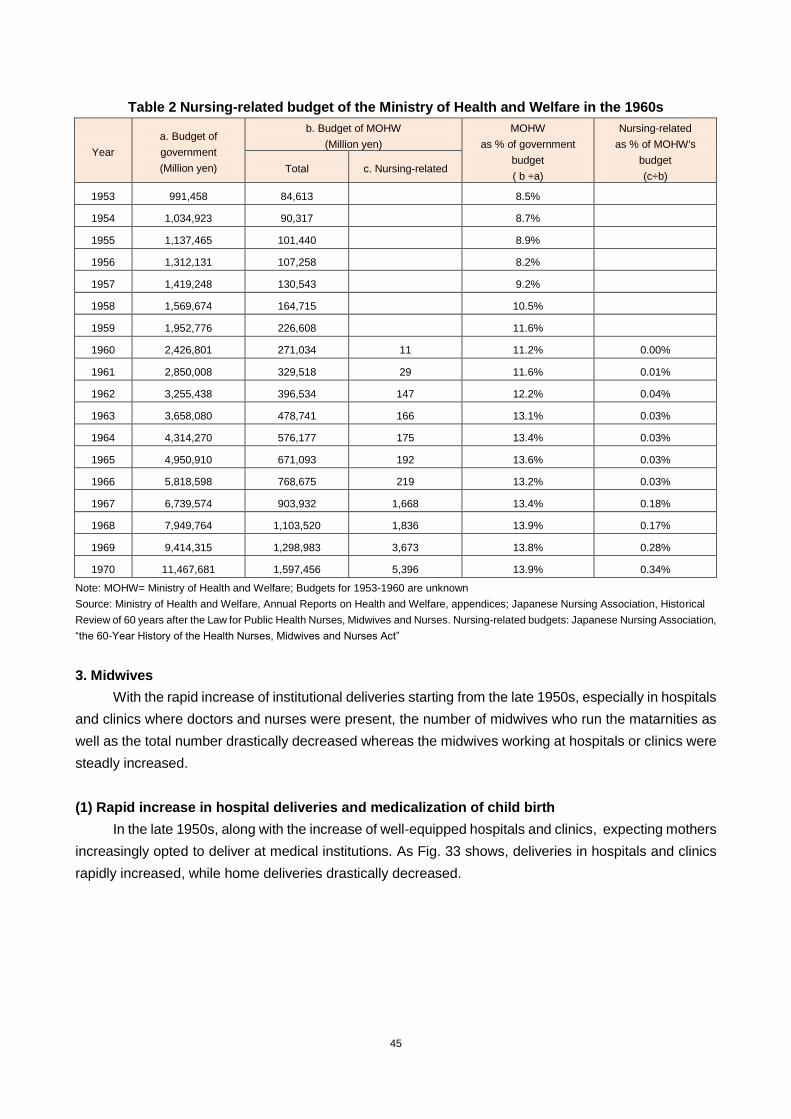
45
Table 2 Nursing-related budget of the Ministry of Health and Welfare in the 1960s
Year
a. Budget of
government
(Million yen)
b. Budget of MOHW
(Million yen)
MOHW
as % of government
budget
( b ÷a)
Nursing-related
as % of MOHW's
budget
(c÷b) Total c. Nursing-related
1953 991,458 84,613 8.5%
1954 1,034,923 90,317 8.7%
1955 1,137,465 101,440 8.9%
1956 1,312,131 107,258 8.2%
1957 1,419,248 130,543 9.2%
1958 1,569,674 164,715 10.5%
1959 1,952,776 226,608 11.6%
1960 2,426,801 271,034 11 11.2% 0.00%
1961 2,850,008 329,518 29 11.6% 0.01%
1962 3,255,438 396,534 147 12.2% 0.04%
1963 3,658,080 478,741 166 13.1% 0.03%
1964 4,314,270 576,177 175 13.4% 0.03%
1965 4,950,910 671,093 192 13.6% 0.03%
1966 5,818,598 768,675 219 13.2% 0.03%
1967 6,739,574 903,932 1,668 13.4% 0.18%
1968 7,949,764 1,103,520 1,836 13.9% 0.17%
1969 9,414,315 1,298,983 3,673 13.8% 0.28%
1970 11,467,681 1,597,456 5,396 13.9% 0.34%
Note: MOHW= Ministry of Health and Welfare; Budgets for 1953-1960 are unknown
Source: Ministry of Health and Welfare, Annual Reports on Health and Welfare, appendices; Japanese Nursing Association, Historical
Review of 60 years after the Law for Public Health Nurses, Midwives and Nurses. Nursing-related budgets: Japanese Nursing Association,
“the 60-Year History of the Health Nurses, Midwives and Nurses Act”
3. Midwives
With the rapid increase of institutional deliveries starting from the late 1950s, especially in hospitals
and clinics where doctors and nurses were present, the number of midwives who run the matarnities as
well as the total number drastically decreased whereas the midwives working at hospitals or clinics were
steadly increased.
(1) Rapid increase in hospital deliveries and medicalization of child birth
In the late 1950s, along with the increase of well-equipped hospitals and clinics, expecting mothers
increasingly opted to deliver at medical institutions. As Fig. 33 shows, deliveries in hospitals and clinics
rapidly increased, while home deliveries drastically decreased.
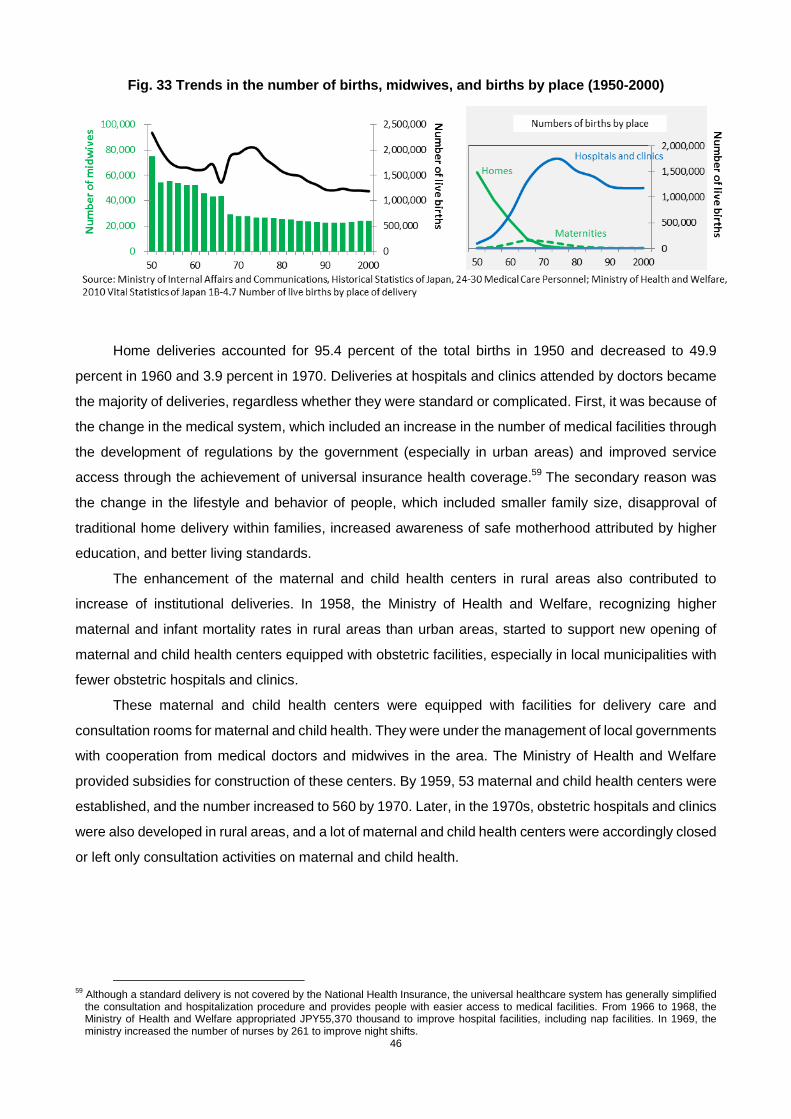
46
Fig. 33 Trends in the number of births, midwives, and births by place (1950-2000)
Home deliveries accounted for 95.4 percent of the total births in 1950 and decreased to 49.9
percent in 1960 and 3.9 percent in 1970. Deliveries at hospitals and clinics attended by doctors became
the majority of deliveries, regardless whether they were standard or complicated. First, it was because of
the change in the medical system, which included an increase in the number of medical facilities through
the development of regulations by the government (especially in urban areas) and improved service
access through the achievement of universal insurance health coverage.59
The secondary reason was
the change in the lifestyle and behavior of people, which included smaller family size, disapproval of
traditional home delivery within families, increased awareness of safe motherhood attributed by higher
education, and better living standards.
The enhancement of the maternal and child health centers in rural areas also contributed to
increase of institutional deliveries. In 1958, the Ministry of Health and Welfare, recognizing higher
maternal and infant mortality rates in rural areas than urban areas, started to support new opening of
maternal and child health centers equipped with obstetric facilities, especially in local municipalities with
fewer obstetric hospitals and clinics.
These maternal and child health centers were equipped with facilities for delivery care and
consultation rooms for maternal and child health. They were under the management of local governments
with cooperation from medical doctors and midwives in the area. The Ministry of Health and Welfare
provided subsidies for construction of these centers. By 1959, 53 maternal and child health centers were
established, and the number increased to 560 by 1970. Later, in the 1970s, obstetric hospitals and clinics
were also developed in rural areas, and a lot of maternal and child health centers were accordingly closed
or left only consultation activities on maternal and child health.
59
Although a standard delivery is not covered by the National Health Insurance, the universal healthcare system has generally simplified the consultation and hospitalization procedure and provides people with easier access to medical facilities. From 1966 to 1968, the Ministry of Health and Welfare appropriated JPY55,370 thousand to improve hospital facilities, including nap facilities. In 1969, the ministry increased the number of nurses by 261 to improve night shifts.

47
(2) Sharp decrease in the number of self-employed midwives and the gradual increase of
employed midwives
As stated above, the total number of midwives decreased because of the medicalization of
deliveries in the 1960s. The number of self-employed midwives decreased, while that of midwives
employed by hospitals and clinics increased, contributing thus to the change in their role. In the deliveries
at medical institutions, a variety of obstetric interventions including cesarean sections, forceps delivery,
perineal incision, and anesthesia delivery were carried out by doctors. As a result, the number of
midwives decreased from 52,337 in 1960 to 31,541 in 1970 as shown in Fig. 34. The number of midwife
schools also decreased from 61 before the war to 8 after the war. Although the number gradually
increased to 29 in 1965 and to 37 in 1969, the number of applicants decreased and the number of
students accounts for 69 to 89% of the full capacity of schools.
Fig. 34 Change in numbers of midwives by work place 1955-1986
In response to the decrease in demand for midwives, the Ministry of Health and Welfare
endeavored to secure their working opportunities by supporting their transfer to medical institutions,
assigning them activities related to maternal and child health education, and giving them employment
opportunities at maternal and child health centers. In 1966, the Ministry of Health and Welfare conducted
re-training and re-education seminars on midwifery nationwide with the aims to help midwives to change
their working style from the self-employed occupation to employed occupation. However, the average
age of self-employed midwives was above 50, and only a few of them wanted to become employee.
Furthermore, in 1968, the Ministry created a new post called the maternal and child health promoters at
municipalities who provided health consultations and guidance for expecting mothers and infants to
secure working opportunities for ex-midwives.
As a result, decrease of midwives was slow down: 11,766 decrease between 1966 and 1968, to
1,353 decrease between 1968 and 1970.
4. Public Health Nurses
In the 1960s, public health nurses covered a wide range of healthcare due to rapid urbanization and
rural depopulation. The roles of health centers were diversified responding to health needs of respective
localities.
48
(1) Customizing health centers’ function to specific local needs and closer collaboration with
local municipalities
High economic growth based on the expansion of manufacturing industry in the late 1950s
prompted the concentration of younger working populations in urban areas and the depopulation of rural
areas. Types of health-related problem also changed dramatically.
Pollution caused by population concentration and industrialization, hygiene of workers at small and
medium-sized companies, non-communicable diseases and mental health care, came up as new health
problems in urban areas. On the other hand, infectious diseases, maternal and child health, malnutrition,
injuries in farming, and elderly care were the major problems in rural areas, where the development of
medical facilities fell behind.
In 1960, the Ministry of Health and Welfare, in response to the change in local health needs, carried
out a comprehensive reform of the health center (800 at the time). The Ministry classified health centers
into five categories based on local profiles and the population size. The categories were: urban type; rural
type; mixed type; remote-region type; and small-scale type. The staff composition (a total of 13 to 53
people) and main activities were adjusted according to the profile of each community. 60
Urban-type
health centers vigorously promoted coordination with hospitals and clinics in the area, while rural-type
health centers stressed on outreach activities due to the shortage of medical institutions.
In the 1960s, in accordance with the instructions from the Ministry of Health and Welfare, health
centers under the prefectural administration started to develop local health work programs in conjunction
with local municipalities whose administrative capacities had been enhanced through merger with
neighboring municipalities. These local health work programs combined the roles of the health centers,
which managed broad health issues including environmental hygiene, and the local municipalities, which
managed national health insurance operations and were familiar with the medical needs of their
communities. They jointly conducted analyses of local health issues, made diagnoses, and formulated
local health and medical programs based on the acquired data. The cooperation between health centers
and local municipalities led to the creation and implementation of more efficient and accurate local health
work.
(2) Diversification of the work of public health nurses and increased cooperation between the
public health nurses at health centers and the public health nurses employed by
Community-based health insurance societies.
With progress in the cooperation system between the public health nurses at health centers under
the prefectural administration and the public health nurses of local municipalities/national health
insurance organizations and the expansion of their activities, the number of public health nurses
continued to increase in a gradual manner.
In addition, in the 1960s, the main issue of the local health changed from anti-tuberculosis
measures to the increase in maternal and child health and non-communicable diseases. The
home-visiting activities of public health nurses also began to focus on care for mentally-disabled people
and bedfast elderly people, in addition to home visits to expecting mothers.
In order to respond to the changing environment surrounding elderly people, the Act for the Welfare
of the Aged was enacted in 1963, which introduced the health checkup system for elderly people and the
home visits by public health nurses to those elderly people who did not receive the checkup. In 1965, the
60
The Ministry of Health and Welfare, Annual Report on Health and Welfare JFY 1966.

49
Ministry of Health and Welfare, in view of the high mortality of expecting mothers in comparison with other
countries, promulgated the “Maternal and Child Health Law” to address the issue of regional disparities in
infant mortality and nutritional status and to take into consideration the care of women at puberty and
menopause. Public health nurses and midwives visited expecting mothers and infants to check their
health conditions. In the same year, the Mental Health Law was reformed to place health centers at the
forefront of mental health operations, and thus public health nurses were empowered to offer
consultations and visit people at home for mental health.
The capacity of public health nurses to respond to the expansion and diversification of their work
became a big issue. The National Institute of Public Health, in the meantime, opened a monthly training
program on local management and epidemiological statistics targeted at the chief public health nurses of
the health centers.
The centers of activities for public health nurses were mainly divided into two places, the health
centers under the prefectural administration and the Community-based health insurance facilities under
the administration of local municipalities. The rest of public health nurses worked at companies and
schools. (See Fig. 35).
At the time, the public health nurses hired by the Community-based health insurance organizations
were responsible for a population of 3,500 people and the working environment was poor when compared
with those of health centers. They had to work on healthcare in areas without a doctor or without
management support for their work in the community. In this context, the Ministry of Health and Welfare
tried to support them by actively enabling the public health nurses at health centers to cooperate through
“district diagnosis” and the establishment of “joint local health programs.”
Fig. 35 Change in numbers of public health nurses by workplace 1960-1980
50
Chapter 3 From 1970 to 1980 Period of Stable Growth (GDP $10,000 to $13,000 era)
The 1970s were a time when the levels of health and medical services continued to improve and
the average life expectancy reached the world‟s highest levels. Both the infant mortality and perinatal
mortality steadily decreased and reached the world‟s lowest levels. On the other hand, with the increase
in the number of elderly people, diseases related to malignant neoplasm and cardiovascular diseases
increased. In addition, the birth rate came down below the levels of population replacement with the
acceleration of an aging society.
In 1973, medical expenses for the elderly above 70 years old ( above 65 in bedridden cases)
became free, while an increase in the family benefit rates of health insurance and the provision of
high-cost medical care were introduced. Subsidies from the national treasury were provided for the
building and development of nursing homes and facilities for the elderly and physically handicapped
people. Thus, social security improved as a whole.
Against this backdrop, the number of beds dramatically increased on one hand, but the regional
imbalance in the number of medical facilities continued on the other hand. With implementation of the
free medical care program for the elderly, patients‟ out of pockets expense decreased, but the central
government‟s health expenditure increased at a macro level. While the total amount of national medical
expenditures in 1970 was 2,496.2 billion yen (of which 1,324.1yen (53 %) funded by the health insurance,
690.1 billion yen (27.6%) by the public treasury (national and municipal), and 482 billion yen (19.3%) by
the out of pockets), that amount in 1980 was 11,980.5 billion yen (of which, 6,372.2 billion yen (53.2 %)
funded by the health insurance, 4,254.5 billion yen (35.5 %) by the public treasury, and 1,353.8 billion yen
(11.3%) by out of pockets). The amount increased by 4.8 times and the ration to GDP also increased from
3.32 % to 4.82 %, an increase of 1.5 percent.
As for human resources for health, the shortage and geographical mal-distribution of medical
doctors was acutely recognized as a policy challenge. New policy measures were implemented to
increase the number of medical doctors mainly by establishing new medical universities/faculties and to
improve medical care in remote rural areas. New comprehensive demand-supply plans for nurses were
designed and new actions were taken to improve nursing education.
1 Medical Doctors
(1) Shortage and geographical mal-distribution of medical doctors
Even after 1970, the Ministry of Health and Welfare and the Ministry of Education, Science and
Culture were consistently aware of the shortage of medical doctors. In this period, not only shortages in
absolute number but also the geographical mal-distribution of medical doctors was highlighted as a major
issue.61
Due to the progress of industrialization, the labor force in rural areas was absorbed into industrial
sector in urban areas. Also in medical care access, the concentration of doctors in urban areas, especially
in major cities was remarkable. The number of medical doctors per 100,000 persons in 1970 was 154.2 in
the seven major cities and 128.5 in other urban areas, while it was 63.5 in small municipalities. Under
such circumstances, prefectures striving for proper medical care in remote rural areas, particularly ones
with no medical universities were acutely aware of the need to establish such medical
universities/faculties in their own prefectures.
61
The Ministry of Health and Welfare, Annual Reports on Welfare JFY 1970 to JFY1980.

51
(2) Increase of medical education capacity by establishing new medical universities
To optimize the demand-supply balance of medical doctors, the Ministry of Health and Welfare and
the Ministry of Education, Science and Culture decided to increase the number of medical doctors. In
1970, the Ministry of Health and Welfare set a policy goal of increasing the medical department capacity
to 6,000 to secure 150 medical doctors per 1000,000 people by 1985. 62
This policy action is noteworthy in two points. First, when studying the criteria for the number of
medical doctors, the Ministry of Health and Welfare gave priority to the number of patients handled by one
doctor as an index of the labor load of medical doctors. The Ministry of Health and Welfare was thinking of
restoring the doctor-patient ratio to the one before 1961, when the universal coverage of national health
insurance was achieved and the demand for medical care started to grow. The target figure of "about
150" was calculated from the number of patients handled by a medical doctor in 1960 (about 36 in
average)..63
Second, for the first time the Japanese government articulated a specific level and a
deadline for the goal for medical doctors‟ increase, while retaining the conventional idea of making
reference of advanced countries statistics.
The policy approach to increase the number of medical doctors was changed in 1970. Until 1970,
the government focused on the increase of quota of students of medical doctors in existing medical
universities (faculties), but did not allow establishment of new medical universities (faculties). However, in
1970, the government started to establish new universities (faculties) in under-served prefectures in
response to political pressures for solving geographical mal-distribution of medical doctors and
stimulating local economy by constructing universities as public works.
The responsibilities and authorities of the ministries to plan the number of medical doctors stayed
the same with the one in the 1960's. The Ministry of Health and Welfare examined the demand-supply of
medical doctors, while the Ministry of Education, Science and Culture examined and planned the quotas.
However, prefectures and political parties began to view rearing medical doctors as a political subject in
this period
In 1970, Akita University, with no medical education faculty, highlighting the regional inequality in
medical care, appealed to the government, and was permitted to establish a medical faculty (Akita
University Medical School). This became possible because the doctor-patient ratio of Akita prefecture
was very low, the grass roots movement demanding establishment of a medical faculty among schools
and citizens was active, and the governor at the time had close contact with members of the Diet.. Then
the prefectures suffering from a severe shortage of medical doctors began to demand for the
establishment of medical universities (faculties) as a major policy issue. In response to such demands,
the Ministry of Health and Welfare announced the aforementioned policy in 1970 that medical faculty
capacity would be increased to about 6,000 to secure about 150 doctors per 100,000 people by 1985. In
1971, the Ministry of Education, Science and Culture set up a committee for new medical university
establishment. In the same year, the committee recommended opening of medical universities (faculties)
where there were none (not all prefectures) and increasing the number of medical doctors per 100,000
people to 150, and also to increase the quotas from 1,200 to 1,300 in the decade from fiscal 1971. Based
on this recommendation, the Ministry of Education, Science and Culture approved the establishment of
62
The Ministry of Health and Welfare, Ishi no jyukyutaisaku nitsuite (Demand and supply measures on medical doctors),July 25, 1970
63 The background is not clear, but this may be the result of specific study and discussion about the setting of targets because a proposal (to increase the number to 160 per 100,000 people) from the conservative party (education subcommittee of the Liberal Democratic Party) was denied.
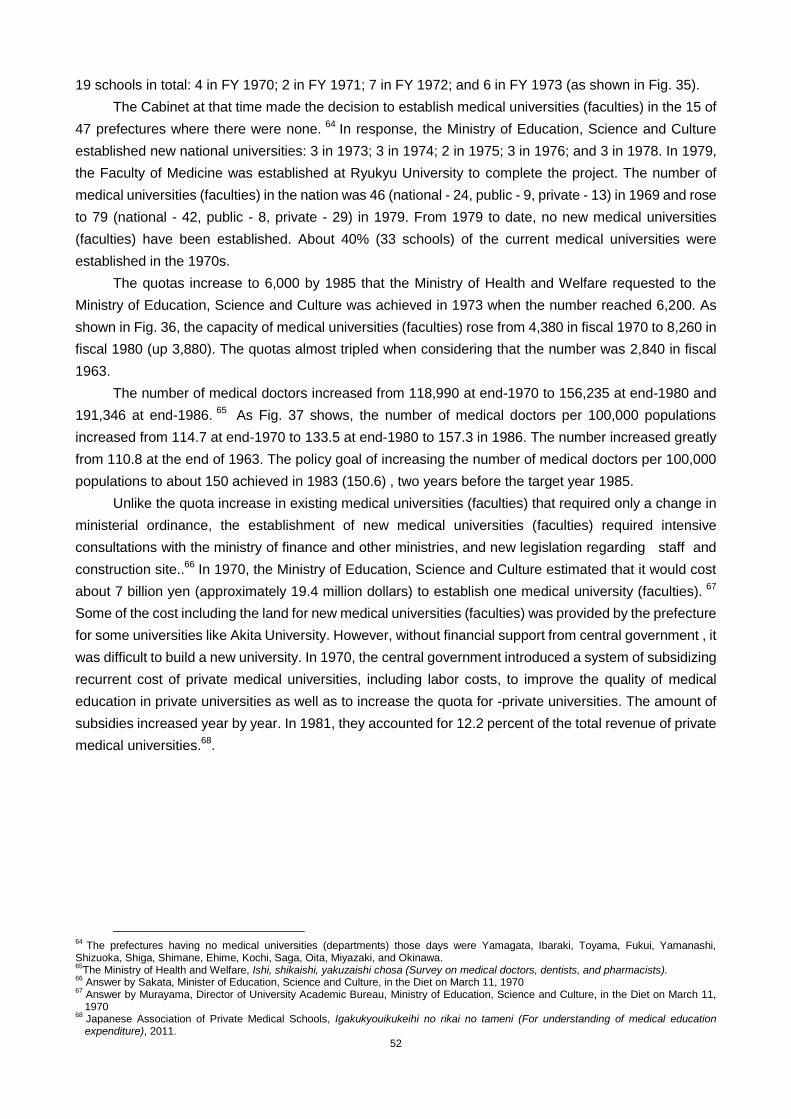
52
19 schools in total: 4 in FY 1970; 2 in FY 1971; 7 in FY 1972; and 6 in FY 1973 (as shown in Fig. 35).
The Cabinet at that time made the decision to establish medical universities (faculties) in the 15 of
47 prefectures where there were none. 64
In response, the Ministry of Education, Science and Culture
established new national universities: 3 in 1973; 3 in 1974; 2 in 1975; 3 in 1976; and 3 in 1978. In 1979,
the Faculty of Medicine was established at Ryukyu University to complete the project. The number of
medical universities (faculties) in the nation was 46 (national - 24, public - 9, private - 13) in 1969 and rose
to 79 (national - 42, public - 8, private - 29) in 1979. From 1979 to date, no new medical universities
(faculties) have been established. About 40% (33 schools) of the current medical universities were
established in the 1970s.
The quotas increase to 6,000 by 1985 that the Ministry of Health and Welfare requested to the
Ministry of Education, Science and Culture was achieved in 1973 when the number reached 6,200. As
shown in Fig. 36, the capacity of medical universities (faculties) rose from 4,380 in fiscal 1970 to 8,260 in
fiscal 1980 (up 3,880). The quotas almost tripled when considering that the number was 2,840 in fiscal
1963.
The number of medical doctors increased from 118,990 at end-1970 to 156,235 at end-1980 and
191,346 at end-1986. 65
As Fig. 37 shows, the number of medical doctors per 100,000 populations
increased from 114.7 at end-1970 to 133.5 at end-1980 to 157.3 in 1986. The number increased greatly
from 110.8 at the end of 1963. The policy goal of increasing the number of medical doctors per 100,000
populations to about 150 achieved in 1983 (150.6) , two years before the target year 1985.
Unlike the quota increase in existing medical universities (faculties) that required only a change in
ministerial ordinance, the establishment of new medical universities (faculties) required intensive
consultations with the ministry of finance and other ministries, and new legislation regarding staff and
construction site..66
In 1970, the Ministry of Education, Science and Culture estimated that it would cost
about 7 billion yen (approximately 19.4 million dollars) to establish one medical university (faculties). 67
Some of the cost including the land for new medical universities (faculties) was provided by the prefecture
for some universities like Akita University. However, without financial support from central government , it
was difficult to build a new university. In 1970, the central government introduced a system of subsidizing
recurrent cost of private medical universities, including labor costs, to improve the quality of medical
education in private universities as well as to increase the quota for -private universities. The amount of
subsidies increased year by year. In 1981, they accounted for 12.2 percent of the total revenue of private
medical universities.68
.
64
The prefectures having no medical universities (departments) those days were Yamagata, Ibaraki, Toyama, Fukui, Yamanashi, Shizuoka, Shiga, Shimane, Ehime, Kochi, Saga, Oita, Miyazaki, and Okinawa. 65
The Ministry of Health and Welfare, Ishi, shikaishi, yakuzaishi chosa (Survey on medical doctors, dentists, and pharmacists). 66
Answer by Sakata, Minister of Education, Science and Culture, in the Diet on March 11, 1970 67
Answer by Murayama, Director of University Academic Bureau, Ministry of Education, Science and Culture, in the Diet on March 11, 1970
68 Japanese Association of Private Medical Schools, Igakukyouikukeihi no rikai no tameni (For understanding of medical education expenditure), 2011.
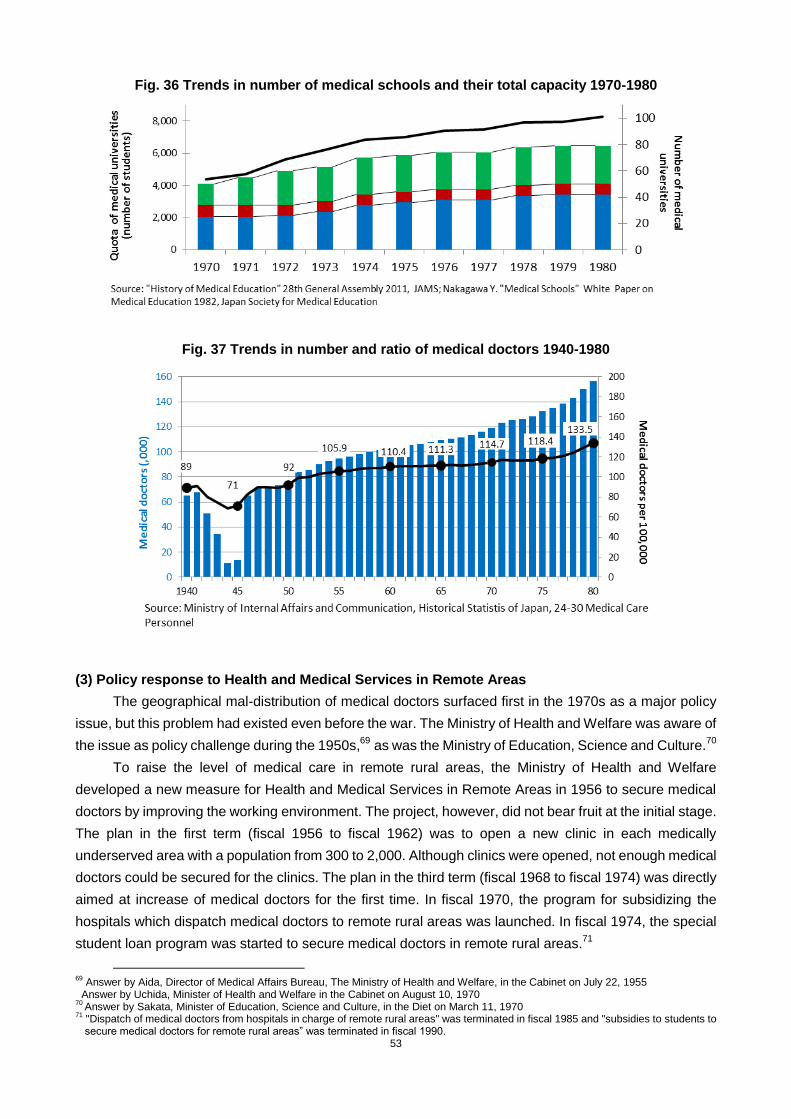
53
Fig. 36 Trends in number of medical schools and their total capacity 1970-1980
Fig. 37 Trends in number and ratio of medical doctors 1940-1980
(3) Policy response to Health and Medical Services in Remote Areas
The geographical mal-distribution of medical doctors surfaced first in the 1970s as a major policy
issue, but this problem had existed even before the war. The Ministry of Health and Welfare was aware of
the issue as policy challenge during the 1950s,69
as was the Ministry of Education, Science and Culture.70
To raise the level of medical care in remote rural areas, the Ministry of Health and Welfare
developed a new measure for Health and Medical Services in Remote Areas in 1956 to secure medical
doctors by improving the working environment. The project, however, did not bear fruit at the initial stage.
The plan in the first term (fiscal 1956 to fiscal 1962) was to open a new clinic in each medically
underserved area with a population from 300 to 2,000. Although clinics were opened, not enough medical
doctors could be secured for the clinics. The plan in the third term (fiscal 1968 to fiscal 1974) was directly
aimed at increase of medical doctors for the first time. In fiscal 1970, the program for subsidizing the
hospitals which dispatch medical doctors to remote rural areas was launched. In fiscal 1974, the special
student loan program was started to secure medical doctors in remote rural areas.71
69
Answer by Aida, Director of Medical Affairs Bureau, The Ministry of Health and Welfare, in the Cabinet on July 22, 1955 Answer by Uchida, Minister of Health and Welfare in the Cabinet on August 10, 1970
70 Answer by Sakata, Minister of Education, Science and Culture, in the Diet on March 11, 1970
71 "Dispatch of medical doctors from hospitals in charge of remote rural areas" was terminated in fiscal 1985 and "subsidies to students to secure medical doctors for remote rural areas” was terminated in fiscal 1990.
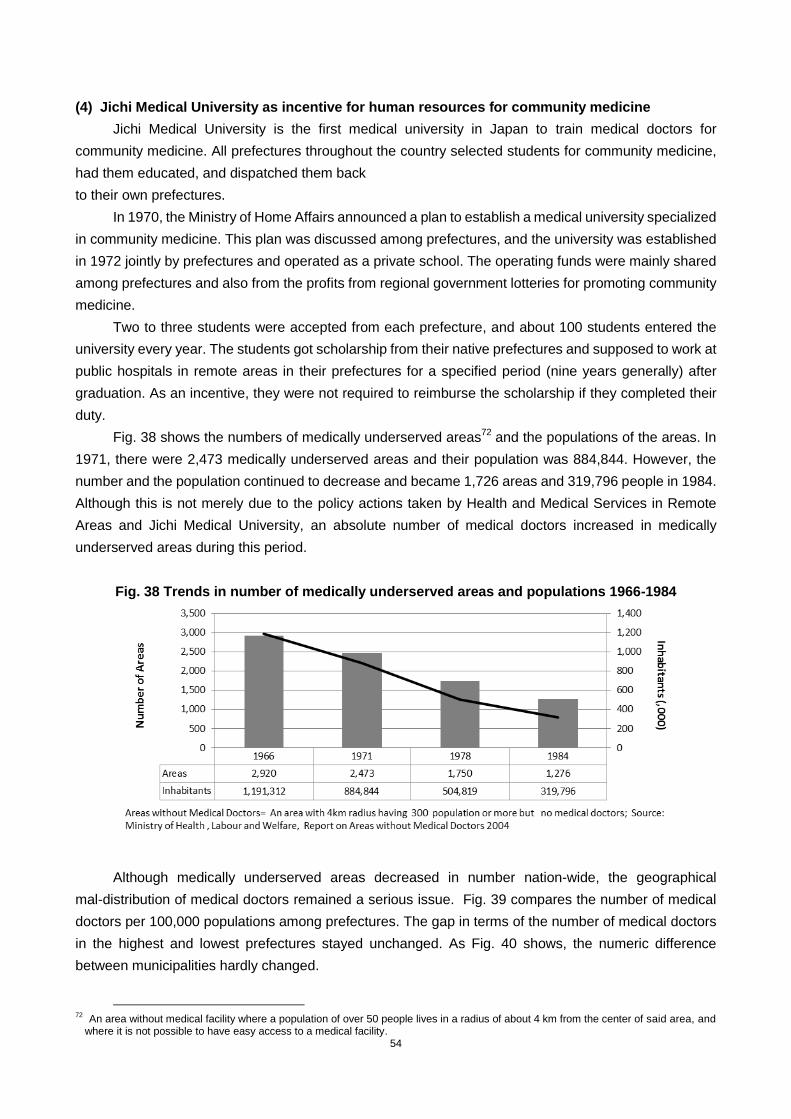
54
(4) Jichi Medical University as incentive for human resources for community medicine
Jichi Medical University is the first medical university in Japan to train medical doctors for
community medicine. All prefectures throughout the country selected students for community medicine,
had them educated, and dispatched them back
to their own prefectures.
In 1970, the Ministry of Home Affairs announced a plan to establish a medical university specialized
in community medicine. This plan was discussed among prefectures, and the university was established
in 1972 jointly by prefectures and operated as a private school. The operating funds were mainly shared
among prefectures and also from the profits from regional government lotteries for promoting community
medicine.
Two to three students were accepted from each prefecture, and about 100 students entered the
university every year. The students got scholarship from their native prefectures and supposed to work at
public hospitals in remote areas in their prefectures for a specified period (nine years generally) after
graduation. As an incentive, they were not required to reimburse the scholarship if they completed their
duty.
Fig. 38 shows the numbers of medically underserved areas72
and the populations of the areas. In
1971, there were 2,473 medically underserved areas and their population was 884,844. However, the
number and the population continued to decrease and became 1,726 areas and 319,796 people in 1984.
Although this is not merely due to the policy actions taken by Health and Medical Services in Remote
Areas and Jichi Medical University, an absolute number of medical doctors increased in medically
underserved areas during this period.
Fig. 38 Trends in number of medically underserved areas and populations 1966-1984
Although medically underserved areas decreased in number nation-wide, the geographical
mal-distribution of medical doctors remained a serious issue. Fig. 39 compares the number of medical
doctors per 100,000 populations among prefectures. The gap in terms of the number of medical doctors
in the highest and lowest prefectures stayed unchanged. As Fig. 40 shows, the numeric difference
between municipalities hardly changed.
72 An area without medical facility where a population of over 50 people lives in a radius of about 4 km from the center of said area, and
where it is not possible to have easy access to a medical facility.

55
Fig. 39 Trends in numbers of medical doctors per 100,000 by prefecture 1935-1978
Fig. 40 Trends in numbers of medical doctors in major cities and villages 1958-1978
According to a later survey, the ratio of trained community medicine students settling in remote
rural areas of their prefectures was obviously higher than that of ordinary medical doctors. During the
period from 1978 until 2006, 97% of the graduates fulfilled their tour of duty. The ratio of graduates settling
in remote rural areas was 16 times greater than ordinary medical doctors and 4 times greater after their
tours of duty. 7374 After the tour of duty, the graduates could have worked anywhere, but 46% to 93%
stayed in their prefectures.75
The university only had a capacity of 100. , The number of graduates from
the Jichi Medical University accounts for only 1.25 % of the total medical school graduates, which was
8,000 in 1980. Though its quantitative impact was limited, it is sure that a certain number of medical
doctors could be secured to work in remote rural areas every year by the incentive mechanism for doctors
of the Jichi Medical University
73
M.Matsumoto, E.Kajii, Medical Education Program with Obligatory Rural Service: Analysis of Factors Associated with Compliance. Helath policy. 90 (2-3), 2009, P125-132.
74 Matsumoto, E.Inoue, E.Kajii, Contract-based Training System for Rural Physicians: Follow-up of the Home Prefecture recruting Scheme of Jichi Medical University. Journal of Rural Health. 24(4), 2008, P360-368.
75 M.Matsumoto, K.Inoue, E. Kajii, Long-term effect of the home prefecture recruiting scheme of Jichi Medical University, Japan. Rural and Remote Health. 8(3), 2008, P930.

56
(5) Expansion of medical education focus into community health and primary care
When the internship system was abolished, the Ministry of Education, Science and Culture set up
“Standards for Establishment of Medical Faculties,” to change the existing medical education curricula
to be more practical one to produce fresh graduates who can serve for the clinical practice immediately
after the graduation. Responding to the ministry‟s request, , not only the Jichi Medical University that
specialized in community medicine , but also other medical universities made efforts to create an
outcome-based curriculum
In a similar manner as the Jichi Medical School, the Medical Faculty of Tsukuba University
introduced an education curriculum, which was not only restricted to an internal teaching and training, but
also included training at other hospitals and clinics. It was intended to produce doctors capable of
implementing primary care in response to community -specific needs. Medical education bearing in mind
community medicine, which was guided by the central government became increasingly common starting
from the 1970s.
2. Nurses
(1) Prolonged shortage of nurses and attempts to upgrade the quality of nursing education
In the midst of an increase in the proportion of the elderly in the 1970s, free healthcare for the
elderly was introduced in 1973 and medical needs exploded accordingly.7677
The demand for nurses
increased further as the number of beds continued to rise. The expansion of nurse development
programs started based on a medium-long term prediction of supply and demand, and the budget to
address the shortage of nurses increased. Meanwhile, the demand for higher nursing education
increased in order to keep up with the sophistication of medical technology. Applicants also wanted
nursing education at universities or junior colleges level, and many nursing schools started to upgrade
themselves to universities or junior colleges.
(2) Formulation of medium-long-term development program of nurses and increases in the
nursing-related budget
In 1974, the Ministry of Health and Welfare formulated a nurse demand-supply plan (1974 to 1978),
the first plan in the nursing field, to solve the issue of the shortage of nurses systematically. The Ministry
of Health and Welfare‟s comprehensive plan included not only strengthening educational facilities, but
also reducing the number of nurses leaving the workforce and increasing their re-entry by improving
working conditions and promoting employment, in order to achieve the number of nurses per bed
equivalent to the level of UK or Sweden 78
by 1978.
To implement the plan, the Ministry of Health and Welfare increased the nursing-related budget
from 5.3 billion yen in 1970 to 47.7 billion yen in 1980 as shown in Table 3. The ratio of the nursing-related
budget in the total budget of the Ministry of Health and Welfare increased from 0.34% in 1970 to 0.53 % in
1980. The approved budget was mainly spent to operate nursing schools established at national hospitals
and clinics, to hold lectures for training teachers, to make scholarship loans to nursing students, to
support the re-entry of nurses that had left the workforce, to improve day care facilities for their children at
76 The aging ratio was 4.9% in 1950, 5.7% in 1960, and 7.1% in 1970. The total number of medical sessions (million) increased about 4.36
times in 20 years: 150.5 in 195, 403.3 in 1965, 656.5 in 1975. 77
The total number of hospital beds and nurses were 626,716 and 105,965 in 1955, 1,077,695 and 133,985 in 1965, and 1,428,183 and 175,841 in 1975, respectively. The number of hospital beds increased by 2.28 times and that of nurses by 1.66 times in 20 years.
78 Those days, the number of nurses per bed was 0.336 in UK, 0.321 in Sweden, and 0.297 at public institutions in Japan.
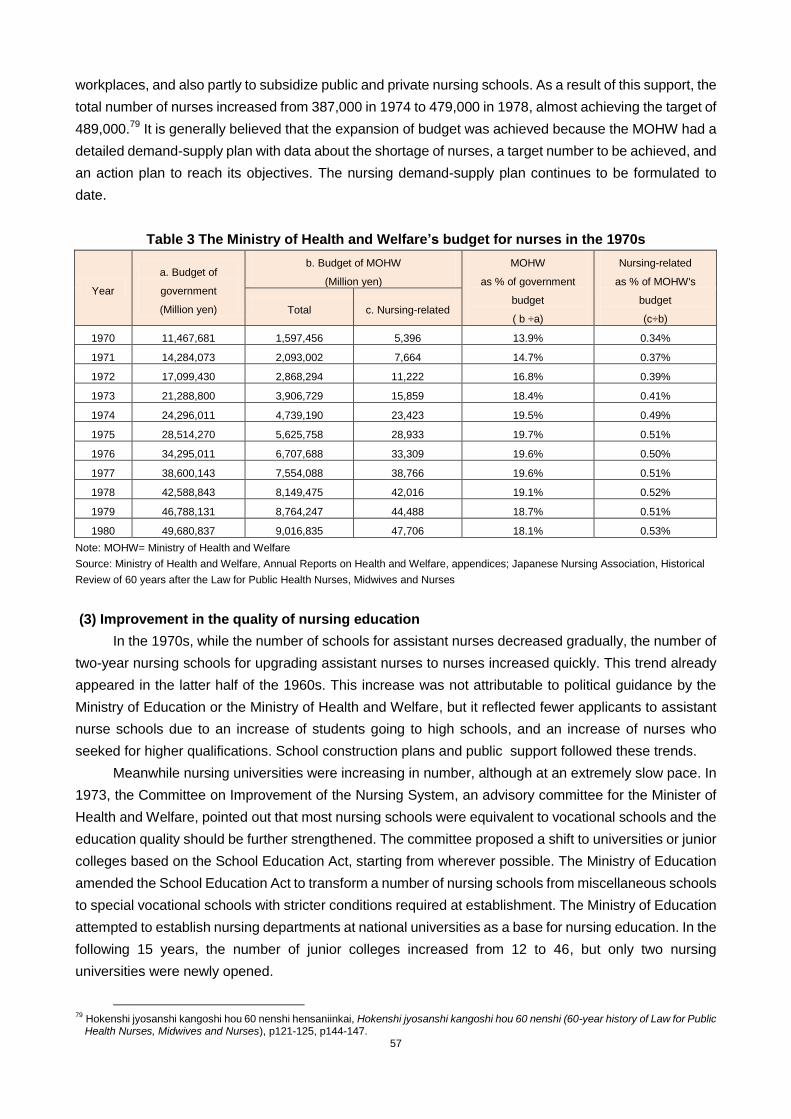
57
workplaces, and also partly to subsidize public and private nursing schools. As a result of this support, the
total number of nurses increased from 387,000 in 1974 to 479,000 in 1978, almost achieving the target of
489,000.79
It is generally believed that the expansion of budget was achieved because the MOHW had a
detailed demand-supply plan with data about the shortage of nurses, a target number to be achieved, and
an action plan to reach its objectives. The nursing demand-supply plan continues to be formulated to
date.
Table 3 The Ministry of Health and Welfare’s budget for nurses in the 1970s
Year
a. Budget of
government
(Million yen)
b. Budget of MOHW
(Million yen)
MOHW
as % of government
budget
( b ÷a)
Nursing-related
as % of MOHW's
budget
(c÷b) Total c. Nursing-related
1970 11,467,681 1,597,456 5,396 13.9% 0.34%
1971 14,284,073 2,093,002 7,664 14.7% 0.37%
1972 17,099,430 2,868,294 11,222 16.8% 0.39%
1973 21,288,800 3,906,729 15,859 18.4% 0.41%
1974 24,296,011 4,739,190 23,423 19.5% 0.49%
1975 28,514,270 5,625,758 28,933 19.7% 0.51%
1976 34,295,011 6,707,688 33,309 19.6% 0.50%
1977 38,600,143 7,554,088 38,766 19.6% 0.51%
1978 42,588,843 8,149,475 42,016 19.1% 0.52%
1979 46,788,131 8,764,247 44,488 18.7% 0.51%
1980 49,680,837 9,016,835 47,706 18.1% 0.53%
Note: MOHW= Ministry of Health and Welfare
Source: Ministry of Health and Welfare, Annual Reports on Health and Welfare, appendices; Japanese Nursing Association, Historical
Review of 60 years after the Law for Public Health Nurses, Midwives and Nurses
(3) Improvement in the quality of nursing education
In the 1970s, while the number of schools for assistant nurses decreased gradually, the number of
two-year nursing schools for upgrading assistant nurses to nurses increased quickly. This trend already
appeared in the latter half of the 1960s. This increase was not attributable to political guidance by the
Ministry of Education or the Ministry of Health and Welfare, but it reflected fewer applicants to assistant
nurse schools due to an increase of students going to high schools, and an increase of nurses who
seeked for higher qualifications. School construction plans and public support followed these trends.
Meanwhile nursing universities were increasing in number, although at an extremely slow pace. In
1973, the Committee on Improvement of the Nursing System, an advisory committee for the Minister of
Health and Welfare, pointed out that most nursing schools were equivalent to vocational schools and the
education quality should be further strengthened. The committee proposed a shift to universities or junior
colleges based on the School Education Act, starting from wherever possible. The Ministry of Education
amended the School Education Act to transform a number of nursing schools from miscellaneous schools
to special vocational schools with stricter conditions required at establishment. The Ministry of Education
attempted to establish nursing departments at national universities as a base for nursing education. In the
following 15 years, the number of junior colleges increased from 12 to 46, but only two nursing
universities were newly opened.
79
Hokenshi jyosanshi kangoshi hou 60 nenshi hensaniinkai, Hokenshi jyosanshi kangoshi hou 60 nenshi (60-year history of Law for Public Health Nurses, Midwives and Nurses), p121-125, p144-147.
58
The biggest obstacle to nursing education at universities was the difficulty of securing good
teachers. For nursing education at the university level, faculties with appropriate degrees were required.
Those days, however, it was too difficult to adequately secure those human resources. For this reason,
the upgrading of university-level nursing education started only after the 1990s.
3. Midwives and Public Health Nurses
(1) Development of the “national health promotion program” and the changing role of health
centers and local municipalities
In the 1970s, while a certain level of medical welfare was achieved, a focus was placed on disease
prevention and health promotion in order to save national medical costs, and the role of health centers
and the health-related activities of local municipalities were revised.
Against the backdrop of economic growth from the 1960s, policies aimed to strengthen social
welfare were actively implemented at the beginning of the 1970s. With the increase in the benefit rate of
national medical insurance scheme, medical expenses for the elderly became free in 1973. The
expansion of these medical welfare policies contributed to a rapid increase in medical expenses coupled
with the advancement of the sophisticated medical technology. The total medical benefit was 2,100
billion yen in 1970 and it increased to 10,700 billion yen in 1980, a fivefold increase. 80
On the other hand, after the oil crisis of 1973, the economy stagnated and the expanded medical
benefit became a big fiscal burden for the central government. Under this circumstances, the Ministry of
Health and Welfare placed greater importance on disease prevention and health promotion in order to
lower medical expenses.
In 1968, the Ministry formulated a new framework of the „key health centers‟ and started the
discussion on consolidating and improving the work of prefectural health centers. Based on the
discussions, in the early 1970s, the Ministry transferred a variety of person-to- person services, such as
maternal and child health checkups, home visits consultation, vaccinations, managed by prefectural
health centers, to local municipalities, and it limited the role of prefectural health centers only to
administrative guidance for local municipalities, inspection management on environmental and food
hygiene, as well as sub-regional administrative work of prefectures.
In 1978, the Ministry started the “National Health Promotion Campaign” consisting of (a) lifelong health
management, (b) development of infrastructure for health promotion and (c) health educational activities,
and it promoted regular health checkups for all people, early diagnosis and early treatment. In this
context, further discussions were made on appropriate division of roles between prefectural health
centers and municipality health departments. In the same year,
the Ministry officially decided to create municipal health centers which take the lead in local health
promotion and preventive care services.
As Fig. 41 shows, there were 88 municipal health centers in 1978, 303 centers in 1980, and 1,106
centers in 1990, covering municipalities all over the country.
80
National Institute of Population and Social Security Research, Shakaihosoukyufuhi JFY 2005 (Social Security Benefit Payments JFY 2005).

59
Fig. 41 Change in the number of health centers and municipal health centers
(2) Further diversification of the work of public health nurses and the expansion of their activities
in municipalities
With the continuing diversification of the work of public health nurses from the 1960s and the
establishment of municipal health centers, the activities of public health nurses in municipalities increased
in the 1970s.
In 1970s, the activities of public health nurses were not only targeted at mothers and infants, the
elderly and physically handicapped people, but also covered a variety of fields including resident care
against pollution and drug-induced diseases, occupational health, and health management activities in
factories/companies to promote prevention measures against non-communicable diseases. The
expanded activities of public health nurses played an important part in the “national health promoting
program.” On the other hand, due to the separate command of prefectural health centers and municipal
centers, problems occurred such as duplication of activities and lack of coordination. With the opening of
the municipal health centers in 1978, the respective activities and roles played by public health nurses
belonging to prefectural health centers, those hired by local health insurance organization, and those
directly employed by the municipalities, were clearly defined and demarcated to avoid duplication and to
promote the coordination of their works.
Fig. 42 Change in the number of public health nurses by workplace
(3) Change in the role of midwives
In the 1970s, the establishment of facilities aimed at the midwife education increased gradually,
while there were no new remarkable policy actions taken. While the number of self-employed midwives
decreased, those employed by medical institutions increased. The overall number, however, gradually

60
decreased.
Over the 1970s, the number of deliveries at maternal health centers decreased, and almost all
deliveries were handled by medical institutions in the 1980s. This change was brought about by the
people‟s preference for hospital delivery, in addition to the fact that it was functionally difficult to
coordinate midwives working at the maternal health centers and commissioned medical doctors who
provide medical back up in complicated cases of delivery. Many doctors refused to be commissioned
because they did not want take the risk of delivery out of their medical facilities. Under those
circumstances, the midwifery facilities at maternal and child health centers were oblige to be abolished .81
Coupled with the closure of midwifery facilities and the overall aging of midwives, the number of
self-employed midwives dwindled sharply in the decade.
Fig. 43 Change in the number of midwives and of births
Although the total number of midwives continued to decrease gradually from 28,807 in 1970 to
25,867 in 1980 and 22,918 in 1990,the number of midwives working in medical institutions increased from
12,814 to 16,696 during the 1970s. 82
The number of entries in midwifery education institutions also
increased. There were 369 entries where there was capacity for 490 in 1960, the number rose to 1,545
where there was capacity for 965 in 1970, and 4,151 for 1,545 places in 1978. The improvement of
working conditions including salary could have contributed for the increase of the number of midwives
working at hospitals and clinics.
81
E. Suzuki, Byouinshussan ni tomonau syussankaijyosya no henkou to sono youin – iryouseidono no saihen ga okonawareta 1945 nen kara byouinsyussan ga seiritsushita 1974 ne wo chushin ni – (Change of midwives in delivery at hospital and its factors – mainly from 1945 when the healthcare system was reorganized to 1974 when delivery at hospital became popular), Kawasaki Journal of Meical Welfare,Vol.15. No.2, 2006.
82 idem

61
■Part III HRH policy actions in Japan and lessons for developing countries
This section sums up the features of each period described in the previous chapter and draws
lessons from Japan‟s HRH experiences for developing countries.
1. Summary of periods
(1) 1868 to 1945: From the Meiji Restoration to the end of World War II (Per capita GDP
$500-$3,000-$1,300era)
The first crucial health challenge for the Meiji government was to control infectious diseases that
were introduced from overseas, such as cholera. The Health Bureau in the Ministry of Home Affairs was
established as a national center for the infectious disease control system, which included local police
office in 1875.
The second challenge was the development of HRH based on Western medicine. The Government
made an effort to regulate the qualification standards of HRH and to develop educational institutions for
HRH. As for medical doctors, the increase in the number of medical faculties was implemented only in a
stepwise manner and relied solely on graduates of the University of Tokyo. Regulations on qualifications
standards for midwives and nurses were enforced nationwide by 1915. As a result, the number of modern
HRH reached 368.4 per 100,000 persons (90.8 for medical doctors, 85.3 for midwives and 192.3 for
nurses) in 1940.
The third challenge was the training and securing of healthy youth who could serve as soldiers
preparing for war. In this context, a tuberculosis control program and maternal and child health became
critical policy agenda items, as well as the training of public health nurses, midwives and nurses. The
Ministry of Education also launched a rapid expansion of medical colleges for doctors to be trained in the
short-term. Meanwhile, the coverage of the health insurance scheme, introduced in 1922, expanded to
70% of the population by the early 1940s.
(2) 1945 to 1960: Post-war reconstruction to high economic growth (Per capita GDP $1,300-$4,000
era)
The most important health needs at the time were the control of tuberculosis and the improvement
of maternal and child health in response to the baby boom. In order to increase efficiency in dealing with
these challenges, community health activities conducted by medical doctors, midwives and nurses based
in public health centers expanded rapidly, partly influenced by the GHQ's advice. The job description of a
public health nurse was wide-ranging, and it required additional skill and knowledge compared to that of a
nurse. This prompted an upgrading of the training program. Public health education and training for
medical doctors were also strengthened, while the upgrading and expansion of public health centers
advanced. As a result, despite poor economic conditions in Japan, maternal and infant mortality rates
decreased sharply. Mortality from tuberculosis also dropped alongside the introduction of free-of-charge
treatment.
(3) 1960 to 1970: Period of high economic growth (Per capita GDP $4,000-$10,000 era)
High economic growth and the achievement of universal health care in 1961 further increased
medical demand, expanded the number of medical facilities, and advanced medical technologies.
62
Against this background, the central government clearly shifted its position to recognizing the shortage
of medical doctors and started increasing the quota for the number of students allowed to study at existing
medical universities. The central government also expanded nursing schools, strengthened the intensive
training of assistant nurses, and supported retired nurses for their re-entry into the health service.
With regard to quality control of medical doctors at the workforce stage, accreditation of specialists
was institutionalized only in very limited sub-specialties. In response to the increased demand of young
doctors for doctoral degrees, medical departments in universities began to exert great influence on the
career development and promotion of their graduates at the workforce stage, principally by giving them
opportunities to take part in clinical exercises that were unique to their respective medical departments.
(4) 1970 to 1980 Period of stable growth (Per capita GDP $10,000-$13,000 era)
This decade saw increased cases of cancers and circulatory diseases and the beginning of an
aging population. Free medical care for the elderly was introduced in 1973, and the number of hospital
beds sharply increased. The shortage of medical doctors continued to be high on the policy agenda, and
the geographical mal-distribution of doctors was seriously recognized as a new policy challenge. In such
circumstances, the central government relaxed its position on the opening of medical universities and
faculties in local prefectures. A coalition of local governments established Jichi Medical University with
special incentive mechanisms for the students who wished to work in rural areas. The central government
upgraded the national remote area health service plan by subsidizing the cost and allowance of medical
doctors dispatched to remote areas.
A medium-term nurse development plan was introduced in 1974 in response to the persistent
shortage of nurses. Some nursing schools were upgraded to junior colleges. The responsibility/function of
community health was mostly transferred from prefectures to municipalities. Environmental health and
elderly care were added to the mandate of public health nurses. The prevalence of institutionalized
medical/health service delivery led to the decline of midwives‟ services.
2. Lessons from Japan's HRH experience for developing countries
(1) Characteristics of Japan's HRH policies until 1980
The following seven characteristics were observed in Japan's HRH policies until 1980, including the
pre-war time.
First, the focus of HRH policies was placed not only on the upgrading and expansion of
medical professionals but also community health professionals. After the war, one of the major
health policies for improving maternal and child health and controlling tuberculosis was capacity building
for HRH in community health services. The number and quality of HRH in medical services increased in
response to the improvement of medical facilities and the achievement of universal health coverage
during the period of high economic growth. The strengthening of public health nurses and doctors also
became crucial health policy topics to implement disease prevention and health promotion in community
health services. During the period, the central government put its policy focus not only on HRH, but also
on the service network by upgrading functions of health centers.
Second, HRH policy on medical doctors focused on the university education phase. The
focus of policy for medical doctors emphasized medical education and qualifications, namely the “entry

63
stage,” which is one of the three career stages of “entry – workforce –exit” defined by WHO.83
Legal and
systematic improvements in terms of both quality and quantity were carried out for educational institutions,
including facility standards, qualifications for university entrance, quotas, and quality control of
examinations. Also, medical universities in rural areas and Jichi Medical University were founded to
develop new doctors for community health. At the same time, education for specialists and in-service
training for doctors in the “workforce stage” were promoted by academic societies, medical departments
in universities, and medical societies.
Third, HRH policy actions for nurses were implemented at all the career stages, “entry –
workforce – exit”, although they were conceived of in a reactive, not proactive, manner. Though
nurses began to practice in the early stages of the pre-war period, it took twenty to thirty years to legislate
their qualifications and educational institutions. After the war, qualifications were updated. However, the
introduction of assistant nurse positions and the development of educational institutions were planned
long after a nurse shortage and weak education system were recognized as health challenges.
Fourth, midwives had been trained and qualified since the beginning of Meiji era, as well as
medical doctors. In the pre-war period, midwives were regarded as independent health specialists.
Their job opportunities declined over the last two decades due to the increased prevalence of
institutionalized deliveries.
Fifth, the central government took the lead in regulating the qualification standards of HRH
educational institutions, while private sector played a key role in the actual
establishment/operations of educational and training institutions. The quota and number of schools
for medical doctors were strictly controlled by the central government, while those for nurses, midwives
and public health nurses were not in place.
Sixth, the division of labor between the Ministry of Health and Welfare and the Ministry of
Education was clearly defined, and HRH policy was formulated by the former and effectively
implemented by the latter with adequate funding.
Finally, because of loose legal restrictions regarding which sub-specialties medical doctors
could claim, the central government had little incentive to adjust the number of medical doctors
in each sub-specialty in order to respond to changes in the pattern of disease incidence.
(2) Lessons from Japan's HRH experience for developing countries
Based on Japan‟s HRH experiences mentioned above, the lessons for developing countries will be
summarized as follows.
It should be noted that Japan had a number of advantageous conditions that distinguished it from
many developing countries. Traditional HRH already existed to some extent before healthcare was
modernized; free compulsory basic education was launched at the beginning of the twentieth century;
and health insurance was already widespread before the war.
Lessons below would be more valuable as a reference for middle income countries with some
amount of HRH who are facing changes in demand for health services amidst an aging society and
economic growth. Also, lessons would be relevant to low income countries in response to the challenges
of providing public health services.
83
WHO, The World Health Report 2006, WHO, 2006.

64
(i) Political leadership is critical for steady progress in developing and securing HRH.
In Japan, the national goal of “wealth and power of the state” during the Meiji period and the goal of
“healthy solders and people” during the early Showa pushed forward powerfully the modernization of
HRH, health insurance, and public health. Moreover, in the post-war period, the ruling Liberal Democrat
Party put the development of health services, in terms of enhancing the coverage of public health
services and securing HRH, as an important political agenda, in response to the competing health
policies of the Social Democrat Party and the Communist Party. It is significant that HRH development
was a policy priority, and programs were implemented by the political leadership. Local healthcare is an
important and common topic to the people in developing countries. Thus, political leaders should be well
aware of the value of placing health as a priority item on the agenda to get the support of the electorate.
(ii) In a situation where the shortage of HRH is serious and its development requires considerable
time, priority can be given to investing in community health or community health personnel in
order to provide the broader population with services related to disease prevention, infectious
disease control, and maternal and child health in a more cost effective manner.
For many developing countries that have not carried out public health system improvements, the
prevention and control of infectious diseases and the improvement of maternal and child health are most
important issues. When tackling health issues by making effective use of limited health budgets and
facilities, securing HRH to prevent diseases and improve the health of people in the community must be
prioritized. In the deteriorated public health environment after the war, Japan‟s central government
promoted public health activities based out of health centers by qualified public health nurses.
The improvement of public health requires human resources who use epidemiological knowledge,
collect and analyze a sufficient amount of current data, and develop a plan for action with effective use of
limited resources. It also requires public awareness to be raised and the securing of HRH who can act as
leaders.
In order for human resources to carry out their activities efficiently, facilities that serve as bases for
their activities, such as public health centers, must be improved, a team including administrators must be
set up, and financial resources and training must be provided by the central or local government. The
share of subsidies for health centers occupied only about 2% of the total amount of the budget of the
Ministry of Health and Welfare in 1950s, when the central government bore the investment costs for
health centers, and the central and local governments jointly funded the operation and management of
health centers.
(iii) When introducing a health profession trained in the short-term, such as an assistant nurse,
to respond to a serious HRH shortage, it is necessary to clearly define their duties and to develop
measures for upgrading their future skills and career prospects.
Many countries among 57 “HRH crisis countries” need to develop HRH trained in a short period of
time to complement existing professionals such as medical doctors, nurses, and midwives. For example,
in Ethiopia, Health Extension Workers (HEW) were introduced to respond to a shortage in the number of
HRH at the end of the last decade (2000s). In order to utilize those HRH trained in the short-term in a

65
sustainable way, opportunities to improve their knowledge, skills, and career opportunities should be
examined in advance.
In Japan, six years after the introduction of assistant nurses in 1951, the Ministry of Health and
Welfare legislated a two-year education program to allow assistant nurses to become nurses. It was an
effort to increase the quality of nursing care.
Confusion occurred between assistant nurses and nurses over their respective job duties. A lesson
learned from Japan's experience shows that when introducing a health profession trained in the
short-term, the scope and job description of these new professionals should be made clear to ensure an
efficient division of labor.
(iv) Transitional measures are worth considering to avoid political conflict between existing HRH
(e.g. traditional birth attendants, herbal medicine doctors) and newly introduced HRH.
In Japan, when a new regulation on the qualifications for medical doctors based on western
medicine was introduced, the exemption of medical license examinations for existing doctors practicing
herbal medicine was set as a transitional measure. Also, provisional licenses were given to traditional
midwives who had already established their own business under the condition that they would pass the
examination within certain period. In addition, when the central government tried to change the regulation
on qualifications for nurses, midwives and public health nurses, the Ministry of Health and Welfare took
transitional measures, giving licenses without examination for existing HRHs.
In West Africa, the policy that disapproved of deliveries by traditional birth attendants was
implemented before a sufficient number of midwives had been trained and assigned to provide health
services. It caused a shortage of midwives and created great difficulties for deliveries, especially in
remote areas where it was hard to assign midwives. 84
By taking transitional measures for traditional health professionals, such as providing provisional
licenses, offering supplementary training, defining alternative roles, and avoiding political conflict, a
smooth transition to modern HRH policies can be achieved.
(v) It is critical to formulate and implement a long-term plan for HRH based on evidence-based
demand-supply analysis.
It takes a long time to train HRH and for policies to demonstrate their effects. So it is desirable to
develop long-term HRH training policies based on precise five-to-ten-year demand-supply plans. Such
plans may take as long as twenty years for medical doctors. An adequate demand-supply projection and
HRH development plan requires an established system in each respective country to monitor the present
situation of HRH, to collect various types of information on domestic socio-economic conditions, the
health needs of population and international trends in HRH, to analyze them from various aspects, and to
project the future in an evidence-based manner. To achieve that end, support from WHO, GHWA,
relevant organizations in the international community, and the political leadership in developing countries
is indispensable.
In Japan, the Ministry of Health and Welfare realized the shortage of medical doctors and nurses in
1960s. However, looking at documents on the development of medical doctors at the time, it seems that

66
the central government utilized a rather simple estimation of the supply and demand of medical doctors
without applying strict calculations. Simple calculations were also conducted to estimate the appropriate
number of nurses. However, for nurses, it seems that the estimates were relatively accurate, because
short-term five-year estimates were adopted; the demand for nurses was related to the number of
hospital beds; and workplace and training facilities were operated under the same calculations. The
development plan for nurses led to the formulation of evidence-based training plans, additional budgetary
requests, and budget increases. In practice, programs on the development of nurses were actively
implemented, and a stable balance between the demand and supply of nurses was reached by the end of
the 1970s.
(vi) It is necessary to clearly define the division of labor between the health ministry and the
education ministry regarding the formulation and implementation of HRH policy and to
encourage close coordination between the ministries.
In most developing countries, a health ministry examines supply and demand of HRH, while an
education ministry implements training of HRH. In many countries, however, HRH development often
becomes a challenge because the division of labor and responsibility between ministries is not clear and
because the communication between them is insufficient, in addition to difficulties with limited budget
resources. In other cases, a similar problem exists within a ministry, especially when planning and
training are divided into different departments.
With regard to the development of medical doctors in Japan, the Ministry of Health and Welfare
examined the demand-supply of medical doctors, and then the Ministry of Education planned the quota of
students and budget for medical universities. The division of labor between them was clear. In addition,
communication between the ministries was maintained through discussions between staff members of
both ministries and in meetings of advisory committees. As a result, HRH development was implemented
without wasting time for coordination between the ministries.
(vii) In dealing with the mal-distribution of HRH, the concept of “Jichi Medical University” is worth
examining, as it introduced effective incentive programs for students who wished to work in rural
areas.
Geographical mal-distribution of HRH is of great concern among developing countries. Various
policies providing incentives have been introduced to promote the coordinated distribution of HRH. For
example, in Thailand and in Mexico, doctors have a duty to work for several years in remote areas to
obtain qualifications as medical doctors. Moreover, providing financial support (such as an allowance),
guaranteeing future positions, and providing opportunity to study abroad are other measures taken in
developing countries to encourage doctors to work in remote areas.
In Japan, Jichi Medical College was established by all forty-seven prefectures for educating student
who wished to work in rural areas. Scholarship loans from each prefecture were allocated to the admitted
students. After nine years of engagement as a medical doctor in his/her home prefecture immediately
after graduation, the loans would not have to be repaid. It would be difficult to apply Japan‟s experience in
an a priori way, but it can be referred to as a policy option to promote health personnel working in remote
areas.
67
(viii) For the retention of HRH at their workplaces, non-financial incentives, including the
improvement of their working environment and accounting for their life plans, such as pregnancy
and child care, are necessary complements to monetary incentives.
Improvement of working conditions has been tried in many countries. In Japan, as a response to
demands from nurses for better working conditions, there were improvements not only in salaries, but
also in the working environment since the 1960s. Improvements were made according to life stages, such
as providing a nursery at the workplace, providing training to upgrade professional skills, introducing new
posts, and preparing a nap room. To some extent, these measures were effective to secure nurses.
It may not be appropriate to apply the policy experience of working conditions on HRH in Japan, a
high-middle income country, to the present context of developing countries. However it can be useful to
examine not only monetary incentives but also non-monetary incentives to fill the various needs of HRH,
including safety in the workplace, opportunities for career development, and support during different life
stages.
68
Closing Remarks
The period when Japan shifted from a low income country to a high income country is the focus of
this report, in order to extract lessons for HRH policies in developing countries. After reaching the status
of a high income country in 1980s, Japan's economy started slowing down, the population aged rapidly
and medical expenditures increased. These are the important questions today in Japan, and they are
major subjects of interest to researchers. The report transfers responsibility for the review of the period
after 1980 to other researchers, because it requires additional analyses on these current issues.
Sixty years have passed since Japan joined the International Monetary Fund and the World Bank.
During these sixty years, Japan was a recipient country of loans from the World Bank from 1953 to 1966.
Although it is not easy to compare different countries in the world and different periods of history, the
analysis presented in this report has been made, aiming at some contribution to the policies of developing
countries which face present challenges in the health sector and which have to develop HRH amidst
budgetary difficulties.
Needless to say, the base of human development is the education system, namely human
development cannot be achieved without a sufficient system of primary and secondary education.
The analysis in this report focused on HRH. It may invite criticism that the report is too descriptive and
less analytical, focusing on only HRH policies separately from disease structures and issues of health
finance in the respective periods of history. Further studies by researchers with specialties in those fields
will complement the analysis in this report.
The present situation of the international community is quite different from the one 60 to 70 years
ago, which is the period of Japan's experience presented in this report. Nowadays, information-gathering
and international knowledge on HRH policies is broader. Grants and technical assistance by the
international community are provided. In addition, information technology has developed at an amazing
speed even in Sub-Saharan Africa and South Asia, and these technologies may mitigate the difficulties of
HRH development. In other words, now is the time when the pursuance of efficiency in health systems
can complement the long duration needed to train HRH.
Based on its experiences in supporting human resources for health and contributing to discussions
on global trends, JICA pledges to protect and promote people‟s health in developing countries by
supporting the innovative development of health systems.

69
■Reference
(1) Transition of the Ministries in charge
(2) Transition of relevant laws
* This shows years to enact these laws.
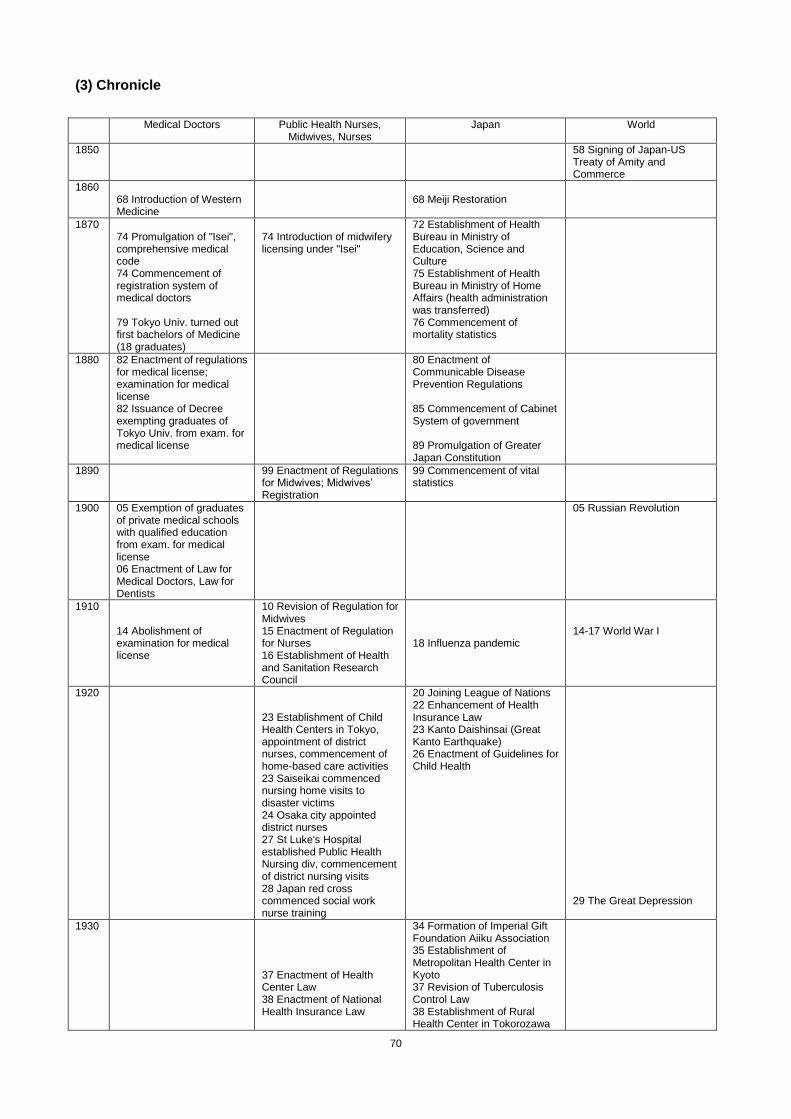
70
(3) Chronicle
Medical Doctors Public Health Nurses,
Midwives, Nurses Japan World
1850 58 Signing of Japan-US Treaty of Amity and Commerce
1860 68 Introduction of Western Medicine
68 Meiji Restoration
1870 74 Promulgation of "Isei", comprehensive medical code 74 Commencement of registration system of medical doctors 79 Tokyo Univ. turned out first bachelors of Medicine (18 graduates)
74 Introduction of midwifery licensing under "Isei"
72 Establishment of Health Bureau in Ministry of Education, Science and Culture 75 Establishment of Health Bureau in Ministry of Home Affairs (health administration was transferred) 76 Commencement of mortality statistics
1880 82 Enactment of regulations for medical license; examination for medical license 82 Issuance of Decree exempting graduates of Tokyo Univ. from exam. for medical license
80 Enactment of Communicable Disease Prevention Regulations 85 Commencement of Cabinet System of government 89 Promulgation of Greater Japan Constitution
1890 99 Enactment of Regulations for Midwives; Midwives‟ Registration
99 Commencement of vital statistics
1900
05 Exemption of graduates of private medical schools with qualified education from exam. for medical license 06 Enactment of Law for Medical Doctors, Law for Dentists
05 Russian Revolution
1910 14 Abolishment of examination for medical license
10 Revision of Regulation for Midwives 15 Enactment of Regulation for Nurses 16 Establishment of Health and Sanitation Research Council
18 Influenza pandemic
14-17 World War I
1920 23 Establishment of Child Health Centers in Tokyo, appointment of district nurses, commencement of home-based care activities 23 Saiseikai commenced nursing home visits to disaster victims 24 Osaka city appointed district nurses 27 St Luke's Hospital established Public Health Nursing div, commencement of district nursing visits 28 Japan red cross commenced social work nurse training
20 Joining League of Nations 22 Enhancement of Health Insurance Law 23 Kanto Daishinsai (Great Kanto Earthquake) 26 Enactment of Guidelines for Child Health
29 The Great Depression
1930
37 Enactment of Health Center Law 38 Enactment of National Health Insurance Law
34 Formation of Imperial Gift Foundation Aiiku Association 35 Establishment of Metropolitan Health Center in Kyoto 37 Revision of Tuberculosis Control Law 38 Establishment of Rural Health Center in Tokorozawa
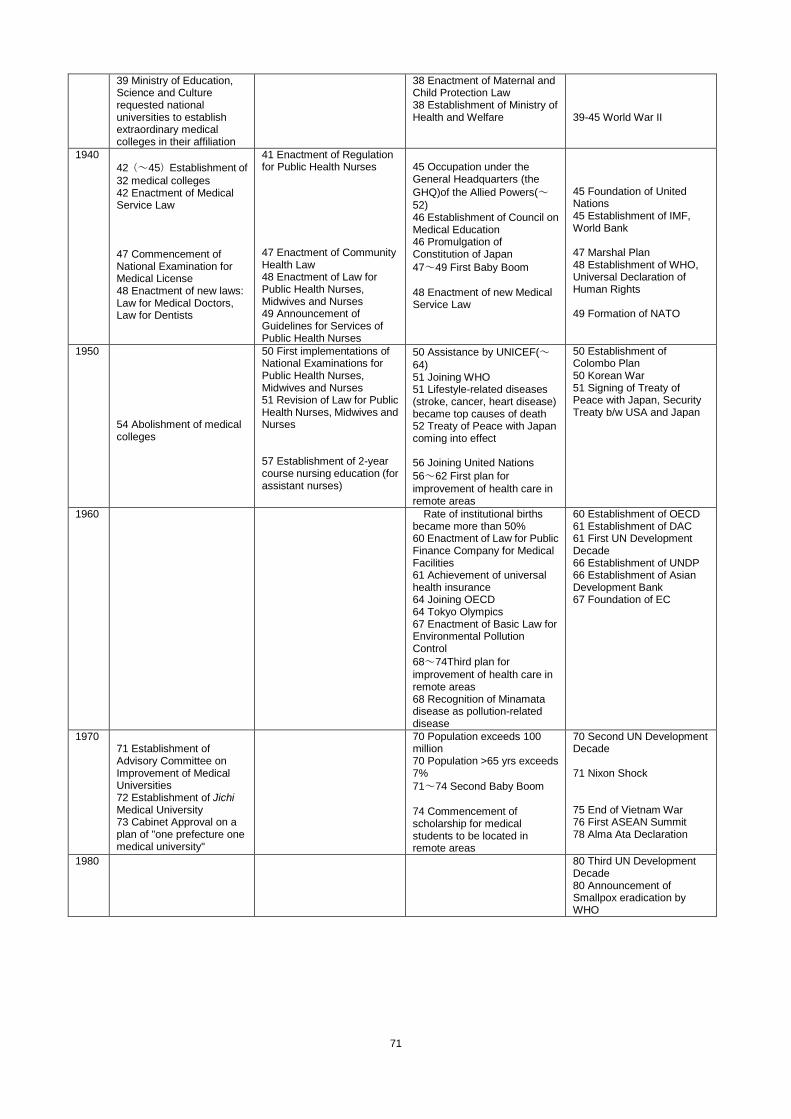
71
39 Ministry of Education, Science and Culture requested national universities to establish extraordinary medical colleges in their affiliation
38 Enactment of Maternal and Child Protection Law 38 Establishment of Ministry of Health and Welfare
39-45 World War II
1940
42(~45)Establishment of
32 medical colleges 42 Enactment of Medical Service Law 47 Commencement of National Examination for Medical License 48 Enactment of new laws: Law for Medical Doctors, Law for Dentists
41 Enactment of Regulation for Public Health Nurses 47 Enactment of Community Health Law 48 Enactment of Law for Public Health Nurses, Midwives and Nurses 49 Announcement of Guidelines for Services of Public Health Nurses
45 Occupation under the General Headquarters (the
GHQ)of the Allied Powers(~52) 46 Establishment of Council on Medical Education 46 Promulgation of Constitution of Japan
47~49 First Baby Boom
48 Enactment of new Medical Service Law
45 Foundation of United Nations 45 Establishment of IMF, World Bank 47 Marshal Plan 48 Establishment of WHO, Universal Declaration of Human Rights 49 Formation of NATO
1950
54 Abolishment of medical colleges
50 First implementations of National Examinations for Public Health Nurses, Midwives and Nurses 51 Revision of Law for Public Health Nurses, Midwives and Nurses 57 Establishment of 2-year course nursing education (for assistant nurses)
50 Assistance by UNICEF(~64) 51 Joining WHO 51 Lifestyle-related diseases (stroke, cancer, heart disease) became top causes of death 52 Treaty of Peace with Japan coming into effect 56 Joining United Nations
56~62 First plan for
improvement of health care in remote areas
50 Establishment of Colombo Plan 50 Korean War 51 Signing of Treaty of Peace with Japan, Security Treaty b/w USA and Japan
1960
Rate of institutional births became more than 50% 60 Enactment of Law for Public Finance Company for Medical Facilities 61 Achievement of universal health insurance 64 Joining OECD 64 Tokyo Olympics 67 Enactment of Basic Law for Environmental Pollution Control
68~74Third plan for
improvement of health care in remote areas 68 Recognition of Minamata disease as pollution-related disease
60 Establishment of OECD 61 Establishment of DAC 61 First UN Development Decade 66 Establishment of UNDP 66 Establishment of Asian Development Bank 67 Foundation of EC
1970 71 Establishment of Advisory Committee on Improvement of Medical Universities 72 Establishment of Jichi Medical University 73 Cabinet Approval on a plan of "one prefecture one medical university"
70 Population exceeds 100 million 70 Population >65 yrs exceeds 7%
71~74 Second Baby Boom
74 Commencement of scholarship for medical students to be located in remote areas
70 Second UN Development Decade 71 Nixon Shock 75 End of Vietnam War 76 First ASEAN Summit 78 Alma Ata Declaration
1980 80 Third UN Development Decade 80 Announcement of Smallpox eradication by WHO
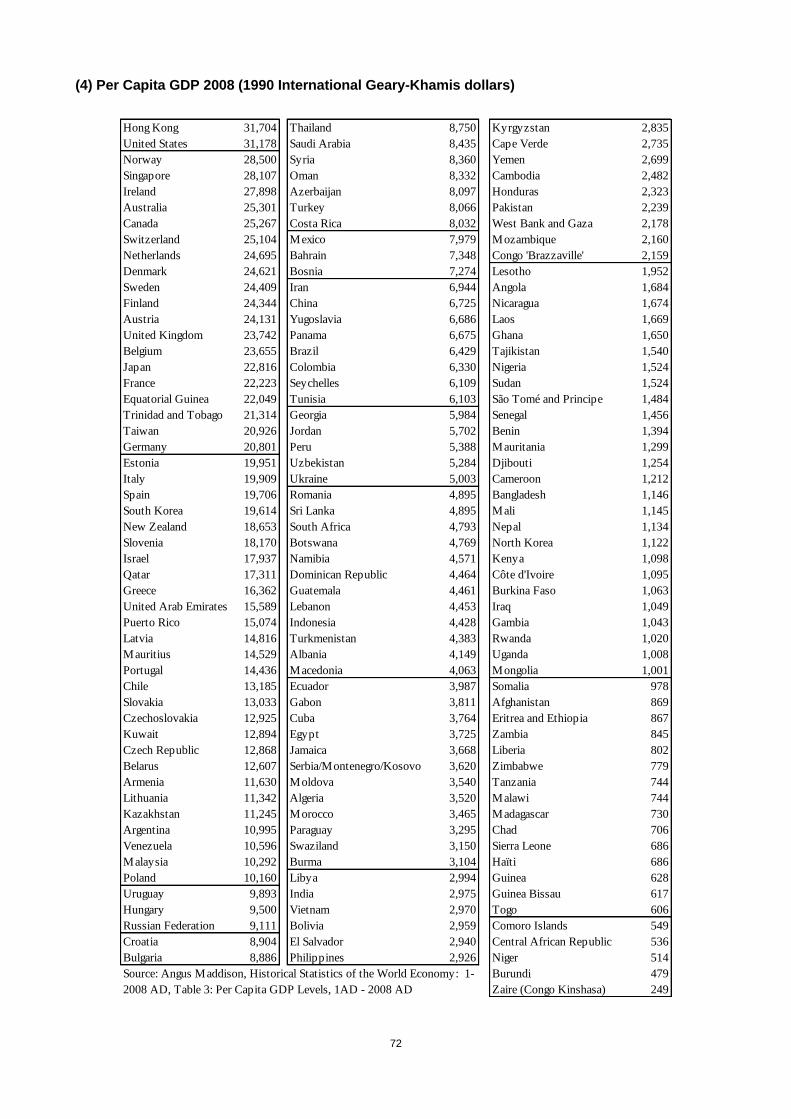
72
(4) Per Capita GDP 2008 (1990 International Geary-Khamis dollars)
Hong Kong 31,704 Thailand 8,750 Kyrgyzstan 2,835
United States 31,178 Saudi Arabia 8,435 Cape Verde 2,735
Norway 28,500 Syria 8,360 Yemen 2,699
Singapore 28,107 Oman 8,332 Cambodia 2,482
Ireland 27,898 Azerbaijan 8,097 Honduras 2,323
Australia 25,301 Turkey 8,066 Pakistan 2,239
Canada 25,267 Costa Rica 8,032 West Bank and Gaza 2,178
Switzerland 25,104 Mexico 7,979 Mozambique 2,160
Netherlands 24,695 Bahrain 7,348 Congo 'Brazzaville' 2,159
Denmark 24,621 Bosnia 7,274 Lesotho 1,952
Sweden 24,409 Iran 6,944 Angola 1,684
Finland 24,344 China 6,725 Nicaragua 1,674
Austria 24,131 Yugoslavia 6,686 Laos 1,669
United Kingdom 23,742 Panama 6,675 Ghana 1,650
Belgium 23,655 Brazil 6,429 Tajikistan 1,540
Japan 22,816 Colombia 6,330 Nigeria 1,524
France 22,223 Seychelles 6,109 Sudan 1,524
Equatorial Guinea 22,049 Tunisia 6,103 São Tomé and Principe 1,484
Trinidad and Tobago 21,314 Georgia 5,984 Senegal 1,456
Taiwan 20,926 Jordan 5,702 Benin 1,394
Germany 20,801 Peru 5,388 Mauritania 1,299
Estonia 19,951 Uzbekistan 5,284 Djibouti 1,254
Italy 19,909 Ukraine 5,003 Cameroon 1,212
Spain 19,706 Romania 4,895 Bangladesh 1,146
South Korea 19,614 Sri Lanka 4,895 Mali 1,145
New Zealand 18,653 South Africa 4,793 Nepal 1,134
Slovenia 18,170 Botswana 4,769 North Korea 1,122
Israel 17,937 Namibia 4,571 Kenya 1,098
Qatar 17,311 Dominican Republic 4,464 Côte d'Ivoire 1,095
Greece 16,362 Guatemala 4,461 Burkina Faso 1,063
United Arab Emirates 15,589 Lebanon 4,453 Iraq 1,049
Puerto Rico 15,074 Indonesia 4,428 Gambia 1,043
Latvia 14,816 Turkmenistan 4,383 Rwanda 1,020
Mauritius 14,529 Albania 4,149 Uganda 1,008
Portugal 14,436 Macedonia 4,063 Mongolia 1,001
Chile 13,185 Ecuador 3,987 Somalia 978
Slovakia 13,033 Gabon 3,811 Afghanistan 869
Czechoslovakia 12,925 Cuba 3,764 Eritrea and Ethiopia 867
Kuwait 12,894 Egypt 3,725 Zambia 845
Czech Republic 12,868 Jamaica 3,668 Liberia 802
Belarus 12,607 Serbia/Montenegro/Kosovo 3,620 Zimbabwe 779
Armenia 11,630 Moldova 3,540 Tanzania 744
Lithuania 11,342 Algeria 3,520 Malawi 744
Kazakhstan 11,245 Morocco 3,465 Madagascar 730
Argentina 10,995 Paraguay 3,295 Chad 706
Venezuela 10,596 Swaziland 3,150 Sierra Leone 686
Malaysia 10,292 Burma 3,104 Haïti 686
Poland 10,160 Libya 2,994 Guinea 628
Uruguay 9,893 India 2,975 Guinea Bissau 617
Hungary 9,500 Vietnam 2,970 Togo 606
Russian Federation 9,111 Bolivia 2,959 Comoro Islands 549
Croatia 8,904 El Salvador 2,940 Central African Republic 536
Bulgaria 8,886 Philippines 2,926 Niger 514
Burundi 479
Zaire (Congo Kinshasa) 249
Source: Angus Maddison, Historical Statistics of the World Economy: 1-
2008 AD, Table 3: Per Capita GDP Levels, 1AD - 2008 AD


![User experience e service design [Handle with brand care]](https://img.pdfslide.tips/doc/110x75/54c60d644a795993288b45cc/user-experience-e-service-design-handle-with-brand-care.jpg)