Embed Size (px)
Citation preview

What If We Only Use Real Datasets for Scene Text Recognition?Toward Scene Text Recognition With Fewer Labels
Jeonghun Baek Yusuke Matsui Kiyoharu AizawaThe University of Tokyo
{baek, matsui, aizawa}@hal.t.u-tokyo.ac.jp
Abstract
Scene text recognition (STR) task has a common prac-tice: All state-of-the-art STR models are trained on largesynthetic data. In contrast to this practice, training STRmodels only on fewer real labels (STR with fewer labels) isimportant when we have to train STR models without syn-thetic data: for handwritten or artistic texts that are diffi-cult to generate synthetically and for languages other thanEnglish for which we do not always have synthetic data.However, there has been implicit common knowledge thattraining STR models on real data is nearly impossible be-cause real data is insufficient. We consider that this com-mon knowledge has obstructed the study of STR with fewerlabels. In this work, we would like to reactivate STR withfewer labels by disproving the common knowledge. We con-solidate recently accumulated public real data and showthat we can train STR models satisfactorily only with reallabeled data. Subsequently, we find simple data augmen-tation to fully exploit real data. Furthermore, we improvethe models by collecting unlabeled data and introducingsemi- and self-supervised methods. As a result, we obtaina competitive model to state-of-the-art methods. To the bestof our knowledge, this is the first study that 1) shows suf-ficient performance by only using real labels and 2) in-troduces semi- and self-supervised methods into STR withfewer labels. Our code and data are available: https://github.com/ku21fan/STR-Fewer-Labels.
1. Introduction
Reading text in natural scenes is generally divided intotwo tasks: detecting text regions in scene images and rec-ognizing the text in the regions. The former is referred toas scene text detection (STD), and the latter as scene textrecognition (STR). Since STR can serve as a substitute formanual typing performed by humans, we frequently em-ploy STR for various purposes: translation by recognizingforeign languages, street sign recognition for autonomous
driving, various card recognition to input personal informa-tion, etc. Unlike optical character recognition (OCR), whichfocuses on reading texts in cleaned documents, STR alsoaddresses irregular cases in our lives, such as curved or per-spective texts, occluded texts, texts in low-resolution im-ages, and texts written in difficult font.
To address these irregular cases, prior works have devel-oped STR models comprising deep neural networks. For ex-ample, to address curved or perspective texts, image trans-formation modules have been proposed to normalize theminto horizontal images [53, 75, 70]. Qiao et al. [49] has inte-grated a pretrained language model into STR models to rec-ognize occluded text. Wang et al. [66] and Mou et al. [42]have introduced a super-resolution module into STR modelsto handle low-resolution images.
While prior works have improved STR models, the studyof training STR models only on fewer real labels (STRwith fewer labels) is insufficient. After emerging large syn-thetic data [17] in 2014, the study of STR with fewer la-bels has decreased. All state-of-the-art methods use largesynthetic data to train STR models instead of sole realdata [51, 53, 25, 75, 26, 1, 70, 65, 63, 71, 30, 49, 72, 42].Implicit common knowledge has been made; training STRmodels only on real data results in low accuracy becausethe amount of real data is very small. This common knowl-edge may have hindered studies on STR with fewer labels.
STR with fewer labels is important when we have totrain STR models without synthetic data. In practical ap-plications, generating synthetic data close to real data canbe difficult depending on the target domain, such as hand-written text or artistic text. In the other case, when we haveto recognize languages other than English, there are not al-ways synthetic data for them. Generating appropriate syn-thetic data for them is difficult for those who do not knowtarget languages.
In this paper, we would like to reactivate STR with fewerlabels for such cases. As a first step, we disprove the com-mon knowledge by showing that we can train STR mod-els satisfactorily only with real labels. This is not previ-ously feasible. Because the real data was small, STR mod-
1
arX
iv:2
103.
0440
0v2
[cs
.CV
] 5
Jun
202
1

2011(231)
2013(2,788)
2015(6,498)
2017(146K)
2019(276K)
Year and (number of accumulated real labeled data)
0
20
40
60
80
100
Acc
urac
y (%
)
TRBACRNN
Synthetic data 16MSynthetic data 16M
Figure 1: Accuracy vs. number of accumulated real labeleddata. Every two years, public real data has been accumu-lated. In our experiments, we find that accuracy obtainedusing real data approaches that obtained using syntheticdata, along with increment of real data. CRNN [51] andTRBA [1] are VGG-based and ResNet-based STR models,respectively.
els trained on real data had low accuracy, as shown in Fig-ure 1. However, the public real data are accumulated everytwo years. We consolidate accumulated real data (276K),and find that the accuracy of STR models [51, 1] trained onthem is close to that of synthetic data (16M). Namely, wecan train STR models only on real data instead of syntheticdata. It is high time to change the prevalent perspective from“We don’t have enough real data to train STR models” to“We have enough real data to train STR models”. It is alsoa good time to study STR with fewer labels.
To improve STR with fewer labels, we find simple yeteffective data augmentations to fully exploit real data. In ad-dition, we collect unlabeled data and introduce a semi- andself-supervised framework into the STR. With extensive ex-periments, we analyze the contribution of them and demon-strate that we can obtain a competitive model to state-of-the-art methods by only using real data. Furthermore, weinvestigate if our method is also useful when we have bothsynthetic and real data.
2. Common Practice in STR DatasetAccording to a benchmark study [1], obtaining enough
real data is difficult because of the high labeling cost. Thus,STR models are generally trained on large synthetic datainstead of real data. Real data has been used for evaluation.
2.1. Synthetic Datasets for Training
There are two major synthetic datasets.
MJSynth (MJ) [17] is generated for STR, and it contains9M word boxes. Each word is generated from a 90K Englishlexicon and over 1,400 Google Fonts, as shown in Figure 2a.
(a) MJ word boxes (b) ST scene image
Figure 2: Examples of two major synthetic datasets.
SynthText (ST) [12] is originally generated for scene textdetection. The texts are rendered onto scene images, asshown in Figure 2b. For STR, we crop the texts in sceneimages and use them for training. ST has 7M word boxes.
2.2. Real Benchmark Datasets for Evaluation
Six real datasets have been used to evaluate STR models.
Street View Text (SVT) [64] is collected from GoogleStreet View, and contains texts in street images. It contains257 images for training and 647 images for evaluation.
IIIT5K-Words (IIIT) [39] is crawled from Google imagesearches with query words such as “billboards” and “movieposters.” It contains 2,000 images for training and 3,000 im-ages for evaluation.
ICDAR2013 (IC13) [21] is created for the ICDAR 2013Robust Reading competition. It contains 848 images fortraining and 1,015 images for evaluation.
ICDAR2015 (IC15) [20] is collected by people who wearGoogle Glass, and thus, many of them contain perspectivetexts and some of them are blurry. It contains 4,468 imagesfor training and 2,077 images for evaluation.
SVT Perspective (SP) [48] is collected from Google StreetView, similar to SVT. Unlike SVT, SP contains many per-spective texts. It contains 645 images for evaluation.
CUTE80 (CT) [50] is collected for curved text. The im-ages are captured by a digital camera or collected from theInternet. It contains 288 cropped images for evaluation.
They are generally divided into regular (SVT, IIIT, IC13)and irregular (IC15, SP, CT) datasets. The former mainlycontains horizontal texts, while the latter mainly containsperspective or curved texts.
3. Consolidating Public Real DatasetsRecently, public real data has been sufficiently accumu-
lated to train STR models, as shown in Figure 1. We con-solidate the training set of public real datasets from 2011to 2019. Table 1 lists datasets. Figure 3 shows the exam-ples of word boxes. Before using the original data directlyfor training, we conduct some preprocessing on datasets forour task. We summarize the processes in §3.3, and detailsare in the supplementary materials.
2
(a) Year 2011 (b) Year 2013 (c) Year 2015 (d) Year 2017 (e) Year 2019
Figure 3: Examples of accumulated real labeled data. More examples are provided in the supplementary materials.
3.1. Real Labeled Datasets Have Increased
Recently, many irregular texts are accumulated as shownin Year 2015, 2017, and 2019 in Figure 3. They can makeSTR models more robust. Many real labeled datasets are re-leased from ICDAR competitions: IC13, IC15, RCTW, ArT,LSVT, MLT19, and ReCTS (7 of 11 datasets in Table 1).ICDAR competitions are held every two years, and real la-beled datasets have also increased in number. We summa-rize real labeled datasets for every two years.
(a) Year 2011 (SVT) and (b) Year 2013 (IIIT, IC13): Mostof images are horizontal texts in the street.
(c) Year 2015 (IC15): Images captured by Google Glassunder movement of the wearer, and thus many are per-spective texts, blurry, or low-resolution images.
(d) Year 2017 (COCO, RCTW, Uber):
COCO-Text (COCO) [62] is created from the MSCOCO dataset [29]. As the MS COCO dataset is notintended to capture text, COCO contains many oc-cluded or low-resolution texts.
RCTW [54] is created for Reading Chinese Text inthe Wild competition. Thus many are Chinese text.
Uber-Text (Uber) [78] is collected from Bing MapsStreetside. Many are house number, and some are texton signboards.
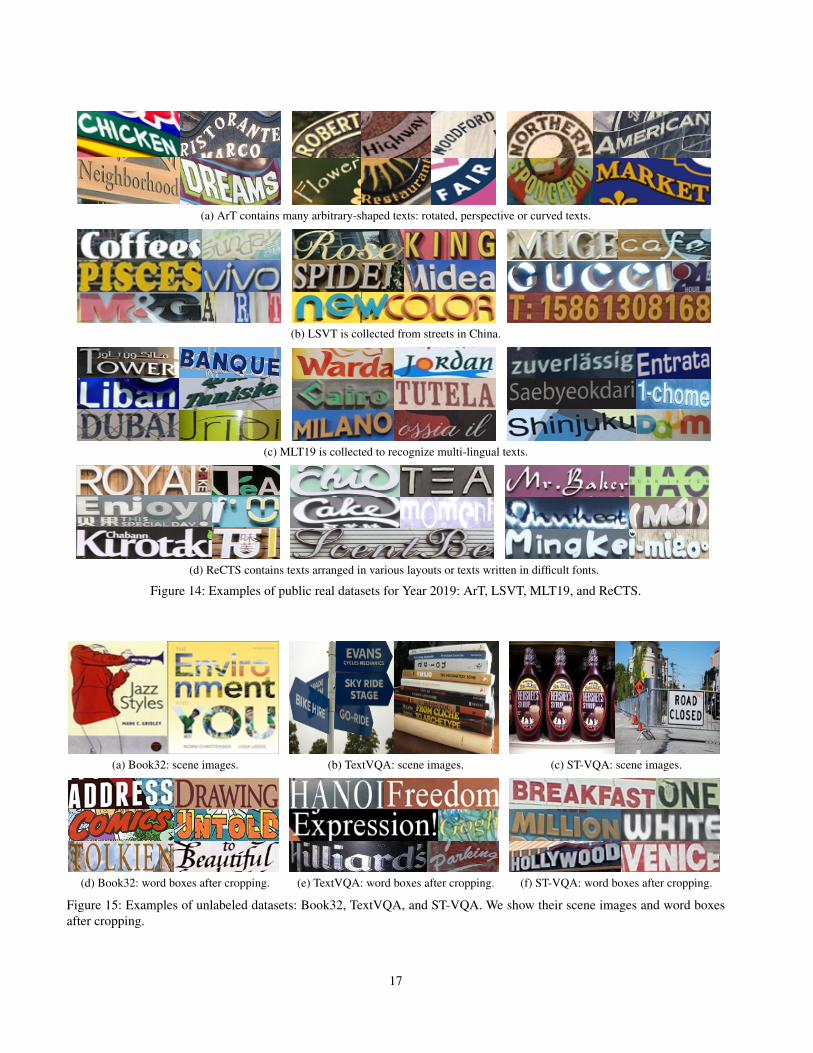
(e) Year 2019 (ArT, LSVT, MLT19, ReCTS):
ArT [7] is created to recognize Arbitrary-shaped Text.Many are perspective or curved texts. It also includesTotaltext [8] and CTW1500 [33], which contain manyrotated or curved texts.
LSVT [60, 59] is a Large-scale Street View Textdataset, collected from streets in China, and thus manyare Chinese text.
MLT19 [43] is created to recognize Multi-LingualText. It consists of seven languages: Arabic, Latin,Chinese, Japanese, Korean, Bangla, and Hindi.
ReCTS [77] is created for the Reading Chinese Texton Signboard competition. It contains many irregulartexts arranged in various layouts or written with uniquefonts.
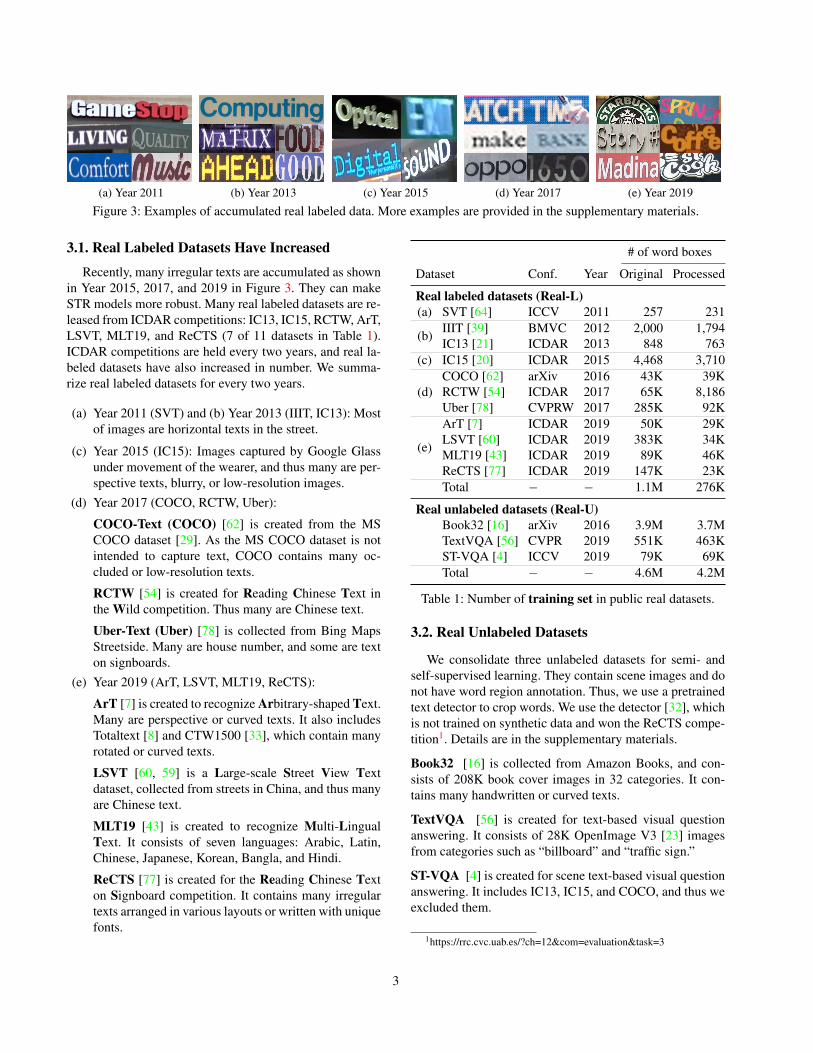
# of word boxes
Dataset Conf. Year Original Processed
Real labeled datasets (Real-L)(a) SVT [64] ICCV 2011 257 231
(b) IIIT [39] BMVC 2012 2,000 1,794IC13 [21] ICDAR 2013 848 763
(c) IC15 [20] ICDAR 2015 4,468 3,710
(d)COCO [62] arXiv 2016 43K 39KRCTW [54] ICDAR 2017 65K 8,186Uber [78] CVPRW 2017 285K 92K
(e)
ArT [7] ICDAR 2019 50K 29KLSVT [60] ICDAR 2019 383K 34KMLT19 [43] ICDAR 2019 89K 46KReCTS [77] ICDAR 2019 147K 23KTotal − − 1.1M 276K
Real unlabeled datasets (Real-U)Book32 [16] arXiv 2016 3.9M 3.7MTextVQA [56] CVPR 2019 551K 463KST-VQA [4] ICCV 2019 79K 69KTotal − − 4.6M 4.2M
Table 1: Number of training set in public real datasets.
3.2. Real Unlabeled Datasets
We consolidate three unlabeled datasets for semi- andself-supervised learning. They contain scene images and donot have word region annotation. Thus, we use a pretrainedtext detector to crop words. We use the detector [32], whichis not trained on synthetic data and won the ReCTS compe-tition1. Details are in the supplementary materials.
Book32 [16] is collected from Amazon Books, and con-sists of 208K book cover images in 32 categories. It con-tains many handwritten or curved texts.
TextVQA [56] is created for text-based visual questionanswering. It consists of 28K OpenImage V3 [23] imagesfrom categories such as “billboard” and “traffic sign.”
ST-VQA [4] is created for scene text-based visual questionanswering. It includes IC13, IC15, and COCO, and thus weexcluded them.
1https://rrc.cvc.uab.es/?ch=12&com=evaluation&task=3
3

3.3. Preprocessing Real Datasets
We conduct following processes before using real data:
Excluding duplication between datasets Some well-known datasets (ICDAR03 (IC03) [37], MLT17 [44], andTotalText [8]) are excluded because they are included inother datasets: IC13 inherits most of IC03, MLT19 includesMLT17, and ArT includes TotalText. Also, CT and ArThave 122 duplicated word boxes, and we exclude them.
Collecting only English words Some datasets are madefor Chinese text recognition (RCTW, ArT, LSVT, ReCTS)or multilingual text recognition (MLT19). Thus they con-tain languages other than English. We only use words whichconsist of alphanumeric characters and symbols.
Excluding don’t care symbol Some texts have “*” or “#”,which denotes “do not care about the text” or “charactershard to read.” We exclude the texts containing them.
Excluding vertical or ± 90 degree rotated texts Somedatasets such as Uber-Text [78] contain many vertical textsor ± 90° rotated texts. We mainly focus on horizontal textsand thus exclude vertical texts. The images whose textshave more than two characters and whose height is greaterthan the width are excluded. For unlabeled data, the imageswhose height is greater than the width are excluded.
Splitting training set to make validation set Most realdatasets do not have validation set. Thus we split the train-ing set of each dataset into training and validation sets.
In addition, we exclude texts longer than 25 charactersfollowing common practice [1].
4. STR With Fewer LabelsIn this section, we describe the STR models and semi-
and self-supervised learning. Although real data has in-creased as mentioned in §3.1, real data is still fewer thansynthetic data at about 1.7% of synthetic data. To com-pensate for the low amount of data, we introduce a semi-and self-supervised learning framework to improve the STRwith fewer labels. This is inspired by other computer visiontasks with fewer labels (high-fidelity image generation [38]and ImageNet classification [74]).
4.1. STR Model Framework
According to [1], STR is performed in four stages:
1. Transformation (Trans.): normalizes the perspectiveor curved text into a horizontal text. This is generallydone by the Spatial Transformer Network (STN) [18].
2. Feature extraction (Feat.): extracts visual feature rep-resentation from the input image. This is generally per-formed by a module composed of convolutional neuralnetworks (CNNs), such as VGG [55] and ResNet [15].
(b) TRBA
ResNet
BiLSTM
Attention
“SNACK”
VGG
BiLSTM
TPS
CTC
(a) CRNN
None
Image
Trans.
Feat.
Seq.
Pred.
“SNAoT”
Figure 4: Illustration of CRNN [51] and TRBA [1].
3. Sequence modeling (Seq.): converts visual features tocontextual features that capture context in the sequenceof characters. This is generally done by BiLSTM [11].
4. Prediction (Pred.): predicts the character sequencefrom contextual features. This is generally done by aCTC [10] decoder or attention mechanism [2].
For our experiments, we adopt two widely-used modelsfrom the STR benchmark [1]: CRNN[51] and TRBA[1], asillustrated in Figure 4. CRNN consists of None, VGG, BiL-STM, and CTC for each stage. CRNN has lower accuracythan state-of-the-art methods, but CRNN is widely chosenfor practical usage because it is fast and lightweight. TRBAconsists of a thin-plate spline [5] transform-based STN(TPS), ResNet, BiLSTM, and Attention for each stage. AsTRBA uses ResNet and attention mechanism, it is largerand slower than CRNN but has higher accuracy.
4.2. Semi-Supervised Learning
Recently, various semi-supervised methods have beenproposed and improved the performance with unlabeleddata, particularly in image classification tasks [24, 61, 41,74]. Since large synthetic data is used for STR to compen-sate for the lack of data instead of using unlabeled data,studies on training STR with unlabeled data are rare. To thebest of our knowledge, there is only one study that uses un-labeled data for the STR benchmark [19]. We introduce twosimple yet effective semi-supervised methods for STR.
Pseudo-Label (PL) [24] is a simple approach that usesunlabeled data. The process is as follows: 1) Train themodel on labeled data. 2) Using the trained model, makepredictions on unlabeled data and use them as pseudola-bels. 3) Combine labeled and pseudolabeled data, and re-train the model on them. Figure 5a illustrates PL. Concur-rent work [19] also uses PL on the Book32 dataset. Theresearchers combine pseudolabeled and synthetic data, anduse them as a training set.
4
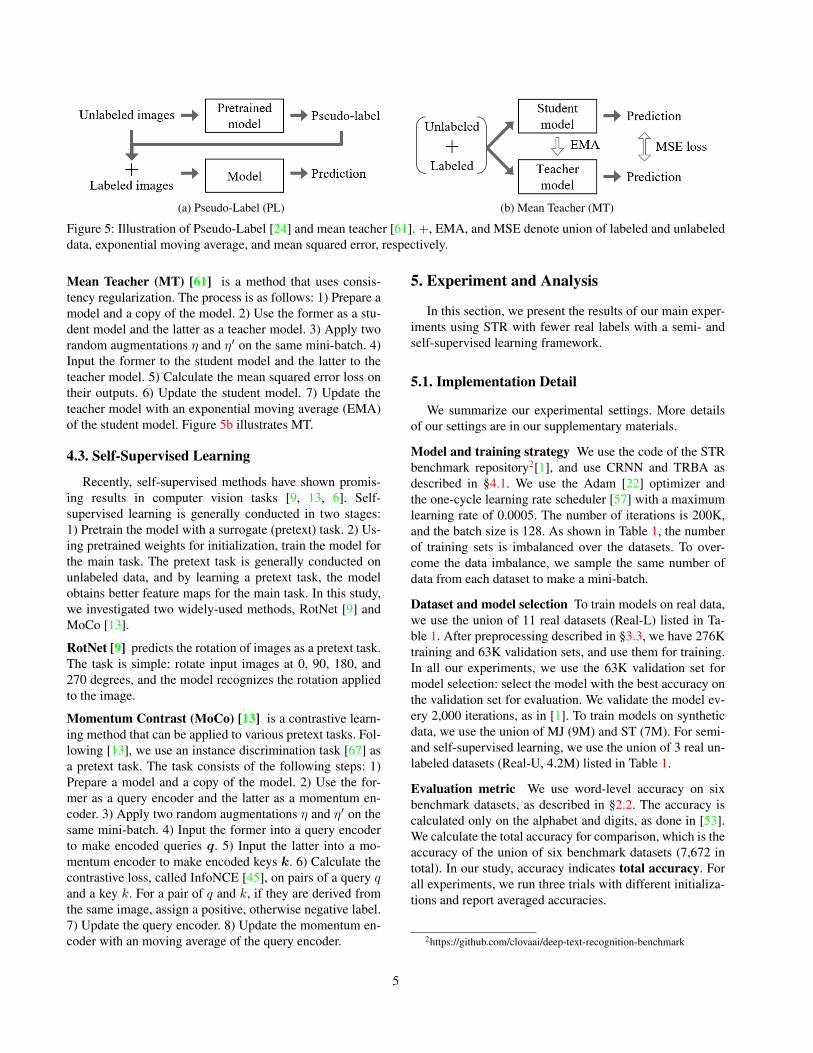
(a) Pseudo-Label (PL) (b) Mean Teacher (MT)
Figure 5: Illustration of Pseudo-Label [24] and mean teacher [61]. +, EMA, and MSE denote union of labeled and unlabeleddata, exponential moving average, and mean squared error, respectively.
Mean Teacher (MT) [61] is a method that uses consis-tency regularization. The process is as follows: 1) Prepare amodel and a copy of the model. 2) Use the former as a stu-dent model and the latter as a teacher model. 3) Apply tworandom augmentations η and η′ on the same mini-batch. 4)Input the former to the student model and the latter to theteacher model. 5) Calculate the mean squared error loss ontheir outputs. 6) Update the student model. 7) Update theteacher model with an exponential moving average (EMA)of the student model. Figure 5b illustrates MT.
4.3. Self-Supervised Learning
Recently, self-supervised methods have shown promis-ing results in computer vision tasks [9, 13, 6]. Self-supervised learning is generally conducted in two stages:1) Pretrain the model with a surrogate (pretext) task. 2) Us-ing pretrained weights for initialization, train the model forthe main task. The pretext task is generally conducted onunlabeled data, and by learning a pretext task, the modelobtains better feature maps for the main task. In this study,we investigated two widely-used methods, RotNet [9] andMoCo [13].
RotNet [9] predicts the rotation of images as a pretext task.The task is simple: rotate input images at 0, 90, 180, and270 degrees, and the model recognizes the rotation appliedto the image.
Momentum Contrast (MoCo) [13] is a contrastive learn-ing method that can be applied to various pretext tasks. Fol-lowing [13], we use an instance discrimination task [67] asa pretext task. The task consists of the following steps: 1)Prepare a model and a copy of the model. 2) Use the for-mer as a query encoder and the latter as a momentum en-coder. 3) Apply two random augmentations η and η′ on thesame mini-batch. 4) Input the former into a query encoderto make encoded queries q. 5) Input the latter into a mo-mentum encoder to make encoded keys k. 6) Calculate thecontrastive loss, called InfoNCE [45], on pairs of a query qand a key k. For a pair of q and k, if they are derived fromthe same image, assign a positive, otherwise negative label.7) Update the query encoder. 8) Update the momentum en-coder with an moving average of the query encoder.
5. Experiment and Analysis
In this section, we present the results of our main exper-iments using STR with fewer real labels with a semi- andself-supervised learning framework.
5.1. Implementation Detail
We summarize our experimental settings. More detailsof our settings are in our supplementary materials.
Model and training strategy We use the code of the STRbenchmark repository2[1], and use CRNN and TRBA asdescribed in §4.1. We use the Adam [22] optimizer andthe one-cycle learning rate scheduler [57] with a maximumlearning rate of 0.0005. The number of iterations is 200K,and the batch size is 128. As shown in Table 1, the numberof training sets is imbalanced over the datasets. To over-come the data imbalance, we sample the same number ofdata from each dataset to make a mini-batch.
Dataset and model selection To train models on real data,we use the union of 11 real datasets (Real-L) listed in Ta-ble 1. After preprocessing described in §3.3, we have 276Ktraining and 63K validation sets, and use them for training.In all our experiments, we use the 63K validation set formodel selection: select the model with the best accuracy onthe validation set for evaluation. We validate the model ev-ery 2,000 iterations, as in [1]. To train models on syntheticdata, we use the union of MJ (9M) and ST (7M). For semi-and self-supervised learning, we use the union of 3 real un-labeled datasets (Real-U, 4.2M) listed in Table 1.
Evaluation metric We use word-level accuracy on sixbenchmark datasets, as described in §2.2. The accuracy iscalculated only on the alphabet and digits, as done in [53].We calculate the total accuracy for comparison, which is theaccuracy of the union of six benchmark datasets (7,672 intotal). In our study, accuracy indicates total accuracy. Forall experiments, we run three trials with different initializa-tions and report averaged accuracies.
2https://github.com/clovaai/deep-text-recognition-benchmark
5

Dataset name and # of data
Method Year Train data IIIT SVT IC13 IC15 SP CT Total3000 647 1015 2077 645 288 7672
Rep
orte
dre
sults
ASTER [53] 2018 MJ+ST 93.4 89.5 91.8 76.1 78.5 79.5 86.4ESIR [75] 2019 MJ+ST 93.3 90.2 91.3 76.9 79.6 83.3 86.8MaskTextSpotter [26] 2019 MJ+ST 95.3 91.8 95.3 78.2 83.6 88.5 89.1ScRN [70] 2019 MJ+ST 94.4 88.9 93.9 78.7 80.8 87.5 88.2DAN [65] 2020 MJ+ST 94.3 89.2 93.9 74.5 80.0 84.4 86.9TextScanner [63] 2020 MJ+ST 93.9 90.1 92.9 79.4 84.3 83.3 88.3SE-ASTER [49] 2020 MJ+ST 93.8 89.6 92.8 80.0 81.4 83.6 88.2RobustScanner [72] 2020 MJ+ST 95.3 88.1 94.8 77.1 79.5 90.3 88.2PlugNet [42] 2020 MJ+ST 94.4 92.3 95.0 82.2 84.3 85.0 89.8
Our
expe
rim
ent
CRNN-Original [51] 2015 MJ 78.2 80.8 86.7 − − − −CRNN-Baseline-synth MJ+ST 84.3 78.9 88.8 61.5 64.8 61.3 75.8CRNN-Baseline-real Real-L 83.5 75.5 86.3 62.2 60.9 64.7 74.8CRNN-PR Real-L+U 89.8 84.3 90.9 73.1 74.6 82.3 83.4
TRBA-Original [1] 2019 MJ+ST 87.9 87.5 92.3 71.8 79.2 74.0 82.8TRBA-Baseline-synth MJ+ST 92.1 88.9 93.1 74.7 79.5 78.2 85.7TRBA-Baseline-real Real-L 93.5 87.5 92.6 76.0 78.7 86.1 86.6TRBA-PR Real-L+U 94.8 91.3 94.0 80.6 82.7 88.1 89.3
Table 2: Accuracy of STR models on six benchmark datasets. We show the results reported in original papers. We present ourresults of CRNN and TRBA: Reproduced models (Baseline-synth), models trained only on real labels (Baseline-real), and ourbest setting (PR, combination of Pseudo-Label and RotNet). TRBA-PR has a competitive performance with state-of-the-artmodels. MJ, ST, Real-L, and Real-L+U denote MJSynth, SynthText, union of 11 real labeled datasets, and union of 11 reallabeled and 3 unlabeled datasets in Table 1, respectively. In each column, top accuracy is shown in bold.
5.2. Comparison to State-of-the-Art Methods
Table 2 lists the results of state-of-the-art methods andour experiments. For a fair comparison, we list the meth-ods that use only MJ and ST for training, and evaluate sixbenchmarks: IIIT, SVT, IC13-1015, IC15-2077, SP, and CT.
Our reproduced models (Baseline-synth) has higher ac-curacies than in the original paper because we use dif-ferent settings such as larger datasets (8M to 16M forCRNN and 14.4M to 16M for TRBA), different optimizer(Adam instead of AdaDelta [73]), and learning rate schedul-ing. Baseline-real is the model only trained on 11 realdatasets. CRNN-Baseline-real has an accuracy close to thatof CRNN-Synth (74.8% to 75.8%), and TRBA-Baseline-real surpasses TRBA-Synth (86.6% over 85.7%).
TRBA with our best setting (TRBA-PR) trained on onlyreal data has a competitive performance of 89.3% withstate-of-the-art methods. PR denotes the combination ofPseudo-Label and RotNet. PR improves Baseline-real by+8.6% for CRNN and +2.7% for TRBA, and results inhigher accuracy than Baseline-synth. In the following sec-tions, we analyze our best setting with ablation studies.
5.3. Training Only on Real Labeled Data
In this section, we present the results of training STRmodels only on real labeled data.
Accuracy depending on dataset increment Table 1 showsthe increment of real data, and Figure 1 shows the accuracyimprovement. For 2019, when the number of the real train-ing set is 276K, the accuracy of CRNN and TRBA trainedonly on real labeled data is close to that of synthetic data.This indicates that we have enough real labeled data to trainSTR models satisfactorily, although the real labeled data isonly 1.7% of the synthetic data.
These results indicate that we need at least from 146K(Year 2017) to 276K (Year 2019) real data for training STRmodels. However, according to [1], the diversity of the train-ing set can be more important than the number of trainingsets. We use 11 datasets, which denotes high diversity, andthus we cannot simply conclude with “276K is enough.”
To investigate the significance of real data, we also con-duct an experiment that uses only 1.74% of synthetic data(277K images), which is a similar amount to our real data.This results in approximately 10% lower accuracy thanBaseline-real (65.1% vs. 74.8% for CRNN and 75.9% vs.86.6% for TRBA). This indicates that real data is far moresignificant than synthetic data.
6
Augmentation CRNN TRBA
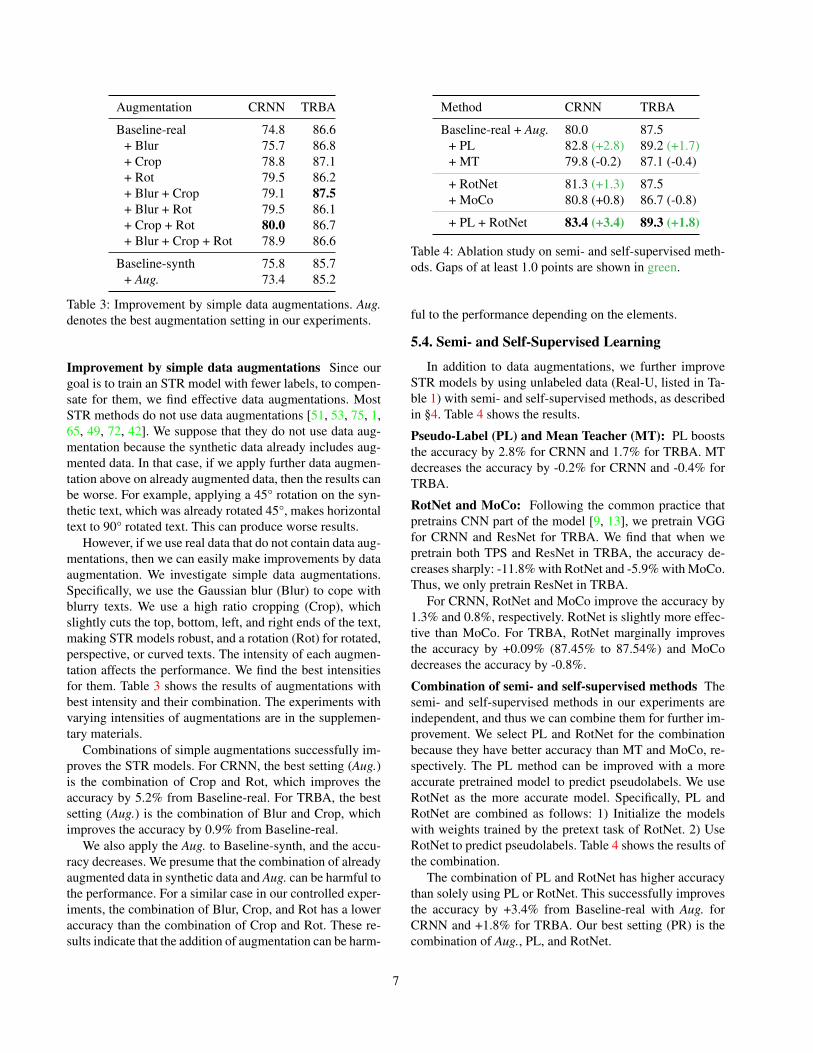
Baseline-real 74.8 86.6+ Blur 75.7 86.8+ Crop 78.8 87.1+ Rot 79.5 86.2+ Blur + Crop 79.1 87.5+ Blur + Rot 79.5 86.1+ Crop + Rot 80.0 86.7+ Blur + Crop + Rot 78.9 86.6
Baseline-synth 75.8 85.7+ Aug. 73.4 85.2
Table 3: Improvement by simple data augmentations. Aug.denotes the best augmentation setting in our experiments.
Improvement by simple data augmentations Since ourgoal is to train an STR model with fewer labels, to compen-sate for them, we find effective data augmentations. MostSTR methods do not use data augmentations [51, 53, 75, 1,65, 49, 72, 42]. We suppose that they do not use data aug-mentation because the synthetic data already includes aug-mented data. In that case, if we apply further data augmen-tation above on already augmented data, then the results canbe worse. For example, applying a 45° rotation on the syn-thetic text, which was already rotated 45°, makes horizontaltext to 90° rotated text. This can produce worse results.
However, if we use real data that do not contain data aug-mentations, then we can easily make improvements by dataaugmentation. We investigate simple data augmentations.Specifically, we use the Gaussian blur (Blur) to cope withblurry texts. We use a high ratio cropping (Crop), whichslightly cuts the top, bottom, left, and right ends of the text,making STR models robust, and a rotation (Rot) for rotated,perspective, or curved texts. The intensity of each augmen-tation affects the performance. We find the best intensitiesfor them. Table 3 shows the results of augmentations withbest intensity and their combination. The experiments withvarying intensities of augmentations are in the supplemen-tary materials.
Combinations of simple augmentations successfully im-proves the STR models. For CRNN, the best setting (Aug.)is the combination of Crop and Rot, which improves theaccuracy by 5.2% from Baseline-real. For TRBA, the bestsetting (Aug.) is the combination of Blur and Crop, whichimproves the accuracy by 0.9% from Baseline-real.
We also apply the Aug. to Baseline-synth, and the accu-racy decreases. We presume that the combination of alreadyaugmented data in synthetic data and Aug. can be harmful tothe performance. For a similar case in our controlled exper-iments, the combination of Blur, Crop, and Rot has a loweraccuracy than the combination of Crop and Rot. These re-sults indicate that the addition of augmentation can be harm-
Method CRNN TRBA
Baseline-real + Aug. 80.0 87.5+ PL 82.8 (+2.8) 89.2 (+1.7)+ MT 79.8 (-0.2) 87.1 (-0.4)
+ RotNet 81.3 (+1.3) 87.5+ MoCo 80.8 (+0.8) 86.7 (-0.8)
+ PL + RotNet 83.4 (+3.4) 89.3 (+1.8)
Table 4: Ablation study on semi- and self-supervised meth-ods. Gaps of at least 1.0 points are shown in green.
ful to the performance depending on the elements.
5.4. Semi- and Self-Supervised Learning
In addition to data augmentations, we further improveSTR models by using unlabeled data (Real-U, listed in Ta-ble 1) with semi- and self-supervised methods, as describedin §4. Table 4 shows the results.
Pseudo-Label (PL) and Mean Teacher (MT): PL booststhe accuracy by 2.8% for CRNN and 1.7% for TRBA. MTdecreases the accuracy by -0.2% for CRNN and -0.4% forTRBA.
RotNet and MoCo: Following the common practice thatpretrains CNN part of the model [9, 13], we pretrain VGGfor CRNN and ResNet for TRBA. We find that when wepretrain both TPS and ResNet in TRBA, the accuracy de-creases sharply: -11.8% with RotNet and -5.9% with MoCo.Thus, we only pretrain ResNet in TRBA.
For CRNN, RotNet and MoCo improve the accuracy by1.3% and 0.8%, respectively. RotNet is slightly more effec-tive than MoCo. For TRBA, RotNet marginally improvesthe accuracy by +0.09% (87.45% to 87.54%) and MoCodecreases the accuracy by -0.8%.
Combination of semi- and self-supervised methods Thesemi- and self-supervised methods in our experiments areindependent, and thus we can combine them for further im-provement. We select PL and RotNet for the combinationbecause they have better accuracy than MT and MoCo, re-spectively. The PL method can be improved with a moreaccurate pretrained model to predict pseudolabels. We useRotNet as the more accurate model. Specifically, PL andRotNet are combined as follows: 1) Initialize the modelswith weights trained by the pretext task of RotNet. 2) UseRotNet to predict pseudolabels. Table 4 shows the results ofthe combination.
The combination of PL and RotNet has higher accuracythan solely using PL or RotNet. This successfully improvesthe accuracy by +3.4% from Baseline-real with Aug. forCRNN and +1.8% for TRBA. Our best setting (PR) is thecombination of Aug., PL, and RotNet.
7

20%(55K)
40%(110K)
60%(166K)
80%(221K)
100%(276K)
Ratio and (amount of real labeled data)
50
60
70
80
90
Acc
urac
y (%
)
TRBA-PRTRBA-Aug.TRBA
CRNN-PRCRNN-Aug.CRNN
Figure 6: Accuracy vs. amount of real labeled data.
5.5. Varying Amount of Real Labeled Data
Although Figure 1 shows the accuracy depending ondataset increment, the results are entangled with two fac-tors: the amount of labeled data and the diversity of datasets.We investigate the effect of the amount of labeled data byproportionally reducing each labeled dataset while main-taining the diversity of datasets (11 datasets). The amountof unlabeled data is fixed. Figure 6 shows the results.
Baseline-real is drastically dropped -13.2% in accuracyfor CRNN and -27.0% for TRBA, with varying data ratiosof 40% to 20%. This shows that an accuracy cliff wouldappear here. When our best augmentation setting (Aug.) isapplied, the accuracy improves fairly, especially with ratiosof 20%, by +13.0% for CRNN and +20.0% for TRBA.
PR with unlabeled data can substitute over 221K labeleddata for CRNN and 110K labeled data for TRBA. CRNN-PR with a ratio of 20% exceeds Baseline-real with a ratioof 100% by 2.0%. TRBA-PR with a ratio of 60% exceedsBaseline-real with a ratio of 100% by 0.4%.
The diversity of datasets can be more important than theamount of labeled data. Comparing the Baseline with ra-tio 40% (110K) to Year 2017 (146K) in Figure 1, while theformer has less data than the latter, the former has higherdiversity than the latter (11 datasets vs. 7 datasets). The for-mer has higher accuracy than the latter: 66.6% vs. 65.1%for CRNN and 78.2% vs. 75.1% for TRBA.
5.6. Training on Both Synthetic and Real Data
In real scenarios, there is a case in which we have largesynthetic data for the general domain and only fewer realdata for the target domain. We investigate if our best setting(PR) is also useful for this case by comparing other options.
Fine-tuning on real data Transfer learning with simplefine-tuning is a feasible option for such a case. We con-
Method Train Data CRNN TRBA
Fine-tuningBaseline-synth MJ+ST 75.8 85.7+ FT Real-L 82.1 90.0+ FT w/PR Real-L+U 76.6 87.5
From scratchBaseline-real Real-L 74.8 86.6Baseline-real Real-L+MJ+ST 79.8 89.1PR Real-L+U 83.4 89.3PR Real-L+U+MJ+ST 84.2 90.0
Table 5: Training on both synthetic and real data.
duct training STR models on large synthetic data (MJ andST, 16M) and then fine-tuning on fewer real data (Real-L,276K) for 40K iterations.
Training from scratch Another option is training STRmodels on both of them from scratch. We use the union of11 real labeled and 2 synthetic datasets as a training set.
Table 5 shows the results. Fine-tuning on real labeleddata improves the accuracy by +6.3% for CRNN and +4.3%for TRBA. Unexpectedly, fine-tuning with PR increases theaccuracy (+0.8% for CRNN and +1.8% for TRBA) but haslower accuracy than fine-tuning only on real labeled data(76.6% vs. 82.1% for CRNN and 87.5% vs. 90.0% forTRBA). This indicates that using semi- and self-supervisedmethods during fine-tuning can be harmful.
PR has higher accuracy than Baseline-real with syntheticdata. This shows that we can substitute the synthetic datawith semi- and self-supervised methods that use unlabeleddata. For CRNN, PR with synthetic data has higher accu-racy than the other settings. This indicates that PR can beuseful for training STR models when both large syntheticdata and fewer real data are available.
6. ConclusionSince STR models have been trained on large synthetic
data, training STR models on fewer real labels (STR withfewer labels) has not been sufficiently studied. In this pa-per, we have focused on STR with fewer labels. STR withfewer labels is considered difficult because there are onlythousands of real data, resulting in low accuracy. However,this is no longer the case. We have shown that public realdata has been accumulated over the years. Although accu-mulated real data is only 1.7% of the synthetic data, we cantrain STR models sufficiently by using it. We have furtherimproved the performance by using simple data augmen-tations and introducing semi- and self-supervised methodswith millions of real unlabeled data. This work is a steppingstone toward STR with fewer labels, and we hope this workwill facilitate future work on this topic.
8
References[1] Jeonghun Baek, Geewook Kim, Junyeop Lee, Sungrae Park,
Dongyoon Han, Sangdoo Yun, Seong Joon Oh, and HwalsukLee. What is wrong with scene text recognition model com-parisons? dataset and model analysis. In ICCV, 2019. 1, 2,4, 5, 6, 7, 13, 14, 15, 18, 19, 20, 21
[2] Dzmitry Bahdanau, Kyunghyun Cho, and Yoshua Bengio.Neural machine translation by jointly learning to align andtranslate. In ICLR, 2015. 4
[3] Ayan Kumar Bhunia, Gautam Kumar, Partha Pratim Roy,R. Balasubramanian, and Umapada Pal. Text recognition inscene image and video frame using color channel selection.Multimedia Tools and Applications, 2017. 13
[4] Ali Furkan Biten, Ruben Tito, Andres Mafla, Lluis Gomez,Marcal Rusinol, Ernest Valveny, CV Jawahar, and Dimosthe-nis Karatzas. Scene text visual question answering. In ICCV,2019. 3
[5] Fred L. Bookstein. Principal warps: Thin-plate splines andthe decomposition of deformations. TPAMI, 1989. 4
[6] Ting Chen, Simon Kornblith, Mohammad Norouzi, and Ge-offrey Hinton. A simple framework for contrastive learningof visual representations. In ICML, 2020. 5
[7] Chee Kheng Chng, Yuliang Liu, Yipeng Sun, Chun Chet Ng,Canjie Luo, Zihan Ni, ChuanMing Fang, Shuaitao Zhang,Junyu Han, Errui Ding, et al. Icdar2019 robust reading chal-lenge on arbitrary-shaped text-rrc-art. In ICDAR, 2019. 3,14
[8] Chee Kheng Ch’ng, Chee Seng Chan, and Chenglin Liu.Total-text: Towards orientation robustness in scene text de-tection. IJDAR, 2020. 3, 4, 14
[9] Spyros Gidaris, Praveer Singh, and Nikos Komodakis. Un-supervised representation learning by predicting image rota-tions. In ICLR, 2018. 5, 7, 18
[10] Alex Graves, Santiago Fernandez, Faustino Gomez, andJurgen Schmidhuber. Connectionist temporal classification:labelling unsegmented sequence data with recurrent neuralnetworks. In ICML, 2006. 4
[11] Alex Graves, Marcus Liwicki, Santiago Fernandez, RomanBertolami, Horst Bunke, and Jurgen Schmidhuber. A novelconnectionist system for unconstrained handwriting recogni-tion. TPAMI, 2009. 4
[12] Ankush Gupta, Andrea Vedaldi, and Andrew Zisserman.Synthetic data for text localisation in natural images. InCVPR, 2016. 2, 12, 15, 19
[13] Kaiming He, Haoqi Fan, Yuxin Wu, Saining Xie, and RossGirshick. Momentum contrast for unsupervised visual rep-resentation learning. In CVPR, 2020. 5, 7, 18
[14] Kaiming He, Xiangyu Zhang, Shaoqing Ren, and Jian Sun.Delving deep into rectifiers: Surpassing human-level perfor-mance on imagenet classification. In ICCV, 2015. 19
[15] Kaiming He, Xiangyu Zhang, Shaoqing Ren, and Jian Sun.Deep residual learning for image recognition. In CVPR,2016. 4
[16] Brian Kenji Iwana, Syed Tahseen Raza Rizvi, SherazAhmed, Andreas Dengel, and Seiichi Uchida. Judging abook by its cover. arXiv:1610.09204, 2016. 3
[17] Max Jaderberg, Karen Simonyan, Andrea Vedaldi, and An-drew Zisserman. Synthetic data and artificial neural net-works for natural scene text recognition. In Workshop onDeep Learning, NeurIPS, 2014. 1, 2, 12, 13
[18] Max Jaderberg, Karen Simonyan, Andrew Zisserman, et al.Spatial transformer networks. In NeurIPS, 2015. 4
[19] Klara Janouskova, Jiri Matas, Lluis Gomez, and DimosthenisKaratzas. Text recognition–real world data and where to findthem. arXiv:2007.03098, 2020. 4, 18, 20
[20] Dimosthenis Karatzas, Lluis Gomez-Bigorda, AnguelosNicolaou, Suman Ghosh, Andrew Bagdanov, Masakazu Iwa-mura, Jiri Matas, Lukas Neumann, Vijay Ramaseshan Chan-drasekhar, Shijian Lu, et al. Icdar 2015 competition on robustreading. In ICDAR, 2015. 2, 3
[21] Dimosthenis Karatzas, Faisal Shafait, Seiichi Uchida,Masakazu Iwamura, Lluis Gomez i Bigorda, Sergi RoblesMestre, Joan Mas, David Fernandez Mota, Jon Almazan Al-mazan, and Lluis Pere De Las Heras. Icdar 2013 robust read-ing competition. In ICDAR, 2013. 2, 3
[22] Diederik P. Kingma and Jimmy Ba. Adam: A method forstochastic optimization. In ICLR, 2015. 5, 19
[23] Ivan Krasin, Tom Duerig, Neil Alldrin, Vittorio Ferrari, SamiAbu-El-Haija, Alina Kuznetsova, Hassan Rom, Jasper Ui-jlings, Stefan Popov, Andreas Veit, Serge Belongie, Vic-tor Gomes, Abhinav Gupta, Chen Sun, Gal Chechik, DavidCai, Zheyun Feng, Dhyanesh Narayanan, and Kevin Mur-phy. Openimages: A public dataset for large-scale multi-label and multi-class image classification. Dataset availablefrom https://github.com/openimages, 2017. 3
[24] Dong-Hyun Lee. Pseudo-label: The simple and effi-cient semi-supervised learning method for deep neural net-works. In Workshop on challenges in representation learn-ing, ICML, 2013. 4, 5, 18
[25] Hui Li, Peng Wang, Chunhua Shen, and Guyu Zhang. Show,attend and read: A simple and strong baseline for irregulartext recognition. In AAAI, 2019. 1, 19, 20
[26] Minghui Liao, Pengyuan Lyu, Minghang He, Cong Yao,Wenhao Wu, and Xiang Bai. Mask textspotter: An end-to-end trainable neural network for spotting text with arbitraryshapes. TPAMI, 2019. 1, 6, 13, 19, 20
[27] Minghui Liao, Baoguang Shi, and Xiang Bai. Textboxes++:A single-shot oriented scene text detector. TIP, 2018. 18
[28] Minghui Liao, Baoguang Shi, Xiang Bai, Xinggang Wang,and Wenyu Liu. Textboxes: A fast text detector with a singledeep neural network. In AAAI, 2017. 18
[29] Tsung-Yi Lin, Michael Maire, Serge Belongie, James Hays,Pietro Perona, Deva Ramanan, Piotr Dollar, and C LawrenceZitnick. Microsoft coco: Common objects in context. InECCV, 2014. 3
[30] Ron Litman, Oron Anschel, Shahar Tsiper, Roee Litman,Shai Mazor, and R Manmatha. Scatter: selective context at-tentional scene text recognizer. In CVPR, 2020. 1, 18, 19,20
[31] Yuliang Liu, Hao Chen, Chunhua Shen, Tong He, LianwenJin, and Liangwei Wang. Abcnet: Real-time scene text spot-ting with adaptive bezier-curve network. In CVPR, 2020. 18
9
[32] Yuliang Liu, Tong He, Hao Chen, Xinyu Wang, Canjie Luo,Shuaitao Zhang, Chunhua Shen, and Lianwen Jin. Explor-ing the capacity of sequential-free box discretization networkfor omnidirectional scene text detection. arXiv:1912.09629,2019. 3, 15
[33] Yuliang Liu, Lianwen Jin, Shuaitao Zhang, Canjie Luo, andSheng Zhang. Curved scene text detection via transverseand longitudinal sequence connection. Pattern Recognition,2019. 3
[34] Yuliang Liu, Sheng Zhang, Lianwen Jin, Lele Xie, YaqiangWu, and Zhepeng Wang. Omnidirectional scene text detec-tion with sequential-free box discretization. In IJCAI, 2019.15
[35] Shangbang Long and Cong Yao. Unrealtext: Synthe-sizing realistic scene text images from the unreal world.arXiv:2003.10608, 2020. 14
[36] Xinghua Lou, Ken Kansky, Wolfgang Lehrach, CC Laan,Bhaskara Marthi, D. Phoenix, and Dileep George. Gener-ative shape models: Joint text recognition and segmentationwith very little training data. In NeurIPS, 2016. 13
[37] Simon M Lucas, Alex Panaretos, Luis Sosa, Anthony Tang,Shirley Wong, and Robert Young. Icdar 2003 robust readingcompetitions. In ICDAR, 2003. 4
[38] Mario Lucic, Michael Tschannen, Marvin Ritter, XiaohuaZhai, Olivier Bachem, and Sylvain Gelly. High-fidelity im-age generation with fewer labels. In ICML, 2019. 4
[39] Anand Mishra, Karteek Alahari, and CV Jawahar. Scene textrecognition using higher order language priors. In BMVC,2012. 2, 3
[40] Anand Mishra, Karteek Alahari, and CV Jawahar. Enhanc-ing energy minimization framework for scene text recogni-tion with top-down cues. Computer Vision and Image Un-derstanding, 2016. 13
[41] Takeru Miyato, Shin-ichi Maeda, Masanori Koyama, andShin Ishii. Virtual adversarial training: a regulariza-tion method for supervised and semi-supervised learning.TPAMI, 2018. 4
[42] Yongqiang Mou, Lei Tan, Hui Yang, Jingying Chen, LeyuanLiu, Rui Yan, and Yaohong Huang. Plugnet: Degrada-tion aware scene text recognition supervised by a pluggablesuper-resolution unit. In ECCV, 2020. 1, 6, 7, 13, 20
[43] Nibal Nayef, Yash Patel, Michal Busta, Pinaki Nath Chowd-hury, Dimosthenis Karatzas, Wafa Khlif, Jiri Matas, Uma-pada Pal, Jean-Christophe Burie, Cheng-lin Liu, et al. Ic-dar2019 robust reading challenge on multi-lingual scene textdetection and recognition—rrc-mlt-2019. In ICDAR, 2019.3
[44] Nibal Nayef, Fei Yin, Imen Bizid, Hyunsoo Choi, YuanFeng, Dimosthenis Karatzas, Zhenbo Luo, Umapada Pal,Christophe Rigaud, Joseph Chazalon, et al. Icdar2017 ro-bust reading challenge on multi-lingual scene text detectionand script identification-rrc-mlt. In ICDAR, 2017. 4
[45] Aaron van den Oord, Yazhe Li, and Oriol Vinyals. Rep-resentation learning with contrastive predictive coding.arXiv:1807.03748, 2018. 5, 18
[46] Adam Paszke, Sam Gross, Francisco Massa, Adam Lerer,James Bradbury, Gregory Chanan, Trevor Killeen, Zeming
Lin, Natalia Gimelshein, Luca Antiga, Alban Desmaison,Andreas Kopf, Edward Yang, Zachary DeVito, Martin Rai-son, Alykhan Tejani, Sasank Chilamkurthy, Benoit Steiner,Lu Fang, Junjie Bai, and Soumith Chintala. Pytorch: An im-perative style, high-performance deep learning library. InNeurIPS, 2019. 19
[47] Yash Patel, Tomas Hodan, and Jiri Matas. Learning surro-gates via deep embedding. In ECCV, 2020. 18
[48] Trung Quy Phan, Palaiahnakote Shivakumara, ShangxuanTian, and Chew Lim Tan. Recognizing text with perspec-tive distortion in natural scenes. In ICCV, 2013. 2
[49] Zhi Qiao, Yu Zhou, Dongbao Yang, Yucan Zhou, and Weip-ing Wang. Seed: Semantics enhanced encoder-decoderframework for scene text recognition. In CVPR, 2020. 1,6, 7, 13, 20
[50] Anhar Risnumawan, Palaiahankote Shivakumara, Chee SengChan, and Chew Lim Tan. A robust arbitrary text detectionsystem for natural scene images. ESWA, 2014. 2
[51] Baoguang Shi, Xiang Bai, and Cong Yao. An end-to-endtrainable neural network for image-based sequence recogni-tion and its application to scene text recognition. TPAMI,2016. 1, 2, 4, 6, 7, 13, 18, 21
[52] Baoguang Shi, Xinggang Wang, Pengyuan Lyu, Cong Yao,and Xiang Bai. Robust scene text recognition with automaticrectification. In CVPR, 2016. 18
[53] Baoguang Shi, Mingkun Yang, Xinggang Wang, PengyuanLyu, Cong Yao, and Xiang Bai. Aster: An attentional scenetext recognizer with flexible rectification. TPAMI, 2018. 1,5, 6, 7, 13, 18, 19, 20, 21
[54] Baoguang Shi, Cong Yao, Minghui Liao, Mingkun Yang, PeiXu, Linyan Cui, Serge Belongie, Shijian Lu, and Xiang Bai.Icdar2017 competition on reading chinese text in the wild(rctw-17). In ICDAR, 2017. 3
[55] Karen Simonyan and Andrew Zisserman. Very deep convo-lutional networks for large-scale image recognition. In ICLR,2015. 4
[56] Amanpreet Singh, Vivek Natarajan, Meet Shah, Yu Jiang,Xinlei Chen, Dhruv Batra, Devi Parikh, and MarcusRohrbach. Towards vqa models that can read. In CVPR,2019. 3
[57] Leslie N. Smith and Nicholay Topin. Super-convergence:very fast training of neural networks using large learningrates. AI/ML for MDO, 2019. 5, 19
[58] Nitish Srivastava, Geoffrey Hinton, Alex Krizhevsky, IlyaSutskever, and Ruslan Salakhutdinov. Dropout: a simple wayto prevent neural networks from overfitting. JMLR, 2014. 21
[59] Yipeng Sun, Jiaming Liu, Wei Liu, Junyu Han, Errui Ding,and Jingtuo Liu. Chinese street view text: Large-scale chi-nese text reading with partially supervised learning. In ICCV,2019. 3
[60] Yipeng Sun, Zihan Ni, Chee-Kheng Chng, Yuliang Liu, Can-jie Luo, Chun Chet Ng, Junyu Han, Errui Ding, Jingtuo Liu,Dimosthenis Karatzas, et al. Icdar 2019 competition onlarge-scale street view text with partial labeling-rrc-lsvt. InICDAR, 2019. 3
[61] Antti Tarvainen and Harri Valpola. Mean teachers are betterrole models: Weight-averaged consistency targets improve
10

semi-supervised deep learning results. In NeurIPS, 2017. 4,5, 18
[62] Andreas Veit, Tomas Matera, Lukas Neumann, Jiri Matas,and Serge Belongie. Coco-text: Dataset and bench-mark for text detection and recognition in natural images.arXiv:1601.07140, 2016. 3
[63] Zhaoyi Wan, Mingling He, Haoran Chen, Xiang Bai, andCong Yao. Textscanner: Reading characters in order for ro-bust scene text recognition. In AAAI, 2020. 1, 6, 13, 19,20
[64] Kai Wang, Boris Babenko, and Serge Belongie. End-to-endscene text recognition. In ICCV, 2011. 2, 3
[65] Tianwei Wang, Yuanzhi Zhu, Lianwen Jin, Canjie Luo, Xi-aoxue Chen, Yaqiang Wu, Qianying Wang, and MingxiangCai. Decoupled attention network for text recognition. InAAAI, 2020. 1, 6, 7, 13, 20
[66] Wenjia Wang, Enze Xie, Xuebo Liu, Wenhai Wang, DingLiang, Chunhua Shen, and Xiang Bai. Scene text imagesuper-resolution in the wild. In ECCV, 2020. 1
[67] Zhirong Wu, Yuanjun Xiong, Stella X Yu, and Dahua Lin.Unsupervised feature learning via non-parametric instancediscrimination. In CVPR, 2018. 5
[68] Xing Xu, Jiefu Chen, Jinhui Xiao, Lianli Gao, Fumin Shen,and Heng Tao Shen. What machines see is not what they get:Fooling scene text recognition models with adversarial textimages. In CVPR, 2020. 18
[69] Xing Xu, Jiefu Chen, Jinhui Xiao, Zheng Wang, Yang Yang,and Heng Tao Shen. Learning optimization-based adversar-ial perturbations for attacking sequential recognition models.In ACMMM, 2020. 18
[70] Mingkun Yang, Yushuo Guan, Minghui Liao, Xin He, KaiguiBian, Song Bai, Cong Yao, and Xiang Bai. Symmetry-constrained rectification network for scene text recognition.In ICCV, 2019. 1, 6, 13, 19, 20
[71] Deli Yu, Xuan Li, Chengquan Zhang, Tao Liu, Junyu Han,Jingtuo Liu, and Errui Ding. Towards accurate scene textrecognition with semantic reasoning networks. In CVPR,2020. 1
[72] Xiaoyu Yue, Zhanghui Kuang, Chenhao Lin, Hongbin Sun,and Wayne Zhang. Robustscanner: Dynamically enhancingpositional clues for robust text recognition. In ECCV, 2020.1, 6, 7, 13, 19, 20
[73] Matthew D Zeiler. Adadelta: an adaptive learning ratemethod. arXiv:1212.5701, 2012. 6, 19
[74] Xiaohua Zhai, Avital Oliver, Alexander Kolesnikov, and Lu-cas Beyer. S4l: Self-supervised semi-supervised learning. InICCV, 2019. 4
[75] Fangneng Zhan and Shijian Lu. Esir: End-to-end scene textrecognition via iterative image rectification. In CVPR, 2019.1, 6, 7, 13, 20
[76] Jinjin Zhang, Wei Wang, Di Huang, Qingjie Liu, and Yun-hong Wang. A feasible framework for arbitrary-shaped scenetext recognition. arXiv:1912.04561, 2019. 13
[77] Rui Zhang, Yongsheng Zhou, Qianyi Jiang, Qi Song, Nan Li,Kai Zhou, Lei Wang, Dong Wang, Minghui Liao, MingkunYang, et al. Icdar 2019 robust reading challenge on readingchinese text on signboard. In ICDAR, 2019. 3
[78] Ying Zhang, Lionel Gueguen, Ilya Zharkov, Peter Zhang,Keith Seifert, and Ben Kadlec. Uber-text: A large-scaledataset for optical character recognition from street-level im-agery. In Scene Understanding Workshop, CVPR, 2017. 3,4
11

Supplementary Material
A. ContentsSupplement B : Needs for STR with Fewer Real Labels
• We complement the needs for STR with fewer real la-bels by illustrating the detailed examples.
Supplement C : STR Datasets - Details and More Exam-ples
• We describe the detail of preprocessing in §3 and showmore examples of public real data.
Supplement D : STR With Fewer Labels - Details• We describe the details of STR models and semi- and
self-supervised methods in §4.
Supplement E : Experiment and Analysis - Details• We provide the details and comprehensive results of
our experiments in §5.
B. Needs for STR with Fewer Real LabelsIn this section, we complement the necessity of training
STR models only on fewer real labels (STR with fewer la-bels). The study of STR with fewer labels generally aims toexploit a few real labels efficiently. We describe the detailedexamples of two needs as mentioned in §1, and introducean additional need based on our experimental results.
Need #1: To recognize handwritten or artistic data inpublic real datasets Figure 7 shows the handwritten orartistic data in public real datasets. It is difficult to generatethem with the current synthetic engine [17, 12]. If we haveappropriate handwritten fonts, we can generate similar textswith handwritten texts synthetically and cover some of thehandwritten texts. However, because the number of fonts(about thousands) is quite lower than the number of people,there can still be uncovered handwritten texts by handwrit-ten fonts. Furthermore, generating artistic texts with hand-written fonts is difficult: artistic texts such as text logo andcalligraphy as shown in Figure 7.
In this case, exploiting the few real data of them can bemore efficient rather than generating synthetic data close tothem. Namely, we need STR with fewer labels in this case.Figure 8 shows the predictions by trained models (TRBA-Baseline-real and -synth) in our experiments. The modeltrained with real data (Real) has better performance thanthat with synthetic data (Synth). These results show that ex-ploiting real data can be useful for these types of texts.
Need #2: To recognize language other than English(LOTE) without synthetic data In the other case, whenwe have to recognize LOTE, there are not always syntheticdata for LOTE. For such a case, we should recognize LOTEwithout synthetic data or generate synthetic data.
(a) Examples from benchmark datasets for evaluation.
(b) Examples from real datasets other than benchmark datasets.
Figure 7: Handwritten or artistic texts in public real data.
GT : LaughReal : LaughSynth: LughGT : ExcitingReal : ExCitingSynth: Esciting
GT : CocaColaReal : Coca-ColaSynth: (ccaloola.
GT : CafeReal : CafeSynth: Gaf
Figure 8: Predictions on handwritten or artistic texts. GT,Real, and Synth denote the ground truth, the predictionof TRBA-Baseline-real, and TRBA-Baseline-synth, respec-tively.
However, generating appropriate synthetic data forLOTE is difficult for those who do not know target lan-guages. When we generate synthetic data, we should pre-pare at least three elements: 1) Word vocabulary (word cor-pus or lexicon). 2) Characters that compose words. 3) Fontto render words. However, for people who do not knowLOTE, preparing three elements for LOTE is difficult; diffi-cult to decide appropriate words, characters, and fonts. Inaddition, some languages have specific rules to generatetheir languages. For example, Arabic texts have two differ-ent features from English: 1) They are written from right toleft. 2) Some of the Arabic characters change their shapedepending on their surrounding characters. These factorsmake generating synthetic data of Arabic difficult for thosewho do not know Arabic.
In this case, when we have to recognize LOTE but gen-erating synthetic data for LOTE is difficult, we need toachieve competitive performance with a few real labels.
Need #3: Current public synthetic data can be in-appropriate to datasets other than STR benchmarkdatasets In addition to evaluation on benchmark datasetsin §5.2, we also evaluate the other seven datasets: COCO,RCTW, Uber, ArT, LSVT, MLT19, and ReCTS. Table 6shows the results. Baseline-real has higher accuracy thanBaseline-synth (Avg. 58.0% vs. 52.3% for CRNN and69.2% vs. 60.4% for TRBA). Our best setting PR success-
12

Model: CRNN Model: TRBAMethod COCO RCTW Uber ArT LSVT MLT19 ReCTS Avg. COCO RCTW Uber ArT LSVT MLT19 ReCTS Avg.
Baseline-synth 37.4 50.3 32.1 48.1 50.3 74.6 73.6 52.3 50.2 59.1 36.7 57.6 58.0 80.3 80.6 60.4Baseline-real 46.3 54.3 45.8 48.1 58.6 78.2 74.7 58.0 62.7 67.7 52.7 63.2 68.7 85.8 83.4 69.2PR 56.6 61.1 44.8 58.7 62.2 82.5 80.9 63.8 66.9 71.5 54.2 66.7 73.5 87.8 85.6 72.3
Table 6: Accuracy of seven evaluation datasets: COCO, RCTW, Uber, ArT, LSVT, MLT19, and ReCTS. Avg. denotes theaveraged accuracies of seven datasets. The number of evaluation sets of each datasets is described in Table 7.
fully improve Baseline-real (Avg. +5.8% for CRNN and+3.1% for TRBA). These results indicate that fewer realdata (Real-L) can be more appropriate to evaluation setsof these seven datasets, rather than current synthetic data(MJ+ST). We presume that because some of the fewer realdata (Real-L) derive from the same domain with evaluationsets of seven datasets, Baseline-real has higher accuracy.Namely, using only fewer real data collected from the targetdomain can be more significant than using large syntheticdata from the other domain. This indicates that studies onSTR with fewer labels are necessary, fully exploiting fewreal data derived from the target domain.
Detailed survey of the literatures of STR with fewer reallabels As mentioned in §1, after emerging large syntheticdata [17](2014), the study of STR with fewer labels has de-creased. Thus, there are only a few studies on STR withfewer labels for five years. Searching for studies on STRwith fewer labels is difficult. In this work, we struggle tosearch for studies on STR with fewer labels via the widely-used search engine: Arxiv Sanity3.
Specifically, we search studies with query “text recogni-tion” from 2016 to 2020. The number of searched papersis 131 papers. We manually check the contents of all ofthem, and find four papers related to STR with fewer la-bels; they only use real data rather than synthetic data. Threeof them are published three or four years ago, and do notuse deep learning based methods; Mishra et al. [40](2016)uses the conditional random field model and support vectormachine. Lou et al. [36](2016) uses the generative shapemodel and support vector machine. Bhunia et al. [3](2017)uses the hidden Markov model and support vector machine.However, it is difficult to compare them with recent state-of-the-art methods. Because their evaluation data are differ-ent from the recent STR benchmark: they all do not eval-uate on IC15, SP, and CT. In addition, they use lexiconsfor calculating accuracy. In general, the accuracy calcu-lated with the lexicon has higher accuracy than the one cal-culated without the lexicon. Thus, comparing them is un-fair. Recent state-of-the-art methods present both accura-cies calculated with lexicons and calculated without lexi-cons [51, 53, 75, 26, 70, 63] or do not present the accuracycalculated with lexicons [1, 65, 49, 72, 42]. Therefore, the
3http://www.arxiv-sanity.com/
former can be compared with the three methods [40, 36, 3]but the latter cannot. The process of using lexicon to cal-culate accuracy is as follows: 1) IIIT, SVT, and SP havepredefined lexicons which contain a target word and somecandidate words. 2) Transform the output word from themodel into the closet word in predefined lexicons. 3) Calcu-late accuracy between transformed one and the target word.
Another paper uses deep learning based meth-ods [76](2019). The paper addresses recognizing Englishand Chinese texts. However, strictly speaking, the paperdescribes scene text spotting (STS), which is the com-bination of scene text detection (STD) and STR, ratherthan sole STR. Because they do not describe the result ofSTR in their paper, it is difficult to compare their methodwith other STR methods. From the results of STS, we canpresume that their detector has great performance but theirrecognizer has a less competitive performance to otherEnglish STR methods. Because they won 1st for STS inthe ArT competition (English only), but they recorded15th of 23 teams for STR in the ArT competition (Englishonly)4. However, this is not a concrete comparison but onlyour presumption. We need the results on STR benchmarkdatasets rather than the results of STS to compare theirmethod with other STR methods.
It is currently difficult to search for studies on STR withfewer labels and compare those studies with state-of-the-artmethods. We hope that our study becomes the appropriatestudy on STR with fewer labels that can be easily searchedand compared.
4https://rrc.cvc.uab.es/?ch=14&com=evaluation&task=2
13

C. STR Datasets - Details and More ExamplesIn this section, we describe the details of our preprocess-
ing process in §3. Furthermore, we illustrate more examplesof real data.
C.1. Preprocessing Real Datasets
Consolidating real datasets We collect SVT and IIIT fromtheir web page5,6. However, the labels of training set of SVTand IIIT are case-insensitive; they are all uppercase alpha-bet. We use case sensitive data of SVT and IIIT corrected by[35]7. We collect IC13, IC15, COCO, ArT, LSVT, MLT19,and ReCTS from the web page of ICDAR competition8. Wedownload RCTW and Uber from their web page9,10.
Excluding duplication between datasets If we do notpay attention the duplication between datasets, we mightuse the training set that includes some of the evaluation set.To avoid this duplication, we investigate the duplication be-tween all training set and all evaluation set. Specifically, weinvestigate whether the scene images of training sets matchthe scene images of evaluation sets. As a result, we find thatthe training set of Art and the evaluation set of CT have 27duplicated scene images and 122 duplicated word boxes, asshown in Figure 9. We exclude them for a fair comparison.The journal version paper of Total-Text [8] indicates thatsome of the word boxes in Total-Text are duplicated in CT.ArT includes Total-Text, and therefore some of the wordboxes in ArT can be also duplicated in CT. However, we donot know how many Total-Text images are in the trainingset of ArT. Thus, we investigate the duplicated word boxesby comparing scene images of ArT and CT. For another ex-ample, according to [1], 215 word boxes are duplicated inthe training set of IC03 and the evaluation set of IC13. Thisis one of the reasons why we exclude IC03; the other reasonis that IC13 inherits most of IC03 data.
According to [7], ArT includes the subset of LSVT. Wecannot find duplicated images by matching scene imagesbecause they are slightly different, as shown in Figure 10.In this case, we investigate duplication by matching labelsof scene images. As a result, we find that the training setof Art and the training set of LSVT have 814 similar sceneimages (433 scene images for English) and 4,578 similarword boxes (861 word boxes for English).
However, since labels of scene images for the evalua-tion set of ArT and LSVT are not provided, we cannot find
5http://vision.ucsd.edu/ kai/svt/6https://cvit.iiit.ac.in/research/projects/cvit-projects/the-iiit-5k-word-
dataset7https://github.com/Jyouhou/Case-Sensitive-Scene-Text-Recognition-
Datasets8https://rrc.cvc.uab.es/9https://rctw.vlrlab.net/dataset
10https://s3-us-west-2.amazonaws.com/uber-common-public/ubertext/index.html
Figure 9: Duplicated scene images. These images are foundin both the training set of ArT and the evaluation set of CT.
(a) Image from ArT (b) Image from LSVT
Figure 10: Similar scene images. These images are foundin both training sets of ArT and LSVT. They are differentimages but contain the same texts; the text regions of ArTare usually more enlarged than LSVT.
duplication by matching labels of scene images. Thus, it isdifficult to exclude the duplication between the evaluationset of ArT and the training set of LSVT. If there are dupli-cated images between them, comparing the accuracy of ArTbetween a method that uses the training set of LSVT and an-other method that does not use the training set of LSVT canbe unfair.
In the case of evaluation on LSVT, in our experiments,we split the training set of LSVT into training, validation,and evaluation set. We exclude the duplicated word boxesbetween the training set of ArT and the evaluation set (aftersplitting) of LSVT; exclude 74 word boxes in the evaluationset of LSVT. In our experiments, we would like to use morereal data for training and validation; thus, we exclude theduplicated word boxes in the evaluation set of LSVT ratherthan exclude training and validation sets of ArT.
Collecting only English words In this study, we takeonly English and symbols. Specifically, we exclude Chinesecharacters in RCTW, ArT, LSVT, and ReCTS. For MLT, allword labels have “a script label” representing the languageof each word label. We exclude the words whose script labelis Arabic, Chinese, Japanese, Korean, Bangla, or Hindi.
Excluding don’t care symbol Don’t care symbol “*” or“#” is usually included in recent public real data: RCTW,Uber, ArT, LSVT, MLT19, and ReCTS. We do not conductthis filtering on SVT, IIIT, IC13, IC15, and COCO.
We do not exclude the texts contains “#” symbol. In-stead, we only exclude the texts is “#”, “##”, “###”, or“####”. Therefore, we can train “#” symbol with other char-acters. In the case of MLT19, we only exclude the texts is
14

“###” or “####”.In contrast to “#” symbol, we exclude the image whose
label contains “*” symbol in Uber. About half of Uber im-ages (149K of 285K training images) contain “*” symbol.Although some of them are sufficiently readable, they con-tain “*” symbol. Thus, we exclude them because they canbe the noise of data.
Excluding vertical or ± 90 degree rotated texts As de-scribed in §3.3, we mainly focus on horizontal texts andthus exclude vertical texts. For the characters such as “1, i,j, l, t” and the words such as “it”, their height usually aregreater than their width. To avoid excluding these charac-ters and words, we only exclude images whose texts havemore than two characters and whose height is greater thanthe width.
Splitting each real dataset into training, validation, andevaluation sets Table 7 shows whether each dataset orig-inally has training, validation, and evaluation sets. Somedatasets do not have them, and thus we split the trainingset of the dataset. For example, RCTW, LSVT, and MLT19only have a training set. Thus we split the training set ofeach dataset into training, validation, and evaluation setswith ratios of 80%, 10%, and 10%, respectively. The evalu-ation sets of RCTW, LSVT, and MLT19 have been released,but the evaluation sets only contain images and do not con-tain labels. Therefore, we cannot evaluate their evaluationsets, and thus RCTW, LSVT, and MLT19 are considerednot to have the evaluation set.
In the other case, SVT, IIIT, IC13, IC15, ArT, andReCTS do not have a validation set, and thus we split thetraining set of each dataset into training and validation setswith ratios of 90% and 10%, respectively.
COCO and Uber originally have training, validation, andevaluation sets. Thus we use their original training, valida-tion, and evaluation sets. We do not split their training sets.
Table 7 shows the number of word boxes used in ourexperiments. The number is calculated as follows: 1) Con-duct preprocessing on the training set of each dataset as de-scribed in §3.3 and §C.1. 2) Following the base code [1],exclude the images whose texts have more than 25 charac-ters in our experiments.
Detector for cropping texts in unlabeled scene im-ages Unlabeled datasets described in §3.2 contain sceneimages. The scene images do not have labels indicatingtext region. Therefore, we use pretrained scene text detec-tion (STD) model for cropping texts in the scene images.In this paper, we assume the case when we have to trainSTR models without synthetic data. In this case, we cannottrain STD model with synthetic data, and thus we use STDmodel trained only on real data, called BDN [32]. BDN hastwo versions; 1) BDN published in IJCAI [34] use syntheticdata (ST [12]) for training. 2) BDN used for ReCTS com-
Check for inclusion # of word boxes
Dataset Train. Valid. Eval. Train. Valid. Eval.
Real labeled datasets (Real-L)SVT X − X 231 25 647IIIT X − X 1,794 199 3,000IC13 X − X 763 84 1,015IC15 X − X 3,710 412 2,077COCO X X X 39K 9,092 9,823RCTW X − − 8,186 1,026 1,029Uber X X X 92K 36K 80KArT X − X 29K 3,202 35KLSVT X − − 34K 4,184 4,133MLT19 X − − 46K 5,689 5,686ReCTS X − X 23K 2,531 2,592Total − − − 276K 63K 146K
Table 7: Number of word boxes used in our experiments,after splitting each real dataset into training, validation, andevaluation sets.
petition [32] do not use synthetic data. We use the secondone for cropping texts in unlabeled scene images.
C.2. More Examples of Public Real Data
Recently, various types of texts have been accumu-lated. They can improve the robustness of STR models. Wepresent more examples of public real data. Figure 11 showsthe examples of benchmark datasets for evaluation, as de-scribed in §2.2. Figure 12, 13, and 14 are the extended ver-sions of Figure 3 in §3. Figure 12 shows examples of ac-cumulated real labeled data for Year 2011, 2013, and 2015.Figure 13, and 14 show examples of that of Year 2017 and2019, respectively. Figure 15 shows examples of unlabeledscene images and word boxes after cropping.
15

(a) SVT (b) IIIT (c) IC13
(d) IC15 (e) SP (f) CT
Figure 11: Examples of benchmark datasets for evaluation. SVT, IIIT, and IC13 are regarded as regular datasets. They containmany horizontal texts. IC15, SP, and CT are regarded as irregular dataets. They contain many perspective or curved texts.
(a) Year 2011: SVT (b) Year 2013: IIIT
(c) Year 2013: IC13 (d) Year 2015: IC15
Figure 12: Examples of public real datasets for Year 2011 (SVT), Year 2013 (IIIT and IC13), and Year 2015 (IC15). SVT,IIIT, and IC13 contains many horizontal texts. IC15 contains many perspective or blurry texts.
(a) COCO contains many occluded or low-resolution texts.
(b) RCTW: Most images are collected in China. (c) Uber contains many house number or signboard texts.
Figure 13: Examples of public real datasets for Year 2017: COCO, RCTW, and Uber.
16
(a) ArT contains many arbitrary-shaped texts: rotated, perspective or curved texts.
(b) LSVT is collected from streets in China.
(c) MLT19 is collected to recognize multi-lingual texts.
(d) ReCTS contains texts arranged in various layouts or texts written in difficult fonts.
Figure 14: Examples of public real datasets for Year 2019: ArT, LSVT, MLT19, and ReCTS.
(a) Book32: scene images. (b) TextVQA: scene images. (c) ST-VQA: scene images.
(d) Book32: word boxes after cropping. (e) TextVQA: word boxes after cropping. (f) ST-VQA: word boxes after cropping.
Figure 15: Examples of unlabeled datasets: Book32, TextVQA, and ST-VQA. We show their scene images and word boxesafter cropping.
17

D. STR With Fewer Labels - DetailsWe describe more details of STR models and semi- and
self-supervised learning in §4.
D.1. Description of STR Models
We select two models in order to represent that our ex-perimental results are not limited to a specific STR model.We adopt two widely-used STR models in STR benchmarkrepository [1]11: CRNN [51] and TRBA [1].
CRNN, the abbreviation of Convolutional-RecurrentNeural Network, is the first model that combines convo-lutional neural networks (CNNs) and recurrent neural net-works (RNNs) for STR. CRNN is regarded as a basicand lightweight STR model. Thus, CRNN is usually se-lected as one of the baseline models. Also, CRNN is some-times adopted to the STR part of scene text spotting thatis the combination of scene text detection and recogni-tion [28, 27, 31]. CRNN consists of 7 layers of VGG-likeCNNs, 2 layers of BiLSTM, and CTC decoder.
TRBA, the abbreviation of TPS-ResNet-BiLSTM-Attention, has the best performance in STR benchmarkrepository [1]. TRBA is also usually selected as one ofthe baseline models [30, 68, 19, 47, 69]. TRBA consistsof 4 layers of CNNs for TPS, 29 layers of ResNet, 2 lay-ers of BiLSTM, and an attention decoder. According to [1],TRBA is created by composing existing modules used inprior works. Thus, TRBA can be regarded as a variant ofRARE [52]. RARE is a well-known architecture that intro-duces an image transformation module into STR models.The main differences between TRBA and RARE are as fol-lows: TRBA uses 1) ResNet instead of VGG-like CNNs.2) BiLSTM instead of GRU. TRBA can be also regardedas a variant of another widely-used baseline model calledASTER [53] because ASTER is the successor of RARE.The main differences between TRBA and ASTER are asfollows: 1) Details of TPS. 2) ASTER uses a bidirectionalattention decoder.
D.2. Objective Function
We use labeled training setDl = {(x1, y1), ..., (xn, yn)}and unlabeled training set Du = {u1, ..., um} to calculateobject function, where x is the labeled training image, y isthe word label, and u is the unlabeled training image.
Objective function for STR STR models are trained byminimizing the objective function as follows,
Lrecog = − 1
|Dl|∑
(x,y)∈Dl
log p(y|x) (1)
where p(y|x) is the conditional probability of word label.
11https://github.com/clovaai/deep-text-recognition-benchmark
Objective function for semi-supervised learning Pseudo-Label (PL) [24] uses pseudolabeled training set Ds ={(u1, s1), ..., (um, sm)} for training, where s is the pseu-dolabel of u. The object function of PL calculated as fol-lows,
L = Lrecog −1
|Ds|∑
(u,s)∈Ds
log p(s|u) (2)
where p(s|u) is the conditional probability of the pseudola-bel.
Mean Teacher (MT) [61] uses the object function as fol-lows,
L = Lrecog+α1
|Dl|+ |Du|∑[x;u]
MSE(fθ([x;u]η), fθ′([x;u]
η′))
(3)where [x;u] denotes the concatenation of x and u. η andη′ denote two random augmentations. [x;u]η and [x;u]η
′
are the images augmented by η and η′, respectively. MSEdenotes the mean squared error, fθ is the student model, fθ′is the teacher model, and α is coefficient of MSE loss.
Objective function for self-supervised learning The pre-text task of RotNet [9] is conducted by minimizing the ob-jective function as follows,
LRot = −1
|R|1
|Du|∑r∈R
∑u∈Du
log p(r|ur) (4)
where R is the set of four rotation degrees{0◦, 90◦, 180◦, 270◦}, p(r|ur) is the conditional prob-ability of rotation degree, and ur is the unlabeled imageu rotated by r. This objective function conducts 4-classclassification.
Following the authors of MoCo [13], we calculate in-foNCE [45]. For each mini-batch, we obtain queries q andkeys k as described in §4.3. For each pair of a query q anda key k, we consider that the key is positive if they de-rive from the same image, otherwise negative. MoCo usesa dictionary that contains negative keys. The dictionary is aqueue that enqueues keys from the current mini-batch anddequeues keys from the oldest mini-batch. The dictionarysizeK is generally much larger than the batch size. For eachquery q, we calculate the object function as follows,
Lq = − logexp(q>kpos/τ)∑Ki=0 exp(q
>ki/τ)(5)
where τ is the temperature value, kpos is the positivekey. This object function conducts (K+1)-way classifica-tion with the softmax function on K negative keys and 1positive key.
E. Experiment and Analysis - DetailsWe show more details of our implementation and the ex-
tended version of our experiments.
18

Setting Description
Baseline-synth Model trained on 2 synthetic datasets (MJ+ST)Baseline-real Model trained on 11 real datasets (Real-L)Aug. Best augmentation setting in our experimentsPR Combination of Aug., PL and RotNet
Table 8: Description of our experimental settings.
E.1. Implementation Detail
In this section, we describe common factors in our exper-iments. Specific factors of each experiment are described atthe beginning of each experiment.
Description of our settings Table 8 shows the descriptionof our main experimental settings.
Training strategy Input images are resized into 32× 100.We use He’s initialization method [14] and gradient clip-ping at magnitude 5. The maximum word length is 25.
We use 94 characters for prediction, same with [53]:26 upper case alphabets, 26 lower case alphabets, 10 dig-its, and 32 ASCII punctuation marks. In addition, 3 specialtokens are added: “[PAD]” for padding, “[UNK]” for un-known character, and “ ” for space between characters. ForCTC decoder, “[CTCblank]” token is also added. For atten-tion mechanism, “[SOS]” and “[EOS]”, which denote thestart and end of sequence, are added.
As shown in Table 7, the number of training set is imbal-ance. To handle data imbalance, we sample the same num-ber of data from each dataset to make a mini-batch. For ex-ample, when we use 11 datasets for training, we sample 12images (= round(128/11)) per dataset to make a mini-batch.As a result, the batch size slightly changes depending on thenumber of datasets for training. However, the difference ismarginal in our experiments and thus we use the balancedmini-batch. We also use the balanced mini-batch for threeunlabeled datasets: 43 images (= round(128/3)) per datasetto make a mini-batch.
Evaluation metric As described in §5.1, the word-level ac-curacy is calculated only on the alphabet and digits. Follow-ing common practice [53], the accuracy is calculated onlyon alphabet and digits, after removing non-alphanumericcharacters and normalizing alphabet to lower case.
Differences from the base code [1] We use the code ofthe STR benchmark repository as our base code. The codeused in the STR benchmark is different from our settings:We use 1) All text in ST (7M) while the base code usesonly alphanumeric texts in ST (5.5M), 2) Adam [22] insteadof Adadelta [73], 3) An one-cycle learning rate schedul-ing [57], 4) Batch size reduced from 192 to 128, 5) Up-per/lower case alphabets, digits, and some symbols (94characters in total) for training while the base code useslower case alphabets and digits (36 characters in total) fortraining, 6) The balanced mini-batch. This is not used for
STR benchmark paper. 7) The CTCLoss from the PyTorchlibrary instead of the CTCLoss from Baidu12. According tothe STR benchmark repository13, the CTCLoss from Baiduhas higher accuracy by about 1% for CRNN than the CT-CLoss from PyTorch library. In addition, 8) we constructand use our own validation set. 9) We calculate total accu-racy on union of SVT, IIIT, IC13, IC15, SP, and CT, ex-cept for IC03. IC03 usually has higher accuracy than otherdatasets (over 90% accuracy), and thus excluding IC03 re-sults in lower total accuracy than that of including IC03.
Environment : All experiments are conducted using Py-torch [46] on a Tesla V100 GPU with 16GB memory.
E.2. Comparison to State-of-the-Art Methods
We present the extended version of Table 2 in §5.2. Ta-ble 2 in §5.2 lists the methods that use only MJ and STfor training, and evaluate six benchmarks: IIIT, SVT, IC13-1015, IC15-2077, SP, and CT. In addition to Table 2 in §5.2,Table 9 also lists the methods that use SynthAdd (SA) [25]or both synthetic and real data,
SA is a synthetic dataset generated by Li et al. [25]. Tocompensate for the lack of special characters, Li et al. gen-erated SA using the same synthetic engine with ST [12]. SAis used in some STR methods [25, 30].
Some methods use both synthetic and real data for train-ing [25, 63, 72]. Their models trained on both synthetic andreal data show better performance than their models trainedonly on synthetic data. However, fairly comparing the threemethods [25, 63, 72] is difficult since they use the differentnumbers of real data (50K [25], 16K [63], and 7K [72]). Al-though they use different real data, we list them in Table 9.
Some methods use character-level labels [26, 70, 63].ST has character-level labels, and the researchers use them.The methods using character-level information tend to ob-tain higher accuracy on irregular texts.
TRBA with our best setting (TRBA-PR) trained on bothsynthetic (MJ+ST) and real data has a competitive perfor-mance of 90.0% to state-of-the-art methods. Adding syn-thetic data SA for training further improves by 0.3% (from90.0% to 90.3%).
E.3. Training Only on Real Labeled Data
Accuracy depending on dataset increment: Extendedversion Figure 16 shows the accuracy vs. the number ofaccumulated real labeled data per dataset increment. This isthe extended version of Figure 1 in §1. Table 10 shows theaccuracy along with the increment of real datasets.
Improvement by simple data augmentations: Varyingdegree of each augmentation As we mentioned in §5.3,the intensity of each augmentation affects the performance.
12https://github.com/baidu-research/warp-ctc13https://github.com/clovaai/deep-text-recognition-benchmark/pull/209
19

Type of training data Dataset name and # of data
Synthetic data Real data IIIT SVT IC13 IC15 SP CT TotalMethod Year MJ+ST SA labeled unlabeled 3000 647 1015 2077 645 288 7672
Rep
orte
dre
sults
ASTER [53] 2018 X 93.4 89.5 91.8 76.1 78.5 79.5 86.4SAR [25] 2019 X X 91.5 84.5 91.0 69.2 76.4 83.3 83.2SAR [25] 2019 X X X 95.0 91.2 94.0 78.8 86.4 89.6 89.2ESIR [75] 2019 X 93.3 90.2 91.3 76.9 79.6 83.3 86.8MaskTextSpotter [26]* 2019 X 95.3 91.8 95.3 78.2 83.6 88.5 89.1ScRN [70]* 2019 X 94.4 88.9 93.9 78.7 80.8 87.5 88.2DAN [65] 2020 X 94.3 89.2 93.9 74.5 80.0 84.4 86.9TextScanner [63]* 2020 X 93.9 90.1 92.9 79.4 84.3 83.3 88.3TextScanner [63]* 2020 X X 95.7 92.7 94.9 83.5 84.8 91.6 91.0SE-ASTER [49] 2020 X 93.8 89.6 92.8 80.0 81.4 83.6 88.2SCATTER [30] 2020 X X 93.7 92.7 93.9 82.2 86.9 87.5 89.7PGT [19] 2020 X X 93.5 90.7 94.0 74.6 80.1 77.8 86.5RobustScanner [72] 2020 X 95.3 88.1 94.8 77.1 79.5 90.3 88.2RobustScanner [72] 2020 X X 95.4 89.3 94.1 79.2 82.9 92.4 89.2PlugNet [42] 2020 X 94.4 92.3 95.0 82.2 84.3 85.0 89.8
Our
expe
rim
ent
TRBAOriginal [1] 2019 X 87.9 87.5 92.3 71.8 79.2 74.0 82.8Baseline-synth X 92.1 88.9 93.1 74.7 79.5 78.2 85.7+ SA X X 93.6 88.8 92.9 76.4 81.1 84.7 87.0Baseline-real X 93.5 87.5 92.6 76.0 78.7 86.1 86.6+ MJ + ST X X 95.1 91.0 94.9 79.0 82.4 89.1 89.1+ MJ + ST + SA X X X 95.4 91.3 95.2 80.2 83.8 92.1 89.8PR X X 94.8 91.3 94.0 80.6 82.7 88.1 89.3+ MJ + ST X X X 95.2 92.0 94.7 81.2 84.6 88.7 90.0+ MJ + ST + SA X X X X 95.4 92.4 95.0 81.9 84.8 89.5 90.3
Table 9: Extended version of Table 2 in §5.2. We show the results reported in original papers. MJ+ST, SA, and “*” denoteunion of MJSynth and SynthText, SynthAdd, and the model that uses character-level labeled data, respectively. Real labeleddata has various variants as described in §E.2. In each column, top accuracy is shown in bold.
SVT(231)
+IIIT(2,025)
+IC13(2,788)
+IC15(6,498)
+COCO(46K)
+RCTW(54K)
+Uber(146K)
+ArT(174K)
+LSVT(208K)
+MLT19(253K)
+ReCTS(276K)
Accumulated dataset and (number of accumulated real labeled data)
0
20
40
60
80
100
Acc
urac
y (%
)
TRBACRNN
Synthetic data 16MSynthetic data 16M
Figure 16: Accuracy vs. number of accumulated real labeled data, extended version of Figure 1 in §1. Along with theincrement of real data, the accuracy obtained using real data approaches the accuracy obtained using synthetic data.
20
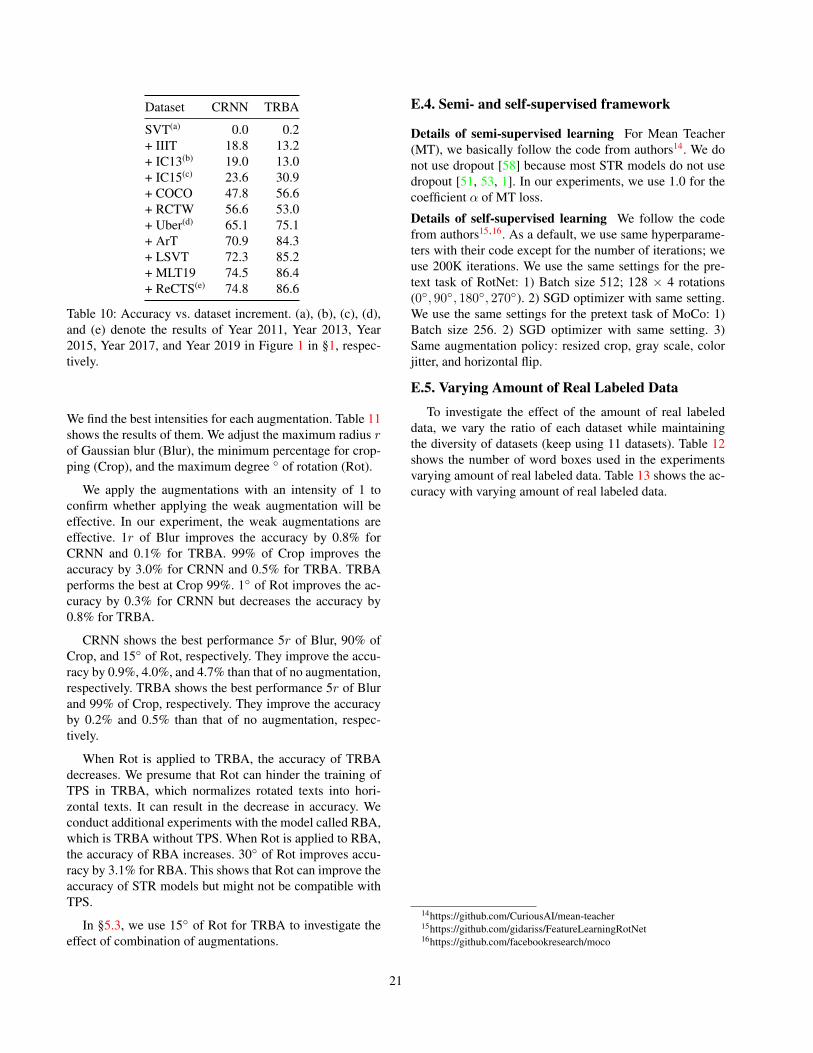
Dataset CRNN TRBA
SVT(a) 0.0 0.2+ IIIT 18.8 13.2+ IC13(b) 19.0 13.0+ IC15(c) 23.6 30.9+ COCO 47.8 56.6+ RCTW 56.6 53.0+ Uber(d) 65.1 75.1+ ArT 70.9 84.3+ LSVT 72.3 85.2+ MLT19 74.5 86.4+ ReCTS(e) 74.8 86.6
Table 10: Accuracy vs. dataset increment. (a), (b), (c), (d),and (e) denote the results of Year 2011, Year 2013, Year2015, Year 2017, and Year 2019 in Figure 1 in §1, respec-tively.
We find the best intensities for each augmentation. Table 11shows the results of them. We adjust the maximum radius rof Gaussian blur (Blur), the minimum percentage for crop-ping (Crop), and the maximum degree ◦ of rotation (Rot).
We apply the augmentations with an intensity of 1 toconfirm whether applying the weak augmentation will beeffective. In our experiment, the weak augmentations areeffective. 1r of Blur improves the accuracy by 0.8% forCRNN and 0.1% for TRBA. 99% of Crop improves theaccuracy by 3.0% for CRNN and 0.5% for TRBA. TRBAperforms the best at Crop 99%. 1◦ of Rot improves the ac-curacy by 0.3% for CRNN but decreases the accuracy by0.8% for TRBA.
CRNN shows the best performance 5r of Blur, 90% ofCrop, and 15◦ of Rot, respectively. They improve the accu-racy by 0.9%, 4.0%, and 4.7% than that of no augmentation,respectively. TRBA shows the best performance 5r of Blurand 99% of Crop, respectively. They improve the accuracyby 0.2% and 0.5% than that of no augmentation, respec-tively.
When Rot is applied to TRBA, the accuracy of TRBAdecreases. We presume that Rot can hinder the training ofTPS in TRBA, which normalizes rotated texts into hori-zontal texts. It can result in the decrease in accuracy. Weconduct additional experiments with the model called RBA,which is TRBA without TPS. When Rot is applied to RBA,the accuracy of RBA increases. 30◦ of Rot improves accu-racy by 3.1% for RBA. This shows that Rot can improve theaccuracy of STR models but might not be compatible withTPS.
In §5.3, we use 15◦ of Rot for TRBA to investigate theeffect of combination of augmentations.
E.4. Semi- and self-supervised framework
Details of semi-supervised learning For Mean Teacher(MT), we basically follow the code from authors14. We donot use dropout [58] because most STR models do not usedropout [51, 53, 1]. In our experiments, we use 1.0 for thecoefficient α of MT loss.
Details of self-supervised learning We follow the codefrom authors15,16. As a default, we use same hyperparame-ters with their code except for the number of iterations; weuse 200K iterations. We use the same settings for the pre-text task of RotNet: 1) Batch size 512; 128 × 4 rotations(0◦, 90◦, 180◦, 270◦). 2) SGD optimizer with same setting.We use the same settings for the pretext task of MoCo: 1)Batch size 256. 2) SGD optimizer with same setting. 3)Same augmentation policy: resized crop, gray scale, colorjitter, and horizontal flip.
E.5. Varying Amount of Real Labeled Data
To investigate the effect of the amount of real labeleddata, we vary the ratio of each dataset while maintainingthe diversity of datasets (keep using 11 datasets). Table 12shows the number of word boxes used in the experimentsvarying amount of real labeled data. Table 13 shows the ac-curacy with varying amount of real labeled data.
14https://github.com/CuriousAI/mean-teacher15https://github.com/gidariss/FeatureLearningRotNet16https://github.com/facebookresearch/moco
21
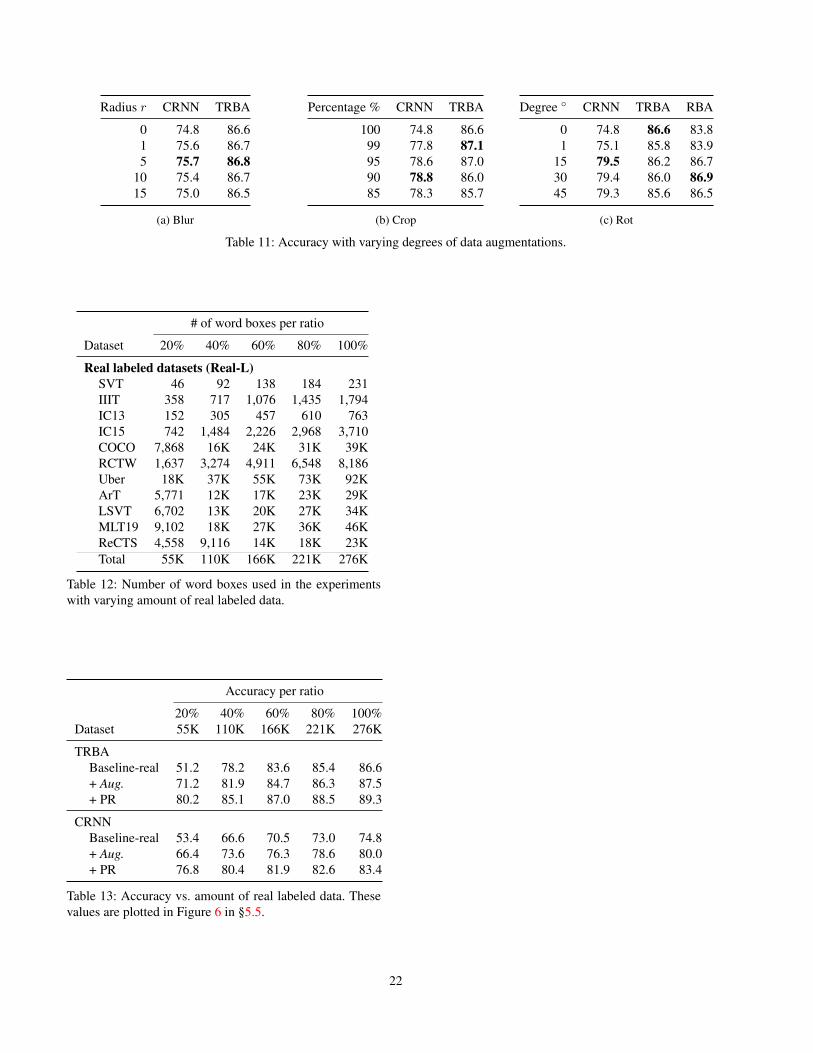
Radius r CRNN TRBA
0 74.8 86.61 75.6 86.75 75.7 86.8
10 75.4 86.715 75.0 86.5
(a) Blur
Percentage % CRNN TRBA
100 74.8 86.699 77.8 87.195 78.6 87.090 78.8 86.085 78.3 85.7
(b) Crop
Degree ◦ CRNN TRBA RBA
0 74.8 86.6 83.81 75.1 85.8 83.9
15 79.5 86.2 86.730 79.4 86.0 86.945 79.3 85.6 86.5
(c) Rot
Table 11: Accuracy with varying degrees of data augmentations.
# of word boxes per ratio
Dataset 20% 40% 60% 80% 100%
Real labeled datasets (Real-L)SVT 46 92 138 184 231IIIT 358 717 1,076 1,435 1,794IC13 152 305 457 610 763IC15 742 1,484 2,226 2,968 3,710COCO 7,868 16K 24K 31K 39KRCTW 1,637 3,274 4,911 6,548 8,186Uber 18K 37K 55K 73K 92KArT 5,771 12K 17K 23K 29KLSVT 6,702 13K 20K 27K 34KMLT19 9,102 18K 27K 36K 46KReCTS 4,558 9,116 14K 18K 23KTotal 55K 110K 166K 221K 276K
Table 12: Number of word boxes used in the experimentswith varying amount of real labeled data.
Accuracy per ratio
20% 40% 60% 80% 100%Dataset 55K 110K 166K 221K 276K
TRBABaseline-real 51.2 78.2 83.6 85.4 86.6+ Aug. 71.2 81.9 84.7 86.3 87.5+ PR 80.2 85.1 87.0 88.5 89.3
CRNNBaseline-real 53.4 66.6 70.5 73.0 74.8+ Aug. 66.4 73.6 76.3 78.6 80.0+ PR 76.8 80.4 81.9 82.6 83.4
Table 13: Accuracy vs. amount of real labeled data. Thesevalues are plotted in Figure 6 in §5.5.
22