Embed Size (px)
Citation preview

Japan Finance Organization for Municipalities JFM

Disclaimer By reading these materials, you agree to be bound by the following limitations: No representation or warranty, express or implied, is made as to, and no reliance should be placed on, the fairness, accuracy, completeness or correctness of the information, or opinions contained herein. Neither the company nor any of the company’s advisors or representatives shall have any responsibility or liability whatsoever (for negligence or otherwise) for any loss howsoever arising from any use of these materials or their contents or otherwise arising in connection with these materials. The information set out herein may be subject to updating, completion, revision, verification and amendment and such information may change materially. These materials are based on the economic, regulatory, market and other conditions as in effect on the date hereof. It should be understood that subsequent developments may affect the information contained in these materials, which neither the company nor its advisors or representatives are under an obligation to update, revise or affirm. Forward-looking statements, including the company’s plans in these materials, are based on information available to the company at the time they were prepared and involve potential risks and uncertainties. Actual results, therefore, may differ from those described in these materials due to changes in a variety of factors, such as market trends, economic conditions and regulations. Accordingly, investors are advised to use their own discretion and exercise great caution when making investment decisions. These materials and the information contained herein do not constitute or form part of any offer for sale or subscription of or solicitation or invitation of any offer to buy or subscribe for any securities of the company. Securities of the company not registered under the U.S. Securities Act of 1933, as amended (the “Securities Act”), may not be offered, sold or delivered within the United States or to U.S. persons absent registration under or an applicable exemption from the registration requirements of the United States securities laws. These materials and the information contained herein are being furnished to you solely for your information and may not be reproduced or redistributed to any other person, in whole or in part. In particular, neither the information contained in these materials nor any copy hereof may be, directly or indirectly, taken or transmitted into or distributed in the United States, Canada, Australia, Japan, Hong Kong or any other jurisdiction which prohibits the same except in compliance with applicable securities laws. Any failure to comply with this restriction may constitute a violation of U.S. or other national securities laws. No money, securities or other consideration is being solicited, and, if sent in response to this presentation or the information contained herein, will not be accepted.
November 2013
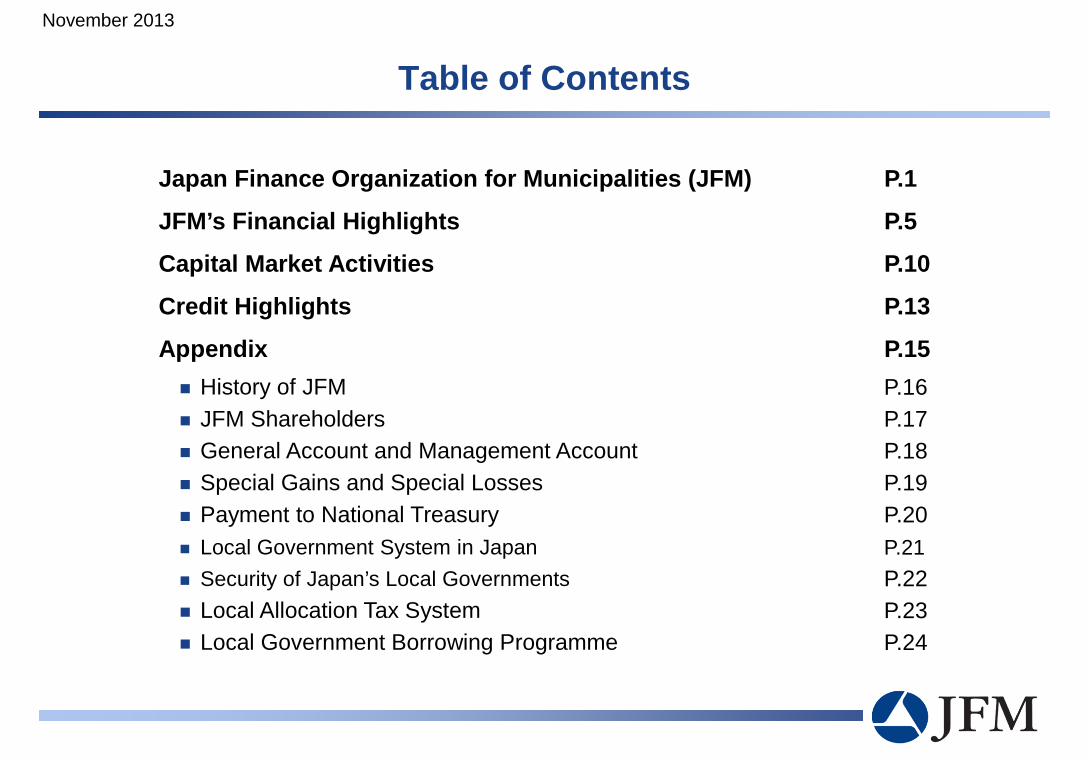
Japan Finance Organization for Municipalities (JFM) P.10
JFM’s Financial Highlights P.50
Capital Market Activities P.10
Credit Highlights P.13
Appendix P.15 History of JFM JFM Shareholders General Account and Management Account Special Gains and Special Losses Payment to National Treasury Local Government System in Japan Security of Japan’s Local Governments Local Allocation Tax System Local Government Borrowing Programme
Table of Contents
November 2013
P.16 P.17 P.18 P.19 P.20 P.21 P.22 P.23 P.24

Japan Finance Organization for Municipalities (JFM)
1
November 2013

Brief Profile of JFM
A Joint Funding Organization for Local Governments
Objective To provide local governments with long-term funding at low interest rates
Establishment Established in 1957 as a government financial institution (the “predecessor”) Succeeded the predecessor on 1 October 2008 (reorganised on 1 June 2009)
Governing Law Japan Finance Organization for Municipalities Law
– Act No. 64 of 2007, as amended
Capital JPY 16.6 bn (USD 176 mm)*
– Capitalised by 1,790 local governments in Japan (as of 31 March 2013) (e.g., Tokyo, Osaka, Yokohama and Nagoya)
Outstanding Loan Balance JPY 22.6 tn (USD 240 bn)*
– Providing loans to 2,095 local governments in Japan, including all prefectures (as of 31 March 2013)
Ratings AA- (negative: S&P) / Aa3 (stable: Moody’s)
– The ratings of JFM are the same as those of the Japanese sovereign
JFM has been playing an important role in the Japanese local government system since 1957.
*USD 1 = JPY 94.30 as of 31 March 2013 (based on the exchange rate on 29 March 2013, the last business day of March).
2
November 2013

Basic Framework of JFM’s Business Operations
Local Governments
Financial Markets
JPY 18.6 tn(1)
(USD 198.1 bn(2))
JFM
Fund for Lending Rate Reduction(4)
Reserve for Interest Rate Volatility, etc.
JPY 3.9 tn(1) (USD 41.9 bn(2))
JPY 0.9 tn(1)
(USD 9.8 bn(2))
Reduction of Interest Rates
Proceeds from Public Races(3)
Funding (JFM Bonds)
JPY 22.6 tn(1) (USD 240.4 bn(2))
Lending (Long-term/
low interest rates) Outstanding
Bond Amount: Outstanding
Loan Amount:
(1) As of 31 March 2013. (2) USD 1 = JPY 94.30 as of 31 March 2013 (based on the exchange rate on 29 March 2013, the last business day of March). (3) A portion of the earnings from municipally operated racing (horse, bicycle, motorcycle and speedboat). (4) Sometimes also translated as “Fund for Improvement of Operations of Municipalities”.
3
November 2013

0100200300
JFM KBN KK KOMINS MuniFin BNG JBIC DBJ
Peer Group Comparison In terms of total assets, JFM is larger than its peer group entities.
Issuer JFM KBN (Kommunalbanken)
KK (KommuneKredit)
KOMINS (Kommuninvest)
MuniFin (Municipality Finance)
BNG (Bank Nederlandse)
JBIC DBJ
Issuer Rating (Moody’s/S&P) Aa3/AA- Aaa/AAA Aaa/AAA Aaa/AAA Aaa/AAA Aaa/AAA Aa3/AA- Aa3/A+
Sovereign Rating Aa3/AA- Aaa/AAA Aaa/AAA Aaa/AAA Aaa/AAA Aaa/AAA Aa3/AA- Aa3/AA-
Country Japan Norway Denmark Sweden Finland Netherlands Japan Japan
Guarantee Structure
Local govts to bear all costs
to satisfy JFM’s obligations
on dissolution
Letter of support from
Kingdom of Norway
Joint and several guarantee from
local govts
Joint and several guarantee from
local govts
Joint guarantee from local govts
through Municipal Guarantee Board
Implicit support from Dutch
Ministry of Finance
Issues overseas
bonds with explicit govt guarantee
Issues overseas
bonds with and without explicit govt guarantee
Ownership 100% local govts
100% central govts
100% local govts
100% local govts (most of
local govts)
30.66% local govts pension fund
16% central govts 53.34% local govts (part of local govts)
50% central 50% local govts
(most of local govts)
100% central govts
100% central govts
(potential privatization)
Establishment 1957/2008 1926/1999 1898 1986 1989/1993 1914 1950/1999/ 2008/2012
1951/1999/ 2008
Total Assets* (USD)
251.4 bn (Mar 2013)
60.6 bn (Mar 2013)
31.3 bn (Dec 2012)
43.4 bn (Dec 2012)
32.8 bn (Dec 2012)
182.3 bn (Dec 2012)
153.0 bn (Mar 2013)
172.3 bn (Mar 2013)
Source: Compiled by JFM based on published materials of each issuer. *Amounts are rounded to one decimal place based on the currency exchange rates as of 29 March 2013.
Total Assets
4
(USD bn*)
November 2013

JFM’s Financial Highlights
5
November 2013

0.0
5.0
10.0
15.0
20.0
25.0New JFM
Predecessor
0.0
2.0
4.0
6.0
8.0
10.0
12.0
14.0
16.0
18.0Bonds without government guarantee
Bonds with government guarantee
Lending and Funding Operations Lending volume has increased substantially since JFM’s
lending scope was expanded in 2009 due to reorganisation.
Loans planned to be made in FY2013 amount to USD 21 bn(1)(2).
Bonds without government guarantees are issued from time to time for the purpose of financing new loans.
Government guaranteed bonds in the domestic market are for the repayment of existing bonds issued by the predecessor.
JFM has no plans to issue government-guaranteed bonds in overseas markets.
(USD bn(1))
FY
Annual Lending Volume Bond Issuance
FY
(1) USD 1 = JPY 94.30 as of 31 March 2013 (based on the exchange rate on 29 March 2013, the last business day of March). (2) Planned amount; subject to change depending on market circumstances.
(USD bn(1))
6
November 2013
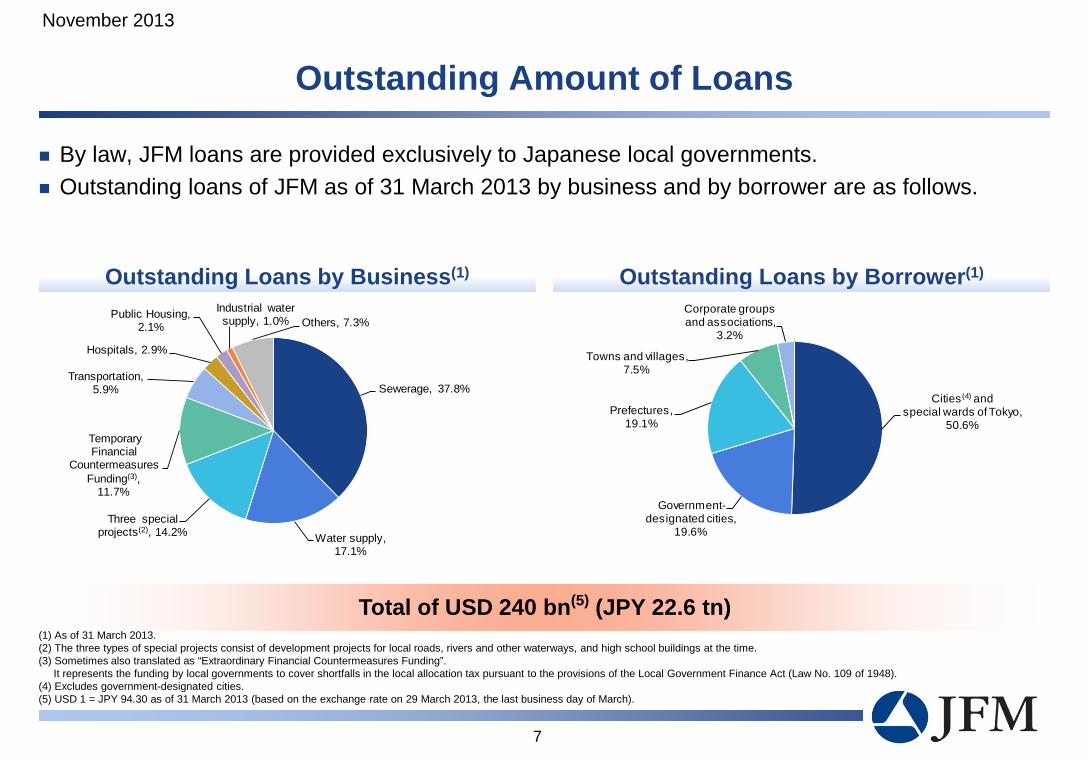
Outstanding Amount of Loans
By law, JFM loans are provided exclusively to Japanese local governments. Outstanding loans of JFM as of 31 March 2013 by business and by borrower are as follows.
Sewerage, 37.8%
Water supply, 17.1%
Three special projects(2), 14.2%
TemporaryFinancial
Countermeasures Funding(3),
11.7%
Transportation, 5.9%
Hospitals, 2.9%
Public Housing, 2.1%
Industrial water supply, 1.0% Others, 7.3%
Cities(4) and special wards of Tokyo,
50.6%
Government-designated cities,
19.6%
Prefectures,19.1%
Towns and villages,7.5%
Corporate groupsand associations,
3.2%
Total of USD 240 bn(5) (JPY 22.6 tn) (1) As of 31 March 2013. (2) The three types of special projects consist of development projects for local roads, rivers and other waterways, and high school buildings at the time. (3) Sometimes also translated as “Extraordinary Financial Countermeasures Funding”. It represents the funding by local governments to cover shortfalls in the local allocation tax pursuant to the provisions of the Local Government Finance Act (Law No. 109 of 1948). (4) Excludes government-designated cities. (5) USD 1 = JPY 94.30 as of 31 March 2013 (based on the exchange rate on 29 March 2013, the last business day of March).
Outstanding Loans by Business(1) Outstanding Loans by Borrower(1)
7
November 2013

Managing Interest Rate Risk
Providing the local governments with long-term funding, JFM is exposed to interest rate risk resulting from a duration gap between lending and funding.
– Lending: Maximum maturities of 30 years (Loan duration: 9.72 years*) – Funding: Issuing bonds mainly with 10 year maturities (Bond duration: 8.61 years*)
Reserves for Interest Rate Volatility – JFM maintains reserves for interest rate volatility to deal with the interest rate risk resulting
from a duration gap between lending and funding.
ALM Committee – The ALM Committee carries out medium- and long-term management and risk analysis
through scenario, Value at Risk, duration and other analyses.
To address such interest rate risk, JFM takes the following measures:
Duration gap: 1.11 years*
*As of 31 March 2013.
8
November 2013

30
35
40
45
Mar-10 Mar-11 Mar-12 Mar-13
Balance Sheets
Financial Performance (as of 31 March 2013)
As of 31 March 2013
(JPY mm) YoY (JPY mm) (USD bn*) YoY
(USD bn*)
Total Assets 23,704,919 +364,212 251 +3.9
Loans 22,668,634 +281,223 240 +3.0
Total Liabilities 23,591,399 +344,389 250 +3.7
Bonds 18,676,401 +499,705 198 +5.3
Reserves under special laws 3,947,086 -157,758 42 -1.7
Total Net Assets 113,520 +19,824 1.2 +0.2
Capital 16,602 0 0.2 0
Statements of Income
FY ended 31 March 2013
(JPY mm) YoY (JPY mm) (USD bn*) YoY
(USD bn*)
Income 487,146 -24,659 5.2 -0.3
Interest Income 485,675 -25,966 5.2 -0.3
Expenses 274,076 -7,673 2.9 -0.1
Interest Expenses 265,647 -8,673 2.8 -0.1
Ordinary Income 213,070 -16,985 2.3 -0.2
Net Special Gains (Losses)(1) (192,241) (-16,182) (2.0) (-0.2)
Net Income 20,828 -804 0.2 -0.01
Stable Income Accumulating Reserves
(USD bn(2)) Payment to national treasury
(2) USD 1 = JPY 94.30 as of 31 March 2013 (based on the exchange rate on 29 March 2013, the last business day of March).
(USD bn(2))
9
0.00
0.05
0.10
0.15
0.20
0.25
FY2009 FY2010 FY2011 FY2012
(1) Net Special Gains (Losses) represents the difference between the amounts show in (a) the Special Gains and (b) the Special Losses line items in our audited Statements of Income for FY2012.
November 2013
Capital Market Activities
November 2013
10

Funding Activities in Overseas Markets
※ From 1984 to 2011: Issuance of 64 overseas bonds with government guarantees.
Format Currency Issue Amount Coupon (%) Issue Date Maturity Date Reg. S USD 1,000 mm 1.500 12 Sep 2012 12 Sep 2017 Reg. S USD 1,000 mm 1.375 5 Feb 2013 5 Feb 2018
144A / Reg. S USD 1,500 mm 2.500 12 Sep 2013 12 Sep 2018
Uridashi Bonds – Issues in various currencies through the MTN Programme to meet specific investor demands.
– Issued AUD 100 mm inaugural Uridashi Bonds in March 2013, targeting Japanese retail investors. JFM has no plans to issue government-guaranteed bonds in overseas markets for the future
11
November 2013
JFM raises funds in a consistent manner to provide local governments with long-term and low-interest funds Benchmark Issuance (Outstanding)
- Completed its debut Global benchmark transaction in September 2013. - JFM plans to conduct one or more benchmark transactions in the overseas market per year (144A/Reg.S) depending
on market conditions, funding needs and other circumstances.
Secondary Market Performance
(bp)
Source: Bloomberg Private Placements
20
30
40
50
60
70
80
Sep-12 Oct-12 Nov-12 Dec-12 Jan-13 Feb-13 Mar-13 Apr-13 May-13 Jun-13 Jul-13 Aug-13 Sep-13 Oct-13
1.5% Sep 2017 1.375% Feb 2018 2.5% Sep 2018

Type of Bonds FY ended 31 March 2013 (achieved) FY ending 31 March 2014 (plan)(2)
Guaranteed JPY 1,030 bn JPY 1,280 bn USD 13.6 bn(1)
Non-guaranteed JPY 1,496 bn JPY 1,500 bn USD 15.9 bn(1)
Domestic Issuance JPY 1,273 bn JPY 1,280 bn USD 13.6 bn(1)
MTN JPY 223 bn JPY 220 bn USD 2.3 bn(1)
Funding Plan for FY2013
In FY2013, JFM plans to raise a total of USD 2.3 bn(1)(2)
- So far, JFM has raised approximately USD 2.1 bn(3) through a public benchmark transaction and private placements
- The funding plan may be revised depending on market conditions, funding needs and other circumstances
Overseas Issuance
FY 2013
0.0
0.5
1.0
1.5
2.0
2.5
3.0
2011 2012 2013
Plan Actual
(USD bn(1))
FY
MTN Bond Issuance
(1) USD 1 = JPY 94.30 as of 31 March 2013 (based on the exchange rate on 29 March 2013, the last business day of March). (2) Planned amount is subject to change. (3) Includes AUD 100 mm, converted at USD 1 = AUD 1.0087 as of 31 March 2013 (based on the exchange rate on 29 March 2013, the last business day of March).
12
(2)
November 2013

Credit Highlights
13
November 2013

Credit Highlights
JFM is a joint funding organization for all local governments, established under the special law. JFM has strong ties with the national government. If JFM’s obligations cannot be satisfied in full during the dissolution process, local governments
bear all of the costs to satisfy such obligations in full, via payments to JFM.
1. Solid Institutional Framework
Loans are provided exclusively to the local governments. Local governments must have the consent or approval of the Minister* or respective prefectural
governors when they undertake borrowings from JFM. Local governments have support from the national level via the Local Allocation Tax system. JFM has never experienced a default on its lending for more than 50 years since its establishment.
2. High Quality of Assets
JFM maintains appropriate reserves. JFM conducts prudent ALM.
3. Sound Financial Foundation
*Minister for Internal Affairs and Communications.
14
November 2013

Appendix
15
November 2013

Date Event Source of Capital
1 June 1957
<Foundation> Japan Finance Corporation for Municipal Enterprises
National Government
1 October 2008
< Start-up of Operation> Japan Finance Organization for Municipal Enterprises
Local Governments
1 June 2009 <Reorganization> Japan Finance Organization for Municipalities (The expansion of lending scope)
Local Governments
History of JFM
As a result of the reorganisation mandated by the policy-based financial reform, JFM’s ownership transferred from the national government to local governments.
Despite the structural change, JFM has strong ties with the national government, playing a vital role in the funding system for local governments.
Substantially all rights and obligations are succeeded to
16
November 2013

JFM Shareholders JFM has capital of JPY 16.6 bn (USD 176 mm(1)(2)) contributed by 1,790(1) Japanese local governments.
Amount of Capital Contribution(1)
(1) As of 31 March 2013. (2) USD 1 = JPY 94.30 as of 31 March 2013 (based on the exchange rate on 29 March 2013, the last business day of March). (3) Excludes Government-designated cities. (4) Government-designated cities: Cities with populations of 500,000 or more designated in accordance with Paragraph 1, Article 252-19 of the Local Autonomy Act. Such government-designated cities are allowed to administer certain matters such as social welfare, food sanitation, urban planning and so on, for which prefectures are responsible in principle.
Prefectures USD 68 mm
38.4%
Cities(3)
and special wards of Tokyo USD 67 mm
38.0%
Government-designated
cities(4) USD 30 mm
17.3%
Towns, villages and local
government associations USD 11 mm
6.3%
USD 176 mm(2)
17
November 2013

General Account: New loans to be extended and new bonds to be issued by JFM (since 2008). Management Account: Legacy operations to manage loans carried over from the predecessor.
General Account and Management Account
Reserve for Losses on the Refinancing of
Bonds JPY 3.4 tn
(USD 36 bn*)
General Account
Management Account
Ensure a financial foundation that can withstand the refinancing risk posed by the government-guaranteed bonds, etc.
FY2008-2017 USD 2.3* bn transferred each year
Predecessor JFM
JFM’s Reserves under Special Laws
Reserve for Interest Rate Volatility
Management Account Reserve for Interest Rate Volatility
Ensure a financial foundation needed to sustain the business into the future
*USD 1 = JPY 94.30 as of 31 March 2013 (based on the exchange rate on 29 March 2013, the last business day of March).
18
November 2013

Special Gains and Special Losses
Provision for Management Account Reserve
for Interest Rate Volatility JPY 203 bn(1) (USD 2.2 bn(2))
Reversal of Management Account Reserve
for Interest Rate Volatility JPY 570 bn(1) (USD 6.0 bn(2))
Provision for Reserve for Interest Rate Volatility
JPY 220 bn(1) (USD 2.3 bn(2)) ≪General Account≫
Reversal of Reserve for Interest Rate Reduction
JPY 11 bn(1) (USD 0.12 bn(2))
*Payment to National Treasury: JPY 1 tn (USD 11 bn(2)) aimed to be paid from FY2012 to FY2014
Special Gains JPY 581 bn(1) (USD 6.2 bn(2))
Special Losses JPY 773 bn(1) (USD 8.2 bn(2))
Payment to National Treasury* JPY 350 bn (USD 3.7 bn(2))
USD 6.0 bn(2) USD
2.3 bn(2)
between JFM Account
Transfer
19
(1) As of 31 March 2013. (2) USD 1 = JPY 94.30 as of 31 March 2013 (based on the exchange rate on 29 March 2013, the last business day of March).
November 2013

Payment to National Treasury
The Minister for Internal Affairs and Communications and the Minister of Finance shall cause an amount that is determined to be in excess to be paid to the national treasury under the conditions that: The businesses of JFM are determined to have been executed smoothly in light of the condition of
JFM management; and The management account reserves for interest rate volatility and certain other reserves are
determined to exceed the amount necessary for the smooth operation of the business of managing and collecting the receivables succeeded from the predecessor into the future.
Conditions specified in Article 14 of the Supplementary Provisions to the JFM Law:
Management Account Reserve for
Interest Rate Volatility JPY 2.7 tn(1) (USD 29 bn(2))
National Treasury
JFM National Government
Part of JFM’s management account reserve for interest rate volatility is to be paid to the national treasury pursuant to Article 14 of the Supplementary Provisions to the JFM Law.
FY2012-2014 total amount of approx. USD 11 bn(2) planned to be paid
In FY2012, JPY 350 bn (USD 3.7 bn(2)) was paid
In FY2013, JPY 650 bn (USD 6.9 bn(2)) scheduled to be paid
20
(1) As of 31 March 2013. (2) USD 1 = JPY 94.30 as of 31 March 2013 (based on the exchange rate on 29 March 2013, the last business day of March).
November 2013

Local governments are responsible for a wide range of services closely related to the daily lives of citizens such as:
- Public health - Social welfare - Education - Policing - Fire fighting
21
National Government
47 Prefectures*
1,742 Cities, Towns, Villages and Special Wards*
Handle administrative issues related to their respective regions, e.g., Yokohama, Kyoto
Serving broader areas, e.g., Tokyo, Osaka
- Foreign affairs - National defense - Monetary policy
Local Government System in Japan
*As of 31 March 2013.
Local Governments
November 2013

Security of Japan’s Local Governments
Consent or Approval for Borrowing
3. Financial Conditions Monitoring
Early Warning or Reconstruction
Under the supervision of upper level government
National Government
3. Financial Conditions Monitoring
Early Warning or Reconstruction
Under the supervision of upper level government
Prefectures
(Local Governments)
Cities Towns
Villages Special Wards
(Local
Governments)
2. Borrowing Consultation
Consent or Approval for Borrowing
2. Borrowing Consultation
1. Secure Financial Resources for Local Governments - Local Allocation Tax System: a portion of national tax revenue is allocated to the local
governments in order to cover the shortfall. (See Appendix P23) - Local Government Borrowing Programme: determines the amount and sources of local
government funding and ensures that funds will be sufficiently provided. (See Appendix P24)
November 2013
22

Under the Local Allocation Tax (“LAT”) system, the national government allocates a part of
national tax revenue to the local governments in order to adjust the imbalance of revenue sources
among the local governments.
LAT for each local government is decided based on its requirement and revenue as follows:
Shortage Standard Financial
Requirements(1) Standard
Local Tax Revenue(2)
LAT for City A
Example: City A
(1) Standard financial requirements are the amount of funds necessary to provide standard public services. The requirements are calculated for each local government according to the standard specified by the Ministry of Internal Affairs and Communications.
(2) Local governments have a right to tax only within their respective local regions in Japan. Regional imbalances in tax revenues are common.
Local Allocation Tax System
23
November 2013

The national government decides guidelines for the amount of local government borrowings according to the Local Government Borrowing Programme (the “LGBP”). Each local government raises funds within this amount.
The total amount of JFM funds is based on the LGBP, prepared by the national government each fiscal year. JFM funds account for around 16% of local government funding.
(USD bn*)
FY
Funding measures Funding amount (Initial plan)
Source: Ministry of Internal Affairs and Communications The figures above are the originally published by Ministry of Internal Affairs and Communication planned numbers (not actual).
Local Government Borrowing Programme
FY 2012 (USD bn*)
FY 2013
(USD bn*) Share
1 Private Funds
Publicly Offered Bond 47 36 25%
Other Private Sector 37 47 32%
2 Public Funds
JFM 23 23 16%
National Government 41 39 27%
Total 149 145 100%
(%)
*USD 1 = JPY 94.30 as of 31 March 2013 (based on the exchange rate on 29 March 2013, the last business day of March).
24
12.9 13.6 13.8
15.5 15.9
0.0
2.0
4.0
6.0
8.0
10.0
12.0
14.0
16.0
18.0
0
20
40
60
80
100
120
140
160
180
2009 2010 2011 2012 2013
Other Private Sector Publicly Offered BondJFM National GovernmentJFM Ratio
18.0
16.0
14.0
12.0
10.0
8.0
6.0
4.0
2.0
0.0
November 2013

Finance, Finance Department
Postal address: Shisei Kaikan,1-3 Hibiya Koen, Chiyoda-ku Tokyo 100-0012, Japan
Tel: +81-3-3539-2697 Fax: +81-3-3539-2615 E-mail: [email protected] Bloomberg ticker: JFM Govt
Japan Finance Organization for Municipalities
Contact Information
(JFM in Tokyo)
25
November 2013


![Practica 7 Electricidad y Magnetismo Jfm 2010[1]](https://img.pdfslide.tips/doc/110x75/5695d07c1a28ab9b0292a33f/practica-7-electricidad-y-magnetismo-jfm-20101.jpg)