Embed Size (px)
Citation preview
0000-0002-4450-6922
POLİTEKNİK DERGİSİ JOURNAL of POLYTECHNIC ISSN: 1302-0900 (PRINT), ISSN: 2147-9429 (ONLINE)
URL: http://dergipark.org.tr/politeknik
A model for designing climate adaptive
shading devices: the case of Bayrakli Tower
İklime uyarlı gölgeleme elemanları tasarımı için
bir model: Bayraklı Tower örneği
Yazar(lar) (Author(s)): Hande ODAMAN KAYA1, Müjde ALTIN2
ORCID1: 0000-0002-4450-6922
ORCID2: 0000-0001-6948-9463
Bu makaleye şu şekilde atıfta bulunabilirsiniz(To cite to this article): Odaman Kaya H., Altin M., “A
model for designing climate adaptive shading devices: the case of Bayraklı Tower”, Politeknik Dergisi,
*(*): *, (*).
Erişim linki (To link to this article): http://dergipark.org.tr/politeknik/archive
DOI: 10.2339/politeknik.634771

A Model for Designing Climate Adaptive Shading Devices: The
Case of Bayrakli Tower
Highlights
❖ Simulation model is validated.
❖ Shading device requirements are analysed.
❖ Climate adaptive shading device proposal is developed.
❖ Simulation results are compared and discussed.
Graphical Abstract
This study is expected to examine the effects of Climate Adaptive Shading Devices (CASD) on building energy
performance through the outputs derived from simulation results of an existing building.
Figure. Methodology
Aim
This study aims to examine the energy performance of the case building and to propose a
methodology for implementing CASD.
Design & Methodology
Sun-path diagram analysis and Openstudio simulation tool are used for developing and evaluating
the effects of CASD on building energy performance.
Originality
This study is significant in literature by examining the effects of the developed CASD on the energy
performance of an existing building through simulation.
Findings
Even CASD increase heating load, they have a positive effect on energy performance of a building
by helping with overheating problem.
Conclusion
This study reveals a solution for the overheating problems of the case building by proposing
Climate adaptive shading devices (CASD).
Declaration of Ethical Standards
The authors of this article declare that the materials and methods used in this study do not require
ethical committee permission and/or legal-special permission.

İklime Uyarlı Gölgeleme Elemanları Tasarımı İçin Bir
Model: Bayraklı Tower Örneği Araştırma Makalesi / Research Article
Hande ODAMAN KAYA1*, Müjde ALTIN2 1Kayapım Mimarlık, Mansuroğlu Mah. 286/7 sok. No:10/11 Bayraklı, İzmir, Türkiye
Mimarlık Bölümü, Mimarlık Fakültesi, Dokuz Eylül Üniversitesi, Türkiye
(Geliş/Received : 18.10.2019 ; Kabul/Accepted : 31.05.2020 ; Erken Görünüm/Early View : 14.06.2020)
ÖZ
Bir yapının enerji performansı üzerinde belirleyici bir bileşen olan cephe; iç ve dış şartlar arasındaki sınırı oluşturmaktadır. Bu
sebeple, mevcut bir ofis yapısı; soğutma enerjisi tüketimi düşürülerek bina enerji performansını geliştirmek için cephesine entegre
edilmiş olan güneş kırıcı elemanlar üzerinden çalışılmıştır. Isıtma ve soğutma için tüketilen elektrik enerjisi hesabı OpenStudio
simülasyon yazılımı aracılığıyla yapılmıştır. Çalışılan binanın simülasyon modeli, elde edilen simülasyon sonuçlarının aylık
elektrik faturalarıyla karşılaştırılması yoluyla doğrulanmıştır. Gölgeleme elemanı ihtiyaçlarına karar vermek için, çalışılan binanın
gölgeleme elemanı olmadan simülasyonu alınıp sonuçlar Güneş diyagramı analizi sonuçlarıyla birlikte çalışılmıştır. Güneş kırıcılar
‘geçirgenlik özelliği’ ve ‘yükselme açısı’ değişkenleri özelinde, güneşin saatlik ve mevsimsel hareketlerine bağlı olarak
çalışılmıştır. Sonrasında, toplanan bilgiler uyarlı gölgeleme elemanlarının karakterini oluşturmak amacıyla kullanılmıştır. Sonuç
olarak; mevcut gölgeleme elemanları ve önerilen uyarlı gölgeleme elemanları, elektrik tüketimleri ve pencerelerin güneş
radyasyonu kaynaklı enerji kazanımı değişkenlerine dayalı olarak karşılaştırılmış ve tartışılmıştır. Öneriler arasından, Güneşin hem
saatlik hem de mevsimsel hareketlerine uyarlılık gösteren gölgeleme elemanları, soğutma enerjisi tüketimini düşürmek adına en
fazla gelişme gösteren sonuçları vermiştir. Ayrıca, ileriki çalışmalarda en iyi performansı sağlayan cephenin geliştirilebilmesi için
öneriler verilmiştir.
Anahtar Kelimeler: Bina enerji performansı, openstudio simulasyonu, güneş yörüngesi diyagramı, iklime uyarlı gölgeleme
elemanı, elektrik tüketimi.
A Model for Designing Climate Adaptive Shading
Devices: The Case of Bayrakli Tower
ABSTRACT
Façade is accepted as a determinant component on energy performance of a building, forming the boundaries between inner and
outer conditions. With an intention to improve the building energy performance of an existing office building, façade integrated
shading devices are examined through the cooling energy consumptions. OpenStudio simulation software is used for calculating
heating and cooling electricity consumptions. The ilding simulation model is validated by comparing the simulation results with
monthly electricity consumption bills. Shading device requirements are determined by using the building model without shading
devices and simulation results are studied together with the sun path diagram analysis results. Hourly and seasonal solar movements
are considered as the main parameters affecting the ‘transparency’ and ‘elevation angles’ of the shading devices. As a result of the
shading device requirement analysis, climate adaptive shading device (CASD) scenarios are presented for the case building.
Consequently, existing shading devices and proposed CASD scenarios are compared and discussed in terms of electricity
consumptions and window solar radiation energy parameters. As a result of the comparisons, shading devices that are adaptable to
both hourly and seasonal solar movements gave the highest improvement results in terms of decreasing cooling energy
consumptions. Also, suggestions are given for developing the best performing façade for further studies.
Keywords: Building energy performance, openstudio simulation, sun-path diagram, climate adaptive shading device,
electricity consumption.
1. INTRODUCTION
Construction sector has been following the global
‘energy efficient’ movement regarding to the obvious
constraints on the natural environment created by the
built environment. National and International
regulations, codes and directives have been the major
push for the implementation of new policies in the sector.
Following the global steps, Turkey has built up a series
of regulations starting from 2008.
However, implementation part of the sector shows a
strong resistance by keeping the regulations as
‘requirements’ to fulfil, not as an attitude to embrace.
Since 60% of buildings’ energy consumption is caused
by heating, cooling and hot water needs; energy
efficiency approaches should be mainly focused on these
issues. In this case, optimizing the building envelope as a *Sorumlu Yazar (Corresponding Author)
e-posta : [email protected]
significant factor on buildings’ heating and cooling
energy demand would help for minimizing the total
energy loads. According to the Organization for
Economic Co-operation and Development [1]; a building
with a high-performance envelope in a cold climate
consumes the 20-30% of a standard building’s heating
load. Indeed, the cooling load gain in a hot climate is also
changing between 10-40%.
This study deals with energy performance of an existing
high- rise office building in İzmir. Bayraklı Tower is
chosen as the case building of this research to study on
its heating and cooling energy consumptions; focused on
shading devices integrated to the façade. Occupants of
the south facing offices have cooling demand both in
summer and winter seasons. Even though shading
devices are densely placed on the southern façade,
curtain wall façade causes over- heating problems.
The paper aims to present a methodology for improving
the energy performance of an existing office building in
İzmir by proposing climate adaptive shading devices
(CASD). Different methodologies are combined on
various components and processes to constitute the steps
of the main aim of this study by: Establishing the shading
device requirements of the building, proposing CASD for
the building and presenting the most efficient proposal
for improving building energy performance by
decreasing cooling energy consumption. This study
considers; energy consumption of heating, cooling and
fan usages as the energy performance indicators, while
hourly and seasonal solar movements are accepted as the
outer factors on the adaptivity behaviour of the façade
components.
Presented methodology can be used for developing
CASD proposals through a solar diagram analysis tool
(Sunearth Tool web-based software) and CASD
proposals can be compared over their effects on building
energy performance of a building by using a simulation
tool (OpenStudio simulation software). So that energy
performance of a building can be improved by using
CASD. Although the methodology is assigned to an
existing case building in this study, it can be used
regardless of the case building (such as new
constructions, different building typologies, other
climate conditions etc.)
2. LITERATURE REVIEW
According to the OECD data, compared to a standard
building envelope is decreasing the heating loads 20-30%
in a cold climate and 10-40% of the cooling loads in a hot
climate [1]. As building envelope is a key component for
reaching a better energy efficiency target, the path of
‘climate adaptive façade’ concept is followed for
increasing building energy performance. For maximizing
the energy savings in buildings while providing the
needed indoor environmental comfort, energy and mass
flow can be managed and modulated by ‘Adaptive’ or
‘Responsive Building Elements (RBE)’ or systems [24].
According to a completed project of the International
Energy Agency—Energy Conservation in Buildings and
Community Systems Programme (IEA-ECBCS),
responsive building elements should be developed,
applied and implemented for improving the energy
efficiency in the built environment. Mainly designed as
construction elements, Responsive Building Elements
can transfer and store heat, light, water and air actively.
IEA–ECBCS Annex 44 indicates that building envelopes
has the largest potential to minimize the energy use in
buildings by integrating adaptive technologies [25].
By means of the ‘exclusive’ approach; a well-insulated
and air tight building envelope can be accepted as a
‘static’ barrier creating a boundary between inside and
outside. Following a ‘selective’ building envelope
understanding, heat and mass flow can be adjustable by
using adaptive or responsive building elements [8].
Although the daily and yearly changing meteorological
conditions affect the occupancy and comfort needs, the
conventional building shells are mainly static and don’t
respond to these changes [26]. But a climate adaptive
building shell (CABS) can adapt itself according to the
changing climatic conditions while providing the
occupant needs and saving energy [13]. CABS can
repeatedly and reversibly change its functions, features
or behaviours over time in response to changing
performance requirements and variable boundary
conditions. This helps to improve the overall building
performance in terms of primary energy consumption
and provides the needed thermal and visual comfort
conditions.’ [27]
Since the word ‘adaptive’ refers to the changeable,
mutable, flexible, instable features; ‘Adaptability’ is
defined as ‘the ability of a system to deliver intended
functionality considering multiple criteria under variable
conditions through the design variables changing their
physical values over time’ [28]. The words ‘active,
advanced, dynamic, intelligent, interactive, kinetic,
responsive, smart, switchable are also used
corresponding to the word ‘adaptive’ [26]. The adaptive
behaviour according to the changing environmental
conditions in time is not a new concept in architecture;
even an operable window on a façade and a curtain are
both conventional adaptive solutions [29]. The first
‘adaptive façade’ known in literature, was designed by
Jean Nouvel for the Institut du Monde Arabe; built
between the years 1981-1987 in Paris [7]. ‘Climate
Adaptive Façades’ can be defined as the façade solutions
that can adapt themselves to the inner and outer factors
manually, mechanically or by the behaviour of smart
materials used.
Considering the data achieved by shading device
requirement analysis; we can say that shading device
requirements of a façade changes during a day parallel to
the changing solar azimuth and elevation angles. To
understand when shading is needed for a façade; solar
azimuth angles are studied on hourly base for each façade
orientation and existing shading devices are positioned
with proper elevation angles to have a better performing
façade for the case building. Since the word ‘adaptive’
refers to the changeable, mutable, flexible, instable
features; ‘Adaptability’ is defined as ‘the ability of a
system to deliver intended functionality considering
multiple criteria under variable conditions through the
design variables changing their physical values over
time’ [30]; this study approaches ‘adaptability’ in
relation with the position and material transmittance of
shading devices.
Since the structure of this paper is founded on ‘building
energy performance calculation’; literature review is
made on building energy performance directive and
regulations of European Union and Turkey. Then
building energy performance is reviewed in relation with
climate adaptive façades, by focusing on the significant
publications in the field.
As a major concept of this study, ‘building energy
performance’ was added to literature by European
Commission with Energy Performance of Buildings
Directive (EPBD), published in 2002. The directive is
presenting the definition and methodology of the concept
in a clear framework which has been developing with
new targets and policies based on the initial
methodology. The main requirements of the directive are
stated as; the minimum energy performance demands
should be provided; the national methodologies should
be provided to calculate and certify the energy
performance of the building. Energy performance of a
building is defined as the calculated or measured amount
of energy demand associated with a typical use of the
building, which includes, inter alia, energy used for
heating, cooling, ventilation, hot water and lighting.
Building energy performance calculation methodology is
also described by using thermal characteristics and other
factors that play an increasingly important role are added;
such as heating and air-conditioning installations,
application of energy from renewable sources, passive
heating and cooling elements, shading, indoor air-
quality, adequate natural light and design of the building.
[2]
The attempt of Turkey in developing policies for
‘building energy performance’ has been proceeding since
the publication of ‘Code for Energy Efficiency’ in 2007;
followed by many regulations and national building
energy performance assessment tool ‘Bep-TR’. The
energy performance of the buildings is calculated by a
simple hourly dynamic method based on Turkish
Standard TS 825. [3] TS 825 was first published on 22nd
of May 2008 with the title of ‘Thermal Insulation
Requirements for Buildings’, focusing on ‘the net heating
energy demand calculation rules’ and ‘the maximum
heating energy usage limitations’. [4] According to the
data collected on January 2017; 485,000 buildings had
been certified through BEP-TR assessment tool and that
means 94% of the new constructions’ and 6% of the
existing buildings’ energy performance had been
examined. With the status at large in Turkey; 73% of
these buildings were improved to a 20-40% higher
energy performance level; and 26% of these buildings
were improved to a 40-60% higher energy performance
level. However, 90% of these certified buildings reached
to higher energy performance levels by heat insulation
applications.
As a term, ‘climate adaptive façade’ refers to a wide
context in literature including either a conventional
curtain or a photovoltaic shading device working with
solar receptors. Even the referred meaning is not new, it
is new as a concept studied by a limited group of people
through case studies, mainly focusing on the definition
and classification in literature:
Van Dijk (2010) made a research on possibilities of
adaptation in the façade of the future faculty of
Architecture at TU Delft. The climate adaptive façade is
shown as a good way of contributing good comfort levels
of a building for its users and the surroundings [5].
Loonen (2010), published a booklet on the overview of
100 CABS including case studies, prototypes and
research projects that can be used as a guide by
researches and designers to follow the adaptive building
shell technology [6]. Loonen et al. (2011) explores and
quantifies the latent potential of CABS by using building
performance simulation in combination with multi-
objective optimization and advanced control strategies.
The main approach of the study is to provide a guidance
to the simulation tool users by changing the question of
the simulation mentality from ‘what if’ to become ‘how
to’ [7]. Loonen et al. (2013) published a comprehensive
literature review on classification of Climate Adaptive
Building Shells (CABS). Dynamic exterior shading
systems are mentioned as more applicable in cost-
effectiveness manner and pointed out as a smooth
transition towards widespread application of more
advanced CABS [8]. Loonen et al. (2015) made a
research with the aim of classifying climate adaptive
façade concepts and presented an analysis of existing
classification approaches to identify requirements and
challenges of these processes [9]. Attia et al. (2015) made
a review on current state of the art of assessment
strategies for adaptive façades and found out that in
literature there is no focus on this field [10]. Aelenei et
al. (2016) studied on analysis of existing concepts and
case studies of climate adaptive façades to propose a new
approach for characterization of these façade elements
which are pointed as primary objectives of improving
energy performance of buildings and human’s comfort
[11]. Loonen et al. (2017) published a review article on
the definition of unique requirements for successful
modelling and simulation of adaptive façades; review on
the capabilities of five widely used BPS tools and
discussion on various ongoing trends and research needs
[12].
In general, climate adaptive façades are assessed through
their effects on the energy performance of hypothetical
buildings, so the results can not be compared with real
data. Current studies covering the context of this paper
are given in a chronological order as follows:
Loonen et al. (2010) studied on exploring the role of
‘Building Performance Simulation (BPS)’ in Climate

Adaptive Building Shells (CABS) through a case study;
asserting that BPS is confirmed to be a valuable tool for
designing buildings with CABS and proved as an active
tool in product design and development [13]. Kim and
Jarrett (2011), aimed to determine the influence of a
climate adaptive façade system on the energy
performance of a hypothetical office building located in
a cold climate. Since the heating loads decreased
compared to a baseline façade system; the future target is
given as, verifying the simulated energy performance
data by testing the adaptive façade system experimentally
[14]. Abboushi (2013) presented a master thesis on
developing high performance office buildings façades by
using adaptive shading and the selective reflector light
shelf technologies [15]. Bianco et al. (2017) focused on
the solution of high energy demand and discomfort
conditions in buildings with large transparent façades.
They proposed a new dynamic shading device based on
the integration of phase change materials (PCM) in an
alveolar polycarbonate panel and presented the findings
[16].
In literature, climate adaptive façades are pointed out as
a potential field for improving building energy
performance. Compared to the advanced climate
adaptive façades, dynamic shading devices are pointed
out as a smooth transition by being more feasible to apply
considering the cost effectiveness.
Regulations are showing computer aided simulation as a
tool for calculating building energy performance, by
giving the answer to the question ‘how to’. However, it
has been a matter of discussion to use the same
simulation tools for assessing effects of climate adaptive
façades on building energy performance. In the field of
climate adaptive façades, simulation is considered as a
tool which is giving the answers to the question ‘how to’;
that would serve as a guide in design and development
processes.
Considering the significant points in literature review; for
improving the energy performance of an existing
building climate adaptive shading devices are proposed
by using a simulation tool as a design guide and the
presented methodology is added to literature for future
studies.
3. INTRODUCTION AND SIMULATION OF THE
CASE BUILDING
Pointed out in literature review, studies are mainly on
hypothetical case buildings and the results can not be
compared with real data. This study fills the gap at this
point by comparing simulation results with the real data
and therefore can calculate the most accurate simulation
results of CASD. So this study deals with improving the
energy performance of an existing building by proposing
a climate adaptive façade with the most accurate
simulation results. As remarked by the literature review,
the chosen simulation tool ‘OpenStudio’ is used as a
guide to find out the answers to the question of ‘how to
apply CASD?’. OpenStudio can supply realistic output
data about the energy performance of a building by using
detailed dynamic calculation methodology of EnergyPlus
software integrated into SketchUp 3D modelling
environment. In fact, using a dynamic method is
recommended by European Commission to reach reliable
results [17].
Case building: Bayraklı Tower is located in İzmir
(latitude: 38.4511138, longitude: 27.1876025), Western
Turkey. The building has 37000 m2 closed area; with 23
stories of mainly offices and sports hall, ground floor
with a shopping mall and 3 basements with car park. All
the details of the building are taken from architectural
and mechanical application projects. The real and
simulation model views of Bayraklı Tower from the
south-east orientation is given in Figure 1a and Figure 1b.
Since the study is mainly dealing with façade of the case
building, exterior surface constructions are defined in
detail for non-transparent and transparent elements in
Table 1 and Table 2. Non- transparent façade layers are
the outer surfaces of the beams.
Table 1. Non-transparent façade surfaces
Materials Thickness
(m)
Conductivity
(W/mK)
Density
(kg/m3)
Specific
Heat (J/kgK)
Thermal Absorptance
(emittance)
Solar
Absorptance
Visible
Absorptance
Tempered glass 0.008
1.4 0.1 0 0.2 0.73 0.021 Air gap 0.02
Tempered glass 0.006
Air gap 0.04 0.03 1225 0 0.9 0.7 0.7
Fireproof gypsum board 0.012 0.16 800 90 0.9 0.7 0.7
Heat insulation
(rockwool) 0.08 0.05 19 960 0.9 0.7 0.7
Table 2. Transparent façade surfaces
Material Thickness (m) U-factor (W/m2K) Solar Heat Gain Coefficient Visible Transmittance
Temperated glass 0.008
1.4 0.20 0.16
Air gap 0.014
Interior glass 0.006
PVB 0.00076
Laminated glass 0.006
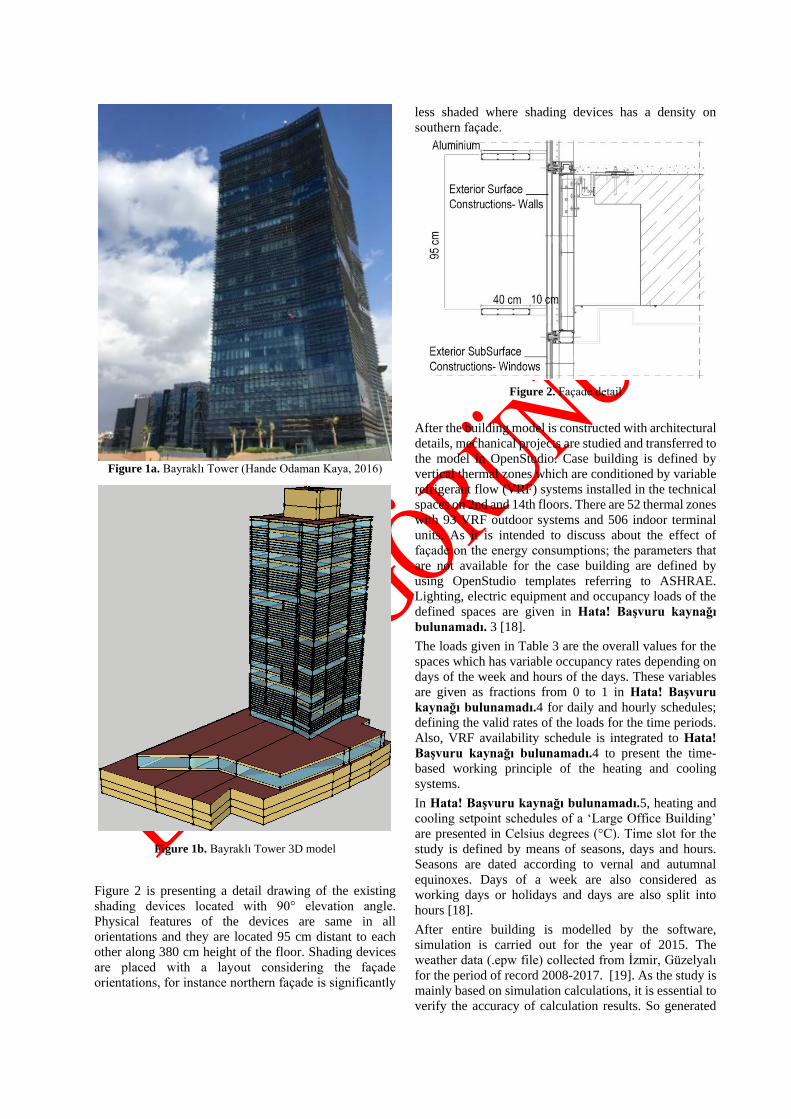
Figure 1a. Bayraklı Tower (Hande Odaman Kaya, 2016)
Figure 1b. Bayraklı Tower 3D model
Figure 2 is presenting a detail drawing of the existing
shading devices located with 90° elevation angle.
Physical features of the devices are same in all
orientations and they are located 95 cm distant to each
other along 380 cm height of the floor. Shading devices
are placed with a layout considering the façade
orientations, for instance northern façade is significantly
less shaded where shading devices has a density on
southern façade.
Figure 2. Façade detail
After the building model is constructed with architectural
details, mechanical projects are studied and transferred to
the model in OpenStudio. Case building is defined by
vertical thermal zones which are conditioned by variable
refrigerant flow (VRF) systems installed in the technical
spaces on 2nd and 14th floors. There are 52 thermal zones
with 93 VRF outdoor systems and 506 indoor terminal
units. As it is intended to discuss about the effect of
façade on the energy consumptions; the parameters that
are not available for the case building are defined by
using OpenStudio templates referring to ASHRAE.
Lighting, electric equipment and occupancy loads of the
defined spaces are given in Hata! Başvuru kaynağı
bulunamadı. 3 [18].
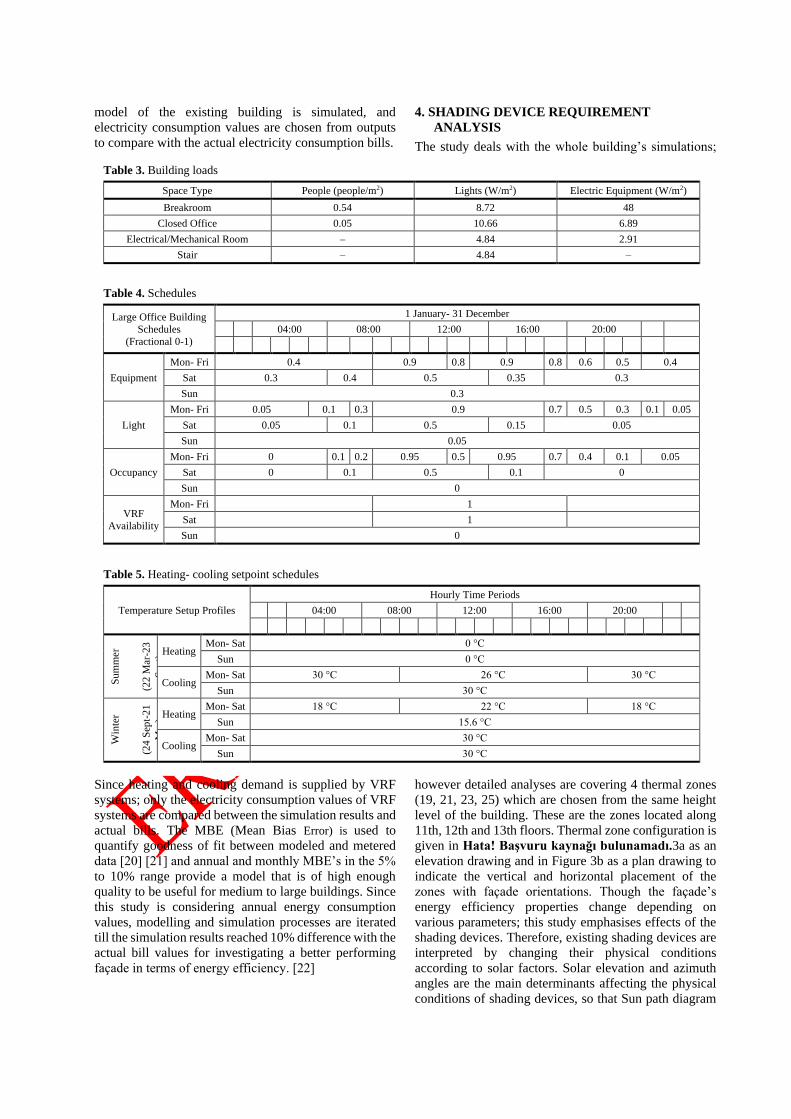
The loads given in Table 3 are the overall values for the
spaces which has variable occupancy rates depending on
days of the week and hours of the days. These variables
are given as fractions from 0 to 1 in Hata! Başvuru
kaynağı bulunamadı.4 for daily and hourly schedules;
defining the valid rates of the loads for the time periods.
Also, VRF availability schedule is integrated to Hata!
Başvuru kaynağı bulunamadı.4 to present the time-
based working principle of the heating and cooling
systems.
In Hata! Başvuru kaynağı bulunamadı.5, heating and
cooling setpoint schedules of a ‘Large Office Building’
are presented in Celsius degrees (°C). Time slot for the
study is defined by means of seasons, days and hours.
Seasons are dated according to vernal and autumnal
equinoxes. Days of a week are also considered as
working days or holidays and days are also split into
hours [18].
After entire building is modelled by the software,
simulation is carried out for the year of 2015. The
weather data (.epw file) collected from İzmir, Güzelyalı
for the period of record 2008-2017. [19]. As the study is
mainly based on simulation calculations, it is essential to
verify the accuracy of calculation results. So generated
model of the existing building is simulated, and
electricity consumption values are chosen from outputs
to compare with the actual electricity consumption bills.
Since heating and cooling demand is supplied by VRF
systems; only the electricity consumption values of VRF
systems are compared between the simulation results and
actual bills. The MBE (Mean Bias Error) is used to
quantify goodness of fit between modeled and metered
data [20] [21] and annual and monthly MBE’s in the 5%
to 10% range provide a model that is of high enough
quality to be useful for medium to large buildings. Since
this study is considering annual energy consumption
values, modelling and simulation processes are iterated
till the simulation results reached 10% difference with the
actual bill values for investigating a better performing
façade in terms of energy efficiency. [22]
4. SHADING DEVICE REQUIREMENT
ANALYSIS
The study deals with the whole building’s simulations;
however detailed analyses are covering 4 thermal zones
(19, 21, 23, 25) which are chosen from the same height
level of the building. These are the zones located along
11th, 12th and 13th floors. Thermal zone configuration is
given in Hata! Başvuru kaynağı bulunamadı.3a as an
elevation drawing and in Figure 3b as a plan drawing to
indicate the vertical and horizontal placement of the
zones with façade orientations. Though the façade’s
energy efficiency properties change depending on
various parameters; this study emphasises effects of the
shading devices. Therefore, existing shading devices are
interpreted by changing their physical conditions
according to solar factors. Solar elevation and azimuth
angles are the main determinants affecting the physical
conditions of shading devices, so that Sun path diagram
Table 3. Building loads
Space Type People (people/m2) Lights (W/m2) Electric Equipment (W/m2)
Breakroom 0.54 8.72 48
Closed Office 0.05 10.66 6.89
Electrical/Mechanical Room – 4.84 2.91
Stair – 4.84 –
Table 4. Schedules
Large Office Building
Schedules
(Fractional 0-1)
1 January- 31 December 04:00 08:00 12:00 16:00 20:00
Equipment
Mon- Fri 0.4 0.9 0.8 0.9 0.8 0.6 0.5 0.4
Sat 0.3 0.4 0.5 0.35 0.3
Sun 0.3
Light
Mon- Fri 0.05 0.1 0.3 0.9 0.7 0.5 0.3 0.1 0.05
Sat 0.05 0.1 0.5 0.15 0.05
Sun 0.05
Occupancy
Mon- Fri 0 0.1 0.2 0.95 0.5 0.95 0.7 0.4 0.1 0.05
Sat 0 0.1 0.5 0.1 0
Sun 0
VRF
Availability
Mon- Fri 1
Sat 1
Sun 0
Table 5. Heating- cooling setpoint schedules
Temperature Setup Profiles
Hourly Time Periods 04:00 08:00 12:00 16:00 20:00
Su
mm
er
(22
Mar
-23
Sep
t) Heating
Mon- Sat 0 °C
Sun 0 °C
Cooling Mon- Sat 30 °C 26 °C 30 °C
Sun 30 °C
Win
ter
(24
Sep
t-2
1
Mar
)
Heating Mon- Sat 18 °C 22 °C 18 °C
Sun 15.6 °C
Cooling Mon- Sat 30 °C
Sun 30 °C
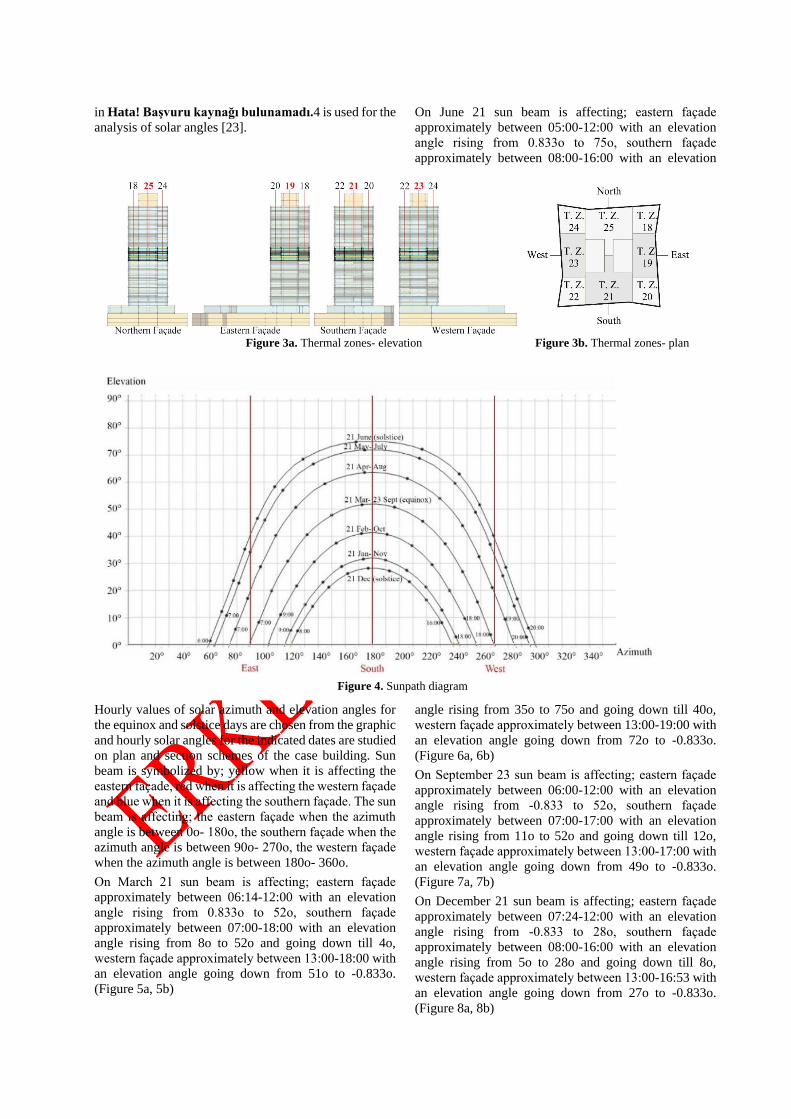
in Hata! Başvuru kaynağı bulunamadı.4 is used for the
analysis of solar angles [23].
Hourly values of solar azimuth and elevation angles for
the equinox and solstice days are chosen from the graphic
and hourly solar angles for the indicated dates are studied
on plan and section schemes of the case building. Sun
beam is symbolized by; yellow when it is affecting the
eastern façade, red when it is affecting the western façade
and blue when it is affecting the southern façade. The sun
beam is affecting; the eastern façade when the azimuth
angle is between 0o- 180o, the southern façade when the
azimuth angle is between 90o- 270o, the western façade
when the azimuth angle is between 180o- 360o.
On March 21 sun beam is affecting; eastern façade
approximately between 06:14-12:00 with an elevation
angle rising from 0.833o to 52o, southern façade
approximately between 07:00-18:00 with an elevation
angle rising from 8o to 52o and going down till 4o,
western façade approximately between 13:00-18:00 with
an elevation angle going down from 51o to -0.833o.
(Figure 5a, 5b)
On June 21 sun beam is affecting; eastern façade
approximately between 05:00-12:00 with an elevation
angle rising from 0.833o to 75o, southern façade
approximately between 08:00-16:00 with an elevation
angle rising from 35o to 75o and going down till 40o,
western façade approximately between 13:00-19:00 with
an elevation angle going down from 72o to -0.833o.
(Figure 6a, 6b)
On September 23 sun beam is affecting; eastern façade
approximately between 06:00-12:00 with an elevation
angle rising from -0.833 to 52o, southern façade
approximately between 07:00-17:00 with an elevation
angle rising from 11o to 52o and going down till 12o,
western façade approximately between 13:00-17:00 with
an elevation angle going down from 49o to -0.833o.
(Figure 7a, 7b)
On December 21 sun beam is affecting; eastern façade
approximately between 07:24-12:00 with an elevation
angle rising from -0.833 to 28o, southern façade
approximately between 08:00-16:00 with an elevation
angle rising from 5o to 28o and going down till 8o,
western façade approximately between 13:00-16:53 with
an elevation angle going down from 27o to -0.833o.
(Figure 8a, 8b)
Figure 3a. Thermal zones- elevation Figure 3b. Thermal zones- plan
Figure 4. Sunpath diagram

Figure 5a. June 21- Azimuth angles Figure 5b. June 21- Elevation angles
Figure 6a. June 21- Azimuth angles Figure 6b. June 21- Elevation angles
Figure 7a. September 23- Azimuth angles Figure 7b. September 23- - Elevation angles
Figure 8a. December 21- Azimuth angles Figure 8b. December 21- Elevation angles

Given on plan and section schemes of the case building,
hourly values of elevation angles for the equinox and
solstice days are studied from Figure 5a-5b, Figure 6a-
6b, Figure 7a-7b and Figure 8a-8b. The collected data for
elevation angles is presented as a graph given in Figure
9.
Figure 9. Hourly elevation angles
In second phase of the shading device requirement
analysis; case building is modelled without shading
devices and ‘exterior windows total transmitted beam
solar radiation energy (J)’ values of the Thermal Zones
19, 21, 23 and 25 are studied from simulation results. To
understand the seasonal changes of sunbeam elevation
angles; solstice and equinox days are used as reference
days and results are presented in Table6.
Regarding to the data in Table 6; east and west oriented
façades are mostly affected with high solar radiation in
Summer because of the low solar elevation angles of
sunbeam that passes through the façade to interior spaces.
For south facing façades it is changing as sunbeam grazes
the façade due to its high elevation angle and north facing
façades are just affected by the indirect solar radiation.
As a result, shading devices are interpreted for both
seasons in only south facing façades. Shading devices of
East and West oriented façades are considered only for
Summer. Apparently North façade is facing direct
sunbeam for a short time while the sun is rising up and
going down which can be neglected; so that it is excluded
from the field of this study.
Considering the orientation of the case building, sunpath
diagram analysis results and beam solar radiation energy
values are collected. The maximum elevation angle is
75o on 21st of June for the eastern and western façades.
Since a 60o elevated shading device can block the sun
beam coming with 75o elevation angle. Also the shading
devices located with an elevation angle less than 20o are
acting as if it is completely closed. (Figure 9) So that 20o
and 60o are accepted as the minimum and maximum
elevation angles for this study and 40o is aslo considered
as the medium elevation angle for the shading devices.
CASD proposal is determined according to the changing
shading seasons from Summer to Winter for each façade
orientation considering daily shading hours. (Table 7)
Eastern and western façades are shaded only in Summer
season with the shading devices that have 3 modes as
20o, 40o, 60o, while southern façade is shaded in 2
modes as 40o and 60o in Summer and 20o in Winter
Season.
0
10
20
30
40
50
60
70
80
06:0
0
07:0
0
08:0
0
09:0
0
10:0
0
11:0
0
12:0
0
13:0
0
14:0
0
15:0
0
16:0
0
17:0
0
18:0
0
19:0
0
20:0
0
Ele
vat
ion
Ang
les
March 21 June 21September 23 December 21
Table 6. Maximum beam solar radiation energy values transmitted from the windows, with no shading devices
Façade
Orientation
Max. Beam Solar Radiation Energy (J)
March 21 June 21 September 23 December 21
Time of
Max.
Value
Reached
Max. Beam
Solar
Radiation
Energy (J)
Time of
Max.
Value
Reached
Max. Beam
Solar
Radiation
Energy (J)
Time of
Max.
Value
Reached
Max. Beam
Solar
Radiation
Energy (J)
Time of
Max.
Value
Reached
Max. Beam
Solar
Radiation
Energy (J)
East 08:30 3.70415e+06 08:30 3.78626e+06 08:30 3.60578e+06 09:30 1.72701e+06
South 11:30 3.61313e+06 11:40 495445 11:30 2.71133e+06 11:30 4.75947e+06
West 15:40 3.2808e+06 17:30 2.87148e+06 14:50 2.92159e+06 14:50 1.96825e+06
North - 0 18:00 176068 - 0 - 0
Table 7. CASD elevation angles
Façade
Orientation
Shading
Season
Daily Shading Hours/ Elevation Angles
07:00 08:00 09:00 10:00 11:00 12:00 13:00 14:00 15:00 16:00 17:00 18:00 19:00
East Summer 20o 40o 60o –
South Summer – 40o 60o 40o –
Winter 20o –
West Summer – 60o 40o 20o –
4. SIMULATION RESULTS AND COMPARISONS
Position of the shading devices are driven out from solar
elevation angles and shading availability decisions are
driven out from solar azimuth angles as the required
shading characteristics. Apart from the adaptivity
parameters, quantity of the shading elements has changed
with the proposed façades. While existing building has a
designed layout with some reductions in shading devices
regarding to the orientation, in the proposal northern
façade has no shadings, though east, south and west
oriented façades are fully shaded. Shading devices are
placed with the same construction detail in Figure 1,
keeping the size in all proposals same with the existing
devices.The model with the existing shading devices is
used for validating the model and energy performance
comparison of the case building with the existing and
proposed shading devices.
The model with no shading devices is representing the
existing building without shading devices to be used in
shading device requirement analysis through the
‘Exterior Windows Total Transmitted Beam Solar
Radiation Energy (J)’ values chosen from the simulation
results. Considering the ‘shading device requirement
analysis’ results; CASD proposal is presented for each
façade orientation with the changing shading device
angles based on hourly and seasonal solar movements.
Regarding to the over- heating problems of an exiting
building; glazed curtain wall façade is detected as the
reason affecting heating and cooling loads directly. Since
heating and cooling demand of the case building is
supplied by VRF systems, electricity consumption is
considered as the building energy performance indicator
in this study.Annual Electricity consumption values are
used for verification of the created simulation model
through the comparison with actual electricity bills.
Then the electricity consumption values are compared
over the building model for the status with no shading
devices, with the existing shading devices and with the
proposed CASD. Table 8 presents electricity
consumption values per m2 used for 34000 m2 closed area
in total, including heating, cooling and fan usages of the
VRF systems.
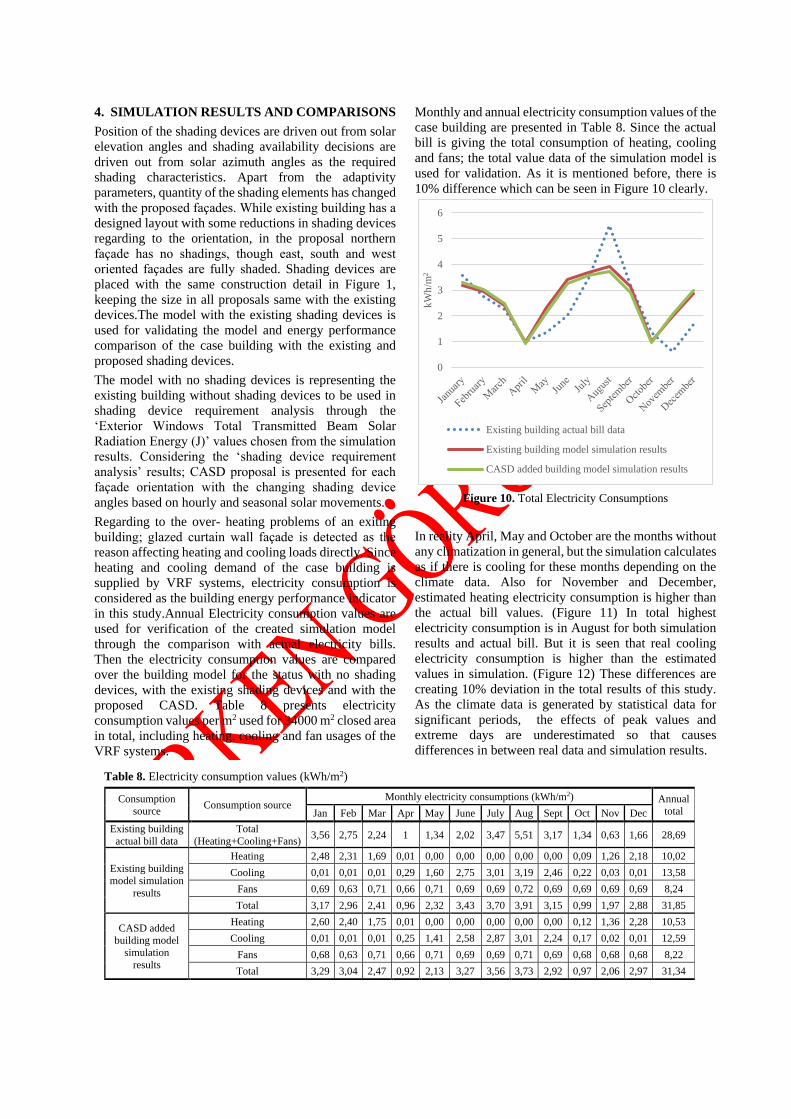
Monthly and annual electricity consumption values of the
case building are presented in Table 8. Since the actual
bill is giving the total consumption of heating, cooling
and fans; the total value data of the simulation model is
used for validation. As it is mentioned before, there is
10% difference which can be seen in Figure 10 clearly.
Figure 10. Total Electricity Consumptions
In reality April, May and October are the months without
any climatization in general, but the simulation calculates
as if there is cooling for these months depending on the
climate data. Also for November and December,
estimated heating electricity consumption is higher than
the actual bill values. (Figure 11) In total highest
electricity consumption is in August for both simulation
results and actual bill. But it is seen that real cooling
electricity consumption is higher than the estimated
values in simulation. (Figure 12) These differences are
creating 10% deviation in the total results of this study.
As the climate data is generated by statistical data for
significant periods, the effects of peak values and
extreme days are underestimated so that causes
differences in between real data and simulation results.
0
1
2
3
4
5
6
kW
h/m
2Existing building actual bill data
Existing building model simulation results
CASD added building model simulation results
Table 8. Electricity consumption values (kWh/m2)
Consumption
source Consumption source
Monthly electricity consumptions (kWh/m2) Annual
total Jan Feb Mar Apr May June July Aug Sept Oct Nov Dec
Existing building
actual bill data
Total
(Heating+Cooling+Fans) 3,56 2,75 2,24 1 1,34 2,02 3,47 5,51 3,17 1,34 0,63 1,66 28,69
Existing building
model simulation
results
Heating 2,48 2,31 1,69 0,01 0,00 0,00 0,00 0,00 0,00 0,09 1,26 2,18 10,02
Cooling 0,01 0,01 0,01 0,29 1,60 2,75 3,01 3,19 2,46 0,22 0,03 0,01 13,58
Fans 0,69 0,63 0,71 0,66 0,71 0,69 0,69 0,72 0,69 0,69 0,69 0,69 8,24
Total 3,17 2,96 2,41 0,96 2,32 3,43 3,70 3,91 3,15 0,99 1,97 2,88 31,85
CASD added
building model
simulation
results
Heating 2,60 2,40 1,75 0,01 0,00 0,00 0,00 0,00 0,00 0,12 1,36 2,28 10,53
Cooling 0,01 0,01 0,01 0,25 1,41 2,58 2,87 3,01 2,24 0,17 0,02 0,01 12,59
Fans 0,68 0,63 0,71 0,66 0,71 0,69 0,69 0,71 0,69 0,68 0,68 0,68 8,22
Total 3,29 3,04 2,47 0,92 2,13 3,27 3,56 3,73 2,92 0,97 2,06 2,97 31,34

In Hata! Başvuru kaynağı bulunamadı.9, façades are
studied through ‘Zone exterior windows total transmitted
beam solar radiation energy values (J)’ in order to
understand the solar effects on a zone-based analysis.
Following the principle of sunpath diagram analysis;
equinox and solstice days are taken as reference to
understand the dramatic solar effects on building façade.
So maximum values of ‘Zone exterior windows total
transmitted beam solar radiation energy (J)’ are chosen
for each façade orientations relevant to time of the peak
point. To understand when the solar effect is maximum
on a façade without any prevention, simulation results of
the model with no shading devices are used. The peak
values of ‘zone exterior windows total transmitted beam
solar radiation energy (J)’ with no shading devices are as
follows;
• East facing façade of thermal zone 19:
at 8:30 on June 21,
• South facing façade of thermal zone 21:
at 11:30 on December 21,
• West facing façade of thermal zone 23:
at 15:40 on March 21.
As a result of the given analysis; for eastern façade
proposed CASD decreases solar radiation from
3.78626e+06 to 1.58989e+06, for southern façade from
4.75947e+06 to 2.32675e+06 for the days with peak
values. But for the western façade CASD proposal gives
the same peak value as 3.28287e+06 on March 21 at
15:40. However CASD proposal is decreasing the solar
radiation values approximately 50% on June 21 and
September 23 for Eastern façade, on March 21 and
December 21 for Southern façade and on June 21 for
Western façade.
Figure 11. Heating Electricity Consumptions
Figure 12. Cooling Electricity Consumptions
0
0,5
1
1,5
2
2,5
3k
Wh
/m2
Existing building model simulation results
CASD added building model simulation results
0
0,5
1
1,5
2
2,5
3
3,5
kW
h/m
2
Existing building model simulation results
CASD added building model simulation results
Table 9. Zone exterior windows total transmitted beam solar radiation energy values (J)
Faç
ade
Ori
enta
tio
n
Shading
Status
March 21 June 21 September 23 December 21
Time of
Max.
Value
Reached
Max. Beam
Solar
Radiation
Energy (J)
Time of
Max.
Value
Reached
Max. Beam
Solar
Radiation
Energy (J)
Time of
Max.
Value
Reached
Max. Beam
Solar
Radiation
Energy (J)
Time of
Max.
Value
Reached
Max. Beam
Solar
Radiation
Energy (J)
Eas
t
(Th
erm
al z
on
e 23
)
No
Shading 08:30 3.70415e+06 08:30 3.78626e+06 08:30 3.60578e+06 09:30 1.72701e+06
Existing
Shading 08:30 3.35447e+06 08:30 3.13395e+06 08:30 3.16174e+06 12:21 1.54384e+06
CASD 08:30 3.70415e+06 08:20 1.58989e+06 08:30 1.70737e+06 09:30 1.72701e+06
So
uth
(Th
erm
al z
on
e 2
1)
No
Shading 11:30 3.61313e+06 11:40 495445 11:30 2.71133e+06 11:30 4.75947e+06
Existing
Shading 11:30 1.70272e+06 - 0 11:30 920126 11:30 3.59462e+06
CASD 11:30 1.25453e+06 - 0 11:30 591872 11:30 2.32675e+06
Wes
t
(Th
erm
al z
on
e 2
3)
No
Shading 15:40 3.2808e+06 17:30 2.87148e+06 14:50 2.92159e+06 14:50 1.96825e+06
Existing
Shading 16:00 2.91698e+06 17:30 2.64245e+06 15:00 2.38171e+06 15:00 1.77348e+06
CASD 15:50 3.28287e+06 17:30 1.52222e+06 15:20 1.19983e+06 14:50 1.96825e+06
5. CONCLUSION
Since the ‘best performing façade’ is still an indefinite
notion in terms of energy efficiency, this study aims to
propose a methodology to propose a CASD for any case
building. The study focuses on managing the effects of a
façade on building energy performance; interrogating the
features that are needed and the features that should be
avoided. Solar movement is determined to be the main
factor effecting the façade decisions relevant to the
requirements of the indoor environment, so the topic is
discussed within the specific parameters of the case
building.
An existing case building is modelled by using
OpenStudio software in detail of the actual project data.
Annual electricity consumption values that are discussed
as heating and cooling energy consumptions are accepted
as the building energy performance indicators. Through
the analysis on simulation results, effects of shading
devices on building energy performance are presented.
Results are analysed both in all building and thermal zone
scales through different parameters. Based on the stated
overheating problems of the south facing offices, the
study focused on the shading devices assembled to the
glazed façade. Regarding to the seasonal solar
movement; case building’s shading device requirements
are determined in detail of shading device elevation
angles and hourly/ daily shading schedules. Also,
‘exterior windows transmitted beam solar radiation
energy’ parameter is examined for seasonal periods to
understand the shading need of façades depending on
orientation. These analyses came out as; for north
oriented façades shading is not a requirement in any time
of any season; east and west oriented façades require
shading devices only in summer where the south oriented
façades require shading devices both in summer and
winter.
Considering the location of the case building, climate
conditions create cooling demand rather than the heating
demand. So, the focus of this study is the over-heating
problems of the building especially in southern façades
which causes high cooling electricity consumption
values. It is clear that existence of the shading devices is
affecting heating and cooling energy consumptions
inversely. When the effectiveness of shading devices
increases, benefit of solar effect on heating loads
decrease. That is why the shading devices increase the
heating loads even if they are climate adaptive. Since
focus of this study is over- heating problem of the case
building, decreasing the cooling demands is pointed out
as a solution. So, CASD is proposed with hourly adaptive
shading device schedules which are placed with seasonal
adaptive shading device angles specific to the façade
orientations.
Another important outcome of this study comprised due
to the solar elevation and azimuth angles; southern
façades are facing the Sun with a higher elevation angle
(47°- 75°) in summer season, compared to the winter sun
which has a lower elevation angle (5°- 28°). So that beam
solar radiation energy is much effective in winter
compared to summer for south facing façades and this is
the most crucial output of the study. Consequently, by
proposing CASD for an existing case building, this study
reveals a solution for a stated problem, which is the
occupants’ compliant about the overheating problems of
the case building.
The presented methodology of this study is applied on an
existing building to support the literature of the study
field by giving simulation results of building energy
performance calculations that are comparable with the
real data. Since the concept of climate adaptive façades
is not mature enough to be applied and examined it is not
supported by sufficient information yet. This study is
expected to examine the effects of CASD on building
energy performance through the outputs derived from
simulation results of an existing building; so that the
outputs can be compared with real data. However, the
study covers the parameters of a case building, presented
methodology can be applied on different building types
and different locations. Also, the scope of the study can
be varied by changing the minor parameters. In further
studies, CASD can be studied considering the monthly
changes of the solar angles.
DECLARATION OF ETHICAL STANDARDS
The authors of this article declare that the materials and
methods used in this study do not require ethical
committee permission and/or legal-special permission.
REFERENCES
[1] OECD. (2001). Climate Change. The Organisation for
Economic Co-operation and Development. Retrieved 5
August, 2017, from
http://www.oecd.org/env/cc/2002529.pdf.
[2] European Commission. (2018). European Commission.
Retrieved from https://ec.europa.eu/
[3] T.C. Çevre ve Şehircilik Bakanlığı. (2017). TMOBB
Elektrik Mühendisleri Odası, Retrieved from
http://www.emo.org.tr/ekler/e90ef5143376f7e_ek.pdf
[4] T825, “Binalarda Isı Yalıtım Kuralları Standardı”, (1999).
[5] Van Dijk, R. “Adaptables- An Adapative Façade for the
Future”, Delft: Delft University of Technology, (2010)
[6] Loonen, R.C.G.M., “Overview of 100 climate adaptive
building shells”, Master Thesis, Eindhoven University of
Technology, (2010).
[7] Loonen, R., Trcka, M., & Hensen, M., “Exploring the
potential of climate adaptive building shells”, Sydney:
International Building Performance Simulation
Association, 2148-2155, (2011).
[8] Loonen, R., Trcka, M., Costola, D., & Hensen, J., “Climate
adaptive building shells: State-of-the-art and future
challenges”, Renewable and Sustainable Energy
Reviews, 25: 483-493, (2013).
[9] Loonen, R., Rico-Martinez, J., Favoino, F., Brzezicki, M.,
Menezo, C., La Ferla, G., & Aelenei, L. “Design for
façade adaptability- Towards a unified and systematic
characterization”, 10th Conference on Building Skins,
Bern, 1284-1294, (2015).
[10] Attia, S., Favoino, F., Loonen, R., Petrovski, A., & Monge-
Barrio, “A. Adaptive façades system assessment: An
initial review”, Building Skins, 1265-1273, (2015).
[11] Aelenei, D., Aelenei, L., & Vieira, C., “Adaptive façade:
concept, applications, research questions”, Energy
Procedia, 91: 269-275, (2016).
[12] Loonen, R., Favoino, F., Hensen, J., & Overend, M.,
“Review of current status, requirements and opportunities
for building performance simulation of adaptive façades”,
Journal of Building Performance Simulation, 10(2):
205-223, (2017).
[13] Loonen, R., Trcka, M., Costola, D., & Hensen, J.,
“Performance simulation of climate adaptive building
shells-Smart Energy Glass as a case study”, Proceedings
of the Ninth International Conference on System
Simulation in Buildings, Liege: Université de Liège -
Atelier des Presses, 1-19, (2010).
[14] Kim, K.-H., “A comparative life cycle assessment of a
transparent composite façade system and a glass curtain
wall system”, Energy and Buildings, 12: 3436-3445,
(2011).
[15] Abboushi, B. K., “The effects of adaptive shading and the
selective reflector light shelf on office building energy
efficiency and daylight performance in hot arid regions”,
Master Thesis, University of Arizona, (2013).
[16] Bianco, L., Komerska, A., Cascone, Y., Serra, V., Zinzi,
M., Carnielo, E., & Ksionek, D., “Thermal and optical
characterisation of dynamic shading systems with PCMs
through laboratory experimental measurements”, Energy
and Buildings, 163: 92-110, (2018).
[17] Ganiç, N., “Calculation of cost optimal levels of minimum
Energy Performance Requirements for Office Building
Retrofits”, Master Thesis, İstanbul Technical University,
(2012).
[18] ASHRAE, “Nonresidential Cooling and Heating Load
Calculation Procedures, Handbook- Fundamentals”,
ASHRAE (American Society of Heating, Refrigerating
and Air-Conditioning Engineers), Atlanta, USA, (2009).
[19] Climate.OneBuilding. (2019) WMO Region 6 – Europe
Repository of free climate data for building performance
simulation: retrieved from
http://climate.onebuilding.org/.
[20] Krieder, J.F. & Haberl, J.S., “Predicting hourly building
energy use: The great energy predictor shootout -
Overview and discussion of results”, ASHRAE Journal,
36:6, United States, (1994).
[21] McCray, J.A., Bailey, P.L., Parker, J.L. & Gillman, R.,
“Using Data Visualization Tools for the Calibration of
Hourly DOE-2.1E Simulations”, Proceeding of Building
Simulation, 95: 461- 466, (1995).
[22] Cohen, D. A., & Bailey, P., “An approach to calibrating
DOE-2 simulation models using hourly end-use data and
data visualization software”, ACEEE Summer Study on
Energy Efficiency in Buildings, Pacific Grove, CA (US),
(1998).
[23] SunEarthTools. (2017, December). Solar tools. April 17,
2017 from Sun position:
https://www.sunearthtools.com/dp/tools/pos_sun.php.
[24] Jin, Q., Overend, M., & Favoino, F., “Towards an ideal
adaptive glazed façade for office buildings”, Energy
Procedia, 62, (2014).
[25] Favoino, F., Overend, M., & Jin, Q., “The optimal thermo-
optical properties and energy saving potential of adaptive
glazing technologies”, Applied Energy, 156: 1-15,
(2015).
[26] De Boer, B. J., Ruijg, G. J., Loonen, R. C. G. M., Trcka,
M., Hensen, J. L. M., & Kornaat, W., “Climate adaptive
building shells for the future–optimization with an
inverse modelling approach”, Energy efficiency first:
The foundation of a low-carbon society, 1413-1422,
(2011).
[27] Ferguson, S., Siddiqi, A., Lewis, K., & de Weck, O.,
“Flexible and reconfigurable systems: Nomenclature and
review”, ASME 2007 International Design Engineering
Technical Conferences and Computers and
Information in Engineering Conference, American
Society of Mechanical Engineers, 249-263, (2007).
[28] Gür, N. V. & Aygün, M., “Mimaride sürdürülebilirlik
kapsamında değişken yapı kabukları için bir tasarım
destek sistemi”, İTÜdergisi/a mimarlık, planlama,
tasarım, 7(1): 74-82, (2008).
[29] Orhon, A. V., “Akıllı Yapı Kabukları”, 11. Ulusal Tesisat
Mühendisliği Kongresi, İzmir Chamber of Mechanical
Engineers, 1481-1487, (2013).
[30] Gür, N. V., “Mimaride sürdürülebilirlik kapsamında
değişken yapı kabukları için bir tasarım destek sistemi”,
Phd Thesis, İstanbul Technical University, (2007).