Embed Size (px)
Citation preview

COMMONWEALTH OF KENTUCKY
JUSTICE & PUBLIC SAFETY CABINET
2015 Overdose Fatality Report
KENTUCKY OFFICE OF DRUG CONTROL POLICY
John C. Tilley, Secretary
Justice & Public Safety Cabinet
Van Ingram, Executive Director
Office of Drug Control Policy

Table of Contents
Introduction ……………………………………………………………….………....Page 3
Highlights of the 2015 Findings……………………………………….…….…..Page 4
Overdose Deaths by County …………………………………………….…….….Page 7
Kentucky Resident Drug Overdose Deaths with the Average Annual Rate (per
100,000 residents)…………………………………………………………..….…..Page 14
Average Annual Drug Overdose Death Rate Based on Decedent’s County of
Residence, 2012-2015…………………………….. …………………….…….….Page 18
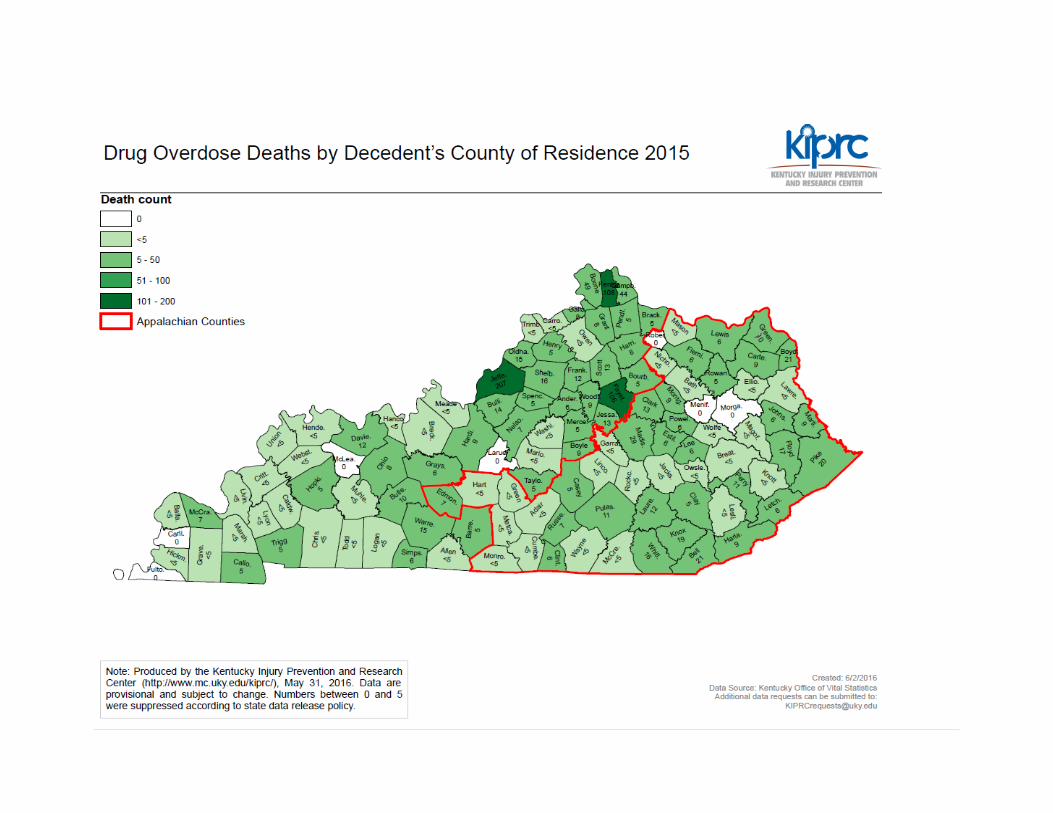
Drug Overdose Deaths by Decedent’s County of Residence, 2015
(MAP)…………………………………………………………………..….…….…..…Page 19
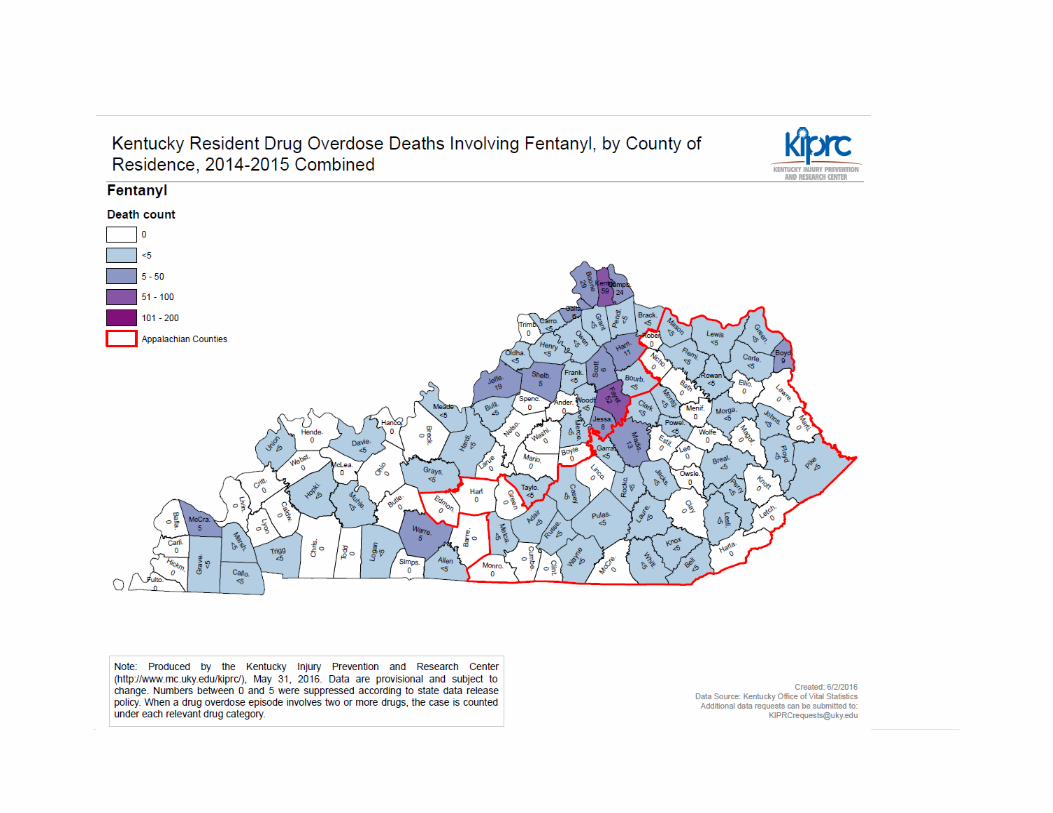
Kentucky Resident Drug Overdose Deaths Involving Fentanyl, by County of
Residence, 2012-2015 Combined (MAP)….…………………………….….…..Page 20
Kentucky Resident Drug Overdose Deaths Involving Heroin, by County of
Residence, 2014-2015 Combined (MAP)……...…………………………….….Page 21

Introduction
Substance abuse, particularly the diversion and abuse of prescription drugs along with
heroin and illicit fentanyl, remains one of the most critical public health and safety
issues facing Kentucky. Over the past decade, the number of Kentuckians who die from
drug overdoses has steadily climbed to more than 1,000 each year, exacting a
devastating toll on families, communities, social services and economic stability and
growth.
In an effort to reverse the trend, the Commonwealth has implemented a number of
program and policy initiatives, including but not limited to the statewide use of
prescription drug monitoring programs, expanded availability of substance abuse
treatment opportunities, and the enactment of laws (House Bill 1 from the 2012 Special
Session and House Bil 217 from the 2013 Regular Session) specifically addressing the
availablity of prescription medications. Senate Bill 192 in the 2015 session increased
penalties for traffickers and included a number of harm-reduction measures aimed at
reducing overdose deaths.
HB 1 mandates that the Kentucky Office of Drug Control Policy, in cooperation with the
Kentucky Medical Examiner’s Office, prepare and publish an annual public report to the
Secretary of the Justice and Public Safety Cabinet to include:
(1) The number of drug-related deaths;
(2) The decedent's age, race, and gender, but not his or her name or address;
(3) The counties in which those deaths occurred;
(4) The scientific, trade, or generic names of the drugs involved; and
(5) The method by which the drugs were obtained, when available.
This report was compiled utilizing data from the Kentucky Medical Examiner’s Office,
the Kentucky Injury Prevention & Research Center (KIPRC), and the Kentucky Office of
Vital Statistics (OVS).
The Kentucky Injury Prevention and Research Center (KIPRC), with support from the
Centers for Disease Control and Prevention, launched the Drug Overdose Technical
Assistance Core (DOTAC) to support local health departments, community coalitions,
and state and local agencies in their efforts to address substance misuse, abuse, and
overdose. DOTAC’s goal is to support and enhance local agencies’ and community
organizations' access to timely local data and analytical results on controlled substance
prescribing, drug related morbidity and mortality trends.
More information on the available data, analytical and community services is available
here: http://www.mc.uky.edu/kiprc/dotac/index.html

Highlights of the 2015 findings include:
Kentucky overdose fatalities increased in 2015. Overdose deaths of
Kentucky residents, regardless of where the death occurred, and non-
residents who died in Kentucky, numbered 1,248 as tabulated in May 2016,
compared to 1,071 overdose deaths counted in the 2014 report.1
People age 45 to 54 were the largest demographic in overdose deaths.
Autopsied and toxicology reports from coroners show overdose deaths
attributed to the use of heroin were involved in approximately 28 percent of
deaths in 2015.
Overdose deaths containing fentanyl, either combined with heroin or alone,
occurred in 420 cases – 34 percent of all deaths.
Jefferson County had the most overdose deaths of any county, with 268.
The largest increase in overdose fatalities occurred in Jefferson County, where
deaths increased by 64, from with 204 deaths in 2014 to 268 in 2015. Deaths in
Kenton County increased by 41, from 71 in 2014 to 112 in 2015. The total in
Fayette County increased by 29, from 112 in 2014 to 141 in 2015.
The largest decrease occurred in Bullitt County, which had 11 fewer fatalities in
2015 compared to the previous year. Other counties with significant declines in
2015 include McCracken County, which declined by 10; and Perry County, which
declined by 9.
Overdose deaths in some Kentucky counties, when numbers were compared on
a per-capita from 2012 through 2015, showed high rates. The top eight
counties by overdose deaths per 100,000 people for 2012 through 2015 are:
Leslie County 68.63 per 100,000
Bell County 61.2 per 100,000
Gallatin County 52.55 per 100,000
Knott County 48.65 per 100,000
1 Number of 2015 known overdose deaths as of June, 2016. A small number of overdose deaths may still be
reported for the previous year after this date. For comparison purposes, the 2012 Overdose Fatality Report
indicated 1,004 deaths; by the end of 2013, the final number of overdose deaths for 2012 was 1,070.
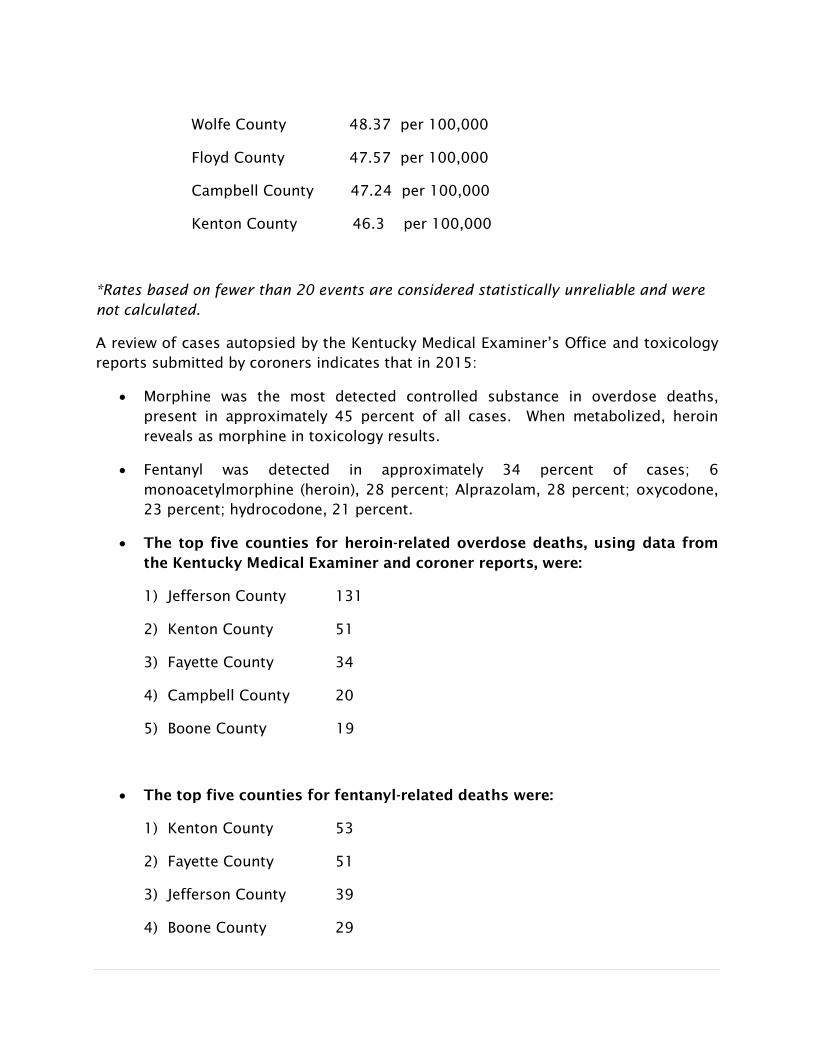
Wolfe County 48.37 per 100,000
Floyd County 47.57 per 100,000
Campbell County 47.24 per 100,000
Kenton County 46.3 per 100,000
*Rates based on fewer than 20 events are considered statistically unreliable and were
not calculated.
A review of cases autopsied by the Kentucky Medical Examiner’s Office and toxicology
reports submitted by coroners indicates that in 2015:
Morphine was the most detected controlled substance in overdose deaths,
present in approximately 45 percent of all cases. When metabolized, heroin
reveals as morphine in toxicology results.
Fentanyl was detected in approximately 34 percent of cases; 6
monoacetylmorphine (heroin), 28 percent; Alprazolam, 28 percent; oxycodone,
23 percent; hydrocodone, 21 percent.
The top five counties for heroin-related overdose deaths, using data from
the Kentucky Medical Examiner and coroner reports, were:
1) Jefferson County 131
2) Kenton County 51
3) Fayette County 34
4) Campbell County 20
5) Boone County 19
The top five counties for fentanyl-related deaths were:
1) Kenton County 53
2) Fayette County 51
3) Jefferson County 39
4) Boone County 29
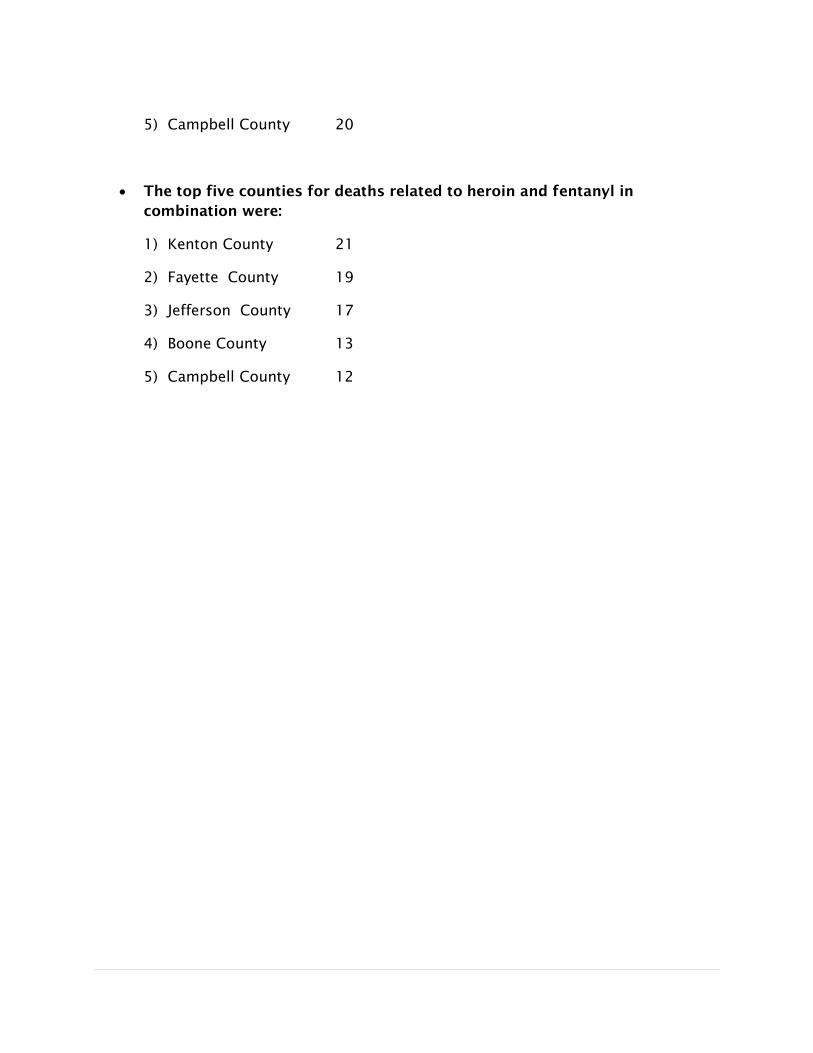
5) Campbell County 20
The top five counties for deaths related to heroin and fentanyl in
combination were:
1) Kenton County 21
2) Fayette County 19
3) Jefferson County 17
4) Boone County 13
5) Campbell County 12

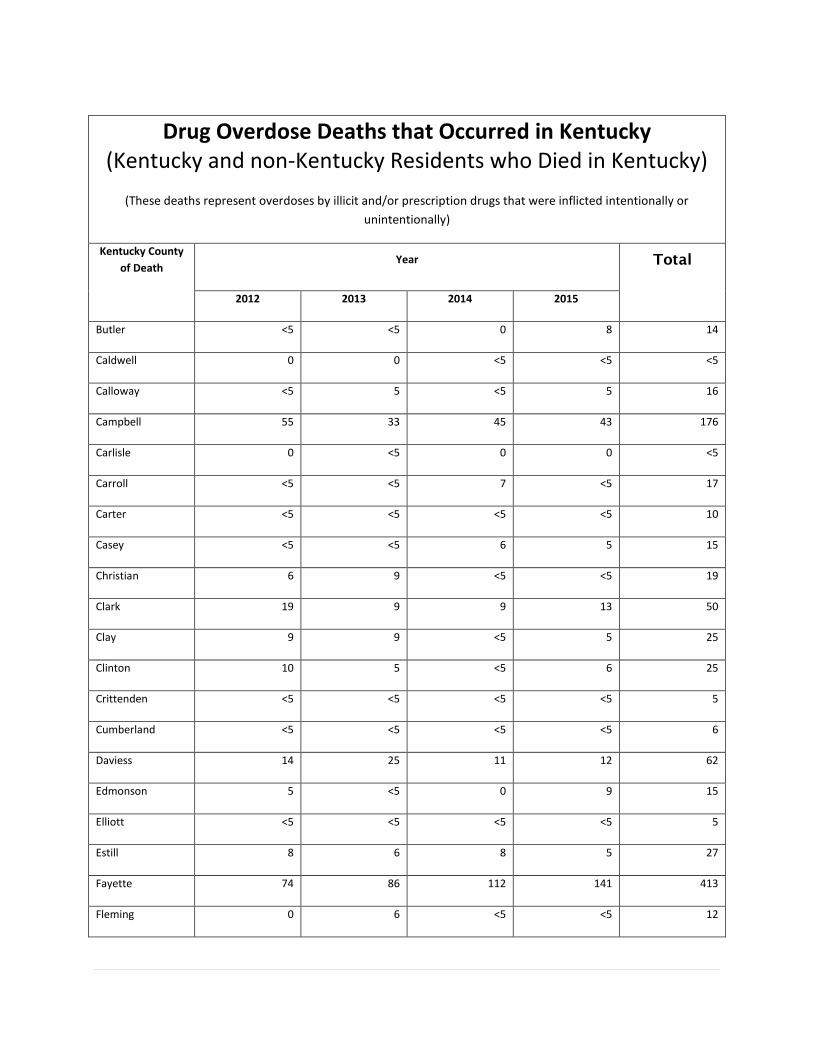
Overdose Deaths by County
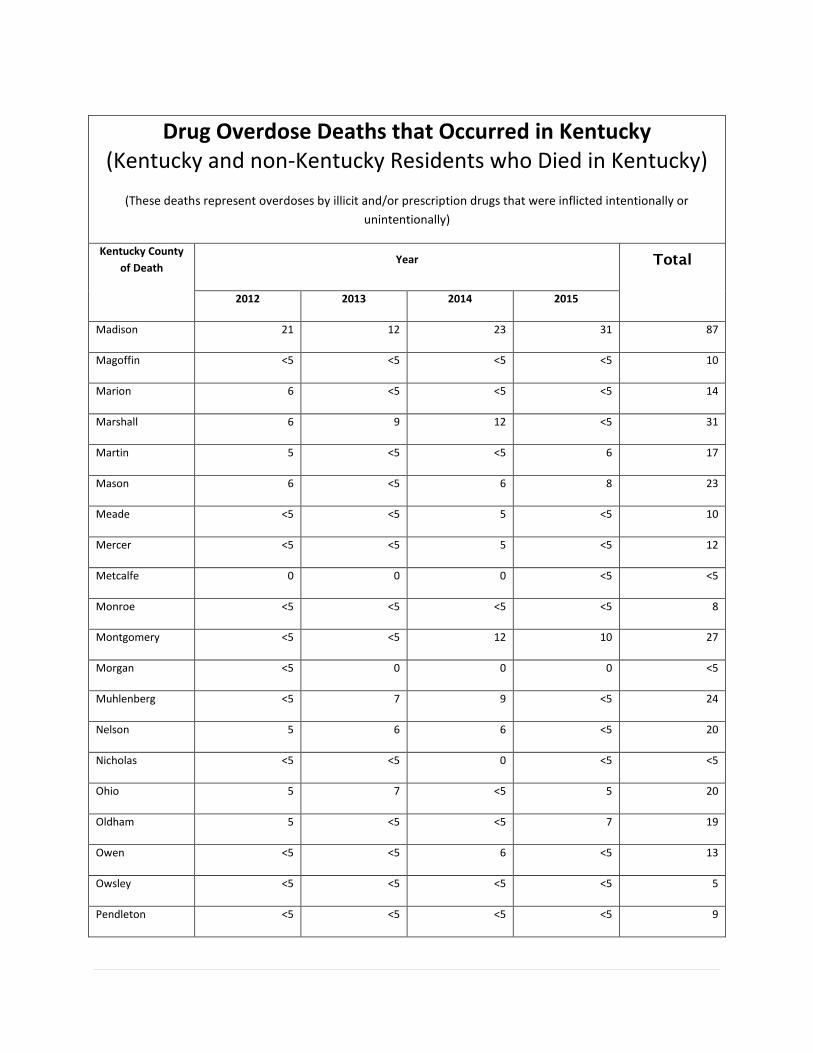
The following chart lists the number of drug overdose deaths by county for 2012
through 2015.
The information was provided by the Kentucky Injury Prevention & Research Center and
the Kentucky Office of Vital Statistics
Drug Overdose Deaths that Occurred in Kentucky (Kentucky and non-Kentucky Residents who Died in Kentucky)
(These deaths represent overdoses by illicit and/or prescription drugs that were inflicted intentionally or
unintentionally)
Kentucky County
of Death Year Total
2012 2013 2014 2015
Adair <5 5 5 6 17
Allen <5 <5 5 <5 15
Anderson 5 5 <5 5 17
Ballard 0 0 0 <5 <5
Barren 5 9 <5 5 23
Bath <5 <5 <5 0 5
Bell 15 26 11 20 72
Boone 34 36 48 62 180
Bourbon <5 5 <5 <5 13
Boyd 12 9 13 24 58
Boyle <5 <5 <5 8 17
Bracken 0 <5 0 <5 5
Breathitt 9 6 8 <5 25
Breckinridge <5 <5 0 <5 7
Bullitt 18 14 22 11 65
Drug Overdose Deaths that Occurred in Kentucky (Kentucky and non-Kentucky Residents who Died in Kentucky)
(These deaths represent overdoses by illicit and/or prescription drugs that were inflicted intentionally or
unintentionally)
Kentucky County
of Death Year Total
2012 2013 2014 2015
Butler <5 <5 0 8 14
Caldwell 0 0 <5 <5 <5
Calloway <5 5 <5 5 16
Campbell 55 33 45 43 176
Carlisle 0 <5 0 0 <5
Carroll <5 <5 7 <5 17
Carter <5 <5 <5 <5 10
Casey <5 <5 6 5 15
Christian 6 9 <5 <5 19
Clark 19 9 9 13 50
Clay 9 9 <5 5 25
Clinton 10 5 <5 6 25
Crittenden <5 <5 <5 <5 5
Cumberland <5 <5 <5 <5 6
Daviess 14 25 11 12 62
Edmonson 5 <5 0 9 15
Elliott <5 <5 <5 <5 5
Estill 8 6 8 5 27
Fayette 74 86 112 141 413
Fleming 0 6 <5 <5 12

Drug Overdose Deaths that Occurred in Kentucky (Kentucky and non-Kentucky Residents who Died in Kentucky)
(These deaths represent overdoses by illicit and/or prescription drugs that were inflicted intentionally or
unintentionally)
Kentucky County
of Death Year Total
2012 2013 2014 2015
Floyd 18 17 21 16 72
Franklin 5 15 10 14 44
Fulton <5 0 0 0 <5
Gallatin <5 <5 <5 5 10
Garrard <5 <5 <5 <5 12
Grant 13 8 13 6 40
Graves 7 5 <5 5 21
Grayson 9 6 8 5 28
Green <5 <5 <5 <5 7
Greenup 5 11 9 8 33
Hancock <5 0 <5 <5 <5
Hardin 10 9 18 10 47
Harlan 12 12 6 10 40
Harrison <5 5 6 7 19
Hart <5 <5 <5 <5 7
Henderson 7 6 5 <5 22
Henry 0 0 <5 <5 <5
Hickman 0 0 0 <5 <5
Hopkins 5 20 8 <5 37
Jackson 0 0 0 <5 <5

Drug Overdose Deaths that Occurred in Kentucky (Kentucky and non-Kentucky Residents who Died in Kentucky)
(These deaths represent overdoses by illicit and/or prescription drugs that were inflicted intentionally or
unintentionally)
Kentucky County
of Death Year Total
2012 2013 2014 2015
Jefferson 192 192 204 255 843
Jessamine 6 <5 8 10 26
Johnson 9 7 <5 7 26
Kenton 59 65 71 112 307
Knott 10 <5 7 <5 23
Knox 13 7 <5 16 39
Larue 0 <5 <5 0 <5
Laurel 19 6 18 10 53
Lawrence 8 5 5 6 24
Lee 0 <5 <5 5 10
Leslie 8 <5 9 5 26
Letcher 11 9 <5 6 30
Lewis <5 0 <5 <5 5
Lincoln 8 <5 <5 <5 14
Livingston <5 <5 <5 <5 7
Logan <5 <5 5 <5 15
Lyon <5 <5 0 <5 <5
McCracken 21 18 20 10 69
McCreary <5 <5 0 <5 8
McLean <5 <5 0 0 <5
Drug Overdose Deaths that Occurred in Kentucky (Kentucky and non-Kentucky Residents who Died in Kentucky)
(These deaths represent overdoses by illicit and/or prescription drugs that were inflicted intentionally or
unintentionally)
Kentucky County
of Death Year Total
2012 2013 2014 2015
Madison 21 12 23 31 87
Magoffin <5 <5 <5 <5 10
Marion 6 <5 <5 <5 14
Marshall 6 9 12 <5 31
Martin 5 <5 <5 6 17
Mason 6 <5 6 8 23
Meade <5 <5 5 <5 10
Mercer <5 <5 5 <5 12
Metcalfe 0 0 0 <5 <5
Monroe <5 <5 <5 <5 8
Montgomery <5 <5 12 10 27
Morgan <5 0 0 0 <5
Muhlenberg <5 7 9 <5 24
Nelson 5 6 6 <5 20
Nicholas <5 <5 0 <5 <5
Ohio 5 7 <5 5 20
Oldham 5 <5 <5 7 19
Owen <5 <5 6 <5 13
Owsley <5 <5 <5 <5 5
Pendleton <5 <5 <5 <5 9

Drug Overdose Deaths that Occurred in Kentucky (Kentucky and non-Kentucky Residents who Died in Kentucky)
(These deaths represent overdoses by illicit and/or prescription drugs that were inflicted intentionally or
unintentionally)
Kentucky County
of Death Year Total
2012 2013 2014 2015
Perry 18 12 15 9 54
Pike 32 24 32 23 111
Powell 8 5 9 5 27
Pulaski 17 13 10 9 49
Rockcastle 5 <5 <5 <5 16
Rowan 6 6 5 12 29
Russell 8 <5 13 7 32
Scott 11 <5 5 8 27
Shelby <5 <5 9 12 29
Simpson <5 <5 0 5 9
Spencer 0 <5 <5 <5 6
Taylor 9 8 0 <5 21
Todd <5 <5 <5 <5 8
Trigg <5 <5 <5 6 11
Trimble <5 <5 <5 <5 5
Union 6 5 6 <5 21
Warren 18 20 18 19 75
Washington 0 0 <5 <5 <5
Wayne <5 <5 <5 <5 15
Webster 0 <5 <5 <5 5

Drug Overdose Deaths that Occurred in Kentucky (Kentucky and non-Kentucky Residents who Died in Kentucky)
(These deaths represent overdoses by illicit and/or prescription drugs that were inflicted intentionally or
unintentionally)
Kentucky County
of Death Year Total
2012 2013 2014 2015
Whitley 22 13 13 15 63
Wolfe <5 <5 <5 <5 10
Woodford <5 5 <5 6 16
All 1,071 1,010 1,088 1,248 4,417

Kentucky Resident Drug Overdose Deaths (These deaths represent overdoses by illicit and/or prescription drugs that were inflicted intentionally
or unintentionally)
County of RESIDENCE
year Number of Drug
Overdose Deaths,
2012-2015 combined
Average Annual Rate (per 100,000
residents) 2012 2013 2014 2015
KENTUCKY (Total)
1,032
1,003
1,069
1,218
4,322
24.53
Adair <5 5 <5 <5 14 18.53*
Allen <5 <5 <5 <5 15 18.38*
Anderson 5 5 <5 6 18 20.63*
Ballard 0 <5 <5 <5 <5 +
Barren <5 10 <5 5 23 13.35
Bath <5 <5 <5 <5 12 24.90*
Bell 11 24 12 21 68 61.2
Boone 30 39 35 49 153 30.51
Bourbon <5 7 <5 5 18 22.48*
Boyd 10 5 14 21 50 25.62
Boyle <5 <5 <5 9 20 16.92
Bracken 0 0 <5 5 6 17.85*
Breathitt 7 5 7 <5 21 38.8
Breckinridge <5 <5 <5 <5 10 12.49*
Bullitt 22 11 26 14 73 23.59
Butler <5 <5 0 10 15 29.18*
Caldwell <5 <5 <5 <5 6 11.73*
Calloway 6 <5 <5 5 17 11.12*
Campbell 55 29 45 44 173 47.24
Carlisle 0 <5 0 0 <5 +
Carroll <5 <5 7 <5 17 39.37*
Carter <5 7 <5 9 22 20.14
Casey <5 <5 <5 5 11 17.24*
Christian 5 9 <5 <5 18 6.06*
Clark 18 10 8 13 49 34.31
Clay 8 7 <5 5 22 25.91
Clinton 10 5 7 6 28 68.65
Crittenden <5 <5 <5 <5 6 16.29*
Cumberland <5 <5 <5 <5 6 22.08*
Daviess 13 23 10 12 58 14.73
Edmonson <5 <5 0 7 14 29.01*

Kentucky Resident Drug Overdose Deaths (These deaths represent overdoses by illicit and/or prescription drugs that were inflicted intentionally
or unintentionally)
County of RESIDENCE year Number of Drug
Overdose Deaths,
2012-2015 combined
Average Annual Rate (per 100,000
residents)
Elliott <5 <5 <5 <5 6 19.54*
Estill 11 <5 8 6 28 48.49
Fayette 54 63 84 106 307 24.75
Fleming 0 5 <5 6 14 24.04*
Floyd 16 18 22 17 73 47.57
Franklin <5 14 11 12 41 20.55
Fulton <5 0 0 0 <5 +
Gallatin 5 <5 <5 8 18 52.55*
Garrard 5 <5 <5 <5 15 22.04*
Grant 12 9 12 8 41 41.57
Graves 7 6 <5 <5 21 14
Grayson 9 6 9 6 30 28.79
Green 0 <5 <5 <5 5 11.23*
Greenup <5 14 7 10 34 23.36
Hancock <5 0 <5 <5 <5 +
Hardin 12 12 18 9 51 11.86
Harlan 14 12 9 9 44 38.99
Harrison <5 5 7 8 23 30.85
Hart <5 <5 <5 <5 9 12.18*
Henderson 8 8 <5 <5 24 12.93
Henry <5 <5 <5 5 11 17.77*
Hickman <5 0 0 <5 <5 +
Hopkins <5 17 7 5 33 17.77
Jackson <5 0 <5 <5 <5 +
Jefferson 172 179 184 207 742 24.47
Jessamine 9 <5 9 13 35 17.27
Johnson 8 9 <5 6 27 28.93
Kenton 55 65 75 108 303 46.3
Knott 11 7 9 <5 31 48.65
Knox 13 10 <5 19 45 35.44
Larue 0 <5 <5 0 <5 +
Laurel 16 9 15 12 52 21.72
Lawrence 8 <5 <5 <5 18 28.48*
Lee 0 <5 <5 6 11 39.42*
Leslie 11 5 10 <5 30 68.63
Letcher 11 9 6 6 32 34.07
Lewis <5 0 <5 6 9 16.33*

Kentucky Resident Drug Overdose Deaths (These deaths represent overdoses by illicit and/or prescription drugs that were inflicted intentionally
or unintentionally)
County of RESIDENCE year Number of Drug
Overdose Deaths,
2012-2015 combined
Average Annual Rate (per 100,000
residents)
Lincoln 7 <5 <5 <5 16 16.36*
Livingston <5 <5 <5 <5 9 24.02*
Logan <5 <5 5 <5 15 13.96*
Lyon <5 <5 <5 <5 5 14.89*
Madison 20 13 23 29 85 24.64
Magoffin 5 5 <5 <5 13 25.15*
Marion 7 <5 <5 <5 17 21.64*
Marshall 6 11 12 <5 33 26.48
Martin 5 <5 <5 9 21 41.77
Mason <5 <5 5 <5 15 21.76*
McCracken 19 16 19 7 61 23.35
McCreary <5 <5 <5 <5 12 16.73*
McLean <5 <5 0 0 <5 +
Meade <5 <5 6 <5 15 12.95*
Menifee 0 <5 0 0 <5 +
Mercer <5 <5 <5 5 13 15.22*
Metcalfe 0 0 <5 <5 <5 +
Monroe <5 <5 <5 <5 9 20.97*
Montgomery <5 <5 11 9 26 23.83
Morgan <5 <5 <5 0 <5 +
Muhlenberg <5 8 8 <5 22 17.59
Nelson <5 5 6 7 22 12.3
Nicholas <5 <5 <5 <5 6 21.22*
Ohio 6 8 <5 8 25 25.95
Oldham <5 6 <5 15 29 11.4
Owen <5 <5 6 <5 12 28.08*
Owsley <5 <5 <5 <5 6 32.87*
Pendleton <5 <5 7 5 19 32.8*
Perry 16 9 13 11 49 43.96
Pike 29 19 29 20 97 38.42
Powell 7 5 11 6 29 58.45
Pulaski 19 11 9 11 50 19.63
Rockcastle 8 <5 <5 <5 19 28.11*
Rowan 6 <5 <5 5 19 20.10*
Russell 7 6 15 7 35 49.52
Scott 11 7 8 13 39 19.23
Shelby <5 <5 7 16 28 15.69

Kentucky Resident Drug Overdose Deaths (These deaths represent overdoses by illicit and/or prescription drugs that were inflicted intentionally
or unintentionally)
County of RESIDENCE year Number of Drug
Overdose Deaths,
2012-2015 combined
Average Annual Rate (per 100,000
residents)
Simpson <5 <5 <5 6 11 15.45*
Spencer <5 <5 <5 5 11 15.59*
Taylor 10 8 <5 5 24 23.94
Todd <5 <5 <5 <5 8 15.94*
Trigg <5 <5 <5 5 9 15.78*
Trimble <5 <5 <5 <5 7 19.93*
Union 7 6 6 <5 23 38.07
Warren 17 16 16 15 64 13.35
Washington <5 0 <5 <5 <5 +
Wayne <5 <5 6 <5 16 19.42*
Webster <5 <5 <5 <5 8 15.03*
Whitley 25 14 16 16 71 49.54
Wolfe <5 <5 <5 <5 14 48.37*
Woodford <5 5 5 9 22 21.64