Embed Size (px)
Citation preview
Amino acid metabolism inhibits antibody-driven kidney injury by inducing autophagy
Kapil Chaudhary1, Rahul Shinde1, Haiyun Liu1, Jaya P. Gnana-Prakasam2, Rajalakshmi Veeranan-Karmegam2, Lei Huang1,3, Buvana Ravishankar1,7, Jillian Bradley1, Nino Kvirkvelia4, Malgorzata McManamin4, Wei Xiao1, Daniel Kleven5, Andrew L. Mellor1,4, Michael P. Madaio4, and Tracy L. McGaha1,4,6
1Cancer Immunology, Inflammation, and Tolerance Program, GRU Cancer Center
2Signaling and Angiogenesis Program, GRU Cancer Center
3Department of Radiology, Medical College of Georgia, Georgia Regents University
4Department of Medicine, Medical College of Georgia, Georgia Regents University
5Department of Pathology, Medical College of Georgia, Georgia Regents University
Abstract
Inflammatory kidney disease is a major clinical problem that can result in end-stage renal failure.
Here we show that antibody mediated inflammatory kidney injury and renal disease in a mouse
nephrotoxic serum nephritis (NTN) model was inhibited by amino acid metabolism and a
protective autophagic response. The metabolic signal was driven by IFN-γ-mediated induction of
indoleamine 2,3 dioxygenase 1 (Ido1) enzyme activity with subsequent activation of a stress
response dependent on the eIF2α kinase general control nonderepressible 2 (GCN2). Activation of
GCN2 suppressed proinflammatory cytokine production in glomeruli and reduced macrophage
recruitment to the kidney during the incipient stage of antibody induced glomerular inflammation.
Further, inhibition of autophagy or genetic ablation of Ido1 or Gcn2 converted antibody-induced,
self-limiting nephritis to fatal end-stage renal disease. Conversely, increasing kidney IDO1
activity or treating mice with a GCN2 agonist induced autophagy and protected mice from
nephritic kidney damage. Finally kidney tissue from patients with antibody-driven nephropathy
showed increased IDO1 abundance, GCN2 activation and autophagy induction. Thus, these
findings support the hypothesis that the IDO-GCN2 pathway in glomerular stromal cells is a
critical negative feedback mechanism that limits inflammatory renal pathology by inducing
autophagy.
6Address correspondence to: Dr. Tracy McGaha, PhD, Department of Medicine, Medical College of Georgia, CN4143, 1120 15th
Street, Augusta, GA, 30912, USA, [email protected] address: Department of Cancer Immunology, Genentech, 1 DNA Way South, San Francisco, CA, 94080, USA
Author contributions. RS, HL, JPG-N, R V-K, LH, BR, JB, NK, and MM contributed to experimental design and execution. DK provided human materials and critical review of the manuscript. ALM and MPM were involved in experimental planning and execution, critical assessment of data, and reviewing the manuscript. KC contributed to experimental design and execution, analysis of data, writing and review of the manuscript. TLM was responsible for experimental design, data analysis and interpretation and wrote the manuscript.
Competing interests. The authors declare that they have no competing interests.
HHS Public AccessAuthor manuscriptJ Immunol. Author manuscript; available in PMC 2016 June 15.
Published in final edited form as:J Immunol. 2015 June 15; 194(12): 5713–5724. doi:10.4049/jimmunol.1500277.
Author M
anuscriptA
uthor Manuscript
Author M
anuscriptA
uthor Manuscript
Introduction
In humans and experimental models of glomerular disease loss of the specialized epithelial
cells in the glomerulus (podocytes) has been directly linked to accelerated
glomerulosclerosis, a substantial cause of decreased glomerular filtration rate and end stage
renal disease (ESRD) (1). Since podocytes have a limited ability to proliferate and
regenerate after injury, podocyte responses to inflammation-driven damage play a key
mechanistic role in the outcome of glomerular disease. Autophagy is a critical response
downstream of diverse stress signals (such as cytokine-driven activation, nutrient depletion,
and so on) (2-4). Moreover, autophagy is required for podocyte survival under basal
conditions as mice with a podocyte-specific defect in autophagy show age-dependent signs
of advanced glomerulosclerosis and decline in kidney function (5). Stress is detected at the
cellular level by multiple homeostatic sensing systems. The integrated stress response is
comprised of four of Ser/Thr kinases that target the α subunit of eukaryotic initiation factor
2 (eIF2α). These kinases are activated by multiple environmental signals including amino
acid deprivation, endoplasmic reticulum stress, heme limitation, and DNA damage (6). The
activation of integrated stress response kinases and subsequent eIF2α phosphorylation alters
cellular transcription and translation driving expression of stress response genes including
those encoding autophagy factors and cytokines (7-9).
There has been long-standing clinical interest in the impact of diet and nutritional stress on
kidney disease progression. While it is not understood on a mechanistic level, there is a
reason to believe that nutrient availability in the microenvironment is a critical determinant
factor in disease outcome. For example, dietary protein or amino acid restriction stress
reduced pathology in clinical and experimental glomerulonephritis and renal ischemia
(10-14). However, the reported effects of a low protein diet in human renal disease have
been more variable and thus the efficacy of dietary protein or amino acid restriction on
chronic kidney disease pathophysiology is not clear (15, 16).
Active enzymatic metabolism of amino acids and the subsequent stress it elicits is
recognized as a regulatory feed back mechanism that alters disease outcomes (8, 17, 18).
Indoleamine 2, 3 dioxygenase 1 (IDO1) is an intracellular tryptophan-metabolizing enzyme
that is expressed by monocytic, epithelial, and endothelial-lineage cells (18-21). Our lab and
others have shown that IDO1-driven tryptophan depletion has a significant impact on
immune cell behavior regulating inflammatory cytokine production in macrophages and
dendritic cells, inducing proliferative arrest in naïve T cells, and promoting tolerogenic
FoxP3+ regulatory T cell maturation and activation (7, 8, 22-24). Thus is it perhaps not
surprising that IDO1 regulates immunity and pathology in a wide array of inflammatory
conditions including infection, autoimmunity, and cancer (19). Interferons are the principle
mechanistic drivers of IDO1 induction, although both transforming growth factor β (TGF-β)
and toll like receptor (TLR)-dependent mechanisms can stimulate IDO1 gene activity (25,
26). IDO1 may act as a negative feed back mechanism protecting the kidney from antibody
mediated inflammatory injury (27); however, data demonstrating IDO1 expression in
inflamed kidney is not definitive and mechanisms underlying this protective effect are not
known.
Chaudhary et al. Page 2
J Immunol. Author manuscript; available in PMC 2016 June 15.
Author M
anuscriptA
uthor Manuscript
Author M
anuscriptA
uthor Manuscript
Amino acid deficiencies are detected by the integrated stress response kinase general control
nonderepressible 2 (GCN2) (28). GCN2 kinase signals are activated by accumulation of any
deacylated (namely, uncharged) tRNA and are required and sufficient for transduction of
intracellular amino acid limitation signals (29, 30). Phosphorylation of eIF2α substantially
reduces global protein synthesis, but translation from relatively rare mRNA species, such as
activating transcription factor 4 (ATF4), are selectively derepressed (31). ATF4, a basic
leucine zipper transcription factor, is a nodal regulator of integrated stress response-driven
transcription and manifestation of the stress response. An ATF4 target gene product, C/EBP-
β homologous protein-10 (CHOP10, CHOP), functionally cooperates with ATF4 to regulate
expression of amino acid transporters, aminoacyl tRNA synthetases, and genes involved in
autophagy suggesting a direct link between GCN2 activation and autophagy responses (32).
In this study we hypothesized inflammatory induction of IDO1 with subsequent tryptophan
depletion-driven GCN2 activation constitutes a metabolic regulatory circuit limiting
pathology in a mouse model of anti-glomerular basement membrane (GBM) disease. The
data presented below show IDO1 and GCN2-dependent regulation is a key mechanism
restricting inflammatory kidney damage and manipulation of IDO1 or GCN2 activity may
have therapeutic benefit.
Materials and methods
Mice
Female 8-10 week old C57BL6/J (B6), B6.Ido1−/−, B6.Eif2ak4tm1.2Dron (Gcn2 KO),
B6.Ifnar1−/−, and B6.Ifnγr1−/− mice were obtained from The Jackson Laboratories and
maintained under specific-pathogen-free conditions in the Georgia Regents University
animal facilities in accordance with Institutional Animal Care and Use Committee
guidelines.
Human Kidney
For patients P7 to P18: tissue was obtained from core needle biopsy taken with ultrasound
guidance. The tissue was separated and the portion of renal parenchyma reserved for
immunofluorescence studies was snap frozen in OCT compound (Tissue Tek) after
collection and stored at −70°C. All experiments were conducted with residual tissue
collected for clinical diagnostic purposes under studies and protocols approved by the
Georgia Regents University institutional review board.
For patients P1 to P5 kidney cortex samples were obtained from the national disease
research interchange (NDRI) national rare disease biospecimen resource. All kidney cortices
were collected in accordance with institutional review board guidelines and regulations.
Patient information is described in table 1.
Nephrotoxic Serum Nephritis (NTN)
Non-accelerated NTN was induced by passive transfer of preabsorbed sheep nephrotoxic
serum (NTS) intravenously in 8-10-week-old mice. Serum from the same batch was used for
all experiments. NTS dose was titrated in B6 mice to induce mild (8 μl/gm, low-dose) and
Chaudhary et al. Page 3
J Immunol. Author manuscript; available in PMC 2016 June 15.
Author M
anuscriptA
uthor Manuscript
Author M
anuscriptA
uthor Manuscript
severe (20 μl/gm, high-dose) pathology. Functional quantification of kidney function was
done by urine albumin/creatinine ratio and BUN estimation (33). Urinary albumin was
measured by mouse albumin specific ELISA (Bethyl Labs). BUN and creatinine
concentrations were measured by enzymatic colorimetric estimation (Stanbio).
Pathology and Immunofluorescence
To assess target organ pathology, kidneys were fixed with 10% formalin in PBS for 48 h and
embedded in paraffin. Kidney sections were stained with Periodic acid-Schiff (PAS) and
hematoxylin reagent. Stained kidney sections were scored for renal damage, as previously
described (34, 35). To assay for immune deposits, kidneys were embedded in optimal
cutting temperature compound (Tissue-Tek) and snap-frozen. Sections (5 μm) were air-
dried, fixed with ice cold methanol, blocked with 3% non-fat milk and stained with rabbit
anti-mouse IDO1 (kindly provided by Dr. David Munn), rabbit anti-mouse LC3 (Cell
signaling Technology), anti-synaptopodin (Santa Cruz Biotechnology), rabbit anti-mouse
cleaved caspase3 (Cell signaling Technology), or FITC conjugated rat anti-mouse CD31
(PCAM1). For immunocytochemistry, 30k to 50k podocytes were cultured in chamber slides
(BD Falcon) and fixed for 3 minutes in ice-cold methanol. To stain for actin filaments
Alexafluor-488 conjugated phalloidin (Thermo-Fisher) was used. In some experiments
TUNEL staining was done on frozen sections using commercially available kits
(Invitrogen). Fluorescent images were captured using Zeiss LSM 510 Meta confocal
microscope.
Quantification of infiltrated F4/80+, CD11c+ and CD11c+ cells in kidney tissue sections
was carried out by immunofluorescence as previously described (36). In the same
experiment, IDO1 expression by these cells was also analyzed by co-localizing IDO1
staining with the cell specific staining. In brief, kidney sections from day 5 post-NTN mice
were co-labeled with IDO1, DAPI and either of F4/80 (eBioscience), CD11c or CD11b
antibodies (BD Pharmingen). Positive cell were identified by presence of staining
surrounding the nuclei staining (DAPI). Cells were counted manually in 5 randomly selected
non-overlapping fields at 25× magnification covering minimum 2-3 glomeruli per field for
each mouse. Microscope magnification, selected area and other imaging parameters were
kept constant between the samples.
Glomerular purification
Mice were anaesthetized and perfused with 8 × 10⁶ magnetic Dynabeads™ (Lifescience
Technologies) diluted in 20 ml of Hanks balanced salt solution (HBSS) through the left
ventricle. After perfusion, kidneys were removed, minced into approximately 1 mm3 pieces
and digested in Collagenase (1mg/ml Collagenase A [Worthington], 100 U/ml
deoxyribonuclease-I [Sigma] in RPMI media without fetal calf serum) at 37°C for 30
minutes with gentle agitation. Collagenase-digested tissue was pressed through a 100 μm
nylon cell strainer (Thermo-Fisher). The filtered was again passed through a 100 μm cell
strainer without pressing. The filtrate was then centrifuged at 200 × g for 5 min at 4°C. The
pellet was resuspended in 2 ml of HBSS. Glomeruli containing Dynabeads™ were isolated
by a magnetic particle concentrator (magnet) and isolated glomeruli were washed at least
three times with HBSS. During the entire procedure kidney tissues were kept at 4°C, except
Chaudhary et al. Page 4
J Immunol. Author manuscript; available in PMC 2016 June 15.
Author M
anuscriptA
uthor Manuscript
Author M
anuscriptA
uthor Manuscript
for the collagenase digestion at 37°C. From purified glomeruli, mRNA and protein were
extracted for quantitative PCR and western blot.
Cell culture
Conditionally immortalized mouse podocytes (37), were cultured and maintained in
collagen-I coated flasks in RPMI-1640 media supplemented with 10% FCS, 100 units/ml
penicillin/streptomycin, 10U/ml mouse recombinant IFN-γ. Confluent cells were passaged
and kept at 37°C without IFNγ to differentiate for 2 weeks in Dulbecco’s modified Eagle’s
medium containing 5% FCS, 5.5 mM glucose, and antibiotics. Podocyte differentiation was
defined by synaptopodin expression confirmed by immunocytochemistry.
Reagents
DNPs were freshly prepared before every injection by adding polyethylenimine (PEI)
(InvivoGen) with CpG−free plasmid DNA (pGiant, InvivoGen) according to the
manufacturers directions. Mice were injected i/v with 30 μg pDNA (N/P ratio of 10:1) in
200μl of 5% glucose solution. 1-Methyl-D-tryptophan (D1MT), 1-Methyl-L-tryptophan
(L1MT), or a racemic mixture of the D and L isomers (Sigma) was prepared as a 20 mM
stock and used at a final concentration of 20 μM to treat podocytes for in vitro experiments
(38). Halofuginone hydrobromide (HF) (Sigma) stored as 2 mg/ml stock solution in
methanol at −20°C was used at a final concentration of 40 ng/ml to treat podocytes for in-
vitro experiments. For in-vivo experiments, HF was resuspended in phosphate buffered
saline (PBS) (4μg/gm) and given i/v as described. 3-methyl adenine (3-MA) (Sigma)
dissolved in 1N NaOH at 10 mg/ml and diluted to 10mM in phosphate buffered saline for
in-vitro experiments and 30 mg/kg for in-vivo studies.
siRNA interference
Transient knock down of GCN2 was done using Lipofectamine™ 2000 (Invitrogen). Briefly,
for each sample in a 6 well plate, 500pmol of siRNA against Gcn2 or scrambled controls
(Santa Cruz Biotechnology) in 250 μl of Opti-MEM™ (Thermo-Fisher Scientific) media was
mixed with Lipofectamine™ 2000, and after 20 minutes the mixture was added to the
podocyte culture. After 6-8 hours of incubation, media was changed to normal media used
for differentiated podocyte culture. Inhibition of GCN2 expression was confirmed by real
time PCR and Western blot after 14-20 hours before using cells for the experiments.
Kynurenine and Trp measurements and IDO enzymatic activity
High-performance liquid chromatography (HPLC) analysis was performed as previously
described (7). Briefly, 100 μl of culture medium was diluted with 10 μl (1/10 volume) of 150
mM sodium acetate (NaAc), pH 4.0, and incubated at room temperature for 2 min. Fifty
microliters (1/4 volume) of 30% trichloroacetic acid (TCA) was then added, and sample
mixtures were incubated on ice for 5 min before being spun in a precooled (4°C) centrifuge
at 2000 × g. For HPLC, 50 μl of sample was loaded by autosampler (Beckman Coulter
model 508) and separated on a C18 (Shimadzu) column using the following conditions:
mobile phase A, 2.5% acetonitrile in 15 mM NaAc, pH 4.0; mobile phase B, 100%
acetonitrile; and flow rate, 1.2 ml/min. The mobile phase was delivered with a Beckman
Chaudhary et al. Page 5
J Immunol. Author manuscript; available in PMC 2016 June 15.
Author M
anuscriptA
uthor Manuscript
Author M
anuscriptA
uthor Manuscript
Coulter model 126 solvent module at a flow rate of 1.2 ml per minute. Kynurenine was
detected with a Beckman Coulter model 166 detector at 360 nm, and tryptophan was
detected using a Jasco FP-1520 fluorescent detector at an excitation wavelength of 285 nm
and an emission wavelength of 365 nm.
IDO activity was measured as previously described (39). Briefly, tissues were homogenized
with a Polytron homogenizer (Kinematica) in 1.5 volumes of ice-cold 0.14 M KCl-20 mM
potassium phosphate buffer (pH 7). The homogenate samples were centrifuged at 7000 × g
and 4°C for 10 min. An aliquot of supernatant was taken for the measurement of IDO
activity. The reaction mixture contained 50 μl enzyme preparation and 50 μl substrate
solution (100mM potassium phosphate buffer pH 6.5, 50μM methylene blue, 20μg catalase,
50 mM ascorbate, and 0.4 mM L-TRP). After incubation at 37°C, samples were acidified
with 3% perchloric acid and centrifuged at 7000×g, 4°C, 10 min. The concentrations of the
enzymatic products were measured by HPLC. IDO activity was calculated as picomoles
kynurenine per hour per milligram tissue.
Gene expression quantification
RNA from cells or tissue were purified using RNeasy RNA purification kits (Qiagen), and
250 ng of RNA was reverse transcribed using a random-hexamer cDNA reverse
transcription kit (Clontech). For the PCR, 1 μl of cDNA was amplified and PCR was done
using IQ Sybr green super mix (Bio-Rad) on an iQ5 real-time PCR detection system (Bio-
Rad). Results were analyzed with the accompanying software according to the
manufacturer’s instructions. PCR for mouse (or human as indicated) β-actin (i.e. Actb), 18S
ribosomal RNA, Ido1, Chop, Gadd45b, Atg3, Atg5, Il6, Ccl2, and Tnfα was done using
previously described primers (19, 22).
Immunoblotting
Western blot was done according to previously published methodology (40). Specific
antibodies against mouse Wilms’ tumor-1 and podocin were purchased from Abcam while
antibodies against LC3, cleaved caspase 3, and β-actin were purchased from Cell Signaling
Technology.
Elisa
To measure kidney cortical cytokines, renal cortices were physically separated from medulla
5 days after NTS injection, weighed, and ground with a pestle and mortar containing 5g
sterile sand (Sigma) and 100 μl of PBS+protease inhibitor cocktail (Sigma)/10mg of tissue.
The material was centrifuged to sediment the sand/ground tissue and supernatant was
collected for assessment of cytokines or chemokines indicated. All measurements were done
using commercially available reagents and done as per manufactures instructions
(eBioscience).
Quantification of LC3 puncta in vitro
Autophagosome formation was quantified by counting LC3 puncta manually. Briefly,
differentiated podocytes were plated on chamber slide and treated. At the experimental
endpoint, cells were gently washed once with PBS and fixed with methanol at −20°C for 3
Chaudhary et al. Page 6
J Immunol. Author manuscript; available in PMC 2016 June 15.
Author M
anuscriptA
uthor Manuscript
Author M
anuscriptA
uthor Manuscript
minutes. Cells were stained for LC3 and LC3+ punctate structures were counted manually in
50-80 cells. Size of the punctate was variable.
Flow cytometry
Kidney cortices were collected and minced finely with a blade. The kidneys were then
incubated with 500 U of collagenase (Sigma) 30 min at 37°C. From the digest, a single-cell
suspension was washed 3 times in PBS+1% BSA and processed for staining. To stain
hematopoietic cells in kidney, anti-CD45, anti-Ly6G, anti-F4/80, anti-CD4, anti-CD8 (all
eBioscience), anti-CD11b, anti-MHCII, and anti-CD86 (BD Pharmingen) were used.
Stained cells were formalin fixed and subjected to flow cytometry on a FACS Canto flow
cytometer (BD Bioscience). Data were analyzed with FlowJo software (Tree Star).
Statistical analysis
Means, SDs, and unpaired student t test results were used to analyze the data. When
comparing two groups, a P value of ≤ 0.05 was considered to be significant. Animal survival
data were analyzed with Kaplan–Meier survival plots followed by the log-rank test.
Results
IDO activity is protective in antibody-mediated glomerulonephritis
To elucidate the functional role of IDO1 in the nephrotoxic serum nephritis (NTN) model of
anti-GBM disease, Ido1 knockout (Ido1 KO) and C57BL/6 (B6) mice were challenged with
sheep anti-mouse nephrotoxic serum (NTS) at a dose that induced mild, self-limiting
glomerular inflammation in B6 mice (35). As expected, B6 mice developed albuminuria that
peaked on or about day 5 and then returned to baseline levels by day 21. At this dose blood
urea nitrogen (BUN) concentrations remained normal (Fig 1A) and the histology remained
normal or minimally altered (Fig 1B and IC). By contrast, Ido1 KO mice developed
fulminant nephritis evidenced by increased albuminuria and BUN concentrations compared
to NTS-injected B6 mice on day 5 and day 21 (Fig 1A). These outcomes were associated
with increased pathology in Ido1 KO mice that showed features of severe
glomerulonephritis including peri-glomerular and interstitial infiltration, fibrocellular
crescent formation, glomerular capillary thrombosis, thickened glomerular basement
membrane, and tubular damage (Fig 1B and 1C). There was progressive and fatal end-stage
renal disease by day 45 after-NTS administration in Ido1 KO mice; in contrast, all wild-type
mice survived (Fig 1D). Similarly, when mice were treated with a lethal dose of NTS, the
Ido1 KO mice had accelerated mortality, with all animals succumbing by day 15 (Fig 1D).
In the NTN model of anti-GBM disease, inflammation and pathology during the first 5 to 7
days post-injury is driven by innate inflammation mediated primarily by cellular responses
to antibody deposition precipitating infiltration of neutrophils and macrophages (41-43).
Thus the increase in proteinuria and BUN in Ido1 KO mice compared to controls at day 5
raised the possibility that IDO1 activity was induced early during the disease process
limiting NTS-driven pathology. Immunofluorescence microscopy showed IDO1 protein was
significantly increased in inflamed kidney and appeared to be primarily in glomeruli (Fig
1E). IDO1+ staining patterns in the glomeruli overlapped with staining for the podocyte
Chaudhary et al. Page 7
J Immunol. Author manuscript; available in PMC 2016 June 15.
Author M
anuscriptA
uthor Manuscript
Author M
anuscriptA
uthor Manuscript
marker synaptopodin suggesting podocytes were producing IDO1 in response to NTS-driven
inflammation (Fig 1E). In contrast, there was no overlap of IDO1 staining with the
endothelial cell marker CD31 suggesting glomerular endothelium did not express IDO1 after
NTS administration (Fig 1E). There were a few IDO1+ cells in the interstitium which co-
stained with the macrophage marker F4/80 suggesting other cell types were expressing
IDO1 in the inflamed renal parenchyma (Fig 2). To test if NTS administration induced Ido1
expression, mRNA from renal cortices and purified glomeruli was measured. We observed
that NTS administration induced a 27-fold increase in Ido1 mRNA in lysate from total renal
cortices (not shown); however, purified glomeruli showed a 10-fold enrichment in Ido1
message induction relative to whole kidney tissues (i.e. a 230-fold induction in Ido1 mRNA
in NTS-treated versus control glomeruli, Fig 1F). Thus while we cannot completely rule out
a role for monocyte-derived IDO1 in regulating the pathogenic antibody-driven renal
response, it is likely that the majority of IDO activity is contributed by glomerular stroma.
Since Ido1 gene activity can be induced by both type I and type II interferons (IFN), we
tested whether IFNs are required for Ido1 induction by NTS. Mice with a genetic disruption
of the gene coding for the IFNα receptor 1 protein fail to respond to either IFNα or IFNβ.
However, lack of type I IFN responsiveness had no effect on Ido1 mRNA induction in
glomeruli after NTS injection (Fig 1F). In contrast, glomeruli from mice lacking IFNγ
responsiveness (Ifnγr1 knockout) showed a 3-fold reduction in Ido1 mRNA compared to
NTS-injected B6 glomeruli (Fig 1F). Thus the data suggest IFNγ responsiveness is a key
mechanism driving Ido1 gene activity in NTN.
By enzymatically catabolizing tryptophan, IDO drives GCN2 activation and subsequent
elicitation of the integrated stress response. This pathway modulates inflammatory potential
and cytokine production in sterile and septic inflammatory settings (7, 8, 22). Thus we
postulated that GCN2 was required to limit antibody-driven kidney pathology.
Phenocopying the observations in Ido1 KO mice, Gcn2 knockout (Gcn2 KO) mice showed
an exaggerated response to low dose NTS with significantly increased albuminuria and
BUN concentrations at both 5 and 21 days post-injection compared to B6 mice (Fig 3A).
Gcn2 KO mice also showed marked glomerular pathology analogous to that seen in Ido1
KO mice (Fig 3B and 3C). Ultimately NTS-driven kidney inflammation progressed to
ESRD in Gcn2 KO mice with death in all members of the group in response to low dose
NTS and accelerated death when exposed to high-dose NTS (Fig 3D). This result suggests
that GCN2 is critical to limit pathology during NTN.
NTN induces rapid production of inflammatory cytokines and chemokines. Since IDO1
inhibits cytokine production in inflammatory conditions(22), we reasoned in the absence of
IDO1 mediated activation of GCN2 there would be increased inflammatory cytokine
responses in NTN. Consistent with this hypothesis, Ido1 KO and Gcn2 KO glomeruli
exhibited a significant increase in Tnfα and Il6 mRNA expression compared to controls 5
days after low dose NTS injection (Fig 4A). Accordingly, there was a 2-fold increase for
both IL-6 and TNFα protein detectible in kidney cortex homogenate as measured by ELISA
(Fig 4B). In contrast, NTS-driven induction of Tgfβ1 expression in glomeruli was lost in
Ido1 KO and Gcn2 KO glomeruli (Fig 4A). In agreement with the expression data, when
cortical TGFβ1 protein was measured there was a 2-fold increase in the NTS treated group,
Chaudhary et al. Page 8
J Immunol. Author manuscript; available in PMC 2016 June 15.
Author M
anuscriptA
uthor Manuscript
Author M
anuscriptA
uthor Manuscript
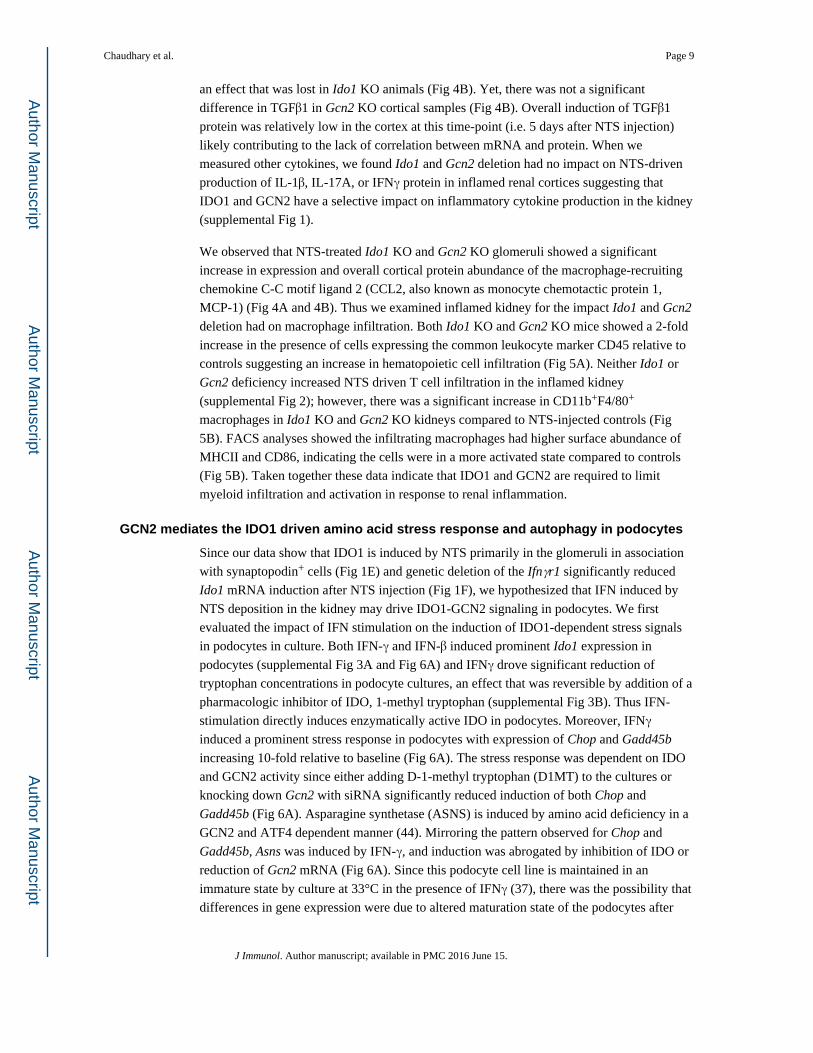
an effect that was lost in Ido1 KO animals (Fig 4B). Yet, there was not a significant
difference in TGFβ1 in Gcn2 KO cortical samples (Fig 4B). Overall induction of TGFβ1
protein was relatively low in the cortex at this time-point (i.e. 5 days after NTS injection)
likely contributing to the lack of correlation between mRNA and protein. When we
measured other cytokines, we found Ido1 and Gcn2 deletion had no impact on NTS-driven
production of IL-1β, IL-17A, or IFNγ protein in inflamed renal cortices suggesting that
IDO1 and GCN2 have a selective impact on inflammatory cytokine production in the kidney
(supplemental Fig 1).
We observed that NTS-treated Ido1 KO and Gcn2 KO glomeruli showed a significant
increase in expression and overall cortical protein abundance of the macrophage-recruiting
chemokine C-C motif ligand 2 (CCL2, also known as monocyte chemotactic protein 1,
MCP-1) (Fig 4A and 4B). Thus we examined inflamed kidney for the impact Ido1 and Gcn2
deletion had on macrophage infiltration. Both Ido1 KO and Gcn2 KO mice showed a 2-fold
increase in the presence of cells expressing the common leukocyte marker CD45 relative to
controls suggesting an increase in hematopoietic cell infiltration (Fig 5A). Neither Ido1 or
Gcn2 deficiency increased NTS driven T cell infiltration in the inflamed kidney
(supplemental Fig 2); however, there was a significant increase in CD11b+F4/80+
macrophages in Ido1 KO and Gcn2 KO kidneys compared to NTS-injected controls (Fig
5B). FACS analyses showed the infiltrating macrophages had higher surface abundance of
MHCII and CD86, indicating the cells were in a more activated state compared to controls
(Fig 5B). Taken together these data indicate that IDO1 and GCN2 are required to limit
myeloid infiltration and activation in response to renal inflammation.
GCN2 mediates the IDO1 driven amino acid stress response and autophagy in podocytes
Since our data show that IDO1 is induced by NTS primarily in the glomeruli in association
with synaptopodin+ cells (Fig 1E) and genetic deletion of the Ifnγr1 significantly reduced
Ido1 mRNA induction after NTS injection (Fig 1F), we hypothesized that IFN induced by
NTS deposition in the kidney may drive IDO1-GCN2 signaling in podocytes. We first
evaluated the impact of IFN stimulation on the induction of IDO1-dependent stress signals
in podocytes in culture. Both IFN-γ and IFN-β induced prominent Ido1 expression in
podocytes (supplemental Fig 3A and Fig 6A) and IFNγ drove significant reduction of
tryptophan concentrations in podocyte cultures, an effect that was reversible by addition of a
pharmacologic inhibitor of IDO, 1-methyl tryptophan (supplemental Fig 3B). Thus IFN-
stimulation directly induces enzymatically active IDO in podocytes. Moreover, IFNγ
induced a prominent stress response in podocytes with expression of Chop and Gadd45b
increasing 10-fold relative to baseline (Fig 6A). The stress response was dependent on IDO
and GCN2 activity since either adding D-1-methyl tryptophan (D1MT) to the cultures or
knocking down Gcn2 with siRNA significantly reduced induction of both Chop and
Gadd45b (Fig 6A). Asparagine synthetase (ASNS) is induced by amino acid deficiency in a
GCN2 and ATF4 dependent manner (44). Mirroring the pattern observed for Chop and
Gadd45b, Asns was induced by IFN-γ, and induction was abrogated by inhibition of IDO or
reduction of Gcn2 mRNA (Fig 6A). Since this podocyte cell line is maintained in an
immature state by culture at 33°C in the presence of IFNγ (37), there was the possibility that
differences in gene expression were due to altered maturation state of the podocytes after
Chaudhary et al. Page 9
J Immunol. Author manuscript; available in PMC 2016 June 15.
Author M
anuscriptA
uthor Manuscript
Author M
anuscriptA
uthor Manuscript
IFNγ simulation. However, overnight culture with IFN-γ did not change expression of the
differentiated podocyte markers Wilms’ tumor-1 (WT-1) or podocin indicating that in our
experimental system podocyte maturation status was not the driving factor in observed gene
expression patterns (supplemental Fig 4A). Thus, these data support for hypothesis that
podocytes respond to IFN-stimulation by rapid induction of IDO1 and the downstream
GCN2-dependent stress program.
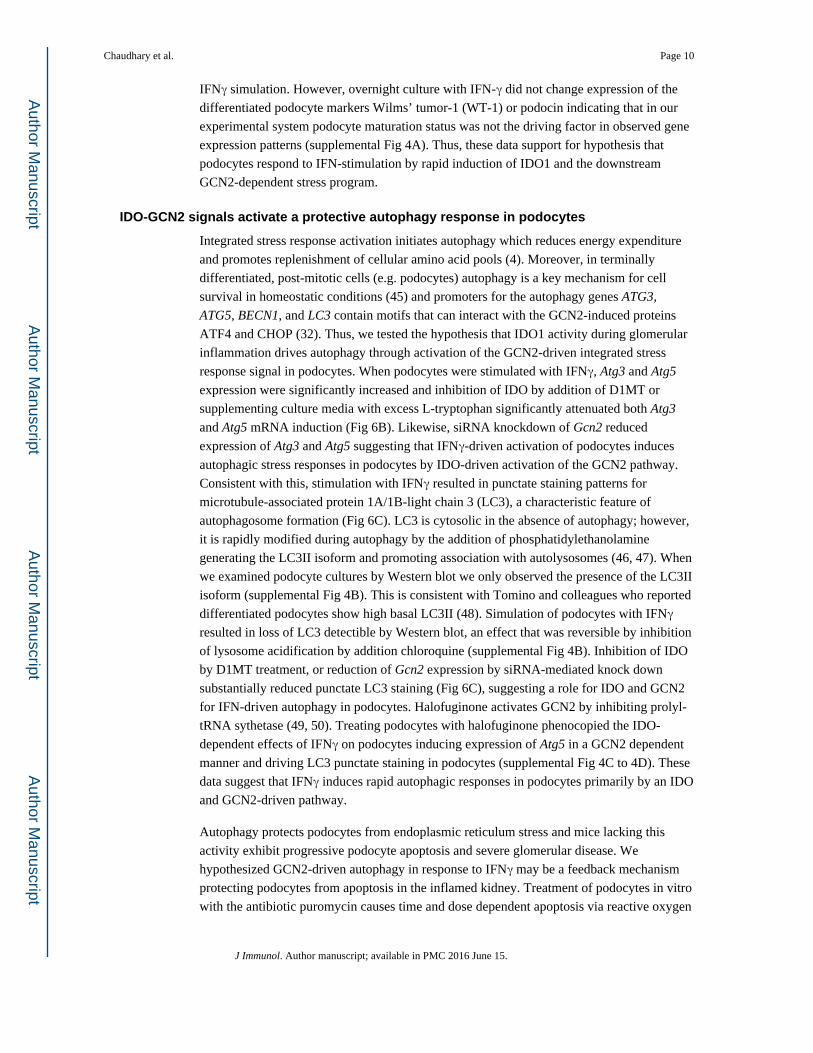
IDO-GCN2 signals activate a protective autophagy response in podocytes
Integrated stress response activation initiates autophagy which reduces energy expenditure
and promotes replenishment of cellular amino acid pools (4). Moreover, in terminally
differentiated, post-mitotic cells (e.g. podocytes) autophagy is a key mechanism for cell
survival in homeostatic conditions (45) and promoters for the autophagy genes ATG3,
ATG5, BECN1, and LC3 contain motifs that can interact with the GCN2-induced proteins
ATF4 and CHOP (32). Thus, we tested the hypothesis that IDO1 activity during glomerular
inflammation drives autophagy through activation of the GCN2-driven integrated stress
response signal in podocytes. When podocytes were stimulated with IFNγ, Atg3 and Atg5
expression were significantly increased and inhibition of IDO by addition of D1MT or
supplementing culture media with excess L-tryptophan significantly attenuated both Atg3
and Atg5 mRNA induction (Fig 6B). Likewise, siRNA knockdown of Gcn2 reduced
expression of Atg3 and Atg5 suggesting that IFNγ-driven activation of podocytes induces
autophagic stress responses in podocytes by IDO-driven activation of the GCN2 pathway.
Consistent with this, stimulation with IFNγ resulted in punctate staining patterns for
microtubule-associated protein 1A/1B-light chain 3 (LC3), a characteristic feature of
autophagosome formation (Fig 6C). LC3 is cytosolic in the absence of autophagy; however,
it is rapidly modified during autophagy by the addition of phosphatidylethanolamine
generating the LC3II isoform and promoting association with autolysosomes (46, 47). When
we examined podocyte cultures by Western blot we only observed the presence of the LC3II
isoform (supplemental Fig 4B). This is consistent with Tomino and colleagues who reported
differentiated podocytes show high basal LC3II (48). Simulation of podocytes with IFNγ
resulted in loss of LC3 detectible by Western blot, an effect that was reversible by inhibition
of lysosome acidification by addition chloroquine (supplemental Fig 4B). Inhibition of IDO
by D1MT treatment, or reduction of Gcn2 expression by siRNA-mediated knock down
substantially reduced punctate LC3 staining (Fig 6C), suggesting a role for IDO and GCN2
for IFN-driven autophagy in podocytes. Halofuginone activates GCN2 by inhibiting prolyl-
tRNA sythetase (49, 50). Treating podocytes with halofuginone phenocopied the IDO-
dependent effects of IFNγ on podocytes inducing expression of Atg5 in a GCN2 dependent
manner and driving LC3 punctate staining in podocytes (supplemental Fig 4C to 4D). These
data suggest that IFNγ induces rapid autophagic responses in podocytes primarily by an IDO
and GCN2-driven pathway.
Autophagy protects podocytes from endoplasmic reticulum stress and mice lacking this
activity exhibit progressive podocyte apoptosis and severe glomerular disease. We
hypothesized GCN2-driven autophagy in response to IFNγ may be a feedback mechanism
protecting podocytes from apoptosis in the inflamed kidney. Treatment of podocytes in vitro
with the antibiotic puromycin causes time and dose dependent apoptosis via reactive oxygen
Chaudhary et al. Page 10
J Immunol. Author manuscript; available in PMC 2016 June 15.
Author M
anuscriptA
uthor Manuscript
Author M
anuscriptA
uthor Manuscript
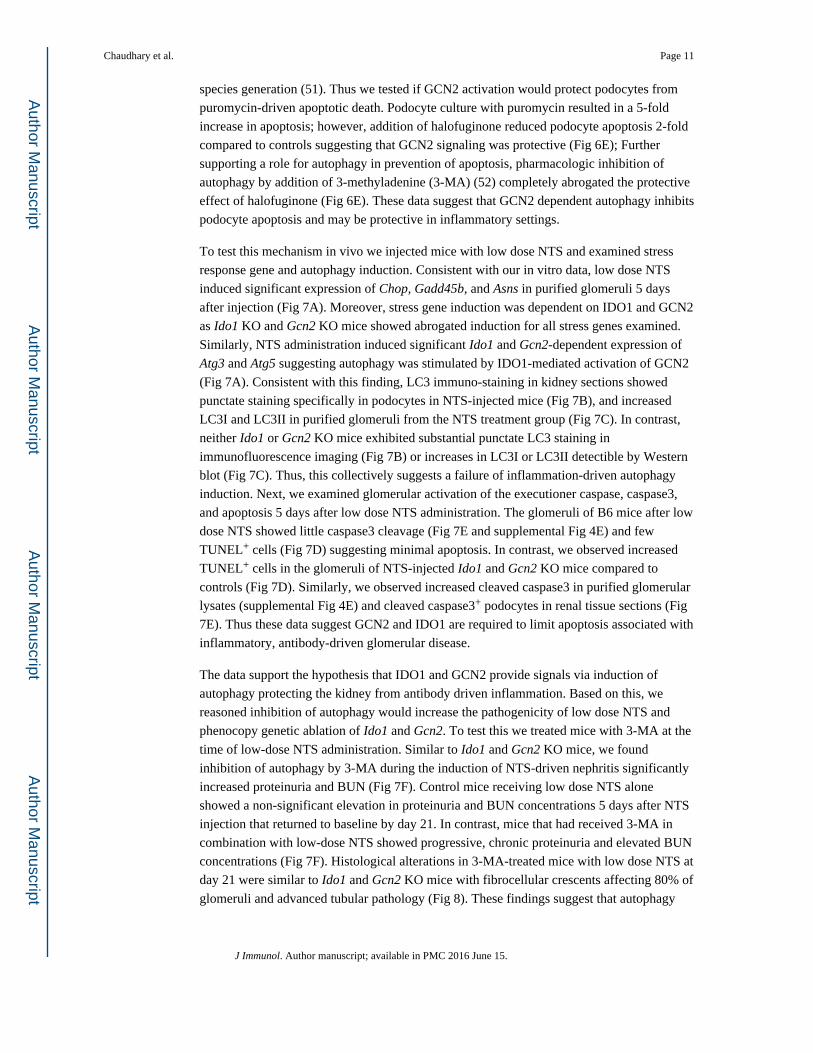
species generation (51). Thus we tested if GCN2 activation would protect podocytes from
puromycin-driven apoptotic death. Podocyte culture with puromycin resulted in a 5-fold
increase in apoptosis; however, addition of halofuginone reduced podocyte apoptosis 2-fold
compared to controls suggesting that GCN2 signaling was protective (Fig 6E); Further
supporting a role for autophagy in prevention of apoptosis, pharmacologic inhibition of
autophagy by addition of 3-methyladenine (3-MA) (52) completely abrogated the protective
effect of halofuginone (Fig 6E). These data suggest that GCN2 dependent autophagy inhibits
podocyte apoptosis and may be protective in inflammatory settings.
To test this mechanism in vivo we injected mice with low dose NTS and examined stress
response gene and autophagy induction. Consistent with our in vitro data, low dose NTS
induced significant expression of Chop, Gadd45b, and Asns in purified glomeruli 5 days
after injection (Fig 7A). Moreover, stress gene induction was dependent on IDO1 and GCN2
as Ido1 KO and Gcn2 KO mice showed abrogated induction for all stress genes examined.
Similarly, NTS administration induced significant Ido1 and Gcn2-dependent expression of
Atg3 and Atg5 suggesting autophagy was stimulated by IDO1-mediated activation of GCN2
(Fig 7A). Consistent with this finding, LC3 immuno-staining in kidney sections showed
punctate staining specifically in podocytes in NTS-injected mice (Fig 7B), and increased
LC3I and LC3II in purified glomeruli from the NTS treatment group (Fig 7C). In contrast,
neither Ido1 or Gcn2 KO mice exhibited substantial punctate LC3 staining in
immunofluorescence imaging (Fig 7B) or increases in LC3I or LC3II detectible by Western
blot (Fig 7C). Thus, this collectively suggests a failure of inflammation-driven autophagy
induction. Next, we examined glomerular activation of the executioner caspase, caspase3,
and apoptosis 5 days after low dose NTS administration. The glomeruli of B6 mice after low
dose NTS showed little caspase3 cleavage (Fig 7E and supplemental Fig 4E) and few
TUNEL+ cells (Fig 7D) suggesting minimal apoptosis. In contrast, we observed increased
TUNEL+ cells in the glomeruli of NTS-injected Ido1 and Gcn2 KO mice compared to
controls (Fig 7D). Similarly, we observed increased cleaved caspase3 in purified glomerular
lysates (supplemental Fig 4E) and cleaved caspase3+ podocytes in renal tissue sections (Fig
7E). Thus these data suggest GCN2 and IDO1 are required to limit apoptosis associated with
inflammatory, antibody-driven glomerular disease.
The data support the hypothesis that IDO1 and GCN2 provide signals via induction of
autophagy protecting the kidney from antibody driven inflammation. Based on this, we
reasoned inhibition of autophagy would increase the pathogenicity of low dose NTS and
phenocopy genetic ablation of Ido1 and Gcn2. To test this we treated mice with 3-MA at the
time of low-dose NTS administration. Similar to Ido1 and Gcn2 KO mice, we found
inhibition of autophagy by 3-MA during the induction of NTS-driven nephritis significantly
increased proteinuria and BUN (Fig 7F). Control mice receiving low dose NTS alone
showed a non-significant elevation in proteinuria and BUN concentrations 5 days after NTS
injection that returned to baseline by day 21. In contrast, mice that had received 3-MA in
combination with low-dose NTS showed progressive, chronic proteinuria and elevated BUN
concentrations (Fig 7F). Histological alterations in 3-MA-treated mice with low dose NTS at
day 21 were similar to Ido1 and Gcn2 KO mice with fibrocellular crescents affecting 80% of
glomeruli and advanced tubular pathology (Fig 8). These findings suggest that autophagy
Chaudhary et al. Page 11
J Immunol. Author manuscript; available in PMC 2016 June 15.
Author M
anuscriptA
uthor Manuscript
Author M
anuscriptA
uthor Manuscript
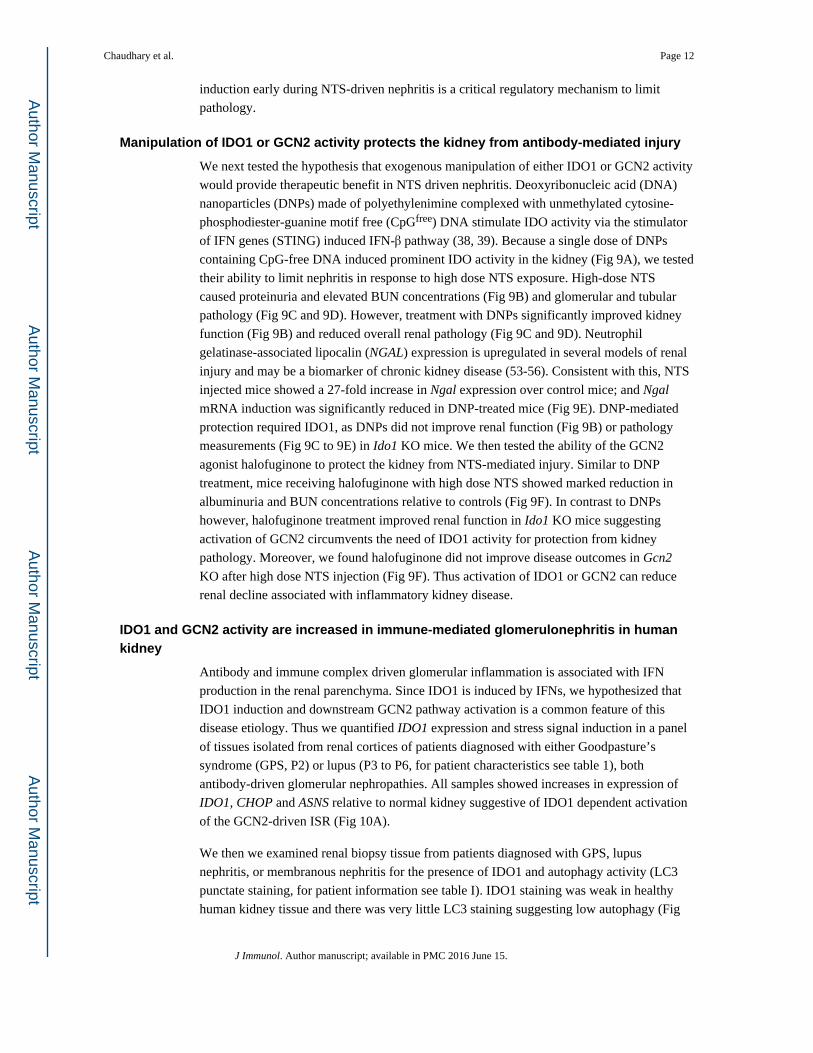
induction early during NTS-driven nephritis is a critical regulatory mechanism to limit
pathology.
Manipulation of IDO1 or GCN2 activity protects the kidney from antibody-mediated injury
We next tested the hypothesis that exogenous manipulation of either IDO1 or GCN2 activity
would provide therapeutic benefit in NTS driven nephritis. Deoxyribonucleic acid (DNA)
nanoparticles (DNPs) made of polyethylenimine complexed with unmethylated cytosine-
phosphodiester-guanine motif free (CpGfree) DNA stimulate IDO activity via the stimulator
of IFN genes (STING) induced IFN-β pathway (38, 39). Because a single dose of DNPs
containing CpG-free DNA induced prominent IDO activity in the kidney (Fig 9A), we tested
their ability to limit nephritis in response to high dose NTS exposure. High-dose NTS
caused proteinuria and elevated BUN concentrations (Fig 9B) and glomerular and tubular
pathology (Fig 9C and 9D). However, treatment with DNPs significantly improved kidney
function (Fig 9B) and reduced overall renal pathology (Fig 9C and 9D). Neutrophil
gelatinase-associated lipocalin (NGAL) expression is upregulated in several models of renal
injury and may be a biomarker of chronic kidney disease (53-56). Consistent with this, NTS
injected mice showed a 27-fold increase in Ngal expression over control mice; and Ngal
mRNA induction was significantly reduced in DNP-treated mice (Fig 9E). DNP-mediated
protection required IDO1, as DNPs did not improve renal function (Fig 9B) or pathology
measurements (Fig 9C to 9E) in Ido1 KO mice. We then tested the ability of the GCN2
agonist halofuginone to protect the kidney from NTS-mediated injury. Similar to DNP
treatment, mice receiving halofuginone with high dose NTS showed marked reduction in
albuminuria and BUN concentrations relative to controls (Fig 9F). In contrast to DNPs
however, halofuginone treatment improved renal function in Ido1 KO mice suggesting
activation of GCN2 circumvents the need of IDO1 activity for protection from kidney
pathology. Moreover, we found halofuginone did not improve disease outcomes in Gcn2
KO after high dose NTS injection (Fig 9F). Thus activation of IDO1 or GCN2 can reduce
renal decline associated with inflammatory kidney disease.
IDO1 and GCN2 activity are increased in immune-mediated glomerulonephritis in human kidney
Antibody and immune complex driven glomerular inflammation is associated with IFN
production in the renal parenchyma. Since IDO1 is induced by IFNs, we hypothesized that
IDO1 induction and downstream GCN2 pathway activation is a common feature of this
disease etiology. Thus we quantified IDO1 expression and stress signal induction in a panel
of tissues isolated from renal cortices of patients diagnosed with either Goodpasture’s
syndrome (GPS, P2) or lupus (P3 to P6, for patient characteristics see table 1), both
antibody-driven glomerular nephropathies. All samples showed increases in expression of
IDO1, CHOP and ASNS relative to normal kidney suggestive of IDO1 dependent activation
of the GCN2-driven ISR (Fig 10A).
We then we examined renal biopsy tissue from patients diagnosed with GPS, lupus
nephritis, or membranous nephritis for the presence of IDO1 and autophagy activity (LC3
punctate staining, for patient information see table I). IDO1 staining was weak in healthy
human kidney tissue and there was very little LC3 staining suggesting low autophagy (Fig
Chaudhary et al. Page 12
J Immunol. Author manuscript; available in PMC 2016 June 15.
Author M
anuscriptA
uthor Manuscript
Author M
anuscriptA
uthor Manuscript
10B, P1). IDO1 staining was variable in disease tissue likely reflecting the variable
pathology assessment and disease activity at the time of collection; however several patients
showed IDO1 staining (Fig 10B). In particular, renal tissue from patients P2, P9 to P12, P15,
and P17 showed prominent diffuse presence of IDO1 in the glomeruli (Fig 10B). Moreover,
the intensity of IDO1 and LC3 staining loosely correlated such that samples that stained
prominently for IDO1 generally exhibited strong LC3II staining as well (Fig 10B). Thus the
data suggest IDO activity is induced in antibody-driven nephritic disease may drive both
stress signals and autophagy responses in the glomerulus.
Discussion
Our findings identify IFN-induced, IDO1-dependent tryptophan catabolism as a critical
mechanism that protects renal tissues from antibody mediated tissue injury. Protection was
mediated through activation of a GCN2 kinase signal that triggers a downstream metabolic
stress response inducting autophagy in podocytes. Moreover, we show that treatments to
induce IDO1 or activate GCN2 directly elicited effective protective responses to NTS,
substantiating the importance of the protection pathway.
Podocytes were crucial to the benefit observed. Antibody deposition in renal tissues incites
local inflammation that causes protein oxidation, DNA damage, and apoptosis leading to
podocyte death. Thus podocytes must engage regulatory mechanisms to compensate for
injury accompanying immune nephritis. Our report demonstrates that induction of IDO
activity during the early phases of NTN is a critical step limiting glomerular apoptosis and
inflammatory pathology. IDO is an intracellular enzyme that metabolizes both cellular and
micro-environmental tryptophan stores to suppress inflammation and regulate innate and
adaptive immunity (19). The Ido1 gene promoter contains several interferon-stimulated
response elements (ISREs) and gamma activated sequence (GAS) motifs and is thus
sensitive to interferon type I and II driven expression and enzymatic activity (57, 58). We
observed IFNγ protein is induced by day 5 after NTS administration (as seen in
supplemental Fig 3) suggesting that early IFNγ production may drive Ido1 gene activity in
podocytes. The hypothesis of IFNγ-driven IDO1 induction is supported by the finding that
Ifnγr1 KO mice showed a significant reduction in Ido1 mRNA induction after injury.
However, the extent of Ido1 message ablation was only 50% as compared to controls. This
suggests other factors are involved in IDO1 induction. One possibility is that type I IFN may
compensate for the lack of IFNγ responsiveness. Supporting this hypothesis we observed
that treatment of podocytes with type I IFN in vitro induced prominent Ido1 expression,
although the induction was 20-fold lower than induction after IFN stimulation (as shown in
sFig 3A). Similarly, systemic administration of DNPs induces IDO1 by driving type I IFN
production in vivo (38). Since we observed protection conveyed by DNPs in an IDO1-
dependent manner the data strongly suggests IDO1 induction after antibody-driven kidney
injury is dependent on upstream interferon release in response to NTS challenge.
IDO1 regulates immunity via two primary mechanisms: i) tryptophan catabolism activates
the amino acid starvation response transmitted by the GCN2 arm of the integrated stress
response, ii) some tryptophan metabolites released by cells expressing IDO (e.g.
kynurenine) activate the aryl hydrocarbon receptor to regulate T cell and monocytic cell
Chaudhary et al. Page 13
J Immunol. Author manuscript; available in PMC 2016 June 15.
Author M
anuscriptA
uthor Manuscript
Author M
anuscriptA
uthor Manuscript
function. Our data suggest that IDO1 modulated NTN via GCN2 activation since outcomes
in Gcn2 KO mice phenocopied outcomes in Ido1 KO mice, as evidenced by exaggerated
NTS-induced renal pathology, cytokine expression profiles in renal cortices, and induction
of stress and autophagy genes. Our results reveal that GCN2 provides a molecular signal
critical for limiting inflammatory pathology induced by NTS deposition in the glomeruli
demonstrating endogenous GCN2-activation, as a consequence of endogenous inflammatory
responses, drives IDO1 activity in the glomeruli playing a dominant role in limiting NTS-
mediated inflammatory pathology.
IDO1 is a potent regulator of adaptive immunity. Thus, it is likely that effects of IDO1 on
glomerulonephritic disease progression involve suppression of stromal pathology and
downstream T and B cell responses to NTS deposition. However, our data show that Ido1
gene activity is induced in the kidney at a time when adaptive responses have not yet
manifest (i.e. 5 days). Moreover functional differences in Ido1 and Gcn2 KO mice as
compared to wild type controls are evident early in the disease process indicating IDO1
driven induction of GCN2 signals are critical for renal responses to antibody injury.
In terminally differentiated podocytes stress response mechanisms play a key function in
cell survival within inflammatory environments. Podocytes exhibit a higher rate of basal as
well as inflammation-driven autophagy and mice deficient in autophagy related gene 5
(Atg5) specifically in podocytes show increased onset of relatively severe, age-related
glomerulosclerosis (5). Evidence from mouse models of non-immune glomerular disease
also supports the notion that autophagy is cytoprotective for podocytes (5, 59-62); however,
the role of autophagy in inflammatory renal disease has never been tested. Our data suggests
basal autophagy activity in podocytes is significantly increased early during the course of
NTS-driven nephritis and inhibition of autophagy drastically increases inflammatory renal
dysfunction. The GCN2 signal has broad effects on cellular phenotypes regulating
expression of genes involved in amino acid synthesis and transport, redox potential, fatty
acid production and inflammation (19). Recently, it was reported that GCN2 could drive
amino acid starvation-induced autophagy in vitro by induction of ATF4 and CHOP (32).
Moreover, stimulation of renal epithelial cells with IFNγ induced IDO dependent autophagy
in vitro (6), suggesting autophagy genes are an biologic target of the GCN2 signal. Yet these
results were derived from artificial restriction of protein/ amino acids in the diet or from in
vitro culture experiments, thus the role of autophagy in renal disease is not clear. Our results
strongly suggest autophagy induction in podocytes is a requisite regulatory feedback
mechanism in renal inflammation; moreover, we show that IDO1 induced GCN2 signaling
is a obligatory driver of autophagy in response to antibody injury as genetic ablation of IDO
or GCN2 activity led to loss of the autophagic response, causing relatively mild
inflammation to convert into severe end-stage renal disease.
In summary, this study shows IDO1-driven activation of GCN2-dependent signals is a
required for induction of autophagy and ultimately podocyte survival and suppression of
inflammatory pathology associated with glomerulonephritis. Moreover we demonstrate that
induction of IDO or GCN2 activity improves kidney function after antibody injury
suggesting therapeutic targeting to enhance this regulatory circuit is possible. In the future it
will be critical to determine the full extent to which IDO and GCN2 modulate inflammatory
Chaudhary et al. Page 14
J Immunol. Author manuscript; available in PMC 2016 June 15.
Author M
anuscriptA
uthor Manuscript
Author M
anuscriptA
uthor Manuscript
pathology in human disease. Nevertheless, given the cytoprotective effect of GCN2
activation it is likely manipulation of the GCN2-driven metabolic signal will show efficacy
in a range of inflammatory renal diseases.
Supplementary Material
Refer to Web version on PubMed Central for supplementary material.
Acknowledgements
The authors would like to thank Dr. David Munn for comments and advice during the development of this research report.
Funding. This work is supported by NIAID grants AI092213, AI099043, and AI105500 (TLM) and NIDDK grant DK081140 (MPM).
References
1. Mundel P, Shankland SJ. Podocyte biology and response to injury. J Am Soc Nephrol. 2002; 13:3005–3015. [PubMed: 12444221]
2. Deretic V, Saitoh T, Akira S. Autophagy in infection, inflammation and immunity. Nat Rev Immunol. 2013; 13:722–737. [PubMed: 24064518]
3. Levine B, Mizushima N, Virgin HW. Autophagy in immunity and inflammation. Nature. 2011; 469:323–335. [PubMed: 21248839]
4. Kroemer G, Marino G, Levine B. Autophagy and the integrated stress response. Mol Cell. 2010; 40:280–293. [PubMed: 20965422]
5. Hartleben B, Godel M, Meyer-Schwesinger C, Liu S, Ulrich T, Kobler S, Wiech T, Grahammer F, Arnold SJ, Lindenmeyer MT, Cohen CD, Pavenstadt H, Kerjaschki D, Mizushima N, Shaw AS, Walz G, Huber TB. Autophagy influences glomerular disease susceptibility and maintains podocyte homeostasis in aging mice. J Clin Invest. 2010; 120:1084–1096. [PubMed: 20200449]
6. Donnelly N, Gorman AM, Gupta S, Samali A. The eIF2alpha kinases: their structures and functions. Cell Mol Life Sci. 2013; 70:3493–3511. [PubMed: 23354059]
7. Liu H, Huang L, Bradley J, Liu K, Bardhan K, Ron D, Mellor AL, Munn DH, McGaha TL. GCN2-dependent metabolic stress is essential for endotoxemic cytokine induction and pathology. Molecular and cellular biology. 2014; 34:428–438. [PubMed: 24248597]
8. Munn DH, Sharma MD, Baban B, Harding HP, Zhang Y, Ron D, Mellor AL. GCN2 kinase in T cells mediates proliferative arrest and anergy induction in response to indoleamine 2,3-dioxygenase. Immunity. 2005; 22:633–642. [PubMed: 15894280]
9. Clavarino G, Claudio N, Dalet A, Terawaki S, Couderc T, Chasson L, Ceppi M, Schmidt EK, Wenger T, Lecuit M, Gatti E, Pierre P. Protein phosphatase 1 subunit Ppp1r15a/GADD34 regulates cytokine production in polyinosinic:polycytidylic acid-stimulated dendritic cells. Proc Natl Acad Sci U S A. 2012; 109:3006–3011. [PubMed: 22315398]
10. Gallinetti J, Harputlugil E, Mitchell JR. Amino acid sensing in dietary-restriction-mediated longevity: roles of signal-transducing kinases GCN2 and TOR. Biochem J. 2013; 449:1–10. [PubMed: 23216249]
11. Peng W, Robertson L, Gallinetti J, Mejia P, Vose S, Charlip A, Chu T, Mitchell JR. Surgical stress resistance induced by single amino acid deprivation requires Gcn2 in mice. Sci Transl Med. 2012; 4:118ra111.
12. Kaysen GA, Odabaei G. Dietary protein restriction and preservation of kidney function in chronic kidney disease. Blood Purif. 2013; 35:22–25. [PubMed: 23343542]
13. Friend PS, Fernandes G, Good RA, Michael AF, Yunis EJ. Dietary restrictions early and late: effects on the nephropathy of the NZB X NZW mouse. Lab Invest. 1978; 38:629–632. [PubMed: 96299]
Chaudhary et al. Page 15
J Immunol. Author manuscript; available in PMC 2016 June 15.
Author M
anuscriptA
uthor Manuscript
Author M
anuscriptA
uthor Manuscript
14. Neugarten J, Feiner HD, Schacht RG, Baldwin DS. Amelioration of experimental glomerulonephritis by dietary protein restriction. Kidney Int. 1983; 24:595–601. [PubMed: 6663981]
15. Thilly N. Low-protein diet in chronic kidney disease: from questions of effectiveness to those of feasibility. Nephrol Dial Transplant. 2013; 28:2203–2205. [PubMed: 23787548]
16. Levey AS, Greene T, Beck GJ, Caggiula AW, Kusek JW, Hunsicker LG, Klahr S. Dietary protein restriction and the progression of chronic renal disease: what have all of the results of the MDRD study shown? Modification of Diet in Renal Disease Study group. Journal of the American Society of Nephrology: JASN. 1999; 10:2426–2439. [PubMed: 10541304]
17. Thoreen CC, Chantranupong L, Keys HR, Wang T, Gray NS, Sabatini DM. A unifying model for mTORC1-mediated regulation of mRNA translation. Nature. 2012; 485:109–113. [PubMed: 22552098]
18. Munn DH, Mellor AL. Indoleamine 2,3 dioxygenase and metabolic control of immune responses. Trends Immunol. 2013; 34:137–143. [PubMed: 23103127]
19. McGaha TL, Huang L, Lemos H, Metz R, Mautino M, Prendergast GC, Mellor AL. Amino acid catabolism: a pivotal regulator of innate and adaptive immunity. Immunological reviews. 2012; 249:135–157. [PubMed: 22889220]
20. Wang Y, Liu H, McKenzie G, Witting PK, Stasch JP, Hahn M, Changsirivathanathamrong D, Wu BJ, Ball HJ, Thomas SR, Kapoor V, Celermajer DS, Mellor AL, Keaney JF Jr. Hunt NH, Stocker R. Kynurenine is an endothelium-derived relaxing factor produced during inflammation. Nature medicine. 2010; 16:279–285.
21. Ferdinande L, Demetter P, Perez-Novo C, Waeytens A, Taildeman J, Rottiers I, Rottiers P, De Vos M, Cuvelier CA. Inflamed intestinal mucosa features a specific epithelial expression pattern of indoleamine 2,3-dioxygenase. International journal of immunopathology and pharmacology. 2008; 21:289–295. [PubMed: 18547472]
22. Ravishankar B, Liu H, Shinde R, Chandler P, Baban B, Tanaka M, Munn DH, Mellor AL, Karlsson MC, McGaha TL. Tolerance to apoptotic cells is regulated by indoleamine 2,3-dioxygenase. Proc Natl Acad Sci U S A. 2012; 109:3909–3914. [PubMed: 22355111]
23. Munn DH, Sharma MD, Mellor AL. Ligation of B7-1/B7-2 by human CD4+ T cells triggers indoleamine 2,3-dioxygenase activity in dendritic cells. J Immunol. 2004; 172:4100–4110. [PubMed: 15034022]
24. Sharma MD, Huang L, Choi JH, Lee EJ, Wilson JM, Lemos H, Pan F, Blazar BR, Pardoll DM, Mellor AL, Shi H, Munn DH. An inherently bifunctional subset of Foxp3+ T helper cells is controlled by the transcription factor eos. Immunity. 2013; 38:998–1012. [PubMed: 23684987]
25. Mellor AL, Munn DH. IDO expression by dendritic cells: tolerance and tryptophan catabolism. Nat Rev Immunol. 2004; 4:762–774. [PubMed: 15459668]
26. Pallotta MT, Orabona C, Volpi C, Vacca C, Belladonna ML, Bianchi R, Servillo G, Brunacci C, Calvitti M, Bicciato S, Mazza EM, Boon L, Grassi F, Fioretti MC, Fallarino F, Puccetti P, Grohmann U. Indoleamine 2,3-dioxygenase is a signaling protein in long-term tolerance by dendritic cells. Nat Immunol. 2011; 12:870–878. [PubMed: 21804557]
27. Hou W, Li S, Wu Y, Du X, Yuan F. Inhibition of indoleamine 2, 3-dioxygenase-mediated tryptophan catabolism accelerates crescentic glomerulonephritis. Clin Exp Immunol. 2009; 156:363–372. [PubMed: 19302241]
28. Harding HP, Novoa I, Zhang Y, Zeng H, Wek R, Schapira M, Ron D. Regulated translation initiation controls stress-induced gene expression in mammalian cells. Mol Cell. 2000; 6:1099–1108. [PubMed: 11106749]
29. Dong J, Qiu H, Garcia-Barrio M, Anderson J, Hinnebusch AG. Uncharged tRNA activates GCN2 by displacing the protein kinase moiety from a bipartite tRNA-binding domain. Molecular cell. 2000; 6:269–279. [PubMed: 10983975]
30. Wek SA, Zhu S, Wek RC. The histidyl-tRNA synthetase-related sequence in the eIF-2 alpha protein kinase GCN2 interacts with tRNA and is required for activation in response to starvation for different amino acids. Mol Cell Biol. 1995; 15:4497–4506. [PubMed: 7623840]
31. Kilberg MS, Shan J, Su N. ATF4-dependent transcription mediates signaling of amino acid limitation. Trends Endocrinol Metab. 2009; 20:436–443. [PubMed: 19800252]
Chaudhary et al. Page 16
J Immunol. Author manuscript; available in PMC 2016 June 15.
Author M
anuscriptA
uthor Manuscript
Author M
anuscriptA
uthor Manuscript
32. B’Chir W, Maurin AC, Carraro V, Averous J, Jousse C, Muranishi Y, Parry L, Stepien G, Fafournoux P, Bruhat A. The eIF2alpha/ATF4 pathway is essential for stress-induced autophagy gene expression. Nucleic Acids Res. 2013; 41:7683–7699. [PubMed: 23804767]
33. Chaudhary K, Kleven DT, McGaha TL, Madaio MP. A human monoclonal antibody against the collagen type IV alpha3NC1 domain is a non-invasive optical biomarker for glomerular diseases. Kidney Int. 2013; 84:403–408. [PubMed: 23515049]
34. Chan O, Madaio MP, Shlomchik MJ. The roles of B cells in MRL/lpr murine lupus. Annals of the New York Academy of Sciences. 1997; 815:75–87. [PubMed: 9186641]
35. Christensen M, Su AW, Snyder RW, Greco A, Lipschutz JH, Madaio MP. Simvastatin protection against acute immune-mediated glomerulonephritis in mice. Kidney Int. 2006; 69:457–463. [PubMed: 16407885]
36. Ravishankar B, Shinde R, Liu H, Chaudhary K, Bradley J, Lemos HP, Chandler P, Tanaka M, Munn DH, Mellor AL, McGaha TL. Marginal zone CD169+ macrophages coordinate apoptotic cell-driven cellular recruitment and tolerance. Proceedings of the National Academy of Sciences of the United States of America. 2014; 111:4215–4220. [PubMed: 24591636]
37. Mundel P, Reiser J, Zuniga Mejia Borja A, Pavenstadt H, Davidson GR, Kriz W, Zeller R. Rearrangements of the cytoskeleton and cell contacts induce process formation during differentiation of conditionally immortalized mouse podocyte cell lines. Exp Cell Res. 1997; 236:248–258. [PubMed: 9344605]
38. Huang L, Lemos HP, Li L, Li M, Chandler PR, Baban B, McGaha TL, Ravishankar B, Lee JR, Munn DH, Mellor AL. Engineering DNA nanoparticles as immunomodulatory reagents that activate regulatory T cells. J Immunol. 2012; 188:4913–4920. [PubMed: 22516958]
39. Huang L, Li L, Lemos H, Chandler PR, Pacholczyk G, Baban B, Barber GN, Hayakawa Y, McGaha TL, Ravishankar B, Munn DH, Mellor AL. Cutting edge: DNA sensing via the STING adaptor in myeloid dendritic cells induces potent tolerogenic responses. J Immunol. 2013; 191:3509–3513. [PubMed: 23986532]
40. McGaha TL, Phelps RG, Spiera H, Bona C. Halofuginone, an inhibitor of type-I collagen synthesis and skin sclerosis, blocks transforming-growth-factor-beta-mediated Smad3 activation in fibroblasts. J Invest Dermatol. 2002; 118:461–470. [PubMed: 11874485]
41. Pickering M, Cook HT. Complement and glomerular disease: new insights. Curr Opin Nephrol Hypertens. 2011; 20:271–277. [PubMed: 21422921]
42. Couser WG. Basic and translational concepts of immune-mediated glomerular diseases. J Am Soc Nephrol. 2012; 23:381–399. [PubMed: 22282593]
43. Kaneko Y, Nimmerjahn F, Madaio MP, Ravetch JV. Pathology and protection in nephrotoxic nephritis is determined by selective engagement of specific Fc receptors. J Exp Med. 2006; 203:789–797. [PubMed: 16520389]
44. Balasubramanian MN, Butterworth EA, Kilberg MS. Asparagine synthetase: regulation by cell stress and involvement in tumor biology. Am J Physiol Endocrinol Metab. 2013; 304:E789–799. [PubMed: 23403946]
45. Hartleben B, Wanner N, Huber TB. Autophagy in Glomerular Health and Disease. Semin Nephrol. 2014; 34:42–52. [PubMed: 24485029]
46. Kabeya Y, Mizushima N, Ueno T, Yamamoto A, Kirisako T, Noda T, Kominami E, Ohsumi Y, Yoshimori T. LC3, a mammalian homologue of yeast Apg8p, is localized in autophagosome membranes after processing. The EMBO journal. 2000; 19:5720–5728. [PubMed: 11060023]
47. Kabeya Y, Mizushima N, Yamamoto A, Oshitani-Okamoto S, Ohsumi Y, Yoshimori T. LC3, GABARAP and GATE16 localize to autophagosomal membrane depending on form-II formation. Journal of cell science. 2004; 117:2805–2812. [PubMed: 15169837]
48. Asanuma K, Tanida I, Shirato I, Ueno T, Takahara H, Nishitani T, Kominami E, Tomino Y. MAP-LC3, a promising autophagosomal marker, is processed during the differentiation and recovery of podocytes from PAN nephrosis. Faseb J. 2003; 17:1165–1167. [PubMed: 12709412]
49. Sundrud MS, Koralov SB, Feuerer M, Calado DP, Kozhaya AE, Rhule-Smith A, Lefebvre RE, Unutmaz D, Mazitschek R, Waldner H, Whitman M, Keller T, Rao A. Halofuginone inhibits TH17 cell differentiation by activating the amino acid starvation response. Science. 2009; 324:1334–1338. [PubMed: 19498172]
Chaudhary et al. Page 17
J Immunol. Author manuscript; available in PMC 2016 June 15.
Author M
anuscriptA
uthor Manuscript
Author M
anuscriptA
uthor Manuscript
50. Keller TL, Zocco D, Sundrud MS, Hendrick M, Edenius M, Yum J, Kim YJ, Lee HK, Cortese JF, Wirth DF, Dignam JD, Rao A, Yeo CY, Mazitschek R, Whitman M. Halofuginone and other febrifugine derivatives inhibit prolyl-tRNA synthetase. Nature chemical biology. 2012; 8:311–317.
51. Wada T, Pippin JW, Marshall CB, Griffin SV, Shankland SJ. Dexamethasone prevents podocyte apoptosis induced by puromycin aminonucleoside: role of p53 and Bcl-2-related family proteins. Journal of the American Society of Nephrology: JASN. 2005; 16:2615–2625. [PubMed: 15987750]
52. Backer JM. The regulation and function of Class III PI3Ks: novel roles for Vps34. Biochem J. 2008; 410:1–17. [PubMed: 18215151]
53. Mishra J, Ma Q, Prada A, Mitsnefes M, Zahedi K, Yang J, Barasch J, Devarajan P. Identification of neutrophil gelatinase-associated lipocalin as a novel early urinary biomarker for ischemic renal injury. Journal of the American Society of Nephrology: JASN. 2003; 14:2534–2543. [PubMed: 14514731]
54. Mishra J, Dent C, Tarabishi R, Mitsnefes MM, Ma Q, Kelly C, Ruff SM, Zahedi K, Shao M, Bean J, Mori K, Barasch J, Devarajan P. Neutrophil gelatinase-associated lipocalin (NGAL) as a biomarker for acute renal injury after cardiac surgery. Lancet. 2005; 365:1231–1238. [PubMed: 15811456]
55. Bolignano D, Donato V, Coppolino G, Campo S, Buemi A, Lacquaniti A, Buemi M. Neutrophil gelatinase-associated lipocalin (NGAL) as a marker of kidney damage. Am J Kidney Dis. 2008; 52:595–605. [PubMed: 18725016]
56. Bolignano D, Coppolino G, Campo S, Aloisi C, Nicocia G, Frisina N, Buemi M. Urinary neutrophil gelatinase-associated lipocalin (NGAL) is associated with severity of renal disease in proteinuric patients. Nephrol Dial Transplant. 2008; 23:414–416. [PubMed: 17893105]
57. Dai W, Gupta SL. Regulation of indoleamine 2,3-dioxygenase gene expression in human fibroblasts by interferon-gamma. Upstream control region discriminates between interferon-gamma and interferon-alpha. J Biol Chem. 1990; 265:19871–19877. [PubMed: 2174056]
58. Hassanain HH, Chon SY, Gupta SL. Differential regulation of human indoleamine 2,3-dioxygenase gene expression by interferons-gamma and -alpha. Analysis of the regulatory region of the gene and identification of an interferon-gamma-inducible DNA-binding factor. J Biol Chem. 1993; 268:5077–5084. [PubMed: 8444884]
59. Li H, Wu Q, Li J, Yang P, Zhu Z, Luo B, Hsu HC, Mountz JD. Cutting Edge: defective follicular exclusion of apoptotic antigens due to marginal zone macrophage defects in autoimmune BXD2 mice. Journal of immunology. 2013; 190:4465–4469.
60. Fang L, Zhou Y, Cao H, Wen P, Jiang L, He W, Dai C, Yang J. Autophagy attenuates diabetic glomerular damage through protection of hyperglycemia-induced podocyte injury. PLoS One. 2013; 8:e60546. [PubMed: 23593240]
61. Cybulsky AV. The intersecting roles of endoplasmic reticulum stress, ubiquitin- proteasome system, and autophagy in the pathogenesis of proteinuric kidney disease. Kidney Int. 2013; 84:25–33. [PubMed: 23254900]
62. Kang YL, Saleem MA, Chan KW, Yung BY, Law HK. The cytoprotective role of autophagy in puromycin aminonucleoside treated human podocytes. Biochem Biophys Res Commun. 2014; 443:628–634. [PubMed: 24333414]
Chaudhary et al. Page 18
J Immunol. Author manuscript; available in PMC 2016 June 15.
Author M
anuscriptA
uthor Manuscript
Author M
anuscriptA
uthor Manuscript
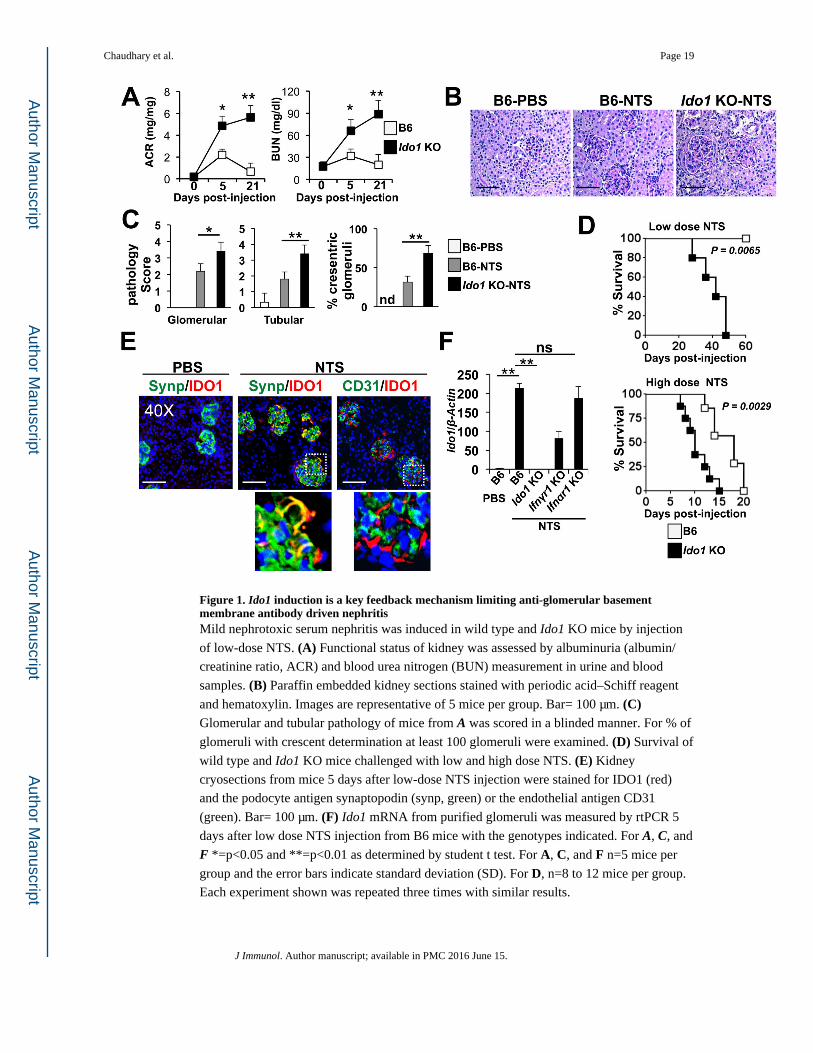
Figure 1. Ido1 induction is a key feedback mechanism limiting anti-glomerular basement membrane antibody driven nephritisMild nephrotoxic serum nephritis was induced in wild type and Ido1 KO mice by injection
of low-dose NTS. (A) Functional status of kidney was assessed by albuminuria (albumin/
creatinine ratio, ACR) and blood urea nitrogen (BUN) measurement in urine and blood
samples. (B) Paraffin embedded kidney sections stained with periodic acid–Schiff reagent
and hematoxylin. Images are representative of 5 mice per group. Bar= 100 μm. (C) Glomerular and tubular pathology of mice from A was scored in a blinded manner. For % of
glomeruli with crescent determination at least 100 glomeruli were examined. (D) Survival of
wild type and Ido1 KO mice challenged with low and high dose NTS. (E) Kidney
cryosections from mice 5 days after low-dose NTS injection were stained for IDO1 (red)
and the podocyte antigen synaptopodin (synp, green) or the endothelial antigen CD31
(green). Bar= 100 μm. (F) Ido1 mRNA from purified glomeruli was measured by rtPCR 5
days after low dose NTS injection from B6 mice with the genotypes indicated. For A, C, and
F *=p<0.05 and **=p<0.01 as determined by student t test. For A, C, and F n=5 mice per
group and the error bars indicate standard deviation (SD). For D, n=8 to 12 mice per group.
Each experiment shown was repeated three times with similar results.
Chaudhary et al. Page 19
J Immunol. Author manuscript; available in PMC 2016 June 15.
Author M
anuscriptA
uthor Manuscript
Author M
anuscriptA
uthor Manuscript
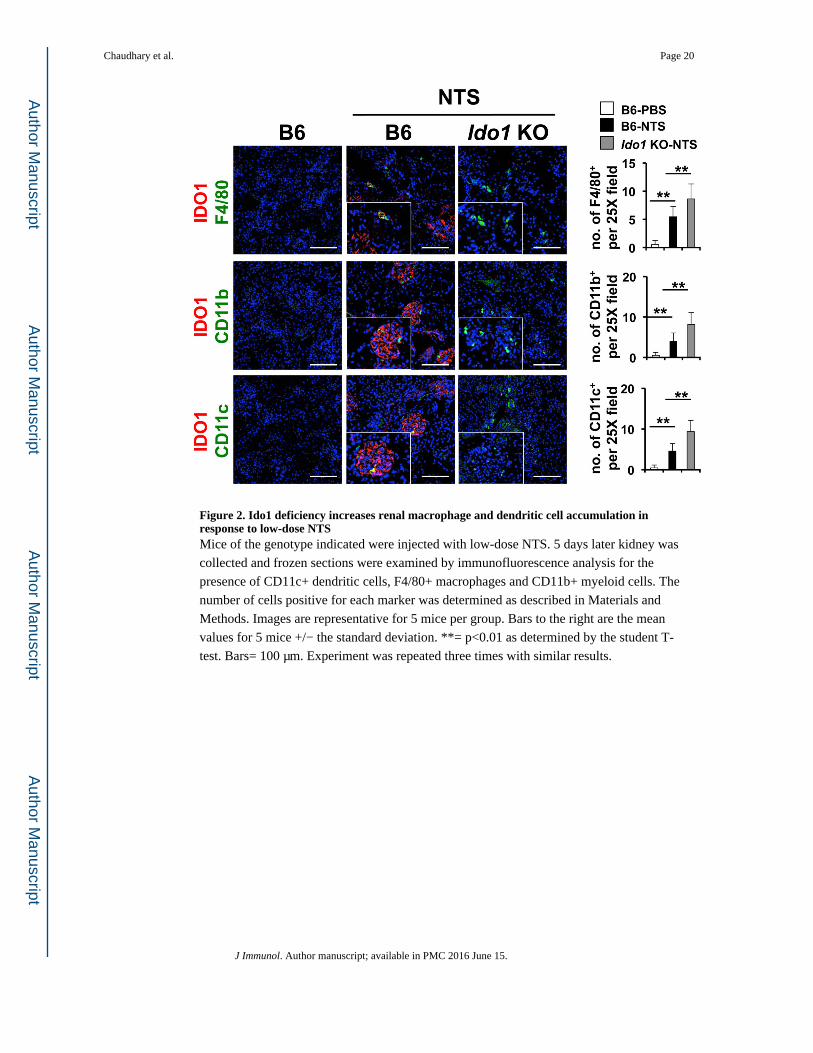
Figure 2. Ido1 deficiency increases renal macrophage and dendritic cell accumulation in response to low-dose NTSMice of the genotype indicated were injected with low-dose NTS. 5 days later kidney was
collected and frozen sections were examined by immunofluorescence analysis for the
presence of CD11c+ dendritic cells, F4/80+ macrophages and CD11b+ myeloid cells. The
number of cells positive for each marker was determined as described in Materials and
Methods. Images are representative for 5 mice per group. Bars to the right are the mean
values for 5 mice +/− the standard deviation. **= p<0.01 as determined by the student T-
test. Bars= 100 μm. Experiment was repeated three times with similar results.
Chaudhary et al. Page 20
J Immunol. Author manuscript; available in PMC 2016 June 15.
Author M
anuscriptA
uthor Manuscript
Author M
anuscriptA
uthor Manuscript
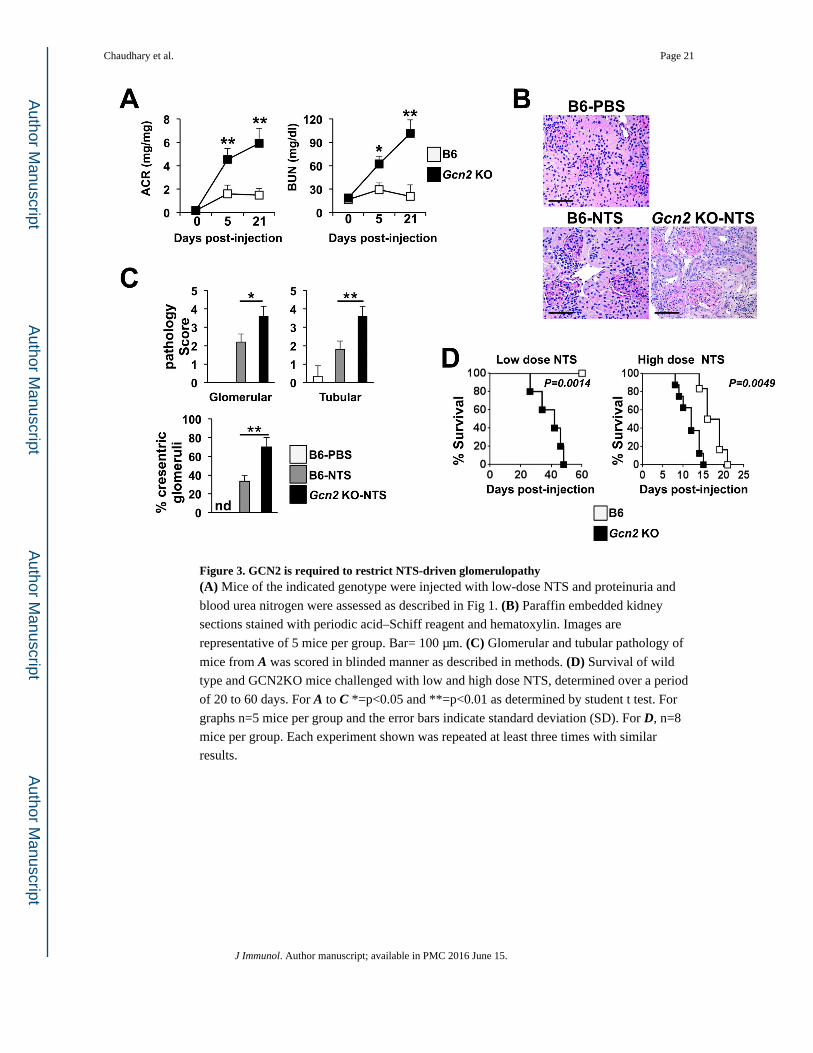
Figure 3. GCN2 is required to restrict NTS-driven glomerulopathy(A) Mice of the indicated genotype were injected with low-dose NTS and proteinuria and
blood urea nitrogen were assessed as described in Fig 1. (B) Paraffin embedded kidney
sections stained with periodic acid–Schiff reagent and hematoxylin. Images are
representative of 5 mice per group. Bar= 100 μm. (C) Glomerular and tubular pathology of
mice from A was scored in blinded manner as described in methods. (D) Survival of wild
type and GCN2KO mice challenged with low and high dose NTS, determined over a period
of 20 to 60 days. For A to C *=p<0.05 and **=p<0.01 as determined by student t test. For
graphs n=5 mice per group and the error bars indicate standard deviation (SD). For D, n=8
mice per group. Each experiment shown was repeated at least three times with similar
results.
Chaudhary et al. Page 21
J Immunol. Author manuscript; available in PMC 2016 June 15.
Author M
anuscriptA
uthor Manuscript
Author M
anuscriptA
uthor Manuscript
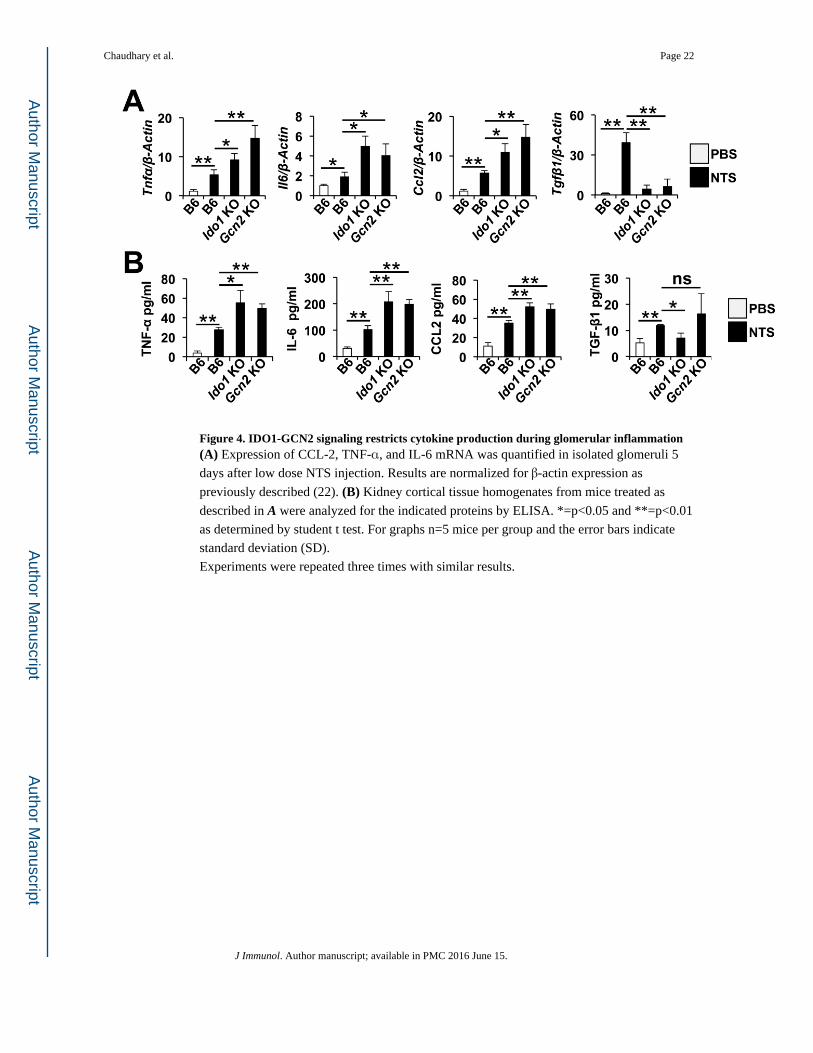
Figure 4. IDO1-GCN2 signaling restricts cytokine production during glomerular inflammation(A) Expression of CCL-2, TNF-α, and IL-6 mRNA was quantified in isolated glomeruli 5
days after low dose NTS injection. Results are normalized for β-actin expression as
previously described (22). (B) Kidney cortical tissue homogenates from mice treated as
described in A were analyzed for the indicated proteins by ELISA. *=p<0.05 and **=p<0.01
as determined by student t test. For graphs n=5 mice per group and the error bars indicate
standard deviation (SD).
Experiments were repeated three times with similar results.
Chaudhary et al. Page 22
J Immunol. Author manuscript; available in PMC 2016 June 15.
Author M
anuscriptA
uthor Manuscript
Author M
anuscriptA
uthor Manuscript
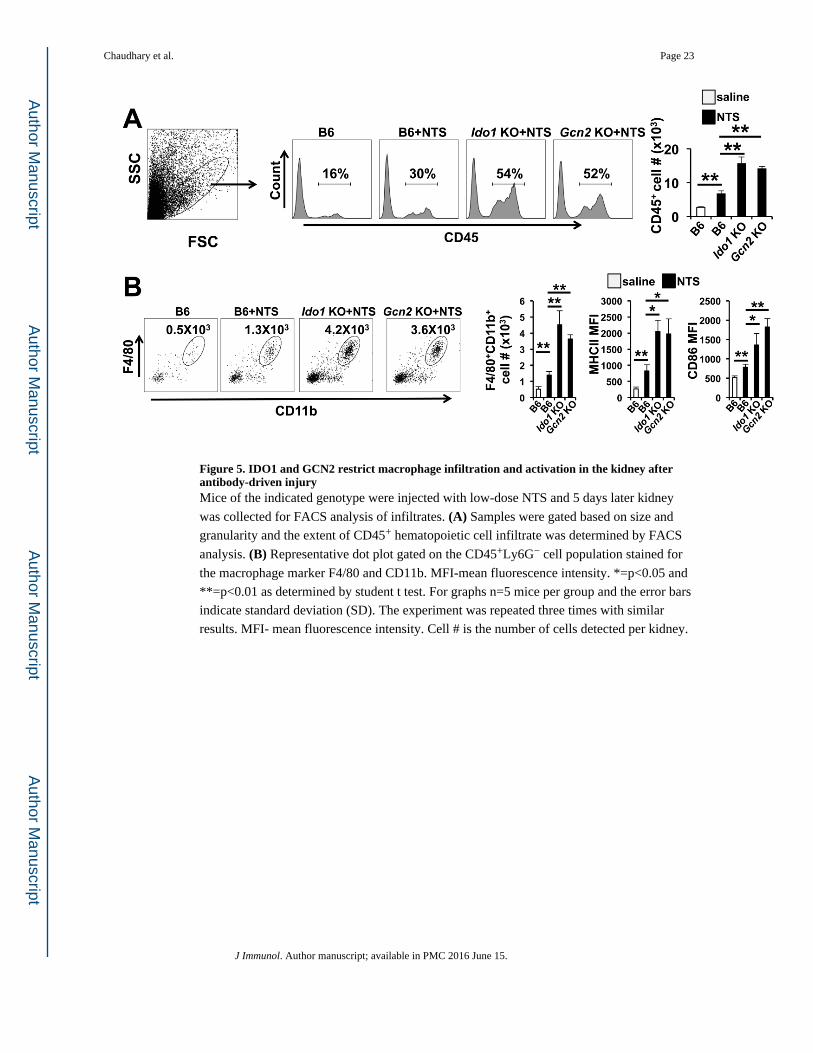
Figure 5. IDO1 and GCN2 restrict macrophage infiltration and activation in the kidney after antibody-driven injuryMice of the indicated genotype were injected with low-dose NTS and 5 days later kidney
was collected for FACS analysis of infiltrates. (A) Samples were gated based on size and
granularity and the extent of CD45+ hematopoietic cell infiltrate was determined by FACS
analysis. (B) Representative dot plot gated on the CD45+Ly6G− cell population stained for
the macrophage marker F4/80 and CD11b. MFI-mean fluorescence intensity. *=p<0.05 and
**=p<0.01 as determined by student t test. For graphs n=5 mice per group and the error bars
indicate standard deviation (SD). The experiment was repeated three times with similar
results. MFI- mean fluorescence intensity. Cell # is the number of cells detected per kidney.
Chaudhary et al. Page 23
J Immunol. Author manuscript; available in PMC 2016 June 15.
Author M
anuscriptA
uthor Manuscript
Author M
anuscriptA
uthor Manuscript
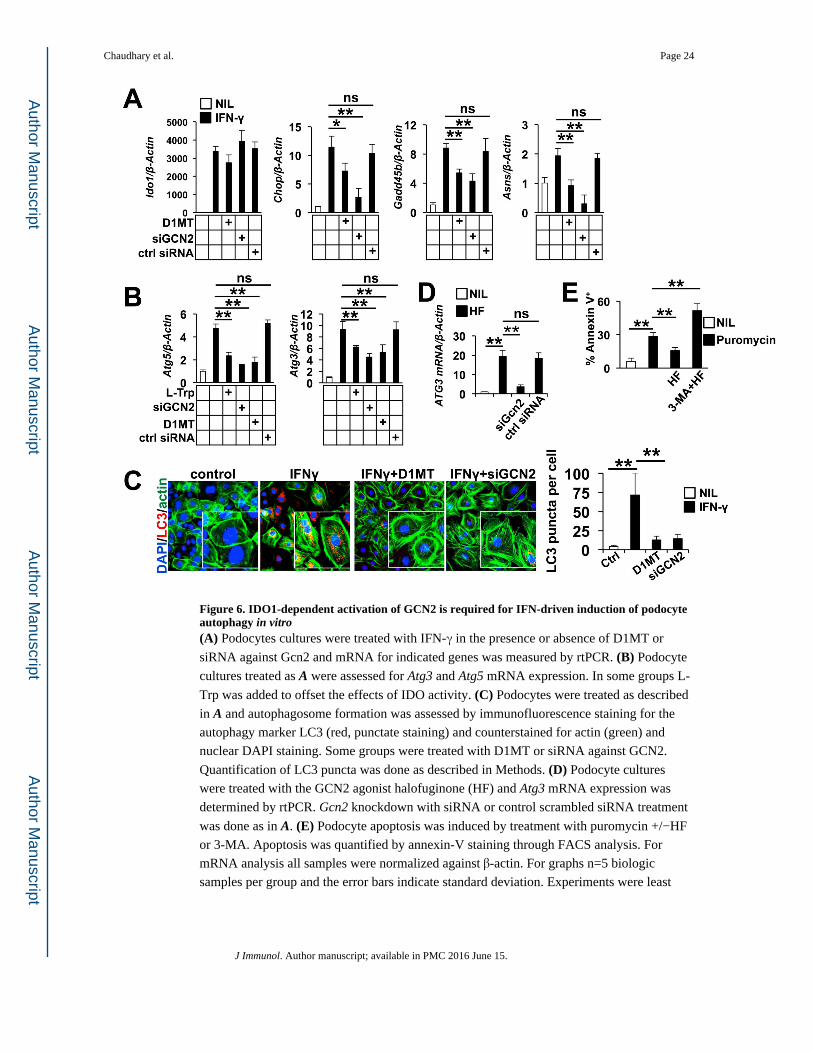
Figure 6. IDO1-dependent activation of GCN2 is required for IFN-driven induction of podocyte autophagy in vitro(A) Podocytes cultures were treated with IFN-γ in the presence or absence of D1MT or
siRNA against Gcn2 and mRNA for indicated genes was measured by rtPCR. (B) Podocyte
cultures treated as A were assessed for Atg3 and Atg5 mRNA expression. In some groups L-
Trp was added to offset the effects of IDO activity. (C) Podocytes were treated as described
in A and autophagosome formation was assessed by immunofluorescence staining for the
autophagy marker LC3 (red, punctate staining) and counterstained for actin (green) and
nuclear DAPI staining. Some groups were treated with D1MT or siRNA against GCN2.
Quantification of LC3 puncta was done as described in Methods. (D) Podocyte cultures
were treated with the GCN2 agonist halofuginone (HF) and Atg3 mRNA expression was
determined by rtPCR. Gcn2 knockdown with siRNA or control scrambled siRNA treatment
was done as in A. (E) Podocyte apoptosis was induced by treatment with puromycin +/−HF
or 3-MA. Apoptosis was quantified by annexin-V staining through FACS analysis. For
mRNA analysis all samples were normalized against β-actin. For graphs n=5 biologic
samples per group and the error bars indicate standard deviation. Experiments were least
Chaudhary et al. Page 24
J Immunol. Author manuscript; available in PMC 2016 June 15.
Author M
anuscriptA
uthor Manuscript
Author M
anuscriptA
uthor Manuscript
three times with similar results. *=p<0.05, **= p<0.01, ns= not significant as determined by
the student t test. Experiments were repeated four times with similar results.
Chaudhary et al. Page 25
J Immunol. Author manuscript; available in PMC 2016 June 15.
Author M
anuscriptA
uthor Manuscript
Author M
anuscriptA
uthor Manuscript
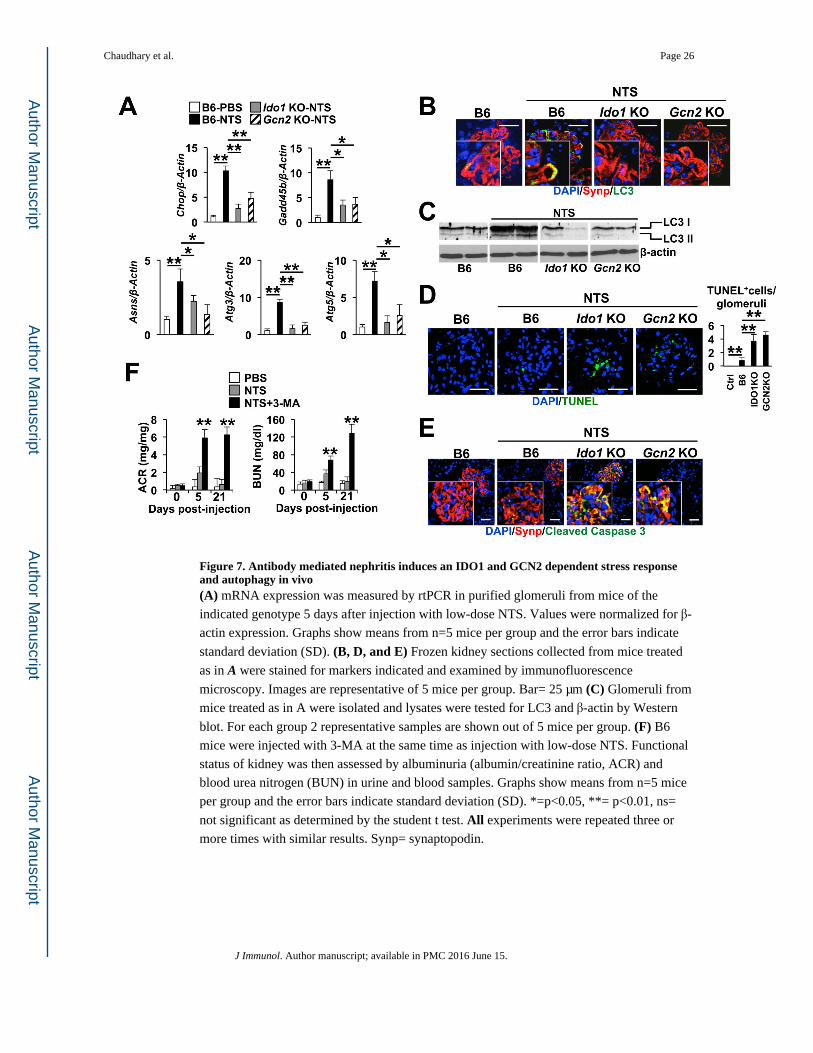
Figure 7. Antibody mediated nephritis induces an IDO1 and GCN2 dependent stress response and autophagy in vivo(A) mRNA expression was measured by rtPCR in purified glomeruli from mice of the
indicated genotype 5 days after injection with low-dose NTS. Values were normalized for β-
actin expression. Graphs show means from n=5 mice per group and the error bars indicate
standard deviation (SD). (B, D, and E) Frozen kidney sections collected from mice treated
as in A were stained for markers indicated and examined by immunofluorescence
microscopy. Images are representative of 5 mice per group. Bar= 25 μm (C) Glomeruli from
mice treated as in A were isolated and lysates were tested for LC3 and β-actin by Western
blot. For each group 2 representative samples are shown out of 5 mice per group. (F) B6
mice were injected with 3-MA at the same time as injection with low-dose NTS. Functional
status of kidney was then assessed by albuminuria (albumin/creatinine ratio, ACR) and
blood urea nitrogen (BUN) in urine and blood samples. Graphs show means from n=5 mice
per group and the error bars indicate standard deviation (SD). *=p<0.05, **= p<0.01, ns=
not significant as determined by the student t test. All experiments were repeated three or
more times with similar results. Synp= synaptopodin.
Chaudhary et al. Page 26
J Immunol. Author manuscript; available in PMC 2016 June 15.
Author M
anuscriptA
uthor Manuscript
Author M
anuscriptA
uthor Manuscript
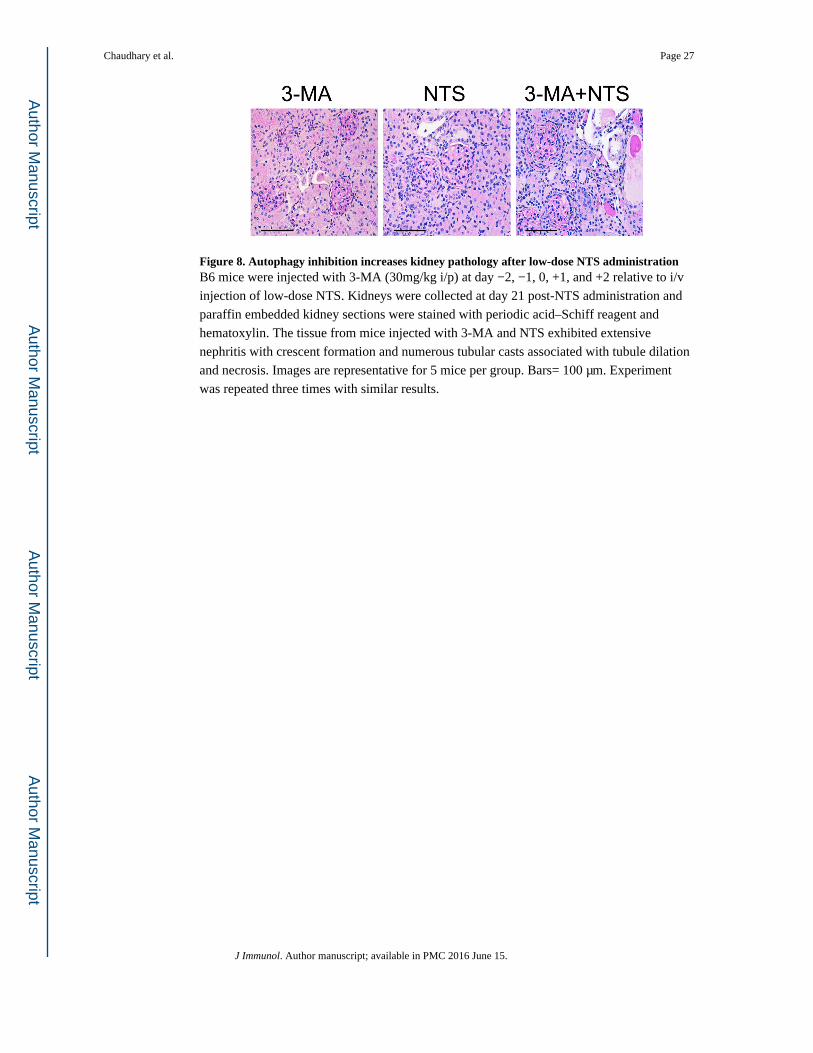
Figure 8. Autophagy inhibition increases kidney pathology after low-dose NTS administrationB6 mice were injected with 3-MA (30mg/kg i/p) at day −2, −1, 0, +1, and +2 relative to i/v
injection of low-dose NTS. Kidneys were collected at day 21 post-NTS administration and
paraffin embedded kidney sections were stained with periodic acid–Schiff reagent and
hematoxylin. The tissue from mice injected with 3-MA and NTS exhibited extensive
nephritis with crescent formation and numerous tubular casts associated with tubule dilation
and necrosis. Images are representative for 5 mice per group. Bars= 100 μm. Experiment
was repeated three times with similar results.
Chaudhary et al. Page 27
J Immunol. Author manuscript; available in PMC 2016 June 15.
Author M
anuscriptA
uthor Manuscript
Author M
anuscriptA
uthor Manuscript
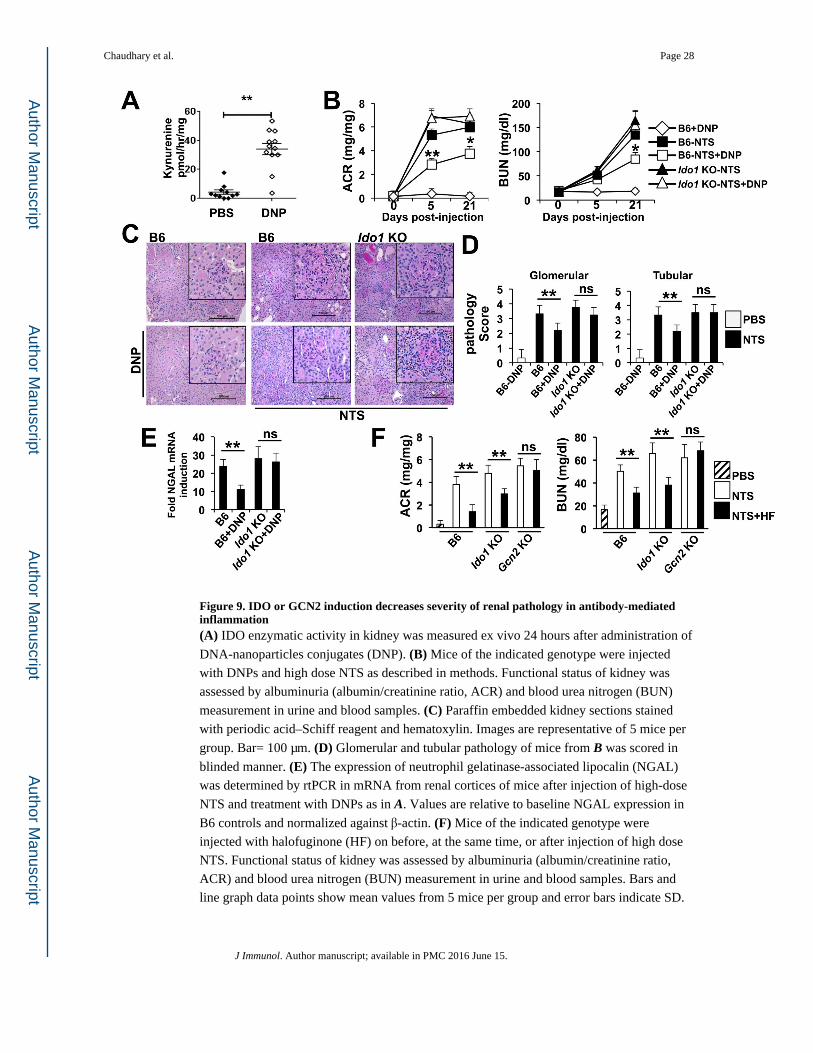
Figure 9. IDO or GCN2 induction decreases severity of renal pathology in antibody-mediated inflammation(A) IDO enzymatic activity in kidney was measured ex vivo 24 hours after administration of
DNA-nanoparticles conjugates (DNP). (B) Mice of the indicated genotype were injected
with DNPs and high dose NTS as described in methods. Functional status of kidney was
assessed by albuminuria (albumin/creatinine ratio, ACR) and blood urea nitrogen (BUN)
measurement in urine and blood samples. (C) Paraffin embedded kidney sections stained
with periodic acid–Schiff reagent and hematoxylin. Images are representative of 5 mice per
group. Bar= 100 μm. (D) Glomerular and tubular pathology of mice from B was scored in
blinded manner. (E) The expression of neutrophil gelatinase-associated lipocalin (NGAL)
was determined by rtPCR in mRNA from renal cortices of mice after injection of high-dose
NTS and treatment with DNPs as in A. Values are relative to baseline NGAL expression in
B6 controls and normalized against β-actin. (F) Mice of the indicated genotype were
injected with halofuginone (HF) on before, at the same time, or after injection of high dose
NTS. Functional status of kidney was assessed by albuminuria (albumin/creatinine ratio,
ACR) and blood urea nitrogen (BUN) measurement in urine and blood samples. Bars and
line graph data points show mean values from 5 mice per group and error bars indicate SD.
Chaudhary et al. Page 28
J Immunol. Author manuscript; available in PMC 2016 June 15.
Author M
anuscriptA
uthor Manuscript
Author M
anuscriptA
uthor Manuscript
*=p<0.05, **=p<0.01, ns= not significant as determined by the student t test. Experiments
were repeated three times with similar results.
Chaudhary et al. Page 29
J Immunol. Author manuscript; available in PMC 2016 June 15.
Author M
anuscriptA
uthor Manuscript
Author M
anuscriptA
uthor Manuscript
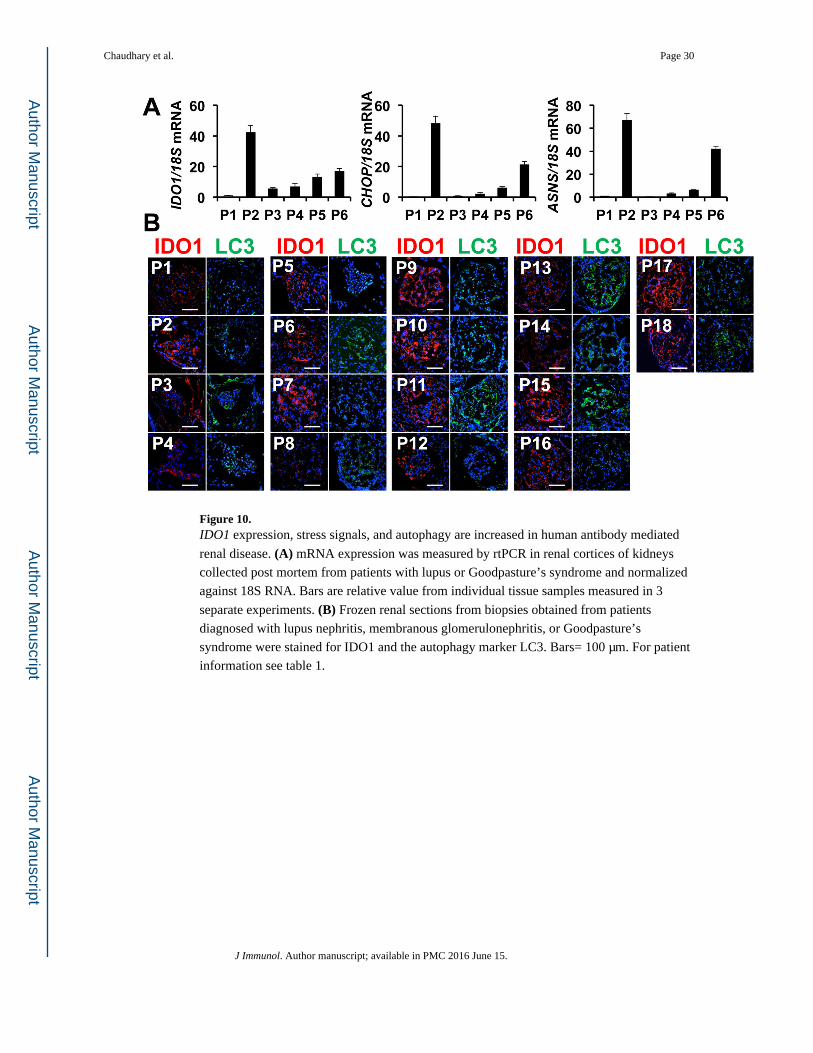
Figure 10. IDO1 expression, stress signals, and autophagy are increased in human antibody mediated
renal disease. (A) mRNA expression was measured by rtPCR in renal cortices of kidneys
collected post mortem from patients with lupus or Goodpasture’s syndrome and normalized
against 18S RNA. Bars are relative value from individual tissue samples measured in 3
separate experiments. (B) Frozen renal sections from biopsies obtained from patients
diagnosed with lupus nephritis, membranous glomerulonephritis, or Goodpasture’s
syndrome were stained for IDO1 and the autophagy marker LC3. Bars= 100 μm. For patient
information see table 1.
Chaudhary et al. Page 30
J Immunol. Author manuscript; available in PMC 2016 June 15.
Author M
anuscriptA
uthor Manuscript
Author M
anuscriptA
uthor Manuscript
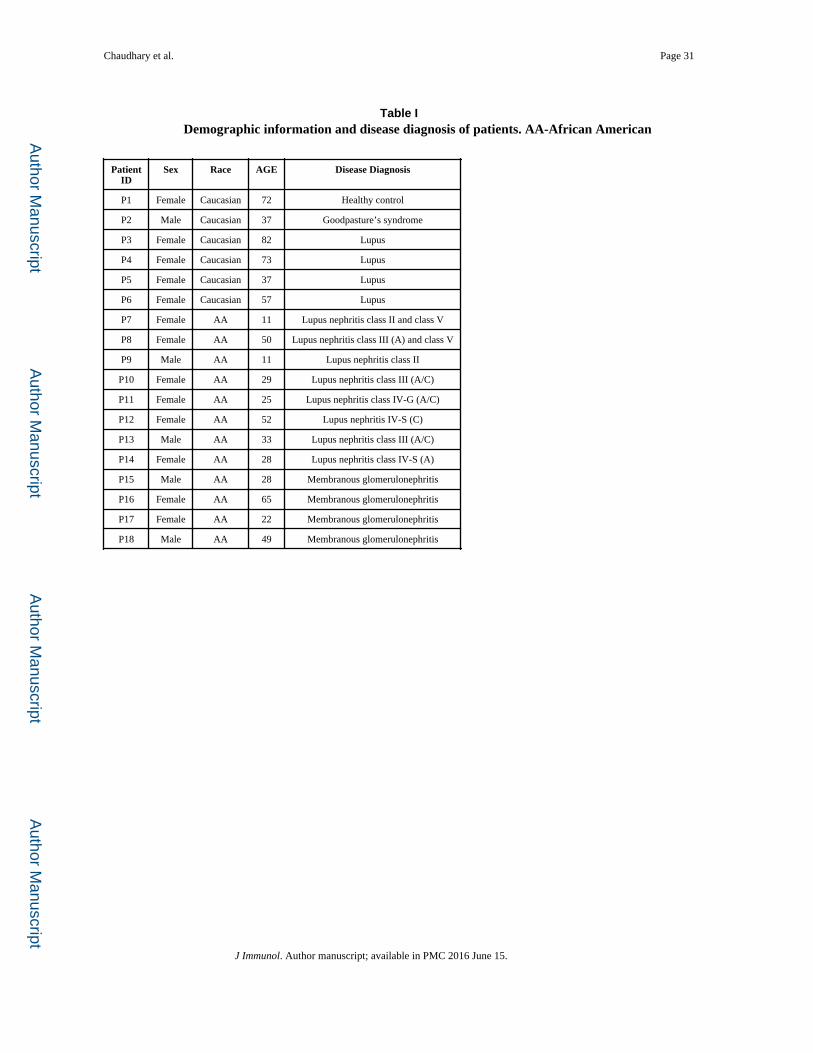
Author M
anuscriptA
uthor Manuscript
Author M
anuscriptA
uthor Manuscript
Chaudhary et al. Page 31
Table IDemographic information and disease diagnosis of patients. AA-African American
PatientID
Sex Race AGE Disease Diagnosis
P1 Female Caucasian 72 Healthy control
P2 Male Caucasian 37 Goodpasture’s syndrome
P3 Female Caucasian 82 Lupus
P4 Female Caucasian 73 Lupus
P5 Female Caucasian 37 Lupus
P6 Female Caucasian 57 Lupus
P7 Female AA 11 Lupus nephritis class II and class V
P8 Female AA 50 Lupus nephritis class III (A) and class V
P9 Male AA 11 Lupus nephritis class II
P10 Female AA 29 Lupus nephritis class III (A/C)
P11 Female AA 25 Lupus nephritis class IV-G (A/C)
P12 Female AA 52 Lupus nephritis IV-S (C)
P13 Male AA 33 Lupus nephritis class III (A/C)
P14 Female AA 28 Lupus nephritis class IV-S (A)
P15 Male AA 28 Membranous glomerulonephritis
P16 Female AA 65 Membranous glomerulonephritis
P17 Female AA 22 Membranous glomerulonephritis
P18 Male AA 49 Membranous glomerulonephritis
J Immunol. Author manuscript; available in PMC 2016 June 15.