Embed Size (px)
Citation preview
Kinetic Study of Hydrogen Evolution Reaction over Strained MoS2with Sulfur Vacancies Using Scanning Electrochemical MicroscopyHong Li,†,¶ Minshu Du,∥,¶ Michal J. Mleczko,‡ Ai Leen Koh,§ Yoshio Nishi,‡ Eric Pop,‡,⊥ Allen J. Bard,*,∥
and Xiaolin Zheng*,†
†Department of Mechanical Engineering, ‡Department of Electrical Engineering, §Stanford Nano Shared Facilities, and ⊥PrecourtInstitute for Energy, Stanford University, Stanford, California 94305, United States∥Center for Electrochemistry, Department of Chemistry, The University of Texas at Austin, Austin, Texas 78712, United States
*S Supporting Information
ABSTRACT: Molybdenum disulfide (MoS2), with its activeedge sites, is a proposed alternative to platinum for catalyzingthe hydrogen evolution reaction (HER). Recently, the inertbasal plane of MoS2 was successfully activated and optimizedwith excellent intrinsic HER activity by creating and furtherstraining sulfur (S) vacancies. Nevertheless, little is knownabout the HER kinetics of those S vacancies and the additionaleffects from elastic tensile strain. Herein, scanning electro-chemical microscopy was used to determine the HER kineticdata for both unstrained S vacancies (formal potential Ev
0 =−0.53 VAg/AgCl, electron-transfer coefficient αv = 0.4, electron-transfer rate constant kv
0 = 2.3 × 10⁻⁴ cm/s) and strained Svacancies (Esv
0 = −0.53 VAg/AgCl, αsv = 0.4, ksv0 = 1.0 × 10⁻³ cm/
s) on the basal plane of MoS2 monolayers, and the strained S vacancy has an electron-transfer rate 4 times higher than that of theunstrained S vacancy. This study provides a general platform for measuring the kinetics of two-dimensional material-basedcatalysts.
■ INTRODUCTION
Molybdenum disulfide (MoS2) has been extensively studied asan attractive catalyst for the hydrogen evolution reaction(HER) for about three decades.1−4 The edge sites of MoS2were first theoretically proposed as active sites in 20055 andthen were experimentally confirmed in 2007.6 Since then,efforts to optimize MoS2 for HER have focused on maximizingthe density of edge sites.7−9 Very recently, the basal plane ofMoS2, which is long thought to be inert for HER, wassuccessfully activated by creating sulfur (S) vacancies thatgenerated new gap states near the Fermi level for hydrogenbinding10,11 and further enhanced by elastically straining the Svacancies that moved the new gap states closer to the Fermilevel.11 So far, all the understanding of the HER activity ofthose unstrained or strained S vacancies comes fromthermodynamic consideration of their hydrogen adsorptionenergy,11 and little is known about the kinetics of those Svacancies on the basal plane of MoS2.In this report, we employ scanning electrochemical
microscopy (SECM)12 equipped with a platinum (Pt)ultramicroelectrode (UME) to determine the kinetic informa-tion on both unstrained and strained S vacancies on the basalplane of MoS2 monolayers. SECM has been previously appliedto study the HER kinetics of metallic catalysts, such as PtUME,13 manganese (Mn) electrodes,14 Pt and gold (Au) thinlayer cells,15 and metal nanoparticles.16−18 These studies
successfully determined the apparent rate constants andelectron-transfer coefficients of the HER on Pt, palladium(Pd), and Mn electrodes.13,14,16,17 More importantly, thesestudies established the methodology to quantify the HERkinetics, including simplifying the HER to be a quasi-reversibleone-step reaction, using a thin layer cell formalism of the HERin the SECM theoretical equations19 and describing the rates ofthe elementary steps and coverage of adsorbed hydrogen atomson metallic electrodes based on the Volmer−Heyrovsky−Tafelmechanism.15 Herein, we leverage the existing framework of theHER study (using SECM to investigate heterogeneouselectrochemical reactions in the energy materials)20−22 andadapt it to study the HER kinetics of the two-dimensional (2-D) catalyst of MoS2 monolayers.
■ EXPERIMENTAL SECTIONSample Fabrication. Continuous 2H-MoS2 monolayers were
grown in a homemade tube furnace.11 The as-grown MoS2 monolayerswere transferred onto a silicon dioxide (SiO2) substrate capped by agold (90 nm)/titanium (10 nm) film using the poly(methylmethacrylate) (PMMA)-assisted transfer process. Briefly, a PMMAfilm was coated onto the as-grown MoS2 on a SiO2 substrate. Then thesample was soaked in potassium hydroxide solution to etch the surface
Received: February 5, 2016Published: March 19, 2016
Article
pubs.acs.org/JACS
© 2016 American Chemical Society 5123 DOI: 10.1021/jacs.6b01377J. Am. Chem. Soc. 2016, 138, 5123−5129
This is an open access article published under an ACS AuthorChoice License, which permitscopying and redistribution of the article or any adaptations for non-commercial purposes.
SiO2 layer and to lift off the PMMA/MoS2 bilayer film (see SupportingNote 1 for more details). Afterward, the PMMA/MoS2 bilayer film wascleaned and floated on a deionized water surface and then scooped bythe target substrate. In the center of the SiO2 substrate, an array ofSiO2 nanopillars (Supporting Information) was obtained via dryetching of the SiO2 film with an electron-beam resist as the etchingmask, which was patterned by electron-beam lithography. Columnswere defined with a negative-tone electron-beam resist (MaN-2403).The pitch size was 650 nm, and the diameter and height of thenanopillars were 350 and 80 nm, respectively. The gold nanopillarswere formed after metallization of SiO2 nanopillars. After thoroughPMMA removal by sequential soaking of samples in acetone (60 °Cfor 10 min) and chloroform (60 °C for 1 h), the sample was strainedby capillary force (see Supporting Note 1).23 To create S vacancies,the cleaned MoS2 samples were exposed to a cold and mild argonplasma (Supporting Note 1).24 The MoS2 film on the flat area of thesubstrate (outside the nanopillar array area) was used as MoS2 with Svacancies (V-MoS2), and that inside the nanopillar array area was usedas strained MoS2 with S vacancies (SV-MoS2). The same PMMA-assisted transfer method was used to prepare the transmission electronmicroscopy (TEM) sample for S vacancy characterization bytransferring the as-grown MoS2 monolayers onto a TEM grid(quantifoil TEM grid, Ted Pella, Inc.), followed by PMMA removalthrough sequential acetone and chloroform soaking processes. Thenthe TEM sample was treated with mild Ar plasma to create S vacancies(Supporting Note 1).Sample Characterization. Elastic strain in the sample was
quantified from the well-established strain-Raman shift relation.Raman modes (E2g
1 and A1g) of monolayer MoS2 show red shiftsupon uniaxial tensile strain with ratios of 2.2 and 0.5 cm−1/% for E2g
1
and A1g modes, respectively.23,25 The magnitude of the elastic strain
was thus calculated by the amount of red shifts of Raman modes(Figure S1). Aberration-corrected, monochromated TEM (ACTEM)imaging was performed using a FEI spherical aberration (Cs) image-corrected 80-300 Titan environmental (scanning) TEM operated at 80kV under negative Cs imaging (NCSI) conditions,26,27 wherein thespherical aberration coefficient of the objective lens was adjusted toapproximately −15 μm, and images were acquired using a slightoverfocus setting.MoS2 Working Electrode Preparation. The MoS2 working
electrodes were defined by masking the MoS2 substrate using plastictape with two hole openings. One hole was located on the unstrainedMoS2 area (V-MoS2), and the other was on the nearby strained MoS2
area (SV-MoS2). Only the areas within the two holes were exposed tothe electrolyte (Supporting Note 2 and Figure S2a).
Electrochemical Measurements. A 920C SECM (CH Instru-ments, Austin, TX) setup (Figure S2b) was employed for theelectrochemical measurements. The MoS2 samples on a Au/Ti-coatedSiO2/Si wafer were placed between an acrylic base and a PTFE cellwith a 3.8 mm diameter orifice in the center. The samples were thenconnected to the potentiostat through a copper tape that was stuck tothe bare Au part of the SiO2/Si wafer. An O-ring with a 1.8 mm innerdiameter was used to ensure a leakage-free connection. A 25 μmdiameter Pt UME served as the tip, which was mounted facingdownward to the substrate electrode. A Pt wire was used as a counterelectrode, and a Ag/AgCl (1 M) electrode (CH Instruments, Austin,TX) acted as a reference electrode. All potentials shown in this workwere relative to the Ag/AgCl (1 M) reference electrode unless statedotherwise. For the SECM experiments, a sealed glovebag was used tokeep the system free of oxygen by purging with argon (Ar). All SECMmeasurements were performed in 0.1 M HClO4 aqueous solution afterdeaeration via Ar bubbling.
The V-MoS2 and SV-MoS2 substrate electrodes were studiedsuccessively by being individually placed within the O-ring area. Twokinds of substrate generation−tip collection (SG−TC) modes wereapplied. First, the MoS2 substrate potential was swept from 0 V to−0.7 V at a scan rate of 5 mV/s to generate hydrogen continuously,and the hydrogen was then collected at the Pt UME tip. Second, theMoS2 substrate potential was switched between the open circuitpotential (OCP) and the negative potentials for HER by dual-potentialpulses. The pulse width was 0.5 s with five replicates. Also, the tippotential was held at 0 V as an amperometric sensor for collecting andoxidizing the hydrogen.
The measurements in Figure S6 were performed by a three-electrode electrochemical compression cell connected to a Gamry 600potentiostat. The MoS2 substrate served as the working electrode; A Ptwire acted as the counter electrode, and a Ag/AgCl electrode was usedas the reference electrode. Sulfuric acid (0.3 M) with a pH value of 0.2was used as the electrolyte.
Multiphysics Simulation. For SECM SG−TC experiments,numerical simulations were performed using COMSOL Multiphysicssoftware v4.2 (COMSOL, Inc., Burlington, MA). A 2-D axialsymmetry model was employed, where a 12.5 μm radius Pt UME (a= 12.5 μm, RG = 2) and a 250 μm radius MoS2 substrate (b = 250μm) were vertically aligned in a cylinder with a radius of 500 μm and aheight of 500 μm. The distance between the tip and substrate was 5μm for V-MoS2 and 4 μm for SV-MoS2 modeling. Since the scan rate
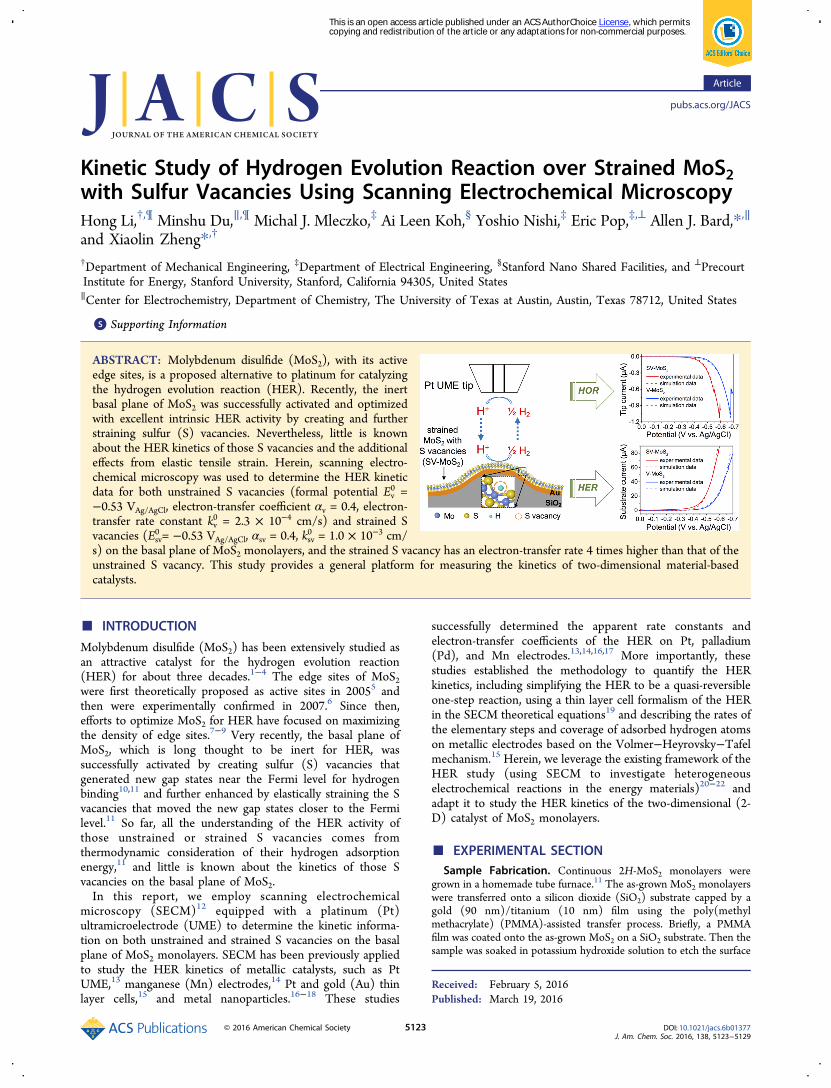
Figure 1.Methodology for quantifying the HER kinetics of strained/unstrained S vacancies on the basal plane of MoS2 monolayers. (a) Schematic ofthe SECM measurement setup that operates in the SG−TC mode. The top trapezoid represents a Pt UME tip, and the bottom strained MoS2monolayer with S vacancies functions as the working electrode. H2 is generated at the MoS2 substrate through HER and subsequently collected andoxidized at the Pt UME tip through HOR. (b) Schematic of the complementary COMSOL simulation for the spatial distribution of hydrogenconcentration (CR/mM). The left side shows the tip and substrate 2-D configuration used in the simulation. The tip is a 25 μm diameter Pt wire in aglass shell (the ratio of glass to metal radius RG = 2). The SV-MoS2 substrate has a diameter of about 0.5 mm. The right side shows a representativecalculated CR distribution (condition: SV-MoS2 potential at −0.6 V and Pt UME tip potential at 0 V in 0.1 M HClO4). Left inset: zoomed-in view ofCR near the tip−substrate gap. Bottom inset: color bar of CR.
Journal of the American Chemical Society Article
DOI: 10.1021/jacs.6b01377J. Am. Chem. Soc. 2016, 138, 5123−5129
5124
of the SG−TC experiment was sufficiently slow (5 mV/s), we used thesteady-state solver to perform the simulation for the potential sweepexperiments. The kinetic parameters of the HER for V-MoS2 and SV-MoS2, including the formal potential E
0, electron-transfer coefficient α,and the rate constants k0, were determined by finding the best fitbetween experimental and simulated linear sweep voltammograms forboth the tip and the substrate (see Supporting Note 3 for moredetails).
■ RESULTS AND DISCUSSIONThe SECM measurement setup is schematically illustrated inFigure 1a, and it operates in SG−TC mode.28,29 The monolayerMoS2 supported on Au is the substrate electrode (i.e., workingelectrode) that is negatively biased to evolve H2 (i.e., HER:
+ →+ −eH H12 2), while a Pt UME tip is held at constant 0 V
vs Ag/AgCl (1 M) reference electrode and measures thecurrent generated from the hydrogen oxidation reaction (i.e.,HOR: → ++ −eH H1
2 2 ). Since the HOR current collected by
the Pt UME tip is controlled by the diffusion of H2 generatedon the MoS2 monolayer electrode, it excludes potential currentcontributions from other side reactions (e.g., reduction ofgrowth precursor, molybdenum trioxide). As such, the SG−TCmode allows us to accurately determine the electron-transferkinetics of the HER of the MoS2 monolayer electrode.Complementary finite difference simulation is carried out tocalculate the time-dependent concentration profiles of hydro-gen and the proton in the SG−TC mode of SECM (Figure 1b).Since there is no recognized model for the HER kinetics ofMoS2, we assume that it follows a general one-electron-transferreaction model with a Butler−Volmer formalism. All kineticparameters were determined by identifying the best fit betweenthe theoretically simulated and experimentally measured linearsweep voltammogram (LSV) curves. It is worth noting that thework described here concerns the relative rates of the HER
reaction, thus the model selected to fit the data is of secondaryimportance.For the SECM measurement, the working electrode consists
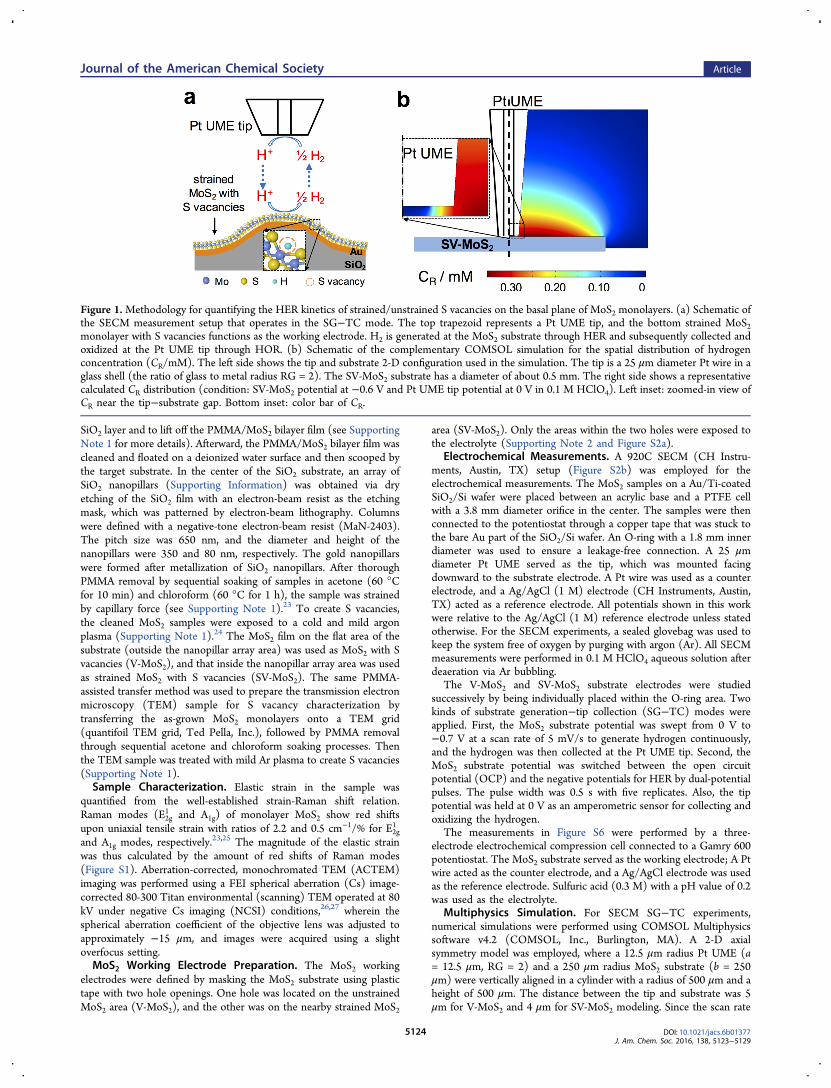
of either unstrained (on flat substrates, V-MoS2) or strained(on nanopillar arrays, Figure 1a shows a single nanopillar for aclear illustration, SV-MoS2) MoS2 monolayers with S vacancies.The atomic force microscopy (AFM) image in Figure 2a showsthat the MoS2 monolayers conformally and uniformly coat thenanopillar array. As such, MoS2 monolayers are strained withlarger strain on top of the nanopillars and smaller strainbetween nanopillars.23 The magnitude and spatial distributionof the strain (Figure 2b) were determined by Ramanspectroscopy,25,30 and the peak strain magnitude is about 1%biaxial tensile strain, or equivalently 2% uniaxial tensile strain(see Figure S1). The S vacancies on the basal plane of MoS2monolayers are clearly shown in the ACTEM image (Figure2c). In this image, the brightest spots correspond to Mo atomsand the lower intensity spots are the S atoms. The highlightedareas (dashed triangles) in Figure 2c correspond to the locationof S atoms, but they exhibit dimmer or even absent brightness,indicating that one or two (top and bottom atomic planes) Satoms in the MoS2 monolayer are missing. By counting thenumber of those S atoms with dimmer or absent brightness inthe ACTEM image, we estimate that about 13% S atoms havebeen removed by the Ar plasma treatment.Next, we ensure that the Pt UME tip is placed in the
hydrogen diffusion layer above the MoS2 working electrodes forthe SECM measurements, so that the HOR current collectedby the Pt UME tip is controlled by the diffusion of H2generated on the MoS2 working electrodes. Specifically, thePt UME tip was first electrochemically activated in Ar-saturated0.1 M HClO4 by cycling the applied potential between −0.2and +1.0 V at a scan rate of 0.1 V/s for 20 cycles. Afterward, thePt UME tip was held at a fixed potential at −0.35 V, where
Figure 2. Quantification of the strain magnitude and S vacancy concentration in MoS2 monolayers. (a) AFM image of a typical strained monolayerMoS2 sample on patterned Au nanopillars. Scale bar is 1 μm. (b) Color-coded strain distribution in a strain-textured monolayer MoS2 (14 × 14 μm2)obtained from scanning micro-Raman spectroscopy. The peak strain magnitude on the top of nanopillars is about 2% (uniaxial tensile strain). (c)ACTEM image of a ∼6.5 × 6.5 nm2 MoS2 monolayer with about ∼13% S vacancies. The biggest and brightest dots are Mo atoms, and the smallbright dots are S atoms. Small dim dots are mono-S vacancies, some of which have been labeled by dashed triangles. Scale bar is 1 nm.
Journal of the American Chemical Society Article
DOI: 10.1021/jacs.6b01377J. Am. Chem. Soc. 2016, 138, 5123−5129
5125
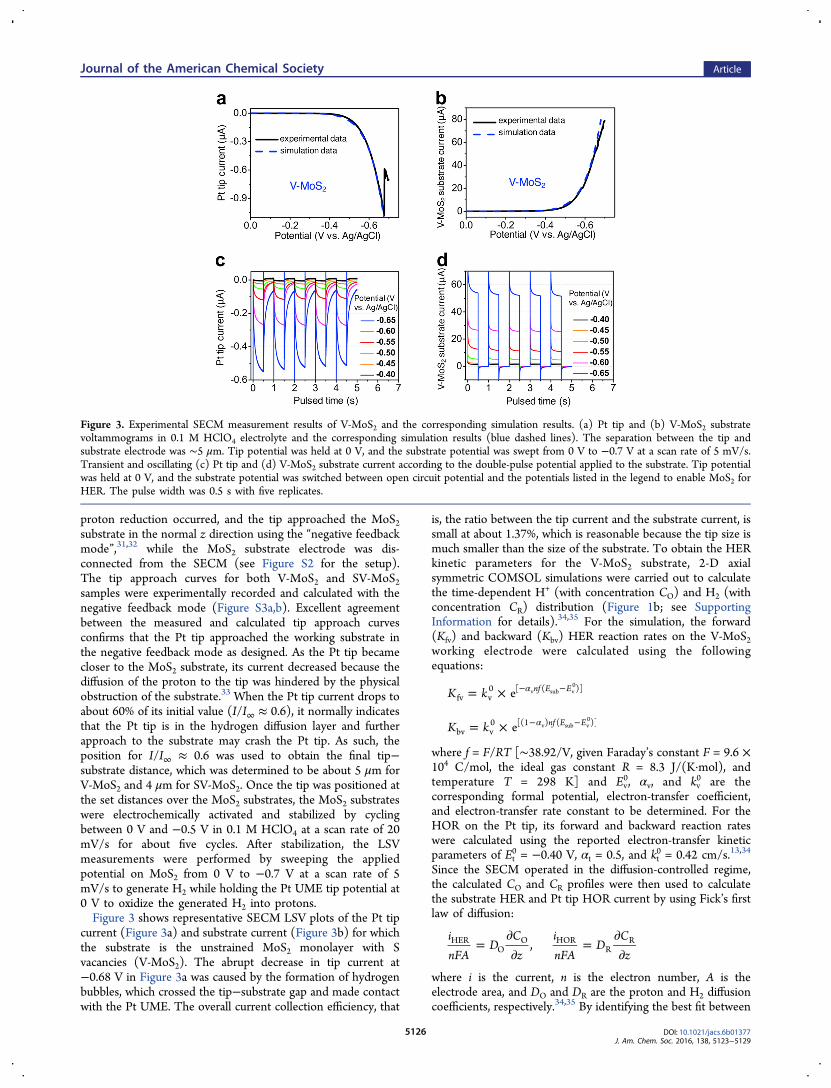
proton reduction occurred, and the tip approached the MoS2substrate in the normal z direction using the “negative feedbackmode”,31,32 while the MoS2 substrate electrode was dis-connected from the SECM (see Figure S2 for the setup).The tip approach curves for both V-MoS2 and SV-MoS2samples were experimentally recorded and calculated with thenegative feedback mode (Figure S3a,b). Excellent agreementbetween the measured and calculated tip approach curvesconfirms that the Pt tip approached the working substrate inthe negative feedback mode as designed. As the Pt tip becamecloser to the MoS2 substrate, its current decreased because thediffusion of the proton to the tip was hindered by the physicalobstruction of the substrate.33 When the Pt tip current drops toabout 60% of its initial value (I/I∞ ≈ 0.6), it normally indicatesthat the Pt tip is in the hydrogen diffusion layer and furtherapproach to the substrate may crash the Pt tip. As such, theposition for I/I∞ ≈ 0.6 was used to obtain the final tip−substrate distance, which was determined to be about 5 μm forV-MoS2 and 4 μm for SV-MoS2. Once the tip was positioned atthe set distances over the MoS2 substrates, the MoS2 substrateswere electrochemically activated and stabilized by cyclingbetween 0 V and −0.5 V in 0.1 M HClO4 at a scan rate of 20mV/s for about five cycles. After stabilization, the LSVmeasurements were performed by sweeping the appliedpotential on MoS2 from 0 V to −0.7 V at a scan rate of 5mV/s to generate H2 while holding the Pt UME tip potential at0 V to oxidize the generated H2 into protons.Figure 3 shows representative SECM LSV plots of the Pt tip
current (Figure 3a) and substrate current (Figure 3b) for whichthe substrate is the unstrained MoS2 monolayer with Svacancies (V-MoS2). The abrupt decrease in tip current at−0.68 V in Figure 3a was caused by the formation of hydrogenbubbles, which crossed the tip−substrate gap and made contactwith the Pt UME. The overall current collection efficiency, that
is, the ratio between the tip current and the substrate current, issmall at about 1.37%, which is reasonable because the tip size ismuch smaller than the size of the substrate. To obtain the HERkinetic parameters for the V-MoS2 substrate, 2-D axialsymmetric COMSOL simulations were carried out to calculatethe time-dependent H+ (with concentration CO) and H2 (withconcentration CR) distribution (Figure 1b; see SupportingInformation for details).34,35 For the simulation, the forward(Kfv) and backward (Kbv) HER reaction rates on the V-MoS2working electrode were calculated using the followingequations:
= × α− −K k e nf E Efv v
0 [ ( )]v sub v0
= × α− −K k e nf E Ebv v
0 [(1 ) ( )]v sub v0
where f = F/RT [∼38.92/V, given Faraday’s constant F = 9.6 ×10⁴ C/mol, the ideal gas constant R = 8.3 J/(K·mol), andtemperature T = 298 K] and Ev
0, αv, and kv0 are the
corresponding formal potential, electron-transfer coefficient,and electron-transfer rate constant to be determined. For theHOR on the Pt tip, its forward and backward reaction rateswere calculated using the reported electron-transfer kineticparameters of Et
0 = −0.40 V, αt = 0.5, and kt0 = 0.42 cm/s.13,34
Since the SECM operated in the diffusion-controlled regime,the calculated CO and CR profiles were then used to calculatethe substrate HER and Pt tip HOR current by using Fick’s firstlaw of diffusion:
=∂∂
=∂∂
inFA
DCz
inFA
DCz
,HERO
O HORR
R
where i is the current, n is the electron number, A is theelectrode area, and DO and DR are the proton and H2 diffusioncoefficients, respectively.34,35 By identifying the best fit between
Figure 3. Experimental SECM measurement results of V-MoS2 and the corresponding simulation results. (a) Pt tip and (b) V-MoS2 substratevoltammograms in 0.1 M HClO4 electrolyte and the corresponding simulation results (blue dashed lines). The separation between the tip andsubstrate electrode was ∼5 μm. Tip potential was held at 0 V, and the substrate potential was swept from 0 V to −0.7 V at a scan rate of 5 mV/s.Transient and oscillating (c) Pt tip and (d) V-MoS2 substrate current according to the double-pulse potential applied to the substrate. Tip potentialwas held at 0 V, and the substrate potential was switched between open circuit potential and the potentials listed in the legend to enable MoS2 forHER. The pulse width was 0.5 s with five replicates.
Journal of the American Chemical Society Article
DOI: 10.1021/jacs.6b01377J. Am. Chem. Soc. 2016, 138, 5123−5129
5126
the calculated currents (Figure 3a,b, dashed lines) and themeasured currents (Figure 3a,b, solid lines), the HER kineticdata (Ev
0 = −0.53 V, αv = 0.4, kv0 = 2.3 × 10⁻⁴ cm/s) were
determined for V-MoS2.Since the HER would not reach the steady state in 0.1 M
HClO4 acid during our SECM measurement, we furtherconducted transient response measurements to verify the abovekinetic parameters extracted from the LSV curves. For thetransient response study,36 we applied a pulse potential to theMoS2 substrate electrode between the OCP and variousnegative potentials with a pulse width of 0.5 s for fivereplicates. The applied potential to the Pt tip was held at 0 V,which was much more positive than the HOR formal potential(−0.40 V), so that the HOR proceeded at a diffusion-controlledrate on the Pt tip, which ensured the validity of extracting theHER kinetic parameters from the tip current, as discussedearlier. The corresponding transient Pt tip and MoS2 substratecurrents are plotted in Figure 3c,d, respectively, and both showsimilar oscillating behavior. First, the Pt tip current (Figure 3c)is nearly 0 A when a MoS2 substrate is at the OCP (without anyHER activity), which shows no hysteresis for H2 collection onthe Pt tip. Second, when more negative potential is applied toMoS2, it generates a larger HER substrate current and larger Pttip HOR current, which verifies that the Pt tip HOR current isindeed controlled by the H2 diffusion flux. Moreover, it is notedthat both the tip and the V-MoS2 substrate currents agree withthe electron-transfer kinetics obtained from Figure 3a,b, whichalso suggests that the one-electron reaction model with aButler−Volmer equation provides a reasonable formalism totreat the complex HER kinetics on V-MoS2.Next, we applied similar SECM measurement steps (as
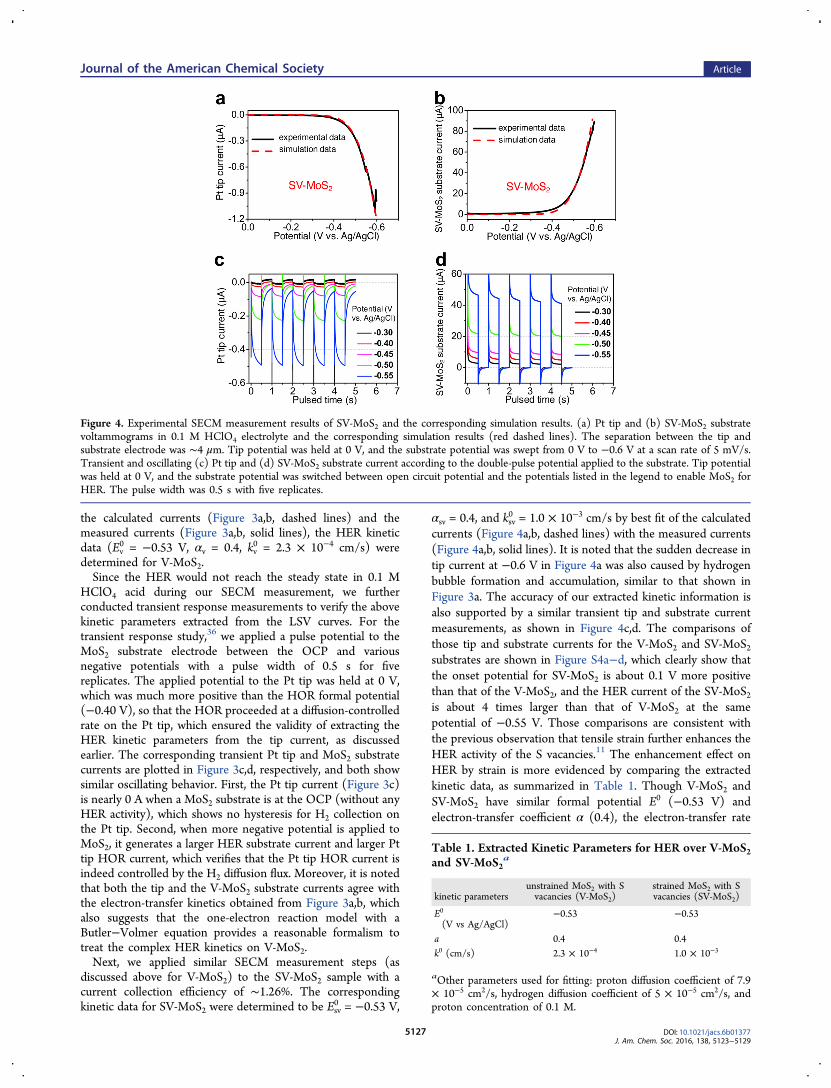
discussed above for V-MoS2) to the SV-MoS2 sample with acurrent collection efficiency of ∼1.26%. The correspondingkinetic data for SV-MoS2 were determined to be Esv
0 = −0.53 V,
αsv = 0.4, and ksv0 = 1.0 × 10⁻³ cm/s by best fit of the calculated
currents (Figure 4a,b, dashed lines) with the measured currents(Figure 4a,b, solid lines). It is noted that the sudden decrease intip current at −0.6 V in Figure 4a was also caused by hydrogenbubble formation and accumulation, similar to that shown inFigure 3a. The accuracy of our extracted kinetic information isalso supported by a similar transient tip and substrate currentmeasurements, as shown in Figure 4c,d. The comparisons ofthose tip and substrate currents for the V-MoS2 and SV-MoS2substrates are shown in Figure S4a−d, which clearly show thatthe onset potential for SV-MoS2 is about 0.1 V more positivethan that of the V-MoS2, and the HER current of the SV-MoS2is about 4 times larger than that of V-MoS2 at the samepotential of −0.55 V. Those comparisons are consistent withthe previous observation that tensile strain further enhances theHER activity of the S vacancies.11 The enhancement effect onHER by strain is more evidenced by comparing the extractedkinetic data, as summarized in Table 1. Though V-MoS2 andSV-MoS2 have similar formal potential E0 (−0.53 V) andelectron-transfer coefficient α (0.4), the electron-transfer rate
Figure 4. Experimental SECM measurement results of SV-MoS2 and the corresponding simulation results. (a) Pt tip and (b) SV-MoS2 substratevoltammograms in 0.1 M HClO4 electrolyte and the corresponding simulation results (red dashed lines). The separation between the tip andsubstrate electrode was ∼4 μm. Tip potential was held at 0 V, and the substrate potential was swept from 0 V to −0.6 V at a scan rate of 5 mV/s.Transient and oscillating (c) Pt tip and (d) SV-MoS2 substrate current according to the double-pulse potential applied to the substrate. Tip potentialwas held at 0 V, and the substrate potential was switched between open circuit potential and the potentials listed in the legend to enable MoS2 forHER. The pulse width was 0.5 s with five replicates.
Table 1. Extracted Kinetic Parameters for HER over V-MoS2and SV-MoS2
a
kinetic parametersunstrained MoS2 with Svacancies (V-MoS2)
strained MoS2 with Svacancies (SV-MoS2)
E0
(V vs Ag/AgCl)−0.53 −0.53
a 0.4 0.4k0 (cm/s) 2.3 × 10⁻⁴ 1.0 × 10⁻³
aOther parameters used for fitting: proton diffusion coefficient of 7.9× 10⁻⁵ cm2/s, hydrogen diffusion coefficient of 5 × 10⁻⁵ cm2/s, andproton concentration of 0.1 M.
Journal of the American Chemical Society Article
DOI: 10.1021/jacs.6b01377J. Am. Chem. Soc. 2016, 138, 5123−5129
5127
constant k0 for SV-MoS2 is about 4 times higher than that of V-MoS2.Finally, the reliability of our SECM measurement was
confirmed by four more repeated measurements of the V-MoS2and SV-MoS2 regions on the same substrate (Figure S5, wherethe error bars represent the standard deviation). The very smallerrors suggest that our SECM measurements are reliable. Wefurther confirmed this by complementary measurements usinga three-electrode electrochemical compression cell that has adiameter of 3 mm (see our previous work for more details11).The average LSV ranges of both V-MoS2 and SV-MoS2 samples(eight samples total) are represented by shaded regions inFigure S6. One can see that the separate measurements agreereasonably well despite the different electrolytes and sampledimensions of the two distinct measurements.
■ CONCLUSION
In summary, we have successfully applied the combinationalapproach of SECM measurements and multiphysics modelingto investigate the HER kinetics of newly identified active sitesthat consist of S vacancies on the basal plane of MoS2. TheHER kinetic data for S vacancies were determined to be theformal potential Ev
0 = −0.53 VAg/AgCl, electron-transfercoefficient αv = 0.4, and electron-transfer rate constant kv
0 =2.3 × 10⁻⁴ cm/s. In addition, the effect of tensile strain on theHER kinetics of S vacancies was quantified. About 2% uniaxialtensile strain increases the electron-transfer rate constant byalmost 4-fold (ksv
0 = 1.0 × 10⁻³ cm/s), confirming that thetensile elastic strain indeed accelerates the HER kinetics of Svacancies in MoS2. The methodology presented here provides ageneral way to study the electrochemical kinetics of MoS2-liketwo-dimensional catalytic systems.
■ ASSOCIATED CONTENT
*S Supporting InformationThe Supporting Information is available free of charge on theACS Publications website at DOI: 10.1021/jacs.6b01377.
Supporting figures of the Raman spectra of strained andunstrained MoS2, optical image of a typical SECMsample, schematic SECM measurement setup, measuredand calculated SECM approach curves, comparison ofHER activities of V-MoS2 and SV-MoS2, comparison ofLSV curves of Pt, V-MoS2, and SV-MoS2, complemen-tary LSV measurements using an electrochemicalcompression cell, simulated LSV curves at various k0;Supporting Note 1 of sample fabrication and character-ization; Supporting Note 2 of substrate electrodepreparation, Pt UME tip preparation, and SECMmeasurements; Supporting Note 3 of multiphysicssimulation (PDF)
■ AUTHOR INFORMATION
Corresponding Authors*[email protected]*[email protected]
Author Contributions¶H.L. and M.D. contributed equally to this work.
NotesThe authors declare no competing financial interest.
■ ACKNOWLEDGMENTS
This work was financially supported by the National ScienceFoundation (CHE-1405248), and the 2013 Global ResearchOutreach (GRO) Program (Award No. IC2012-1318) of theSamsung Advanced Institute of Technology (SAIT) andSamsung R&D Center America, Silicon Valley (SRA-SV),under the supervision of Dr. Debasis Bera and AnthonyRadspieler, Jr. Part of this work was performed at the StanfordNano Shared Facilities (SNSF).
■ REFERENCES(1) Nidola, A.; Schira, R. Int. J. Hydrogen Energy 1986, 11, 449−454.(2) Merki, D.; Hu, X. Energy Environ. Sci. 2011, 4, 3878−3888.(3) Laursen, A. B.; Kegnaes, S.; Dahl, S.; Chorkendorff, I. EnergyEnviron. Sci. 2012, 5, 5577−5591.(4) Benck, J. D.; Hellstern, T. R.; Kibsgaard, J.; Chakthranont, P.;Jaramillo, T. F. ACS Catal. 2014, 4, 3957−3971.(5) Hinnemann, B.; Moses, P. G.; Bonde, J.; Jørgensen, K. P.;Nielsen, J. H.; Horch, S.; Chorkendorff, I.; Nørskov, J. K. J. Am. Chem.Soc. 2005, 127, 5308−5309.(6) Jaramillo, T. F.; Jørgensen, K. P.; Bonde, J.; Nielsen, J. H.; Horch,S.; Chorkendorff, I. Science 2007, 317, 100−102.(7) Chen, Z.; Cummins, D.; Reinecke, B. N.; Clark, E.; Sunkara, M.K.; Jaramillo, T. F. Nano Lett. 2011, 11, 4168−4175.(8) Kibsgaard, J.; Chen, Z.; Reinecke, B. N.; Jaramillo, T. F. Nat.Mater. 2012, 11, 963−969.(9) Kong, D.; Wang, H.; Cha, J. J.; Pasta, M.; Koski, K. J.; Yao, J.;Cui, Y. Nano Lett. 2013, 13, 1341−1347.(10) Ataca, C.; Ciraci, S. Phys. Rev. B: Condens. Matter Mater. Phys.2012, 85, 195410.(11) Li, H.; Tsai, C.; Koh, A. L.; Cai, L.; Contryman, A. W.;Fragapane, A. H.; Zhao, J.; Han, H. S.; Manoharan, H. C.; Abild-Pedersen, F.; Nørskov, J. K.; Zheng, X. Nat. Mater. 2016, 15, 48−53.(12) Bard, A. J.; Fan, F. R. F.; Kwak, J.; Lev, O. Anal. Chem. 1989, 61,132−138.(13) Zhou, J.; Zu, Y.; Bard, A. J. J. Electroanal. Chem. 2000, 491, 22−29.(14) Leonard, K. C.; Bard, A. J. J. Am. Chem. Soc. 2013, 135, 15890−15896.(15) Bonazza, H. L.; Vega, L. D.; Fernandez, J. L. J. Electroanal. Chem.2014, 713, 9−16.(16) Ahmed, S.; Ji, S.; Petrik, L.; Linkov, V. M. Anal. Sci. 2004, 20,1283−1287.(17) Li, F.; Ciani, I.; Bertoncello, P.; Unwin, P. R.; Zhao, J.; Bradbury,C. R.; Fermin, D. J. J. Phys. Chem. C 2008, 112, 9686−9694.(18) Li, F.; Bertoncello, P.; Ciani, I.; Mantovani, G.; Unwin, P. R.Adv. Funct. Mater. 2008, 18, 1685−1693.(19) Fernandez, J. L. J. Electroanal. Chem. 2010, 650, 90−97.(20) Bertoncello, P. Energy Environ. Sci. 2010, 3, 1620−1633.(21) Lai, S. C. S.; Macpherson, J. V.; Unwin, P. R. MRS Bull. 2012,37, 668−674.(22) Wain, A. J. Electrochem. Commun. 2014, 46, 9−12.(23) Li, H.; Contryman, A. W.; Qian, X.; Ardakani, S. M.; Gong, Y.;Wang, X.; Weisse, J. M.; Lee, C. H.; Zhao, J.; Ajayan, P. M.; Li, J.;Manoharan, H. C.; Zheng, X. Nat. Commun. 2015, 6, 7381.(24) Ma, Q.; Odenthal, P. M.; Mann, J.; Le, D.; Wang, C. S.; Zhu, Y.;Chen, T.; Sun, D.; Yamaguchi, K.; Tran, T.; Wurch, M.; McKinley, J.L.; Wyrick, J.; Magnone, K.; Heinz, T. F.; Rahman, T. S.; Kawakami,R.; Bartels, L. J. Phys.: Condens. Matter 2013, 25, 252201.(25) Rice, C.; Young, R. J.; Zan, R.; Bangert, U.; Wolverson, D.;Georgiou, T.; Jalil, R.; Novoselov, K. S. Phys. Rev. B: Condens. MatterMater. Phys. 2013, 87, 081307.(26) Jia, C. L.; Urban, K. Science 2004, 303, 2001−2004.(27) Urban, K. W. Science 2008, 321, 506−510.(28) Martin, R. D.; Unwin, P. R. Anal. Chem. 1998, 70, 276−284.(29) Sanchez-Sanchez, C. M.; Rodriguez-Lopez, J.; Bard, A. J. Anal.Chem. 2008, 80, 3254−3260.
Journal of the American Chemical Society Article
DOI: 10.1021/jacs.6b01377J. Am. Chem. Soc. 2016, 138, 5123−5129
5128

(30) Li, H.; Zhang, Q.; Yap, C. C. R.; Tay, B. K.; Teo, H. T. E.;Olivier, A.; Baillargeat, D. Adv. Funct. Mater. 2012, 22, 1385−1390.(31) Unwin, P. R.; Bard, A. J. J. Phys. Chem. 1991, 95, 7814−7824.(32) Kwak, J.; Bard, A. J. Anal. Chem. 1989, 61, 1221−1227.(33) Bard, A. J.; Denuault, G.; Lee, C.; Mandler, D.; Wipf, D. O. Acc.Chem. Res. 1990, 23, 357−363.(34) Zoski, C. G. J. Phys. Chem. B 2003, 107, 6401−6405.(35) Sheng, W.; Gasteiger, H. A.; Shao-Horn, Y. J. Electrochem. Soc.2010, 157, B1529−B1536.(36) Minguzzi, A.; Battistel, D.; Rodríguez-Lopez, J.; Vertova, A.;Rondinini, S.; Bard, A. J.; Daniele, S. J. Phys. Chem. C 2015, 119,2941−2947.
Journal of the American Chemical Society Article
DOI: 10.1021/jacs.6b01377J. Am. Chem. Soc. 2016, 138, 5123−5129
5129


![Strained -Sn on InSb(001) · InSb, is likewise a heteroepitaxial strained system. The use of InSb as a template for high quality crystals is well established [18{20]. It induces a](https://img.pdfslide.tips/doc/110x75/5f63835e50764f10ad37eb67/strained-sn-on-insb001-insb-is-likewise-a-heteroepitaxial-strained-system-the.jpg)