Embed Size (px)
Citation preview
TASK QUARTERLY vol. 19, No 4, 2015, pp. 455–470
KOALA GRAPH THEORY
INTERNET SERVICE
TOMASZ GOLUCH, KRZYSZTOF M. OCETKIEWICZ
AND KRZYSZTOF GIARO
Department of Algorithms and System Modeling
Gdansk University of Technology
Narutowicza 11/12 80-233 Gdansk, Poland
(received: 4 June 2015; revised: 6 July 2015;
accepted: 15 July 2015; published online: 1 October 2015)
Abstract: KOALA has been created with the idea of C++ library templates, implementing
a broad set of procedures in the fields of algorithmic graph theory and network problems in
discrete optimization. During the C2NIWA project, a library has been greatly extended, the
code refactored and enclosed with the internet service available in the public repository of
the project. Today it contains interconnected educational materials in the form of Wikibook,
documentation and sample codes, a multifunctional web-based application for edition of graphs,
a collection of over 100 web services which offers a library of selected procedures to be run on
the BeesyCluster system.
Keywords: algorithmic graph theory, discrete optimization, C++ template library, web-based
application, educational vortal
1. Introduction
An internet vortal focused on the graph theory and discrete optimization
was created in the framework of the KOALA project, developed within the C2NIWA
(Centre of Competence for Novel Infrastructure of Workable Applications). The
whole project was divided into five parts, which have been described in detail in
the following sections of this article.
The first part is a template library, initially developed within the research
project (No. NN519 405837) of the Polish National Science Centre.
The second part is a documentation library which has been divided into
three parts: (1) the KOALA Theory and User Manual (the aim of this part is
to easily introduce the user to theoretical issues related to the library and its
implementing aspects), (2) the Reference Manual (an advanced manual created
in Doxygen, fully describing all the functionalities of the library), and (3) KOALA
456 T. Goluch, K. M. Ocetkiewicz and K. Giaro
code examples (collection of sample codes to use the procedures of the library in
an easy and proper way).
The third part of the KOALA project is an advanced editor of graphs
(ZGRED), prepared as a web-based application (executed in a browser) which
allows the user to create complex structures and run the algorithms of the library
on these graphs.
The fourth part is a service that provides the majority, namely 116, of
library methods as Web services. These services are used, inter alia, by the ZGRED
graph editor mentioned before.
The fifth and last part of the KOALA project is a sample application
depicting the problem of a Chinese postman in the form of a computer game.
A public repository has been created within the KOALA project including:
• KOALA library sources (C++ templates) [1];
• Internet documentation:
– The KOALA theory and User Manual (Wiki on Redmine) [2];
– The API (Doxygen) library documentation [3];
– Code examples [4];
• Advanced graph editor – ZGRED [5];
• A set of webservices running on the BeesyCluster [6];
• Demo application for local and mobile platforms (the Chinese postman puz-
zle) [7].
2. KOALA library
There are many solutions available on the market which are similar to the
KOALA library, however, their scope is limited, the assumptions are simplified and
their nature is rather commercial (e.g. LEDA [8]). Moreover, they usually have
a difficult and unergonomic “expert friendly” programming interface (e.g. the
Boost Graph Library [9]). KOALA is a library of C++ templates, implementing
a broad set of procedures and data structures in the fields of algorithmic graph
theory and network problems in discrete optimization. In its construction, the
KOALA is based on paradigms of object-oriented programming [10] and generic
programming [11]. The basic KOALA project assumptions are:
• versatility of the library – its procedures are adapted to a wide range of various
thematic areas of graph algorithmics;
• user-friendly interface procedures;
• easy and quick creation/experimenting with new procedures;
• possibility of convenient modification;
• supplying the user with tools which facilitate work with graphs.
Owing to that, KOALA reconciles two apparently contradictory priorities:
the created code uses (and also allows the user to use) modern, advanced C++
language mechanisms and at the same time the KOALA codes may be used
by programmers who have only basic knowledge of object oriented C++ and
KOALA Graph Theory Internet Service 457
templates. Library algorithms are available as static methods of classes which
group them into coherent thematic blocks. They usually occur in several versions
(overloading of names) with slightly different functionalities. KOALA offers its
advanced user a possibility of flexible modification of the behavior of some
procedures and modification of types of their internal data structures - which
can have an impact on the effectiveness of their implementation (a policy-based
programming paradigm [12] with policy classes for template procedures have
been applied). The main data structure is a template of a class of a mixed
(i.e. with directed and/or undirected edges) multigraph. This template contains
over 150 methods for performing various operations on vertices and edges. The
implemented algorithms cover various parts of the algorithmic graph theory and
discrete optimization, i.e.:
• The chromatic graph theory. Vertex and edge coloring: classical, list, interval
models;
• Analyzing the graph structure. DFS, BFS and Lex-BFS traversing, the topolog-
ical order and the Hasse diagram for acyclic digraphs, connected components,
2-connected and strongly connected components (for digraphs), modular de-
composition, searching the Eulerian cycle and path;
• Optimization problems for multigraphs with numerical weights on edges: The
Dijkstra (simple or with a priority queue), Bellman-Ford, Johnson and Floyd
algorithms (i.e. allowing negative weights), Kruskal’s algorithm, shortest and
longest paths in an acyclic digraph (critical paths tree);
• Flow problems. Maximal flow, the cheapest maximal flow or with a given
capacity, a minimal edge and minimal vertex cut, the Gomory-Hu tree, the
largest set of paths, which are internally vertex- or edge-disjoint with given
ends;
• Task scheduling on parallel identical processors in the following models
(expressed with three-field notation, see [13]): −|prec|Cmax (critical path),
P2|pj =1,prec|Cmax, P |pj =1,intree|Cmax, P |prec|Cmax (2-approximation),
1 |pj =1,prec,pmtn|Lmax, P |pj =1,intree|Lmax, P | |ΣCi, 1| |ΣUi;
• An independent set in a graph. Edge maximum (matching), stable matching in
a bipartite graph, vertex maximum (11 polynomial heuristics);
• Graph creation, recognition and transformations;
• Standard classes of graphs and algorithms dedicated to them;
• Input and output for graphs and vertex/edge parameters: 4 text formats;
• Specific container class templates.
The created software is open source. The KOALA library is consistent with
the C++ ISO/IEC 14882:2003 standard. In some cases specific mechanisms from
ISO/IEC 14882:2011 may also be used. However, proper modifications are always
implemented in order to meet the C++03 standard.
The Library was tested with the use of the following compilers: GCC v. 4.4.7
and newer, Intel 12.0, VisualStudio 2012, 2013 and CLang 3.5. It consists of: 72
458 T. Goluch, K. M. Ocetkiewicz and K. Giaro
source files, over 2MB of sources and about 50,000 lines of code [1]. In the whole
project, the specific version of the camelCase naming convention was used.
3. KOALA manual
Each library as comprehensive as KOALA can easily overwhelm the user
with all the features and diversity. However, a comprehensive documentation has
been created and attached to the library in order to help the user. The aim of
that documentation is to introduce inexperienced programmers to the world of
theory covered by the library and allow them to start the implementation quickly.
It can provide the user with a quick answer to the question - Is it possible to solve
a given problem by means of the library and how to implement it? The whole
documentation has been divided into two major complementary parts describing
various aspects of the project (see Section 3.1).
The first part is related to the KOALA Manual which describes the mathe-
matical apparatus for KOALA (the KOALA Theory) and the user’s manual which
describes basic algorithms and data structures of KOALA (the KOALA User Man-
ual). To avoid a redescription of concepts and issues which are well known, the
user, if possible, is also referred to external sources, e.g. scientific publications,
English-language Wikipedia, Wolfram MathWorld.
The second part consists of the so-called Reference Manual. It describes
precisely all the elements of the library. The two parts of the library can be easily
distinguished from each other as they have been created with the use of two
different tools: wiki of Redmine application [14] and Doxygen [15]. Additionally,
sample codes, described in detail in the last Section 3.3, have been added to
enable quick implementation. Sample codes are available in both parts of the
documentation. There are many links between the two parts and they refer to
each other. This allows the user to become familiar with the detailed description
of a given component and with the relevant theory.
For example, if the user wants to check whether the library allows him/her
to find the shortest path between two selected vertices in a weighted graph,
he/she should choose Chapter 7 of the KOALA Theory, entitled “Problems of
discrete optimization in weighted graphs”. In this chapter there is information
about the theory of weighted graphs and in particular the shortest weighted
path problem. Then, by clicking the “Shortest-path” link he/she is transferred
to the KOALA User Manual where he/she can learn about several approaches
to this issue. By choosing the first one – the Dijkstra class – the user gets
a description of its basic methods. He/She can read about the class in more
detail by clicking the “Dijkstra” link. However, providing that he/she is interested
in the “findPath” method, he/she can either directly get the information on
the sample code by clicking the “see code examples” link or find a detailed
description of this function by clicking the “findPath” link which transfers
him/her to the Reference Manual. After choosing the first option, apart from
a sample code, in most cases he/she will also see the runtime text output of
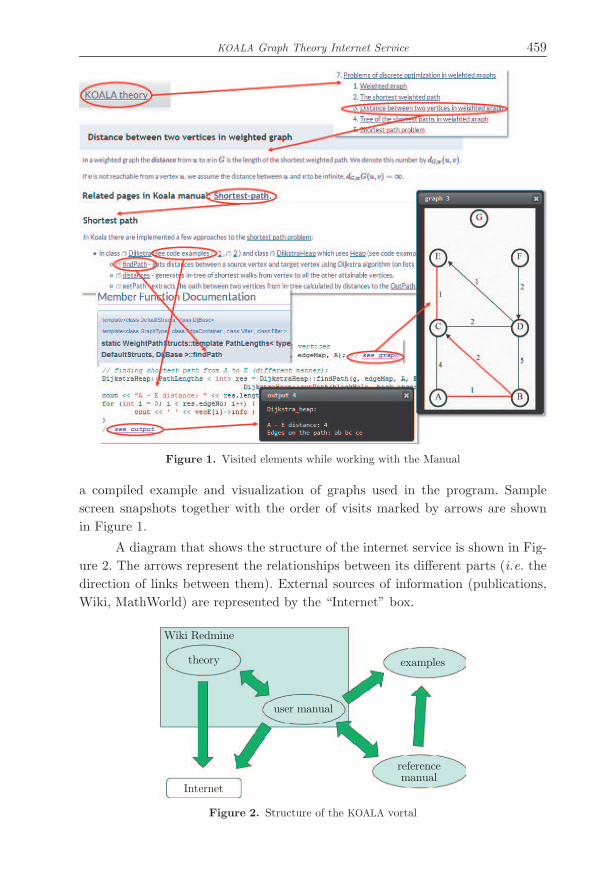
KOALA Graph Theory Internet Service 459
Figure 1. Visited elements while working with the Manual
a compiled example and visualization of graphs used in the program. Sample
screen snapshots together with the order of visits marked by arrows are shown
in Figure 1.
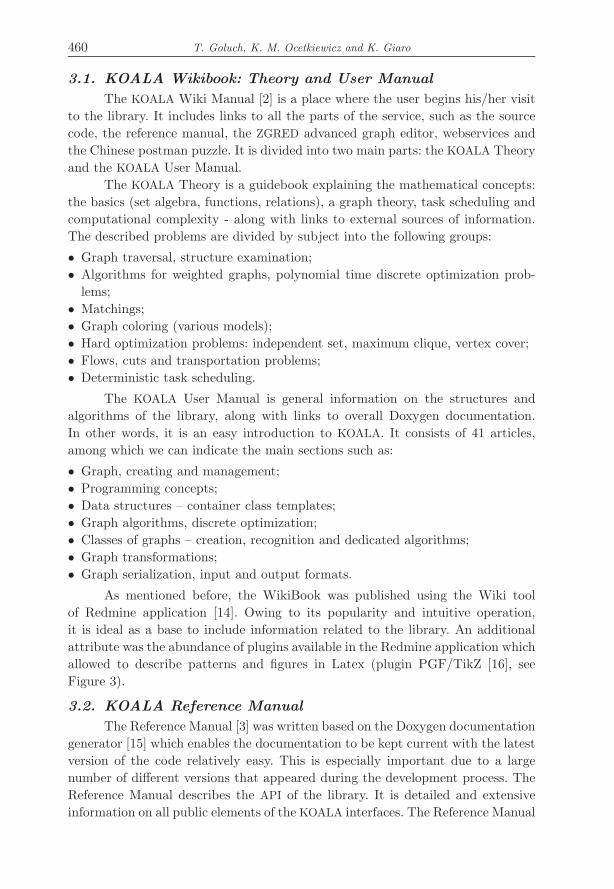
A diagram that shows the structure of the internet service is shown in Fig-
ure 2. The arrows represent the relationships between its different parts (i.e. the
direction of links between them). External sources of information (publications,
Wiki, MathWorld) are represented by the “Internet” box.
Figure 2. Structure of the KOALA vortal
460 T. Goluch, K. M. Ocetkiewicz and K. Giaro
3.1. KOALA Wikibook: Theory and User Manual
The KOALA Wiki Manual [2] is a place where the user begins his/her visit
to the library. It includes links to all the parts of the service, such as the source
code, the reference manual, the ZGRED advanced graph editor, webservices and
the Chinese postman puzzle. It is divided into two main parts: the KOALA Theory
and the KOALA User Manual.
The KOALA Theory is a guidebook explaining the mathematical concepts:
the basics (set algebra, functions, relations), a graph theory, task scheduling and
computational complexity - along with links to external sources of information.
The described problems are divided by subject into the following groups:
• Graph traversal, structure examination;
• Algorithms for weighted graphs, polynomial time discrete optimization prob-
lems;
• Matchings;
• Graph coloring (various models);
• Hard optimization problems: independent set, maximum clique, vertex cover;
• Flows, cuts and transportation problems;
• Deterministic task scheduling.
The KOALA User Manual is general information on the structures and
algorithms of the library, along with links to overall Doxygen documentation.
In other words, it is an easy introduction to KOALA. It consists of 41 articles,
among which we can indicate the main sections such as:
• Graph, creating and management;
• Programming concepts;
• Data structures – container class templates;
• Graph algorithms, discrete optimization;
• Classes of graphs – creation, recognition and dedicated algorithms;
• Graph transformations;
• Graph serialization, input and output formats.
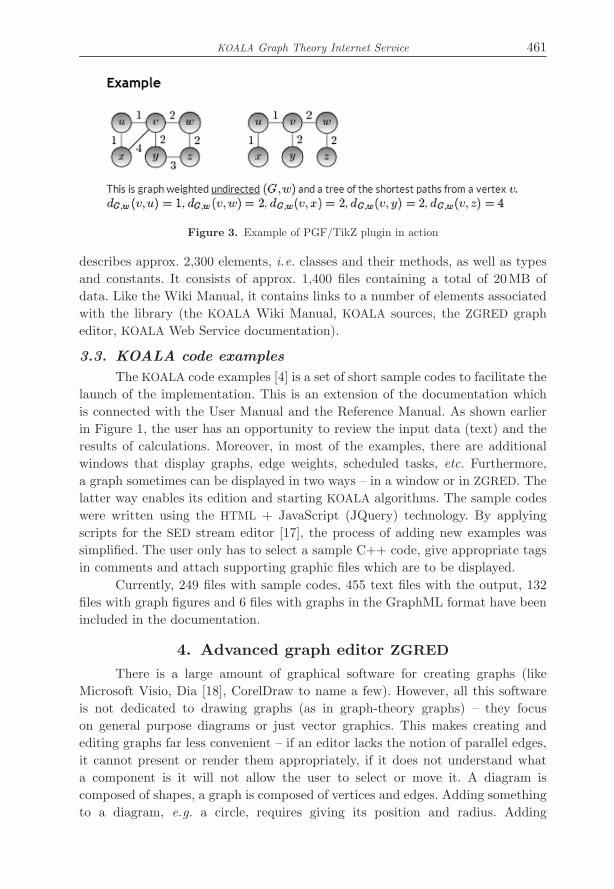
As mentioned before, the WikiBook was published using the Wiki tool
of Redmine application [14]. Owing to its popularity and intuitive operation,
it is ideal as a base to include information related to the library. An additional
attribute was the abundance of plugins available in the Redmine application which
allowed to describe patterns and figures in Latex (plugin PGF/TikZ [16], see
Figure 3).
3.2. KOALA Reference Manual
The Reference Manual [3] was written based on the Doxygen documentation
generator [15] which enables the documentation to be kept current with the latest
version of the code relatively easy. This is especially important due to a large
number of different versions that appeared during the development process. The
Reference Manual describes the API of the library. It is detailed and extensive
information on all public elements of the KOALA interfaces. The Reference Manual
KOALA Graph Theory Internet Service 461
Figure 3. Example of PGF/TikZ plugin in action
describes approx. 2,300 elements, i.e. classes and their methods, as well as types
and constants. It consists of approx. 1,400 files containing a total of 20MB of
data. Like the Wiki Manual, it contains links to a number of elements associated
with the library (the KOALA Wiki Manual, KOALA sources, the ZGRED graph
editor, KOALA Web Service documentation).
3.3. KOALA code examples
The KOALA code examples [4] is a set of short sample codes to facilitate the
launch of the implementation. This is an extension of the documentation which
is connected with the User Manual and the Reference Manual. As shown earlier
in Figure 1, the user has an opportunity to review the input data (text) and the
results of calculations. Moreover, in most of the examples, there are additional
windows that display graphs, edge weights, scheduled tasks, etc. Furthermore,
a graph sometimes can be displayed in two ways – in a window or in ZGRED. The
latter way enables its edition and starting KOALA algorithms. The sample codes
were written using the HTML + JavaScript (JQuery) technology. By applying
scripts for the SED stream editor [17], the process of adding new examples was
simplified. The user only has to select a sample C++ code, give appropriate tags
in comments and attach supporting graphic files which are to be displayed.
Currently, 249 files with sample codes, 455 text files with the output, 132
files with graph figures and 6 files with graphs in the GraphML format have been
included in the documentation.
4. Advanced graph editor ZGRED
There is a large amount of graphical software for creating graphs (like
Microsoft Visio, Dia [18], CorelDraw to name a few). However, all this software
is not dedicated to drawing graphs (as in graph-theory graphs) – they focus
on general purpose diagrams or just vector graphics. This makes creating and
editing graphs far less convenient – if an editor lacks the notion of parallel edges,
it cannot present or render them appropriately, if it does not understand what
a component is it will not allow the user to select or move it. A diagram is
composed of shapes, a graph is composed of vertices and edges. Adding something
to a diagram, e.g. a circle, requires giving its position and radius. Adding
462 T. Goluch, K. M. Ocetkiewicz and K. Giaro
something, e.g. a vertex to a graph requires just giving its position. A vertex is
represented by a circle, but by default all vertices have the same radius. Moreover,
changing the radius of a vertex is a very rare activity, hence, forcing the user to
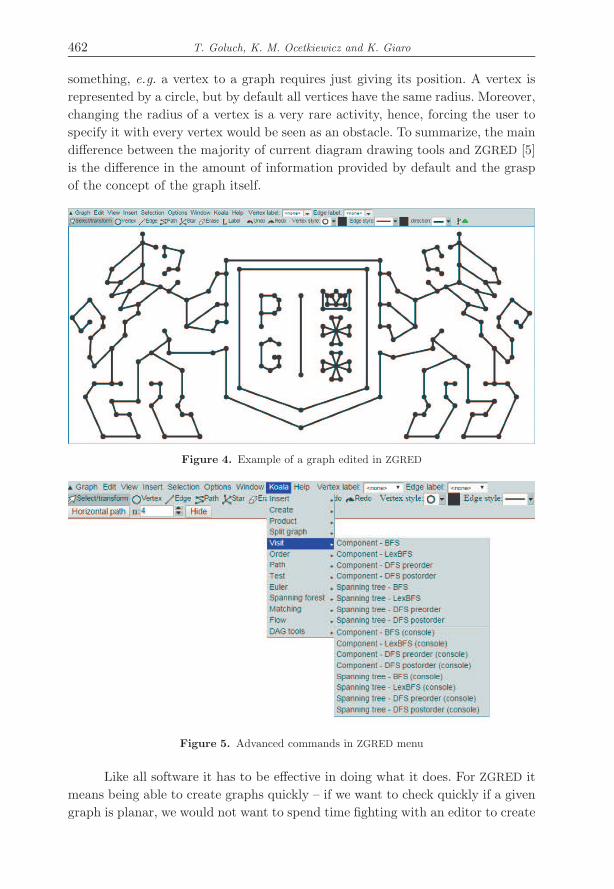
specify it with every vertex would be seen as an obstacle. To summarize, the main
difference between the majority of current diagram drawing tools and ZGRED [5]
is the difference in the amount of information provided by default and the grasp
of the concept of the graph itself.
Figure 4. Example of a graph edited in ZGRED
Figure 5. Advanced commands in ZGRED menu
Like all software it has to be effective in doing what it does. For ZGRED it
means being able to create graphs quickly – if we want to check quickly if a given
graph is planar, we would not want to spend time fighting with an editor to create
KOALA Graph Theory Internet Service 463
it. We want to click a few times, select an option and be done with it. On the
other hand, most graphs are drawn by scientists who often want to include them
in publications. Therefore, there has to be a way of customizing the appearance
of the drawing and including it in a publication should be as easy as possible.
Another design goal of ZGRED was that it should be possible to run it in
an offline mode, after saving the web page to a disk. Therefore, the online version
of ZGRED is composed of a single HTML page, a couple of CSS style sheets and
a JavaScript code of the application. All resources are embedded inside the source
code which not only makes them always immediately available (and does not
depend on the browser fetching and storing them in a cache) but also reduces the
page load time – all images are small, two or three color icons and inlining them
is more bandwidth-friendly than requiring a browser to fetch (or just ask about
their modification) about a hundred images.
ZGRED does not use any additional toolkits or libraries. This was an
intentional choice. Most of the ZGRED code base focuses on the program logic,
i.e. handling a graph. None of the available JavaScript toolkits provide such
functionality. On the other hand, the user interface part, where such toolkits could
prove useful, required a very specific functionality, like multicolumn property lists
which was too specific to be provided by a general-use toolkit. While this meant
more time spent on developing the user interface and providing a cross-browser
compatibility, the relative amount of this time was not significant as the user
interface code was only a small fraction of the total code size.
The main goal of ZGRED is to present and allow modification of graphs.
Therefore, graphs have to be drawn and graphs have to be interactive. There
are two major ways of creating two dimensional images inside web browsers:
a CANVAS tag and a SVG image. The CANVAS tag essentially provides a bitmap
with given dimensions and the API for drawing a bitmap into this. The provided
API consists of a set of functions that are typically available when dealing with
vector graphics: drawing simple shapes (lines, ellipses, polygons, Bezier curves),
line width and color, filling the color selection, viewing transformations (scale,
translate, rotate and general matrix transformation) and text rendering. It is
enough for ZGRED as vertices are drawn as circles, edges as straight lines or semi-
circles and loops are rendered as Bezier curves. The SVG technology provides
essentially the same rendering functionality but wraps it with a DOM tree and
allows to attaching event handlers to different objects. While event handling would
appear to be a desired property, proving useful during implementing the graph
interactivity, SVG events share one an undesirable feature with virtually all the
diagram drawing software – an object is hit only when it is pointed directly with
a mouse cursor. This, along with the usual lack of highlighting of a currently
pointed object often leads to frustration while the user is trying to hit a one-pixel
wide line.
For ZGRED we have decided that the currently pointed object will be
highlighted which gives the user a visual cue which object will be selected after
464 T. Goluch, K. M. Ocetkiewicz and K. Giaro
pressing the mouse button. Moreover, the object does not need to be hit precisely
– it is enough to click a point that is sufficiently close to it. If multiple objects
satisfy this condition, the one that is closest to the clicked point is selected. Such
a selection method, while being convenient for the user, is almost impossible to
be implemented by means of SVG events. While a hit-margin could be simulated
by covering objects with invisible and thicker “hit shapes”, the select-nearest rule
cannot be implemented as SVG resolves conflicts with the z-order (and there is
no notion of a closer–further relation as the object is either hit or not).
If SVG cannot help us with hit testing and the performance is not a dis-
tinctive feature (there is no essential difference in rendering the speed), the only
choice is between using the API drawing directly or via a DOM tree. Therefore,
we have chosen the CANVAS element.
The method of rendering a graph is rather sophisticated in order to achieve
the efficiency of operation. On the one hand, vertices and edges pointed by the
mouse cursor should be highlighted, which requires some drawing operations after
every mouse movement event from the browser, on the other hand, a full redraw
of the drawing area is extremely costly – a decent CPU and an up-to-date browser
are able to render only a few hundred styled curves in a reasonable time (about
100ms) and any text drawing (e.g. vertex or edge labels) makes it even more
costly.
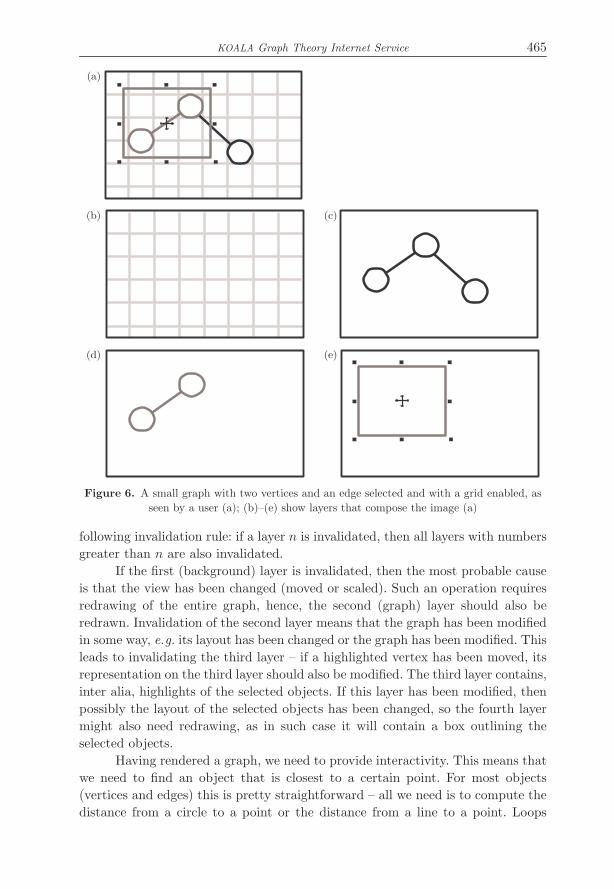
This problem was solved by dividing the drawing into four layers (see
Figure 6). The first layer handles the graph background – the grid, if shown; the
background image, if set, the bounding box and the background color. The second
layer represents the drawing of the graph without any highlighting – plain vertices
and edges and their labels. The third layer contains any highlighting applied to
the graph – selected edges or vertices and hit indicator (vertex or edge is hit if
it is pointed by the mouse cursor). Finally, the fourth layer contains additional
shapes not connected to the graph like the selection area or the resize/rotate box.
Every layer, except the first, has a transparent background and the final image is
obtained by drawing layers in the same place in their sequence order (actually this
is done automatically by the browser as every layer is represented by a CANVAS
tag, placed in the same area of the web page and properly ordered by their z-
order). If an object (vertex or edge) is highlighted, it is drawn twice – once on the
second layer in its default drawing style and second time on the third layer using
the “highlighted” style.
Such a scheme complicates the drawing operations, but the gain outweighs
this additional work by a large margin. Events like a mouse movement can be
handled by redrawing only the third and fourth layers, which usually contain
only a few objects to be drawn.
Moreover, multiple redraws are batched – if handling the user input requires
redrawing multiple elements, these redraws are not done immediately. Instead, the
affected layers are invalidated and only invalidated layers are redrawn in the next
redraw cycle. Since layers depend on those below them, we have implemented the
KOALA Graph Theory Internet Service 465
Figure 6. A small graph with two vertices and an edge selected and with a grid enabled, as
seen by a user (a); (b)–(e) show layers that compose the image (a)
following invalidation rule: if a layer n is invalidated, then all layers with numbers
greater than n are also invalidated.
If the first (background) layer is invalidated, then the most probable cause
is that the view has been changed (moved or scaled). Such an operation requires
redrawing of the entire graph, hence, the second (graph) layer should also be
redrawn. Invalidation of the second layer means that the graph has been modified
in some way, e.g. its layout has been changed or the graph has been modified. This
leads to invalidating the third layer – if a highlighted vertex has been moved, its
representation on the third layer should also be modified. The third layer contains,
inter alia, highlights of the selected objects. If this layer has been modified, then
possibly the layout of the selected objects has been changed, so the fourth layer
might also need redrawing, as in such case it will contain a box outlining the
selected objects.
Having rendered a graph, we need to provide interactivity. This means that
we need to find an object that is closest to a certain point. For most objects
(vertices and edges) this is pretty straightforward – all we need is to compute the
distance from a circle to a point or the distance from a line to a point. Loops
466 T. Goluch, K. M. Ocetkiewicz and K. Giaro
are more tricky. While it is possible to compute such a distance analytically, it
is neither easy nor fast to do so. Instead we have approximated the curve with
two straight lines and a semi-circle. The distance from the curve is computed
as a minimal distance to one of these three objects. While the computation is
not mathematically precise, the hit margin makes it hard to spot any noticeable
differences.
The size of the ZGRED source code is about 700KB and counts about 22,000
lines.
4.1. ZGRED as a desktop application
During the development of the web-based ZGRED another requirement
appeared. There was a need for an offline version of ZGRED. This need arose
from the limitations of a sandboxed environment inside a web browser. Firstly,
a web application has no access to the system clipboard (at the time when ZGRED
was being developed there was no universally supported Clipboard API). Secondly,
a web application is not effective enough to handle large graph databases (with the
graph count of the order of hundred thousands). Moreover, batch computations
on a large number of graphs are impossible with the KOALA Web Service due to
its low throughput. Thirdly, a web application cannot be easily used as a “graph
visualizer”, for example, for debugging purposes.
How to create a non-web application without rewriting the whole code base?
A simple wrapper for a browser control does not help here – a browser control
is still a browser and runs all JavaScript codes inside a sandbox, so we solved
nothing. We solved this problem as follows. The user interface and input/output
code (e.g. opening and saving files, calling webservices) was separated from the
program logic and provided in a form of a set of defined interfaces. The online
version of ZGRED became a platform independent program code and a browser
based implementation of required interfaces (using HTML, CSS and JavaScript).
Then, all that was needed to create an offline ZGRED was a JavaScript engine
and an offline application based implementation of the required interfaces.
The JavaScript engine of choice was Google’s V8 [19]. We tried Mozilla’s
SpiderMonkey [20] at first, but at the time of ZGRED development its documenta-
tion was very unreliable. Different versions of the engine required different usage
patterns and the API changed rapidly. Online documentation containing exam-
ples of a few old versions did not prove helpful. To be fair, the official online
documentation of V8 is extremely sparse [21–23] but the code base is partially
documented in the Doxygen format, so a semi-usable (as many functions are not
documented) reference can be generated.
To provide the portability of the user interface code the wxWidgets
toolkit [24] was chosen. The main arguments for this toolkit were: the project
maturity, good documentation [25], and earlier experience with it. The toolkit
provided not only portable user interface controls but also, inter alia, file system
access, which helped with the graph visualization mode and the threading model,
used while performing computations on a graph database.
KOALA Graph Theory Internet Service 467
The graph database handling was simplified by the existence of SQLite [26].
It is a mature, portable, in-process SQL database engine. A ZGRED graph
DataBase (ZDB file) is essentially a SQLite database.
Using ZGRED as a graph visualizer had to be as simple as possible. From
earlier discussions with the users who actually needed this feature the following
method of visualization was developed. Entering a “visualization mode” requires
providing a file name. Then, the program begins observing the file and rereads
it after every change. If, after a read, the file contains a valid graph in one of
the supported formats, then it is displayed and made available for editing. In the
visualization mode ZGRED keeps track of positions of all vertices that appeared
at some point of time. This makes it easier for the user to keep track of changes
in the visualized graph – if the first graph shown has 3 vertices and the user
arranged them in a readable way, then when the graph contains four vertices
after rereading, the layout of the first three vertices will be preserved.
5. KOALA WebServices
One of the goals of the KOALA project was to provide a widely available
webservice containing selected functions from the KOALA library [6]. The webser-
vice had to be run on NIWA [27] servers and essential computations needed to be
run via the BeesyCluster [28] service. This setup turned out a bit tricky to han-
dle. While BeesyCluster provides a webservice to access its resources, it requires
a user authentication and does not allow creating custom webservices. Therefore,
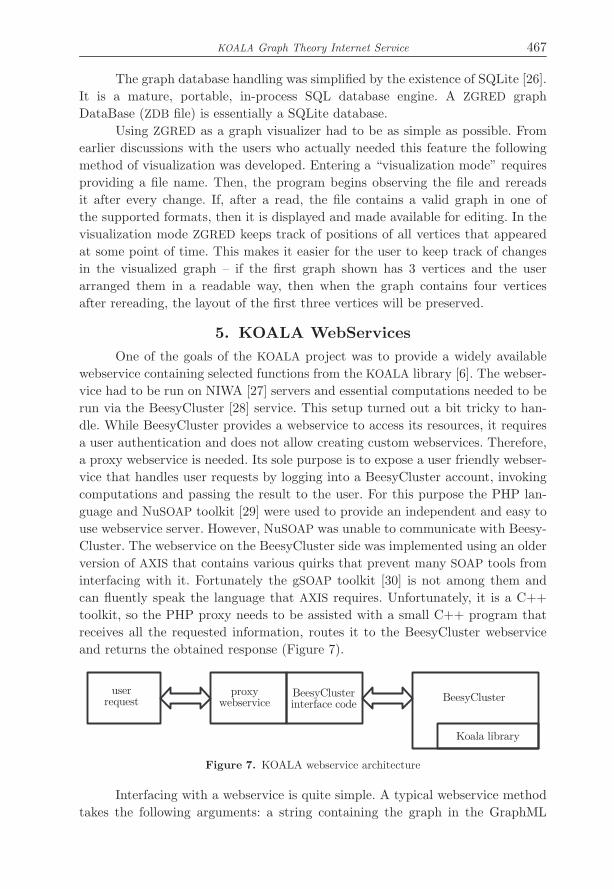
a proxy webservice is needed. Its sole purpose is to expose a user friendly webser-
vice that handles user requests by logging into a BeesyCluster account, invoking
computations and passing the result to the user. For this purpose the PHP lan-
guage and NuSOAP toolkit [29] were used to provide an independent and easy to
use webservice server. However, NuSOAP was unable to communicate with Beesy-
Cluster. The webservice on the BeesyCluster side was implemented using an older
version of AXIS that contains various quirks that prevent many SOAP tools from
interfacing with it. Fortunately the gSOAP toolkit [30] is not among them and
can fluently speak the language that AXIS requires. Unfortunately, it is a C++
toolkit, so the PHP proxy needs to be assisted with a small C++ program that
receives all the requested information, routes it to the BeesyCluster webservice
and returns the obtained response (Figure 7).
Figure 7. KOALA webservice architecture
Interfacing with a webservice is quite simple. A typical webservice method
takes the following arguments: a string containing the graph in the GraphML
468 T. Goluch, K. M. Ocetkiewicz and K. Giaro
format, a string naming the vertex and edge identifiers (only when necessary) and
additional arguments depending on the algorithm to be invoked. The identifiers
are used to identify objects. For example, if a user wants to find the shortest
path between two vertices, he/she must supply these vertices to the call. He/She
does that by supplying a property named e.g. “id” and setting the “id” property
of a starting vertex to “start” and target vertex to “target”. When invoking
a webservice method, he/she provides “id” as the identifier name, “start” as the
source vertex and “target” as the target vertex:
findPathBFS(‘‘graph in GraphML’’, ‘‘id’’, ‘‘’’, ‘‘start’’, ‘‘target’’).
Obviously, the GraphML identifiers of these objects can also be used:
findPathBFS(‘‘graph in GraphML’’, ‘‘’’, ‘‘’’, ‘‘v0’’, ‘‘v3’’) .
Needless to say, almost all methods available in the webservice can also be invoked
from ZGRED.
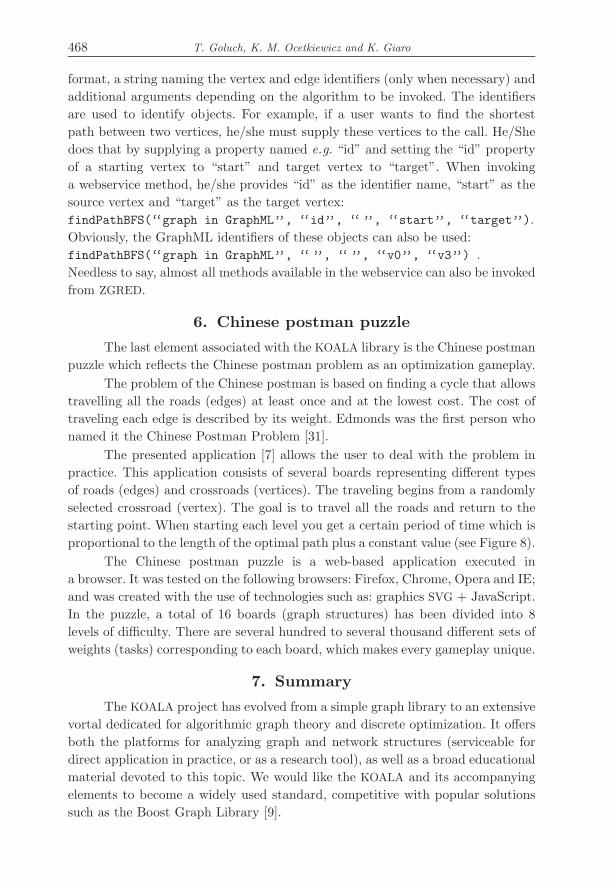
6. Chinese postman puzzle
The last element associated with the KOALA library is the Chinese postman
puzzle which reflects the Chinese postman problem as an optimization gameplay.
The problem of the Chinese postman is based on finding a cycle that allows
travelling all the roads (edges) at least once and at the lowest cost. The cost of
traveling each edge is described by its weight. Edmonds was the first person who
named it the Chinese Postman Problem [31].
The presented application [7] allows the user to deal with the problem in
practice. This application consists of several boards representing different types
of roads (edges) and crossroads (vertices). The traveling begins from a randomly
selected crossroad (vertex). The goal is to travel all the roads and return to the
starting point. When starting each level you get a certain period of time which is
proportional to the length of the optimal path plus a constant value (see Figure 8).
The Chinese postman puzzle is a web-based application executed in
a browser. It was tested on the following browsers: Firefox, Chrome, Opera and IE;
and was created with the use of technologies such as: graphics SVG + JavaScript.
In the puzzle, a total of 16 boards (graph structures) has been divided into 8
levels of difficulty. There are several hundred to several thousand different sets of
weights (tasks) corresponding to each board, which makes every gameplay unique.
7. Summary
The KOALA project has evolved from a simple graph library to an extensive
vortal dedicated for algorithmic graph theory and discrete optimization. It offers
both the platforms for analyzing graph and network structures (serviceable for
direct application in practice, or as a research tool), as well as a broad educational
material devoted to this topic. We would like the KOALA and its accompanying
elements to become a widely used standard, competitive with popular solutions
such as the Boost Graph Library [9].
KOALA Graph Theory Internet Service 469
Figure 8. The application: the Chinese postman puzzle
References
[1] KOALA library http://koala.os.niwa.gda.pl/koala.zip
[2] KOALA, the main page of the service http://koala.os.niwa.gda.pl
[3] KOALA, documentation of the library’s API http://koala.os.niwa.gda.pl/api/index.html
[4] KOALA code examples http://koala.os.niwa.gda.pl/api/examples.html
[5] KOALA – ZGRED graph editor http://koala.os.niwa.gda.pl/zgred/zgred.html
[6] KOALA webservices on the BeesyCluster http://koala.os.niwa.gda.pl/ws/ws.php
[7] KOALA Chinese postman puzzle http://koala.os.niwa.gda.pl/toy/index.html
[8] Mehlhorn K and Ngher S 1989 LEDA, a Library of Efficient Data Types and Algorithms,
MFCS 89, LNCS 379 88
[9] Siek J, Lee L-Q and Lumsdaine A 2002 The Boost Graph Library: User Guide and
Reference Manual, Addison-Wesley
[10] Sarang P 2006 Object-Oriented Programming with C++, PHI Learning
[11] Garcia R, Jarvi J, Lumsdaine A, Siek J and Willcock J 2007 An Extended Comparative
Study of Language Support for Generic Programming, Journal of Functional Program-
ming 17 (2) 145
[12] Alexandrescu A 2001 Modern C++ Design: Generic Programming and Design Patterns
Applied, Addison-Wesley
[13] Błażewicz J, Lenstra J and Rinnoy Kan A 1983 Scheduling subject to resource contrains:
classification and complexity, Disc. Appl. Math. 5 11
[14] Wiki of Redmine http://www.redmine.org/projects/redmine/wiki
[15] Doxygen main page http://www.stack.nl/˜dimitri/doxygen/
[16] Mertz A and Slough W 2007 Graphics with PGF and TikZ, Proceedings of the Practical
TEX 2006 Conference
470 T. Goluch, K. M. Ocetkiewicz and K. Giaro
[17] McIlroy M D 1987 A Research Unix reader: annotated excerpts from the Programmer’s
Manual, 1971-1986 (Technical report), CSTR. Bell Labs., 139
[18] Dia Diagram Editor http://dia-installer.de/
[19] Google’s V8 JavaScript engine https://developers.google.com/v8/
[20] Mozilla’s SpiderMonkey JavaScript engine
https://developer.mozilla.org/en-US/docs/Mozilla/Projects/SpiderMonkey
[21] Google’s V8 JavaScript engine, online documentation (1)
https://developers.google.com/v8/get started
[22] Google’s V8 JavaScript engine, online documentation (2)
https://developers.google.com/v8/embed
[23] Google’s V8 JavaScript engine, online documentation (3)
https://developers.google.com/v8/profiler example
[24] wxWidgets, cross-platform GUI library http://wxwidgets.org/
[25] wxWidgets documentation http://docs.wxwidgets.org/3.0/
[26] SQLite database engine http://www.sqlite.org/
[27] Centre of Competence for Novel Infrastructure of Workable Applications
http://www.niwa.gda.pl/
[28] BeesyCluster platform
https://projects.os.niwa.gda.pl/projects/cd-niwa/wiki/BeesyCluster
[29] NuSOAP – SOAP Toolkit for PHP http://sourceforge.net/projects/nusoap/
[30] gSOAP toolkit for SOAP and REST XML Web services
http://www.cs.fsu.edu/˜engelen/soap.html
[31] Edmonds J 1965 The Chinese postman problem, Operations Research, Suppl. 1 13 373


![[Fotografia]. Podstawowe pojęcia / Krzysztof Pacholak, Tomasz Kaczor](https://img.pdfslide.tips/doc/110x75/55d2f7fbbb61eb681b8b46cb/fotografia-podstawowe-pojecia-krzysztof-pacholak-tomasz-kaczor.jpg)