Embed Size (px)
Citation preview

Kobe University Repository : Thesis
学位論文題目Tit le
The IFRS Convergence Effects on Account ing Quality: PreliminaryEvidence from IFRS Convergence Process in Indonesia(IFRSへのコンバージェンスが会計情報の質に与える影響:インドネシアにおける予備的証拠)
氏名Author Tri Lestari
専攻分野Degree 博士(経営学)
学位授与の日付Date of Degree 2015-03-25
公開日Date of Publicat ion 2016-03-01
資源タイプResource Type Thesis or Dissertat ion / 学位論文
報告番号Report Number 甲第6292号
権利Rights
JaLCDOI
URL http://www.lib.kobe-u.ac.jp/handle_kernel/D1006292※当コンテンツは神戸大学の学術成果です。無断複製・不正使用等を禁じます。著作権法で認められている範囲内で、適切にご利用ください。
Create Date: 2018-06-24

博士論文
The IFRS Convergence Effects on Accounting Quality:
Preliminary Evidence from IFRS Convergence Process in
Indonesia
2015年 1 月 16日
神戸大学大学院経営学研究科
桜井久勝研究室
経営学専攻
学籍番号:101B412B
氏名:TRI LESTARI

ii
The IFRS Convergence Effects on Accounting Quality:
Preliminary Evidence from IFRS Convergence Process in
Indonesia
氏名 TRI LESTARI

iii
Dedicated to my beloved: Zaenal Mutaqin (husband), Kaevlin Fadla Taqia (son),
Kanza Haura Taqia (daughter), El-Musri Family, and Harto Mulyono Family.

iv
ACKNOWLEDGEMENTS
I would like to express my deepest gratitude to my supervisor and chair of my
doctoral committee, Professor Hisakatsu Sakurai, for his guidance, persistent
instruction, and useful suggestions on my thesis. It is my great opportunity to do my
thesis under his supervision. My heartfelt gratitude goes to my other committee
members Professor Kazuhisa Otogawa and Associate professor Tomomi Takada for
their constructive suggestions, help and support during my doctoral studies. Thanks
to Professor Masatoshi Goto as the committee member of my final examination.
I am very grateful to Professor Tadanori Yosano, Professor Hideo Kozumi and
Yoshinori Shimada who help me in my first coming to Kobe University. I would like
to thank to all Sakurai seminar members, especially to Toshio Moriwaki who assists
me related with Japanese document matters. My sincere thanks goes to all faculty
administrative staffs at the Graduate School of Business Administration, Kobe
University for all of their kindness help.
I would like to gratefully acknowledge the financial support from the
Directorate General of Higher Education of Ministry of Education of Indonesia.
Without their support, this journey would not have been possible.

v
ABSTRACT
The purpose of this study is to examine whether the accounting quality has
changed after the recent revisions of accounting standards during IFRS convergence
in Indonesia. Specifically, this study addresses research questions whether the
accounting information under the recent revisions of accounting standards has
changed in the indication of earnings management, accruals quality, timely loss
recognition, value relevance and comparability. I compare the accounting quality
between two periods of IFRS convergence process in Indonesia (2005-2008 and
2009-2012). On the exception of accounting comparability result, this study finds that
the accounting quality has changed after the recent revisions of accounting standards.
The findings on indication of earnings management, accruals quality, and value
relevance indicate that the firms in the period of 2009-2012 have better quality of
accounting information. However, the result on timely loss recognition shows a
negative nuance, that firms in the latter period recognize losses in less timely fashion.
These findings contribute to the ongoing debate of IFRS convergence effect on
accounting quality for emerging markets. In particular, this evidence could convince
the standards setter and financial reporting users that IFRS convergence gives their
expected benefits on accounting quality.
Keywords: IFRS convergence; earnings management; accruals quality; timely loss
recognition; value relevance; accounting comparability; Indonesia.

vi
TABLE OF CONTENTS
Abstract …………………………………………………………………………….. v
Table of Contents ………………………………………………………………...... vi
List of Tables………………………………………………………………………. ix
List of Abbreviations.……………………………………………………………… xi
Chapter I Introduction 1
1.1. Background………………………………………………………………… 1
1.2. Objectives and Research Questions……………………………………….. 4
1.3. Research Gap……………………………………………………………… 4
1.4. Contribution of the Study………………………………………………….. 5
1.5. Organization of the Study.………………………………………………… 6
Chapter II Literature Review and Hypotheses Development 7
2.1. Development of Capital Market and Financial Accounting Standards in
Indonesia………………………………………………………………… 7
2.1.1. Development of Indonesian Capital Market…………………………… 7
2.1.2. Development of Indonesian Financial Accounting Standards ………… 9
2.1.3. IFRS Convergence Process in Indonesia ……………………………… 12
2.1.3.1. Reasons for Convergence …………………………………………. 12
2.1.3.2. The Convergence Process …………………………………………. 18
2.2. Accounting Quality ………………………………………………………. 31
2.2.1. Definition of Accounting Quality …………………………………….. 31
2.2.2. IFRS and Accounting Quality ………………………………………… 34
2.3. Review of Prior Research ………………………………………………… 37
2.3.1. Related Research on the IFRS Convergence Effects on Accounting Quality
………………………………………………………………………… 37

vii
2.3.2. Related Research on Accounting Information Comparability ……….. 49
2.3.3. Related Research on IFRS and Accounting Quality in Indonesian Market
…………………………………………………………………………… 54
2.4. Hypotheses Development ………………………………………………….. 56
Chapter III Research Design 62
3.1. Overview …………………………………………………………………… 62
3.2. Accounting Quality Metrics ……………………………………………….. 63
3.2.1. Earnings Management …………………………………………………. 63
3.2.2. Accruals Quality ……………………………………………………….. 67
3.2.3. Timely Loss Recognition ………...……………………………………. 68
3.2.4. Value Relevance ……………….……………………………………… 70
3.2.5. Accounting Comparability ………..…………………………………… 72
3.2.5.1. Similarity of Accounting Functions …….………………………….. 72
3.2.5.2. Similarity of Earnings and Equity Book Value`s Information Content75
3.3. Data and Sample Selection ……………………………………………...…. 77
3.4. Descriptive Statistics ……………………………………………………….. 78
Chapter IV Results 82
4.1. Results on Accounting Quality Analysis…………………………………….82
4.1.1. Indication of Earnings Management …………………………………….82
4.1.2. Accruals Quality …………………...…………………………………… 83
4.1.3. Timely Loss Recognition ………………...…………………………….. 83
4.1.4. Value Relevance ……………………..………………………………… 84
4.1.4.1. Price Model Results ……………..…………………………………. 84
4.1.4.2. Return Model Results ……………………………………………….. 85
4.1.5. Accounting Comparability …………………...………………………… 87

viii
4.1.5.1. Similarity of Accounting Function ………………………………….. 87
4.1.5.2. Similarity of Earnings and Equity Book Value`s Information Content87
4.2. Summary of Empirical Results…………………………………………….. 89
4.3. Robustness Tests …………………………………………………………… 90
4.4. Additional Analysis …………………........................................................... 94
4.4.1. The Effect of Good Corporate Governance …………………………... 94
4.4.2. The Effect of Auditor Type ………………………………………….. 101
4.4.3. The Effect of Firm Size ……………………………………………… 103
4.4.4. The Effect of Negative Earnings in the Value Relevance Analysis …. 106
Chapter V Summary and Conclusions 109
References 111

ix
LIST OF TABLES
Table 2.1 Summaries of PSAK Revisions over Time…..………………………... 23
Table 2.2 Revisions Made on PSAK in Effect from 2009 to 2012 ………………. 25
Table 2.3 Major and Minor Differences between IFRS and PSAK..…………….. 27
Table 2.4 Related Studies on the Effects of IAS/IFRS on Accounting Quality.… 47
Table 2.5 Related Studies on IFRS and Accounting Comparability…….……….. 52
Table 2.6 Studies on IFRS Effect on Accounting Quality in Indonesian Market… 56
Table 3.1 Descriptive Statistics…………………………………………………… 79
Table 3.2 Descriptive Statistics of Variables in Accounting Comparability
Analysis……………………………………………………………….... 81
Table 4.1 Results Analysis for Earnings Management, Accruals Quality and Timely
Loss Recognition……………………………………………………….. 84
Table 4.2 Regression Results for Value Relevance Analysis……………………. 86
Table 4.3 Results of Accounting Comparability Before and After Accounting
Standards Change (Multivariate Analysis) …………………………….. 88
Table 4.4 Comparability Score for Earnings and Equity Book Value`s Information
Content ………………………………………………………………… 89
Table 4.5 Results Analysis for Earnings Management, Accruals Quality and Timely
Loss Recognition Use Matched Sample ………………………………. .92
Table 4.6 Results for Robustness Test for Value Relevance Analysis …………… 93
Table 4.7 Comparisons of Earnings Management, Accruals Quality and Timely Loss
Recognition between Period 2005-2008 and 2009-2012 for CGPI Firms
…………………………………………………………………………….97

x
Table 4.8 Comparisons of Earnings Management, Accruals Quality and Timely Loss
Recognition between Period 2005-2008 and 2009-2012 for Non-CGPI
Firms …………………………………………………………………..... 98
Table 4.9 Comparisons of Earnings Management, Accruals Quality and Timely Loss
Recognition between CGPI Firms and Non-CGPI Firms for Period of
2005-2008……………………………………………………………….. 99
Table 4.10 Comparisons of Earnings Management, Accruals Quality and Timely Loss
Recognition between CGPI Firms and Non-CGPI Firms for Period of
2009-2012 ………………………………………………………………100
Table 4.11 Regression Results of CGPI Vs. non-CGPI Firms for Value Relevance
Analysis …………………………………………………………………101
Table 4.12 Regression Results of Big 4 Vs. Non-Big 4 for Accruals Quality and
Timely Loss Recognition Analysis …………………………………… 102
Table 4.13 Regression Results of Big 4 Vs. Non-Big 4 for Value Relevance Analysis
…………………………………………………………………………. 103
Table 4.14 Regression Results of Large firms Vs. Small Firms for Accruals Quality
and Timely Loss Recognition Analysis ……………………………….. 105
Table 4.15 Regression Results of Small Firms Vs. Large Firms for Value Relevance
Analysis …………………………………………………………………105
Table 4.16 Regression Results of firms with Negative Vs. Positive Earnings for
Value relevance Analysis……………………………………………… 108

xi
LIST OF ABBREVIATIONS
Bapepam-LK Capital Market and Financial Institutions Supervisory Agency
CGPI Corporate Governance Perception Index
DSAK Dewan Standar Akuntansi Keuangan (Financial Accounting
Standards Board)
GAAP Generally Accepted Accounting Principles
IAI Ikatan Akuntan Indonesia (Indonesian Institute of Accountants)
IAS International Accounting Standards
IASB International Accounting Standards Board
IASC International Accounting Standards Committee
IDX Indonesian Stock Exchange
IFAC International Federation of Accountants
IFRS International Financial Reporting Standard
KPAI Komite Prinsip Akuntansi Indonesia (Indonesian Accounting
Principles Committee)
KSAK Komite Standar Akuntansi Keuangan (Financial Accounting
Standards Committee)
PAI Prinsip Akuntansi Indonesia (Indonesian Accounting Principles)
PSAK Pernyataan Standar Akuntansi Keuangan (Statement of Financial
Accounting Standard)
ROSC Report on the Observance of Standards and Codes
SAK Standar Akuntansi Keuangan (Financial Accounting Standards)

xii
SAK-ETAP Standar Akuntansi Keuangan-Entitas Tanpa Akuntanbilitas Publik
(Financial Accounting Standards for Non-publicly Accountable
Entities)
SEC Securities and Exchange Commission
SMEs Small and Medium-size Entities
SMO Statements of Membership Obligations

1
CHAPTER I
INTRODUCTION
1.1. Background
The International Financial Reporting Standards (IFRS) adoption process in
Indonesia makes a significant change and represents one of the most influential
accounting rules in the recent years. As the Indonesian accounting standards setter
has committed to harmonize the local standards to the international accounting
standards since 1994, the amendment of accounting standards during the adoption
process is expected to bring a better quality of accounting information to the users.
In accordance with the principal objectives of the IFRS Foundation to develop a
single set of high quality, understandable, enforceable and globally accepted
IFRSs through its standard-setting body, the International Accounting Standards
Board (IASB) (IFRS Foundation, 2013), the IFRS convergence process in
Indonesia is expected to improve the financial reporting quality. As Indonesia
moves toward further reforms in the last decade, stabilizing financial markets and
fostering an investment friendly environment become priorities. Hence, to increase
the number of foreign direct investment inflows, this country needs a higher
quality of financial information and an enhanced financial transparency and
consistency with international standards (ROSC Indonesia, 2010).
There are some expected benefits that motivate a country adopting IFRS.
Those are the elimination of barriers to international investing, higher quality of
accounting numbers, greater transparency and comparability of financial reports,
more efficient pricing in equity markets, more liquid equity markets and a lower
cost of capital (Brown, 2013). These benefits are in line with the goal of

2
establishing international accounting standards to develop an internationally
acceptable set of high financial reporting standards. However, there has been a
considerable debate among the research`s findings on the effect of IFRS adoption.
As some researchers doubt the relevance of IFRS to developing countries,
study on the relevance and the impact of IFRS to developing countries is still a
subject of interest to investigate. Major disadvantages for developing countries to
converge with IFRS such as information overloads (Choi and Mueller, 1998) and
additional cost of unnecessary complexity (Belkaoui, 2004) occur when IFRS is
irrelevant to national needs. If IFRS is not relevant, the adoption advantage such as
improved quality may not achieve. Barth et al. (2001) show that firms with high
quality accounting have a stronger association between stock prices and earnings
and book value because higher earnings quality better reflects a firm`s economic
condition. In addition, Barth et al. (2008) also find the accounting standards that
reduce earnings management behavior result in high value relevance accounting
earnings.
Studies on the relevance of IFRS adoption in emerging markets become
more popular in the recent years. Liu et al. (2011) argue that examining the value
relevance of accounting information under IFRS in an emerging market becomes
interesting because investors in emerging markets have very limited information
available. For Indonesian case, Widodo Lo (2012) investigates value relevance of
accounting information under IFRS transition in Indonesia from 1994 to 2009. He
finds that value relevance of earnings and equity book values is higher in the
period of significant adoption of IAS/IFRS than the period of little IAS/IFRS
adoption. Unfortunately, his study only focuses on value relevance analysis and
only uses a very limited sample. Since the IFRS convergence process in Indonesia

3
is still continuing and this continuing process has been made significant revisions
of the standards since 2009, the issue of IFRS adoption impact on accounting
quality is interesting to investigate.
Previous studies also investigate whether IFRS adoption affects accounting
information comparability. Some researches examine the direct effect of IFRS
adoption on financial reporting comparability, while others use accounting
comparability argument to justify the expected effects of mandatory IFRS
adoption and test the comparability effect indirectly (Wu and Zhang, 2010; Kim
and Li, 2010; Li, 2010; DeFond et al., 2011; Ozkan et al., 2012; Barth et al., 2012;
Yip and Young, 2012; Cascino and Gassen, 2013; Brochet et al., 2013). For their
analyses, these studies develop and use some different metrics to measure the level
of accounting comparability. Generally, they draw similar conclusions that
financial reporting comparability increases after IFRS adoption. Most of those
studies examine the IFRS adoption effect on cross-country accounting
comparability (around the world, European countries, U.S. and non-U.S.).
However, to date, only a few studies investigate accounting comparability on firm
level within a country, specifically in the case of IFRS adoption effect in emerging
markets.
One reason justifying the interest of analyzing IFRS convergence effect in
Indonesia pertains to the significant progress of IFRS convergence gradually
process in the recent decades that will get up to the stage of full adoption in the
near future. Different from its neighbors (for example Malaysia, Philippine, and
Singapore), who entirely adopt the IFRS at one time, Indonesia chooses a gradual
strategy to replace the local GAAP approaches with IFRS. This strategy is chosen
in order to avoid the psychological shock and to give more time for preparation,

4
then will reduce if any negative impact of the new standards. If the IFRS standards
are indeed good quality, the improvement of the accounting quality under the
recent revision of the standards will be observable. The other reason to analyze the
IFRS convergence process in Indonesia has to do with the importance of the
growing economic power in Indonesia. This country faces a bright economic
future for next 15 years because of its emerging economy and a population of 240
million with nearly 60% of the population of working age. Moreover, Indonesia`s
economy has been growing steadily at the rate of 6% per annum over the last five
years and its number of middle income earners is currently about 35 million
people (Sinaga and Wahyuni, 2014).
1.2. Objectives and Research Questions
The purpose of this study is to examine whether the accounting standards
change during IFRS convergence makes different level of accounting information
quality. Specifically, this study addresses research questions whether the recent
revisions of accounting standards affect the indication of earnings management,
accruals quality, timely loss recognition, value relevance and comparability of
accounting information. I analyze the financial statements of listed firms on
Indonesia Stock Exchange (IDX) from 2005 to 2012. To investigate the effect of
the accounting standards change, I compare the accounting quality of financial
reports in the period before and after accounting standards change, 2005-2008 and
2009-2012 respectively.
1.3. Research Gap
Even though the number of IFRS adoption effect on accounting quality
studies, both in developed markets or developing markets, increases recently, it is
still worth to investigate this issue as there is a considerable debate upon the mixed

5
findings. The plethora of accounting measurements used, the different economics
characteristics background, different period examined, and some other factors
impact the different results obtained. Without properly control for those issues,
studies using cross-country data are likely to result misleading conclusions.
Therefore, a single country studies are fundamental to further development of the
research on the economic consequences of IFRS adoption.
For Indonesian case, to my knowledge, there is lack of literature on the IFRS
convergence consequences, particularly from published papers. I only find two
recent published papers examine aforementioned issue, Widodo Lo (2012) and
Cahyonowati and Ratmono (2012). However, these papers only examine value
relevance of accounting information as the proxy of accounting quality.
1.4. Contribution of the Study
The main contribution of this study is that the effects of accounting
standards changes, in the process of IFRS convergence, on accounting quality are
investigated over time using some metrics of both attributes, accounting-based and
market-based. The other contribution is that this study includes more recent data
and exclusively examines the period of IFRS convergence since 2005 that consider
as significant adoption of international standards compared to the IAS adoption
period. This study also fills the gap in the existing literature by investigating the
effect of IFRS convergence on the accounting quality in emerging market, in
particular studies on Indonesian market. The findings of this study are expected
could convince the standards setter and accounting information users that IFRS
standards give the expected benefits on accounting quality.

6
1.5. Organization of the Study
This thesis consists of five chapters. After introduction, chapter 2 describes
the institutional background of IFRS convergence in Indonesia, reviews the related
literature, and develops the hypotheses. Chapter 3 discusses the valuation model,
sample selection procedures, and presents descriptive statistics. Chapter 4 presents
results analyses and discusses the empirical findings, and provides the robustness
tests and additional analyses. Chapter 5 provides the summary and conclusions of
the study.

7
CHAPTER II
LITERATURE REVIEW AND HYPOTHESES DEVELOPMENT
2. 1. Development of Capital Market and Financial Accounting Standards in
Indonesia
2.1.1. Development of Indonesian Capital Market
The development of accounting regulations for financial reporting
practices in a country is closely related with its development of the capital
market. For that reason, first I describe the development and the current
condition of Indonesian capital market before discussing the accounting
standards development.
The capital market in Indonesia has actually exists long before the
independence of Indonesia. The first stock exchange in Indonesia was
established on 1912 in Batavia during the Dutch colonial era. At that time, the
Exchange was established for the interest of the Dutch East Indies (VOC).
During those era, the capital market grew gradually, and even became inactive
for a period of time due to various conditions, such as the World War I and II,
power transition from the Dutch government to Indonesian government, etc.
(IDX, 2013).
Indonesian government reactivated its capital market in 1977, but from
the year until 1987 the activity of stock trading in Jakarta Stock Exchange
(JSX; the former name of Indonesia Stock Exchange) was dull. There were
only 24 listed companies, since most people preferred to invest their money in
banks rather than the capital market. Hereafter, Indonesian government issued

8
some support of incentives and regulations to encourage capital market
growth. PAKDES 87 (December Package 1987) and PAKDES 88 were issued
to give ways for companies to go public and foreign investors to invest their
money in Indonesia. In addition, deregulation package in banking and capital
market were made during the period of 1988-1990. Those regulations brought
positive impacts on the capital market growth; the JSX welcomed foreign
investors and the activities were improving. In order to foster the growth of
capital market, the second stock exchange, the Surabaya Stock Exchange, was
opened in 1989. These two markets, Jakarta Stock Exchange and Surabaya
Stock Exchange, merged into one market named as Indonesia Stock Exchange
(IDX) in 2007.
After escaped from the 1997`s economic crisis, Indonesian economy has
started to recover in 2007 (Hill and Shiraishi, 2007). As the economic growth,
the number of companies listed on the IDX has grown steadily. By the first
quarter of 2014 there are 494 companies listed in IDX, with the total market
capitalization of equities in the amount of Rp 4,717,502 billion. This amount
is a more than fourfold increasing in the last five years (Rp 1,076,491 billion
in 2008) (IDX Fact Book, 2014).
The increasing interest of foreign investors contributes to the growing
capital market in this country. To date, foreign investors hold some 64 percent
of the shares traded on the IDX floor (Tempo, 2014). It indicates that foreign
investors have a significant role in this market. The Indonesian capital market
regulations allow foreign investors to hold up to 100 percent of shares of firms
listed on IDX, with an exception only for ownership of commercial banks,
which is limited to 99 percent of total shares. To maintain the increasing

9
interest of foreign investors to Indonesian market and make further increasing
in foreign direct investment, this country needs a higher quality of financial
information and also an enhanced financial transparency and consistency with
international standards (ROSC Indonesia, 2010).
2.1.2. Development of Indonesian Financial Accounting Standards
Maradona and Chand (2014) divide the history of accounting standard
development in Indonesia, which has evolved over four decades, into three
periods.
1) The early stage of Indonesian accounting standards development (1973-
1990)
This early stage covers the early formulation of accounting standards that
has led to the publication of the first codified modern accounting
standards. This period began when the Indonesian stock exchange was
reactivated in 1973 from its hiatus. The formulation of accounting
standards was part of the government`s program to reactivate the capital
market. At that moment, the Indonesian Institute of Accountants (IAI)
made the codification of the accounting principles and standards for the
first time, named as “Prinsip Akuntansi Indonesia” (PAI/Indonesian
Accounting Principles). PAI was developed largely on the basis of U.S
GAAP (Kusuma, 2005). Following this publication, the IAI then
established a permanent standard setting body within the organization
structure called as the Indonesian Accounting Principles Committee
(KPAI) in 1974. This committee continued the work on formulating
Indonesian accounting standards by revising the newly issued PAI-1973.

10
In 1984, KPAI published the second edition of PAI after completing a
significant revision on PAI-1973 and codified it as PAI-1984.
The accounting standard formulation from the 1970s to the late 1980s
may be seen as the foundation stage in the Indonesian accounting
standard development, as the period saw a major shift in the accounting
standard model and the standard formulation mechanism (Maradona and
Chand, 2014). In this period, there is a drastically moved of accounting
standard orientation from the Dutch colonization system to the U.S.
accounting system. The goal to produce a set of accounting standards as
part of the capital revitalization program was the main generating power
for the progression of accounting standard setting.
2) The advancement of Indonesian accounting standards (1990-2007)
In this period, Indonesia strived to maintain the credibility and relevance
of its accounting standards by aligning with international practices while
at the same time taking into consideration the local needs. The accounting
standard setting process is strongly related with the development of stock
market. As the capital market growing, the IAI responded by making
major changes in accounting standard setting process. Firstly, the KPAI
was reorganized into the Indonesian Financial Accounting Standards
Committee (KSAK) in 1994. Secondly, in the same year the IAI also
transformed the basis of accounting standard setting from U.S. GAAP to
the International Accounting Standards (IAS) and made a formal decision
to support the harmonization program initiated by the International
Accounting Standards Committee (IASC). KSAK made a total revision of
11
PAI 1984, and codified it as Standar Akuntansi Indonesia (SAK). They
made twice revision of the SAK 1994, October 1, 1995 and June 1, 1996.
In the subsequent period, 1998, the KSAK was restructured into the
Indonesian Financial Accounting Standards Board (DSAK). This new
board has greater power than its predecessor as it has been granted the
authority to set and endorse the statement of financial accounting
standards and the interpretation of financial accounting standards. There
are two kinds of boards, DSAK, which is responsible for the SAK, and
DSAK Sharia, which is responsible for the SAK Sharia (accounting
standards dedicated to Islamic based institution such as Islamic
commercial banks). Both of the boards are under the IAI. The national
council of IAI designates the boards` members every four years. As the
board of trustees, the national council of IAI also designates the member
of the consultative board of SAK. This board is responsible for giving
suggestion and recommendation to the DSAK and the DSAK Sharia.
3) The convergence period (2007-present)
This period covers the transition period to IFRS, in which the DSAK has
embarked on a gradual IFRS convergence program over several phases.
An ultimate goal to achieve full convergence between Indonesian national
accounting standards and IFRS has directed the sequence of events in the
Indonesian accounting standards setting agenda. Accordingly, the
Indonesian accounting standards have moved significantly closer to IFRS
compared to previous period.
As mentioned above, DSAK has the authority to set accounting
standards in Indonesia. Members of DSAK come from various sectors

12
within the Indonesian accounting environment, including the public
accounting profession, the capital market authority, the central bank,
accounting academics, and industries. Although the IAI does not have a
legal status a standard-setting body, the regulatory framework in
Indonesia requires companies to prepare financial statements based on
accounting standards set by the accounting profession organization,
which is approved by the government (Kusuma, 2005).
Moreover, in this period, the development of accounting standards
for small and medium-size entities (SMEs) sector has been initiated.
Based on the data from the Ministry of SMEs and Cooperatives, more
than 90 percent companies in Indonesia are SMEs. DSAK initiates to
develop a separate set of accounting standards for small and medium-size
entities. The standards named as the Financial Accounting Standards for
Non-publicly Accountable Entities (SAK-ETAP), which published in
July 2009 and set to be effective as of 1 January 2011. These standards
are developed based on IFRS for SMEs, however, the DSAK made some
modifications to make SAK-ETAP applicable to the Indonesian context.
2.1.3. IFRS Convergence Process in Indonesia
2.1.3.1. Reasons for Convergence
As the International Federation of Accountants (IFAC) member,
Indonesia is required to demonstrate compliance with the statements of
membership obligations (SMOs). The mission of IFAC is to serve the
public interest, strengthen the accountancy profession worldwide and
contribute to the development of strong international economies by
establishing and promoting adherence to high-quality professional

13
standards, furthering the international convergence of such standards and
speaking out on public interest issues where the profession`s expertise is
most relevant. In line with the mission, IFAC board states seven SMOs.
The member obligations related with IFRS convergence is stated in SMO 7
as follows:
1) Member bodies of IFAC should support the work of the IASB by
notifying their members of every IFRS.
2) The IASB exposes proposed IFRS for public comment. Member bodies
are encouraged to notify their members of all exposure drafts issued by
the IASB and to encourage them to comment on behalf of those
members that have an interest in accounting standards.
3) Member bodies should use their best endeavors:
a. To incorporate the requirements of IFRS in their national
accounting requirements, or where the responsibility for the
development of national accounting standards lies with third
parties, to persuade those responsible for developing those
requirements that general purpose financial statements should
comply with IFRS, or with local accounting standards that are
converged with IFRS, and disclose the fact of such compliance; and
b. To assist with the implementation of IFRS, or national accounting
standards that incorporate IFRS.
Other reason that Indonesia has to converge to the IFRS is because
Indonesia is the member of the leaders of the group of twenty (G20) in
which IFRS convergence is one of the G20 agreements. At the November
2008 summit in Washington, the leaders agreed on a set of common

14
principles for market reforms, including the following principle for
strengthening transparency and accountability:
“We will strengthen financial market transparency, including by
enhancing required disclosure on complex financial products and ensuring
complete and accurate disclosure by firms of their financial conditions.
Incentives should be aligned to avoid excessive risk-taking.”
The G20`s regulatory reform action plan called for not only greater
regulatory coordination across national lines but also stated that “the key
global accounting standards bodies should work intensively toward the
objective of creating a single high-quality global standard” (Deloitte,
2009).
At the April 2009 summit in London, the G20 leaders issued a
communiqué setting out their plans for stimulating the recovery of the
global economy. The G20’s plans address a wide range of areas including
economic stimulus, enhanced regulation of systemically important entities,
and strengthened financial systems. The Leaders’ Communiqué was
supplemented by a Declaration on Strengthening the Financial System (the
Declaration), which elaborated on the Communiqué’s comments on the
financial system, and a number of reports from G20 working groups. The
declaration reiterated the G20`s principles of strengthening transparency
and accountability, enhancing sound regulation, promoting integrity in
financial markets and enforcing international cooperation (Deloitte, 2009).
Furthermore, there are some expected benefits that motivate a
country to adopt IFRS. Based on empirical evidence, Brown (2013)
discussed the benefits of countries that have adopted IFRS, as follows:
15
a. Elimination of barriers to international investing
The difference in accounting standards across country made it more
difficult for financial analysts to forecast a firm`s future earnings. It
has been reported that analysts` forecasts have been more accurate
since the companies, whose earnings were being forecasted, adopted
international accounting standards. Horton et al. (2013) investigate the
changes in the accuracy of analysts` earnings forecasts following IFRS
adoption by both voluntary and mandatory adopters. They report that
the largest improvement (decrease in forecast errors) was for
mandatory adopters and was related to the difference between the
firm`s adopters and was related to the firm`s earnings under domestic
GAAP and under IFRS. The improvement was reported due to both of
the greater comparability between firms as a result of adopting IFRS
and the higher quality of IFRS relative to the prior standards.
The removal of cross-border investment barriers by IFRS adoption can
be reflected in changes in the portfolio held by large international
investors. Florou and Pope (2012) find that financial institution such as
mutual fund and superannuation funds increased their shareholdings in
IFRS-adopters by 4% relative to non-adopters over two years
beginning with the adoption year. The effect was noticeably stronger
among investors more likely to benefit from higher quality reporting,
in countries with stronger enforcement, and where the switch to IFRS
had greatest effect.

16
b. Higher quality of accounting numbers
Many studies find that IFRS adoption brought benefits in the form of
higher quality of financial statements. A plethora of accounting quality
measures has been advanced to investigate the IFRS adoption effect on
accounting numbers. They include the extent to which firms are
believed to engage in income smoothing, or adjust their earnings so
that they beat some benchmark, or make large “discretionary” accruals
when calculating earnings, or use less conservative accounting
practices. Therefore, it is not surprising when the findings are mixed.
In addition to the different measures of accounting quality, some
factors may affect the different findings among studies. For example,
the different economies characteristics that differ that strength of IFRS
implementation enforcement, differ in the effectiveness of controls for
incentives associated with a firm`s use of particular set of accounting
standards and effects of the economic environment, different period
used, and different control variables used (Barth et al. 2008).
c. Greater transparency and comparability of financial reports
Brown (2013) argues that improved comparability of financial
statements is another potential benefit of adopting IFRS, but the extent
to which comparability is achieved is limited by inertia in firms’
accounting policies, how much latitude firms are allowed when
choosing their accounting policies under the “old” and “new”
standards, and the extent of compliance, itself partly a product of the
effectiveness of regulatory monitoring and enforcement in the
particular jurisdictions in which the firms operate. However, empirical

17
studies find a more optimistic overall picture of positive impact of
IFRS adoption on comparability financial report (Barth et al., 2012;
Yip and Young, 2012; Brochet et al., 2013; Cascino and Gassen, 2014)
d. More efficient pricing in equity markets
To investigate whether financial reporting under IFRS make a more
efficient pricing in equity markets, many studies compared the
apparent of usefulness or value relevance of domestic GAAP and IFRS
to investors. They usually compare some aspect of relationship
between historical returns from investing in the firm`s shares and its
reported earnings, or use Ohlson model that relates the firm`s stock
price to its equity book value per share and earnings per share.
Sometimes, they also relates the firm`s stock price to other information
not yet formally reflected in the accounts, but possibly disclosed in the
notes to the financial statements.
Another common approach also found in the empirical literature is by
decomposing accounting numbers into their components. For example,
when the information is publicly available, earnings under IFRS can be
decomposed into earnings under local GAAP and the individual items
which, when aggregated, constitute the difference between earnings
under local GAAP and IFRS.
e. More liquid equity markets
Brown (2013) discusses that IFRS adoption requires firms to commit
in using higher quality accounting standards, make greater disclosure,
and to more openness and transparency in its dealings with outside
investors. The commitment could make their stocks more actively

18
traded and priced more efficiently in stock markets. He interprets that
more stock market volatility would be driven by news about firms
itself, rather than by news about other firms or about the market as a
whole. Market providers like to operate more liquid markets for
obvious reason of self-interest, and IFRS have a potentially beneficial
role in fostering liquidity.
f. Lower cost of capital
Countries adopting IFRS have expected benefit to get lower cost of
capital, especially for corporate sectors. Applying IFRS would lower
the cost for processing financial information between countries, for
cross border investment. Brown (2013) contend, in the condition that
all else equal, stockholder, present and future, and other stakeholders
would benefit because the firm`s existing activities would become
more valuable, future growth opportunities would become more
worthwhile and some otherwise marginal projects would become
economically viable.
2.1.3.2. The Convergence Process
DSAK mentions five different types of country adopting IFRS:
1) Full adoption, when a country adopt all of IFRS and translate it word by
word.
2) Adapted, when a country adopt all of IFRS with some adjustment.
3) Piecemeal, when a country adopt some statements or certain paragraph of
IFRS.
4) Referenced, when a country use IFRS as a reference in the process of
standard setting.

19
5) Not adoption at all, when a country continue to use national accounting
standards.
For the adoption approach, Chand and Patel (2011) mention five
different convergence approaches that a country can implement in adopting
the IFRS, namely: 1) adopting of the IFRS entirely; 2) selective adoption of
the IFRS or adoption within time interval; 3) IFRS adoption with
modification to account for country-specific characteristics; 4) preserving
national accounting standards but in line with the IFRS; and 5) continuation
of national accounting standards.
Indonesia targeted to be a full IFRS adoption country for the reasons
discussed above. For the process to accomplish the full adoption, this
country follows both the second and third approaches, in which IFRS are
adopted gradually into local accounting standards and minor modifications
are made to align the standards with Indonesian regulations and business
environment (Maradona and Chand, 2014). They explain that the gradual
approach in IFRS convergence means that different newly adopted IFRS
standards have different effective dates of implementation.
To perform the gradual approach of IFRS convergence, in 2006,
DSAK-IAI made a road map of the phases to converge the IFRS into the
Indonesian accounting standards as follows:
a. Adoption phase 2007-2010
− Adopt IFRS per 1 January 2009 into PSAK
− Prepare all related infrastructures
− Evaluate the impact of IFRS adoption to current applied PSAK
20
b. Preparation 2011
− Finalization of infrastructures
− Implementation of new PSAK
c. Implementation 2012
− Implementation of new PSAK
− Evaluate the impact of new PSAK comprehensively
Based on the mandate that has been given by the IAI national Council,
the due process procedure for the DSAK-IAI in converging the SAK with
IFRS is as follows:
a. Identification of the SAK that is going to be converged with IFRS.
b. Research and analysis of the concepts and issues.
c. Limited consultations with relevant stakeholders, among others,
regulators, associations and entities.
d. Public consultation through the issuance of exposure draft and public
hearings.
e. Board deliberations on public comments.
f. Issuance of SAK.
As noted before, that since 1994, DSAK has committed to
harmonizing the Indonesian accounting standards with the International
Accounting Standards. Until 2004, there were 59 accounting standards and 7
interpretations prescribed by DSAK. However, there are several standards,
which are not IAS-based, such as accounting for sharia banking, accounting
for cooperatives, accounting for land, accounting for nonprofit
organizations, accounting for quasi-organizations, and accounting for joint

21
operations. Table 2.1, Panel A lists some revised PSAK and its effective date
during the period of 1994-2004.
In 2005, the Indonesian Financial Accounting Standards Board
intensifies its efforts to make PSAK consistent with IFRS by 2008, both in
substance and in format. As mentioned before, a gradual strategy was chosen
by DSAK-IAI as the convergence method to progressively replace the local
GAAP approaches with IFRS. The convergence process was done step by
step with transition period, in order to avoid the psychological shock and to
give more time for preparation. In addition, the strategy will reduce the
negative impact of the new PSAK, if any.
Accomplishing the full adoption of IFRS is not an easy process. Many
countries face similar challenges in the process of IFRS adoption. To adopt
the IFRS into the national standards, a country must translate the IFRS,
which is developed in English, into their national language. Some problem
might be faced in finding a proper term to develop the same meaning in
same context in the statement of the standards. Some argue that since the
IFRS is capital market oriented, it will be difficult for a country with
accounting standards tax-driven to adopt the IFRS. The standards
complexity of IFRS and also its frequent changes will complicate the IFRS
convergence process.
The report on the observance of standards and codes of Indonesia 2010
(ROSC Indonesia, 2010) explains that DSAK finds it difficult to catch up the
growing number of new and revised IFRS and interpretations issued by the
IASB. DSAK spends much time assessing the suitability of specific IFRS
requirements in the Indonesian environment. An assessment of each standard

22
is not an efficient process to follow in converging the Indonesian standards
with IFRS. Table 2.1, Panel B shows only a few numbers of PSAK revised
during 2005-2008.
Then, a serious effort was undertaken by DSAK to expedite the
convergence process in 2009. As the Indonesia commitment to the G20
forum and also the obligation as the IFAC member, IAI targeted to
accomplish the full adoption of the IFRSs in 2012. The target of IFRS
convergence in Indonesia is to revise current PSAK to comply materially
with IFRS as per January 1, 2009. DSAK decided to revoke 16 PSAK,
which resulted a decrease in the number of Indonesian standards that did not
have any IFRS counterparts. By March 31, 2010, the Board had significantly
reduced the gap between local standards (PSAK) and IFRS. Table 2.1, Panel
C lists the PSAKs materially comply with IFRS as per January 1, 2009 as of
December 20, 2011. In addition, Table 2.2 presents the summary of
revisions made on some PSAKs from 2009 until 2012 and the effective year
of the related revisions.
Despite a number of new revisions are made and some new standards
are issued during 2009 and 2010, the target to fully IFRS adoption in 2012
has not been achieved. Some major and minor differences between IFRS and
PSAK still exist. The standard gap with IFRS was as follows:
• 23 PSAK were fully comparable with IFRS;
• 5 PSAK were substantially comparable with IFRS;
• 8 PSAK were substantially non-comparable with IFRS;
• 2 IFRS had not yet been adopted (IFRS 1, IAS 41).
23
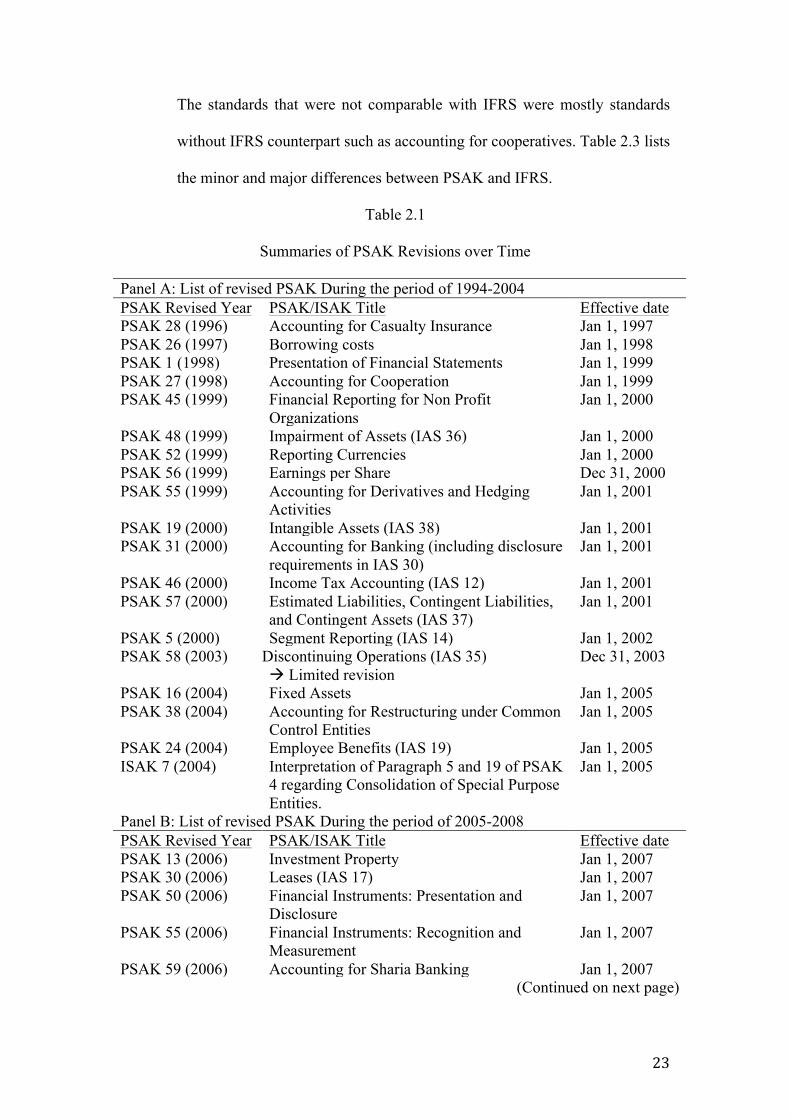
The standards that were not comparable with IFRS were mostly standards
without IFRS counterpart such as accounting for cooperatives. Table 2.3 lists
the minor and major differences between PSAK and IFRS.
Table 2.1
Summaries of PSAK Revisions over Time
Panel A: List of revised PSAK During the period of 1994-2004 PSAK Revised Year PSAK/ISAK Title Effective date PSAK 28 (1996) Accounting for Casualty Insurance Jan 1, 1997 PSAK 26 (1997) Borrowing costs Jan 1, 1998 PSAK 1 (1998) Presentation of Financial Statements Jan 1, 1999 PSAK 27 (1998) Accounting for Cooperation Jan 1, 1999 PSAK 45 (1999) Financial Reporting for Non Profit
Organizations Jan 1, 2000
PSAK 48 (1999) Impairment of Assets (IAS 36) Jan 1, 2000 PSAK 52 (1999) Reporting Currencies Jan 1, 2000 PSAK 56 (1999) Earnings per Share Dec 31, 2000 PSAK 55 (1999) Accounting for Derivatives and Hedging
Activities Jan 1, 2001
PSAK 19 (2000) Intangible Assets (IAS 38) Jan 1, 2001 PSAK 31 (2000) Accounting for Banking (including disclosure
requirements in IAS 30) Jan 1, 2001
PSAK 46 (2000) Income Tax Accounting (IAS 12) Jan 1, 2001 PSAK 57 (2000) Estimated Liabilities, Contingent Liabilities,
and Contingent Assets (IAS 37) Jan 1, 2001
PSAK 5 (2000) Segment Reporting (IAS 14) Jan 1, 2002 PSAK 58 (2003) Discontinuing Operations (IAS 35)
à Limited revision Dec 31, 2003
PSAK 16 (2004) Fixed Assets Jan 1, 2005 PSAK 38 (2004) Accounting for Restructuring under Common
Control Entities Jan 1, 2005
PSAK 24 (2004) Employee Benefits (IAS 19) Jan 1, 2005 ISAK 7 (2004) Interpretation of Paragraph 5 and 19 of PSAK
4 regarding Consolidation of Special Purpose Entities.
Jan 1, 2005
Panel B: List of revised PSAK During the period of 2005-2008 PSAK Revised Year PSAK/ISAK Title Effective date PSAK 13 (2006) Investment Property Jan 1, 2007 PSAK 30 (2006) Leases (IAS 17) Jan 1, 2007 PSAK 50 (2006) Financial Instruments: Presentation and
Disclosure Jan 1, 2007
PSAK 55 (2006) Financial Instruments: Recognition and Measurement
Jan 1, 2007
PSAK 59 (2006) Accounting for Sharia Banking Jan 1, 2007 (Continued on next page)

24
Table 2.1 (continued)
Panel C: List of PSAKs materially comply with IFRS as per January 1, 2009 as of December 20, 2011
PSAK Revised Year PSAK Effective date PSAK 1 (2009) Presentation of Financial Statements Jan 1, 2011 PSAK 2 (2009) Statement of Cash Flows Jan 1, 2011 PSAK 3 (2010) Interim Financial Reporting Jan 1, 2011 PSAK 4 (2009) Consolidated and Separate Financial
Statements Jan 1, 2011
PSAK 5 (2009) Segment Reporting Jan 1, 2011 PSAK 7 (2010) Related Party Disclosure Jan 1, 2011 PSAK 8 (2010) Events after the Reporting Period Jan 1, 2011 PSAK 10 (2009) The effects of Changes in Foreign Exchange
Rates. Jan 1, 2012
PSAK 12 (2009) Interests in Joint Venture Jan 1, 2011 PSAK 13 (2011) Investment Property Jan 1, 2012 PSAK 14 (2008) Inventories Jan 1, 2009 PSAK 15 (2009) Investments in Associates Jan 1, 2011 PSAK 16 (2011) Fixed Assets Jan 1, 2012 PSAK 18 (2010) Accounting and Reporting of Retirement
Benefits Plans Jan 1, 2012
PSAK 19 (2010) Intangible Assets Jan 1, 2011 PSAK 22 (2010) Business Combinations Jan 1, 2011 PSAK 23 (2010) Revenues Jan 1, 2011 PSAK 24 (2010) Employee Benefits Jan 1, 2012 PSAK 25 (2009) Accounting Policies, Changes in Accounting
Estimates and Errors. Jan 1, 2011
PSAK 26 (2011) Borrowing Costs Jan 1, 2011 PSAK 28 (2010) Accounting for Casualty Insurance
Contracts Jan 1, 2012
PSAK 30 (2011) Leases Jan 1, 2011 PSAK 33 (2010) Accounting for General Mining Jan 1, 2012 PSAK 34 (2010) Construction Contracts Jan 1, 2012 PSAK 36 (2010) Accounting for Life Insurance Contracts Jan 1, 2012 PSAK 45 (2010) Financial Reporting for Nonprofit
Organization Jan 1, 2012
PSAK 46 (2010) Income Taxes Jan 1, 2012 PSAK 48 (2009) Impairment of Assets Jan 1, 2011 PSAK 50 (2010) Financial Instruments: Presentation Jan 1, 2012 PSAK 53 (2010) Share-based Payment Jan 1, 2012 PSAK 55 (2011) Financial Instruments: Recognition and
Measurement Jan 1, 2012
PSAK 56 (2010) Earnings per Share Jan 1, 2012 PSAK 57 (2009) Provision, Contingent Liabilities and
Contingent Assets Jan 1, 2011
PSAK 58 (2009) Non-current Assets held for Sale and Discontinued Operations
Jan 1, 2011
(Continued on next page)

25
Table 2.1 (continued)
Panel C: List of PSAKs materially comply with IFRS as per January 1, 2009 as of December 20, 2011
PSAK Revised Year PSAK Effective date PSAK 60 Financial Instruments: Disclosure Jan 1, 2012 PSAK 61 Accounting for Governments Grants and
Disclosure of Governments Assistance Jan 1, 2012
PSAK 62 Insurance Contracts Jan 1, 2012 PSAK 63 Financial Reporting in Hyperinflationary
Economies Jan 1, 2012
PSAK 64 Exploration for and Evaluation of Mineral Assets
Jan 1, 2012
Source: DSAK
Table 2.2
Revisions Made on PSAK in Effect from 2009 to 2012
Standard (issued/revised year)
In effect
Focus Revision Made
PSAK 2 (2009) 2011 Statement of cash flow
Requires direct method for the presentation and omit cash flows from extraordinary items.
PSAK 10 (2010) 2012 The effects of changes foreign exchange rates
Places an emphasis on assessing functional currency based on primary indicators.
PSAK 13 (2011) 2012 Investment property
Introduces a new requirement to account for properties under construction or development as investment properties.
PSAK 14 (2008) 2009 Inventories Prohibition of LIFO as a cost formula. PSAK 15 (2009) 2011 Investments
in Associates Equity method should not apply for investments that classified as available for sale.
PSAK 16 (2011) 2012 Fixed Assets Reaffirms that land usually has an indefinite useful life and should not depreciated.
PSAK 18 (2010) 2012 Accounting and Reporting of Retirement Benefits Plans
The scope of this standard is for all retirement benefits plans.
PSAK 19 (2010) 2011 Intangible Assets
Intangible assets with infinite useful life should not be amortized.
(continued on next page)

26
Table 2.2 (continued)
Standard (issued/revised year)
In effect
Focus Revision Made
PSAK 24 (2010) 2012 Employee Benefits
The standard now scopes out all share-based awards granted to employees and introduces new guidance for defined benefit plans.
PSAK 25 (2009) 2011 Accounting Policies, Changes in Accounting Estimates and Errors.
Defining the material omission and misstatement.
PSAK 26 (2011) 2012 Borrowing costs Definition of borrowing costs has been amended.
PSAK 30 (2011) 2012 Lease When a lease includes both land and building; classification as finance or operating lease is performed separately on land and building in accordance with the general principles of PSAK 30.
PSAK 34 (2011) 2012 Construction Contracts
Borrowing costs should be included as part of total costs used in the percentage of completion method calculation.
PSAK 46 (2011) 2012 Income Taxes Some amendments made related with temporary difference.
PSAK 48 (2009) 2011 Impairment of Assets
Requires measurement of recoverable amount of intangible assets with an indefinite useful life on an annual basis.
PSAK 50 (2006) 2010 Financial Instruments: presentation
Some of the notable changes include the scope, definition, puttable instrument, right issue and disclosure.
PSAK 53 (2010) 2012 Share-based Payment
First time adoption of IFRS 2.
PSAK 55 (2006) 2010 Financial Instruments: Recognition and Measurement
Allows a non-derivative financial asset to be reclassified out of held-for-trading into another category in a certain circumstance.
PSAK 60 2012 Financial Instruments: Disclosures
First time adoption of IFRS 7.
Source: DSAK

27
Table 2.3
Major and Minor Differences between IFRS and PSAK
IFRS PSAK Differences IFRS 1 First-time
adoption of IFRS
No equivalent standard
IFRS 1 will not be adopted as it has been considered or included in the transitional provision in the individual standards or interpretations.
IFRS 3 Business combinations
Business combinations (PSAK 22)
Some minor amendments being made in the IFRS 3 which has not been absorbed by PSAK 22. There is a difference in measuring non-controlling interests where IFRS 3 provides clearer requirements (on present ownership interests and entitle their holders to a proportionate share of the entity`s net assets in the event of liquidation), which reduces diversity in the application. IFRS 3 also provides application guidance on all share-based payment transactions that are part of business combinations, including unreplaced and voluntarily replaced share-based payment awards.
IFRS 4 Insurance contracts
Insurance contracts (PSAK 62)
PSAK 62 is adopted from IFRS 4 except for the requirement in IFRS 4 to measure the insurance liabilities on an undiscounted basis because this contradicts PSAK 28 and PSAK 36.
Accounting for loss insurance (PSAK 28) Accounting for life insurance (PSAK 36)
The purpose of PSAK 28 and 36 is to complement the requirement in PSAK 62. There are no standards in IFRS/IAS, which are equivalent to PSAK 28 and 36.
IFRS 6 Exploration for and evaluation of mineral resources
Exploration and evaluation of mineral resources mining (PSAK 64)
PSAK 64 is consistent with IFRS 6 in all significant-respects.
(Continued on next page)

28
Table 2.3 (continued)
IFRS PSAK Differences Striping
activities and environmental management in general mining (PSAK 33)
PSAK 33 provides specific guidelines on the general mining in relation to striping and environmental management activities. There are no standards in IFRS/IAS, which are equivalent to PSAK 33 and thus this additional provision may lead to different accounting treatment.
IFRS 7 Financial instruments: disclosures
Financial instruments: disclosures (PSAK 60)
There are several amendments being made in the IFRS 7, which has not been absorbed by PSAK 60. The main differences are as follows: • PSAK 60, under the credit risk
disclosure requirements, still includes a provision to disclose the carrying amount of financial assets that would otherwise be past due or impaired whose terms have been renegotiated and a description of collateral held by the entity as security and other credit enhancements, where as IFRS 7 has deleted these points.
IFRS 7 requires greater disclosure of transferred financial assets in both categories of (a) transferred assets that are not derecognized in their entirety and (b) transferred assets that are derecognized in their entirety. The second category has more extensive disclosures requirements.
IAS 1 Presentation of financial statements
Presentation of financial statements (PSAK 1)
PSAK 1 is consistent with IAS 1 in all significant respects, except for the following: • PSAK 1 defines Indonesian financial
accounting standards as consisting of financial accounting standards, their interpretations, financial reporting rules issued by capital market authorities. IAS 1 does not include the latter.
• Unlike IAS 1, PSAK 1 disallows an entity to use titles for the financial statements other than those used in PSAK 1. PSAK 1 however allows the entity to use balance sheets instead of the statement of financial position.
(Continued on next page)

29
Table 2.3 (continued)
IFRS PSAK Differences • Under PSAK 1, where compliance with
the PSAK would be so misleading that it would conflict with the objectives of the financial statements, an entity is not allowed to depart from the relevant standards; however it may disclose the fact that: (a) the application of those standards would be misleading and (b) alternative reporting basis should be applied to achieve fair presentation of financial statements. IAS 1, under similar circumstances, allows for departure from the prevailing standards.
IAS 10 Events after reporting period
Events after reporting period (PSAK 8)
PSAK 8 is consistent with IAS 10 in all significant respects, except that IAS 10 requires disclosures in cases where owners or other parties have the power to amend financial statements after issue. PSAK does not require such disclosure.
IAS 12 Income taxes Income taxes (PSAK 46)
IAS 12 contains an exception to the measurement of deferred tax assets or liabilities arising on investment property measured at fair value, which assumed that an investment property is recovered entirely through sale. PSAK 46 regulates several items that are not covered by IAS 12, i.e (a) final income tax (no deferred tax applicable, recognition and presentation of the related final income tax expense and balance) and (b) specific rules with regard to tax assessment letters (mainly on the recognition of additional tax expenses/income arising from the tax examination letters).
IAS 27 Consolidated and separate financial statements
Consolidated and separate financial statements (PSAK 4)
PSAK 4 is consistent with IAS 27 in all significant respects, except that: 1. Unlike IAS 27, PSAK 4 does not allow a
parent entity to present its own separate financial statements as standalone general purposes financial statements. PSAK 4 stipulates that the separate financial statements have to be presented as supplementary information to the consolidated financial statements. (Continued to next page)

30
Table 2.3 (continued)
IFRS PSAK Differences 2. PSAK 4 does not provide an exemption
for the parent entity from consolidating the financial statements of its subsidiaries. All parent entities are required to present the consolidated financial statements. Under IAS 27, such an exemption exists provided certain criteria are met.
IAS 28 Investments in associates
Investments in associates (PSAK 15)
PSAK 15 is consistent with IAS 28 in all significant respects, except that under IAS 28, an entity or an investor is exempted from applying the equity method of accounting for its associates if they meet certain criteria. In this case, the investor prepare separate financial statements as their only financial statements and records investments in associates, either at cost or in accordance with IAS 39.
IAS 31 Interests in joint ventures
Interests in joint ventures (PSAK 12)
PSAK 12 is consistent with IAS 31 in all-significant respects. But while both PSAK 12 and IAS 31 allow either the equity method or the proportionate consolidation method, PSAK 12 puts more emphasis on the equity method, whereas IAS 31 recommends the proportionate consolidation method.
IAS 34 Interim financial reporting
Interim financial reporting (PSAK 3)
PSAK 3 is consistent with IAS 34 in all-significant respects. However, under the prevailing capital market regulations, listed companies are required only to report cumulative year-to-date information (and related comparatives) for the Statement of Comprehensive Income (“SoCI”) and are not required to present current interim period SoCI.
IAS 39 Financial instruments: recognition and measurement
Financial instruments: recognition and measurement (PSAK 55)
There are several amendments being made in the IAS 39, which has not been absorbed by PSAK 55. PSAK 55 is consistent with IAS 39 in all significant respects except for IAS 39 includes several amendments with regard to: • The prohibition of the reclassification of a
hybrid (combined) contract out of the fair value through profit or loss category when the entity is unable to separately measure an embedded derivative; (continued on next page)

31
Table 2.3 (continued)
IFRS PSAK Differences Further clarification on the scope exemption
to forward contract for business combination.
IAS 41 Agriculture No equivalent standard under PSAK
IAS 41 will be adopted after it is revised by the IASB. The IAS 41 model currently is not considered to be compatible with the agriculture environment in Indonesia. Unlike IAS 41 that requires the agriculture to be measured at fair value, the accounting for agriculture under PSAK is still based on historical costs.
Source: Pinnarwan et al. (2012) 2. 2. Accounting Quality
2.2.1. Definition of Accounting Quality
Many definitions of accounting quality exist in the literature. Levitt
(1998) mentions comparability and transparency as two main attributes of high
quality of financial reporting. It means that investors must be able to
meaningfully analyze performance across time periods and among companies.
Some other researchers, such as Bhattacharya et al. (2003), Ball et al. (2003), and
Barth and Schipper (2008) also propose transparency as a desired attribute of
high quality earnings.
While, Dechow and Schrand (2004) define earnings quality by focusing
on the analyst`s perspective. They define earnings to be of high quality when the
earnings number accurately annuitizes the intrinsic value of the firm. In another
of think, they also define a high quality of earnings when return on equity is a
good measure of the internal rate of return on the company`s current portfolio of
projects. Furthermore, they argue that persistence and predictability in earnings
alone is not sufficient to indicate a high quality of earnings. Greater earnings

32
persistence is meaningful only if earnings truly reflect performance during the
period and if current-period performance persists in future periods.
Francis et al. (2004) identity and classify seven attributes of earnings
quality into two categories: accounting-based (accruals quality, persistence,
predictability, and smoothness) and market based (value relevance, timeliness,
and conservatism). They explain that accounting-based attributes use accounting
information only, while market-based attributes depend on the relation between
market data and accounting data.
Barth et al. (2008) define high quality earnings as those that exhibit less
earnings management, implying that is not an innate characteristic, but rather the
absence of manipulation and bias. Their argument is because accounting quality
can be affected by opportunistic discretion exercised by managers and non-
opportunistic error in estimating accruals. This corresponds well to Guay et al.
(1996) argument that managerial opportunism reduces information precision and
accounting quality.
A widely used definition of accounting quality is derived from the
qualitative characteristics of useful financial information from IASB, FASB and
the convergence project between them. IASB in its conceptual framework for
financial reporting 2010 emphasizes the core aim of financial statements is the
decision usefulness. It states that if financial information is to be useful, it must
be relevant and faithfully represents what it purports to represent. Relevant
financial information, which has predictive value and confirmatory value, is
capable of making a difference in the decisions made by users (IASB, 2010,
QC6). To be useful, financial information must not only represent relevant
phenomena, but it must also faithfully represent the phenomena that it purports to
33
represent (IASB, 2010, QC12). Faithful representation means that the financial
information should complete, neutral and free from error.
In addition, the IASB conceptual framework mentions that usefulness of
financial information is enhanced if it is comparable, verifiable, timely and
understandable. Comparability enables users to identify and understand
similarities in, and differences among, items (IASB, 2010, QC21). Verifiability
helps assure users that information faithfully represents the economic phenomena
it purports to represents (IASB, 2010, QC26). Timeliness means having
information available to decision-makers in time to be capable of influencing
their decisions (IASB, 2010, QC29). Finally, classifying, characterizing and
presenting information clearly and concisely make it understandable (IASB,
2010, QC30).
To sum up, the definition of accounting quality is depend on which
perspective used. The construct of accounting quality is context specific,
different from situation to situation. The definition may focus on the decision
usefulness, valuation input, comparability, faithfully representation, prudence,
persistence, precision, relevance, transparency, and understandability. It depends
on to whom the definition is targeted (Dechow et al., 2009). In the same notion,
Schipper and Vincent (2003) argue that earnings quality differs according to the
users of financial statements; thus, standards setters and managers with
compensation contract tied to the earnings number may have different
perceptions of accounting quality.
In this study, I define the accounting quality from the investors`
perspective and in the context of how accounting standards affect the accounting
information. Therefore, I attempt to focus on the accounting quality constructs

34
such as decision usefulness, transparency, relevance, and comparability. In
particular, this study interprets high quality of accounting information as the one
that less managed earnings, higher accruals quality, more timely loss recognition,
more value relevant, and more comparable.
2.2.2. IFRS and Accounting Quality
The IFRS are issued by the IASB, which replaced the IASC in 2001. Since
2005, almost all publicly listed companies in Europe and many other countries
are required to prepare financial statements in accordance with IFRS (Barth et
al., 2008). In addition, Deloitte Touche Tohmatsu (2012) noted that as of June
2012, there are more than 120 countries that have adopted IFRS. The U.S.
Securities and Exchange Commission (SEC) also has permitted foreign
companies listed on the New York Stock Exchange to use IFRS in submitting
their financial statements without making reconciliations with U.S. GAAP.
A goal of the IASC and IASB is to develop an internationally acceptable
set of high quality financial reporting standards. To achieve this goal, they have
issued principles-based standards, and taken steps to remove allowable
accounting alternatives and to require accounting measurements that better
reflect a firm`s economic position and performance (IASC, 1989). However,
these principles-based standards have some advantages and disadvantages for
accounting quality. Barth et al. (2008) discuss the reasons why IFRS may
improve accounting quality. They contend that principles-based standards and
required accounting measurements that better reflect a firm`s underlying
economics will increase the accounting quality of the accounting amounts. By
doing so, the financial report provides investors with information to aid them in
making investment decisions. Using principles-based standards, IFRS eliminate

35
certain accounting alternatives thereby reducing managerial discretion. The use
of fair value accounting measurements may better reflect the underlying
economics than domestic standards. In addition they also argue that accounting
quality could also increase because of changes in the financial reporting system
contemporaneous with firms` adoption of IFRS, for example, more rigorous
enforcement.
For the disadvantages of principles-based standards, Barth et al. (2008)
provide two reasons that IFRS may reduce accounting quality. First, IFRS could
eliminate accounting alternatives that are most appropriate for communicating
the underlying economics of a business thus forcing managers of these firms to
use less appropriate alternatives, thus resulting in a reduction in accounting
quality. Second, the inherent flexibility in principles-based standards could
provide greater opportunity for firms to manage earnings, thereby decreasing
accounting quality.
In related vein, the IFRS standards have two-sided effect on some the
accounting quality attributes examined in this study. IFRS based-earnings is
expected to be less managed, because IFRS limit management`s discretion to
report earnings that are less reflective of firm`s economic performance. On the
other hand, the inherent flexibility in principles-based standards could provide
greater opportunity for firms to manage earnings.
Turning to accruals quality attribute, higher quality of earnings has better
accruals quality. Since, accounting quality not only affected by opportunistic
discretion exercised by managers, but also by non-opportunistic errors in
estimating accruals. Consequently, higher quality of accounting has less non-

36
opportunistic errors in estimating accruals. Thus, quality of accruals and earnings
increases when the magnitude of estimation errors decreases.
Recognition of losses is considered to be timely if they are included in the
financial statements as they occur instead of being spread over future periods.
For this attribute, I interpret that higher quality of accounting information have
more timely manner to recognize losses. Ball and Shivakumar (2005) discuss the
important of timeliness of economic loss incorporation as an important attribute
of earnings quality. In the context of corporate governance, they argue that
timely loss recognition affects governance because it makes managers less likely
to make investments they expect ex-ante to be negative-NPV, and less likely to
continue operating investments with ex-post negative cash flows. In addition,
they also discuss that timely loss recognition also affects debt by providing more
accurate ex-ante information for loan pricing and more quickly trigger debt
agreement rights from violating covenants based on ex-post accounting ratios.
Value relevance attribute interprets that higher accounting quality have
higher association between stock price and earnings and equity book value
because higher earnings quality better reflect a firm`s underlying economics.
Accounting standards that require recognition of amounts that are intended to
faithfully represent a firm`s underlying economics and less subject to
opportunistic managerial discretion produce higher accounting quality (Barth et
al, 2008). In addition, higher accounting quality is also resulting from less non-
opportunistic error in estimating accruals. However, there is a contradictory
implication of earnings smoothing as the indication of earnings management.
Earnings smoothing can increase the association between earnings and share
prices (Barth et al., 2008). For example, the presence of large assets impairments
37
is likely to be positively associated with frequency of large negative net income,
but could reduce the value relevance of accounting earnings because extreme
losses tend to have a low correlation with share prices and returns.
Comparability is the quality of information that enables users to identify
similarities and differences between two sets of economic phenomena (IASB,
2010). Intuitively IFRS adoption will improve the similarity facet of cross-
country accounting comparability, and it is also expected to improve the
similarity facet of cross-firms comparability. However, an overemphasis on
uniformity may reduce comparability by making unlike things look alike (IASB,
2010). In sum, firms adopting IFRS have higher accounting quality when they
have higher similarity facet of comparability and have lower or at least the same
level of difference facet of comparability.
2. 3. Review of Prior Research
There is a wealth of studies on IAS/IFRS adoption effect on accounting
quality using various metrics. In the first section, I review the prior studies which
focusing their analyses mainly on earnings management, accruals quality and value
relevance. Then, I review the related research on accounting comparability in a
separate section. Finally, I review the IFRS and accounting quality studies in the
Indonesian market.
2.3.1. Related Research on the IFRS Convergence Effects on Accounting
Quality
Many prior studies investigate the effect of IFRS adoption on accounting
quality. However the results of these studies are mixed. Although some studies
report positive impact, other studies find a detrimental or no effect of IFRS
adoption. These studies analyze the IFRS adoption effect in the context of one

38
specific country, both developed countries, such as Germany (Van Tendeloo and
Vanstraelen, 2005; Paananen and Lin, 2009), Sweden (Paananen, 2008), and UK
(Samasekera et al., 2012), and emerging countries, such as China (Zhou et al.,
2009; Liu et al., 2011; Wang and Chambell, 2012; Zhang et al., 2013), Brazil
(Vieira et al., 2011), India (Rudra and Bhattacharjee, 2012), and Malaysia (Ismail
et al., 2013), European Union countries (Chen et al., 2010; Aubert and
Grudnitski, 2011), and countries around the world (Barth et al., 2008; Houqe et
al., 2012; Ahmed et al., 2013).
Barth et al. (2008) examine 327 early adopter firms from 21 countries to
investigate whether early adoption of IAS/IFRS during 1994-2003 is associated
with higher accounting quality. They use earnings smoothing, managing towards
earnings targets, timely loss recognition, and value relevance to measure the
accounting quality. Comparing between treatment sample voluntarily adopted
IAS/IFRS and control sample consist of firms from same countries that elected to
continue using local domestic GAAP, they predict that firms adopting IAS/IFRS
will exhibit more volatile earnings (less smoothing) than firms applying domestic
standards. Their analyses find that firms in the treatment sample are less earnings
management, more timely loss recognition, and more value relevance of
accounting information than do matched control firms applying non-US domestic
standards. Based on these findings, Barth et al. (2008) conclude that IAS/IFRS
adoption deters opportunistic earnings management.
Paglietti (2009) investigates the impact of the IFRS mandatory adoption in
a typical code-law European country such as Italy. She analyzes how and
whether the accounting information quality changes following IFRS
implementation. However, her study is only focus on value relevance, which

39
considered as the basic attributes of accounting quality. The study is performed
on a sample of 960 firm-year observations concerning Italian listed companies
observed from 2002-2007. The findings confirm the expected overall increase in
the value relevance under IFRS. The study also documents that the recent growth
of the equity market in Italy, the ongoing company privatization process, the
decrease in ownership concentration as the divergence between accounting and
taxation are all factors that might have contributed to strengthen IFRS
implementation therefore positively influencing the accounting information
quality. As such, she suggests that accounting quality does not depend only on
the high quality of accounting standards, but it is also a function of the country`s
complex institutional setting.
Samasekera et al. (2012) investigate the impact of enforcement (greater
monitoring of auditors and more regulatory scrutiny of financial reporting) on
accounting quality under IFRS in the UK. They predict that after adoption of
IFRS cross listed firms will be under scrutiny because they fall under regulation
in more than one jurisdiction where enforcement activities increased in the post
2005 mandatory IFRS period. As predicted, they find accounting quality
measures improve for cross-listed UK firms after they adopt IFRS, while
corresponding improvement is not observed for non-cross listed firms.
Chua et al. (2012), using four years of IFRS adoption experience in
Australia for a wide range of accounting-based metrics and market-based
information, find that the mandatory IFRS adoption has resulted in better
accounting quality than previously under Australian GAAP. Specifically, they
find that the pervasiveness of earnings management by way of smoothing has
reduced, timeliness of loss recognition has improved in post adoption period.

40
However, the improvement of value relevance only found for non-financial
firms.
Dimitropoulos et al. (2013) investigate the impact of IFRS adoption on the
quality of accounting information within the Greek accounting setting. They find
evidence that the implementation of IFRS contributed to less earnings
management, more timely loss recognition, and greater value relevance of
accounting figures, compared to the local accounting standards. They also
document that audit quality further complements the beneficial impact of IFRS
since those companies that are audited by Big-5 audit firms exhibit higher levels
of accounting quality. They control for firm-specific effects like size, risk,
profitability and growth opportunities.
Some studies using a sample of firms in emerging countries also find the
positive impact of IFRS adoption. Chebaane and Othman (2014) examine the
value relevance of earnings and book value equity of firms in UAE, Bahrain,
Jordan, Kuwait, Qatar, Turkey and South Africa during and post IFRS adoption
periods. They find that value relevance of earnings and book value of equity is
positively associated with the mandatory IFRS adoption in emerging economies
of African and Asian regions. Their further analyses highlight the increase of the
value level is positively influenced by a common law legal system, a high level
of external economic openness, a strong investor protection, a full protection of
minority shareholders and by a sophisticated capital market.
Liu et al. (2011) examine whether international accounting standards
evidence acceptable benefits to regulated non-English-speaking markets. In
particular, they investigate whether improvements can be found in earnings
management and value relevance of accounting measures with standards change

41
in China. They find that, in general, accounting quality improved, evidenced by
decrease in earnings management and increase in value relevance of reported
earnings. Their finding corroborates the earlier study using Chinese firms by
Zhou (2009). In addition, Liu et al. (2011) find that the improvement in
accounting quality is significantly larger for firms that were not audited by Big
Four and expected to have less incentive for transparent reporting before the
standards change.
A study using firms listed on Abu Dhabi Stock Exchange also shows that
accounting information under IFRS is value relevant. Alali and Foote (2012)
examine the value relevance of accounting information under IFRS in Abu Dhabi
Stock Exchange. Using monthly market data from 2000 to 2006, their study
investigates the value relevance of accounting information based on both return-
earnings and price-earnings models. Their overall results show that the
accounting information under IFRS is value relevant. They show that as the
market developed, the value relevance of accounting information has improved,
but it may not be value relevant in the period of bearish trend. Their result
supports the initiative of compliance and enforcement of IFRS and the need to
implement transparent financial reporting and governance system. As additional
analysis, they show that firm size and auditor type affect the value relevance of
accounting information in Abu Dhabi market.
Ismail et al. (2013) investigate the change in earnings quality of Malaysian
companies after IFRS adoption. They examine a large sample of 4,010
observations over a three-year-period before and a three-year-period after the
adoption of the new set of accounting standards, and focus on two attributes of
higher quality earnings, lower level of earnings management practice and higher

42
value relevance of earnings. Their results show that the earnings reported during
the period after IFRS adoption is associated with lower earnings management
and higher value relevant. Using both price-earnings and return-earnings models,
they also find that earnings reported during the period after IFRS adoption is
more value relevant.
For the case in Indonesian market, Widodo Lo (2012) investigate the
influence of adopting IAS/IFRS on the value relevance of accounting
information from 1994 to 2009. The data is divided into period of little adoption
of IAS/IFRS (1994-2000) and the period of significant adoption of IAS/IFRS
(2001-2009). Based on price-earnings model, he analyzes a sample of 2,286 firm
year observations and finds that value relevance of earnings and equity book
values is higher in the period of significant adoption of IAS/IFRS than the period
of little IAS/ IFRS adoption. He also finds that equity book value and earnings
are value relevant when both equity book value and earnings are positive.
There are also some studies reporting no effect of IFRS adoption. Van
Tendeloo and Vanstraelen (2005) investigate the accounting quality of firms in
Germany, a code-law country with low investor protection rights. Their sample
consists of German listed companies, contains 636 firms-year observations
relating to the period 1999-2001. They find that IAS-adopters do not present
different earnings management behavior compared to companies reporting under
German GAAP. Their findings suggest that high quality standards are
insufficient and ineffective in countries with weak investor protection rights, as
their results indicate that voluntary adopters of IFRS in Germany cannot be
associated with lower earnings management.
Aubert and Grudnitski (2011) analyze the impact and importance of
43
mandatory IFRS adoption on EU firms from 13 countries. Their sample consists
of 3,530 observations. They report that accounting information produced under
IFRS was not more value relevant than that derived using local GAAP. A
positive differential impact between earnings constructed on the basis of IFRS
and local accounting standards was detected only for the all-countries-combined
sample. Meanwhile, the quality of discretionary accruals was shown to be
significantly higher under IFRS than local GAAP only for firms in Finland,
Greece and Sweden.
Houqe et al. (2012) also find that IFRS adoption per se does not lead to
increase earnings quality. They examine the effects of mandatory IFRS adoption
and investor protection on the quality of accounting earnings in forty-six
countries around the world. The earnings quality does increase with IFRS
adoption where a country has higher investor protection regime. Their results
highlight the importance of investor protection for financial reporting quality and
the need for regulators to design mechanisms that limit managers` earnings
management practices.
For the case in China, Wang and Campbell (2012) investigate how IFRS,
state ownership, and board of directors influence earnings management. They
find that IFRS adoption does not seem to deter earnings management. In the
current environment of China, state-ownership to an extent discourages earnings
management. Firm size and the increasing number of independent board of
directors are also deterring factors of earnings management. Meanwhile, Pelucio-
Grecco et al. (2014) find that IFRS convergence in Brazil had a restrictive effect
on earnings management. They find that regulatory environment is the most
effective restrictive factor to earnings management among the three factors they

44
studied (getting audited by the Big Four firms, corporate governance and
regulatory environment). Their finding suggests that, to constrain earnings
management in legislative law countries, it is necessary to have effective
enforcement.
The negative impact of IFRS adoption is also found by many studies.
Jeanjean and Stolowy (2008) analyze the effect of mandatory introduction of
IFRS on earnings management in Australia, France and the UK. They find that
the pervasiveness of earnings management did not decline after the introduction
of IFRS in the UK and Australia, even it has increased in France. Of these
findings, they argue that sharing rules is not a sufficient condition to create a
common business language, and that management incentives and national
institutional factors play an important role in framing financial reporting
characteristics. In addition, Chen et al. (2010) also suggest that listed EU firms in
15 countries have higher levels of income smoothing and less timely recognition
of losses. They only find a better accounting quality based on the discretionary
accruals measure.
Clarkson et al. (2011) compare the value relevance between common law
and code law countries using firms in EU countries and Australia. Their finding
indicates that, upon the switch to IFRS, there is a declining in value relevance of
book value per share and earnings per share for firms in common law countries.
On the contrary, there is an increasing in value relevance for firms in code law
countries.
Using a large sample from 20 countries, Ahmed et al. (2013) provide
preliminary evidence on the effects of mandatory IFRS adoption on accounting
quality. They compare the accounting quality of financial statements of a broad

45
set of firms from 20 countries that adopted IFRS in 2005 relative to a benchmark
group of firms from countries that did not adopt IFRS matched on the strength of
legal enforcement, industry, size, book-to-market, and accounting performance.
Their study reports an increase in income smoothing, aggressive accruals
recognition and a reduction in timeliness of loss recognition, compared to a
benchmark sample of countries that did not adopt IFRS.
For single country study, there are some studies that find the negative
impact of IFRS adoption. Paananen and Lin (2009) compare the characteristics
of accounting amounts using a sample of German companies reporting under
IAS during 2000-2002, and IFRS during 2003-2004 and 2005-2006. They find
that earnings and book value of equity are becoming less value relevant during
the IFRS mandatory period compared to both the IAS and the IFRS voluntary
periods. The findings on earnings smoothing and timely loss recognition largely
corroborate their findings on value relevance. Their results indicate that
accounting quality improved between the IAS era and the IFRS voluntary period
but worsened in the IFRS mandatory period.
Paananen (2008) finds that quality of financial reporting decrease after the
IFRS adoption in Sweden. Rudra and Battacharjee (2012) find that firms
adopting IFRS in India are more likely to smooth earnings compared to non-
adopting firms. Zhang et al. (2013) examine how accounting standards and
insider`s incentives affect earnings management in China, and find that the
mandatory implementation of IFRS-convergent accounting standards in 2007
significantly increase in earnings management.
Barth et al. (2008) contend for some reasons for the mixed findings of prior
literature of IFRS adoption effect on accounting quality, especially for single

46
country study. First, firms preparing to adopt IFRS are likely to make a gradually
transition, from local GAAP to be closer to those based on IFRS. Second, a
country with developing economies characteristics usually lack of the
infrastructure to enforce the IFRS implementation. Third, the studies differ in the
effectiveness of controls for incentives associated with a firm`s use of a
particular set of accounting standards and effects of the economic environment.
Fourth, the studies use different metrics, draw data from somewhat different
periods, and use different control variables. Therefore, it suggests to
conscientiously interpreting the findings on the economic consequence of IFRS
adoption. To generalize the results, we have to carefully concern on research
setting, the institutional background, the metrics used, control variables used, and
observation periods.
Even though there are some constraints in generalizing the single country
studies, these studies are fundamental to further develop the research on the
economic consequences of IFRS adoption. Given the limitation exists in cross-
country studies, particularly on different methods and process periods of IFRS
implementation chosen in different countries, research on single country will
give more relevant conclusion. Cross-country studies pooling firms` data from
countries that adopted different methods without properly controlling for this
issue are likely to results in misleading conclusions.
This study differs from prior single studies on IFRS adoption effect on
accounting quality in several respects. First, I examine the IFRS adoption in an
emerging market, which adopts a gradual strategy in converging the local GAAP
to IFRS. Second, I compare between little adoption period and significant
adoption period of IFRS convergence process, which has not reached the stage of
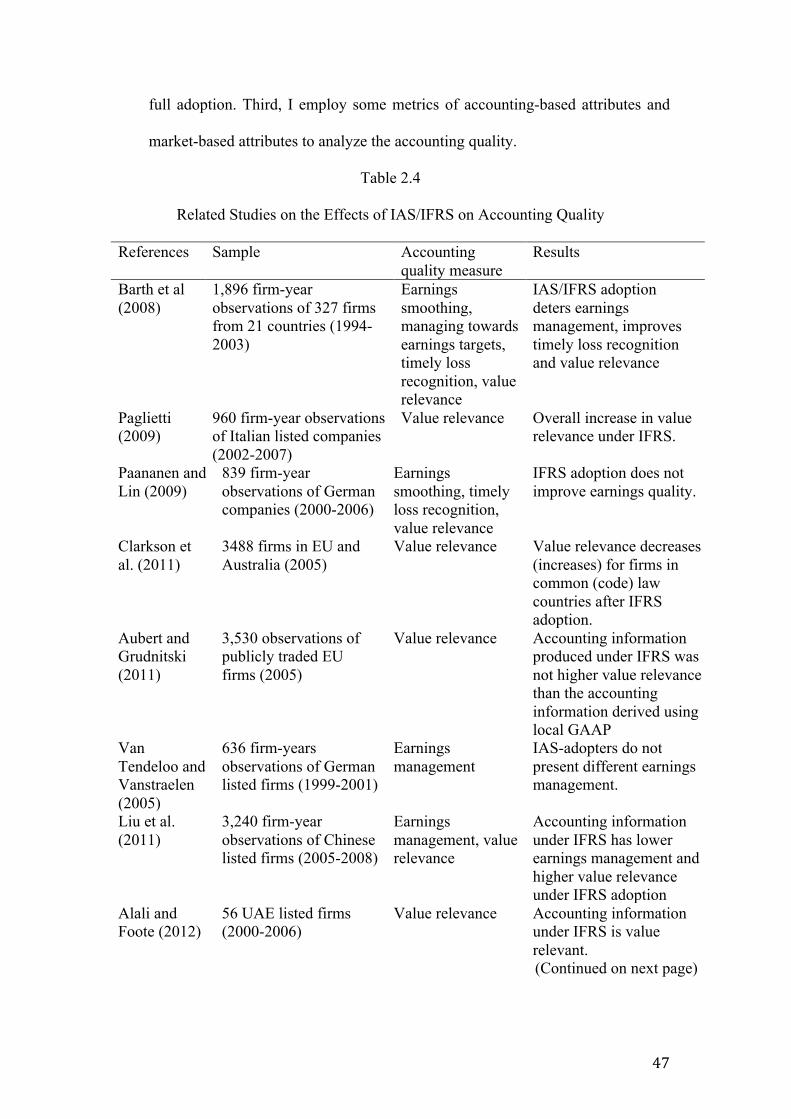
47
full adoption. Third, I employ some metrics of accounting-based attributes and
market-based attributes to analyze the accounting quality.
Table 2.4
Related Studies on the Effects of IAS/IFRS on Accounting Quality
References Sample Accounting quality measure
Results
Barth et al (2008)
1,896 firm-year observations of 327 firms from 21 countries (1994-2003)
Earnings smoothing, managing towards earnings targets, timely loss recognition, value relevance
IAS/IFRS adoption deters earnings management, improves timely loss recognition and value relevance
Paglietti (2009)
960 firm-year observations of Italian listed companies (2002-2007)
Value relevance Overall increase in value relevance under IFRS.
Paananen and Lin (2009)
839 firm-year observations of German companies (2000-2006)
Earnings smoothing, timely loss recognition, value relevance
IFRS adoption does not improve earnings quality.
Clarkson et al. (2011)
3488 firms in EU and Australia (2005)
Value relevance Value relevance decreases (increases) for firms in common (code) law countries after IFRS adoption.
Aubert and Grudnitski (2011)
3,530 observations of publicly traded EU firms (2005)
Value relevance Accounting information produced under IFRS was not higher value relevance than the accounting information derived using local GAAP
Van Tendeloo and Vanstraelen (2005)
636 firm-years observations of German listed firms (1999-2001)
Earnings management
IAS-adopters do not present different earnings management.
Liu et al. (2011)
3,240 firm-year observations of Chinese listed firms (2005-2008)
Earnings management, value relevance
Accounting information under IFRS has lower earnings management and higher value relevance under IFRS adoption
Alali and Foote (2012)
56 UAE listed firms (2000-2006)
Value relevance Accounting information under IFRS is value relevant. (Continued on next page)

48
Table 2.4 (continued)
References Sample Accounting quality measure
Results
Samarasekera et al. (2012)
495 UK listed firms (2000-2009)
Earnings smoothing, managing towards earnings targets, timely loss recognition, value relevance
Value relevance improves and less likely to manage towards earnings targets under IFRS for all firms. Earnings smoothing and timely loss recognition improve only for cross-listed firms.
Wang and Campbell (2012)
1,329 Chinese listed firms (1998-2009)
Earnings management
IFRS adoption does not seem to deter earnings management.
Houqe et al. (2012)
104,348 firm-year observations from 46 countries (2000-2007)
Discretionary accruals, accruals quality, earnings persistence.
Earnings quality increases after IFRS adoption only for a country with stronger investor protection.
Ismail et al. (2013)
4,010 firm-year observations of Malaysian companies (2002-2009)
Earnings management, value relevance
Earnings reported during the period after IFRS adoption is associated with lower earnings management and higher value relevant.
Ahmed et al. (2013)
3,236 firms from 20 countries (2002-2007)
Income smoothing, earnings benchmark, accruals aggressiveness, timely loss recognition.
Increase in income smoothing, more accruals aggressive and less timely loss recognition for firms adopting IFRS.
Dimitropoulos et al. (2013)
101 Greece listed firms (2001-2008)
Earnings management, timely loss recognition, value relevance
IFRS contributed to less earnings management, more timely loss recognition and greater value relevance.
Chebaane and Othman (2014)
10,838 firm-year observations of listed firms from African and Asian emerging countries (1998-2012)
Value relevance Value relevance of earnings is higher in the IFRS post adoption period.
Pelucio-Grecco et al. (2014)
317 Brazilian listed firms (2006-2011)
Earnings management
IFRS convergence in Brazil had a restrictive effect on earnings management.

49
2.3.2. Related Research on Accounting Information Comparability
Comparability of financial reporting is considered as an important
characteristic to enhance the usefulness of accounting information (IASB,
2010). Therefore, many studies are interested to examine some issues related to
accounting information comparability, such as some determinants that affect
the comparability level, the benefits of financial statement comparability, and
the role of comparability for the investors. Although comparability has proven
somewhat elusive and difficult to grasp empirically, recently, some empirical
studies have emerged in response to the development of new methodologies to
measure comparability.
One of the seminal works on the comparability measurement is the paper
of De Franco et al. (2011). They develop an output-based measure of
comparability based on the earnings and stock returns relation, capturing the
similarity with which the two firms translate a given firm’s economic shock.
They investigate the effect of accounting comparability on analyst coverage and
forecast properties. Using samples of U.S. firms grouped by industry, they
examine the benefits of comparability. They find that comparability is
positively associated with analyst following and forecast accuracy, and
negatively associated with forecast optimism and dispersion. Specifically, they
find when accounting comparability of firms is higher, analyst coverage
increases, forecast accuracy improves, and forecast dispersion diminishes. They
argue that, for a given firm, the availability of information about comparable
firms lowers the cost of acquiring information, and increases the overall
quantity and quality of information available about the firm. Furthermore,
comparability also allows analysts to better explain firms` historical

50
performance or to use information from comparable firms as additional inputs
in their analyses.
Some studies use the comparability argument to justify the expected
effects of mandatory IFRS adoption and test the comparability effect indirectly
(e.g., Wu and Zhang, 2010; Kim and Li, 2010; Li, 2010; DeFond et al., 2011;
Ozkan et al., 2012). While, some other studies examine the direct effect of
IFRS adoption on accounting comparability (e.g., Lang et al., 2010; Barth et al.,
2012; Yip and Young, 2012; Liao et al., 2012; Jayaraman and Verdi, 2013;
Brochet et al., 2013; Cascino and Gassen, 2014; Wang, 2014). In general, these
studies find that capital market gets the benefits when accounting information is
more comparable. Table 2.5 summarizes some related research on IFRS and
accounting comparability.
Lang et al. (2010) examine changes in cross-country financial statement
comparability around mandatory IFRS adoption and the effects of these
changes on firms’ information environments, as captured by analyst properties
and bid-ask spreads. They use De Franco et al. (2011) measure and examine
samples of 6,320 firms from 47 countries in the period of 1998-2008. They find
that accounting comparability does not increase for IFRS adopters relative to a
benchmark group of non-adopters. They also find negative effects on the firms`
information environments, which suggest that accounting standards
harmonization does not improve an analysts` ability to learn from inter-firm
comparisons. In addition, for two countries comparison, Liao et al. (2012)
investigate IFRS adoption effect on comparability for French and German
firms. Using earnings capitalization model and book value model, they find that
French and German IFRS earnings and book values are comparable only in the

51
year subsequent to IFRS adoption, but become less comparable in the years that
follow.
On the other hand, some studies find a positive effect of IFRS adoption
on the increasing of accounting comparability. Barth et al. (2012) examine
whether the application of IFRS by non-US firms results in accounting amounts
comparable to those resulting from application of US GAAP by US firms.
Their results indicate that IFRS firms have a greater accounting system and
value relevance comparability with US firms when IFRS firms apply IFRS than
when they applied domestic standards. Furthermore, they find that
comparability is greater for firms that adopt IFRS mandatorily, firms in
common law and high enforcement countries, and in more recent years. They
also find that earnings smoothing, accruals quality, and timeliness are potential
sources of greater comparability. Cascino and Gassen (2014), using De Franco
et al. (2011) model and the modified one, investigate the effects of mandatory
IFRS adoption on the comparability of financial accounting information of
9,848 firms from 29 countries for the period 2001-2008. They find that only
firms with high compliance incentives experience substantial increases in
comparability. Moreover, they document firms from countries with tighter
reporting enforcement experience larger IFRS comparability effects, and public
firms adopting IFRS become less comparable to local GAAP private firms from
the same country. Finally, Yip and Young (2012), using a sample of 17
European countries, also provide evidence of increased accounting
comparability following IFRS adoption. They use three proxies to measure
comparability, i.e. similarity of accounting functions, degree of information
transfer, and information content of earnings and book value.

52
For specific country study, Brochet et al. (2013) examine whether
mandatory adoption of IFRS leads to capital market benefits through enhanced
financial statement comparability. They investigate the insider purchases of
shares to directly examine a users` ability to exploit private information of 663
firms in UK from 2003 to 2006. Their findings indicate that mandatory IFRS
adoption improves comparability and thus leads to capital market benefits by
reducing insiders’ ability to exploit private information.
Table 2.5
Related Studies on IFRS and Accounting Comparability
References Sample Period Comparability measure
Results
Wu and Zhang (2010)
12,049 firm year observations from EU countries
1993-2008 The use of Relative Performance Evaluation
Post-adoption has greater financial reporting comparability associated with mandatory IFRS adoption.
Lang et al. (2010)
6,320 firms from 47 countries
1998-2008 De Franco et al.
IFRS adoption did not increase accounting comparability.
DeFond et al. (2011)
5,460 firm-year observations from 14 EU countries
2003-2004 and 2006-2007
The number of industry peers using uniform accounting standards.
Subsequent to mandatory IFRS adoption, the increase in foreign mutual fund investment is greater among the firms that experience relatively large increases in uniformity and are in countries with strong implementation credibility.
Kim and Li (2010)
31,785 firm-year observations from 50 countries
1999-2007 Non-announcing firms’ abnormal stock return variance
After switching to IFRS, investors are more likely to use earnings information of industry peers for share valuation, and that both improved reporting quality and information comparability.
(Continued on next page)

53
Table 2.5 (continued)
References Sample Period Comparability measure
Results
Ozkan et al. (2012)
892 firms from 15 EU countries
2002-2008 Contractual usefulness of accounting information in executive compensation
The higher earnings quality and comparability after IFRS adoption facilitate executive compensation contracting.
Barth et al. (2012)
3,400 firms from 27 countries
1995-2006 De Franco et al. and model of value relevance comparability
IFRS firms have greater accounting system and value relevance comparability with US firms when IFRS firms apply IFRS than when they applied domestic standards.
Yip and Young (2012)
2,562 firms from 17 countries
2002-2004 − Similarity of accounting functions − Degree of
information transfer − Similarity of
earnings information content
− Mandatory IFRS adoption improves cross-country information comparability by making similar things look more alike without making different things look less different.
− Both accounting convergence and higher quality information under IFRS are the likely drivers of the comparability improvement.
− Cross-country comparability improvement is affected by firms’ institutional environment.
Liao et al. (2012)
1,674 (2,035) French (German) firm year observations
2006-2008 Earnings capitalization model and book value model
French and German IFRS earnings and book values are comparable in the year subsequent to IFRS adoption, but become less comparable in the years that follow.
(Continued on next page)

54
Table 2.5 (continued)
References Sample Period Comparability measure
Results
Jayaraman and Verdi (2013)
28,037 firm year observations from 14 countries
1994-2004 De Franco et al.
The effect of IFRS adoption on accounting comparability is two times larger for Euro members compared to non-Euro members.
Brochet et al. (2013)
663 firms in UK
2003-2006 a users’ ability to exploit private information
Mandatory IFRS adoption improving comparability and thus leading to capital market benefits by reducing insiders’ ability to exploit private information.
Cascino and Gassen (2014)
9,848 firms from 29 countries.
2001-2008 De Franco et al. and degree of information transfer
Only firms with high compliance incentives experience substantial increases in comparability.
Wang (2014)
26,349 firm year observations of all non-US firms
2001-2008 Correlation across accounting standards measurement processes
Accounting standards harmonization facilitates transnational information transfer and suggests financial statement comparability as a direct mechanism.
2.3.3. Related Research on IFRS and Accounting Quality in The Indonesian
Market
I find at least five studies investigate the effect of IFRS convergence
process on accounting quality in the Indonesian market. However, three of them
are not a published paper and only observe the impact on manufacturing firms.
These studies vary in accounting quality metrics used and observation periods.
Then, it is not surprisingly when the results are mixed. For example, Widodo
Lo (2012), Cahyonowati and Ratmono (2012), and Wulandari (2014) examine
the value relevance change during the IFRS convergence process. Widodo Lo
(2012) observes the period from 1994 to 2009, and divides as period of little
adoption (1994-2000) and period of significant adoption of IFRS (2001-2009).

55
He finds that the period of significant IFRS adoption is more value relevant.
The two latter studies observe more recent data. Cahyonowati and Ratmono
(2012) compare the period from 2008 to 2011, and Wulandari (2014) compares
the data of 2007 and 2012. Cahyonowati and Ratmono (2012) do not find a
significant different of value relevance between period of 2008-2009 and 2010-
2011. On the contrary, Wulandari (2014) finds that value relevance of financial
report for firms in 2012 significantly increases relatively compared to firms in
2007. These different results may be caused by the different observation
periods, as a number of newly revised accounting standards are issued and
effect in 2009-2012. So, comparing the period before 2009 and after 2009 until
2012 may get more observable changes.
There are two other studies that find insignificant difference of
accounting quality during the IFRS convergence process in the Indonesian
market, which use accounting quality metrics other than value relevance.
Famila (2012) examines the persistence, predictability, value relevance and
timeliness of manufacturing firms` financial report from 2008 to 2011.
Handayani (2014) compares the indication of accruals and real earnings
management of manufacturing firms` financial report from 2009 to 2012.
My study differs from these studies in several aspects. First, I analyze
accounting comparability attribute that has not been examined by prior studies.
Second, the sample firms of this study consist of listed firms from all industries
except for certain analyzes, whereas some prior studies only focus on one
industry such as manufacturing firms. So that, this study examines larger
number of sample firms. Third, the observation periods of this study capture the

56
period of little adoption (2005-2008) and the period of significant adoption
(2009-2012).
Table 2.6
Studies on IFRS Effect on Accounting Quality in Indonesian Market
References Sample Accounting quality measure
Results
Widodo Lo (2012)
2,286 firm-year observations (1994-2009)
Value relevance Value relevance is higher in the period of IFRS based-standards.
Cahyonowati and Ratmono (2012)
1,512 firm-year observations (2008-2011)
Value relevance Value relevance does not increase significantly in the period of IFRS-based standards.
Famila (2012)
320 firm-year observations of manufacture firms (2008-2011)
Persistence, predictability, relevance, and timeliness
There is no significant difference of persistence, predictability, value relevance and timeliness before and after period of IFRS-based standards.
Handayani (2014)
324 firm-year observations of manufacture firms (2009-2012)
Accruals and real earnings management
There is no significant difference of accruals and real earnings management before and after period of IFRS-based standards.
Wulandari (2014)
177 firm-year observations of manufacture firms (2007 and 2012)
Value relevance Value relevance increases in the period of IFRS-based standards.
2.4. Hypotheses Development
IFRS adoption has a potential effect on earnings quality. Barth et al. (2008)
suggest that IFRS adoption could lead to improvements in accounting quality
because IFRS eliminates certain accounting alternatives thereby reducing
managerial discretion. However, they also argue that IFRS is viewed as principles-
based standards and thus is potentially more difficult to circumvent. In addition,
they provide two reasons that may not increase the accounting quality. First,
limiting managerial discretion relating to accounting alternatives could eliminate

57
the firms` ability to report accounting measurements that are more reflective of its
economic position and performance. Second, the inherent flexibility in principles
based standards could provide greater opportunity for firms to manage earnings,
thereby decreasing accounting quality.
Ball (2006) argues that IFRS are designed to make earnings more
informative, provide more useful balance sheets, and curtail the discretion
afforded managers to manipulate provisions, create hidden reserves, “smooth”
earnings and hide economic looses from public view. In addition, Barth et al.
(2008) state that accounting amount that better reflects a firm`s underlying
economics, resulting from either principle-based standards or required accounting
measurements, can increase accounting quality because by doing so provides
investors with information to aid them in making investment decisions.
Some arguments suggesting that the adoption of mandatory IFRS reporting
yields significant capital-market benefits often start from the premise that IFRS
reporting increases transparency and improves the quality of financial reporting,
citing that IFRS are more capital-market oriented and more comprehensive,
especially with respect to disclosures, than most local GAAP (Daske et al.,
2008). Recent studies support this premise by providing evidence that IFRS
adoption improves accounting quality (e.g., Barth et al., 2008; Liu et al., 2011;
Samarasekera et al., 2012). These studies provide evidence of the accounting
quality improvement brought by IFRS adoption in term of value relevance and
lower earnings management behavior. In addition, Daske et al. (2008) state that
IFRS reduces the amount of reporting discretion relative to many local GAAP
and, in particular, compel firms towards the bottom of the quality spectrum to
improve their financial reporting.

58
Furthermore, prior studies also examine IFRS adoption effect on the
improvement of financial reporting comparability. IASB (2010) defines
accounting comparability as the qualitative characteristic that enables users to
identify and understand the similarities in, and differences among, items. If a
firm`s accounting amounts are more comparable with those of its industry peers,
the marginal costs for outsiders (e.g., shareholders, creditors, and regulators) and
for specialized monitors (e.g., independent auditors and financial analysts) to
collect and process accounting information of these peer firms become smaller.
De Franco et al. (2011) emphasize that a higher degree of accounting
comparability lowers the cost of information acquisition, and increases the
overall quantity and quality of information available to information users. Taken
together, comparability is an attribute that enables to enhance the usefulness of
accounting information.
The importance of accounting comparability in enhancing the utility of
financial statements has led to growing research interest in the IFRS adoption
effect on accounting comparability. As discussed in section 2, some researchers
develop and adopt some measurement models to examine this issue. Most of
them find that financial report more comparable after IFRS adoption and gives
positive benefits to the markets. Even though there are some studies only find a
subtle effect or even a decreasing in comparability level.
In emerging markets, generally, published financial reports are the only
sources of information available for existing and potential investors to use (Alali
and Foote, 2012). Confirmed that circumstances, based on ROSC-Indonesia
survey in 2010, investors in Indonesian market tend to rely more on the
information available in published financial statements, especially that audited by
59
the largest four accounting firms in the country. Moreover, one of the objectives of
IFRS adoption in emerging markets is to have higher quality of accounting
standards. Supporting the quality improvement premise, especially the IFRS
adoption in developing countries, Ismail et al. (2013) argue that better accounting
standards could increase the quality of financial statements in developing countries
and the impact of the adoption of IFRS could be more significant than is found in
developed markets.
Prior studies suggest strong investor protection and strong legal
enforcement as the fundamental determinants for high quality financial reporting
(Daske et al., 2008; Paglietti, 2009; Houqe et al., 2012). In line with that, the
convergence process in Indonesia seems to get support from various national
institutions in this country. First, the Capital Market and Financial Institutions
Supervisory Agency (Bapepam-LK) revises certain financial reporting
requirements in capital market regulations to make them consistent with the
Indonesian equivalent of IFRS. Second, the Bank of Indonesia (the central bank)
has also incorporated the IFRS-equivalent standards relevant to the banking
industry into the revision of the Indonesian Accounting Guidelines for Banks.
Third, the newly established Financial Service Authority has also pledged its
support for the full convergence of IFRS in the country, while it also emphasizes
the readiness of the financial industry as a prerequisite in implementing the
standards (IAI, 2013).
In this study, I focus on the period of the convergence process in the IFRS
era (2005-2012) only, not include the IAS era. As noted before, the number of
PSAK materially complies with IFRS significantly increased since 2009.
Therefore, I make a cut off period for the gradual convergence process in 2009.

60
On the whole, I predict that there is an impact of IFRS convergence process in
Indonesia on the accounting quality. Although Indonesian firms are supposed to
have better accounting quality in the recent period of IFRS convergence, the prior
studies do not provide clear evidence. On one hand, IFRS adoption gives positive
impact on accounting quality, both for the cases in developed markets (Barth et al.,
2008; Paglietti, 2009; Samasekera et al., 2012, Chua et al., 2012, Dimitropoulus et
al. 2013) and emerging markets (Liu et al., 2011; Alali and Foote, 2012; Ismail et
al., 2013; Chebaane and Othman, 2014). It is also likely to increase value
relevance of accounting information in Indonesian markets (Widodo Lo, 2012).
On the other hand, many evidences are also found that accounting quality
deteriorated after IFRS adoption (Jeanjean and Stolowy, 2008; Paananen and Lin,
2009; Chen et al., 2010; Clarkson et al., 2011; Ahmed et al. 2013).
Taken together, I have no clear prediction about the direction whether IFRS
convergence gives positive or negative impact on accounting quality after the
recent revisions of Indonesian accounting standards. Therefore, I state the
following hypotheses:
H1: The indication of earnings management has changed after the recent
revisions of the accounting standards.
H2: Accruals quality has changed after recent revisions of the accounting
standards.
H3: Timely loss recognition has changed after recent revision of the accounting
standards.
H4: Value relevance of accounting information has changed after recent revisions
of the accounting standards.
H5: Accounting information comparability has changed after recent revisions of

61
the accounting standards.
I test the differences of accounting quality before and after accounting
standards change using several metrics relating to earnings management, accruals
quality, timely loss recognition, value relevance, and comparability. There are
some underlying reasons to employ these metrics. First, I analyze the indication of
earnings management because IFRS is developed as principles-based standards
that eliminates certain accounting alternatives thereby reducing managerial
discretion. Accounting standards that require recognition of amounts that are
intended to faithfully represent a firm`s underlying economics and less subject to
opportunistic managerial discretion produce higher accounting quality (Barth et al,
2008). Second, higher accounting quality is also resulting from less non-
opportunistic error in estimating accruals. I employ the Dechow and Dichev
(2002) model to analyze this non-opportunistic error. Third, I analyze the timely
loss recognition attribute to examine the conservatism aspect of financial reports
based on IFRS standards. Fourth, since there are plausible alternative
interpretations of these metrics, it is possible to rule these out for some metrics
based on the finding from other metrics. For example, I interpret that higher
earnings variability indicates higher accounting quality. However, it also can be
interpreted as lower quality resulting from error in estimating accruals. If I also
find higher value relevance, the error in estimating accruals explanations is ruled
out. Finally, I analyze the accounting comparability because this attribute is rarely
analyzed by prior studies, particularly in emerging markets.

62
CHAPTER III
RESEARCH DESIGN
3.1 Overview
In the section 2, I have discussed the literature on accounting quality and
IFRS convergence. Albeit there are numerous ways proposed by prior studies in
measuring accounting quality, there is still lack of consensus on the concept
definition. Prior studies operationalize accounting quality mainly on three
perspectives: earnings management, timely loss recognition and value relevance. I
attempt to adopt these three perspectives and add two other perspectives (accruals
quality and comparability) in order to draw upon the interpretation of Levitt (1998),
Ball et al. (2003), Bhattacharya et al. (2003), and Barth and Schipper (2008), on
accounting quality. That is, the two main attributes of high quality of financial
reporting are transparency and comparability. Transparency is defined as the ability
of users to see through the financial statements to comprehend the underlying
accounting events and transactions in the firms. Comparability is defined as the
ability of users to meaningfully analyze performance across time periods and among
companies.
Therefore, I attempt to associate the concept of accounting quality with
accounting-based attributes, by adopting earnings management, accruals quality,
and timely loss recognition constructs to concentrate on the accounting information
quality prepared under accounting standards during the IFRS convergence process.
I also include market-based construct for value relevance to strengthen the findings.
Then, I complement my analyses by adopting the construct of accounting
comparability as the other main attribute of accounting quality.

63
3.2 Accounting Quality Metrics
3.2.1. Earnings Management
I use two manifestations of earnings management, that are, earnings
smoothing and managing towards positive earnings. The earnings smoothing
metrics consist of three measures. The first metric for income smoothing is the
variability of change in net income. Similar to Lang et al. (2006) approach, this
study defines variability of change in net income as the variance of residuals (𝜀!"! )
from the following regression where it regresses change in net income on a series
of control variables that could potentially affect earnings.
As suggested by prior literatures, growth, debt, leverage, assets turnover,
and firm size could affect the variability of earnings (Lang et al., 2006; Barth et
al., 2008), and also could influence the extent of earnings management practices
(Johnson et al., 2002). For example, larger and more mature companies are more
likely to have more sophisticated financial reporting systems, so that the
managers have more opportunity to manage earnings. However, there is also
plausible alternative prediction that larger and mature companies are likely more
concern on higher earnings quality. In addition, I also include auditor type as a
factor that could influence firm`s earnings quality. Francis (2004) suggests that
larger audit firm has higher audit quality, and increase audit quality is associated
with increased earnings quality (Chen et al., 2001).
∆𝑁𝐼!" = 𝛼! + 𝛼!𝐺𝑟𝑜𝑤𝑡ℎ!" + 𝛼!𝐷𝑒𝑏𝑡!" + 𝛼!𝐿𝑒𝑣!" + 𝛼!𝐴𝑠𝑠𝑇𝑢𝑟𝑛!"
+𝛼!𝑆𝑖𝑧𝑒!" + 𝛼!𝐴𝑢𝑑!" + 𝜀!"! (1)
Where:
ΔNIit = Change in net income from year t-1 to year t deflated by average
total assets

64
Growthit = Percentage change in total annual net sales from year t-1 to year t
Debtit = Percentage change in total liabilities from year t-1 to year t
Levit = Leverage ratio for year t, equal to total liabilities over total assets
AssTurnit = Assets turnover for year t, equal to total annual net sales over total
assets
Sizeit = Natural log of total assets at the end of year t
Audit = An indicator variable that equals one if the firm`s auditor is PwC,
EY, KPMG, or Deloitte, and zero otherwise.
This study estimates equation (1) using annual data, then pool the residuals
of each regression for the respective time periods (either before and after
accounting standards change). This results in two sets of residuals being
generated. I calculate the variance of the residuals for each respective group, and
compare it using a variance ratio F-test. Higher variance represents the better
accounting quality.
The second income smoothing metric is based on the mean ratio of the
variability of the change in net income, ΔNI, to the variability of the change in
operating cash flow, ΔCFO. Lang et al. (2006) suggests that the variability of
change in net income may also be affected by firm-specific factors related to the
underlying volatility of the cash flow stream. Firms with more volatile cash
flows will naturally have more volatile net income. An additional measure of
earnings smoothing will be conducted to adjust the underlying volatility of cash
flows.
This study computes the ratio of the variability of change in net income to
the variability of change in cash flows from operations. Ceteris paribus, the firms
with higher magnitude of earnings management should have lower ratios. I use

65
the same set of control variables to control for other factors that may affect
changes in cash flows.
∆𝐶𝐹𝑂!" = 𝛼! + 𝛼!𝐺𝑟𝑜𝑤𝑡ℎ!" + 𝛼!𝐷𝑒𝑏𝑡!" + 𝛼!𝐿𝑒𝑣!" + 𝛼!𝐴𝑠𝑠𝑇𝑢𝑟𝑛!"
+ 𝛼!𝑆𝑖𝑧𝑒!" + 𝛼!𝐴𝑢𝑑!" + 𝜀!"! (2)
Where:
ΔCFOit = Change in operating cash flows from year t-1 to year t deflated by
average total assets.
Again, I run the regression of equation (2) using annual data, then pool the
residuals of each regression for the respective time periods. This results in two
sets of residuals being generated for the change in operating cash flows. I
calculate the variance of residuals, and compute the ratio for each respective
group.
The third measure for income smoothing is based on the correlation
between accruals and cash flow. A direct approach to capture the smoothing
effect of accruals is to consider their correlation with cash flows (Lang et al.,
2006). Myers and Skinner (2007) argued that management would use their
discretion to smooth earnings and conceal shocks to cash flows. A more negative
correlation between the residuals of accruals (𝜀!!) and the residuals of net cash
flow (𝜀!!) is suggestive of earnings smoothing. Then, compare and test the
correlations of the residuals from equation (3) and (4) between the two time
periods based on Cramer`s (1987) squared correlation test.
𝑇𝐴𝐶!" = 𝛼! + 𝛼!𝐺𝑟𝑜𝑤𝑡ℎ!" + 𝛼!𝐷𝑒𝑏𝑡!" + 𝛼!𝐿𝑒𝑣!" + 𝛼!𝐴𝑠𝑠𝑇𝑢𝑟𝑛!"
+𝛼!𝑆𝑖𝑧𝑒!" + 𝛼!𝐴𝑢𝑑!" + 𝜀!"! (3)
𝐶𝐹𝑂!" = 𝛼! + 𝛼!𝐺𝑟𝑜𝑤𝑡ℎ!" + 𝛼!𝐷𝑒𝑏𝑡!" + 𝛼!𝐿𝑒𝑣!" + 𝛼!𝐴𝑠𝑠𝑇𝑢𝑟𝑛!"
+𝛼!𝑆𝑖𝑧𝑒!" + 𝛼!𝐴𝑢𝑑!" + 𝜀!"! (4)

66
Where:
TACit = Total accruals in year t, equals to net income less operating cash flows
deflated by average total assets
CFOit = Operating cash flows in year t deflated by average total assets.
The second measurement for earnings management measures from the
perspective of managing towards positive earnings. Following Lang et al. (2006),
I use an approach to examining earnings management that is focused on targets
towards which firms might manage earnings. This measurement examines a
firm`s tendency to manage earnings targets, namely towards small positive net
incomes. I pool all observations for period before and after accounting standards
change to measure the frequency of small positive earnings. Following prior
research, I use a dummy variable for small positive earnings that is set to one for
observations for which the annual net income scaled by total assets is between 0
and 0.01 and is set to zero otherwise (Lang et al., 2006; Barth et al., 2008).
However, different from the prior research, I modify the model by swapping the
binary variable of DPer with the binary variable of SPOS as the dependent
variable for the logit regression. A positive coefficient of DPer from equation (5)
suggests that firms in a period have more of a tendency to manage earnings
toward small positive net income. This model enables us to examine whether the
probability of firms reporting small positive earnings (SPOS) has changed in the
period after accounting standards change, together with the control variables
used in the previous measures.
𝑆𝑃𝑂𝑆!" = 𝛼! + 𝛼!𝐷𝑃𝑒𝑟!" + 𝛼!𝐺𝑟𝑜𝑤𝑡ℎ!" + 𝛼!𝐷𝑒𝑏𝑡!" + 𝛼!𝐿𝑒𝑣!"
+𝛼!𝐴𝑠𝑠𝑇𝑢𝑟𝑛!" + 𝛼!𝑆𝑖𝑧𝑒!! + 𝛼!𝐴𝑢𝑑!" + 𝜀!" (5)

67
Where:
SPOSit = An indicator variable which is set to one for observations for which
the annual net income scaled by total assets is between 0 and 0.01 and
zero otherwise.
DPerit = An indicator variable which is set to one for observations under period
of 2009-2012 and zero under period of 2005-2008;
3.2.2. Accruals Quality
The first model measuring accruals quality was proposed by Dechow and
Dichev (2002). The model is based on the fact that accruals shift the recognition
of cash flow over time to better measure firms` performance. Since accruals are
based on estimates, the incorrect estimates must be corrected in the future
accruals and earnings. So, estimation errors are noise, that reducing the beneficial
role of accruals.
Dechow and Dichev (2002) predict that the quality of accruals and earnings
decreases when the magnitude of estimation errors increases. Their model maps
working capital accruals into operating cash flows. A poor match thus signifies
low accruals quality. They build a regression model of change in working capital
accruals on last year, present and future cash flows (equation 6). The residuals
from the regression reflect the accruals that are unrelated to cash flow
realizations, and the standard deviation of these residuals is a firm level measure
of accruals quality, where a higher standard deviation denotes lower quality
(Dechow and Dichev, 2002).
∆𝑊𝐶!" = 𝛼! + 𝛼!𝐶𝐹𝑂!"!! + 𝛼!𝐶𝐹𝑂!" + 𝛼!𝐶𝐹𝑂!"!! + 𝜀!" (6)
Where:
ΔWCit = change in working capital accruals, deflated by average total assets;

68
CFO = operating cash flow, deflated by average total assets;
High variance in the estimation errors yields non-persistent earnings, and it
is an inverse measure of earnings quality. The idea is that systematically small or
large estimation errors do not create problems for users since these still enable
them to predict future earnings. This is intuitively appealing, since a persistent
residual does not necessarily equal low accruals quality but can just be a result of
a reality in the firm. On the other hand, volatile residuals impede investors`
prediction of future earnings, creating an earnings number of low quality.
Francis et al. (2004) argue that the Dechow-Dichev model is a powerful
earnings quality measure. This model is different from the Jones model, which
attempts to capture earnings management, whereas the Dechow-Dichev model
focuses on earnings quality. The model does not distinguish intentional
estimation errors from the unintentional ones, since all errors signify poor
accruals quality, regardless the underlying intent.
3.2.3. Timely Loss Recognition
Ball and Shivakumar (2005) argue that timeliness in financial statement
recognition of economic loss is an important attribute of financial reporting
quality because it increases financial statement usefulness generally, in
particular in corporate governance and debt agreements. The governance effect
of timely loss incorporation is due to it mitigating agency problems associated
with managers` investment decisions. The efficiency of debt agreements is also
affected because timely loss recognition provides more accurate information for
loan pricing. They also note that the demand for timely gain recognition is
smaller since managers have natural incentives to report profits.

69
Using their model, I measure timely loss recognition as a non-linear
relation between operating cash flows and accruals (equation 7). Firms that
engage in a timely recognition of economic gains and losses will exhibit a
positive correlation between accruals, TAC, and contemporaneous cash flows,
CFO. The positive correlation comes from the fact that cash flows generated
from individual durable assets (such as plant and equipment) tend to be
correlated over time (Ball and Shivakumar, 2005).
The more timely firms are in their recognition of expected losses, the
stronger the positive correlation between accruals, TAC, and operating cash
flows, CFO, will be when cash flows are negative. Thus, the level of timely loss
recognition is increasing in the coefficient, α3. A timely recognition of gains
would instead be captured by a positive correlation between cash flows and
accruals when current cash flows are positive. However, because standard
accounting practices generally do not allow firms to recognize expected future
gains in cash flows until those gains are actually realized, there is little positive
correlation between positive cash flows and accruals on average. Instead, the
use of accruals to mitigate cash flow noise generally causes a negative relation
between cash flows and accruals (i.e. α2<0) (Dechow, 1994; Dechow et al.,
1998).
The main coefficient of interest, α7, will test the changes in timely loss
recognition for firms in the period of 2009-2012 relative to the changes for
firms in the period 2005-2008. A positive α7 indicate that timely loss
recognition increased for firms in the period of 2009-2012 relative to firms in
the period of 2005-2008. α6 captures any average change in the correlation
between accruals and positive cash flows in 2009-2012.

70
𝑇𝐴𝐶!" = 𝛼! + 𝛼!𝐷𝐶𝐹𝑂!" + 𝛼!𝐶𝐹𝑂!" + 𝛼!𝐷𝐶𝐹𝑂!" ∗ 𝐶𝐹𝑂!" + 𝛼!𝐷𝑃𝑒𝑟 + 𝛼!𝐷𝑃𝑒𝑟 ∗ 𝐷𝐶𝐹𝑂!"
+𝛼!𝐷𝑃𝑒𝑟 ∗ 𝐶𝐹𝑂!" + 𝛼!𝐷𝑃𝑒𝑟 ∗ 𝐷𝐶𝐹𝑂!" ∗ 𝐶𝐹𝑂!" + 𝜀!" (7)
Where:
TACit = Total accruals in year t, deflated by beginning total assets;
CFOit = Cash flow from operations, deflated by beginning total assets;
DCFOit = Dummy variable for CFOt, which is set one for CFOt < 0 and zero
otherwise;
DPerit = Dummy variable for period, which is set to one for observations
under period of 2009-2012 and zero under period of 2005-2008.
3.2.4. Value Relevance
In value relevance literature, there are two basic types of valuation model
that have extensively used by prior studies. Price model tests how firm`s market
value relates to accounting earnings and equity book value. As seen in equation
(8), based on Ohlson (1995), the model expresses the firm value as a function
of its earnings and equity book value. The other type of value relevance
valuation model is return model, which describes relation between stock returns
and accounting earnings. The value relevance of accounting information studies
using returns-earnings association is motivated by the seminal work of Ball and
Brown (1968). Then, Easton and Harris (1991) popularized a specific version of
annual return model including both earnings levels and earnings changes. The
return model used in this study, based on Easton and Harris (1991), is provided
in equation (9).
Chen et al. (2001) discuss two advantages of price models compared to
return models. When stock markets anticipate any components of accounting
earnings and incorporate the anticipation in the beginning stock price, i.e. prices

71
leading earnings, return models will bias earnings coefficients toward zero. On
the other hand, Kothari and Zimmerman (1995) argue that price models yield
unbiased earnings coefficients because stock prices reflect the cumulative effect
of earnings information. Return models only assess the value relevance of
accounting earnings, whereas price models based on Ohlson (1995) show how a
firm`s market value is related both accounting earnings and equity book value.
In addition, the use of Ohlson model will expand the scope of assessing value
relevance into both income statement and balance sheet.
However, Kothari and Zimmerman (1995) argue that return models have
less serious econometric problems of heteroscedasticity than price models. In
fact, we can find large number of value relevance studies use both price and
return models. Following previous studies and based on Kothari and
Zimmerman suggestion, this study uses both price and return models in
assessing value relevance of accounting information.
P!" = α! + α!E!" + α!BVE!" + ε!" (8)
Where:
Pit = Stock price of firm i (at three months after end of year t)
Eit = Earnings per share for firm i during period t
BVEit = Book value of equity per share for firm i at the end of period t
R!" = α! + α!!!"!!"!!
+ α!∆!!"!!"!!
+ ε!" (9)
Where:
Rit = Stock return firm i for year t (annual return from month -9 to +3),
Eit = Earnings per share of firm i for year t,
ΔEit = Change in annual earnings per share,
Pit-1 = Stock price at the beginning of nine months prior to fiscal year end.

72
This study estimates price model and return model described above to
examine the hypothesis, and the results of the two models are expected to
complement each other. To examine the change in relative value relevance of
accounting information under substantially IFRS-convergent accounting
standards after recent revisions of the standards, this study estimates equation (8)
and (9) using subsample of the period before and after standards changes (2005-
2008 and 2009-2012). I expect the coefficients of E!",BVE!" ,𝐄𝐢𝐭𝐏𝐢𝐭!𝟏
, and ∆𝐄𝐢𝐭𝐏𝐢𝐭!𝟏
to be
positive and significant at a conventional level if accounting information is value
relevant. If the period after accounting standards changes (2009-2012) is more
value relevant, coefficients and adjusted R-squared in the latter period are higher
relatively compared to the previous period. Cramer`s test (1987) is used to
examine the significant difference between two sub-sample periods` R-squared.
3.2.5. Accounting Comparability
3.2.5.1. Similarity of Accounting Functions
Comparability of financial reporting is considered as an important
characteristic to enhance the usefulness of accounting information (IASB,
2010). Therefore, many studies are interested to examine some issues related
to accounting information comparability, such as some determinants that
affect the comparability level, the benefits of financial statement
comparability, and the role of comparability for the investors. Although
comparability has proven somewhat elusive and difficult to grasp
empirically, recently, some empirical studies have emerged in response to
the development of new methodologies to measure comparability. One of
the seminal works on the comparability measurement is the paper of De

73
Franco et al. (2011). They develop an output-based measure of
comparability based on the earnings and stock returns relation, capturing the
similarity with which the two firms translate a given firm’s economic shock.
They investigate the effect of accounting comparability on analyst coverage
and forecast properties. Using samples of U.S. firms grouped by industry,
they examine the benefits of comparability.
This study uses accounting comparability measure developed by De
Franco et al. (2011) to gauge the similarity of accounting functions for firms
listed in the IDX during IFRS convergence process. De Franco et al. (2011)
conceptually define financial statement comparability as “ two firms have
comparable accounting system if, for a given set of economic events, they
produce similar financial statements.” Then, to put the conceptual definition
into practice, they develop a simple empirical model of firm`s accounting
system. In the model, they use stock return as a proxy for the net effect of
economic events on the firm`s financial statements, and earnings as the
proxy for financial statements. For each firm-year, they first estimate
equation (10) using the 16 previous quarters of data.
𝐸!" = 𝛼! + 𝛼!𝑅!" + 𝜀!" (10)
Where:
Eit = Ratio of quarterly net income before extraordinary items to the
beginning of period market value of equity;
Rit = Stock price return during the quarter.
Subsequently, they measure comparability between two firms as the
“closeness” of the functions between the firms. To estimate the distance
between functions, i.e., a measure of closeness or comparability, they invoke

74
the implication of accounting comparability: if two firms have experienced
the same set of economic events, the more comparable the accounting
between the firms, the more similar their financial statements. It uses firm i`s
and firm j`s estimated accounting functions to predict their earnings,
assuming that they had the same return (i.e., if they had experienced the
same economic events, Rit). Specifically, it uses the two estimated
accounting functions for each firm with the economic events of a single
firm, and calculates as follows:
𝐸(𝐸𝑎𝑟𝑛𝑖𝑛𝑔𝑠)!!" = 𝛼! + 𝛼!𝑅!" (11)
𝐸(𝐸𝑎𝑟𝑛𝑖𝑛𝑔𝑠)!"# = 𝛼! + 𝛼!𝑅!" (12)
E(Earnings)iit is the predicted earnings of firm i given firm i`s function
and firm i`s return in period t; and E(Earnings)ijt is the predicted earnings of
firm i given firm j`s function and firm i`s return in period t. By using firm i`s
return in both predictions, it explicitly holds the economic event constant.
Accounting comparability between firm i and j is defined as the negative
value of the average absolute difference between the predicted earnings
using firm i`s and firm j`s functions (equation 13). Greater values indicate
greater comparability.
𝐶𝑜𝑚𝑝𝐴𝑐𝑐𝑡!"# = − !!" × 𝐸 𝐸𝑎𝑟𝑛𝑖𝑛𝑔𝑠!!! − 𝐸(𝐸𝑎𝑟𝑛𝑖𝑛𝑔𝑠!"#)!
!!!" (13)
I estimate accounting comparability for each firm i – firm j
combination of firms in the same industry classification. To test the
hypothesis, I compare the mean of accounting comparability score in the
period before and after accounting standards change, and test for significant
differences. In addition, I estimate equation (14) to analyze whether there is
a significant change in accounting comparability level during the

75
convergence period. Following Lang et al. (2010), I include firm size and
book to market ratio as control variables, because these variables are widely
used to capture many unobserved firm-specific characteristics. In addition, I
also control the number of firm observations in an industry sector. A
significant positive (negative) α1 indicates that accounting comparability
level increases (decreases) significantly.
𝐴𝑐𝑐𝑡𝐶𝑜𝑚𝑝!" = 𝛼! + 𝛼!𝐷𝑃𝑒𝑟 + 𝛼!𝑆𝑖𝑧𝑒!" + 𝛼!𝐵𝑇𝑀!"
+𝛼!𝑁𝐹𝑖𝑟𝑚!" + 𝜀!" (14)
Where:
AcctCompit = Accounting comparability;
DPerit = An indicator variable equal to one for firms in the period after
accounting standards change, and zero otherwise;
Sizeit = Natural log of total assets;
BTMit = Book value of equity divided by market value of equity;
NFirmit = Number of firm observations in an industry sector
3.2.5.2. Similarity of Earnings and Equity Book Value`s Information
Content
Yip and Young (2012) developed another model to measure the
accounting comparability among firms by measuring the similarity of
information content of earnings and equity book value. They argue that the
information content of earnings and equity book value capture the extent to
which accounting earnings and equity book value reflect a firm`s economic
performance. Firms that engage in similar economic activities should have
similar information content if their accounting systems are comparable.
They measure the information content as the long-window association

76
between stock price and earnings and the equity book value.
Different from the first measurement, I use Yip and Young (2012)
model to examine the different facet of comparability. If IFRS has positive
impact on accounting comparability, the similarity facet of comparability
will improve, and the different facet of comparability will decline or at least
remain.
𝑀𝑉𝐸!" = 𝛼! + 𝛼!𝐸𝑃𝑆!" + 𝛽!𝐵𝑉𝐸!" + 𝛼!𝐷𝐼𝑛𝑑 + 𝛼!𝐷𝐼𝑛𝑑 ∗ 𝐸𝑃𝑆!"
+𝛼!𝐷𝐼𝑛𝑑 ∗ 𝐵𝑉𝐸!" + 𝜀!" (15)
Where:
MVEit = Market value of equity at the end of fiscal year, scaled by the
number of outstanding common shares;
EPSit = Earnings per share at the end of fiscal year;
BVEit = Book value equity per share at the end of fiscal year;
DIndit = Industry sector indicator.
I estimate equation (15) using two sets of firms from different
industry sectors for every possible combination before and after accounting
standards change separately. In addition, I test the difference in information
content of earnings and equity book value between the period before and
after accounting standards change. A significant α4 and α5 indicate that
firms from different sets of industry sector have different information
content of earnings and equity book value, respectively. For each firms` set
pair, I assign one for the comparability score of earnings (equity book
value) information content if α4 (α5) is insignificant (defined as p-value of
more than five percent), and zero otherwise.

77
3.3 Data and Sample Selection
The initial sample consists of all industrial Indonesia listed companies found
in the Bloomberg database in the years from 2005 to 2008 and 2009 to 2012. For
the first three metrics (earnings management, accruals quality, and timely loss
recognition), I begin with 3,396 firm-year observations, representing 468 firms
listed on the Indonesia Stock Exchange. Observations with missing value are then
deleted, thus the sample selection ends up with 3,154 observations for earnings
management metrics analyses, except for the CFO and TAC models. In addition,
financial firms are excluded from the analysis of correlation between TAC and
CFO model, accruals quality model, and timely loss recognition model.
I exclude firms with negative equity book value from the sample for the
value relevance metric. This results in total observations of 2,338 firm-year for
price model and 2,194 firm-year for return model. I divide the sample period into
two groups that represent period before and after accounting standards change.
The first group consists of firm-year observations from 2005 to 2008, which have
1,034 observations for price model analysis and 970 observations for return model
analysis. The second group consists of firm-year observations from 2009 to 2012
with 1,304 observations and 1,224 observations for price model and return model
analysis respectively.
For the first metric of accounting comparability, I use semiannual data
because of data availability. Since the Bloomberg data only provides semiannual
data of Indonesian listed firms from the second half of 2005, the sample period of
this study only covers from 2006 to 2011. I exclude firms from the financial
industry sector because of its specific regulations. In addition, firms without

78
necessary semiannual data from 2006-2011 are deleted from the sample. This
process results in only 65 firms for each period.
Finally, for the second accounting comparability metric, I exclude firms
from the financial industry and firms with negative equity book value. I use annual
data for this analysis. In addition, to ensure that there are at least 24 observations
in each regression, I require at least three firms in an industry. This procedure
yields 792 firm-year observations (99 firms) from six industry sectors. From all
possible combination of two sets of firms from six industry sectors, I have 15
regressions and hence 15 comparability scores for information content of earnings
and equity book value before and after accounting standards change, respectively.
3.4 Descriptive Statistics
Table 3.1 presents the descriptive statistics of the test and control variables
used in the earnings quality model.1 The observations are divided into two periods
of the IFRS convergence process. Then, both sets of the observations are pooled
over four years (i.e. 2005-2008 and 2009-2012). Overall, the descriptive statistics
in table 3.1 reveal that significant changes have occurred in some of the test and
control variables. Although the total accruals (TAC) measured as net income
minus cash flow from operations is not significantly different, the total cash flows
from operations (CFO) increase significantly in 2009-2012. The significant
increase in CFO may be explained by the improved economic conditions in 2009-
2012. The change in working capital accruals decreases significantly in the latter
period. For the control variables, there is no significant increase in company
growth (measured as the percentage change in total annual net sales). The debt
growth increases significantly in the latter period. This could be driven by the fact
1 All continuous variables are winsorized at top and bottom 1% to control for outliers.
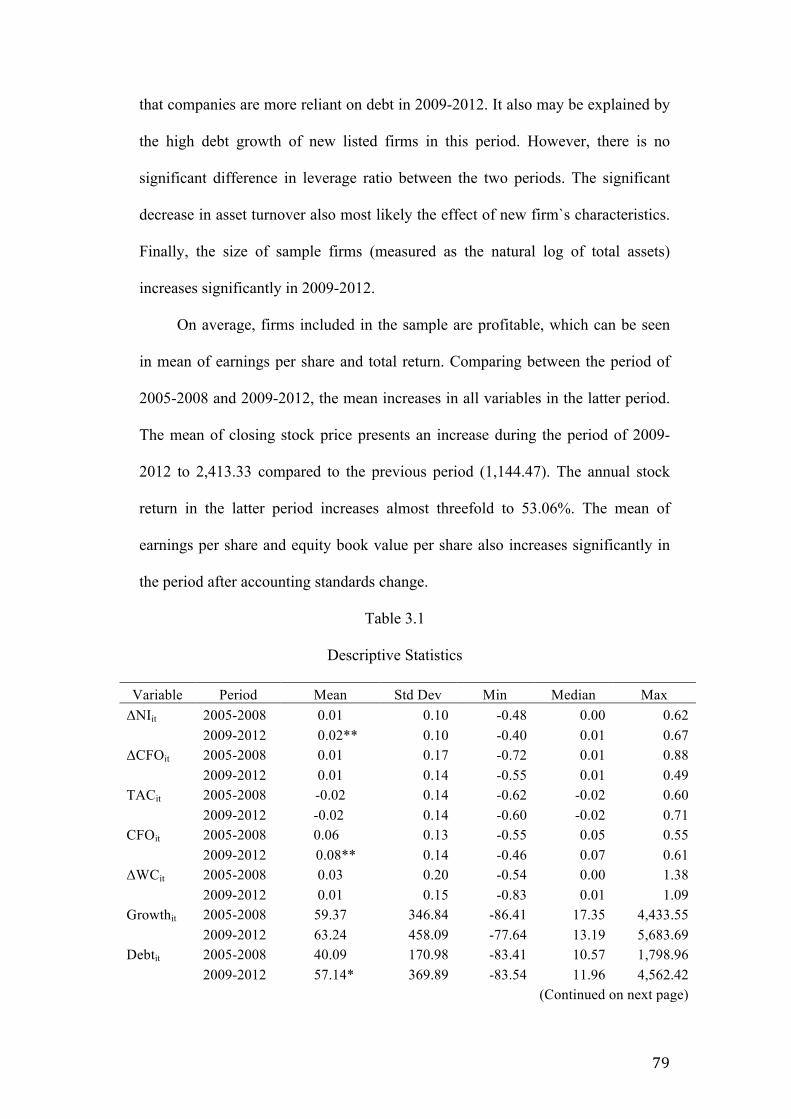
79
that companies are more reliant on debt in 2009-2012. It also may be explained by
the high debt growth of new listed firms in this period. However, there is no
significant difference in leverage ratio between the two periods. The significant
decrease in asset turnover also most likely the effect of new firm`s characteristics.
Finally, the size of sample firms (measured as the natural log of total assets)
increases significantly in 2009-2012.
On average, firms included in the sample are profitable, which can be seen
in mean of earnings per share and total return. Comparing between the period of
2005-2008 and 2009-2012, the mean increases in all variables in the latter period.
The mean of closing stock price presents an increase during the period of 2009-
2012 to 2,413.33 compared to the previous period (1,144.47). The annual stock
return in the latter period increases almost threefold to 53.06%. The mean of
earnings per share and equity book value per share also increases significantly in
the period after accounting standards change.
Table 3.1
Descriptive Statistics
Variable Period Mean Std Dev Min Median Max ΔNIit 2005-2008 0.01 0.10 -0.48 0.00 0.62
2009-2012 0.02** 0.10 -0.40 0.01 0.67
ΔCFOit 2005-2008 0.01 0.17 -0.72 0.01 0.88
2009-2012 0.01 0.14 -0.55 0.01 0.49
TACit 2005-2008 -0.02 0.14 -0.62 -0.02 0.60
2009-2012 -0.02 0.14 -0.60 -0.02 0.71
CFOit 2005-2008 0.06 0.13 -0.55 0.05 0.55
2009-2012 0.08** 0.14 -0.46 0.07 0.61
ΔWCit 2005-2008 0.03 0.20 -0.54 0.00 1.38
2009-2012 0.01 0.15 -0.83 0.01 1.09
Growthit 2005-2008 59.37 346.84 -86.41 17.35 4,433.55
2009-2012 63.24 458.09 -77.64 13.19 5,683.69
Debtit 2005-2008 40.09 170.98 -83.41 10.57 1,798.96
2009-2012 57.14* 369.89 -83.54 11.96 4,562.42
(Continued on next page)

80
Table 3.1 (continued)
Variable Period Mean Std Dev Min Median Max Levit 2005-2008 0.60 0.34 0.01 0.57 2.47
2009-2012 0.55 0.34 0.01 0.52 2.98
AssTurnit 2005-2008 0.97 1.11 0.01 0.70 9.42
2009-2012 0.91* 0.92 0.01 0.68 6.13
Sizeit 2005-2008 27.66 1.68 23.05 27.63 32.63 2009-2012 28.11*** 2.03 22.71 28.03 34.09
Audit 2005-2008 0.28 0.45 0.00 0.00 1.00 2009-2012 0.28 0.45 0.00 0.00 1.00 Pit 2005-2008 1,144.47 2,868.44 24.63 275.57 21,998
2009-2012 2,413.33*** 6,862.29 49.86 485 68,135
Eit 2005-2008 97.18 352.15 -540.24 13.70 3,257
2009-2012 150.91*** 432.99 -304.66 28 3,545
BVEit 2005-2008 803.73 1,673.13 7.54 278.47 14,820
2009-2012 1,014.54** 2,007.86 8.84 345.10 14,616
Rit 2005-2008 0.18 0.98 -0.86 -0.01 8.74
2009-2012 0.53** 1.04 -0.70 0.20 7.56
Eit/Pit-1 2005-2008 0.05 0.22 -0.92 0.05 1.31
2009-2012 0.08*** 0.20 -1.08 0.07 1
ΔEit/Pit-1 2005-2008 0.03 0.33 -1.74 0.00 2.78
2009-2012 0.04* 0.26 -1.36 0.01 1.78
Variable definitions: ΔNIit = Change in net income from year t-1 to year t deflated by average total assets; ΔCFOit = Change in operating cash flows from year t-1 to year t deflated by average total assets; TACit = Total accruals in year t, equals to net income less operating cash flows deflated by average total assets; CFO it = Operating cash flows in year t deflated by average total assets; ΔWCit= Change in working capital accruals from year t-1 to t deflated by average total assets; Growthit = Percentage change in total annual net sales from year t-1 to year t; Debtit = Percentage change in total liabilities from year t-1 to year t; Levit = Leverage ratio for year t, equal to total liabilities over total assets; AssTurnit= Assets turn over for year t, equal to total annual net sales over total assets; Sizeit = Natural log of total assets at the end of year t; Pit = stock price of firm i (at three months after end of year t); Eit= Earnings per share for firm i during period t; BVEit = Book value of equity per share for firm i at the end of period t; Rit = Stock return firm i for year t (annual return from month -9 to +3); Eit/Pit-1=Earnings per share of firm i for year t deflated by stock price at the beginning of nine months prior to fiscal year end; ΔEit/Pit-1 = Change in annual earnings per share deflated by stock price at the beginning of nine months prior to fiscal year end. *, **, *** Significant at p < 0.1, p < 0.05, and p < 0.01, respectively.
Table 3.2 reports the descriptive statistics for variables used in accounting
comparability analysis. It shows that the accounting comparability score from De
Franco et al. (2011) measurement for both periods are at the same level; the score
mean (median) is -0.03 (-0.02). In addition, the control variables, book to market
ratio and size, show a different figure. Book to market ratio decreases in the mean
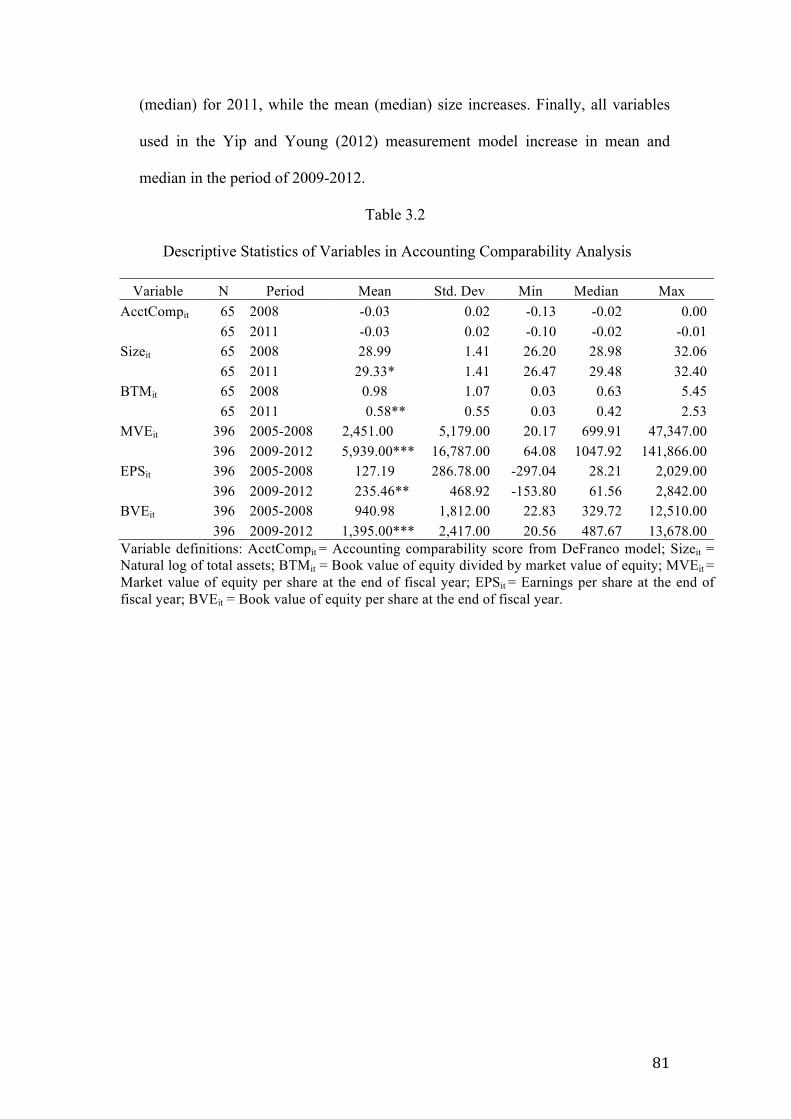
81
(median) for 2011, while the mean (median) size increases. Finally, all variables
used in the Yip and Young (2012) measurement model increase in mean and
median in the period of 2009-2012.
Table 3.2
Descriptive Statistics of Variables in Accounting Comparability Analysis
Variable N Period Mean Std. Dev Min Median Max AcctCompit 65 2008 -0.03 0.02 -0.13 -0.02 0.00
65 2011 -0.03 0.02 -0.10 -0.02 -0.01
Sizeit 65 2008 28.99 1.41 26.20 28.98 32.06
65 2011 29.33* 1.41 26.47 29.48 32.40
BTMit 65 2008 0.98 1.07 0.03 0.63 5.45
65 2011 0.58** 0.55 0.03 0.42 2.53
MVEit 396 2005-2008 2,451.00 5,179.00 20.17 699.91 47,347.00
396 2009-2012 5,939.00*** 16,787.00 64.08 1047.92 141,866.00
EPSit 396 2005-2008 127.19 286.78.00 -297.04 28.21 2,029.00
396 2009-2012 235.46** 468.92 -153.80 61.56 2,842.00
BVEit 396 2005-2008 940.98 1,812.00 22.83 329.72 12,510.00
396 2009-2012 1,395.00*** 2,417.00 20.56 487.67 13,678.00
Variable definitions: AcctCompit = Accounting comparability score from DeFranco model; Sizeit = Natural log of total assets; BTMit = Book value of equity divided by market value of equity; MVEit = Market value of equity per share at the end of fiscal year; EPSit = Earnings per share at the end of fiscal year; BVEit = Book value of equity per share at the end of fiscal year.

82
CHAPTER IV
RESULTS
4.1. Results on Accounting Quality Analysis
4.1.1. Indication of Earnings Management
Table 4.1, Panel A, reports the results of the tests of earnings smoothing
are consistent to the prediction, but there is no significant difference in some
instances. The variability of change in net income shows an insignificant
increase between the two periods. However, a substantial increase is found after
controlling firm-specific volatility in cash flow from operations by using the
ratio of change in net income variability to change in cash flow from operations
variability. It suggests that the latter period has a lower income smoothing
behavior. The correlation between the residuals from the regression on accruals
and cash flow from operations shows a decrease in magnitude of negative
correlations. However, the Cramer`s (1987) squared correlation test shows that
the different level of correlation between two periods is not significant. Lang et
al. (2006) argue that a more negative correlation between accruals and cash
flows suggests higher level of earnings smoothing because managers appear to
respond to poor cash flow outcome by increasing accruals. After the standard
change, this correlation turned less negative, implying a decrease in earnings
smoothing with the standards change.
If firms are less likely to manage towards earnings targets in the period
after accounting standards change, the coefficient for DPer should be negative.
Table 4.1 Panel A-2 shows that the coefficient for DPer is negative and

83
significant.2 As many authors argued that, given discretion, management will
find ways to report small positive earnings if possible. Accruals management
might affect the resulting distribution of earnings (Lang et al., 2006). Thus, this
finding is consistent with the earnings smoothing measures. Firms in 2009-2012
have a lower earnings management behavior then it is less likely to manage
towards earnings targets.
4.1.2. Accruals Quality
Table 4.1, Panel B, provides the results where I estimate and compare the
accruals quality between the two sets of sample. The residuals from the
regression reflect accruals that are unrelated to cash flow realizations, and the
standard deviation of these residuals is a firm-level measure of accruals quality,
where a higher standard deviation denotes lower quality (Dechow and Dichev,
2002). As predicted, the accruals quality changed, firms under period of 2009-
2012 have lower standard deviation of the residuals. In addition, statistic test
shows that the difference of residuals between two periods is significant. This
evidence suggests that earnings quality improves after the change of accounting
standards in 2009-2012.
4.1.3. Timely Loss Recognition
If firms in the period of 2009-2012 are more timely recognition of losses,
the coefficient on 𝛼! in a regression model of accruals on cash flow from
operations (equation 7) is positive. As shown in Table 4.1, Panel C, the result
shows that the coefficient on 𝛼! is negative and significant. It indicates that firms
2 To confirm the result, I test the frequency of small negative (Sneg) using the same model. Intuitively if earnings quality better, the coefficient of Sneg is positive. Contrary to my expectation, the coefficient of Sneg is negative, but not significant. This result might be influenced by a better macro economic condition in 2009-2012.

84
in the latter period are less likely to recognize losses as transitory items, implies
that their asymmetry is lower (Ball and Shivakumar, 2005).
Table 4.1
Results Analysis for Earnings Management, Accruals Quality and Timely Loss
Recognition
Panel A: Indication of Earnings Management Prediction Period of 2005-2008
Period of 2009-2012 z-score
(a) (b)
1. Earnings Smoothing
(n =1,464) (n =1,690) a. Variance of ΔNI*a (a) ≠ (b) 0.009 0.010 0.458
b. Variance of ΔNI*/ ΔCFO*b,c (a) ≠ (b) 0.289 0.535 4.079***
(n =1,208) (n =1,410)
c. Correlation between CFO* and TAC*d (a) ≠ (b) -0.688 -0.676 1.005 2. Managing Towards Earnings Targets Prediction Period of 2005-2012 Wald-stat
(n = 3,154)
Frequency of SPose (2005-2012) α1 ≠ 0 -0.346 10.91***
Panel B: Accruals Quality Prediction Period of 2005-2008
Period of 2009-2012 t-statistic
(n =1,198) (n = 1,406)
Standard deviation of residualsf (a) ≠ (b) 0.149 0.114 3.341** Panel C: Timely Loss Recognition Prediction Period of 2005-2012 t-statistic
(n = 2,326)
Coefficient on 𝛼!from Ball and Shivakumar (2005) regression modelg α7 ≠ 0 -0.203 -6.129***
*, **, *** Significant at p < 0.1, p < 0.05, and p < 0.01, respectively. #Financial firms are excluded from the analysis of correlation between TAC and CFO model, accruals quality model, and timely loss recognition model. a ΔNI* is the variance of residuals from a regression of the ΔNI on the control variables. b ΔCFO* is the variance of residuals from a regression of the ΔCFO on the control variables c Variability of ΔNI* over ΔCFO* is the ratio of ΔNI* divided by ΔCFO*. d Correlation of ACC* and CFO* is the partial Spearman correlation between the residuals from the ACC and CFO regression. e Spos is an indicator variable set to one for observations for which the annual net income scaled by total assets is between 0 and 0.01 and set to zero otherwise. f Standards deviation of residuals from Dechow and Dichev (2002) accruals model, the regression is ∆𝑊𝐶!" = 𝛼! + 𝛼!𝐶𝐹𝑂!"!! + 𝛼!𝐶𝐹𝑂!" + 𝛼!𝐶𝐹𝑂!"!! + 𝜀!" g The regression is 𝑇𝐴𝐶!" = 𝛼! + 𝛼!𝐷𝐶𝐹𝑂!" + 𝛼!𝐶𝐹𝑂!" + 𝛼!𝐷𝐶𝐹𝑂!" ∗ 𝐶𝐹𝑂!" + 𝛼!𝐷𝑃𝑒𝑟 + 𝛼!𝐷𝑃𝑒𝑟 ∗𝐷𝐶𝐹𝑂!" + 𝛼!𝐷𝑃𝑒𝑟 ∗ 𝐶𝐹𝑂!" + 𝛼!𝐷𝑃𝑒𝑟 ∗ 𝐷𝐶𝐹𝑂!" ∗ 𝐶𝐹𝑂!" + 𝜀!"
4.1.4. Value Relevance
4.1.4.1. Price Model Results
Table 4.2 Panel A provides results from regressions using subsample
2005-2008 and 2009-2012 for price model. As expected, the results from price
85
model show that coefficients of earnings and equity book value are positive
and significant. The results of both periods show that accounting information
in Indonesian market is value relevant. However, the magnitude of equity
book value coefficient is smaller than earnings coefficient. Barth et al. (1998)
show the importance of earnings and equity book value as determinants of
equity prices. They state that book value becomes more relevant, when the
financial health of firm deteriorates. In my sample, there are only about 19 %
of firms have negative earnings. So, it may explain why investors more focus
to earnings rather than equity book value.
Comparing results from period before and after standards changes, I
find that the latter period (2009-2012) has higher coefficient of earnings per
share. The coefficients of this variable for 2005-2008 and 2009-2012 are 4.47
and 11.368 respectively. This higher coefficient indicates that earnings is
more value relevant in the period after the accounting standards change. The
coefficient of equity book value also increases from 0.579 to 0.616. In
addition, the latter period has significantly higher adjusted R-squared (75%)
relatively compared to the previous period (69%). The result from Cramer`s
test shows that the two R-squared is significantly different. Overall, this result
supports the main hypothesis of this study that value relevance of accounting
information changed after the recent revision of accounting standards.
4.1.4.2. Return Model Results
From the result of return model regression (Table 4.2 Panel B), I find
that earnings is value relevant in both periods. The coefficient of earnings is
positive and significant, indicating that high level of earnings is associated
with high stock return. The magnitude of this coefficient also increases

86
significantly from 0.574 in 2005-2008 to 1.409 in 2009-2012. However, I
find insignificant coefficient of earnings changes in both periods, indicating
that this variable is not associated with stock return. The coefficient for
2005-2008 and 2009-2012 of this variable are 0.108 and 0.066 respectively.
This insignificant association reveals that investors do not concern about
earnings surprise in both periods.
The result from return model also show that the latter period has
significantly higher adjusted R-squared, 2.1% for 2005-2008 and 8.1% for
2009-2012. This result complements the evidence found in price model and
supports the main hypothesis.3
Table 4.2
Regression Results for Value Relevance Analysis
Panel A: Price model Pit=α0+α1Eit+α2EBVit+εit
Period N α1 α2 Adj. R2 Cramer`s test (z-score)
2005-2008 1,034 4.47 0.579 0.69
3.674*** 21.267*** 13.096***
2009-2012 1,304 11.368 0.616 0.75
31.96*** 8.032***
Panel B: Return model Rit=α0+α1Eit/Pit-1 +α2ΔEit/Pit-1 +εit Period N α1 α2 Adj. R2 Cramer`s test (z-score)
2005-2008 970 0.574 0.108 0.021
3.390*** 3.246*** 0.956
2009-2012 1,224 1.409 0.066 0.081
8.65*** 0.517
P!" is stock price of firm i (at three months after end of year t). E!" is earnings per share for firm i during period t. EBV!" is equity book value per share for firm i at the end of period t. R!" stock return firm i for year t (annual return from month -9 to +3). ∆E!" is change in annual earnings per share. P!"!! is stock price at the beginning of nine months prior to fiscal year end. *** significant at p-value < 0.01.
3 I also estimate the price and return models using dummy period for pooled sample and get similar result with improved R-squared.

87
4.1.5. Accounting Comparability
4.1.5.1. Similarity of Accounting Functions
The mean of accounting comparability scores resulting from the first
measurement for firms in the period 2006-2008 and 2009-2011 is insignificant
different (table 3.2). In addition, Table 4.3 provides the regression result of
the equation (14) to test the main hypothesis, where the accounting
comparability score is regressed on period dummy variable and the control
variables. If accounting comparability improves in the latter period, the
coefficient of DPer will positive and significant. However, contrary to the
prediction, the coefficient of DPer is insignificant. This result means that
accounting comparability in the latter period of convergence process does not
change significantly.
4.1.5.2. Similarity of Earnings and Equity Book Value`s Information
Content
The second measurement examines the different facet of comparability
by testing the similarity of earnings and equity book value`s information
content of two different sets of industry. This model measures the
comparability by capturing the similarity of accounting information content
between two groups of firms from different industry sectors. Table 4.4 reports
the mean of comparability scores for earnings and equity book value`s
information content. It also provides the statistic test for differences in mean
between comparability score for 2005-2008 and 2009-2012 using McNemar
test.

88
Table 4.3
Results of Accounting Comparability Before and After Accounting Standards Change
(Multivariate Analysis)
Coefficient t-statistics Intercept -0.108 -2.946*** Dper 0.000 0.048 Size 0.003 2.166** BTM -0.003 -1.654* NFirm 0.000 1.363 Adjusted R2 0.066 Number of Observations 130
Dependent variable is the accounting comparability score from DeFranco model; DPer = An indicator variable equal to one for firms in the period after accounting standards change, and zero otherwise; Size = Natural log of total assets; BTM = Book value of equity divided by market value of equity; NFirm = number of firm observations in an industry sector. *, **, *** Significant at p < 0.1, p < 0.05, and p < 0.01, respectively.
The result shows that firms in the period of 2009-2012 have lower
(higher) similarity of earnings (equity book value) information content,
however, the statistic test shows that the difference is not significant. Similar
with the finding of the first model, the measurement of similarity of earnings
and equity book value`s information content also proves that the recent
revisions of accounting standards do not give a significant change in
comparability accounting of financial statements.4 However, at least there is a
positive nuance of different facet of comparability, that the level of different
facet of comparability is still remain, instead of increase, after the recent
revisions of accounting standards.
4 The subtle effect on accounting comparability may be do to the narrower period used and
the limited sample availability.

89
Table 4.4
Comparability Score for Earnings and Equity Book Value`s Information Content
Mean of comparability score of earnings`
information content
Mean of comparability score of equity book value`s information
content Number of observations 15 15 2005-2008 0.667 0.600 2009-2012 0.533 0.800 Difference -0.133 0.200 p-value 0.500 0.508
4.2. Summary of Empirical Results
The empirical results of this study reveal that the majority of accounting
quality indicators changed after the recent revision of accounting standards in
Indonesia. That is, there is higher ratio of change in net income variability to
change in cash flow from operations variability, and the less frequency of small
positive earnings. It indicates that earnings management decreased in the period of
2009-2012. However, I do not find a significant change in two other income
smoothing measures. In addition, the indicator of accruals quality shows that firms
in the latter period have higher quality of accruals. Complementing the positive
findings on accounting-based attributes, result from market based-attribute
indicates accounting quality improved in term of value relevance.
However, this study finds that firms recognize losses in less timely fashion
in the period after accounting standards change. Under Basu (1997) definition of
conservatism, earnings reflects bad news more quickly than good news. Thus, I
interpret that the recent of revisions accounting standards converge to IFRS do
not improve the conservatism of financial reporting. This result is not
surprisingly, as some previous studies also find that this attribute decreases after
mandatory IFRS adoption (Paananen and Lin, 2009; Chen et al., 2010; Ahmed et
al., 2012).

90
For accounting comparability metrics, I do not find a significant change in
the period after recent revisions of accounting standards. This inconsistent result
compared to other testing attributes may because of the different attribute
analyzed in the accounting comparability model. In addition, this finding seems
to contradict with the standards setter and users` expectation, as one of the
important reasons to adopt IFRS is to increase the comparability of reported
financial information. However, IASB (2010) explains in its basis for
conclusions of the conceptual framework for financial reporting, that even if the
financial information is not readily comparable, relevant and faithfully
represented information is still useful. On the other hand, comparable
information is not useful if it is not relevant and may mislead if it is not faithfully
represented. Of this argument, IASB highlight that comparability is considered as
an enhancing qualitative characteristic instead of a fundamental qualitative
characteristic.
4.3. Robustness Tests
In order to rule out the effect of sample composition changes and mitigate
the effect of unstable new listed firms on the results of the whole sample, I am
also re-running all tests using a constant sample consisting firm-observations
available in all sample periods. This sample has 1,412 observations for each
period. Table 4.5 shows that the results analysis of earnings quality using
constant sample are similar and supports the results using the whole sample.
Corroborate the results of earnings smoothing measure, I find a significant
decrease in the magnitude of negative correlation between accruals and cash flow
from operations between the two periods. Overall, the latter period is less

91
earnings smoothing, less managing towards earnings targets and higher accruals
quality, but less timely loss recognition.
For the value relevance analysis, I perform several sensitivity tests to check
the robustness of the results. First, I re-estimate price model and return model
regression by including firms with negative equity book value and adding
dummy variable EBV, stated as one if firm has positive equity book value and
zero otherwise. The results from both models are materially similar compared to
the main results.
Furthermore, to rule out the effect of sample composition changes on the
results of the whole sample, I estimate the regression of price model and return
model using constant sample consisting firm-observations available in all sample
periods. By deleting firms with less than eight years data (2005-2012), I get 772
firm-year observations for price model and 768 firm-year observations for return
model for each sample period. The results remain materially unchanged
compared to those of the whole sample for both models.
In addition, I perform stability test by dividing the test period 2005-2012
into narrower period. The narrowed periods are 2006-2011 with 1,763 firm-year
observations for price model and 1,649 firm-year observations for return model;
2007-2012 with 1,179 firm-year observations for price model and 1,105 firm-
year observations for return model; and 2008-2009 with 588 firm-year
observations for price model and 568 firm-year observations for return model.
Table 4.6 Panel B provides the regression results from price model and return
model using three kinds of narrower period before and after accounting standards
change.

92
Table 4.5
Results Analysis for Earnings Management, Accruals Quality and Timely Loss
Recognition Use Matched Sample
Panel A: Indication of Earnings Management Prediction
Period of 2005-2008
Period of 2009-2012 z-score
(a) (b)
1. Earnings Smoothing
(n = 1,412 ) (n = 1,412 ) a. Variance of ΔNI*a (a) ≠ (b) 0.010 0.010 0.184
b. Variance of ΔNI*/ ΔCFO*b,c (a) ≠ (b) 0.378 0.594 3.256***
(n = 1,160 ) (n =1,160 )
c. Correlation between CFO* and TAC*d (a) ≠ (b) -0.692 -0.618 3.812** 2. Managing Towards Earnings Targets Prediction Period of 2005-2012 Wald-stat
(n =2,824 )
Frequency of Spose α1 ≠ 0 -0.346 9.664***
Panel B: Accruals Quality Prediction Period of 2005-2008
Period of 2009-2012 t-statistic
(n = 1160) (n = 1,160 )
Standard deviation of residualsf (a) ≠ (b) 0.148 0.104 3.424** Panel C: Timely Loss Recognition Prediction Period of 2005-2012 t-statistic
(n = 2320)
Coefficient on 𝛼!from Ball and Shivakumar (2005) regression modelg α7 ≠ 0 -0.199 -5.626***
*, **, *** Significant at p < 0.1, p < 0.05, and p < 0.01, respectively. #Financial firms are excluded from the analysis of correlation between TAC and CFO model, level of discretionary accruals model, and timely loss recognition model. a ΔNI* is the variance of residuals from a regression of the ΔNI on the control variables. b ΔCFO* is the variance of residuals from a regression of the ΔCFO on the control variables c Variability of ΔNI* over ΔCFO* is the ratio of ΔNI* divided by ΔCFO*. d Correlation of ACC* and CFO* is the partial Spearman correlation between the residuals from the ACC and CFO regression. e Spos is an indicator variable set to one for observations for which the annual net income scaled by total assets is between 0 and 0.01 and set to zero otherwise. f Standards deviation of residuals from Dechow and Dichev (2002) accruals model, the regression is ∆𝑊𝐶!" = 𝛼! + 𝛼!𝐶𝐹𝑂!"!! + 𝛼!𝐶𝐹𝑂!" + 𝛼!𝐶𝐹𝑂!"!! + 𝜀!" g The regression is 𝑇𝐴𝐶!" = 𝛼! + 𝛼!𝐷𝐶𝐹𝑂!" + 𝛼!𝐶𝐹𝑂!" + 𝛼!𝐷𝐶𝐹𝑂!" ∗ 𝐶𝐹𝑂!" + 𝛼!𝐷𝑃𝑒𝑟 + 𝛼!𝐷𝑃𝑒𝑟 ∗𝐷𝐶𝐹𝑂!" ∗ 𝐶𝐹𝑂!"
Overall, the results from stability test are consistent with the main test
results. As in the main test, the magnitude of earnings coefficient and equity
book value coefficient in latter period are higher than previous period for both
models in all narrowed period. From results of return model, I find significant
coefficient of earnings changes in three narrowed periods (2008, 2007-2008 and
2006-2008).

93
Finally, I perform a sensitivity test by using interest rates as control variable. As
Johnson (1999) argues that interest rates should be included in models whenever
inferences about changes in value relevance of earnings due to non-interest rate
factors are hypothesized. I use Bank Indonesia certificate (SBI) rate of return as a
proxy of risk-free rate. As seen on Table 4.6 Panel C, the results remained
qualitatively unchanged. Coefficient of all variables and adjusted R-squared from
both models are similar with those in the main test.
Table 4.6
Results of Robustness Test for Value Relevance Analysis
Panel A: Results using match sample
Price model Pit=α0+α1 Eit+α2EBVit+εit
Return model Rit=α0+α1Eit/Pit-1+α2ΔEit/Pit-1 +εit
Period N α1 α2 Adj. R2 N α1 α2
Adj. R2
2005-2008 772 4.41 0.54 0.67 768 0.56 0.02 0.02
18.43*** 11.51***
2.83*** 0.19
2009-2012 772 13.03 0.16 0.76 768 1.65 -0.00 0.13
27.86*** 1.70*
8.51*** -0.02
Panel B: Stability test
Price model Pit=α0+α1Eit+α2EBVit+εit
Return model Rit=α0+α1Eit/Pit-1+α2ΔEit/Pit-1+εit
Period N α1 α2 Adj. R2
N α1 α2 Adj. R2
2008 289 5.51 0.22 0.78
277 0.34 0.24 0.06
17.45*** 3.97***
2.37** 1.92**
2009 299 9.35 0.30 0.80
291 0.98 -0.22 0.05
20.03*** 2.03**
3.83*** -1.12
2007-2008 562 7.06 0.25 0.69
518 0.59 0.48 0.04
19.16*** 3.99***
2.23** 2.29**
2009-2010 617 9.16 0.96 0.72
587 1.58 -0.23 0.10
18.92*** 8.64***
7.76*** -1.42
2006-2008 805 5.99 0.36 0.70
748 0.53 0.27 0.02
21.88*** 7.01***
2.44** 1.76*
2009-2011 958 11.15 0.85 0.75
901 1.44 0.01 0.08
26.19*** 8.98***
7.66*** 0.03
(Continued on next page)

94
Table 4.6 (continued)
Panel C: Regression results using SBI rate as control variable Price model Pit=α0+α1 Eit+α2 EBVit+α3SBIt+εit
Period N α1 α2 α3 Adj. R2 2005-2008 1,034 4.47 0.58 -44.68 0.69
21.26*** 13.10*** -1.08
2009-2012 1,304 11.37 0.62 -10.87 0.75
31.95*** 8.02*** -0.12
Return model Rit=α0+α1Eit/Pit-1 +α2ΔEit/Pit-1 +α3SBIt+εit Period N α1 α2 α3 Adj. R2 2005-2008 970 0.57 0.12 0.00 0.02
3.21*** 1.08 1.13
2009-2012 1,224 1.40 0.04 0.11 0.09
8.67*** 0.34 4.30***
P!" is stock price of firm i (at three months after end of year t). E!" is earnings per share for firm i during period t. EBV!" is equity book value per share for firm i at the end of period t. R!" stock return firm i for year t (annual return from month -9 to +3). ∆E!" is change in annual earnings per share. P!"!! is stock price at the beginning of nine months prior to fiscal year end. SBIt is the average rate of return of Bank Indonesia certificate in year t. All continuous variables are winsorized at 1% top and bottom. *, **, *** Significant at p < 0.1, p < 0.05, and p < 0.01, respectively.
4.4. Additional Analysis
4.4.1. The Effect of Good Corporate Governance
This study makes further analysis using two subsamples consisting firms
that have high level of good corporate governance perception index (hereafter
refer to as CGPI) and firms without high level of good corporate governance
perception index (hereafter refer to as non-CGPI). Prior studies document that
effective corporate governance mechanisms are associated with less earnings
management as the properties of accounting quality (Van Tendeloo and
Vanstraelen, 2005); Kent et al., 2010; and Liang and Shan, 2011). Therefore,
the CGPI firms are intuitively expected to be more concern about financial
reporting quality, so this study predicts this group have a better earnings quality
relatively compared to group of non-CGPI firms.

95
I obtain the data of firms that have high level of good corporate
governance perception index from the Indonesian Institute for Corporate
Governance. For earnings management, accruals quality, and timely loss
recognition analyses, the sample has 371 of CGPI firms and 2,783 observations
of non-CGPI firms. For price model of value relevance analysis, there are 241
CGPI firms and 2,097 non-CGPI firms. For return model of value relevance
analysis, I have 230 CGPI firms and 1,964 non-CGPI firms.
Table 4.7 shows the result of earnings management, accruals quality and
timely loss recognition between period 2005-2008 and 2009-2012 for CGPI
Firms. None of these accounting quality indicators indicate significant change
in the latter period. On the contrary, the results from the non-CGPI group show
significant change in indication of earnings management, accruals quality and
timely loss recognition (Table 4.8). In the latter period, firms in this group are
less managed earnings, have better accruals quality, but less timely in recognize
losses. Meanwhile, Table 4.9 shows that CGPI firms have better indication of
earnings management, accruals quality and timely loss recognition in the
previous period. Then, in the latter period, the earnings management indicators
become similar between the two groups (Table 4.10).
Value relevance results for CGPI and non-CGPI firms are presented in
Table 4.11. Overall, these groups have higher value relevance in the period
after accounting standards change. Significant increase is found for group of
CGPI firms from price model analysis. While, for group of non-CGPI firms,
there are significant increase in earnings coefficient from price model and
significant increase in adjusted R-squared from return model.

96
To sum up, this study confirms that good corporate governance is
associated with quality of financial reporting. However, the more important
evidence is the finding of more observable improvement for the group of non-
CGPI firms. That is, after the accounting standards change, this group has
better indication of earnings management, higher quality of accruals and higher
value relevance. Overall, I conclude that good corporate governance affect the
accounting quality, but the good quality of CGPI firms does not drive the
accounting quality change found in the whole sample of the main analyses.

97
Table 4.7
Comparisons of Earnings Management, Accruals Quality and Timely Loss
Recognition between Period 2005-2008 and 2009-2012 for CGPI Firms
CGPI Firms Panel A: Indication of Earnings Management Prediction
Period of 2005-2008
Period of 2009-2012 Z-score
(a) (b)
1. Earnings Smoothing
(n = 179 ) (n =192 ) a. Variance of ΔNI*a (a) < (b) 0.009 0.005 0.0006
b. Variance of ΔNI*/ΔCFO*b,c (a) < (b) 0.333 0.478 0.000
(n =125 ) (n =136 )
c. Correlation between CFO* and TAC*d (a) < (b) -0.580 -0.645 0.933
2. Managing Towards Earnings Targets Prediction
Period of 2005-2012 Wald-stat
(n =371 )
Frequency of Spose Negative -0.619 2.407
Panel B: Accruals Quality Prediction
Period of 2005-2008
Period of 2009-2012 t-statistic
(n = 125) (n = 136 )
Standard deviation of residualsf (a) > (b) 0.054 0.070 0.230
Panel C: Timely Loss Recognition Prediction
Period of 2005-2012 t-statistic
(n =261 )
Coefficient on 𝛼!from Ball and Shivakumar (2005) regression modelg Positive -0.062 -0.63
*, **, *** Significant at p < 0.1, p < 0.05, and p < 0.01, respectively. #Financial firms are excluded from the analysis of correlation between TAC and CFO model, level of discretionary accruals model, and timely loss recognition model. a ΔNI* is the variance of residuals from a regression of the ΔNI on the control variables. b ΔCFO* is the variance of residuals from a regression of the ΔCFO on the control variables c Variability of ΔNI* over ΔCFO* is the ratio of ΔNI* divided by ΔCFO*. d Correlation of ACC* and CFO* is the partial Spearman correlation between the residuals from the ACC and CFO regression. e Spos is an indicator variable set to one for observations for which the annual net income scaled by total assets is between 0 and 0.01 and set to zero otherwise. f Standards deviation of residuals from Dechow and Dichev (2002) accruals model, the regression is ∆𝑊𝐶!" = 𝛼! + 𝛼!𝐶𝐹𝑂!"!! + 𝛼!𝐶𝐹𝑂!" + 𝛼!𝐶𝐹𝑂!"!! + 𝜀!" g The regression is 𝑇𝐴𝐶!" = 𝛼! + 𝛼!𝐷𝐶𝐹𝑂!" + 𝛼!𝐶𝐹𝑂!" + 𝛼!𝐷𝐶𝐹𝑂!" ∗ 𝐶𝐹𝑂!" + 𝛼!𝐷𝑃𝑒𝑟 + 𝛼!𝐷𝑃𝑒𝑟 ∗𝐷𝐶𝐹𝑂!"

98
Table 4.8
Comparisons of Earnings Management, Accruals Quality and Timely Loss
Recognition between Period 2005-2008 and 2009-2012 for Non-CGPI Firms
Non CGPI Firms Panel A: Indication of Earnings Management Prediction Period of 2005-2008
Period of 2009-2012 Z-score
(a) (b)
1. Earnings Smoothing
(n = 1285 ) (n =1498 ) a. Variance of ΔNI*a (a) < (b) 0.011 0.010 0.448
b.Variance of ΔNI*/ ΔCFO*b,c (a) < (b) 0.377 0.537 4.992**
(n =1083 ) (n =1274 )
c. Correlation between CFO* and TAC*d (a) < (b) -0.681 -0.693 0.665
2. Managing Towards Earnings Targets Prediction Period of 2005-2012 Wald-stat
(n = 2783)
Frequency of Spose Negative -0.304 7.503*** Panel B: Accruals Quality Prediction Period of 2005-2008 Period of 2009-2012 t-statistic
(n = 1,073) (n = 1,270 )
Standard deviation of residualsf (a) > (b) 0.159 0.119 2.799** Panel C: Timely Loss Recognition Prediction Period of 2005-2012 t-statistic
(n =2,357 )
Coefficient on 𝛼!from Ball and Shivakumar (2005) regression modelg Positive -0.209 -5.961***
*, **, *** Significant at p < 0.1, p < 0.05, and p < 0.01, respectively. #Financial firms are excluded from the analysis of correlation between TAC and CFO model, level of discretionary accruals model, and timely loss recognition model. a ΔNI* is the variance of residuals from a regression of the ΔNI on the control variables. b ΔCFO* is the variance of residuals from a regression of the ΔCFO on the control variables c Variability of ΔNI* over ΔCFO* is the ratio of ΔNI* divided by ΔCFO*. d Correlation of ACC* and CFO* is the partial Spearman correlation between the residuals from the ACC and CFO regression. e Spos is an indicator variable set to one for observations for which the annual net income scaled by total assets is between 0 and 0.01 and set to zero otherwise. f Standards deviation of residuals from Dechow and Dichev (2002) accruals model, the regression is ∆𝑊𝐶!" = 𝛼! + 𝛼!𝐶𝐹𝑂!"!! + 𝛼!𝐶𝐹𝑂!" + 𝛼!𝐶𝐹𝑂!"!! + 𝜀!" g The regression is 𝑇𝐴𝐶!" = 𝛼! + 𝛼!𝐷𝐶𝐹𝑂!" + 𝛼!𝐶𝐹𝑂!" + 𝛼!𝐷𝐶𝐹𝑂!" ∗ 𝐶𝐹𝑂!" + 𝛼!𝐷𝑃𝑒𝑟 + 𝛼!𝐷𝑃𝑒𝑟 ∗𝐷𝐶𝐹𝑂!"
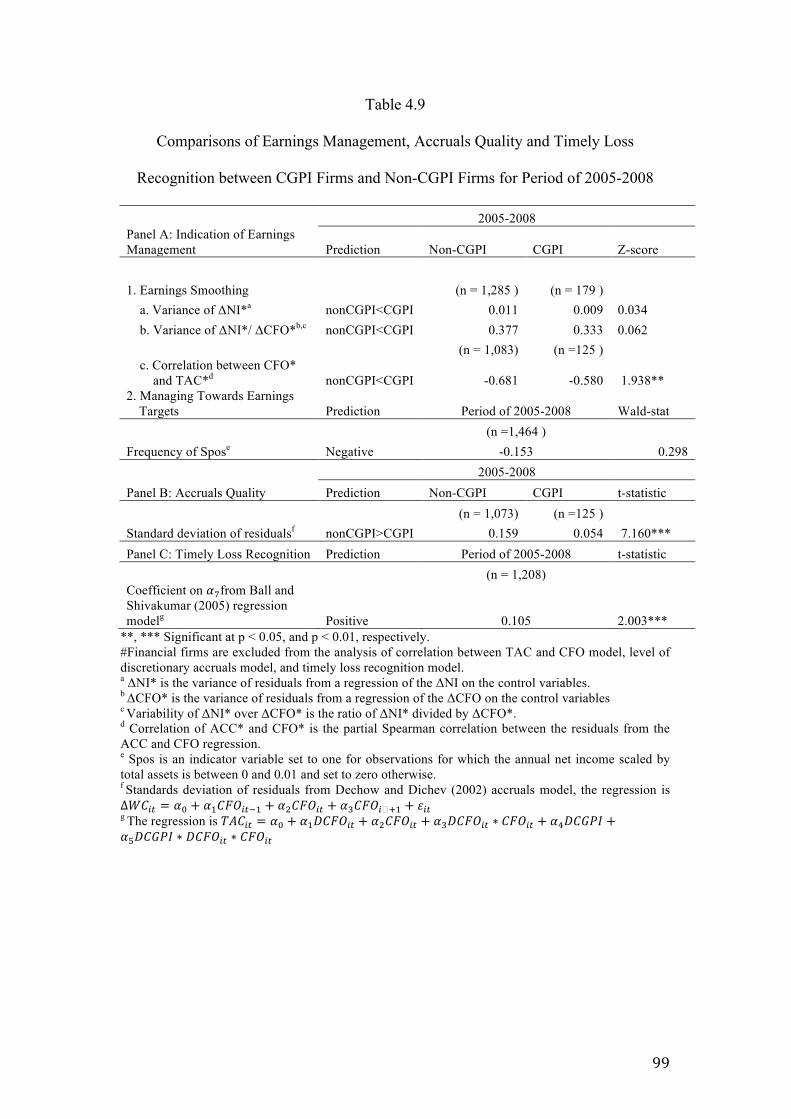
99
Table 4.9
Comparisons of Earnings Management, Accruals Quality and Timely Loss
Recognition between CGPI Firms and Non-CGPI Firms for Period of 2005-2008
2005-2008 Panel A: Indication of Earnings Management Prediction Non-CGPI CGPI Z-score
1. Earnings Smoothing
(n = 1,285 ) (n = 179 ) a. Variance of ΔNI*a nonCGPI<CGPI 0.011 0.009 0.034
b. Variance of ΔNI*/ ΔCFO*b,c nonCGPI<CGPI 0.377 0.333 0.062
(n = 1,083) (n =125 )
c. Correlation between CFO* and TAC*d nonCGPI<CGPI -0.681 -0.580 1.938** 2. Managing Towards Earnings
Targets Prediction Period of 2005-2008 Wald-stat
(n =1,464 )
Frequency of Spose Negative -0.153 0.298 2005-2008 Panel B: Accruals Quality Prediction Non-CGPI CGPI t-statistic
(n = 1,073) (n =125 )
Standard deviation of residualsf nonCGPI>CGPI 0.159 0.054 7.160*** Panel C: Timely Loss Recognition Prediction Period of 2005-2008 t-statistic
(n = 1,208)
Coefficient on 𝛼!from Ball and Shivakumar (2005) regression modelg Positive 0.105 2.003***
**, *** Significant at p < 0.05, and p < 0.01, respectively. #Financial firms are excluded from the analysis of correlation between TAC and CFO model, level of discretionary accruals model, and timely loss recognition model. a ΔNI* is the variance of residuals from a regression of the ΔNI on the control variables. b ΔCFO* is the variance of residuals from a regression of the ΔCFO on the control variables c Variability of ΔNI* over ΔCFO* is the ratio of ΔNI* divided by ΔCFO*. d Correlation of ACC* and CFO* is the partial Spearman correlation between the residuals from the ACC and CFO regression. e Spos is an indicator variable set to one for observations for which the annual net income scaled by total assets is between 0 and 0.01 and set to zero otherwise. f Standards deviation of residuals from Dechow and Dichev (2002) accruals model, the regression is ∆𝑊𝐶!" = 𝛼! + 𝛼!𝐶𝐹𝑂!"!! + 𝛼!𝐶𝐹𝑂!" + 𝛼!𝐶𝐹𝑂!�!! + 𝜀!" g The regression is 𝑇𝐴𝐶!" = 𝛼! + 𝛼!𝐷𝐶𝐹𝑂!" + 𝛼!𝐶𝐹𝑂!" + 𝛼!𝐷𝐶𝐹𝑂!" ∗ 𝐶𝐹𝑂!" + 𝛼!𝐷𝐶𝐺𝑃𝐼 +𝛼!𝐷𝐶𝐺𝑃𝐼 ∗ 𝐷𝐶𝐹𝑂!" ∗ 𝐶𝐹𝑂!"

100
Table 4.10
Comparisons of Earnings Management, Accruals Quality and Timely Loss
Recognition between CGPI Firms and Non-CGPI Firms for Period of 2009-2012
2009-2012 Panel A: Indication of Earnings Management Prediction Non-CGPI CGPI Z-score 1. Earnings Smoothing
(n =1,498 ) (n =192 )
a. Variance of ΔNI*a nonCGPI<CGPI 0.010 0.005 0.000 b. Variance of ΔNI*/ ΔCFO*b,c nonCGPI<CGPI 0.537 0.478 0.879
(n =1,274 ) (n =136 )
c. Correlation between CFO*and TAC*d nonCGPI<CGPI -0.693 -0.645 1.070 2. Managing Towards Earnings
Targets Prediction Period of 2005-2012 Wald-stat
(n = 1,684)
Frequency of Spose Negative -0.182 0.292 2009-2012 Panel B: Accruals Quality Prediction Non-CGPI CGPI t-statistic
(n = 1,270 ) (n =136 )
Standard deviation of residualsf nonCGPI>CGPI 0.119 0.070 3.556*** Panel C: Timely Loss Recognition Prediction Period of 2005-2012 t-statistic
(n = 1,410)
Coefficient on 𝛼!from Ball and Shivakumar (2005) regression modelg Positive 0.085 2.315***
*, **, *** Significant at p < 0.1, p < 0.05, and p < 0.01, respectively. #Financial firms are excluded from the analysis of correlation between TAC and CFO model, level of discretionary accruals model, and timely loss recognition model. a ΔNI* is the variance of residuals from a regression of the ΔNI on the control variables. b ΔCFO* is the variance of residuals from a regression of the ΔCFO on the control variables c Variability of ΔNI* over ΔCFO* is the ratio of ΔNI* divided by ΔCFO*. d Correlation of ACC* and CFO* is the partial Spearman correlation between the residuals from the ACC and CFO regression. e Spos is an indicator variable set to one for observations for which the annual net income scaled by total assets is between 0 and 0.01 and set to zero otherwise. f Standards deviation of residuals from Dechow and Dichev (2002) accruals model, the regression is ∆𝑊𝐶!" = 𝛼! + 𝛼!𝐶𝐹𝑂!"!! + 𝛼!𝐶𝐹𝑂!" + 𝛼!𝐶𝐹𝑂!"!! + 𝜀!" g The regression is 𝑇𝐴𝐶!" = 𝛼! + 𝛼!𝐷𝐶𝐹𝑂!" + 𝛼!𝐶𝐹𝑂!" + 𝛼!𝐷𝐶𝐹𝑂!" ∗ 𝐶𝐹𝑂!" + 𝛼!𝐶𝐺𝑃𝐼 + 𝛼!𝐷𝐶𝐺𝑃𝐼 ∗ 𝐷𝐶𝐹𝑂!" ∗ 𝐶𝐹𝑂!"

101
Table 4.11
Regression Results of CGPI Vs. non-CGPI Firms for Value Relevance Analysis
Panel A: Price model Pit=α0+α1Eit+α2EBVit+εit
Period N α1 α2 Adj. R2
Cramer`s test (z-score)
CGPI 2005-2008 106 5.367 1.281 0.628
3.937*** 4.985*** 4.244***
2009-2012 135 12.599 0.536 0.857
12.342*** 1.635*
Non-CGPI 2005-2008 928 4.012 0.595 0.728
0.295 20.643*** 14.951***
2009-2012 1,169 10.809 0.667 0.723
27.29*** 8.367***
Panel B: Return model Rit=α0+α1 Eit/Pit-1 +α2 ΔEit/Pit-1 +εit
Period N α1 α2 Adj. R2
Cramer`s test (z-score)
CGPI 2005-2008 99 3.256 0.540 0.122
0.340 2.174** 0.358
2009-2012 131 2.003 -0.136 0.157
4.944*** -0.533
Non-CGPI 2005-2008 871 0.514 0.116 0.018
3.206*** 2.827*** 0.995
2009-2012 1,093 1.355 0.094 0.076
7.717*** 0.664
P!" is stock price of firm i (at three months after end of year t). E!" is earnings per share for firm i during period t. EBV!" is equity book value per share for firm i at the end of period t. R!" stock return firm i for year t (annual return from month -9 to +3). ∆E!" is change in annual earnings per share. P!"!! is stock price at the beginning of nine months prior to fiscal year end. All continuous variables are winsorized at 1% top and bottom. *, **, *** Significant at p < 0.1, p < 0.05, and p < 0.01, respectively.
4.4.2. The Effect of Auditor Type
I also examine whether the type of auditors as the proxy of audit quality
affect the accounting quality during IFRS convergence. Since a substantial
research findings suggest that a higher quality audit of larger accounting firms
(Francis, 2004), I classify sample firms based on whether they are audited by Big
4 or non-Big 4 auditors and examine its effect on accounting quality. I do not
analyze the earnings management indicator`s models in this section because
auditor type is used as control variable for that metrics in the main analyzes.

102
Table 4.12 and Table 4.13 present the results of accruals quality and timely
loss recognition, and value relevance, respectively. It shows that the group of
firms audited by Big 4 has the same level of accruals quality and timely loss
recognition in both periods. Significant improvement only found in value
relevance. On the contrary, I find significant change in all measurements for the
group of firms audited by non-Big 4. Comparing between groups, although the
group of firms audited by Big 4 has better indicators in both periods, except for
value relevance, the group of non-Big has more observable improvement in the
latter period.
Of these findings, I confirm the positive association between audit quality
and accounting quality. However, since obvious improvement of accounting
quality is found in the group of firms audited by non-Big 4, I conclude that this
factor does not drive the results in the main analyses.
Table 4.12
Regression Results of Big 4 Vs. Non-Big 4
for Accruals Quality and Timely Loss Recognition Analysis
Panel A: Accruals quality N Std. dev. of residuals t-statistic Big 4 2005-2008 301 0.109 0.321 2009-2012 315 0.097 Non-Big 4 2005-2008 897 0.157 3.493*** 2009-2012 1,091 0.115 Panel B: Timely loss recognition N Coefficient of 𝛼! t-statistic Big 4 (2005-2012) 643 -0.242 -1.419 Non-Big 4 (2005-2012) 1,683 -0.543 -6.616** 2005-2008 (Non-Big 4 vs. Big 4) 1,074 -0.494 -4.097*** 2009-2012 (Non-Big 4 vs. Big 4) 1,253 -0.194 -1.517 **, *** Significant at p < 0.05 and p < 0.01, respectively.

103
Table 4.13
Regression Results of Big 4 vs. Non-Big 4 for Value Relevance Analysis
Panel A: Price model Pit=α0+α1Eit+α2EBVit+εit
Period N α1 α2 Adj. R2 Cramer`s test (z-score)
Big 4 2005-2008 272 7.945 0.673 0.600
0.505 14.777*** 4.827***
2009-2012 344 10.96 0.688 0.577
12.461*** 2.929***
Non Big 4 2005-2008 762 3.391 0.703 0.794
1.391 18.066*** 18.264***
2009-2012 960 11.359 0.610 0.813
31.384*** 8.247***
Panel B: Return model Rit=α0+α1 Eit/Pit-1 +α2 ΔEit/Pit-1 +εit
Period N α1 α2 Adj. R2 Cramer`s test (z-score)
Big 4 2005-2008 263 0.494 -0.026 0.011
2.593*** 2.027* -0.139
2009-2012 320 2.121 -0.311 0.108
6.162*** -1.122
Non Big 4 2005-2008 707 0.605 0.125 0.021
2.643*** 2.697*** 0.904
2009-2012 904 1.220 0.177 0.075
6.567*** 1.217
P!" is stock price of firm i (at three months after end of year t). E!" is earnings per share for firm i during period t. EBV!" is equity book value per share for firm i at the end of period t. R!" stock return firm i for year t (annual return from month -9 to +3). ∆E!" is change in annual earnings per share. P!"!! is stock price at the beginning of nine months prior to fiscal year end. *, *** Significant at p < 0.1 and p < 0.01, respectively.
4.4.3. The Effect of Firm Size
Firm size has been examined as a factor related to accounting quality.
For value relevance, several prior studies show that accounting information
is more value relevant for smaller firm than larger firm because larger firms
receive more media coverage and other forms of public attention than
smaller firms do, and consequently, stock prices of larger firms either
incorporate more public information about the firm`s future prospect or
aggregate such information more quickly than smaller firms, both of which
will lead to a smaller earnings response coefficient in larger firms (Chen et
al., 2001). However, Chen et al. (2001) and Alali and Foote (2012) find

104
different results on effect of firm size on value relevance from return model
and price model. Based on return model, accounting information of smaller
firms is more value relevant than larger firms, while the finding based on
price model shows an opposite result.
I include all sample firms when examining the effect of firm size on
accruals quality and timely loss recognition. However, I exclude firms with
negative earnings to examine the effect on value relevance, since the result
from return model shows that this group is not value relevant (see section
4.3.4). Then, I make a partition of the sample equally into two groups
according to the magnitude of firm`s market value. By estimating the model
of accruals quality, timely loss recognition, price and return model, I
compare the change of accounting quality within group of small and large
firms before and after accounting standards change, then I compare the
accounting quality between group of small and large firms. However, I do
not analyze the earnings management indicator`s models because firm size
has used as control variable for these metrics in the main analysis.
Table 4.14 and Table 4.15 show the results from regression model of
large firms and small firms. Overall, I get similar figure from these groups in
all indicators. That is, both of the groups have significant changes in accruals
quality, timely loss recognition, and value relevance (significant result is
found in return model only). Specifically, in the period after accounting
standards change, large firms and small firms have better accruals quality
and higher value relevance, but recognize losses in less timely manner.
Nevertheless, the group of large firms has better accruals quality and higher
value relevance in both periods.

105
These results indicate that, in general, the accounting quality of firms
in the latter period has changed, not only for large firms but also for small
firms. Therefore, I infer that the results in the main analyses is not driven by
the changes in accounting quality of large firms because I also find
significant changes for group of small firms.
Table 4.14
Regression Results of Large firms Vs. Small Firms
for Accruals Quality and Timely Loss Recognition Analysis
Panel A: Accruals quality N Std. dev. of residuals t-statistic Large firms 2005-2008 590 0.137 2.742** 2009-2012 671 0.094 Small firms 2005-2008 607 0.158 2.265** 2009-2012 735 0.124 Panel B: Timely loss recognition N Coefficient of 𝛼! t-statistic Large firms (2005-2012) 1,096 -0.672 -5.135*** Small firms (2005-2012) 1,231 -0.470 -4.783*** 2005-2008 (small vs large firms) 1,074 -0.338 -2.907*** 2009-2012 (small vs large firms) 1,253 -0.540 -4.124***
**, *** Significant at p < 0.05 and p < 0.01, respectively.
Table 4.15
Regression Results of Large Firms Vs. Small Firms for Value Relevance Analysis
Panel A: Price model Pit=α0+α1Eit+α2EBVit+εit
Period N α1 α2 Adj. R2
Cramer`s test (z-score)
Large Firms 2005-2008 347 6.035 0.364 0.731
6.230*** 14.510*** 4.266*** 2009-2012 622 13.754 0.613 0.869 33.125*** 6.569*** Small Firms 2005-2008 481 4.110 0.464 0.687
0.000 15.287*** 7.872***
2009-2012 487 4.976 0.204 0.687
17.251*** 3.675***
(Continued on next page)

106
Table 4.15 (continued)
Panel B: Return model Rit=α0+α1 Eit/Pit-1 +α2 ΔEit/Pit-1 +εit
Period N α1 α2 Adj. R2
Cramer`s test (z-score)
Large Firms 2005-2008 331 3.516 -0.078 0.105
2.841*** 6.160*** -0.322 2009-2012 577 4.903 -0.827 0.268 13.143*** -3.287*** Small Firms 2005-2008 445 0.603 0.243 0.052
2.519*** 1.980** 1.619
2009-2012 462 2.272 -0.226 0.145
7.939*** -1.250
P!" is stock price of firm i (at three months after end of year t). E!" is earnings per share for firm i during period t. EBV!" is equity book value per share for firm i at the end of period t. R!" stock return firm i for year t (annual return from month -9 to +3). ∆E!" is change in annual earnings per share. P!"!! is stock price at the beginning of nine months prior to fiscal year end. **, *** Significant at p < 0.05, and p < 0.01, respectively.
4.4.4. The Effect of Negative Earnings in the Value Relevance Analysis
Hayn (1995) finds that firms with positive earnings have a
significantly higher earnings response coefficient than those with negative
earnings. Furthermore, some other studies also find that equity book value
becomes more relevant than earnings when firms have negative earnings
(Burgstahler and Dichev, 1997; Collins et al., 1997; Chen et al., 2001).
Widodo Lo (2012), using sample of Indonesian listed firms, finds evidence
based on price model that equity book values and earnings are value relevant
when both equity book values and earnings are positive, and not value
relevant when both equity book values and earnings are negative. Therefore,
in this analysis, I expect that accounting information of firms with positive
earnings is more value relevant than firms with negative earnings before and
after accounting standards change. Different from Widodo Lo (2012), this
study uses price model and return model to analyze the effect of positive vs.
negative earnings on value relevance.
107
Table 4.16 presents the results analysis of negative vs. positive
earnings effect on the value relevance of accounting information. From price
model analysis, for group of firms with negative earnings, the coefficients of
earnings in both periods are negative and not significant, but the coefficients
of equity book value are positive and significant. This result suggests that
book value become more relevant for firms with negative earnings. The
adjusted R-square decreases from 42.3% in the previous period to 31.4% in
the latter period. From group of firms with positive earnings, I find results as
predicted. The coefficients on earnings and equity book value are positive
and significant with adjusted R-squared more than 70% for both periods. As
predicted by the theory, the earnings variable plays a significant role
together with the equity book value variable for firms with positive earnings.
The adjusted R-squared also increase significantly from 70.5% in the
previous period to 78.4% in the latter period. This result is consistent with
Widodo Lo (2012) findings.
The results from return model for groups of negative earnings show
that none of the coefficient is significant for both periods, and the model is
also insignificant. On the contrary, for positive earnings groups, I find a
significant positive coefficient of earnings, which substantially increase from
1.400 in the previous period to 3.207 in the latter period. The adjusted R-
square also significantly increases from the previous (5%) to the latter period
(17.9%). However, I only find a significant coefficient of earnings change in
latter period in the positive earnings group with negative sign.
The finding of less informative of loss is consistent with the results of
previous studies. Hayn (1995) and Chen et al. (2001) also find a weaker

108
response of losses. Hayn (1995) finds an extremely low and insignificant
earnings coefficient when only loss firms are considered. Further, she finds
that the coefficient and R-squared decline monotonically with the number of
years in which the firm experiences a loss. Chen et al. (2001), using sample
of China market, also find that negative earnings is not value relevant. They
argue that investors perceive negative earnings as non-sustainable and focus
on information reflected in equity book value.
Table 4.16
Regression Results of firms with Negative Vs. Positive Earnings
for Value Relevance Analysis
Panel A: Price model Pit=α0+α1Eit+α2EBVit+εit
Period N α1 α2 Adj. R2 Cramer`s test
(z-score) Negative Earnings 2005-2008 206 -0.780 0.744 0.423
0.138 -1.178 10.206***
2009-2012 195 -3.181 2.134 0.314
-0.861 8.564***
Positive Earnings 2005-2008 828 5.068 0.461 0.705 4.686***
20.314*** 8.750***
2009-2012 1,109 12.446 0.394 0.784
33.908*** 4.953***
Panel B: Return model Rit=α0+α1 Eit/Pit-1 +α2 ΔEit/Pit-1 +εit
Period N α1 α2 Adj. R2 Cramer`s test
(z-score) Negative Earnings 2005-2008 194 -0.474 -0.128 0.004
0.702 -1.243 -0.515 2009-2012 185 -0.204 0.224 -0.006 -0.518 0.880 Positive Earnings 2005-2008 776 1.400 0.002 0.050
4.946*** 4.867*** 0.014 2009-2012 1,039 3.207 -0.410 0.179 13.559*** -2.660***
P!" is stock price of firm i (at three months after end of year t). E!" is earnings per share for firm i during period t. EBV!" is equity book value per share for firm i at the end of period t. R!" stock return firm i for year t (annual return from month -9 to +3). ∆E!" is change in annual earnings per share. P!"!! is stock price at the beginning of nine months prior to fiscal year end. All continuous variables are winsorized at 1% top and bottom. *** Significant at p < 0.01.

109
CHAPTER V
SUMMARY AND CONCLUSIONS
The objective of this study is to examine the accounting information quality in
the Indonesian market during the IFRS convergence process. Specifically, I compare
whether there is a change in term of earnings management, accruals quality, timely
loss recognition, value relevance, and accounting comparability. Using data of firms
listed on IDX, this study compares the quality of accounting information in 2005-
2008 and 2009-2012. I analyze the accounting-based attributes by adopting earnings
management, accruals quality, and timely loss recognition constructs. To complement
these accounting-based constructs in strengthening the findings, I analyze the value
relevance as a market-based construct. In addition, I also analyze the accounting
comparability construct as the other attribute of accounting quality.
Overall, the results of this study show that the accounting quality has changed
after the recent revisions of accounting standards. The findings on earnings
smoothing, managing towards earnings targets, accruals quality, and value relevance
indicate that the firms in the period of 2009-2012 have higher earnings quality.
However, the finding on income smoothing is somewhat weak evidence, only one of
three measures shows a significant change. The result on timely loss recognition
shows a significant change, but a negative nuance. It denotes that the period after
accounting standards change is less timely loss recognition. This finding confirms
that IFRS standards do not improve the conservatism of financial reporting. Finally,
for accounting comparability measurements, I find insignificant difference between
the two periods.

110
From the additional analyses, I find that the group of non-CGPI firms and the
group of firms audited by non-Big 4 has more obvious changes of accounting quality
in the period after accounting standards change relatively compared to group of CGPI
firms and group of firms audited by Big 4, respectively. However, for firm size, I find
significant changes in both of the large firms group and small firms group. In sum, I
conclude that the groups of firms, which perceived to have higher accounting quality
(i.e. CGPI firms, firms audited by Big 4, large firms), do not drive the results in the
main analyses. Then, I also confirm the prior research`s evidence on the less
informative of negative earnings.
These findings contribute to the ongoing debate of IFRS convergence effect on
accounting quality, especially in the emerging markets. The implication is that the
changes of the accounting standards have caused some improvements in accounting
quality of financial reporting in the Indonesian market. Therefore, this evidence could
convince the standards setter and financial reporting users that IFRS convergence
gives their expected benefits, particularly on accounting quality.
However, the results of this study are still subject to several limitations.
Although the results are robust to some sensitivity tests, I acknowledge that there are
some other factors that may influence the accounting quality change during sample
period. Including some other control variables and applying other methodologies to
analyze the accounting quality may give different insights about the impact of
accounting standards change on accounting quality. Comparing accounting quality
between IAS period and IFRS period would be also fruitful to get more pictures of
adoption effects in the Indonesian market. Finally, the design challenges inherent in
measuring accounting comparability is the other limitation of this study.

111
References Ahmed, A., M. Neel, and D. Wang. 2013. Does mandatory adoption of IFRS improve
accounting quality? Preliminary evidence. Contemporary Accounting Research
30 (4): 1344-1372.
Alali, F. A., and P. S. Foote. 2012. The value relevance of International Financial
Reporting Standards: empirical evidence in an emerging market. The
International Journal of Accounting 47 (1): 85-108.
Aubert, F., and G. Grudnitski. 2011. The impact and importance of mandatory
adoption of International Financial Reporting Standards in Europe. Journal of
International Financial Management and Accounting 22 (1): 1-26.
Ball, R. 2006. International Financial Reporting Standards (IFRS): pros and cons for
investors. Accounting and Business Research 36 (Special issue): 5-27.
Ball, R., A. Robin, and J. Wu. 2003. Incentives versus standards: properties of
accounting income in four East Asian countries. Journal of Accounting and
Economics 36 (1-3): 235-270.
Ball, R., and L. Shivakumar. 2005. Earnings quality in UK private firms: comparative
loss recognition timeliness. Journal of Accounting and Economics 39 (1): 83–
128.
Ball, R., and P. Brown. 1968. An empirical evaluation of accounting income
numbers. Journal of Accounting Research 6 (2): 159-178.
Barth, M. E, W. H. Beaver, and W. R. Landsman. 1998. Relative valuation roles of
equity book value and net income as a function of financial health. Journal of
Accounting and Economics 25 (1): 1–34.

112
Barth, M. E., W. H. Beaver, and W. R. Landsman. 2001. The relevance of the value
relevance literature for financial accounting standard setting: another View.
Journal of Accounting and Economics 31 (1): 77-104.
Barth, M. E., W. Landsman, and M. Lang. 2008. International accounting standards
and accounting quality. Journal of Accounting Research 46 (3): 467- 498.
Barth, M. E., W. Landsman, M. Lang, and C. Williams. 2012. Are IFRS-based and
US GAAP-based accounting amounts comparable? Journal of Accounting and
Economics 54 (1): 68–93.
Barth, M. E. and K. Schipper. 2008. Financial reporting transparency. Journal of
Accounting, Auditing, and Finance 23 (2): 173-190.
Basu, S. 1997. The conservatism principle and asymmetric timeliness of earnings.
Journal of Accounting and Economics 24 (1): 3-37.
Belkaoui, A. 2004. Accounting Theory (5th ed.), Thomson, London, England.
Bhattacharya, U., H. Daouk, and M. Welker. 2003. The world price of earnings
opacity. The Accounting Review 78(3): 641-678.
Brochet, F., A. D. Jagolinzer, and E. J. Riedl. 2013. Mandatory IFRS adoption and
financial statement comparability. Contemporary Accounting Research 30 (4):
1373-1400.
Brown, P. 2013. Some observations on research on the benefits to nations of adopting
IFRS. The Japanese Accounting Review 3 (2013): 1-19.
Burgstahler, D., and I. Dichev. 1997. Earnings, adaptations and equity value. The
Accounting Review 72 (2): 187-215.
Cahyonowati, N., and D. Ratmono. 2012. Adopsi IFRS dan relevansi nilai informasi
akuntansi. Jurnal Akuntansi dan Keuangan 14 (2): 105-115.
Cascino, S., and J. Gassen. 2014. What drives the comparability effect of mandatory

113
IFRS adoption? Review of Accounting Studies. Forthcoming.
Chand, P., and C. Patel. 2011. Achieving global convergence of financial reporting
standards: implications from the South Pacific region. Studies in Managerial
and Financial Accounting (Book series vol.22).
Chen, C., J. P. Chen, and S. X. Su. 2001. Is accounting information value-relevant in
the emerging Chinese stock market? Journal of International, Auditing and
Taxation 10 (1): 1-22.
Chen, H., Q. Tang, Y. Jiang, and Z. Lin. 2010. The role of International Financial
Reporting Standards in accounting quality: evidence from the European Union.
Journal of International Financial Management and Accounting 21 (3): 220-
278.
Chebaane, S., and H. B. Othman. 2014. The impact of IFRS adoption on value
relevance of earnings and book value of equity: the case of emerging markets in
African and Asian regions. Procedia-Social and Behavioral Sciences 145:70-
80.
Choi, F., and G. Mueller. 1998. International Accounting. Prentice Hall, Englewood
Cliffs, New Jersey.
Chua, Y. I., C. S. Cheong, and G. Gould. 2012. The impact of mandatory IFRS
adoption on accounting quality: evidence from Australia. Journal of
International Accounting Research 11(1): 119-146.
Clarkson, P., J. D. Hanna, G. D. Richardson, D. Gordon, and R. Thompson. 2011.
The impact of IFRS adoption on the value relevance of book value and
earnings. Journal of Contemporary Accounting and Economics 7: 1-17.
Collins, D., E. Maydew, and I. Weiss. 1997. Changes in the value-relevance of
earnings and book values over the past forty years. Journal of Accounting and

114
Economics 24 (1): 39-67.
Cramer, J. S. 1987. Mean and variance of R2 in small and moderate samples. Journal
of Econometrics 35 (2): 253-266.
Daske, H., L. Hail, C. Leuz, and R. S. Verdi. 2008. Mandatory IFRS reporting around
the world: early evidence on the economic consequences. Journal of
Accounting Research 46 (5): 1085-1142.
Dechow, P. 1994. Earnings and cash flows as measures of firm performance: the role
of accounting accruals. Journal of Accounting and Economics 18 (1): 3-42.
Dechow, P., and C. M Schrand. 2004. Earnings Quality. CFA Institute.
Dechow, P., and I. Dichev. 2002. The quality of accruals and earnings: the role of
accruals estimation errors. The Accounting Review 77 (Supplement): 35-59.
Dechow, P., S. P. Kothari, and R. L. Watts. 1998. The relation between earnings and
cash flows. Journal of Accounting and Economics 25 (2): 133-168.
Dechow, P.M., W. GE, and C.M. Schrand. 2009. Understanding earnings quality: a
review of the proxies, their determinants and their consequences. Journal of
Accounting and Economics 50 (3): 344-401.
DeFond, M., X. Hu, M. Hung, and S. Li. 2011. The impact of IFRS adoption on
foreign mutual fund ownership: the role of comparability. Journal of
Accounting and Economics 51 (3): 240-258.
De Franco, G., S. P. Kothari, and R. Verdi. 2011. The benefits of firm comparability.
Journal of Accounting Research 49 (4): 895-931.
Deloitte Touche Tohmatsu. 2012. IFRS in your pocket 2012. Available at
http://www.deloitte.com/assets/Dcom-
Azerbaijan/Local%20Assets/Documents/IFRSs_ in_your_pocket_2012.pdf
Dimitropoulos, P. E., D. Asteriou, D. Kousenidis, and S. Leventis. 2013. The impact

115
of IFRS on accounting quality: evidence from Greece. Advances in Accounting
29(1): 108-123.
Easton, P. D., and T. S. Harris. 1991. Earnings as an explanatory variable for returns.
Journal of Accounting Research 29 (1): 19-36.
Famila, M. A. 2012. Perbandingan kualitas laba antara periode sebelum dan sesudah
pengadopsian IFRS di Indonesia. Undergraduate Thesis, University of
Indonesia.
Florou, A., and P. F. Pope. 2012. Mandatory IFRS adoption and institutional
investment decision. The Accounting Review 87 (6): 1993-2025.
Francis, J.R. 2004. What do we know about audit quality? The British Accounting
Review 36 (4): 345-368.
Francis, J., R. LaFond, P. M. Olsson, and K. Schipper. 2004. Costs of equity and
earnings attributes. The Accounting Review 79 (4): 967-1010.
Guay, W., S. P. Kothari, and R. L. Watts. 1996. A market-based evaluation of
discretionary accruals models. Journal of Accounting Research 34 (1): 83-105.
Handayani, Y. P. 2014. Analisis perbedaan manajemen laba sebelum dan sesudah
penerapan standar akuntansi keuangan (konvergensi IFRS). Undergraduate
Thesis, Padang State University.
Hayn, C. 1995. The information content of losses. Journal of Accounting and
Economics 20 (2): 125-153.
Hill, H., and T. Shiraishi. 2007. Indonesia after the Asian crisis. Asian Economic
Policy Review 2 (1): 123-141.
Houqe, M. N., T. Van Zijl, K. Dunstan, and A. K. M. W. Karim. 2012. The effect of
IFRS adoption and investor protection on earnings quality around the world.
The International Journal of Accounting 47(3): 333-355.

116
Horton, J., G. Serafeim, and I. Serafeim. 2013. Does mandatory IFRS adoption
improve the information environment? Contemporary Accounting Research 30
(1): 388-423.
International Accounting Standards Board (IASB). 2010. The Conceptual Framework
for Financial Reporting. London, UK: IASB.
International Accounting Standards Committee (IASC). 1989. Framework for the
Preparation and Presentation of Financial Statements. London, UK: IASC.
International Financial and Reporting Standards Foundation. 2013. About the IFRS
Foundation and the IASB. Available at http://www.ifrs.org/The-
organisation/Pages/IFRS-Foundation-and-the-IASB.aspx.
Indonesian Institute of Accountants. 2008. Konvergensi Standar Akuntansi Keuangan
(SAK) Indonesia ke IFRS. Siaran Pers IAI. Available at
http://www.iaiglobal.or.id/berita/detail.php?id=19
Indonesian Institute for Corporate Governance. 2012. Available at
http://iicg.org/v25/.
Ismail, W. A. W., A. K. Khairul, T. Zijl, and K. Dunstan. 2013. Earnings quality and
the adoption of IFRS-based accounting standards: evidence from an emerging
market. Asian Review of Accounting 21 (1): 53-73.
Jayaraman, S., and R. Verdi. 2013. Economic integration, IFRS adoption and
accounting comparability. Working paper, available at
http://ssrn.com/abstract=228699
Jeanjean, T., and H. Stolowy. 2008. Do accounting standards matter? An exploratory
analysis of earnings management before and after IFRS adoption. Journal of
Accounting and Public Policy 27(6): 480-494.

117
Johnson, M. F. 1999. Business cycles and the relation between security returns and
earnings. Review of Accounting Studies 4 (2): 93-117.
Johnson, V.E., I.K. Khurana, and J.K. Reynolds. 2002. Audit-firm tenure and the
quality of financial reports. Contemporary Accounting Research 19 (4): 637-
660.
Kent, P., J. Routedge, and J. Stewart. 2010. Innate and discretionary accruals quality
and corporate governance. Accounting and Finance 50 (1): 171-195.
Kim, Y., and S. Li. 2010. Mandatory IFRS adoption and intra-industry information
transfers. Working paper, Leavey School of Business, Santa Clara University,
Santa Clara.
Kothari, S., and J. Zimmerman. 1995. Price and return models. Journal of Accounting
and Economics 20 (2): 155-192.
Kusuma, I. 2005. Indonesia. In S.M. Saudagaran (ed.), Asian Accounting Handbook:
A User`s Guide to the Accounting Environment in 16 Countries. Singapore:
Thompson Learning.
Lang, M., J. S. Raedy, and W. Wilson. 2006. Earnings quality and cross listing: are
reconciled earnings comparable to U.S. earnings. Journal of Accounting and
Economics 42 (2): 255–283.
Lang, M., M. Maffett, and E. Owens. 2010. Earnings comovement and accounting
comparability: the effects of mandatory IFRS adoption. Working paper,
University of North Carolina. Available at http://ssrn.com/abstract=1676937.
Levitt, A. 1998. The importance of high quality accounting standards. Accounting
Horizons 12 (1): 79-82.
Li, S. 2010. Does mandatory adoption of International Financial Reporting Standards
in the European Union reduce the cost of equity capital? The Accounting

118
Review 85 (2): 607-636.
Liang, J., and Y. G. Shan. 2013. Do corporate governance impact on earnings
quality? Evidence from IFRS adoption in European Union. Financial Markets
and Corporate Governance Conference. Available at SSRN:
http://ssrn.com/abstract=2215424.
Liao, Q., T. Sellhorn, and H. A. Skaife, 2012. The cross-country comparability of
IFRS earnings and book values: evidence from France and Germany. Journal of
International Accounting Research 11 (1): 155–184.
Liu, C., L. J. Yao, N. Hu, and L. Liu. 2011. The impact of IFRS on accounting
quality in a regulated market: an empirical study of China. Journal of
Accounting, Auditing and Finance 26 (4): 659-676.
Maradona, A. F., and P. Chand. 2014. Development of accounting standards and the
process of convergence with International Financial Reporting Standards
(IFRS) in Indonesia. Working paper. Available at
http://criticalperspectivesonaccounting.com/wp-content/uploads/2014/06/paper-
cpa-069.pdf.
Myers, J. N., L. A. Myers, and D. J. Skinner. 2007. Earnings momentum and earnings
management. Journal of Accounting, Auditing, and Finance 22 (2): 249-284.
Ohlson, J. A. 1995. Earnings, book values and dividends in security valuation.
Contemporary Accounting Research 11 (2): 661-687.
Ozkan, N., Z. Singer, and H. You. 2012. Mandatory IFRS adoption and the
contractual usefulness of accounting information in executive compensation.
Journal of Accounting Research 50 (4): 1077-1107.
Paananen, M. 2008. The IFRS adoption’s effect on accounting quality in Sweden.
Working paper at University of Hertfordshire, UK.

119
Paananen, M. and H. Lin. 2009. The development of accounting quality of IAS and
IFRS over time: the case of Germany. Journal of International Accounting
Research 8 (1): 31-55.
Paglietti, P. 2009. Investigating the effects of the EU mandatory adoption of IFRS on
accounting quality: evidence from Italy. International Journal of Business and
Management 4 (12): 3-18.
Pelucio-Grecco, M. C., C. M. S. Geron, G. B. Grecco, and J. P. C. Lima. 2014. The
effect of IFRS on earnings management in Brazilian non-financial public
companies. Emerging Markets Review 21: 42-66.
Pinnarwan, D., Hodge, M. and Irawan, M. (2012) IFRS and Indonesian GAAP
(PSAK): similarities and differences.
http://www.pwc.com/id/en/publications/assets/ifrs-psak-comparison-2012.pdf
(Accessed 2 September 2013).
Report on The Observance of Standards and Codes Indonesia-Accounting and
Auditing. 2010. Available at http://www.imf.org/external/NP/rosc/rosc.aspx.
Rudra, T., and D. Bhattacharjee. 2012. Does IFRS influence earnings management?
Evidence from India. Journal of Management Research 4(1): 1-13.
Samarasekera, N., M. Chang, and A. Tarca. 2012. IFRS and accounting quality: the
impact of enforcement. Working paper. Available at
http://ssrn.com/abstract=2183061.
Schipper, K., and L. Vincent. 2003. Earnings quality. Accounting Horizons 17
(Suplement): 97-110.
Sinaga, R. U., and E. T. Wahyuni. 2014. The emerging accounting profession in
Indonesia: building stronger cooperation between Australia and Indonesia. The
Accounting Profession`s Engagement with Asia. Chartered Accountants

120
Australia and New Zealand, Sidney, Australia.
Tempo. 2014. Bright outlook for capital market: IDX director. Available at
http://en.tempo.co/read/news/2014/09/18/056607853/Bright-Outlook-for-
Capital-Market-IDX-Director.
Van Tendeloo, B., and A. Vanstraelen. 2005. Earnings management under German
GAAP and IFRS. European Accounting Review 14 (1): 155-180.
Vieira, R. B., V. A Martins, A. Machado, and J. C. A. Domingues. 2011. Impacts of
partial adoption of IFRS in Brazil: effects on financial information quality of
publicly traded companies. British Journal of Economics, Finance and
Management Sciences 1 (2): 93-112.
Wang, C. 2014. Accounting standards harmonization and financial statement
comparability: evidence from transnational information transfer. Journal of
Accounting Research 52 (4): 955-992.
Wang, Y., and M. Campbell. 2012. Corporate governance, earnings management, and
IFRS: empirical evidence from Chinese domestically listed companies.
Advances in Accounting 28 (1): 189-192.
Widodo Lo, E. 2012. The value relevance of accounting information in transition to
IAS/IFRS: the case of Indonesia. Jurnal Akuntansi and Manajemen 23 (2): 139-
151.
Wu, J. S., and I. Zhang. 2010. Accounting integration and comparability: evidence
from relative performance evaluation around IFRS adoption. Working paper,
University of Rochester, University of Minnesota - Twin Cities. Available at
http://ssrn.com/abstract=1650782.
Wulandari, T. R. 2014. Perubahan value relevance dalam informasi akuntansi setelah
adopsi IFRS: bukti perusahaan manufaktur yang terdaftar Bursa Efek Indonesia

121
(BEI). Proceeding of Simposium Nasional Akuntansi 17 Lombok-Indonesia.
Yip, R. Y. W., and D. Young. 2012. Does mandatory IFRS adoption improve
information comparability? The Accounting Review 87 (5): 1767-1789.
Zhang, Y., K. Uchida, and H. Bu. 2013. How do accounting standards and insiders`
incentives affect earnings management? Evidence from China. Emerging
Markets Review 16: 78-99.
Zhou, H., Y. Xiong, and G. Ganguli. 2009. Does the adoption of International
Financial Reporting Standards restrain earnings management? Evidence from
an emerging market. Academy of Accounting and Financial Studies Journal 13:
43-56.