Embed Size (px)
Citation preview

Complimentary MethodsComplimentary Methods
Today I�m going to briefly discuss some structuralToday I�m going to briefly discuss some structuralcharacterization techniques that are complimentarycharacterization techniques that are complimentaryto X-ray powder diffraction.to X-ray powder diffraction.
�� Neutron DiffractionNeutron Diffraction�� Electron DiffractionElectron Diffraction�� X-ray Fluorescence, EDAX and ElectronX-ray Fluorescence, EDAX and Electron
Microprobe AnalysisMicroprobe Analysis�� EXAFS and XANESEXAFS and XANES�� Pair Distribution Function (PDF) AnalysisPair Distribution Function (PDF) Analysis

Neutron DiffractionNeutron DiffractionWe�ve talked about X-ray and neutron diffractionWe�ve talked about X-ray and neutron diffraction
throughout the quarter as though they werethroughout the quarter as though they wereinterchangableinterchangable. The basic concept is the same though. The basic concept is the same thoughthere are important distinctions between the two. Let�sthere are important distinctions between the two. Let�sbegin with the begin with the DeBroglie DeBroglie relationship.relationship.
λλλλλλλλ = h/p = h/ = h/p = h/mvmv
but the kinetic energy, E, and velocity, v, of a particle arebut the kinetic energy, E, and velocity, v, of a particle arerelated by the expressionrelated by the expression
E = (1/2)mvE = (1/2)mv22 → → → → → → → → v = v = sqrtsqrt(2E/m)(2E/m)
combining the two relationships givescombining the two relationships gives
λλλλλλλλ = h/ = h/sqrtsqrt(2mE)(2mE)
finally for thermal neutrons from a reactor source thefinally for thermal neutrons from a reactor source theenergy of an electron is E = energy of an electron is E = kT kT so thatso that
λλλλλλλλ = h/ = h/sqrtsqrt(2kT)(2kT)
Typical values for a neutron reactor source are 300<T<400KTypical values for a neutron reactor source are 300<T<400Kand 1.0 A< and 1.0 A< λλλλλλλλ < 2.5 A < 2.5 A..

Reactor Reactor DiffractometersDiffractometers
Thermal Neutron Instruments at NISTThermal Neutron Instruments at NIST
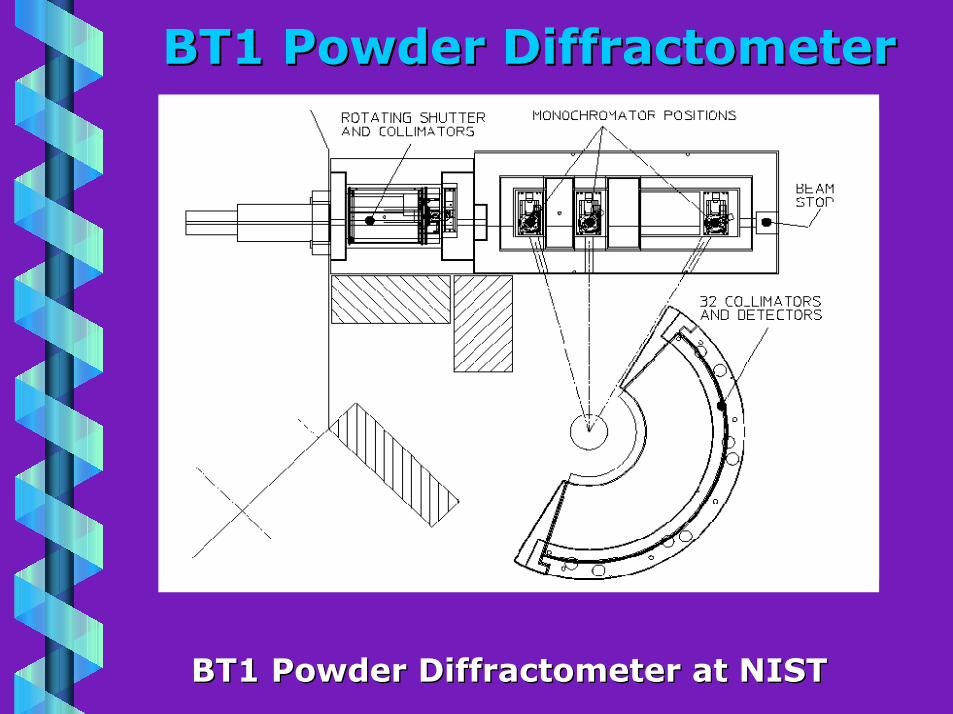
BT1 Powder BT1 Powder DiffractometerDiffractometer
BT1 Powder BT1 Powder Diffractometer Diffractometer at NISTat NIST

D2B Powder D2B Powder DiffractometerDiffractometer
D2B Powder D2B Powder Diffractometer Diffractometer at ILLat ILL

Instrumental Broadening: X-raysInstrumental Broadening: X-rays
This data corresponds to a Bruker D8 Diffractometer, equippedwith an incident beam Ge monochromator and Braun Position
Sensitive Detector (masked to use ~ 4° 2θ)
y = 9E-06x2 - 0.0005x + 0.0623
R2 = 0.9938
0
0.02
0.04
0.06
0.08
0.1
0.12
0.14
0.16
0.18
0 20 40 60 80 100 120 140
2-Theta
FWHM
Bragg Brentano
Debye-Scherrer

Instrumental Broadening: NeutronInstrumental Broadening: Neutron
This data corresponds to a High Resolution Powder NeutronDiffractometer located on Beamline BT1 at NIST. See
http://www.ncnr.nist.gov/instruments/bt1/bt1_for_xtal.htmlformore information.
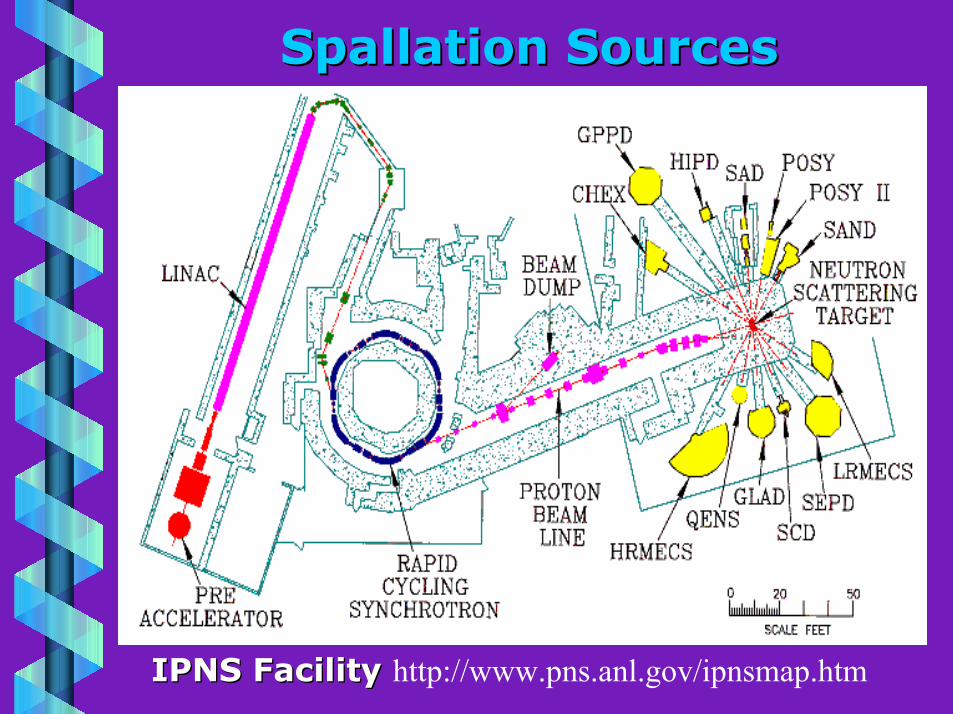
SpallationSpallation Sources Sources
IPNS Facility IPNS Facility http://www.pns.anl.gov/ipnsmap.htm

SpallationSpallation Sources Sources
The interaction between the accelerated proton andThe interaction between the accelerated proton andthe neutron target (the neutron target (PbPb). Typically each proton). Typically each proton
generates 10-15 neutrons. These neutrons then passgenerates 10-15 neutrons. These neutrons then passthrough a moderator (often water or liquid methane)through a moderator (often water or liquid methane)
to reduce their energy to a level comparable withto reduce their energy to a level comparable withthermal neutrons from a reactor. This image wasthermal neutrons from a reactor. This image was
taken from the taken from the website website of the Paul of the Paul Scherrer Scherrer Institute.Institute.http://www.psi.ch/index_e_sinq.shtml

TOF TOF Diffractometer Diffractometer (SEPD)(SEPD)
Since the neutrons come in pulses their energy (and henceSince the neutrons come in pulses their energy (and hencewavelength) can be determined by measuring the time itwavelength) can be determined by measuring the time it
takes for the neutron to hit the detector. Hence the spectratakes for the neutron to hit the detector. Hence the spectracome out in Time-of-Flight (TOF) rather than 2come out in Time-of-Flight (TOF) rather than 2θ. θ. TheThe
geometry of the experiment is still transmission and theregeometry of the experiment is still transmission and thereare sets of detector banks that record the diffractedare sets of detector banks that record the diffracted
neutrons. Typically the only moving parts will be choppersneutrons. Typically the only moving parts will be choppersthat let through the neutron pulses. This diagram shows thethat let through the neutron pulses. This diagram shows the
layout of the SEPD layout of the SEPD diffractometerdiffractometer at IPNS. at IPNS.

TOF TOF Diffractometer Diffractometer (GEM)(GEM)
Schematic Drawing of the GEM Schematic Drawing of the GEM Diffractometer Diffractometer at theat theISIS source in the UK. For more information see:ISIS source in the UK. For more information see:http://www.isis.rl.ac.uk/disordered/gem/gem_home.htm

Spallation vsSpallation vs. Reactor Sources. Reactor Sources
�� Advantages of TOF instruments on Advantages of TOF instruments on spallationspallationsourcessources
�� Better resolution at low d-Better resolution at low d-spacings spacings (high angle).(high angle).This is good for accurate structure refinements.This is good for accurate structure refinements.
�� Higher neutron flux, which translates to smallerHigher neutron flux, which translates to smallersamples and faster collection times.samples and faster collection times.
�� Politically feasible to build a Politically feasible to build a spallation spallation neutronneutronsource in the US.source in the US.
�� Advantages of Advantages of diffractometers diffractometers at reactor sourcesat reactor sources
�� Better resolution at high d-Better resolution at high d-spacings spacings (low angle).(low angle).This is good for magnetic studies, compoundsThis is good for magnetic studies, compoundswith large unit cells, with large unit cells, abab--initio initio structure solution.structure solution.
�� Data analysis and background modeling is moreData analysis and background modeling is morestraightforward.straightforward.

X-rays X-rays vsvs. Neutrons. Neutrons
�� Neutron beams are highly penetrating (penetrationNeutron beams are highly penetrating (penetrationdepths of centimeters-decimeters),depths of centimeters-decimeters),
�� X-rays are highly attenuated by matter (penetrationX-rays are highly attenuated by matter (penetrationdepths of microns-millimeters).depths of microns-millimeters).
�� Neutrons are scattered from nucleiNeutrons are scattered from nuclei
�� X-rays are scattered by electronsX-rays are scattered by electrons
�� Neutron scattering power varies irregularly withNeutron scattering power varies irregularly withatomic number and mass numberatomic number and mass number
�� X-ray scattering power varies smoothly with atomicX-ray scattering power varies smoothly with atomicnumbernumber
�� Neutrons have an intrinsic magnetic momentNeutrons have an intrinsic magnetic moment
�� X-rays have no magnetic momentX-rays have no magnetic moment

X-rays X-rays vsvs. Neutrons-Implications. Neutrons-Implications�� Neutron beams are highly penetrating (penetrationNeutron beams are highly penetrating (penetration
depths of centimeters-decimeters),depths of centimeters-decimeters),
�� Diffraction comes from entire sample. Values areDiffraction comes from entire sample. Values areless susceptible to surface and absorptionless susceptible to surface and absorptioneffects.effects.
�� Displacement (temperature) factors tend to beDisplacement (temperature) factors tend to bemore accurate.more accurate.
�� Larger samples are needed (optimal sampleLarger samples are needed (optimal samplevolume is on the order of 10 cmvolume is on the order of 10 cm3,3, roughly the roughly thesize of your finger)size of your finger)
�� Neutrons are scattered from nucleiNeutrons are scattered from nuclei
�� Neutron scattering factors do not fall off withNeutron scattering factors do not fall off withincreasing 2-theta.increasing 2-theta.
�� More reliable intensities for high angle peaksMore reliable intensities for high angle peaksallow for more reliable structure determinations.allow for more reliable structure determinations.

X-rays X-rays vsvs. Neutrons-Implications. Neutrons-Implications
�� Neutron scattering power varies irregularly withNeutron scattering power varies irregularly withatomic number and mass numberatomic number and mass number
�� Neutrons are more sensitive to light elements (H,Neutrons are more sensitive to light elements (H,N, O, F, C, etc.)N, O, F, C, etc.)
�� Neutrons are sensitive to isotope distributionsNeutrons are sensitive to isotope distributions�� See See http://www.http://www.ncnrncnr..nistnist..govgov/resources/n-lengths/ /resources/n-lengths/ forfor
more informationmore information�� Some elements strongly absorb neutrons andSome elements strongly absorb neutrons and
cannot be easily studied (B,cannot be easily studied (B, Cd Cd, , SmSm, , EuEu, , GdGd, , DyDy,,HfHf, , IrIr, Hg), Hg)
�� Some elements are essentially transparent toSome elements are essentially transparent toneutrons (V) or have negative scattering lengthsneutrons (V) or have negative scattering lengths((TiTi, , MnMn))
�� Neutrons have an intrinsic magnetic momentNeutrons have an intrinsic magnetic moment
�� Neutrons are used to determine orderedNeutrons are used to determine orderedmagnetic structures (Ferro-, magnetic structures (Ferro-, FerriFerri-, and-, andAntiferromagneticAntiferromagnetic materials) materials)

Electron DiffractionElectron DiffractionJust as with neutrons, electrons accelerated to a highJust as with neutrons, electrons accelerated to a high
velocity can have a wavelength in the Angstrom range,velocity can have a wavelength in the Angstrom range,through thethrough the DeBroglie DeBroglie relationship. relationship.
λλλλλλλλ = h/p = h/ = h/p = h/mvmv
but the kinetic energy, E, and velocity, v, of a particle arebut the kinetic energy, E, and velocity, v, of a particle arerelated by the expressionrelated by the expression
E = (1/2)mvE = (1/2)mv22 → → → → → → → → v = v = sqrtsqrt(2E/m)(2E/m)
combining the two relationships givescombining the two relationships gives
λλλλλλλλ = h/ = h/sqrtsqrt(2mE)(2mE)
The energy of an electron is related to the acceleratingThe energy of an electron is related to the acceleratingvoltage, V, by the relationship E = voltage, V, by the relationship E = eVeV. Upon correcting. Upon correctingfor relativistic effects we get an approximate relationshipfor relativistic effects we get an approximate relationshipbetween the wavelength (in Angstroms) and the Voltagebetween the wavelength (in Angstroms) and the Voltage
λλλλλλλλ = = sqrtsqrt(150/V)(150/V)
Typical values for a electron microscope are V ~ 100 kV andTypical values for a electron microscope are V ~ 100 kV andλλλλλλλλ ~ 0.04 Angstroms ~ 0.04 Angstroms

Transmission ElectronTransmission ElectronMicroscopeMicroscope
This is the CM300 Ultra-TwinField Emission Gun TEM.
It is located in the CampusCenter for Electron Optics(CEOF) in the MSEdepartment

X-rays X-rays vsvs. Electrons. Electrons
�� Electrons are highly attenuated by matterElectrons are highly attenuated by matter(penetration depth of (penetration depth of nanometersnanometers))
�� X-rays are strongly attenuated by matterX-rays are strongly attenuated by matter(penetration depths of microns-millimeters).(penetration depths of microns-millimeters).
�� Electrons beams can be highly focussedElectrons beams can be highly focussed
�� X-rays are difficult to focusX-rays are difficult to focus
�� Electron scattering power drops off strongly as aElectron scattering power drops off strongly as afunction of 2-thetafunction of 2-theta
�� X-ray scattering power drops off smoothly as aX-ray scattering power drops off smoothly as afunction of 2-thetafunction of 2-theta
�� Diffracted electrons can interact strongly with theDiffracted electrons can interact strongly with thelattice making it difficult to get reliable intensitieslattice making it difficult to get reliable intensities
�� X-ray intensities and peak positions can beX-ray intensities and peak positions can bedetermined with a great deal of accuracydetermined with a great deal of accuracy

X-rays X-rays vsvs. Electrons-Implications. Electrons-Implications�� Differences between collecting X-ray and electronDifferences between collecting X-ray and electron
diffraction datadiffraction data
�� Data collection done under high vacuumData collection done under high vacuum�� Data collection is usually transmission measurementData collection is usually transmission measurement
(TEM) on a thin sample or crystal(TEM) on a thin sample or crystal�� Diffraction patterns can be collected in short periodsDiffraction patterns can be collected in short periods
of time (seconds)of time (seconds)�� Data sets are often collected over a very limitedData sets are often collected over a very limited
angular range (angular range (±±±±±±±± 4 4°°°°°°°° 2-theta) 2-theta)�� Electron beam is usually focused onto a very smallElectron beam is usually focused onto a very small
micro-single crystalmicro-single crystal
�� Uses of Electron diffractionUses of Electron diffraction
�� You can obtain single crystal photographs from aYou can obtain single crystal photographs from amicrocrystalline microcrystalline substancesubstance
�� To determine unit cell dimensions and space groupTo determine unit cell dimensions and space groupsymmetry (good for finding superstructure peaks)symmetry (good for finding superstructure peaks)
�� Can be used to get single phase information from aCan be used to get single phase information from amultiphase samplemultiphase sample
Chemical AnalysisChemical Analysis�� When an element is excited by either X-rays or highWhen an element is excited by either X-rays or high
energy electrons above it�s absorption edge it willenergy electrons above it�s absorption edge it willlead to the fluorescent emission of x-rays of alead to the fluorescent emission of x-rays of aspecific energy. This is the principle upon whichspecific energy. This is the principle upon whichthe sealed Cu X-ray tube operates (Cu is bombardedthe sealed Cu X-ray tube operates (Cu is bombardedby electrons and emits Kby electrons and emits Kαααααααα1, K1, Kαααααααα2 and K2 and Kββββββββ x-rays). x-rays).
�� Since each element fluoresce X-rays of a specificSince each element fluoresce X-rays of a specificwavelength we can determine the elements presentwavelength we can determine the elements presentin a sample by analyzing the energy and intensity ofin a sample by analyzing the energy and intensity ofthe emitted X-rays.the emitted X-rays.
�� It�s fairly straightforward to use this technique forIt�s fairly straightforward to use this technique forqualitative and qualitative and semiquantitativesemiquantitative analysis. analysis.
�� Using standards it is possible to develop aUsing standards it is possible to develop acalibration curve and use this technique forcalibration curve and use this technique forquantitative elemental analysis.quantitative elemental analysis.

Excitation SourcesExcitation Sources�� X-rays (Fluorescence Analysis)X-rays (Fluorescence Analysis)
�� Gives an accurate analysis of bulk Gives an accurate analysis of bulk stoichiometrystoichiometry�� High vacuum is not utilized, so that it is easy toHigh vacuum is not utilized, so that it is easy to
change sampleschange samples�� Can be difficult to detect light elements, lowerCan be difficult to detect light elements, lower
limit of stability depends upon atmospherelimit of stability depends upon atmosphere�� Air (Z > 22 {Air (Z > 22 {TiTi})})�� He (Z > 13 {Al})He (Z > 13 {Al})�� Vacuum (Z > 9 {F})Vacuum (Z > 9 {F})
�� Electrons (EDAX, Electron Microprobe Analysis)Electrons (EDAX, Electron Microprobe Analysis)
�� Electrons can be focused which allows one toElectrons can be focused which allows one tocarry out elemental analysis on a specific spot orcarry out elemental analysis on a specific spot orcrystalline grain in a samplecrystalline grain in a sample
�� Done under high vacuumDone under high vacuum

Energy ResolutionEnergy Resolution�� Wavelength Wavelength DispersiveDispersive
�� Fluorescent radiation is diffracted off of a crystal andFluorescent radiation is diffracted off of a crystal andvarious wavelengths are separated via various wavelengths are separated via Bragg�s Bragg�s LawLaw((λλλλλλλλ=2dsin=2dsinθθθθθθθθ))
�� This technique gives very good resolution, but longerThis technique gives very good resolution, but longercounting times are needed in order to collect the datacounting times are needed in order to collect the dataover the necessary 2-theta range.over the necessary 2-theta range.
�� Energy Energy DispersiveDispersive
�� The fluorescent radiation passes directly from theThe fluorescent radiation passes directly from thesample to an energy sensitive detector (typically asample to an energy sensitive detector (typically aSiSi((LiLi) detector)) detector)
�� Often used with electron excitation sources. It is veryOften used with electron excitation sources. It is verycommon to have such an analyzer attached to ancommon to have such an analyzer attached to anelectron microscope.electron microscope.
�� Lower resolution, but much faster collection times.Lower resolution, but much faster collection times.�� SemiquantitativeSemiquantitative

Issues with Issues with QuantQuant. Analysis. Analysis�� Reliable quantitative analysis using Reliable quantitative analysis using fluoresence fluoresence methodsmethods
usually requires generation of a calibration curve usingusually requires generation of a calibration curve usingappropriate standards. The similarity of your standardsappropriate standards. The similarity of your standardsand the unknown sample determine the ultimate accuracyand the unknown sample determine the ultimate accuracyof the analysis. The need for standards comes aboutof the analysis. The need for standards comes aboutbecause of the following effects.because of the following effects.
�� Matrix AbsorptionMatrix Absorption
�� The The absoprtion absoprtion of X-rays coming into and out of theof X-rays coming into and out of thecrystal varies with composition.crystal varies with composition.
�� EnhancementEnhancement
�� Fluorescent radiation from one element (i.e. Fluorescent radiation from one element (i.e. NiNi) can be) can beabsorbed and induce fluorescence in other elementsabsorbed and induce fluorescence in other elementscontained in the sample (i.e. Fe)contained in the sample (i.e. Fe)

Elemental Analysis using an SEMElemental Analysis using an SEM�� The following specifications are taken from theThe following specifications are taken from the
MARC center in geology at Ohio State UniversityMARC center in geology at Ohio State University((http://www.geology.http://www.geology.ohioohio-state.-state.eduedu/marc/sem1./marc/sem1.htmhtm))
• High resolution (44 nm nm) imaging of surfaces
• Nondestructive analysis of large samples (up to 8" x 8" x1.5")
•• Energy Energy dispersive dispersive detectordetector
• Low voltage operation for analysis of insulating samples
• Quantitative chemical microanalysis with 0.1% detection0.1% detectionlimitslimits if no spectral overlaps
• Extensive automated image analysis based on size, shapeand chemical composition

Electron Microprobe AnalysisElectron Microprobe Analysis�� The following specifications are taken from theThe following specifications are taken from the
MARC center in geology at Ohio State UniversityMARC center in geology at Ohio State University((http://www.geology.http://www.geology.ohioohio-state.-state.eduedu/marc/ema1./marc/ema1.htmhtm))
� Quantitative chemical microanalysis with 0.01% detection0.01% detectionlimits routinely; limits routinely; 0.003% for some elements
� Four high selectivity wavelength dispersive spectrometersoperate simultaneously
� Rapid spectral acquisition with energyenergy dispersive dispersive analyzer analyzer
� Analysis of elements from boron to uranium
� High-resolution (1 um beam diameter1 um beam diameter) nondestructiveanalysis

Disordered MaterialsDisordered Materials
�� Many materials contain some type of disorder onMany materials contain some type of disorder onthe atomic scale. For example this is true of anythe atomic scale. For example this is true of anysolid solution. Some classes of materials wheresolid solution. Some classes of materials wheredisorder is an important element of the structuredisorder is an important element of the structureinclude:include:
�� Compound semiconductorsCompound semiconductors�� High Temperature SuperconductorsHigh Temperature Superconductors�� Ferroelectrics Ferroelectrics and and PiezoelectricsPiezoelectrics�� Magnetoresistant Magnetoresistant MaterialsMaterials�� AlloysAlloys
�� In such systems the crystal structure that oneIn such systems the crystal structure that oneobtains from powder or single crystal diffractionobtains from powder or single crystal diffractiongives an average structure. Other techniques aregives an average structure. Other techniques areneeded to determine the local coordinationneeded to determine the local coordinationenvironment of atoms.environment of atoms.

Methods of Extracting LocalMethods of Extracting LocalStructural InformationStructural Information
�� Spectroscopic methodsSpectroscopic methods
�� Magic Angle Spinning - Solid State NMRMagic Angle Spinning - Solid State NMR�� Mossbauer Mossbauer Spectroscopy (Fe, Spectroscopy (Fe, SnSn, , EuEu, �), �)�� ESR (need an odd # of unpaired electrons)ESR (need an odd # of unpaired electrons)�� µµµµµµµµSrSr
�� X-ray and Neutron MethodsX-ray and Neutron Methods
�� X-ray absorption fine structure (EXAFS)X-ray absorption fine structure (EXAFS)http://www.lure.u-http://www.lure.u-psudpsud..frfr/sections//sections/chimiechimie//xafsmacxafsmac//courscours__herculeshercules.html.html
�� Pair Distribution Function (PDF) AnalysisPair Distribution Function (PDF) Analysishttp://www.pa.http://www.pa.msumsu..eduedu//cmpcmp//billingebillinge-group/docs/home/overview.-group/docs/home/overview.htmhtm