Embed Size (px)
Citation preview

-1-
『国際開発研究フォーラム』30(2005. 9)
Forum of International Development Studies, 30(Sep. 2005)
Labor Productivity and Inter-Sectoral Reallocation of Labor inSingapore (1965-2002)*
K. Ali AKKEMIK**
Abstract
This paper investigates the impact of the shifts of labor across sectors on aggregate
productivity growth through a decomposition of aggregate productivity growth in
Singapore over the period 1965-2002. The static shift-share analysis is utilized to for this
purpose. The results show that the shifts of labor paid off well in terms of their
contribution to labor productivity especially for manufacturing in the 1985 era which was
characterized by interventionist labor market policies of the government. On the other
hand, the impact of labor shifts is negative in the post-1985 era which is characterized by
a more liberalized labor market.
I. Introduction
Long-run economic growth can be sustained by continuous increases in productivity. Economic
growth also brings about changes in the input composition of the economy. Scarce resources are
shifted from less productive activities to more productive activities.
The impact of the shifts of resources across the sectors of the economy on economic growth and
productivity has recently attracted attention of many researchers. Now, there is a large literature
on the impact of changes in sectoral labor composition on aggregate productivity for developing as
well as developed countries (e.g. Salter 1960, Syrquin 1984 and 1986, and Timmer and Szirmai
2000). These studies focus on the shift of labor and capital from primary sectors (e.g. agriculture) to
manufacturing and services sectors. They specifically point to the positive contribution of resource
reallocation from low-productivity sectors (most likely agriculture and traditional manufacturing
industries such as textile manufactures) to sectors and industries that exhibit higher productivity
(such as electronics, basic metals, and transport equipment industries). It is found, however, that
the shifts of resources for most developing countries are not conducive for productivity growth.
Somewhat similar evidence was found in Akkemik (2005) in a study covering Japan, Korea, and
Singapore for the last three decades of the 20th century.
In Singapore industrialization was initiated by the government and sustained economic growth
has been a major concern for the government. Being involved deeply in economic decision-making,
the government has directed the shifts of resources towards more productive areas. It is important
*This paper is derived from a chapter of a thesis to be submitted for the degree of PhD at Nagoya University.I would like to acknowledge the debt to my main supervisor Professor H. Osada, who checked two earlierdrafts of this paper and provided helpful comments, for his support and encouragement. The comments bytwo anonymous referees were useful. Finally, fruitful discussions with seminar members working underProfessor Osada are greatly acknowledged. **The author is a PhD candidate at Nagoya University, Graduate School of International Development.
Correspondence: [email protected]

to investigate how the shifts of resources impacted on productivity, the long-run determinant of
growth. This issue is of great importance to the policymakers, because a slow adjustment of
productivity bears a cost in the long-run as foregone growth. Labor is a scarce and very important
resource for the Singapore economy. The purpose of this paper is to analyze the impact of inter-
sectoral shifts of labor on aggregate productivity growth in Singapore. The hypothesis that shifts of
resources have a positive effect on aggregate productivity growth as supposed by Syrquin (1995) will
be tested. The study covers all productive activities in Singapore classified into nine major sectors
and nineteen manufacturing industries and the analysis covers the period 1965-2002. The
methodology is adopted from the instructive paper by Timmer and Szirmai (2000).
This paper is organized into six sections including the introduction. The second section reviews
labor market policies of the government. The third section explains the data construction and
periods of analysis. Trends in labor productivity and real wages constitute the fourth section. The
fifth section lays the methodology and the results of analysis. Conclusions with policy discussions
are provided in the sixth section.
II. Labor Market Policies of the Singaporean Government1
The government in Singapore has actively been involved in the working of the economy
throughout its development process since independence was gained in 1965. Labor market,
especially, has been the area where the involvement of the government in decision-making has been
the most important. Its involvement in the labor market has evolved through three distinct stages,
namely 1965-1978 (early post-independence rapid growth years), 1979-1985 (economic
restructuring), and post-1985 (post-recession era). Labor market policies of the government closely
follow the economic development of Singapore, as explained below.
In the first period (1965-1978), the immediate problems for the government were to solve the
problem of high unemployment rate (above 10 percent) and ensure continuous economic growth.
The government’s responses to these challenges were twofold. The first of these was the promotion
of export-oriented labor-intensive industries (especially textiles industry and the assembly-based
electrical machinery and appliances industry) as part of its export-oriented development strategy.
Its second response was the use of abundant unskilled labor for this purpose. The government’s
efforts brought unemployment down to 4 percent by 1973, bringing the economy to a point where full
employment is achieved. The economy grew rapidly in this period and the problem of
unemployment was solved through this process. Labor, then became scarce in some fast-growing
sectors and the government replied to this new challenge by increasing the female labor force
participation and allowing in foreign unskilled labor, mainly from neighboring Malaysia. The signs
of a tight labor market led the government to revise its labor market policy. Consequently, the
government established the National Wage Council (NWC)2 in 1972 in order to bring wage
Labor Productivity and Inter-Sectoral Reallocation of Labor in Singapore (1965-2002)
-2-
settlement and labor-management relations under control. NWC was given the authority to
recommend on annual wage increases, which were closely followed by the companies. In the early
1970s, NWC opted for wage restraint (i.e. wage increases lower than the increase in consumer
prices) where real wages were put under pressure in order to cushion the destructive effects of the
oil shocks that could bring in high inflation to the country. Until the second half of the 1970s the
growth rate of the real wages generally fell below that of labor productivity (see Figure 1).
The government changed its policy of promoting labor-intensive industries towards promoting
higher value-added economic activities in the late-1970s. This came with a restructuring plan in
which the labor market policy played a major role. In 1979, the government initiated a “high-wage
policy” where wages were deliberately increased at high rates through the NWC (see Figure 1). This
was due to the government’s perception that “correcting” the restrained wages and letting them
approach to their market-clearing levels would help increase labor costs and reflect labor-scarcity
and consequently lead the producers to shift to higher value-added productive activities. The
government also put in place some measures to help improve labor skills by establishing the Skills
Development Fund (SDF), where employers and employees contributed equally (2 percent of the
wage in 1979, later rose to 4 percent in 1980). In addition, the government announced additional
financial assistance schemes for companies to assist them in improving the skills of their workers.
As a result of the wage rises and some other shocks (e.g. decline in the world demand for
Singapore’s main export industries, ending of the construction boom which kept the economic growth
high for some years, etc.), the economy fell into a deep recession in 1985. The government
established the Economic Committee to investigate the reasons of the recession and the ways to
escape its adverse effects. The committee delivered its recommendations in a report to the
government in 1986. Those related to the labor market emphasized a cut in labor costs by reducing
the contribution rates of employees and employers to the Central Provident Fund (CPF)3 and
freezing of wages for two years. These recommendations were soon put in action by the government.
Labor market policies of the government changed drastically after the recession (post-1985 era).
A committee under the NWC recommended in 1986 the introduction of a flexible wage system rather
than mandatory announcing of annual wage increases by the NWC. This reform was put in effect
from 1987. Flexible wage system divides the wage into three parts: (i) a basic component, (ii)
supplement to the wage in the amount of a month’s wage or so which can be adjusted in times of
distress, and (iii) a performance bonus which is variable depending on the performance of the
workers and the company, i.e. company profits and productivity. The flexible wage system is
definitely a move towards the liberalization of the labor market policies of the government. NWC
annual wage increases were abandoned from 1987 on and were replaced by qualitative guidelines
(i.e. providing recommendations on wage increases taking into account the relation between wages
and productivity) In addition, SDF and the government’s policy of helping the companies improve
-3-

their labor quality were resumed in the post-1985 period.
III. Data Construction
Before starting an analysis of productivity, this part classifies economic activities, briefly
describes data and their sources, and finally introduces the periods for which the analyses are
conducted.
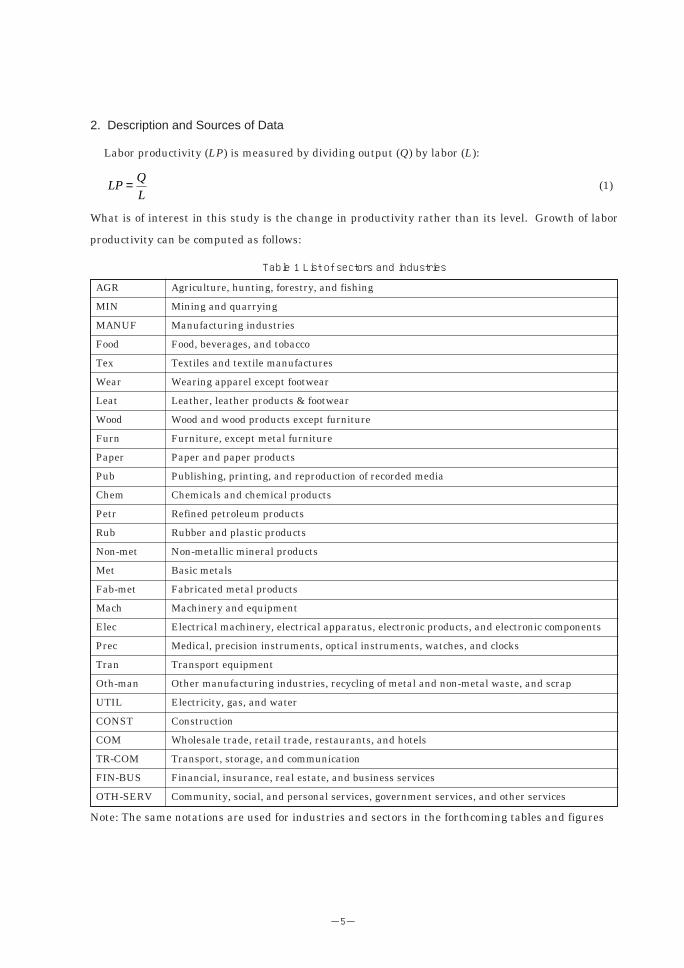
1. Industrial Classification
The analyses are conducted at two levels. At the first level, the analyses are conducted for major
sectors of the economy. At the second level, only the manufacturing sector is considered and the
analyses are conducted for individual manufacturing industries. For these purposes, economic
activities are divided into nine major sectors: agriculture, mining, manufacturing, utilities,
construction, commerce (i.e. wholesale and retail trade, hotels, and restaurant services), transport
and communications services, financial and business services, and other services (i.e. government
services, community, personal, and social services, and all other services not classified).
Manufacturing sector is further divided into 19 industry groups. In total, economic activities are
classified into 27 different groups of production activities. The results of the analyses below are
presented in two tiers. First, the sectoral analysis is presented and then the analysis concerning
only the manufacturing industries within the boundaries of the manufacturing sector is presented.
In the tables, major industries are noted by block capital letters. The list of industries with
abbreviations is presented in Table 1.
Labor Productivity and Inter-Sectoral Reallocation of Labor in Singapore (1965-2002)
-4-
Figure 1 Growth rates of real wages and labor productivity of the economy (unit: percentage)
Source: Author’s calculations using the data whose sources are explained in the text
2. Description and Sources of Data
Labor productivity (LP) is measured by dividing output (Q) by labor (L):
(1)
What is of interest in this study is the change in productivity rather than its level. Growth of labor
productivity can be computed as follows:
LPQ
L=
-5-
AGR
MIN
MANUF
Food
Tex
Wear
Leat
Wood
Furn
Paper
Pub
Chem
Petr
Rub
Non-met
Met
Fab-met
Mach
Elec
Prec
Tran
Oth-man
UTIL
CONST
COM
TR-COM
FIN-BUS
OTH-SERV
Agriculture, hunting, forestry, and fishing
Mining and quarrying
Manufacturing industries
Food, beverages, and tobacco
Textiles and textile manufactures
Wearing apparel except footwear
Leather, leather products & footwear
Wood and wood products except furniture
Furniture, except metal furniture
Paper and paper products
Publishing, printing, and reproduction of recorded media
Chemicals and chemical products
Refined petroleum products
Rubber and plastic products
Non-metallic mineral products
Basic metals
Fabricated metal products
Machinery and equipment
Electrical machinery, electrical apparatus, electronic products, and electronic components
Medical, precision instruments, optical instruments, watches, and clocks
Transport equipment
Other manufacturing industries, recycling of metal and non-metal waste, and scrap
Electricity, gas, and water
Construction
Wholesale trade, retail trade, restaurants, and hotels
Transport, storage, and communication
Financial, insurance, real estate, and business services
Community, social, and personal services, government services, and other services
Table 1 List of sectors and industries
Note: The same notations are used for industries and sectors in the forthcoming tables and figures

(2)
The operator ∆ denotes change in the relevant item. Equation (2) describes the growth rate of labor
productivity as the difference between the growth rates of output (Q) and labor input (L).
Labor input can be represented by the number of employees or working hours. Although which
one to use depends on the availability of data, the use of working hours is preferred because workers
may be working for different hours depending on the business cycle, especially in the manufacturing
sector. In this study, output is represented by real value-added for manufacturing industries and by
gross output in real terms for the nine major sectors. Value-added data for the services sectors were
available only for a few years and hence gross output appears to be the only measure that can be
used to represent Q in equation (1). I used both labor hours and number of employees to represent
L. Consequently, four measures for labor productivity are derived: gross output (or value-added) per
worker (Q/N) and gross output (or value-added) per working hour (Q/H), where Q, N, and H stand
for real output (or value-added), number of employees, and working hours, respectively.
Sectoral gross output data are obtained from the annual issues of Singapore Yearbook of
Statistics and the national accounts statistics. Gross output data for the nine major sectors are
normalized by the sectoral GDP deflators with 1990 as the base year to calculate real output.
Sectoral GDP deflators are obtained from the national accounts. Value-added data for the
manufacturing industries are obtained from the annual issues of the Report on the Census of
Industrial Production. The most appropriate method to compute real value-added is to use the
double deflation method where intermediate inputs deflated by its relevant price index is deducted
from the gross output deflated by its relevant price index. However, the unavailability of the price
indices for the intermediate inputs in Singapore does not allow us to use this method. As a
consequence, value-added data of the manufacturing industries are normalized by the Singapore
Manufactured Price Indices (SMPI) which is available in detail in the annual statistical yearbook.
SMPI is selected among a number of available price indices as it is the closest to be chosen as a
wholesale price index.
Finally, wage data for the major sectors and manufacturing industries are collected from the
annual statistical yearbook. In order to compute real wages, these wage figures are deflated by the
GDP deflator for the major sectors and by the abovementioned wholesale price indices for the
manufacturing industries.
3. Periods of Analysis
The analyses are conducted for three separate periods. Such periodization is necessary in order to
create a link between the government’s labor market policies as explained above and the results of
the analyses. The periodization naturally follows the periodization related to the government’s labor
∆ ∆ ∆LP
LP
Q
Q
L
L= −
Labor Productivity and Inter-Sectoral Reallocation of Labor in Singapore (1965-2002)
-6-

market policies as explained in section II above and the analyses are conducted for the three periods,
1965-78, 1979-1985, and 1986-2002. The data were collected for all years between 1965 and 2002,
where 2002 is the last year for which the data were available. Post-1985 period refers to 1986-2002.
IV. Trends in Labor Productivity and Real Wages
In this section I take a look at the trends in labor productivity and real wages. Both labor
productivity and real wages are computed using the equation (1) and later smoothed by the so-called
Hodrick-Prescott Filter,4 developed by Hodrick and Prescott (1997). This filter allows us to separate
out the influence of the business cycle from the original series and provides us with the long-run
movements of real wages and productivity.5
To see the relations between the long-run movements in labor productivity and in real wages, the
long-run movements of productivity and real wages are presented in Figures 1 to 6. In figures 1, 3,
and 5 the long-run trends of average labor productivity and real wages at the sectoral level are
presented. Agriculture and mining sectors are excluded in these tables due to their unimportance
for the economy. Figures 2, 4, and 6 provide the same figures for major manufacturing industries,
i.e. food, chemicals, petroleum refining, electrical and electronic machinery and appliances, precision
equipment, and transport equipment industries. All values in these figures are smoothed with the
Hodrick-Prescott filter. For convenience, the values in the figures are presented in natural
logarithm. If labor productivity is calculated as value-added per employee, then aggregate labor
productivity for the entire economy remained almost stable until the late 1970s when the
government initiated a large-scale restructuring in order stimulate higher-value-added production
through deliberate increases in wages in large scale. From then on, average labor productivity has
an ever increasing trend. This needs to be compared with the trend of real wages at the sectoral
level as seen in Figure 6. Real wages have increased only slightly until the late 1970s and from then
on they have an ever increasing path. The large increases from the late 1970s to the mid-1980s are
a result of the high-wage policy. From the mid-1980s on, the increasing trend of real wages follows a
uniform increasing path with the rate of increase getting slightly lower in the 1990s. In the post-
1985 period, the increases in real wages reflect gains in labor productivity. As seen in Figures 1 and
3, labor productivity increased at a slowing rate after the mid-1980s and the movement in real
wages replicated this trend.
Sectoral and industry-level figures for the growth rate of the two measures of labor productivity
are presented in Table 2. Table 2 presents the growth of labor productivity measured as output per
labor and as output per working hour. These tables reveal that in the long periods selected (i.e.
1965-1985, 1986-2002, and 1965-2002) the growth rates of labor productivity using any of the two
measures are very similar. In short periods (e.g. 1979-1985), however, the growth rates of the two
measures tend to be different. The remarkable productivity growth performance of the chemicals
-7-
industry is observable from both tables. This performance was accompanied in some periods by the
precision equipment and electrical and electronic machinery industries.
Labor Productivity and Inter-Sectoral Reallocation of Labor in Singapore (1965-2002)
-8-
Figure 2 Labor productivity (labor: number of employees) of major sectors (1965-2002)
Note: The data are smoothed with Hodrick-Prescott filter. Source: Author’s calculations
Figure 3 Labor productivity (labor: number of employees) of major manufacturing industries (1965-2002)
Note: The data are smoothed with Hodrick-Prescott filter. Source: Author’s calculations

-9-
Figure 4 Labor productivity of major sectors (labor: working hours) (1965-2002)
Note: The data are smoothed with Hodrick-Prescott filter. Source: Author’s calculations
Figure 5 Labor productivity (labor: working hours) of major manufacturing industries (1965-2002)
Note: The data are smoothed with Hodrick-Prescott filter. Source: Author’s calculations

Labor Productivity and Inter-Sectoral Reallocation of Labor in Singapore (1965-2002)
-10-
Figure 6 Real wages of major sectors (1965-2002)
Note: The data are smoothed with Hodrick-Prescott filter. Source: Author’s calculations
Figure 7 Real wages of major manufacturing industries (1965-2002)
Note: The data are smoothed with Hodrick-Prescott filter. Source: Author’s calculations

To understand the differences between productivity growth rates across industries, one should
consider the fact that international trade is a major economic activity in Singapore. As pointed out
by MTI (2001), the degree of competition and openness for each sector is highly important in this
respect. The sectors with inferior productivity growth rates (such as agriculture, mining, other
services, and construction) are by nature producers of non-tradable goods and services and are
-11-
Table 2 Labor productivity growth rates (percentage average annual growth rate)
Sectors
/ industries
AGR
MIN
MANUF
UTIL
CONST
COM
TR-COM
FIN-BUS
OTH-SERV
TOTAL
Food
Tex
Wear
Leat
Wood
Furn
Paper
Pub
Chem
Petr
Rub
Non-met
Met
Fab-met
Mach
Elec
Prec
Tran
Oth-man
1965-
1978
-16.3
9.3
0.0
10.5
2.8
-4.8
2.7
5.6
-0.5
0.0
1.9
4.1
5.0
1.0
5.8
-1.8
3.0
0.7
8.4
2.6
3.5
5.6
6.8
1.8
4.3
-1.2
-1.1
5.3
2.6
1979-
1985
9.2
6.5
3.8
9.1
1.8
1.0
7.7
4.9
2.4
3.0
4.7
3.8
-1.1
3.0
-2.1
4.8
13.3
5.7
5.4
-5.9
3.4
-0.5
-0.7
3.0
1.6
8.0
7.8
4.0
15.8
1965-
1985
-6.5
7.1
2.3
9.3
2.7
-2.6
4.4
5.5
0.4
1.0
2.9
2.5
1.6
0.2
2.6
-0.6
7.8
2.7
7.9
0.7
2.5
3.1
3.6
2.4
4.8
1.6
2.0
3.7
8.2
1986-
2002
-2.6
-5.7
5.5
4.9
2.6
3.1
4.7
-1.7
2.6
4.0
-0.5
2.9
4.2
3.7
1.6
-5.4
-1.1
2.3
9.7
5.7
1.6
0.8
-0.7
1.5
1.5
5.9
6.0
0.8
-3.7
1965-
2002
-4.8
1.4
3.8
7.3
2.7
0.0
4.5
2.0
1.4
2.3
1.4
2.7
2.7
1.7
2.2
-2.8
3.8
2.5
8.7
2.9
2.1
2.1
1.6
2.0
3.3
3.5
3.8
2.4
2.9
1966-
1978
-17.0
8.8
2.7
11.3
2.8
-4.7
2.6
5.9
0.1
0.1
1.4
3.6
4.6
0.1
5.1
2.2
2.4
0.1
7.6
1.8
2.7
4.4
6.0
1.6
4.0
-1.2
-1.8
5.4
3.3
1979-
1985
9.3
8.3
4.9
9.4
1.2
1.3
9.2
5.1
3.3
3.6
5.0
4.0
-0.7
3.4
-1.2
5.7
13.9
6.3
5.7
-5.6
3.7
-0.1
-0.5
3.2
1.5
8.7
9.0
4.2
15.9
1965-
1985
-7.1
7.3
3.2
9.8
2.4
-2.4
5.4
5.7
1.0
1.3
3.3
2.2
1.6
-0.3
2.5
-0.8
7.5
2.4
7.5
0.3
2.1
3.0
3.3
2.5
4.7
1.9
2.1
3.8
8.2
1986-
2002
-3.0
-6.0
3.1
5.2
2.7
3.2
4.6
-1.7
2.2
3.9
-0.5
2.8
3.8
3.4
1.8
-5.4
-1.2
2.3
10.0
5.8
1.3
0.8
-0.7
1.1
1.5
5.5
6.0
0.9
-4.5
1965-
2002
-5.3
1.3
3.2
7.7
2.5
0.1
5.0
2.3
1.6
2.4
1.6
2.4
2.6
1.4
2.2
-2.8
3.6
2.4
8.6
2.8
1.7
2.0
1.5
1.9
3.2
3.5
3.8
2.5
2.5
Source: Author’s calculations
Real value-added per employee Real value-added per working hour

inward-oriented. However, others with high productivity performances such as manufacturing
sector, especially electrical and electronics appliances and machinery industry, are open to free trade
and hence they are subject to competition with foreign rivals. This is a stimulant for upgrading and
restructuring in these sectors which is a factor that ensures improvements in productivity.
The trends in real wages point to tight labor market characteristics in Singapore. The increase in
real wages accelerates from the early 1970s when Singapore achieved full employment. It is
important to note that the speed of real wage increases continued in a slower pace after the mid-
1980s. There seems to be a strong relation between real wages and labor productivity, especially in
the manufacturing sector. The initial suppression of wages during the early industrialization period
(until the restructuring efforts of the late-1970s) as represented by relatively little real wage gains
in Figures 5 and 6 was followed by the government’s adjustment policies in the labor market to
stimulate higher value-added activities facilitated further gains in real wages. The change in real
wage trends towards an increasing one from the late-1970s was not accompanied by a rising trend in
labor productivity. The trends in productivity were rather favoring stable or slight increases with
the growth rate being slower than real wages. These findings suggest a somewhat existing but weak
relation between gains in labor productivity and real wage earnings. Thus, the strong influence of
the government in wage determination until the mid-1980s and governmental efforts in improving
labor productivity went hand in hand and reinforced each other. Following the restructuring efforts,
in the post-1985 period, the trends in productivity gains and real wage gains allowed the producers
to offset the costs of production brought about by increases in real wages to a large extent.
V. Reallocation of Labor and its Impact on Labor Productivity
1. Methodology
This section investigates the contribution of labor shifts across sectors to productivity growth. For
this purpose, I use the static shift-share method as presented by Timmer and Szirmai (2000). This
method has recently been used extensively to analyze the impact of labor shifts on labor productivity
(e.g. Fagerberg, 2000; Timmer and Szirmai, 2000; Jalava et al, 2002; van Ark and Timmer, 2003).
Below, aggregate labor productivity growth is decomposed into its components using the static shift-
share method.
I start with the following equation:
(3)
where LP stands for aggregate labor productivity, L for total employment, Q for total output in the
relevant sector or industry i, and the subscript t for time. This equation describes aggregate labor
productivity as a weighted sum of the labor productivities of individual industries, the weights being
the share of each industry in total labor. Note that labor input is represented by total number of
LPQ
L
Q
L
L
Ltt
t
i t
i ti
i t
t
= = ⋅∑ ,
,
,
Labor Productivity and Inter-Sectoral Reallocation of Labor in Singapore (1965-2002)
-12-

workers here. Terms without subscripts refer to aggregate (entire economy) measures. The term
Li,t/Lt in equation (3) refers to labor share of the sector or industry i in total labor and the term
Qi,t/Li,t refers to labor productivity for the same industry. Renaming the former as sli and the latter
as LPi, equation (3) can be rewritten as follows:
(4)
Next, I consider changes in labor productivity for any time period [0,1], where 0 and 1 stand for
the beginning and the end years of the period, respectively. The change in labor productivity level
can be written simply by subtracting the level of labor productivity at the end of the period (1) from
that of the beginning of the period (0):
(5)
Rearranging with some algebraic manipulations and dividing each side by LP0 to rearrange equation
(5) in growth terms, the following is obtained:
(6)
The first term on the right-hand side in equation (6), i.e. labor share of the beginning year of the
period multiplied by labor productivity change during the period, describes internal productivity
growth within individual industries and measures “intra-industry productivity growth.” Sectoral
labor shares are used as weights. Therefore, intra-industry effect measures the change in aggregate
labor productivity growth if the labor shares remained constant over time. The second term (change
in labor share multiplied by the labor productivity of the beginning year of the period) measures
labor shift based on the labor productivity level of the beginning of the period. In other words, this
effect measures the changes in aggregate labor productivity resulting from the movements of labor
across industries with differing productivity levels had the labor productivity levels of individual
industries remained constant over time. When the employment shares of industries with high
productivity levels rise, this means a reallocation of labor towards industries whose productivity is
growing rapidly. Following Timmer and Szirmai (2000), I name this the “static shift effect.” The
third term, that measures the cross-effects of the changes in both labor productivity and labor
shares, is the most difficult one to interpret. When the industries with high productivity growth
rates also increase their share of employment, this means a reallocation of labor towards industries
with rapid growth in productivity. Since it takes into account both labor productivity and labor
share changes at the same time in the selected period, this term will be named the “dynamic shift
effect”, again following Timmer and Szirmai.6
LP LP
LP LPLP LP sl
LPsl sl LP
LPsl sl LP LP
i ii i i ii i
i ii i i
1 0
0 01 0 0
01 0 0
01 0 1 0
1 1
1
− = −( ) ⋅ + −( ) ⋅
+ −( ) ⋅ −( )
∑ ∑
∑
, , , , , ,
, , , ,
LP LP LP sl LP slii i ii i1 0 1 1 0 0− = ⋅ − ⋅∑ ∑, , , ,
LP LP slii i= ⋅∑
-13-

The two shift effects measure the impact of structural change on aggregate labor productivity.
One can measure the impact of sectoral shifts of labor on the aggregate productivity level in
alternative ways as well (e.g. Syrquin 1986). However, the adopted method here provides further
details about the impacts of these shifts. If the sum of the two shift effects is positive and
considerably large, labor shifts have a positive impact on aggregate labor productivity. Increases in
labor quality reflect not only the improvement in the quality of labor due to in-house training by
firms or restructuring within the firms, but also the changes in available capital per labor. Higher
capital-labor ratio leads to higher labor productivity level. In turn, we can expect that the shift
effects reflect the restructuring efforts of the government starting from 1979 aiming at the
reallocation of resources in order to increase capital intensity of local industries. Note that the shift
effects are related to average productivity, not marginal product of labor. It is assumed here, for
simplicity, that all workers in the same sector have the same productivity, i.e. average productivity
remains unchanged by inter-sectoral employment shifts. In addition, labor is assumed to be
homogenous.7 Under these assumptions, I am interested in average productivity changes.
2. Results
The results of the decomposition exercise are presented in Table 3. The analysis is conducted for
the entire economy first and later confined to manufacturing industries to investigate the impact of
labor shifts across manufacturing industries on aggregate manufacturing labor productivity. The
results show that the shift effects are positive for both the manufacturing sector and the entire
economy for the two periods preceding 1985 and negative for the post-1985 period. The
contributions of the shift effects to manufacturing productivity before 1985 are large, around 50
percent, pointing to substantial gains from labor shifts across manufacturing industries. The results
here are comparable to a similar study by MTI (2001) which used the same method adopted in this
study in order to measure the effects of sectoral labor shifts on aggregate labor productivity for the
period 1985-2000. This period largely overlaps with the post-1985 era in this study. The results of
the MTI’s study are very close to the findings of this study with the shift effects in the period 1985-
2000 being negative.
Table 4 presents the contributions of major sectors to the sources of productivity growth. It is
seen from the table that before 1985 much of the intra-industry productivity growth came from the
construction and transport and communications sectors. The contributions of the manufacturing
industries are presented in Table 5. Within the manufacturing sector, petroleum refining industry
is a large contributor. In the post-1985 period, the best performer is the manufacturing sector (in
particular, electrical and electronic appliances, chemicals, and petroleum refining industries),
followed by the construction, transport and communication, and commerce sectors. Financial and
business services sector, however, exhibits a big decline in its contribution with a negative figure.
Labor Productivity and Inter-Sectoral Reallocation of Labor in Singapore (1965-2002)
-14-

Shift effects, overall, are negative for the post-1985 period and positive for the preceding period.
There is a need to interpret the meaning of the positive and negative shift effects for both periods.
Before 1985, the sum of the shift effects are 21.3 (1965-78) and 6.2 percent (1979-85) respectively for
the entire economy and more than 50 percent for the manufacturing sector. Dynamic shift effects
regarding major sectors are large only in the period 1965-78 (see Table 4). In other periods, they are
negligibly small. For the 1965-78 period, the largest contributors to the shift effects are the
commerce and financial and business services sectors. For the 1979-85 period, the largest
contributors are construction and financial and business services sectors whereas the contribution of
the manufacturing sector runs in the opposite direction. Before 1985, productivity growth rates of
all industries except agriculture, commerce, and other services sectors were larger than the economy
average (see Table 2). The productivity growth rate of the other services sector is negligibly small.
The share of this sector in employment also decreased over the period. This gave rise to a largely
negative contribution rate to shift effects by this industry. Overall, the general impact of the shifts
of labor across sectors before 1985 on aggregate labor productivity is positive.
Among the manufacturing industries, electrical and electronic appliances, petroleum, transport
equipment, and basic machinery industries account for a large portion of the shift effects for the pre-
1985 era (see Table 5). The shifts of labor across the manufacturing industries and towards rapid
growing industries such as electrical machinery and petroleum refining industries ensured gains
from productivity in the rapid growth period (1965-78). The contributions of the traditional
industries to the shift effects generally worked in the negative direction. In the restructuring period
(1979-85) the shift of labor towards higher value-added activities (e.g. electronics industry) impacted
positively to aggregate manufacturing productivity. In other words, shifts of labor across
manufacturing industries throughout the restructuring process worked in favor of productivity gains
and facilitated gains from productivity. To put in other words, the government’s strong hand in
-15-
Table 3 Decomposition of aggregate labor productivity (1965-2002)
Entire economy
Manufacturing
Aggregate productivity growth rate (%)
Intra-industry productivity (%)
Static shift effects (%)
Dynamic shift effects (%)
Aggregate productivity growth rate (%)
Intra-industry productivity (%)
Static shift effects (%)
Dynamic shift effects (%)
1965-
1978
0.0
78.7
83.0
-61.7
2.9
40.2
62.3
-2.5
1979-
1985
3.0
93.8
8.5
-2.3
4.2
50.8
48.9
0.3
1986-
2002
3.8
135.5
-22.5
-13.0
5.2
115.7
-10.8
-4.9
Source: Author’s calculations

labor allocation and strong control of the labor market emerged as an extra source of labor
productivity growth in Singapore manufacturing.
In the post-1985 period, however, shift effects are negative 35.5 percent for the entire economy
and minus 15.7 percent for the manufacturing sector. Dynamic shift effects are negligible and shift
effects result almost entirely from the static shift effects (see tables 4 and 5). This fact has an
important implication about the shifts of labor. Negative static shift effects arise when those sectors
with productivity growth rates higher than the economy average face declining employment shares.
In other words, negative static shift effects point to the allocation of labor towards industries with
lower productivity levels. The employment share of the manufacturing sector, which exhibits the
highest productivity growth rate in this period, has declined from 24.7 percent in the period 1979-85
to 20.8 percent in the post-1985 period (see Table 6). On the other hand, the financial and business
services sector which had lower productivity growth rates than the average, has increased its
employment share from the period 1979-85 to 1986-97. Among the manufacturing industries,
chemicals industry accounts for the large portion of the positive shift effects in the post-1985 era
whereas that of the electrical and electronic appliances and petroleum refining industries account
for the large part of the negative shift effects in the post-1985 period.
However, these findings beg for interpretation. The negative shift effects found for the post-1985
period suggests that throughout the restructuring process some labor was shifted from the more
productive manufacturing sector to less productive sectors that were mostly domestic-oriented and
thus were not exposed to international competition. A possible explanation can be made by looking
at the exposure of these sectors to competition. As pointed out in MTI (2001), manufacturing sector
is exposed to competition through free trade more than other sectors and this stimulates continuous
restructuring, which requires improvements in the quality of labor in order to enhance international
competitiveness. Governmental efforts such as Productivity Action 21 and SME 21 plans address
the low-productivity performance problem of the services sectors and the need to improve their
productivity performances (see MTI 2001).
An alternative explanation provided by MTI (2001) goes as follows: The theoretical explanation
that shifts of labor towards sectors with higher productivity levels brings about an extra source of
aggregate productivity growth, suggests that more jobs will be created in such sectors and wages
will increase. However, this is not happening in Singapore most probably because the labor force
that is shifted do not possess the relevant skills required in the more productive sectors, or are
reluctant to change jobs. This problem points to the need for skills upgrading to induce higher
value-added generation in Singapore, an issue that was always raised up in official reports. One of
the main targets in the post-1985 labor market policies of the government was therefore upgrading
of the skills of the laborforce employed in the services sectors, which absorb the labor released from
the manufacturing sector in the 1990s.
Labor Productivity and Inter-Sectoral Reallocation of Labor in Singapore (1965-2002)
-16-

VI. Conclusion and Policy Discussions
In this paper I reviewed the labor market policies of the Singaporean government and
investigated the impact of the shifts of labor across sectors on aggregate labor productivity. I found
for the entire economy that the shifts of labor impacted positively but in small amounts before 1985
and negatively in the post-1985 era. On the other hand, in the manufacturing sector, which was the
primary target of the government’s direct intervention in the labor market, labor shifts across
manufacturing industries impacted positively on manufacturing labor productivity accounting for
half of it whereas its impact in the post-1985 era was negative as in the case of the whole economy.
The results of the analysis should be compared with the changing labor market policies of the
government. The two periods before 1985 (1965-78 and 1979-85) where the labor shift effects on
aggregate manufacturing productivity are large and that of the general economy is positive though
small, are characterized by a highly interventionist and strict labor market policy of the government.
In the first period (1965-78), the government aimed at the mobilization of the labor force towards
labor-intensive industrialization as part of its export-oriented development strategy based on labor-
intensive export industries. For this purpose the government adopted a wage restraint policy with
strict controls on wage increases in order to maintain cost competitiveness. In the second period
(1979-85), the government’s aim of industrial restructuring with the abandonment of the promotion
of the labor-intensive manufacturing industries, was associated with the encouragement of the firms
to shift towards higher value-added activities and improve the quality of their labor for this purpose.
The results of these policies that aimed at an allocation of labor towards first labor-intensive export
-17-
Table 4 Percentage contributions of sectors to aggregate labor productivity (1965-2003)
AGR
MIN
MANUF
UTIL
CONST
COM
TR-COM
FIN-BUS
OTH-SERV
TOTAL
Intra-ind
2.6
0.3
1.6
19.4
27.3
8.1
15.7
-35.0
38.7
78.7
Stat. sh.
7.4
1.0
21.6
-3.3
-31.7
42.1
-11.3
80.2
-23.0
83.0
Dyn. sh.
-5.0
-1.7
-5.2
-2.2
-16.0
-7.8
-3.1
-11.7
-9.0
-61.7
Intra-ind
2.1
-0.6
20.5
3.7
10.0
0.0
22.5
26.8
8.8
93.8
Stat. sh.
-1.4
1.8
-20.3
-0.4
10.7
2.0
1.2
14.7
0.1
8.5
Dyn. sh.
-1.1
0.1
0.4
-0.9
-2.9
-0.3
-1.1
3.5
-0.1
-2.3
Intra-ind
-0.1
-0.4
42.0
5.0
35.4
26.3
28.9
-15.7
14.1
135.5
Stat. sh.
0.8
-0.5
-43.3
-2.0
14.3
-11.7
-6.3
14.2
11.8
-22.5
Dyn. sh.
-0.7
-0.6
-2.0
-3.0
-2.7
-1.1
-1.4
-1.4
-0.2
-13.0
1965 - 1978 1979 - 1985 1986 - 2002
Note: Intra-ind: Intra-industry productivity, Stat. sh.: static shift effect, Dyn. Sh.: dynamic shifteffect
Source: Author’s calculations

industries and then a restructuring of this labor among the existing sectors are twofold. First, there
was a substantial shift8 of labor towards the manufacturing sector, the main engine of growth.
Second, the shift of labor across manufacturing industries was towards certain high-performing
industries such as electrical and electronic machinery industry away from the traditional labor-
intensive industries such as textiles. Such reallocation of labor brought about a “bonus” for labor
productivity, i.e. shifted labor was used in more productive areas which had a positive impact on
manufacturing labor productivity.
In the post-1985 era, however, the results of the analysis show that the impact of the shifts of
labor on aggregate labor productivity at both the whole economy and manufacturing levels is
negative. This means that the shifts of labor worked against aggregate labor productivity. Post-
1985 period is characterized by relatively liberalized labor markets with wage reforms of the
government toward the introduction of a flexible wage policy and the abandonment of the controls on
wage increases. In this period, the government aimed at industrial diversification with an emphasis
on financial and business services sector as a new engine of growth along with the manufacturing
sector. Due to these adjustments, there was a shift of labor away from the manufacturing sector to
other services sectors, especially the financial and business services sector. This shift acted as a
negative factor for aggregate labor productivity. Similarly, the shifts of labor within the
manufacturing sector across the manufacturing industries did not provide a “bonus” to
manufacturing labor productivity.
Previous research in the development economics literature has emphasized the positive role of the
shifts of labor from less productive areas to more productive areas as a positive factor for
productivity. This study shows that before 1985, the government could effectively realize such a
gain by mobilizing the labor force. However, a more liberalized labor market and the target set as
economic diversification after 1985 led to the shift of labor towards less productive areas and
negative gains from productivity by this shift.
In conclusion, the most important issue to investigate appears to be the reversal of the impacts of
the shifts of labor from in the post-1985 period. In the liberalized labor market of the post-1985 era,
one can expect the labor to move to areas where the wage levels are higher. Financial and business
services sector, for example, offers higher wages than the manufacturing sector. Wage differences
across sectors largely explain the shifts of labor in a liberalized market. Why such shifts have a
negative impact on aggregate labor productivity is a problem to be treated carefully. One possibility
is that the labor market is moving towards a point where it will work normally with the relief of the
labor market from long years of strong government intervention. In other words, the labor market
may be moving to equilibrium after a long period of disequilibrium. Such a move may bring in
negative shift effects since workers will be shifting across sectors in search for better pay for their
services. Finally, the general tendency for the labor to shift toward services sectors when the
Labor Productivity and Inter-Sectoral Reallocation of Labor in Singapore (1965-2002)
-18-

economy reaches maturity applies also to Singapore.
-19-
Table 5 Percentage contributions of manufacturing industries to aggregate manufacturing laborproductivity
Food
Tex
Wear
Leat
Wood
Furn
Paper
Pub
Chem
Petr
Rub
Non-met
Met
Fab-met
Mach
Elec
Prec
Tran
Oth-man
Total
Intra-ind
-4.4
1.5
3.4
-0.3
0.9
-1.6
1.1
-1.6
9.5
19.8
4.4
0.5
-2.2
-1.3
2.0
2.8
0.1
7.9
-2.4
40.2
Stat. sh.
-36.8
-12.5
-10.1
3.3
-52.5
-1.5
0.1
-2.7
15.1
118.7
-14.8
-4.8
-41.2
-6.9
144.6
-257.8
-31.8
252.3
1.7
62.3
Dyn. sh.
0.3
-0.6
0.0
0.1
-1.4
0.0
-0.1
0.1
0.1
1.8
-0.3
-1.1
-0.5
-0.1
-0.3
-0.4
0.0
-0.3
0.1
-2.5
Intra-ind
3.4
-1.9
-2.4
0.0
-3.7
0.7
-5.0
-4.7
-13.0
49.6
-2.1
2.2
0.8
-2.2
29.6
-14.4
0.3
14.7
-0.8
50.8
Stat. sh.
-0.3
0.2
-1.6
0.0
2.0
0.4
1.8
-2.1
-1.7
2.8
4.4
-5.3
0.3
3.7
-8.8
27.2
6.8
7.9
11.2
48.9
Dyn. sh.
0.0
0.0
0.0
0.0
0.0
0.0
0.0
0.0
0.0
0.0
0.0
0.1
-0.1
-0.1
0.0
0.0
0.0
0.3
0.1
0.3
Intra-ind
-0.9
0.2
0.5
0.1
0.2
-0.8
-0.5
2.5
37.9
16.1
0.8
1.4
-0.5
1.2
2.3
50.4
4.3
-0.8
1.2
115.7
Stat. sh.
-0.7
-0.2
-1.1
0.0
-0.3
-0.3
-0.1
-0.1
2.8
-1.5
0.3
0.2
-0.3
0.1
-0.5
-10.2
-0.1
1.2
0.0
-10.8
Dyn. sh.
-0.2
-0.2
0.5
0.0
0.0
0.0
0.0
-0.5
0.6
-0.7
0.2
-1.2
1.0
2.2
-0.5
-0.1
-0.2
-4.7
-1.0
-4.9
1965 - 1978 1979 - 1985 1986 - 2002
Note: Intra-ind: Intra-industry productivity growth, Shift eff: shift effectSource: Author’s calculations

Notes
1 The information here is largely extracted from Carling (1995).
2 NWC consisted of representatives from the government, labor unions, and employees. In this way, the gov-
ernment could effectively control the industrial relations.
3 Central Provident Fund (CPF) is the national pension fund of Singapore. Both employers and employees
compulsorily contribute to the employee’s account in CPF. Singaporean government collects the “forced
Labor Productivity and Inter-Sectoral Reallocation of Labor in Singapore (1965-2002)
-20-
Table 6 Annual percentage share of sectors and industries in total employment
Note: The figures for manufacturing industries refer to their share in the manufacturing sector only. Source: Author’s calculations based on the data whose sources are described in the text
AGR
MIN
UTIL
CONST
COM
TR-COM
FIN-BUS
OTH-SERV
MANUF
Food
Tex
Wear
Leat
Wood
Furn
Paper
Pub
Chem
Petr
Rub
Non-met
Met
Fab-met
Mach
Elec
Prec
Tran
Oth-man
1966-1978
1.2
0.3
2.4
5.3
21.2
10.3
7.8
25.7
25.8
9.3
4.9
10.5
0.6
6.7
1.4
1.9
5.3
2.8
1.4
6.4
3.3
1.4
6.3
5.1
15.4
2.0
11.1
4.3
1979-1985
1.1
0.2
0.8
7.2
23.8
11.7
8.3
22.2
24.7
5.0
2.3
10.4
0.4
2.7
2.4
1.5
4.7
2.5
1.3
4.2
2.2
0.8
7.2
7.7
30.4
2.4
9.7
2.2
1986-2002
0.4
0.0
0.5
7.4
22.9
10.8
14.2
22.9
20.8
4.2
0.7
5.5
0.2
0.6
1.8
1.4
4.9
3.6
1.0
5.2
1.8
0.6
9.2
8.9
36.8
2.5
9.1
1.7

savings” of its citizens by this way. The CPF account is used by the account holder to pay for education,
health, and housing expenses of himself or his family. The account holder earns an interest on his savings
in his CPF account. Therefore, CPF acts more like a saving institution, rather than simply a pension fund.
4 Hodrick-Prescott filter can be explained as follows. When original series xt is composed of a trend compo-
nent and a cyclical component , where t denotes time (t = 1, 2, T).
Hodrick and Prescott (1997) suggest that with the following minimization method, the cyclical component ct
can be isolated from the original series xt.
where λ is the smoothing parameter (also named penalty parameter). The first term in this minimization
function, the sum of the squares of deviations, penalizes the variance of ct. The second term, the summa-
tion of the second differences of the trend component τt multiplied by the smoothing parameter λ, places a
penalty to the lack of smoothness in τt, i.e. a penalty on the variations in the growth rate of the trend com-
ponent with the degree of penalization directly proportional to the value of the parameter λ chosen.
Although the Hodrick-Prescott filter is easy to use, the selection of the appropriate value for the smoothing
parameter appears as the major drawback. If λ approaches to 0, the trend component is almost equal to
the original series, and if diverges to an infinitely large number, a linear trend is achieved. Hodrick and
Prescott (1997) recommend setting the value of λ to 100 for annual data. I follow this tradition.
5 The inspiration in searching for long-run trends in labor productivity and wages here comes from a study by
Voyvoda and Yeldan (1999) on Turkey.
6 Using the same methodology for an analysis of the productivity slowdown in the US, Beebe and Haltmaier
(1980) name the intra-industry and shift effects as “rate” and “level” effects, respectively.
7 Timmer and Szirmai (2000) report some shortcomings of the shift-share analysis. For example, the shift of
low-productivity and low-skilled agricultural labor into industry leads to an increase in the average produc-
tivity in agriculture. In the shift-share analysis, this increase in agricultural labor productivity is included
in the intra-industry productivity growth effect, but in fact it was caused by labor shift. This may lead to
an underestimation of shift effects. Productivity levels may be dependent also on the quality of labor. If
labor shifts towards industries with higher productivity due to higher labor skills, shift effects includes
improved labor quality which results in overestimation of shift effects.
8 To avoid confusion about the word “shift,” note that the shift of labor does not necessarily mean physical
transfer of labor from one sector to another. Total labor force may be growing but some sectors may be
receiving more labor than the others.
References
Akkemik, K. Ali. 2005. Structural Change and Its Impact on Productivity in Japan, Korea, and Singapore
(1970-2000). Forum of International Development Studies 28: 25-44.
minτ
τ λ τ τ τ τt t
T xt t t t t tt
T
t
T
{ } + −=
−
==
−( ) + −( ) − −( )[ ]
∑∑
1
2
1 1
2
2
1
1
c x x ct t t t
T
t t t−{ }( ) = +=
τ τ1
:τ τt t t
T{ }( )=1
-21-

Beebe, Jack and Jane Haltmaier. 1980. An Intersectoral Analysis of the Secular Productivity Slowdown.
Federal Reserve Bank of San Francisco Economic Review Fall 1980: 7-28.
Carling, Robert G. 1995. Labor Market Policies. In Bercuson, Kenneth (ed.), Singapore: A Case Study in
Rapid Development. International Monetary Fund Occasional Paper No. 119: 29-33.
Fagerberg, Jan. 2000. Technological Progress, Structural Change and Productivity Growth: A Comparative
Study. Structural Change and Economic Dynamics 11: 393-411.
Hodrick, R. J. and E. C. Prescott. 1997. Postwar US Business Cycles: An Empirical Investigation. Journal of
Money, Credit and Banking 29: 1-16.
Jalava, Jukka, S. Heikkinen, and R. Hjerppe. 2002. Technology and Structural Change: Productivity in the
Finnish Manufacturing Industries, 1925-2000. Paper presented at “XIII Economic History Congress,”
Buenos Aires, 28 June 2002.
MTI (Ministry of Trade and Industry, Republic of Singapore). 2001. Singapore’s Productivity Performance.
In Economic Survey of Singapore, First Quarter 2001, pp. 40-48.
Salter, W. E. G. 1960. Productivity and Technical Change. University of Cambridge Department of Applied
Economics Monographs. Cambridge: University Press.
Singapore Department of Statistics. Yearbook of Statistics, various years.
Singapore Department of Statistics. Report on the Census of Industrial Production, various years.
Singapore Department of Statistics. Singapore System of National Accounts, 1995.
Syrquin, Moshe. 1984. Resource Reallocation and Productivity Growth. In Moshe Syrquin, Lance Taylor,
and Larry E. Westphal (eds.), Economic Structure and Performance — Essays in Honor of Hollis B.
Chenery. Orlando, Florida: Academic Press, pp. 75-101.
Syrquin, Moshe. 1986. Productivity Growth and Factor Reallocation. In Hollis Chenery, Sherman Robinson,
and Moshe Syrquin (eds.), Industrialization and Growth: A Comparative Study. Published for the World
Bank by Oxford University Press, pp. 229-262.
Syrquin, Moshe. 1995. Patterns of Structural Change. In H. Chenery and T. N. Srinivasan, eds., Handbook
of Development Economics, Volume 1. Elsevier, pp. 203-273.
Timmer, Marcel P. and A. Szirmai. 2000. Productivity Growth in Asian Manufacturing: The Structural
Bonus Hypothesis Examined. Structural Change and Economic Dynamics 11: 371-392.
Van Ark, Bart and M. Timmer. 2003. Asia’s Productivity Performance and Potential: The Contribution of
Sectors and Structural Change. Paper presented at the conference “Leading East Asia in the 21st Centu-
ry,” Tokyo, 30 May 2003.
Voyvoda, Ebru and A. Erinç Yeldan (1999). Patterns of Productivity Growth and the Wage Cycle in Turkish
Manufacturing. Paper presented at the “METU Economic Research Conference III,” Ankara, September
1999.
Labor Productivity and Inter-Sectoral Reallocation of Labor in Singapore (1965-2002)
-22-


![البوابة الإجتماعية : استقبال · 2019. 5. 21. · 2019 30 2019 37 j + 1985 5 1985 12 1985 5 1985 12 30 2019 37 12 2019 30 5 1985 2019 2019 37 (1 €3.1£'.4]1985](https://img.pdfslide.tips/doc/110x75/5fedd4702235b618ec02783f/-2019-5-21-2019-30-2019.jpg)