Embed Size (px)
Citation preview
Department of Electrical and Computer Engineering
Laboratory Manual
for
CENG460 Communications Networks
By
Ruonan Zhang, Emad Shihab, Zhe Yang, Xuan Wang, Lei Zheng,and Lin Cai
Copyright 2013 University of Victoria. All rights reserved
The knowledge acquired in the CENG460 course and the labs should NOTbe misused under any circumstances. Please carefully read and follow thePolicy on “Responsible Use for Information Technology Services” (availableat “http://www.uvic.ca/6030”) for using Information technology services atthe University of Victoria.
Please refer to the CENG 460 lab web page for supplementary lab informa-tion.
This lab manual has adopted several contents from the labs suggested in [1,3, 4, 5].

Contents
1 Lab 1: Introduction to WireShark and Layered Protocol 31.1 Overview . . . . . . . . . . . . . . . . . . . . . . . . . . . . . . 4
1.1.1 WireShark . . . . . . . . . . . . . . . . . . . . . . . . . 41.1.2 Networking Tools . . . . . . . . . . . . . . . . . . . . . 51.1.3 Layered Protocol . . . . . . . . . . . . . . . . . . . . . 6
1.2 Procedures . . . . . . . . . . . . . . . . . . . . . . . . . . . . . 61.2.1 Installation . . . . . . . . . . . . . . . . . . . . . . . . 61.2.2 Getting familiar with WireShark . . . . . . . . . . . . 61.2.3 Layered Protocol . . . . . . . . . . . . . . . . . . . . . 8
1.3 Discussion . . . . . . . . . . . . . . . . . . . . . . . . . . . . . 111.3.1 Running WireShark . . . . . . . . . . . . . . . . . . . . 111.3.2 Networking Tools . . . . . . . . . . . . . . . . . . . . . 111.3.3 Layered Protocol . . . . . . . . . . . . . . . . . . . . . 12
2 Lab 2: TCP 132.1 Objective . . . . . . . . . . . . . . . . . . . . . . . . . . . . . 132.2 Introduction . . . . . . . . . . . . . . . . . . . . . . . . . . . . 13
2.2.1 TCP Header Format . . . . . . . . . . . . . . . . . . . 152.2.2 TCP Connection Setup . . . . . . . . . . . . . . . . . . 152.2.3 TCP Data Flow . . . . . . . . . . . . . . . . . . . . . . 162.2.4 TCP Connection Release . . . . . . . . . . . . . . . . . 162.2.5 TCP Congestion Control . . . . . . . . . . . . . . . . . 172.2.6 TCP Flow Control (Optional) . . . . . . . . . . . . . . 182.2.7 Retransmission in TCP . . . . . . . . . . . . . . . . . . 18
2.3 Procedures . . . . . . . . . . . . . . . . . . . . . . . . . . . . . 192.3.1 TCP Header Format . . . . . . . . . . . . . . . . . . . 192.3.2 TCP Connection Setup . . . . . . . . . . . . . . . . . . 202.3.3 TCP Data Flow . . . . . . . . . . . . . . . . . . . . . . 20
i

2.3.4 TCP Connection Release . . . . . . . . . . . . . . . . . 212.3.5 TCP Congestion Control . . . . . . . . . . . . . . . . . 212.3.6 TCP Flow Control (Optional) . . . . . . . . . . . . . . 212.3.7 Retransmission in TCP . . . . . . . . . . . . . . . . . . 21
2.4 Discussion . . . . . . . . . . . . . . . . . . . . . . . . . . . . . 222.4.1 TCP Header Format . . . . . . . . . . . . . . . . . . . 222.4.2 TCP Connection Setup . . . . . . . . . . . . . . . . . . 222.4.3 TCP Data Flow . . . . . . . . . . . . . . . . . . . . . . 232.4.4 TCP Connection Release . . . . . . . . . . . . . . . . . 242.4.5 TCP Congestion Control . . . . . . . . . . . . . . . . . 252.4.6 TCP Flow Control (Optional) . . . . . . . . . . . . . . 252.4.7 Retransmission in TCP . . . . . . . . . . . . . . . . . . 25
3 Lab 3: ARP, IP, and ICMP 273.1 Objective . . . . . . . . . . . . . . . . . . . . . . . . . . . . . 273.2 Introduction . . . . . . . . . . . . . . . . . . . . . . . . . . . . 27
3.2.1 Address Resolution Protocol (ARP) . . . . . . . . . . . 273.2.2 Internet Protocol (IP) . . . . . . . . . . . . . . . . . . 283.2.3 Internet Control Message Protocol (ICMP) . . . . . . . 28
3.3 Procedures . . . . . . . . . . . . . . . . . . . . . . . . . . . . . 293.3.1 Exploring ARP functions . . . . . . . . . . . . . . . . . 293.3.2 Analyzing IP frames . . . . . . . . . . . . . . . . . . . 293.3.3 Exploring ICMP functions . . . . . . . . . . . . . . . . 30
3.4 Discussion . . . . . . . . . . . . . . . . . . . . . . . . . . . . . 313.4.1 Exploring ARP functions . . . . . . . . . . . . . . . . . 313.4.2 Analyzing IP frames . . . . . . . . . . . . . . . . . . . 323.4.3 Exploring ICMP functions . . . . . . . . . . . . . . . . 33
4 Lab 4: Ethernet and IEEE 802.11 344.1 Objective . . . . . . . . . . . . . . . . . . . . . . . . . . . . . 344.2 Introduction . . . . . . . . . . . . . . . . . . . . . . . . . . . . 34
4.2.1 Ethernet . . . . . . . . . . . . . . . . . . . . . . . . . . 344.2.2 IEEE 802.11 . . . . . . . . . . . . . . . . . . . . . . . . 35
4.3 Procedures . . . . . . . . . . . . . . . . . . . . . . . . . . . . . 364.3.1 Analyzing Ethernet frames . . . . . . . . . . . . . . . . 364.3.2 Exploring IEEE 802.11 functions . . . . . . . . . . . . 36
4.4 Discussion . . . . . . . . . . . . . . . . . . . . . . . . . . . . . 374.4.1 Analyzing Ethernet frames . . . . . . . . . . . . . . . . 37
1

4.4.2 Exploring IEEE 802.11 functions . . . . . . . . . . . . 37
2

Chapter 1
Lab 1: Introduction toWireShark and LayeredProtocol
The labs for this course were designed to help students better understandthe ideas learned in the classes through hands-on experiments.
A better way to understand network protocols is to observe how theyactually work. A basic tool for observing the messages exchanged betweenexecuting protocol entities is the packet sniffer, which is an essential part ofnetwork protocol analyzer. WireShark is a free and open-source networkprotocol analyzer that runs on various operating systems including Linux,Unix, Mac, and Windows. We will give a brief overview of it in the followingsection.
This lab has three parts. The first part includes simple tasks that let youget familiar with the basic operations of WireShark. The second part willintroduce some handy networking tools, which will be used in the followinglabs. The third part will focus on how protocols and layering are representedin packets by exploring the sniffed packet traces.
3
1.1 Overview
1.1.1 WireShark
WireShark (previously called Ethereal) is one of the most widely used net-work protocol analyzer. It passively sniffs packets that are sent from orreceived by a designated network interface, but never sends packets itself. Itreceives a copy of packets that are sent from or received by the applicationsand protocols executing on the end-system (e.g., your computer). WireSharkalso has a graphical front-end to display the packets that it sniffs.
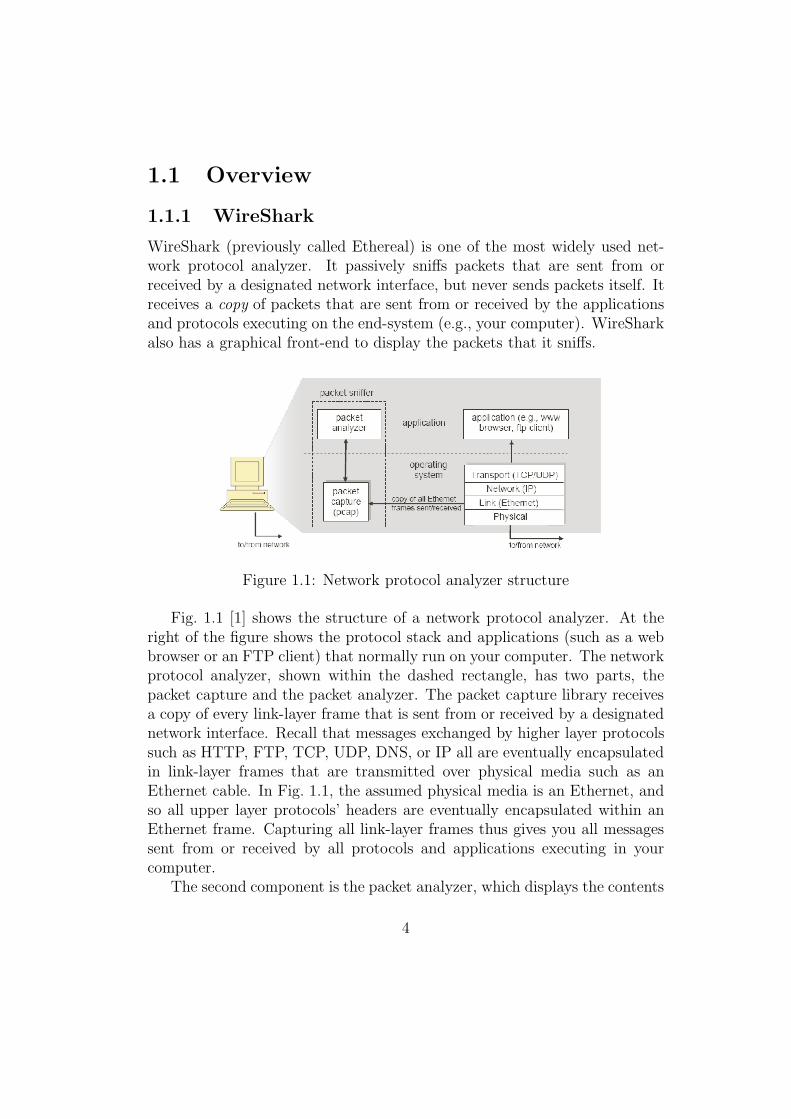
Figure 1.1: Network protocol analyzer structure
Fig. 1.1 [1] shows the structure of a network protocol analyzer. At theright of the figure shows the protocol stack and applications (such as a webbrowser or an FTP client) that normally run on your computer. The networkprotocol analyzer, shown within the dashed rectangle, has two parts, thepacket capture and the packet analyzer. The packet capture library receivesa copy of every link-layer frame that is sent from or received by a designatednetwork interface. Recall that messages exchanged by higher layer protocolssuch as HTTP, FTP, TCP, UDP, DNS, or IP all are eventually encapsulatedin link-layer frames that are transmitted over physical media such as anEthernet cable. In Fig. 1.1, the assumed physical media is an Ethernet, andso all upper layer protocols’ headers are eventually encapsulated within anEthernet frame. Capturing all link-layer frames thus gives you all messagessent from or received by all protocols and applications executing in yourcomputer.
The second component is the packet analyzer, which displays the contents
4
of all fields within a link-layer frame. In order to do so, the packet analyzermust understand the structure of messages exchanged by the protocols. Forexample, we are interested in displaying the various fields in messages ex-changed by the HTTP protocol in Fig. 1.1. The packet analyzer understandsthe format of Ethernet frames, and so it can identify the IP datagram withinan Ethernet frame. It also understands the IP datagram format, so it canextract the TCP segment within the IP datagram. It understands the TCPsegment structure, so it can extract the HTTP message contained in the TCPsegment. Finally, it understands the HTTP protocol and so, for example,knows that an HTTP message may contain the string of “GET”, “POST”,or “HEAD”.
1.1.2 Networking Tools
ping
The ping program in the source host sends a packet to the target IP address;if the target is alive, the ping program in the target host responds by sendinga packet back to the source host. Both of these ping packets carry ICMPmessages. Try “ping --help” to find out its usage.
ifconfig
The ifconfig is a tool to configure a network interface, for instance, setting aninterface’s IP address and netmask, disabling or enabling a given interface.Try “ifconfig --help” to find out its usage.
netstat
The netstat is a tool that displays network connections, routing tables, andnetwork interface statistics. It is used for finding problems in the networkand to determine the amount of traffic on the network as a performancemeasurement. Try “netstat --help” to find its usage.
wget
wget is a command-line program that let you fetch a URL. Unlike a webbrowser, which fetches and executes the entire pages, wget give you thecontrol over exactly which URLs you fetch and when you fetch them. wget
5

has many options (try “wget --help” to see them) but a URL can be fetchedsimply with “wget URL”.
1.1.3 Layered Protocol
Two reference models are used to describe the network architecture, theOSI/ISO reference model and the TCP/IP reference model. The OSI/ISOmodel divides the network into seven layers and the TCP/IP model dividesthe network into four layers. No matter which model is used, the basicprinciple of the layered architecture is that each layer performs some servicesfor the layer above it.
1.2 Procedures
1.2.1 Installation
WireShark is free to download at http://www.wireshark.org/. How to buildand install WireShark onto machines with different operating systems can bereferred to http://wiki.wireshark.org/BuildingAndInstalling.
1.2.2 Getting familiar with WireShark
A. Starting WireShark
When you run WireShark, you will see the graphical user interface (GUI) asshown in Fig. 1.2. There are four main fields:
• Filter field: Used to filter out uninteresting packets with the enteredspecifications, so you can choose which packets should (not) be shownon the screen;
• Captured packets: Lists the packets captured by the selected inter-face;
• Details of selected packet: Lists information about the packet thatis selected in the captured packets window;
• Content of packet in hex/ASCII: Displays the content of the cap-tured packet, in hex and ASCII.
6

Filter filed
Captured
packets
Details of
selected
packet
Content
of packet
in hex and
ASCII
Figure 1.2: WireShark graphical user interface
B. Capture Trace
Use the following procedure to capture the trace.
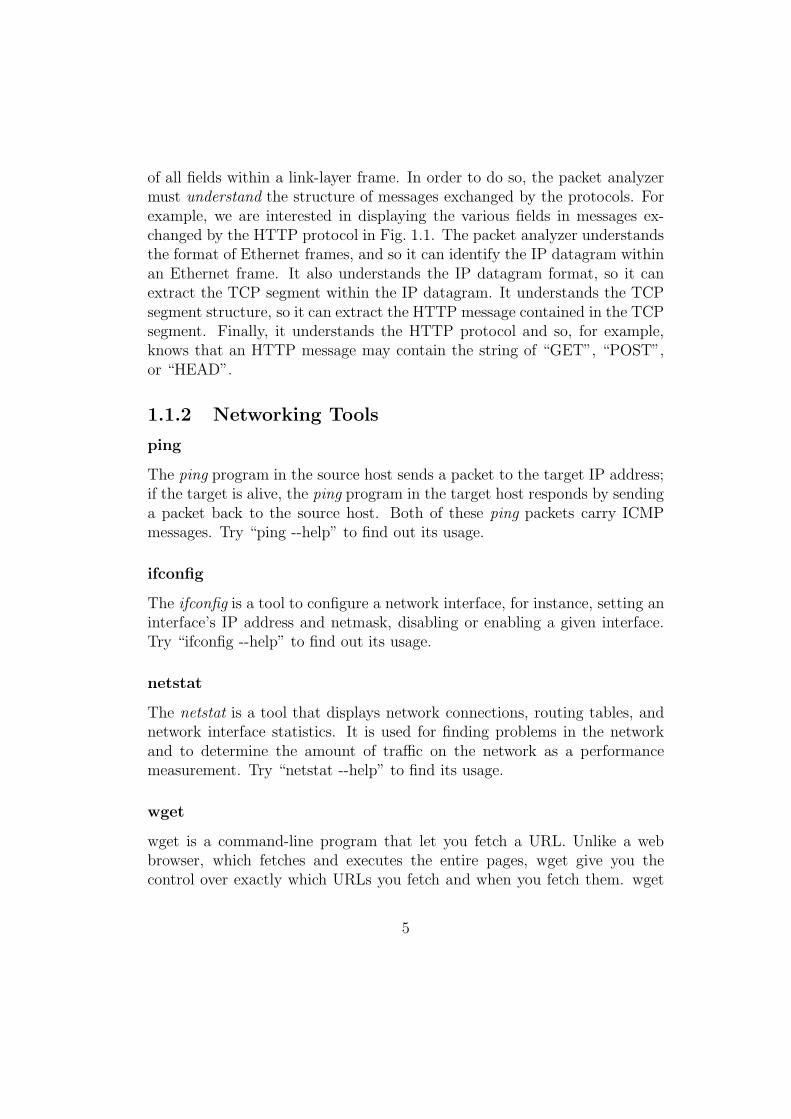
• Pick a URL and fetch it by wget. For example, open a console,type “wget http://www.google.ca”, you will obtain the fetched resourcewritten in a file. A successful example is shown in Fig. 1.3. The ex-pected response is “200 OK”.
• Close web browser. By minimizing browser activity you will stop yourcomputer from fetching unnecessary web content, and avoid incidentaltraffic in the trace.
• Launch Wireshark. Choose the network interface that we would like tocapture the packets on. To do this, select “Capture ⇒ Options” fromthe command menu. A window similar to the one shown in Fig. 1.4should pop up. Select the interface you are using. Uncheck “Capture
7
Figure 1.3: Wget URL
packets in promiscuous mode”. This mode is useful to overhear packetssent to/from other computers on broadcast networks. We only wantto record packets sent to/from your computer. Use capture filter “tcpport 80”. This filter will record only standard web traffic and not otherkinds of packets that your computer may send. Click “Start” to startthe packet capture process.
• When the capture is started, repeat the web fetch using wget above.This time, the packets will be recorded by Wireshark as the content istransferred.
• After the fetch is successful, return to Wireshark and use the menus orbuttons to stop the trace (“Capture ⇒ Stop”). If you have succeeded,the upper Wireshark window will show multiple packets. How manypackets being captured will depend on the size of the web page, butthere should be at least 8 packets in the trace. An example is shownin Fig. 1.5.
1.2.3 Layered Protocol
By inspecting the captured trace, or the provided trace (wget-trace) tounderstand the layered protocol.
8

Select
interface
Figure 1.4: Capture options window
• Select an HTTP GET packet. This packet carries the HTTP requestsent from your computer to the server.
• The protocol layers being used in web fetching are shown in Fig. 1.6.HTTP is the application layer web protocol used to fetch URLs. Itruns on top of the TCP/IP transport and network layer protocols. Thelink layer protocol shown in the figure is Ethernet. It may be otherprotocol, depends on your network.
• Click on one HTTP packet, and turn to the middle panel with details ofthe packet. The first block is “Frame”. This is a record that describesoverall information about the packet, including when it was capturedand how many bits long it is. The second block is “Ethernet” (Youmay have taken trace in a computer with 802.11, but still you will seean Ethernet block. This is because Wireshark capture traffic in Ether-net format determined on the capture options. See Link-layer headertype.). Then we can see IP, TCP, and HTTP. This is a bottom-up or-der, because as packets are passed down the protocol stack, the headerof the lower layer protocol is added to the front of the information from
9

Figure 1.5: Packet trace
Figure 1.6: Protocol stack for a web fetch
the higher layer protocol. That is, the lower layer protocols come firstin the packet.
10

• When an Ethernet frame arrives at a computer, the Ethernet layermust hand the packet that it contains to the next higher layer to beprocessed. In order to do this, the protocol use information in its headerto determine the higher layer data unit encapsulated. Which field isused here?
• Draw a figure of an HTTP GET packet that shows the position andsize in bytes of the TCP, IP and Ethernet protocol headers. On thisdrawing, show the range of header and payload of each layer.
1.3 Discussion
1.3.1 Running WireShark
1. Capture a trace without filter.
2. List at least 3 different protocols that appear in the protocol columnin the unfiltered packet-listing window.
3. How long did it take from the HTTP GET message being sent to theHTTP OK reply being received?
1.3.2 Networking Tools
Explore the usage of “ifconfig”, “ping”, “netstat”, and answer the followingquestions. (Hint: If you’re not sure about how to use these command, pleasecheck Sec. 1.1.2 “Networking Tools”.)
1. How many Ethernet interfaces are in your computer, how to determineit?
2. How to turn down/up an Ethernet interface?
3. Ping 10 packets to two websites. Compare the statistic results (packetloss, avg rtt).
11
1.3.3 Layered Protocol
1. Draw the structure of a HTTP GET packet.
2. In the provided trace (wget-trace), calculate the average overhead ofall the packets from the server to the client (in percentage). (Hint:For one packet, the overhead is the size of all headers in one packet overthe total size. The average overhead is the ratio between total size ofheaders and total size of the packets).
3. Which Ethernet header field tells the next higher layer protocol is IP?What value it used?
4. Which IP header field tells the next higher layer protocol is TCP? Whatvalue it used?
12
Chapter 2
Lab 2: TCP
2.1 Objective
In this lab, we first get familiar with the format of TCP header, thenstudy the TCP 3-Way Handshake and reliable data transfer, followed by thecongestion control algorithm and retransmission scheme.
2.2 Introduction
TCP is the dominant transport layer protocol in the Internet. It providesa reliable, in-order stream of data between two end-points, even if they areconnected by a network that may drop, re-order, or corrupt the packets.TCP provides the reliable data streaming service by detecting if packets arelost, delayed, or corrupted during transmission.
In this lab, we investigate the behavior of TCP in detail, by analyzing atrace of the TCP segments sent and received in transferring a 300 KB filefrom a local computer (the client, IP address: 10.0.1.5) to a remote Webserver (http://gaia.cs.umass.edu/, IP address: 128.119.245.12). The file,named alice.txt (which contains two copies of the text of Alice in Wonder-
land) is stored on the client computer and is uploaded to the server using theHTTP POST method. Here the POST method is used in order to transfera large amount of data from a computer to another computer.
The procedure to transfer this file is as follows:
• Start up Web browser on the client computer and go to http://gaia.
13
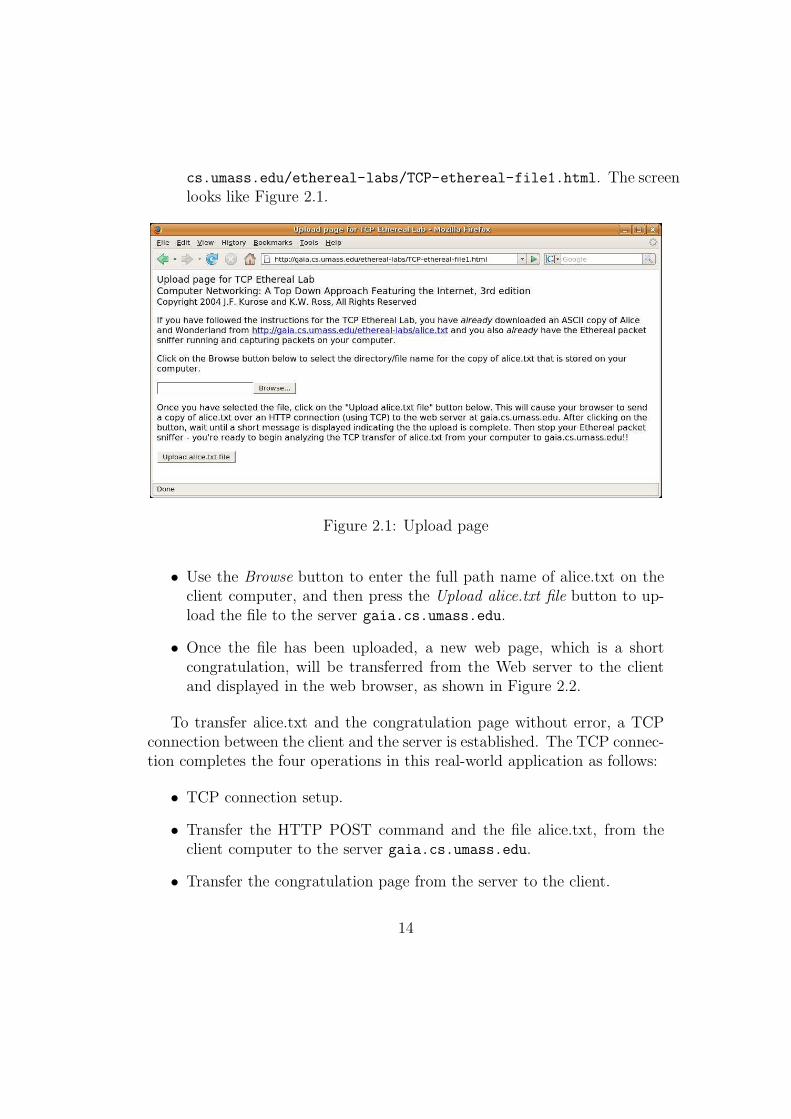
cs.umass.edu/ethereal-labs/TCP-ethereal-file1.html. The screenlooks like Figure 2.1.
Figure 2.1: Upload page
• Use the Browse button to enter the full path name of alice.txt on theclient computer, and then press the Upload alice.txt file button to up-load the file to the server gaia.cs.umass.edu.
• Once the file has been uploaded, a new web page, which is a shortcongratulation, will be transferred from the Web server to the clientand displayed in the web browser, as shown in Figure 2.2.
To transfer alice.txt and the congratulation page without error, a TCPconnection between the client and the server is established. The TCP connec-tion completes the four operations in this real-world application as follows:
• TCP connection setup.
• Transfer the HTTP POST command and the file alice.txt, from theclient computer to the server gaia.cs.umass.edu.
• Transfer the congratulation page from the server to the client.
14

Figure 2.2: Congratulation Page
• TCP connection release.
WireShark is run on the client computer to capture the trace of the TCPsegments sent/received from/to the client computer while the file is beingtransferred. We saved the trace from the TCP stream in the file tcp-trace-1.cap. The trace tracked all of the above four actions of TCP. We use thistrace to study the TCP behaviors in this lab.
2.2.1 TCP Header Format
Every TCP segment consists of a header followed by an optional dataportion. The format of the header is defined in RFC 793, including SourcePort (16 bits), Destination Port (16 bits), Sequence Number (32 bits), ACK(32 bits), .... In this lab, we will see the details of the TCP headers used inthis application.
2.2.2 TCP Connection Setup
Before transferring data, a TCP connection is established between the twoend systems, typically with three messages, called the three-way handshake:
15
SYN → SYNACK → ACK. The handshake is also used to negotiate certainproperties of the connection, e.g., the Maximum Segment Size (MSS) thatthe client and server can accept, and the Selective Acknowledgement (SACK)option. In this lab, we will see the three-way handshake procedure in thetrace tcp-trace-1.cap.
2.2.3 TCP Data Flow
Once the connection is established, the TCP sender partitions the messagefrom the application into segments. The MSS is used to determine howto partition the single message so the underlying network can encapsulateeach segment into a packet without further fragmentation. The sequencenumber and ACK number are used to detect packet loss, duplication, re-order in transmission and to deliver the segments correctly and in-order tothe application in the destination host.
In this real-world application, after the connection was established, theclient computer wrote about 300KB into the data stream using the HTTPPOST command. From the application’s perspective, this was sent as oneunit, or one message. However, the underlying network cannot support pack-ets large enough to hold all 300KB of data. We will see that TCP broke thissingle logical transmission into multiple segments according to MSS.
In the trace file tcp-trace-1.cap, the first three segments are used toestablish the connection. Starting from the No.4 TCP segment, the clientbegan to transfer the application layer message to the server. The 4th seg-ment contains the HTTP POST command (we will dig into the packet con-tent field and see this HTTP command). This segment is actually used totransfer this HTTP command. The text file is transferred by the followingTCP segments. Here we regard both the HTTP POST command and thefile (alice.txt) together as the whole message. Therefore, we consider the 4thTCP segment as the first segment in the TCP connection to transfer themessage from the client to the server.
2.2.4 TCP Connection Release
The TCP connection is closed when the two end systems exchange TCPsegments with FIN bit set and ACKed by the other side. The FIN bit literallymeans that no additional new data will be sent on that side of the connection.
16
The sequence of two FINs and their corresponding ACKs is the preferredway to gracefully terminate a TCP connection. However, TCP connectionscan also be terminated by setting the RESET bit. Although the RESET wasdesigned to be used for unrecoverable errors, it is often used in practice forfast termination that avoids the formalities of the FIN-ACK exchanges.
In the trace file tcp-trace-1.cap, after the client acknowledged the dataof the congratulation page, the server sent a FIN indicating that it wouldnot be sending any additional data. The client acknowledged this FIN bysending back the ACK. Therefore the flow in the direction from the serve tothe client is closed. The client computer could also terminate its flow to theserver by sending the FIN segments. Alternatively, the client computer senta RESET segment to the server to release the connection.
2.2.5 TCP Congestion Control
In TCP, congestion control provides the ability to limit the sending ratein response to signs of network congestion. Congestion control helps thenetwork to recover from congestion by shrinking sender’s outgoing trafficand therefore avoids network congestion collapse, and at the same time triesto achieve throughput as high as possible.
Congestion control is realized by setting the size of congestion window,according to two strategies, the slow start and the congestion avoidance.During the slow start phase, the congestion window increases one MSS witheach acknowledgment, and subsequently the window size is doubled everyround-trip time (RTT). During congestion avoidance, each acknowledgmentincreases the congestion window by MSS2/congestion window size (if thereceiver sends ACK for each received packet without delay), and subsequentlythe congestion window size is increased by one MSS every RTT. Slow startphase changes to congestion avoidance phase when congestion window ex-ceeds the slow-start threshold.
We will use the TCP segment trace file, tcp-trace-1.cap to investigateTCP congestion control. In particular, we look at how the congestion windowevolved since the beginning of transferring the HTTP POST command andthe alice.txt file.
17

2.2.6 TCP Flow Control (Optional)
TCP also provides flow control or the ability to limit the sending rateto avoid a fast sender over-running a slow receiver. To provide a reliableservice, a TCP receiver cannot deliver data that it received out of orderto the waiting application. Therefore, the TCP receiver typically allocates afixed amount of buffer space to store both out-of-order data and data waitingfor the application to fetch. If the TCP receiver runs out of buffer space tohold the incoming data, then it has no choice but to drop the out-of-orderdata packet even if it is error-free.
The receiver advertises its available buffer in each acknowledgment. Thereceiver’s advertised window field is used to inform the sender how muchroom is left for the incoming data. Then in the sliding-window based flowcontrol, the sender chooses the minimum of the receiver window and thecongestion window to be the size of the sliding window in order to make surethat the receiver will not run out of buffer space.
The TCP segment trace file, tcp-trace-1.cap, is used to exam TCP flowcontrol. We will see that the receiver window took effect and throttled thesender even though the congestion window continued to grow.
2.2.7 Retransmission in TCP
We learned that TCP provides reliable data transmission over an unre-liable network by relying on feedback from the receiver to detect loss andresponding to packet loss with retransmissions. TCP uses two kinds of in-dications of packet losses, timeout and duplicated acknowledgment (whichis regarded as an early indication of packet loss and causes the fast retrans-mission instead of waiting until timeout). The TCP sender must maintain acopy of the data it sent in case retransmission is needed, so it must store thedata until the corresponding acknowledgment is received.
However, in the trace tcp-trace-1.cap, all the packets were receivedcorrectly the first time and thus there was no retransmission. In order toinvestigate the TCP retransmission scheme, we are going to analyze anothertrace of TCP connections, tcp-trace-retransmission.cap [3], in which re-transmission does occur.
The trace, tcp-trace-retransmission.cap, was taken on a private net-work [3]. A desktop PC and a laptop were connected via a wireless router.The laptop was connected via a wireless interface and specifically placed so
18
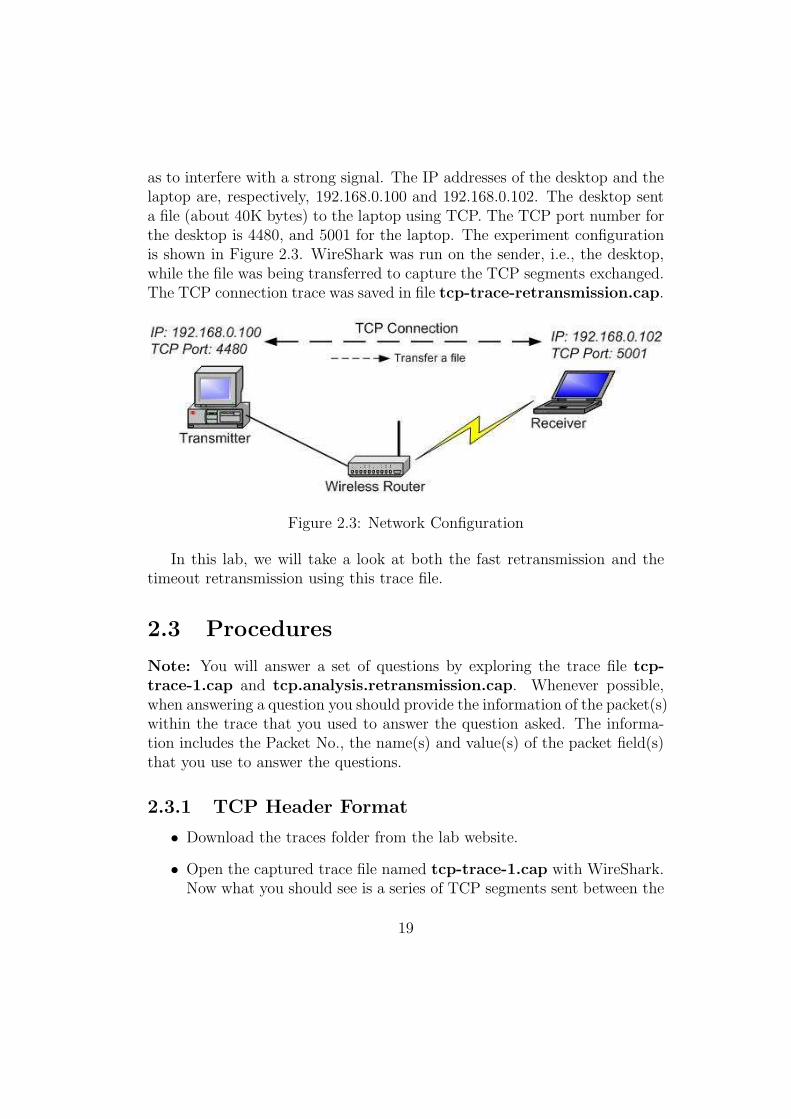
as to interfere with a strong signal. The IP addresses of the desktop and thelaptop are, respectively, 192.168.0.100 and 192.168.0.102. The desktop senta file (about 40K bytes) to the laptop using TCP. The TCP port number forthe desktop is 4480, and 5001 for the laptop. The experiment configurationis shown in Figure 2.3. WireShark was run on the sender, i.e., the desktop,while the file was being transferred to capture the TCP segments exchanged.The TCP connection trace was saved in file tcp-trace-retransmission.cap.
Figure 2.3: Network Configuration
In this lab, we will take a look at both the fast retransmission and thetimeout retransmission using this trace file.
2.3 Procedures
Note: You will answer a set of questions by exploring the trace file tcp-trace-1.cap and tcp.analysis.retransmission.cap. Whenever possible,when answering a question you should provide the information of the packet(s)within the trace that you used to answer the question asked. The informa-tion includes the Packet No., the name(s) and value(s) of the packet field(s)that you use to answer the questions.
2.3.1 TCP Header Format
• Download the traces folder from the lab website.
• Open the captured trace file named tcp-trace-1.cap with WireShark.Now what you should see is a series of TCP segments sent between the
19
client and the server gaia.cs.umass.edu.
• Since this lab is about TCP rather than HTTP, change WireShark’sPacket List Pane window so that it shows information about the TCPsegments containing the HTTP messages. To do this, in WireShark,select Analyze ⇒ Enabled Protocols. Then uncheck the HTTP box andselect OK.
• Select the first packet and explore the details of the TCP segment usingthe packet details pane and the packet bytes pane.
• Select the Transmission Control Protocol item in the Packet Details
Pane then the content of the header is highlighted in the Packet BytesPane.
• Answer the related questions in section 2.4.1.
2.3.2 TCP Connection Setup
• Find the initial three-way handshake in the trace file. (Hint: Youshould see the SYN segment sent from the client to gaia.cs.umass.
edu, and also the SYNACK segment being returned.)
• Answer the related questions in section 2.4.2.
2.3.3 TCP Data Flow
• Check the HTTP POST command. Select the 4th segment in thePacket List Pane. Select the Data item in the Packet Details Pane
and the content of the data carried by this segment is highlighted inthe Packet Bytes Pane. You should find a POST and other HTTPcommand information within its Date field.
• Set time reference. In order to make the following analysis easier, settime reference to the 4th packet. Choose the Time Reference items inthe Edit menu, or from the pop-up menu of the Packet List Pane.
Note: Now the 4th packet becomes the starting point for all subse-quent packets. The time values of all the following packets are calcu-lated relative to this packet.
20

• Set the time display format as microseconds. Choose the Time Display
Format in the View menu. Then select Seconds Since Beginning of
Capture and Microseconds.
• Answer the related questions in section 2.4.3.
2.3.4 TCP Connection Release
• Find the segments used to release the connection between the clientand the server.
• Answer the related questions in section 2.4.4.
2.3.5 TCP Congestion Control
• Open the captured trace file named tcp-trace-1.cap with WireShark.
• Answer the related questions in section 2.4.5.
2.3.6 TCP Flow Control (Optional)
• Open the captured trace file named tcp-trace-1.cap with WireShark.
• Answer the related questions in section 2.4.6.
2.3.7 Retransmission in TCP
• Open the captured trace file named tcp-trace-retransmission.capwith WireShark.
• List retransmissions. Search for retransmissions with the display fil-ter tcp.analysis.retransmission. Applying this filter, you should see 9retransmissions in the trace.
• Answer the related questions in section 2.4.7.
21
2.4 Discussion
2.4.1 TCP Header Format
1. Write down the TCP header content in hexadecimal format (in thepacket bytes pane). Dissect the TCP header and indicate the value ofeach field in the header. Annotate the hexadecimal content to explainyour answer.
2. What are TCP port numbers used by the client computer (source) andthe server (destination) when transferring the file to gaia.cs.umass.
edu? How did the client computer determine the port numbers whenit wanted to set up a TCP connection to the server?
3. What is the maximum header length? Given the value of the HeaderLength field, how to calculate the length of the head in unit of bytes?Verify your answer using the first TCP segment in the trace file.
4. (Optional) How does TCP calculate the Checksum field? What is thepseudoheader format? Write down the pseudoheader of the flow fromthe client to the server in hexadecimal format. Verify the Checksumvalue in the first TCP segment in the trace file.
2.4.2 TCP Connection Setup
1. Which segments are the initial three-way handshake in the trace file?How do you determine this?
2. What is the actual initial sequence number in each direction (in hex-adecimal format)? How did the client and the server determine thesevalues?
Note: WireShark displays the relative sequence number. You shouldselect the Sequence Number field in the header, the actual value ishighlighted in the Packet Bytes Pane.
3. What is the value of the acknowledgment number in the SYNACKsegment? How did gaia.cs.umass.edu determine that value?
22
4. What are the values of the sequence number and the acknowledgmentnumber in the third ACK segments in the three-way handshake? Howdid the client computer determine these values?
5. How did the client and the server announce the maximum TCP payloadsize that they were willing to accept? What are the values and whydid they choose these values?
6. Is there data sent in the SYN, SYNACK, and ACK segment? How doyou determine this?
2.4.3 TCP Data Flow
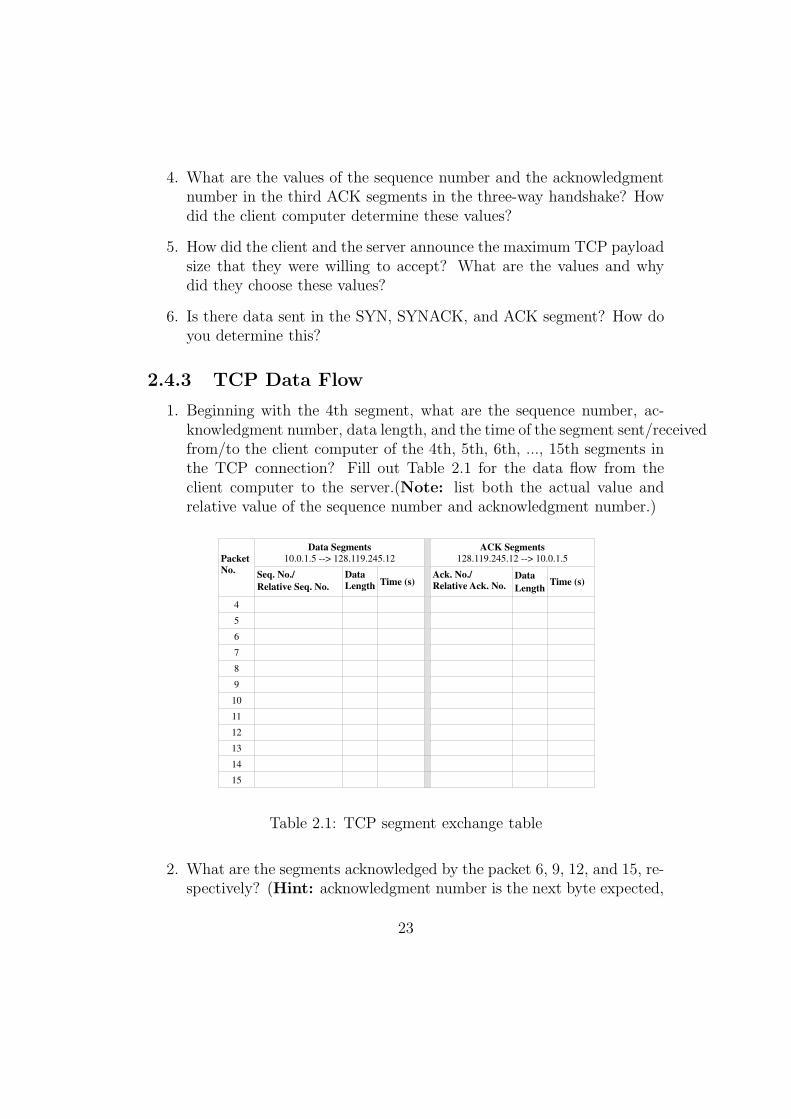
1. Beginning with the 4th segment, what are the sequence number, ac-knowledgment number, data length, and the time of the segment sent/receivedfrom/to the client computer of the 4th, 5th, 6th, ..., 15th segments inthe TCP connection? Fill out Table 2.1 for the data flow from theclient computer to the server.(Note: list both the actual value andrelative value of the sequence number and acknowledgment number.)
Data Segments
10.0.1.5 --> 128.119.245.12
ACK Segments
128.119.245.12 --> 10.0.1.5 Packet
No.Seq. No./
Relative Seq. No.
Data
Length Time (s) Ack. No./
Relative Ack. No. Data
LengthTime (s)
4
5
6
7
8
9
10
11
12
13
14
15
Table 2.1: TCP segment exchange table
2. What are the segments acknowledged by the packet 6, 9, 12, and 15, re-spectively? (Hint: acknowledgment number is the next byte expected,
23

so it actually acknowledges the bytes before the acknowledgment num-ber.)
3. Given the difference between when each TCP segment was sent, andwhen its acknowledgment was received, what is the RTT value for eachof the segments which have been acknowledged before the 15th seg-ment?
4. (Optional) What is the Estimated RTT value after the receipt of eachACK? Assume that the value of the Estimated RTT is equal to themeasured RTT for the first segment, and then is computed using theEstimated RTT equation for all subsequent segments. (Hint: Com-pare your calculation with the statistics analysis of TCP stream byWireShark.).
5. In the trace file, how did the sequence number of the packets fromthe server to the client change? Why? (Hint: When transferring thealice.txt file, the server was only a receiver and did not send any datato the client.)
6. (Optional) At the end of the trace file, find the TCP segments usedby the server to transfer the congratulation webpage to the client com-puter? How do you determine this?
7. (Optional) Are there any retransmitted segments in the trace file?What do you check for (in the trace) in order to answer this question?
2.4.4 TCP Connection Release
1. Which packets were used to close the data flow from the server to theclient? How do you determine this? (Hint: two segments are involvedin the FIN-ACK sequence.)
2. Which packets were used to close the data flow from the client to theserver? How do you determine this?
3. (Optional) In the FIN segment, what is the sequence number? In thecorresponding ACK segment, what is the acknowledgment number?How did the client determine this number?
24
2.4.5 TCP Congestion Control
1. Exam the 4th to 15th TCP segments. Can you find a pattern of thenumber of segments sent from the client and from the server gaia.cs.umass.edu? Why did the TCP data flow have such a pattern?
2. What is the initial size of congestion window? How do you determinethis? What is the size of congestion window when the segment 5, 8, 11and 14 were sent out?
3. In the lecture we have learned that the congestion window doublesits size in every RTT in the slow start phase. Beginning with the 4thpacket, what is the size of the congestion window and which packet wereinside the congestion window (i.e., these packets could be sent) duringthe first RTT? What is the size of the congestion window and whichpacket were inside the congestion window during the second RTT? Howabout the third RTT? Give the segment numbers.
4. When did the sender’s congestion control change from the slow startphase to the congestion avoidance phase? Give the segment numberand the time. How do you determine this?
5. What is the threshold between the slow start and congestion avoidance?(Hint: the size of congestion window when TCP change from slow startphase to congestion avoidance phase.)
2.4.6 TCP Flow Control (Optional)
1. Exam the 179th segment in the trace file, why did the sender stopsending more segments? What is the size of receiver window advertisedby the receiver at this moment? How do you determine this?
2.4.7 Retransmission in TCP
1. Segment 12 is the first retransmission. What is it in the segment thatidentifies the segment as a retransmission? (Hint: the sequence numberhas been used by a previous packet.) Which segment was segment 12retransmitted for?
25

2. Segment 12 is a fast retransmission, which should be triggered by triple-duplicated-acknowledgment. Find the three acknowledgments whichtriggered the fast retransmission of segment12. (Hint: in order to trig-ger a fast retransmission, the duplicated acknowledgments should ac-knowledge the same acknowledgment number, which is the sequencenumber of the fast retransmission.)
3. Is segment 44 a fast retransmission or timeout retransmission? Howdo you determine this? (Hint: whether the sequence number in thesegment has been acknowledged for three times or not.)
26
Chapter 3
Lab 3: ARP, IP, and ICMP
3.1 Objective
In this lab, we will investigate the Address Resolution Protocol (ARP), theIP (Internet Protocol), and Internet Control Message Protocol (ICMP). Thefirst part of this lab is mainly about the ARP protocol. We will study theoperation of the protocol based on the fields that it sets in the Ethernet framecontaining the ARP message. The second part of the lab focuses on analyzingIP frames, by observing and interpreting the fields in the IP frame. The lastpart of this lab focuses on the format and content of the ICMP messages.
3.2 Introduction
3.2.1 Address Resolution Protocol (ARP)
ARP is the standard method for finding a host’s hardware address whenonly its network layer address is known. It can be used to resolve manydifferent network-layer protocol addresses to hardware addresses. Due tothe overwhelming prevalence of IPv4 and Ethernet, ARP is primarily usedto translate IP addresses to Ethernet MAC addresses. ARP is used in thefollowing four cases when two hosts communicate:
1. When two hosts are on the same network and one desires to send apacket to the other.
27
2. When two hosts are on different networks and must use a gateway/routerto reach the other host.
3. When a router needs to forward a packet for one host through anotherrouter.
4. When a router needs to forward a packet from one host to the destina-tion host on the same network.
The first case is used when two hosts are on the same physical network (thatis, they can directly communicate without going through a router). The lastthree cases are the most used over the Internet as two computers on theInternet are typically separated by several hops.
3.2.2 Internet Protocol (IP)
Above the link layer, there is the network layer, which is responsible for relaythe date between the transport layer and the link layer. The network proto-col in network layer is called the Internet Protocol, or more commonly, the IPProtocol. The IP protocol performs two basic functions, the addressing (IPaddress) and the packet routing. Note that the internet layer is agnostic ofapplication data structures as the transport layer, and it also does not dis-tinguish between operation of the various transport layer protocols. Thus,IP protocol can carry data for a variety of different upper layer protocols bydifferent protocol numbers, such as TCP, UDP and ICMP.
There are currently two versions of the IP protocol, IPv4 and IPv6. In thissection we examine IPv4, which the most widespread version. With giventrace files, we’re going to learn about the details of IP frame.
3.2.3 Internet Control Message Protocol (ICMP)
The Internet Control Message Protocol (ICMP) is one of the core protocolsfor network management in the Internet. It is mainly used by networked com-puters’ operating systems to send error messages indicating, for instance,that a requested service is not available or that a host or router could not bereached. It has been used in network trouble-shooting and analyzing appli-cations such as ping and traceroute.
28

ICMP uses the basic support of IP as if it were a higher level protocol; how-ever, ICMP is actually an integral part of IP, and must be implemented byevery IP module. ICMP messages are sent in several situations: for example,when a datagram cannot reach its destination, when the gateway does nothave the buffering capacity to forward a datagram, and when the gatewaycan direct the host to send traffic on a shorter route [RFC792].
In this part of the lab, we use two network tools. One is ping, which is used totest whether a particular host is reachable across an IP network, to self-testthe network interface card of the computer, or to measure latency. The otherone is traceroute, used to determine the route taken by packets across an IPnetwork. We can understand the functions of ICMP by using these tools.
3.3 Procedures
3.3.1 Exploring ARP functions
• Download and open the trace named “ethernet-trace”.
• This trace basically emulates retrieving a long document.
• The ARP protocol typically maintains a cache of IP-to-Ethernet ad-dress translation pairs on your computer.
• Find the ARP request message and answer questions (1)-(5) in sec-tion 3.4.1.
• Find the ARP reply that was sent in response to the ARP request andanswer questions (6)-(10) in section 3.4.1.
3.3.2 Analyzing IP frames
• Using the same trace file as above.
• Select any packet with the HTTP GETmessage in the trace and expandthe IP header fields (using the + expander or icon) to see the details.You can simply click on a packet to select it (in the top panel). And thedetails of its structure (in the middle panel) and the bytes that make
29

up the packet (in the bottom panel). Our interest is the IP header,and you may ignore the other higher and lower layer protocols.
• Select the the packet with HTTP GET message (the No.10 packet) andanswer questions (1)-(2) in section 3.4.2.
• Observe all the packets and answer questions (3)-(4) in section 3.4.2.
3.3.3 Exploring ICMP functions
A. Ping The ping program in the source host sends a packet to the target IPaddress; if the target is alive, the ping program in the target host respondsby sending a packet back to the source host. Both of these ping packets carryICMP messages.
The following procedures describe how to capture the traces of ping messages.
• Start up the WireShark and begin packet capture.
• Open a console, type the command ping www.engr.uvic.ca -c 101 in thecommand line. The argument “-c 10” indicates that ten ping messagesshould be sent.
• When the ping program terminates, stop the packet capture.
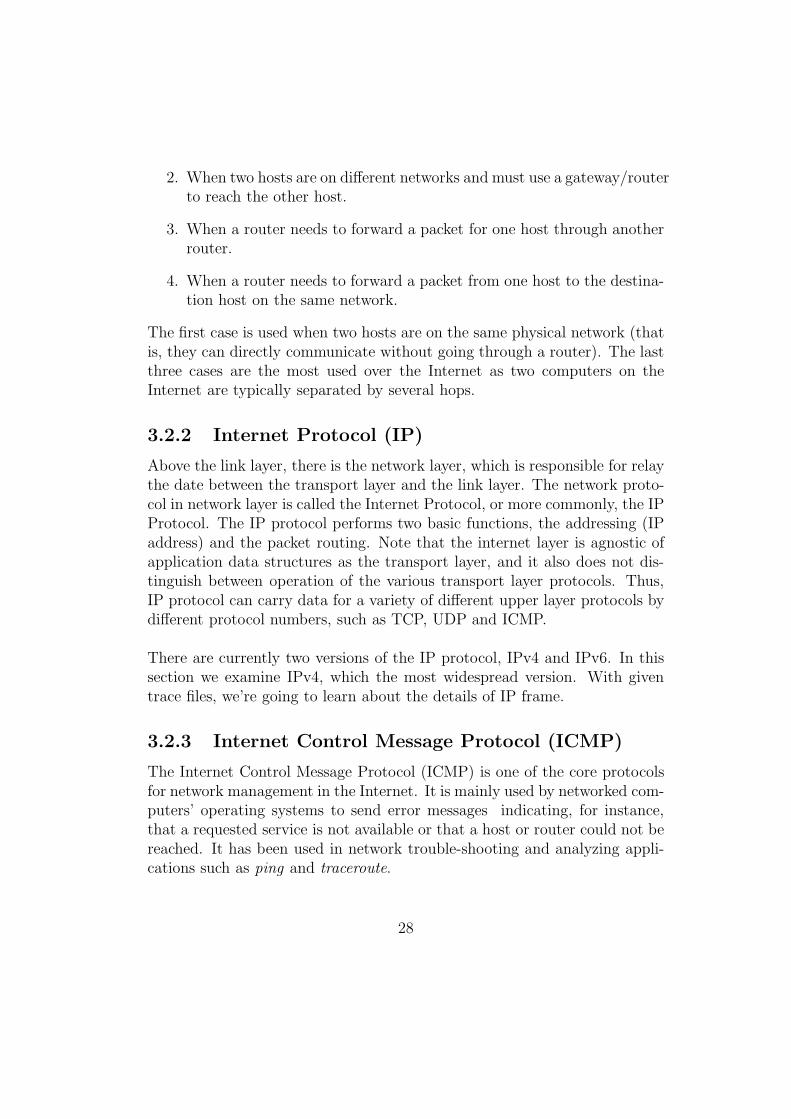
Download and open “ping-trace” in WireShark. Use the display filter to listthe ICMP messages only, as shown in Figure 3.1 and answer questions (1)-(4)in section 3.4.3.
B. Traceroute The traceroute program is used to figure out the path a packettakes from the source to the destination. The following procedures describehow to capture the packets of traceroute messages.
• Start up the WireShark and begin packet capture.
• Open a console, type the command traceroute www.engr.uvic.ca in com-mand line.
1The ping command here is different in Linux and Windows operating system. If you’re
working in Windows system, the command here should be ping www.engr.uvic.ca -n 10
30
Figure 3.1: Capture of ping packet with ICMP display filter
• When the traceroute program terminates, stop the packet capture.
Download and open “tracert-trace” in WireShark, and set the display filteras icmp. Then answer the questions (5)-(7) in section 3.4.3 based on thetrace.
3.4 Discussion
3.4.1 Exploring ARP functions
Answer the following questions based on the trace file “ethernet-trace”.
1. What are the hexadecimal values for the source and destination ad-dresses in the Ethernet frame containing the ARP request message?
2. Find the hexadecimal value for the two-byte Ethernet Frame type field.
31
3. Where the ARP opcode (operation code) field is located, i.e., how manybytes bits are there between of first bit of the opcode and the first bitof the ARP message.
4. What is the value of the opcode field within the ARP-payload part ofthe Ethernet frame, in which an ARP request is made?
5. Does the ARP message contain the IP address of the sender?
6. Where the ARP opcode field is located, i.e., how many bytes from thevery beginning of the Ethernet frame does the ARP opcode field begin?
7. What is the value of the opcode field within the ARP-payload part ofthe Ethernet frame in which an ARP response is made?
8. What is the MAC address answered to the earlier ARP query?
9. What are the hexadecimal values for the source and destination ad-dresses in the Ethernet frame containing the ARP reply message?
10. Why there is no ARP reply for the second ARP query (packet No.6)?
3.4.2 Analyzing IP frames
Answer following questions based on “ethernet-trace”.
1. Sketch a figure of the packet you selected to show the position andsize in bytes of the IP header fields, as well as the values in hexadecimal.Your figure can simply show the frame as a long, thin rectangle.
2. What are the IP and MAC addresses of the source and destination?
3. How does the value of the Identification field change or stay the samefor different packets? (Hint: No.) Is there any pattern if the value doeschange?
4. How can you tell from looking at a packet that it has not been frag-mented?
32

3.4.3 Exploring ICMP functions
Answer following question based on “ping-trace” and “tracert-trace”.
1. What is the IP address of the source host (client)? What is the IPaddress of the destination host (server)?
2. Can you get the average RTT (Round Trip Time)? What’s that?
3. Examine one of the ping request packets. What are the ICMP type andcode numbers? What other fields does this ICMP packet have? Howmany bytes are the checksum, sequence number and identifier fields?
4. Examine the corresponding ping reply packet. What are the ICMPtype and code numbers? What other fields does this ICMP packethave? How many bytes are the checksum, sequence number and iden-tifier fields?
5. What is the IP address of the source host (client)? What is the IPaddress of the destination host (server).
6. How many routers are between the source and the destination (www.engr.uvic.ca),for the trace file? Please draw a figure to show the sequences of theserouters, i.e, source− >router first− > ...− >router last− >destination?
7. Can you get the average RTT times between the source host and eachrouter? What are they?
33
Chapter 4
Lab 4: Ethernet and IEEE802.11
4.1 Objective
In this lab, we will investigate the link layer protocols, including the Ethernetand IEEE 802.11. The first part of this lab is mainly about the Ethernetframe format. The second part of the lab focuses on analyzing IEEE 802.11frames.
4.2 Introduction
4.2.1 Ethernet
Ethernet stations communicate by sending each other data frames. As withother IEEE 802 LANs, each Ethernet station is given a single 48-bit MACaddress, which is used to specify the destination and the source of each dataframe. Network interface cards (NICs) or chips normally do not accept framesaddressed to other Ethernet stations. Adapters are generally programmedwith a globally unique MAC address, but this can be overridden, either toavoid an address change when an adapter is replaced, or to use locally ad-ministered addresses.
All generations of Ethernet (except very early experimental versions) sharethe same frame formats (and hence the same interface for higher layers), and
34
can be readily (and in most cases, cheaply) interconnected.
Due to the ubiquity of Ethernet, the ever-decreasing hardware cost of it,and the reduced panel space needed by twisted pair Ethernet, most manu-facturers now build the functionality of an Ethernet card directly into PCmotherboards, eliminating the need for installation of a separate networkcard.
4.2.2 IEEE 802.11
In this part, we are going to explore the link layer, and management func-tions of 802.11. Generally speaking, there are three types 802.11 frames,the Data frame (Type 2), the Control frame (Type 1), and the Managementframe (Type 0). For each type of frame, there are also different subtypes.Typically, Data frame is the longest, which can be up to 1500 bytes, whileManagement frames are much shorter, and Control frames are very short.As the Data and Control frames have been illustrated in the text book, herewe introduce some important types of Management frames.
• Beacon frame Beacon frames are sent out periodically by an AP toadvertise its existence and capabilities to nearby computers. Beacon isan IEEE 802.11 wireless LAN Management frame. In a Beacon frame,there are a series parameters, including the SSID name of the AP, thedata rates it supports, and the channel on which it is operating.
• Association A computer has to associate with the AP after it learnedan AP via a Beacon or otherwise and before it can send or receive datafrom the AP. Possibly, authentication process will be involved duringthe association. If the Association Request is successful received by AP,the AP will return an Association Response, and then the computerwill acknowledge the association response. The Association Requestand Response carry information that describes the capabilities of theAP and computer. Thus, both endpoints can know the other’s abilities.
• Probe Request/Response In addition to find AP by waiting to learnabout an AP from Beacons, a computer may also probe for specific APs.A Probe Request is sent by a computer to test whether an AP with aspecific SSID is nearby. If the AP is nearby, it will reply with a Probe
35
Response. Like Beacon and Association frames, each of these framescarries information describing the capabilities of the computer and AP.
4.3 Procedures
4.3.1 Analyzing Ethernet frames
• Download and open the trace named “ethernet-trace”.
• Find the HTTP GET message that was sent from the web browser togaia.cs.umass.edu (should be packet No.10) and answer question (1)-(4) in section 4.4.1.
• Find the Ethernet frame containing the first byte of the HTTP responsemessage and answer question (5)-(6) in section 4.4.1.
4.3.2 Exploring IEEE 802.11 functions
• Download and open the trace named “wlan-trace” [4]. Note that itmay be difficult to gather your own trace using windows system. Themain issue is that Windows system made 802.11 frames appear to comevia a wired Ethernet. However, it is possible to use Mac or Linux togather 802.11 frames directly, without this conversion.
• Select a Data packet. The packet detail can show four layers informa-tion: 1) Frame, which is a record added by Wireshark with informationabout the time and length of the frame; 2) Radiotap, which is also arecord of captured physical layer parameters, such as the strength ofthe signal and the modulation; 3) IEEE 802.11, which is the bits ofthe 802.11 Data frame;4) Data, which is a record containing the framepayload data. Answer the related questions in section 4.4.2.
• Inspect different packets to see the values for different types of frames.You can use filter to see only one type frames by entering the expressionwlan.fc.type==n into the Filter box above the list of frames in the toppanel. For example, ”n=2” is for data frames, ”n=1” is for controlframes, and ”n=0” is for management frames. Answer the relatedquestions in section 4.4.2.
36
• Inspect the packet transmission reliability. Use filter expressions tofind the number of Data frames that are originals and retransmissions.For example, wlan.fc.type==2 && wlan.fc.retry==0 will find originalData frames. Answer the related questions in section 4.4.2.
• Inspect the Management frame. Use filter to help you find these frame,and answer the related questions in section 4.4.2.
4.4 Discussion
4.4.1 Analyzing Ethernet frames
For trace file “ethernet-trace”, answer the following questions.
1. What is the 48-bit Ethernet address of the client computer?
2. What is the 48-bit destination address in the Ethernet frame? Is thisthe Ethernet address of gaia.cs.umass.edu? Which device has thisas its Ethernet address?
3. Give the hexadecimal value for the two-byte Frame type field.
4. What is the value of the Ethernet source address? Is this the addressof your computer, or of gaia.cs.umass.edu? Which device has thisas its Ethernet address?
5. What is the destination address in the Ethernet frame? Is this supposedto be the Ethernet address of the computer you are using?
6. Find the hexadecimal value for the two-byte Frame type field.
4.4.2 Exploring IEEE 802.11 functions
Answer the following questions based on the trace file “wlan-trace”.
1. Which AP is the most active one? what is its BSS ID?
2. How many Data frames are in the trace, how many subtypes, and whatis the most common subtype of Data frame?
37
3. How many subtypes of Control frames are in the trace, what are they?and what is the most common subtype?
4. How many subtype of Management frames are in the trace, what arethey and what is the most common subtype?
5. Please estimate the retransmission rate as the number of retransmis-sions over the number of original transmissions. Show your calculation.
6. What are the Type and Subtype values for the Association Request/AssociationResponse frames, the Probe Request/Probe Response frames?
38

Bibliography
[1] Ethereal Labs, http://www-net.cs.umass.edu/ethereal-labs
[2] Wikipedia.org, http://en.wikipedia.org/wiki/HTTP
[3] Jeanna Matthews, Computer Networking: Internet Protocols in Action,John Wiley & Sons, Inc., Dec. 2004.
[4] Andrew Tanenbaum and David Wetherall, Computer Networks 5/E,Prentice Hall, Oct. 2010
[5] James F. Kurose and Keith W. Ross. 2009. Computer Networking: ATop-Down Approach (5th ed.). Addison-Wesley Publishing Company,USA.
39
![Wireshark Kullanım Rehberi - exploit-db.comturkish]-wireshark... · Filter kısm ı6 7 1 ) Daha önce ... Wireshark –Adres Çözümlemenin Aktif Edilmesi Peki wireshark bu adres](https://img.pdfslide.tips/doc/110x75/5a78a6237f8b9a21538b5a13/wireshark-kullanim-rehberi-exploit-dbcom-turkish-wiresharkfilter-kism-i6.jpg)