Embed Size (px)
Citation preview

Laser sintering of hydroxyapatite
by layer-wise slurry deposition (LSD)
Dissertation
zur Erlangung des Grades eines
Doktor-Ingenieures
vorgelegt von
Dipl.- Ing. Zahra Sadeghian
aus Teheran (Iran)
genehmigt von der
Fakultät für Bergbau, Hüttenwesen und Maschinenwesen
der Technischen Universität Clausthal
Tag der mündlichen Prüfung
15. März 2005

Hauptberichterstatter………………………………………….Prof. Dr. Ing. J. G. Heinrich
Berichterstatter……………………………………………….....Prof. Dr. Ing. J. Deubener
Vorsitzender der Prüfungskommission………………………....Prof. Dr. Ing. H. J. Barth

To my Family and my Teachers
"You have to believe yourself. If you want, you can. Only decide"

Acknowledgements
First of all, special thanks to my God who has always helped me. I would like to express my
deepest gratitude to Prof. Dr. Ing. J. G. Heinrich and Prof. Dr. Ing. F. Moztarzadeh for their
strong support and their friendly assistance. They have taught me the way how to focus on the
research and being serious in working to achieve good results. They offered me an ideal
scientific atmosphere and helped me to gain a knowledge and ability beyond the reach of
many attainments.
I would also like to thank Prof. Dr. Ing. J. Deubener for becoming my second examiner and
for spending his precious time in reviewing my thesis.
I would like to thank to all my colleagues in this institute, who had helped me in various
technical and personal matters, during my entire in this institute in particular Dr. Günster, Mr.
Engler and Mr. Gahler and Dr. Ohlendorf for their support in set up of the LSD device. I
would like to thank Mr. Gorke, Mr. Betram, Mr. Zellmann, Dr. Dörr, Dr. Helsch, Mr. Shütz,
Mr. Holly and Mr. Rust in particular Mrs. Lüer and Mrs. Ohlendorf for their kind helps.
Finally, I would extend my thanks to all my family members who have been a continuous
source of encouragement and support. My special thanks to my mother, my husband and my
lovely daughter for their patience and continous encouragement.
Abstract
Layer-wise slurry deposition (LSD) is an approach in solid freeform fabrication (SFF), that
can be used for fabrication of hydroxyapatite (HA) bone implants. In view of
biocompatibility, HA is a suitable ceramic material for hard tissue replacement implants. SFF
technique is the prototyping of objects directly from computer models without part-specific
tooling or human intervention.
A slurry is processed by a LSD device designed by the Clausthal University of Technology.
The general purpose of this method of rapid prototyping (RP) is to reduce the time for product
development by shortening the period between design and testing without using of any mould.
Another useful feature of the technology is to provide a relatively simple interface to the
sliced geometry from computer aided design (CAD) solids models of sources such as
computed tomography (CT) and magnetic resonance imaging (MRI) images.
LSD process is sequentially layering of slurry and then laser sintering of these layers. The aim
of the present work is to analyze the influence of laser parameters on the LSD fabrication
process of HA implant. The rheological properties of the hydroxyapatite slurries play an
important role in facilitating the layering operation. The most influential process parameters
on microstructure and composition of the samples are laser power and laser beam speed. The
current work focuses on the preparation of stable-dispersed HA ceramic slurries for LSD and
investigation on the effects of laser parameters on the LSD process and penetration depth. X-
ray diffraction (XRD), fourier transformation infrared spectroscopy (FTIR) and scaning
electron microscopy (SEM) were used to investigate the influence of laser parameters on the
formation of the phases. After laser sintering the presence of α-tricalcium phosphate (TCP)
and amorphous calcium phosphate (ACP) was detected. TCP and ACP are beneficial for
accelerated fixation and remodeling of the prothesis. The laser sintered samples have a high
porosity that the pore size of samples expressed as a function of laser parameters and green
density of layer.
Also, this current work includes comparing of the direct laser sintering process with
conventional sintering of layers.
Also, in this study, the fabrication of the porous and dense glass-reinforced HA composite by
laser sintering and conventional sintering has been investigated. The final microstructure
consisted of a triphasic bioceramic after sintering.
i

For future work, it is suggested further developments to revolve around the laser-sintered
second phase-reinforced HA (as such as HA/zirconia) composite in order to evaluate the
mechanical properties.
ii

Index 1. Introduction……………………………………………………………………………….1
1.1 Stabilization of HA suspensions……………………………………………………….3
1.2 Layer-wise slurry deposition (LSD) of HA…………………………………………....5
1.3 LSD of the HA-glass composite………………………………………….....................6
2. Literature survey
2.1 Overview on rapid prototyping ......................................................................................8
2.1.1 Rapid prototyping technologies………………………………………………….9
2.1.1a Stereolithography………………………………………………………....9
2.1.1b Solid ground curing……………………………………………………....10
2.1.1c Laminated object manufacturing………………………………………....11
2.1.1d Fused deposition modeling……………………………………………... 12
2.1.1e Selective laser sintering……………………………………………….....12
2.1.1f 3-D Ink-jet printing……………………………………………………....13
2.1.2 Introduction to laser materials processing……………………………………....14
2.2 Colloidal processing of ceramics……………………………………………………...17
2.2.1 Interparticle forces……………………………………………………………....17
2.2.2 Van der waals attractive forces……………………………………………….....17
2.2.3 Electrostatic forces ……………………………………………………………..19
2.2.4 Polymeric stabilization……………………………………………………….....19
2.2.4a Steric stabilization……………………………………………………......20
2.2.4b Depletion stabilization…………………………………………………...21
iii
2.2.4c Combinations of stabilization methods…………………………………....21
2.3 Suspension rheology………………………………………………………………….22
2.4 The drying behaviour of the bodies…………………………………………………..23
2.5 Introduction to bioceramics…………………………………………………………..24
2.5.1 Bioceramic types and their properties……………………………………….....24
2.5.2 Calcium phosphate ceramics types…………………………………………......25
2.5.3 Properties and applications of calcium phosphate bioceramics………...............27
2.5.4 HA-based ceramics……………………………………………………………..29
2.5.5 Synthesis and properties of HA..………… …………………………………....29
2.5.6 Dense HA ceramics…………………………………………………………......31
2.5.7 Porous HA ceramics……..…………………………………………………........31
2.5.8 Glass-reinforced HA composites…………………………………………..........32
3. Experimental procedure
3.1 Characterization of starting material………………………………………….............34
3.2 Slurry preparation and characterization……………………………………………....34
3.2.1 Viscosity measurements………………………………………………………..34
3.2.2 Measurement of the zeta potential……………………………………………...35
3.3 Layer-wise slurry deposition process………………………………………………...36
3.4 Characterization of the LSD HA and HA-glass composite…………………………..37
3.4.1 SEM investigation……………………………………………………………....37
3.4.2 XRD diffraction analysis……………………………………………………….37
3.4.3 DTA analysis…………………………………………………………………...38
3.4.4 FTIR analysis……………………………………………………………….......38
3.4.5 Porosimetry measurement………………………………………………………38
3.4.6 Density measurement ……………………………………………………..........39
iv
4. Results and discussion
4.1 Dispersion of HA powder in aqueous media…………………………………………..40
4.1.1 Particle/ floc size distribution…………………………………………………....40
4.1.2 The effect of dispersants on aqueous dispersibility of the HA powder…….........40
4.1.3 The effects of powder pre-treatments on powder characteristics and surface charge
of HA suspensions………………………………………………………….........43
4.1.4. Influence of deagglomeration time on dispersibility and rheology…………….50
4.2 Composition of the HA slips for the LSD process……………………………………54
4.3 The drying behaviour of the HA layers at the LSD process………………………......55
4.4 Comparative study of the LSD green layers……………………………………..........56
4.5 Laser sintering of the HA layers………………………………………………………58
4.5.1 The effect of laser parameters on microstructure ………………..……................58
4.5.2 The effect of solid loading on microstructure …………………………..……….63
4.5.3 The effect of laser parameters on phase composition ………...……………........65
4.6 Conventional sintering of HA layers…………………………………………….........75
4.6.1 Microstructure of the sintered HA layers……………………………………….75
4.6.2 Composition of the sintered HA layers……………………………………........77
4.7 Laser sintering of HA-glass composite layers………………………………………...78
4.7.1 The effect of laser parameters on microstructure ………………………………..79
4.7.2 The effect of laser parameters on phase composition …………………………...82
4.8 Conventional sintering of HA-glass composite layers………………….......................86
4.8.1 Microstructure of the sintered HA-glass layers…… …………………………....86
4.8.2 Composition of the sintered HA-glass layers…………………............................88
5. Conclusions and outlook………………………………………………………………....91
6. References………………………………………………………………………………...95
v
Chapter 1/ Introduction
1. Introduction
Calcium phosphate-based bioceramics have been used in medicine for 25 years
because of their excellent biocompatibility, bioactivity and osteoconductive
characteristics [1]. Hydroxyapatite (HA) and related calcium phosphate ceramic
materials have been widely used as implant materials due to their close similarity in
composition and high biocompatibility with natural bone. In view of biocompatibility,
hydroxyapatite (Ca10(PO4)6(OH)2) seems to be a suitable ceramic material for hard
tissue replacement implants, it forms a direct bonding with the neighboring bones. [2].
In fact, the dense and porous HA have been vigorously investigated as implant
materials for bone and tooth applications. It shows excellent biocompatibility with
hard tissues and also with skin and muscle tissues [3].
Nevertheless, due to the poor mechanical properties of bulk HA ceramics, these
cannot be used as implant devices to replace large bony defects or for load-bearing
applications. Accordingly, there has been much effort to improve the mechanical
properties of the HA. The mechanical properties of ceramics have been improved
significantly by additions of strong reinforcing agents. To be used as a reinforcing
agent for the HA, the biocompatibility of second phase should be considered most
importantly [1].
But the number of medical applications of HA are limited, due to the rate of
remodeling in the body over a long time period [4] and a relatively slow rate of
osseointegration [5]. A simple method for improving the rate of remodeling of a HA
implant is to introduce appreciable levels of a more resorbable calcium phosphate
phase, such as tricalcium phosphate (TCP) [6]. Although HA and TCP have only
slight differences in their chemical composition they differ in their biological
resorbing capacity [7]. At body temperature in contact with aqueous media such as
body fluids HA is a stable phase. Other phases such as TCP interact with water or
body fluids at 37 °C to form HA [8]. Clinical application of pure bioactive
hydroxyapatite can be improved with the bioresorbable tricalcium phosphate for
better bone regeneration. The main attractive feature of bioactive bone graft materials
is their ability to form a strong direct bond with the host bone resulting in a strong
interface [9]. Dense HA ceramic when used as a bone implant, is almost non-
resorbable and bioinert. An appropriate porosity coupled with its bioactivity provides
1

Chapter 1/ Introduction
improved conditions for accelerated growth of the bone tissue to achieve a full
integration with the living bones [7, 9].
There are 206 bones in the human body, all of which differ in size and shape from
each other and vary from person to person. For reconstructive and orthopedic surgery
applications the bone implant could be economically custom-made for patients by
using a medical computed tomography (CT) scan. A custom-made implant of actual
dimensions would reduce the time for performing the medical implantation and
possible risks to the patient. Another advantage of a prefabricated and exact-fit
implant is that it can be used more effectively and applied at the damage site rather
than a replacement is formulated during surgery from a paste or granular material
[10].
Rapid prototyping (RP) techniques can be used to fabricate dimensionally accurate
prototypes of bones. RP is a relatively new technology to produce the three-
dimensional (3-D) objects of complex shape directly from computer-aided design
(CAD) files. RP is also known as solid freeform fabrication. The general purpose of
RP is to reduce the time for product development by shortening the period between
design and testing. To date the use of RP in medicine has been mainly for surgical
planning and guidance with models being developed from CT or MRI data of the
patient. Another useful feature of the technology is to provide a relatively simple
interface to the sliced geometry from sources other than CAD solids models such as
CT and MRI medical imaging equipments [11]. Solid freeform fabrication (SFF) is
the prototyping of objects directly from computer models without part-specific tooling
or human intervention [12]. Layer-wise slurry deposition (LSD) is an approach of
SFF in which a part is built layer-wise by using slurries instead of dry powders. This
process consists of three stages namely, optimization of design, slurry development,
and laser sintering [13, 14, 15].
In near-net-shape forming, the principles underlying the stability of suspensions must
be well understood for preparing high solid loading, stable suspensions, defect free
ceramic green layers and successfully sintered layers in sequence. The objective of
the project was to demonstrate the overall feasibility of using the LSD process for
fabrication of near-net-shape bioceramic bone implants. The project involved several
areas of effort, including formulation of a low-shrinkage bioceramic slurry system,
2
Chapter 1/ Introduction
development and production of bioceramic layers suitable for the laser sintering
process, acquisition of a computer graphic file of appropriate format (Stl) for LSD and
development of LSD process parameters for making 3-D articles with the bioceramic
layers.
Also aim of the present work is to analyze the influence of scan size, scan spacing and
laser power on the LSD fabrication process of HA/ TCP/ amorph implant structures.
This work includes the direct laser sintering process without using a binder in the
slurry and comparing with conventional sintering of layers.
1.1 Stabilization of HA suspensions
The behaviour of HA aqueous suspensions is quite complex because of the changes in
the concentration of the hydroxylic groups on the surface due to the suspension
parameters or to the thermal treatment, as was pointed out by Galassi et al. [16].
The colloidal approach to powder processing is based on the control of the
interparticle forces through the modification of the reactivity at the solid-liquid
interface [17]. The spontaneously formed soft agglomerates due to van der Waals
attractive forces between the powder particles are broken down into individual
particles and dispersed by promoting interparticle repulsion by any or both of the
following methods: (i) through the control of surface charges either by adjustment of
pH of the medium or by adsorption of dispersants (electrolytes) on to the surface of
powder particles (electrostatic stabilization) and (ii) through steric separation of
individual particles by adsorption of neutral or charged large chain polymers on to the
particle surface (steric or electrosteric stabilization) [18, 19].
The flowing properties of the slurry will be consequently tailored so as to match the
rheological response required under the processing conditions. This can be achieved
through the optimization of the type and quantity of the dispersing agent, solid
loading, and the particle size distribution and shape of the powder particles. The
optimization of colloidal suspensions is in order to reach a low viscosity and stabile
that is the first step in order to produce homogeneous, defect free pieces. The kind and
amount of dispersant have great on the preparation of homogeneous, high
concentrated ceramics suspensions with low viscosity [20, 21].
3
Chapter 1/ Introduction
HA-based compositions are usually difficult to disperse in aqueous media, with the
suspensions achieving only low or moderate solids concentrations. Nordstrom et al
[22] found slip casting of the commercial HA powder to be difficult, because of the
lower zeta potential values for the slip.
Toriyama et al. [23] investigated the dispersion behaviour of mechanochemically
synthesized HA powders in water, using various dispersing agents. They observed
that, although pH modification had a negligible effect, anionic polyelectrolytes at
considerably higher concentrations (3wt%) effectively stabilized the suspensions
through an electrosteric mechanism.
In this study the dispersion behaviour of HA powders in aqueous media has been
investigated that it has been monitored by particle size, viscosity and zeta potential
analyses as a function of pH of the slurry and the quantity of two dispersing inorganic
and organic agents. It has been observed that, anionic polyelectrolytes at
concentrations (0.75 wt%) effectively stabilized the suspensions through an
electrosteric mechanism.
The key point at the LSD process is the preparation of a HA concentrated suspension
with optimised flow behaviour [24, 25, 26]. In order to obtain the high green density
and reduce the final shrinkage of components, the solids loading of the suspension
must be as high as possible while the viscosity should be kept low enough for
processing.
In order to obtain the dispersed slurries with high solid content it is necessary to study
the different factors affecting their stability and rheology, such as the characteristics
of the dispersing medium, type and amount of dispersant, powder characteristics
(specific surface area, chemical composition and size distribution of the powder
particles) and preparation time of slurries. The surface properties play a critical role in
the dispersing behavior in water. A successful processing requires the use of well
deagglomerated and relatively high concentrated suspensions. For obtaining such
suspensions, the complex interfacial reactions between solvent media, dispersant,
powders and additives must be taken into account. The present study is aimed at
investigating the optimization of an aqueous dispersion of HA powder synthesized by
powder pre-treatments. In this work the above-mentioned aspects has been studied
using powders of HA calcinated at temperatures ranging between 700 and 1000 °C.
Slurries with high solid content (up to 75 wt %) and good fluidity has been obtained.
4
Chapter 1/ Introduction
1.2 Layer-wise slurry deposition (LSD) of HA
LSD is one of the established solid freeform fabrication (SFF) manufacturing
processes that can build three-dimensional objects directly from computer models
without part-specific tooling or human intervention. Meanwhile, there have been great
efforts to develop implantable materials that can assist in regeneration of bone defects
and injuries.
LSD can be used for fabrication of porous and dense ceramics and composites that it
is based on layer-wise deposition of highly loaded colloidal slurries. The process is
essentially binderless with less than 1% organics and layers can be fabricated, dried,
and completely sintered.
These efforts include material selection, preparation of slurry, LSD process parameter
optimization.
Porous HA implants have been widely used in various fields (orthopaedics,
maxillofacial, etc.) and have demonstrated bone in-growth into the open pores on the
surface of the implant [27]. The porosities in human bone are predominantly in the
range of 1-100 µm. The canaliculi and vasculature channels are 1-5 µm in diameter.
Osteocyte lacunae and Volksmann's canals are typically 5-15 µm in diameter, and the
larger Haversian canals are between 50 and 100 µm in diameter. A minimum pore
size of 100 µm is necessary for tissue in-growth into the bone grafts to maintain blood
supply in the connective tissues. As the bone cells grow within the interconnected
pore channels, the implant serves as a structural bridge or scaffold for bone formation.
A pore size of approximately 100-150 µm has been established as necessary, but
interconnectivity is more critical than the pore size. Macroporous scaffolds based on
ceramics and glass-ceramics have been produced by several techniques such as the
use of polymeric sponge, foaming process. Synthetic HA for bone substitution can be
produced with a range of porosities depending on the method of processing. The
porosity can be classified according to pore diameter as macroporosity (>10µ) and
microporosity (<10µ) and it has been suggested that these structural modifications
influence the biocompatibility of HA [28].
Laser sintering of oxide ceramics is a fast process because the oxides effectively
absorb CO2 laser radiation [29].
5
Chapter 1/ Introduction
The microstructure and composition evolution during the laser sintering and
conventional sintering are also a subject for this work.
1.3 LSD of HA-glass composite
In order to increase the mechanical strength of HA, a variety of processing techniques
have been developed. Knowles et al. reported that mechanical properties of
unmodified HA can be improved significantly by adding a small amount of CaO-
P2O5-Na2O-based sintering additives [30].
The chemical analysis of the inorganic part of bone is complex because of ion
substitution that may occur in hydroxyapatite lattice, where CO32− is a common
substitute for OH− or PO4 3−, Mg2+ and Na+ for Ca2+, and F− for OH−. Therefore, there
is a need to include these trace elements in the HA used for implants and prostheses,
since the biological behaviour of apatites is strongly dependent on their composition.
Using glasses within the P2O5-CaO system with additions of Na+, Mg2+, and K+ ions,
glass-reinforced HA composites can be prepared by a liquid-phase sintering process,
with much higher biaxial bending strength than commercial sintered HA [31]. It has
been speculated that the flexural bending of these composites is related to some
microstructural characteristics such as the presence of secondary phase, β and α-TCP
and the percentage of porosity in the microstructures. In vivo performance of this
composite plays a vital role in the integrity and the function of bone and soft
connective tissues. Lopes et al. confirmed that toughness and hardness of glass
reinforced HA composite are highly depended on microstructural characteristic [32].
Calcium phosphate bioceramics can be used in applications where bone ingrowth is
intended. In this application, the ideal material is the one with a degradation ratio
similar to that of new bone formation. It is well established that pure and crystalline
hydroxyapatite has a low degradation ratio in vivo. For this reason, recent studies
have pointed to the design of multiphasic calcium phosphate bioceramics as bone
fillers [33]. These materials contain other calcium phosphates with higher solubility
when compared to pure hydroxyapatite. Tricalcium phosphates are bioactive ceramics
that can be associated to hydroxyapatite. These bioceramics exhibit polimorphism: α-
TCP and β-TCP. In temperatures above 1300 ºC, β-TCP is likely to decompose in α-
TCP [34].
6

Chapter 1/ Introduction
In this study, the fabrication of the dense and porous glass- HA composite by laser
sintering and conventional sintering has been investigated. The final microstructure
consisted of a triphasic bioceramic after sintering.
7
Chapter 2/ Literature survey
2 Literature survey
2.1 Overview on rapid prototyping
The term rapid prototyping (RP) refers to a class of technologies that can automatically
construct physical models from computer-aided design (CAD) data. These "three dimensional
printers" allow designers to quickly create tangible prototypes of their designs, rather than just
two-dimensional pictures. Prototypes are also useful for testing a design that it is as desired or
needs improvement. For designers RP allows them to be made faster and less expensively [35,
36].
RP techniques can also be used to make tooling (referred to as rapid tooling) and even
production-quality parts (rapid manufacturing). For small production runs and complicated
objects, rapid prototyping is often the best manufacturing process available. Of course,
"rapid" is a relative term. Most prototypes require from three to seventy-two hours to build,
depending on the size and complexity of the object. This may seem slow, but it is much faster
than the weeks or months required to make a prototype by traditional means such as
machining. These dramatic time savings allow manufacturers to bring products to market
faster and more cheaply [35].
At least six different rapid prototyping techniques are commercially available. Because RP
technologies are being increasingly used in non-prototyping applications, the techniques are
often collectively referred to as solid free-form fabrication, computer automated
manufacturing, or layered manufacturing. The latter term is particularly descriptive of the
manufacturing process used by all commercial techniques. A software package "slices" the
CAD model into a number of thin (~0.1 mm) layers, which are then built up one atop another.
Rapid prototyping is an "additive" process, combining layers of paper, wax, or plastic to
create a solid object. In contrast, most machining processes (milling, drilling, grinding, etc.)
are "subtractive" processes that remove material from a solid block. RP’s additive nature
allows it to create objects with complicated internal features that cannot be manufactured by
other means [35, 37].
Rapid prototyping is widely used in the automotive, aerospace, medical, and consumer
products industries. Part volume is generally limited to 0.125 cubic meters or less, depending
on the RP machine. Mechanical performance of the fabricated parts is limited by the materials
8
Chapter 2/ Literature survey
that must be used in the RP process. Ceramic and metal prototypes are difficult to make,
though this should change in the near future.
Although several rapid prototyping techniques exist, all employ the same basic five-step
process. The steps are:
1. Create a CAD model of the design
2. Convert the CAD model to STL format
3. Slice the STL file into thin cross-sectional layers
4. Construct the model one layer atop another
5. Clean and finish the model
2.1.1 Rapid prototyping technologies
There are various ways to classify the RP techniques that have currently been developed. The
RP classification used here is based on the form of the starting material. Most commercially
available rapid prototyping machines use one of six techniques [35].
• Liquid-based rapid prototyping systems: Starting material is a liquid.
Stereolithography and solid ground curing systems are described here.
• Solid-based rapid prototyping systems: Starting material is a solid.
Laminated object manufacturing and fused deposition modeling systems are presented here.
• Powder-based rapid prototyping systems: Starting material is a powder.
Selective laser sintering and three dimensional printing systems are described here.
2.1.1a Stereolithography
Patented in 1986, stereolithography started the rapid prototyping revolution. The technique
builds three-dimensional models from liquid photosensitive polymers that solidify when
exposed to ultraviolet light. As shown in Fig. 1.2, the model is built upon a platform situated
just below the surface in a vat of liquid epoxy or acrylate resin. A low-power highly focused
UV laser traces out the first layer, solidifying the model’s cross section while leaving excess
areas liquid [38].
Next, an elevator incrementally lowers the platform into the liquid polymer. A sweeper re-
coats the solidified layer with liquid, and the laser traces the second layer atop the first. This
9

Chapter 2/ Literature survey
process is repeated until the prototype is complete. Afterwards, the solid part is removed from
the vat and rinsed clean of excess liquid. Supports are broken off and the model is then placed
in an ultraviolet oven for complete curing [38].
Figure 1.2 Schematic diagram of stereolithography [38].
2.1.1b Solid ground curing
Developed by Cubital, solid ground curing (SGC) is somewhat similar to SLA in that both use
ultraviolet light to selectively harden photosensitive polymers. Fig. 2.2 shows schematic
diagram of SGC process. First, photosensitive resin is sprayed on the build platform. Next, the
machine develops a photomask (like a stencil) of the layer to be built. This photomask is
printed on a glass plate above the build platform using an electrostatic process similar to that
found in photocopiers. The mask is then exposed to UV light, which only passes through the
transparent portions of the mask to selectively harden the shape of the current layer.
Fig. 2. 2 Schematic diagram of solid ground curing [38].
10

Chapter 2/ Literature survey
After the layer is cured, the machine vacuums up the excess liquid resin and sprays wax in its
place to support the model during the build. The top surface is milled flat, and then the
process repeats to build the next layer. When the part is complete, it must be de-waxed by
immersing it in a solvent bath. The sequence for each layer takes about 90 seconds. Time to
produce a part by SGC is claimed to be about eight times faster than other RP systems and
can produce larges models [38, 39].
2.1.1c Laminated object manufacturing
Laminated object manufacturing (LOM) was developed in 1985 and commercialised by
Helisys Corporation in the USA to build components with layers of paper or plastic [38].
The original material consists of paper laminated with heat-activated glue and rolled up on
spools. As shown in Fig. 3.2 a focused laser cuts the outline of the first layer into the paper
and then cross-hatches the excess area (the negative space in the prototype). During the build,
the excess material provides excellent support for overhangs and thin-walled sections. After
the first layer is cut, the platform lowers out of the way and fresh material is advanced. The
platform rises to slightly below the previous height, the roller bonds the second layer to the
first, and the laser cuts the second layer. This process is repeated as needed to build the part,
which will have a wood-like texture. Because the models are made of paper, they must be
sealed and finished with paint or varnish to prevent moisture damage. Helisys developed
several new sheet materials, including plastic, water-repellent paper, and ceramic and metal
powder tapes. The powder tapes produce a "green" part that must be sintered for maximum
strength [38].
Fig. 3.2 Schematic diagram of laminated object manufacturing [38].
11
Chapter 2/ Literature survey
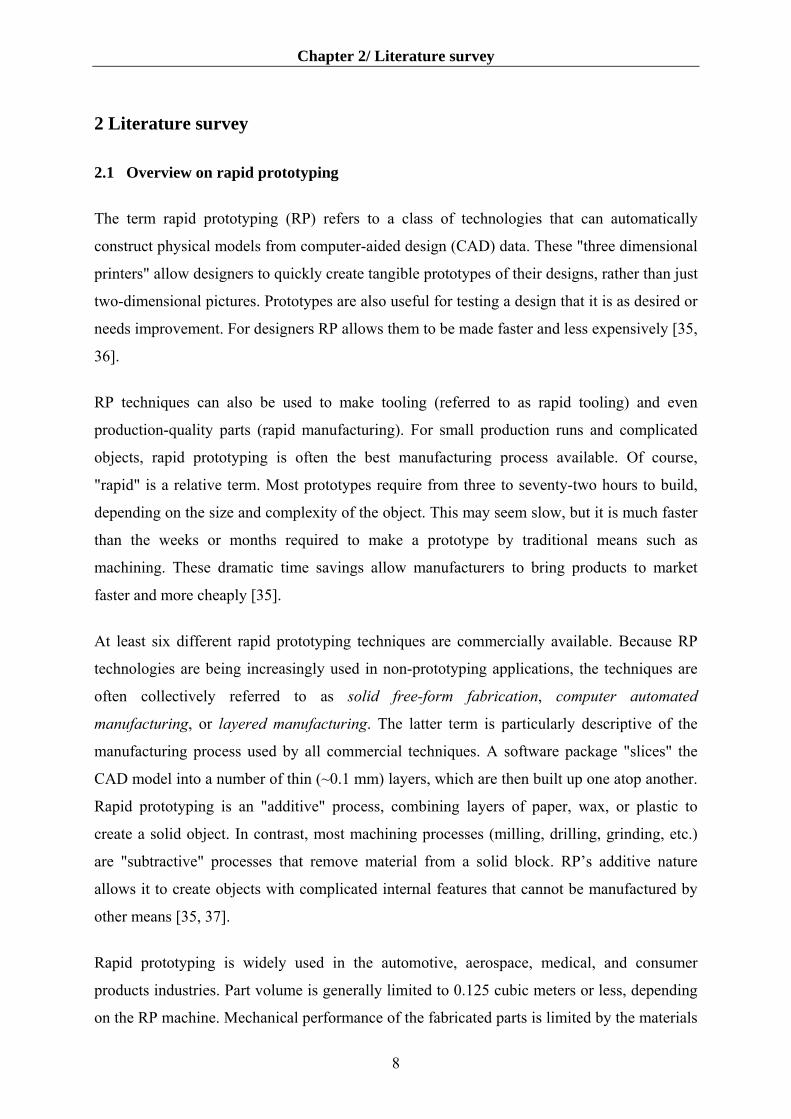
2.1.1d Fused deposition modeling
In this technique, filaments of heated thermoplastic are extruded from a tip that moves in the
x-y plane. Like a baker decorating a cake, the controlled extrusion head deposits very thin
beads of material onto the build platform to form the first layer. The platform is maintained at
a lower temperature, so that the thermoplastic quickly hardens. After the platform lowers, the
extrusion head deposits a second layer upon the first. Supports are built along the way,
fastened to the part either with a second, weaker material or with a perforated junction [35,
38]. Fig. 4.2 shows schematic diagram of FDM.
Fig. 4.2 Schematic diagram of fused deposition modelling [35].
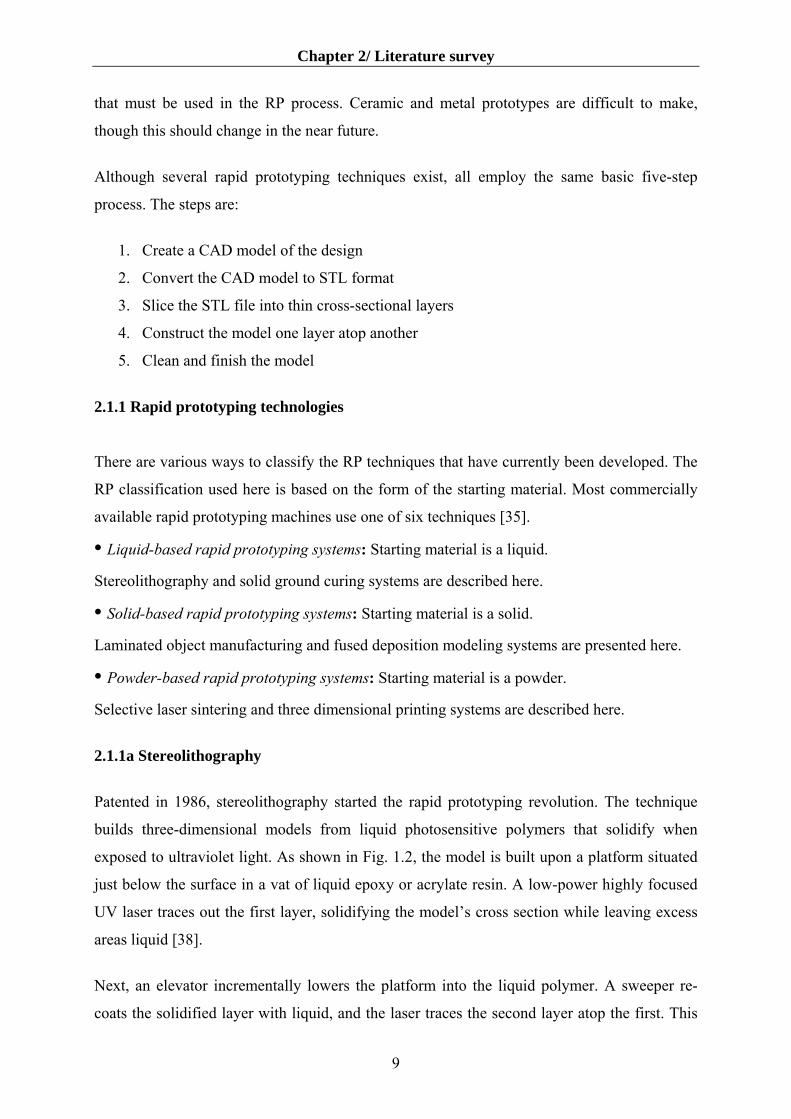
2.1.1e Selective laser sintering
Developed by Carl Deckard at the University of Texas, selective laser sintering was patented
in 1989 [38]. The technique, shown in Fig. 5.2, uses a laser beam to selectively fuse powdered
materials, such as nylon, elastomer, and metal, into a solid object. Parts are built upon a
platform which sits just below the surface in a bin of the heat-fusable powder. The platform is
lowered by the height of the next layer and powder is reapplied. This process continues until
the part is completed. Excess powder in each layer helps to support the part during the build.
Parts processed by SLS are often porous and post processing is necessary when strength is
required in ceramic parts. Conventional sintering and hot isostatic pressing are two common
12
Chapter 2/ Literature survey
methods used to increase final density. No support structure is needed as the non-fused
powder remains in place to act as a support itself [38, 40].
Fig. 5.2 Schematic diagram of selective laser sintering [35].
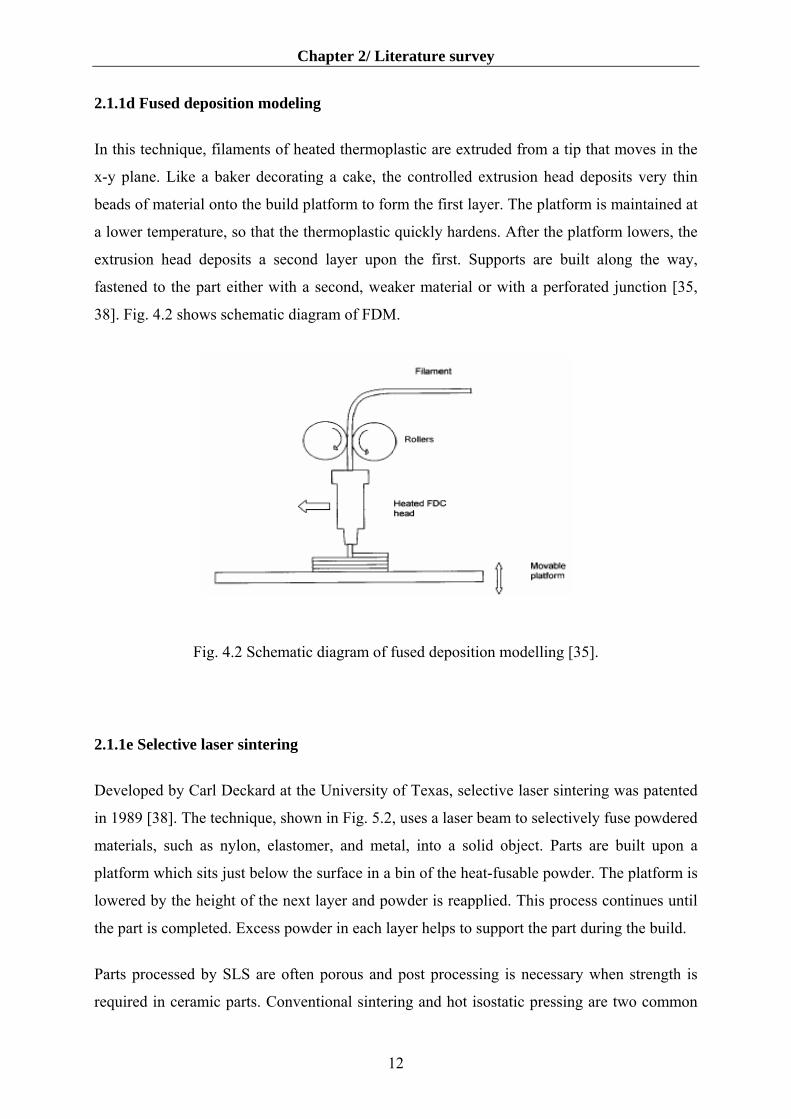
2.1.1f 3-D Ink-jet printing
Three-dimensional printing (3DP) was developed at MIT in 1992 as a method to create
performs from powdered metals and ceramics [38]. As shown in Fig. 6.2, parts are built upon
a platform situated in a bin full of powder material. An ink-jet printing head selectively
deposits or "prints" a binder fluid to fuse the powder together in the desired areas. Unbound
powder remains to support the part. The platform is lowered, more powder added and leveled,
and the process repeated.
Fig. 6.2 Three dimensional printing: (1) powder layer is deposited, (2) ink-jet printing of areas
that will become the part, and (3) piston is lowered for next layer (key: v = motion) [38].
13
Chapter 2/ Literature survey
When finished, the green part is then removed from the unbound powder, and excess unbound
powder is blown off. Finished parts can be infiltrated with wax or other sealants to improve
durability and surface finish. Typical layer thicknesses are on the order of 0.1 mm. This
process is very fast, and produces parts with a slightly grainy surface. This yields extremely
good accuracy, allowing the machines to be used in the jewelry industry. Three–dimensional
printing does not require high energy, does not involve lasers or any toxic materials and is
relatively cheap and fast [38, 40].
2.1.2 Introduction to laser materials processing
The first laser is attributed to Theodore Maiman, who successfully excited a ruby crystal to
emit light in 1960 [41]. Since the late 1960 s, the CO2 laser has been the workhorse in various
industrial materials processing applications. Over the past decade, the neodymium ion-doped
yttrium aluminum garnet (Nd: YAG) solid-state lasers have become increasingly popular for
manufacturing applications, due to better absorptivity and the ability to use fiber optics for
beam transport.
There is a straightforward approach to understanding laser processing which is relevant for
every situation. This approach considers the only processes that can occur when a laser beam
strikes a surface. A laser or any light beam, is either reflected or absorbed or transmitted.
Expressed very simply: Reflection + Absorption + Transmission = 1
In almost all practical situations, some or all three processes occur. Furthermore, considering
the relative amounts of each of these processes that occur to be also useful in a particular
process. The next assumption in almost practical situations, some of the photons are absorbed
by the target and these photons are converted into thermal energy at the target, heat, that it
may be either conducted, radiated or convected away from the area. But conduction is the
dominating process. If the rate of heat input to the target zone is greater than the rate of
conduction of heat away from the target zone, then the temperature rises locally and either
melting or vaporization or a combination of both occurs [41].
A significant proportion of the beam is absorbed by the target, as this is usually the case in the
majority of industrial laser processes. It is widely accepted that there are three dominating
factors:
• average power of the laser beam
14

Chapter 2/ Literature survey
• intensity of the laser spot on the target
• wavelength of the laser beam.
Of these three, perhaps the average power in watts is the easiest to understand and the
intensity and wavelength need some explanation. Intensity (or irradiance), is usually
calculated approximately by dividing the power of the beam by the spot area. For a fixed
wavelength, the laws of physics tell us that all the photons have the same energy. For a shorter
wavelength beam, the energy of each photon is higher. This initial reaction may be then
sustained or not sustained according to the heat input or average power in watts (W) of the
laser beam. The average power of a laser beam is very easy to understand and measure,
especially for a continuous wave (CW) beam. For a pulsed beam, the product of the pulse
energy and the pulse repetition rate gives us the average power [41].
When this stream of pure light or photons are absorbed by a surface, usually, the energy is
converted into vibration of the atoms which in effect heats up the surface, although in some
cases this can be on the scale of a few thousandths of a millimeter (or microns) when energy
of photons is high enough. Under certain very special conditions these photons may break an
atomic bond. The majority of laser processes are however, thermal in nature, they are the
result of the generation of controlled melting and vaporization processes. There are two other
generalizations which may also help: we may visualize the wavelength of the laser beam and
the intensity of the laser spot on the target as controlling the initial reaction of the target to the
beam and the average power as determining the rate of the process [41].
Fig. 7.2 shows schematically the interaction of a laser beam with a structure. Assuming a
reasonable degree of absorption (with ignore transmission), the incident photons are absorbed
either due to excitation of electrons or for longer wavelengths, excitation of vibrational
modes.
The desirable wavelengths for optimum energy absorption for reflective alloys include visible
end (511 nm) to near-infrared (1.06 µm) wavelengths as found in solid-state lasers. Fig. 8.2
shows absorbtion curve of various lasers by metals, insulators.
In metals, absorption takes place very near the surface and can occur by excitation of both
conduction band (free electron-like) and valance band (interband absorption) electrons are the
absorbing entities. These electrons transfer their increased kinetic energy to the lattice via
phonon scattering on time scales of ps, resulting in a temperature increase. For long pulses (>
ps) heating is occurring during the pulse and so in general one can treat light energy to heat in
15

Chapter 2/ Literature survey
one step. For semiconductors and insulators, absorption is either through vibrational
excitation (requiring infrared light matching allowed vibrational transitions of the material) or
electronic excitations (e.g., via chromophores, defects, or band-to-band transitions). The
practical use of lasers in fabrication is dominated by thermal processes thus arguing over
“photoelectronic” vs. “photothermal” is moot [27, 41].
Fig. 7.2 Schematic of relevant interactions and consequences of energy absorption [41].
Fig. 8.2 Absorbtion curve of various lasers by metals, insulators [27].
16

Chapter 2/ Literature survey
2.2 Colloidal processing of ceramics
The term "colloid" is used to describe particles that possess at least one dimension in the size
range 1 to 1000 nm [42].
Colloidal processing of ceramics is reviewed with an emphasis on interparticle forces and
suspension rheology.
2.2.1 Interparticle forces
Through careful control of interparticle forces, colloidal suspensions can be prepared in the
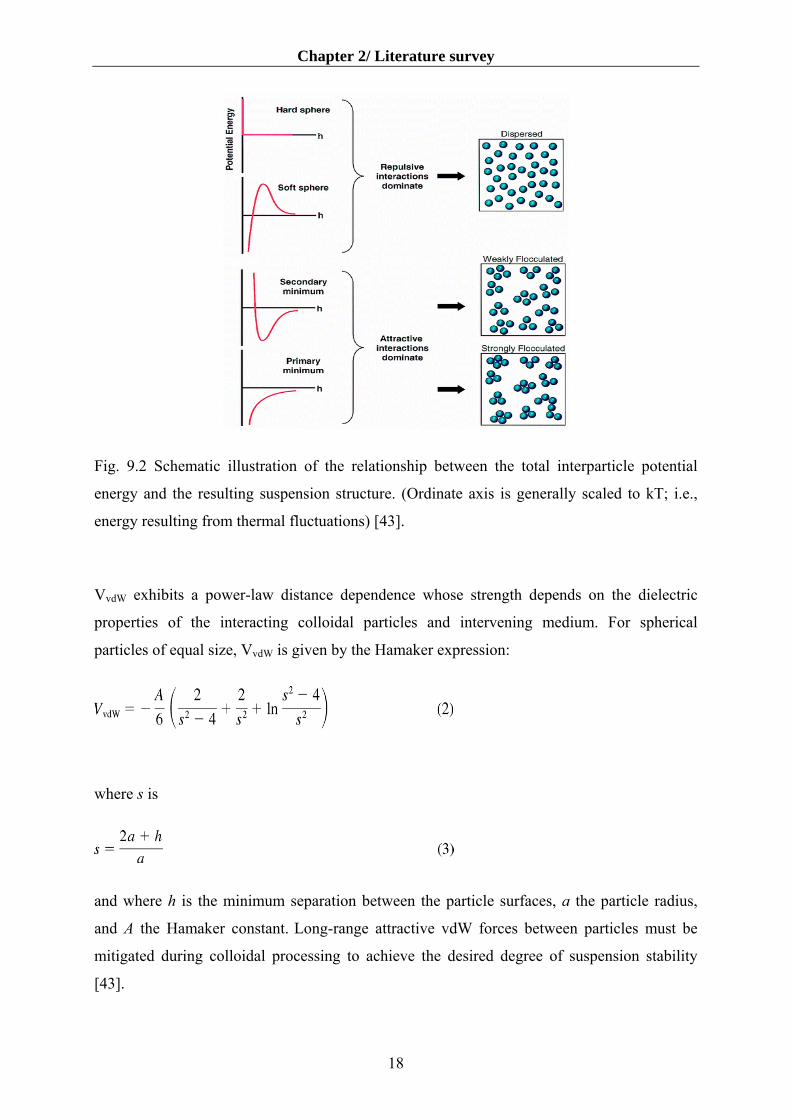
dispersed, weakly flocculated, or strongly flocculated states, as shown schematically in Fig. 9.
2. In the dispersed state, discrete particles that exist in the suspension repel one another on
close approach, provided the repulsive barrier is >>kbT. In the weakly flocculated state,
particles aggregate in a shallow secondary minimum (well depth ≈ 2-20 kbT), forming isolated
clusters (or flocs) in suspension at volume fractions below the gel point (φ <φ gel) or a particle
network at higher volume fractions (φ ≥ φ gel). In this case, an equilibrium separation distance
exists between aggregated particles. In contrast, particles aggregate into a deep primary
minimum in the strongly flocculated (or coagulated) state, forming either a touching particle
network or individual clusters in suspension, depending on their concentration.
Colloidal stability is governed by the total interparticle potential energy, Vtotal, which can be
expressed as
Vtotal = VVdW + Velect + VSteric+ VStructural (1)
where VvdW is the attractive potential energy due to long-range van der Waals interactions
between particles, Velect the repulsive potential energy resulting from electrostatic interactions
between like-charged particle surfaces, Vsteric the repulsive potential energy resulting from
steric interactions between particle surfaces coated with adsorbed polymeric species, and
Vstructural the potential energy resulting from the presence of nonadsorbed species in solution
that may either increase or decrease suspension stability [42, 43].
2.2.2 Van der Waals attractive forces
Long-range forces resulting from van der Waals (vdW) interactions are ubiquitous and always
attractive between like particles.
17
Chapter 2/ Literature survey
Fig. 9.2 Schematic illustration of the relationship between the total interparticle potential
energy and the resulting suspension structure. (Ordinate axis is generally scaled to kT; i.e.,
energy resulting from thermal fluctuations) [43].
VvdW exhibits a power-law distance dependence whose strength depends on the dielectric
properties of the interacting colloidal particles and intervening medium. For spherical
particles of equal size, VvdW is given by the Hamaker expression:
where s is
and where h is the minimum separation between the particle surfaces, a the particle radius,
and A the Hamaker constant. Long-range attractive vdW forces between particles must be
mitigated during colloidal processing to achieve the desired degree of suspension stability
[43].
18

Chapter 2/ Literature survey
2.2.3 Electrostatic forces (Electrical double layer stabilization)
The stability of aqueous colloidal systems can be controlled by generating like-charges of
sufficient magnitude on the surfaces of suspended ceramic particles. The resulting repulsive
Velect exhibits an exponential distance dependence whose strength depends on the surface
potential induced on the interacting colloidal particles and the dielectric properties of the
intervening medium. Exact analytical expressions for the electrostatic potential energy cannot
be given; therefore, analytical approximations or numerical solutions are used. For spherical
particles of equal size that approach one another under conditions of constant potential, Velect
is given by
provided ka is sufficiently large (>10). In contrast, when the double layer around each particle
is extensive (ka < 5), Velect is given by
where ε r is the dielectric constant of the solvent, ε 0 the permittivity of vacuum, ψ 0 the
surface potential, and 1/k the Debye-Hückel screening length. k is given by
where Ni and zi are the number density and valence of the counterions of type i, and F the
Faraday constant. ψ 0 results from the dissociation of amphoteric hydroxyl groups present on
oxide surfaces and depends on pH and indifferent electrolyte concentration. It can be
estimated from the zeta potential (ξ ), which measures the electrostatic potential at, or very
near to, the beginning of the diffuse double layer [42, 43].
2.2.4 Polymeric stabilization
The spatial extension of polymer molecules of even modest molecular weights is usually
comparable to the range of the London attraction between colloidal particles and of course
greater than the range of van der Waals force and it can generate repulsion. There is a
19

Chapter 2/ Literature survey
minimum thickness of a polymer layer at the particles surface for stabilization. The minimum
depends on the particle size and the magnitude of the Hamaker constant. One major advantage
of macromolecules is that their dimensions are relatively insensitive to electrolyte
concentration, unlike electrical double layers. In addition, polymeric stabilization can be more
powerful than electrostatic stabilization, providing stability for a longer time and at high
solids loading. When flocculation or phase separation does occur, it is normally reversible, a
suitable change in the solvent conditions will redisperse the particles spontaneously. There are
at present two different mechanisms whereby polymer chains can impart colloid stability:
steric stabilization and depletion stabilization [43].
2.2.4a Steric stabilization
Steric stabilization of colloidal particles is produced by macromolecules that are attached (e.g.
by grafting or by physical adsorption) to the surfaces of the particles (Fig. 10. 2a). If enough
polymer adsorbs, the thickness of the coating is sufficient to keep particles separated by steric
repulsion between the polymer layers, and at those separations the van der Waals forces are
too weak to cause the particles to adhere. This is presented schematically in Figure 10. 2a. For
small particles, Brownian motion is then sufficient to keep them suspended indefinitely. The
steric repulsion can be regarded as a loss in configuration entropy that occurs when polymer
chains of two particles interpenetrate. This produces an increase in the free energy of the
system. The positive ∆G for polymer chain interpenetration which leads to steric stabilization
is given in terms of the corresponding enthalpy and entropy changes by ∆G = ∆H - Τ∆S, and
therefore, stabilization could be the result of a positive ∆H and/or a negative ∆S. A positive
∆H would reflect the release of bound solvent from the polymer chains as they interpenetrate
and a negative ∆S would reflect loss of configurational freedom as the polymer chains
interpenetrate. If ∆H is positive and/or ∆S negative, the dispersion will be sterically stabilized
at all accessible temperatures. However, if ∆H and ∆S are both positive, the dispersion should
flocculate on heating (enthalpic stabilization), whereas if ∆H and ∆S are both negative, the
dispersion should flocculate on cooling below the theta-temperature (entropic stabilization)
[43].
The interactions between particles for steric stabilization have not been quantified. To
describe the magnitude and range of the interaction between polymer layers, the solution
properties of the polymer and the conformations of the polymer at the solid-liquid interface
need to be considered [44].
20
Chapter 2/ Literature survey
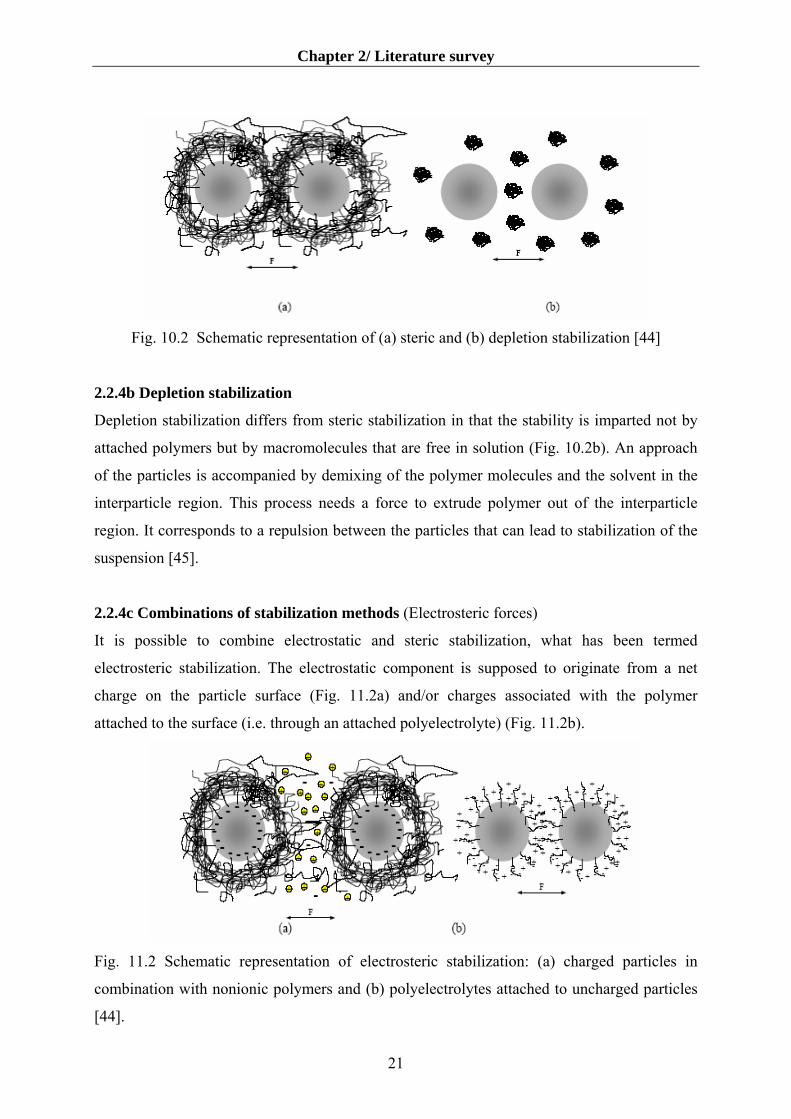
Fig. 10.2 Schematic representation of (a) steric and (b) depletion stabilization [44]
2.2.4b Depletion stabilization
Depletion stabilization differs from steric stabilization in that the stability is imparted not by
attached polymers but by macromolecules that are free in solution (Fig. 10.2b). An approach
of the particles is accompanied by demixing of the polymer molecules and the solvent in the
interparticle region. This process needs a force to extrude polymer out of the interparticle
region. It corresponds to a repulsion between the particles that can lead to stabilization of the
suspension [45].
2.2.4c Combinations of stabilization methods (Electrosteric forces)
It is possible to combine electrostatic and steric stabilization, what has been termed
electrosteric stabilization. The electrostatic component is supposed to originate from a net
charge on the particle surface (Fig. 11.2a) and/or charges associated with the polymer
attached to the surface (i.e. through an attached polyelectrolyte) (Fig. 11.2b).
Fig. 11.2 Schematic representation of electrosteric stabilization: (a) charged particles in
combination with nonionic polymers and (b) polyelectrolytes attached to uncharged particles
[44].
21
Chapter 2/ Literature survey
Electrosteric stabilization is common in biological systems. In addition to electrosteric
stabilization, it is possible to have combinations of depletion stabilization with both steric
and/or electrostatic stabilization. The combination of depletion and steric stabilization is quite
common at high concentrations of free polymer in the dispersion medium [44, 45].
2.3 Suspension rheology
The rheological behavior of colloidal dispersions is among their most important properties.
Rheological measurements monitor changes in flow behavior in response to an applied stress
(or strain) [46].
In viscous flow behaviour, the apparent viscosity (η ) is related to the applied shear stress (τ )
and shear rate by the following expression: ●
τ = ηγ ●
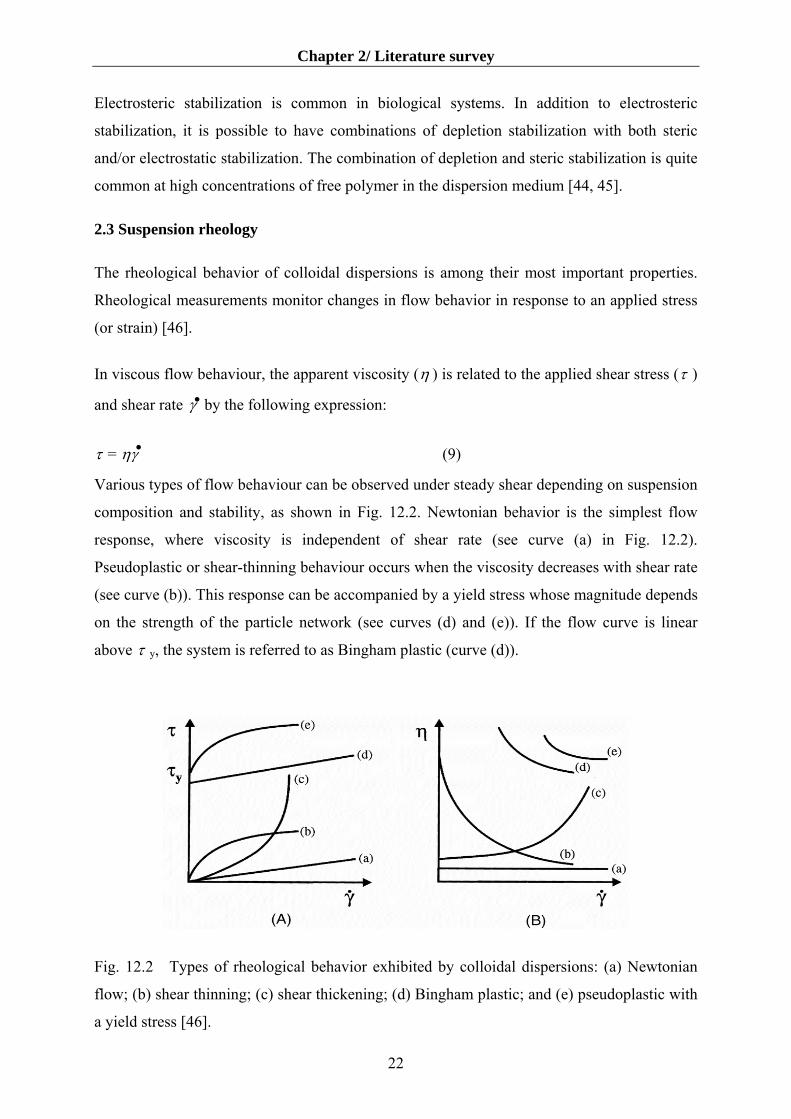
Various types
composition
response, wh
Pseudoplastic
(see curve (b
on the streng
above τ y, the
Fig. 12.2 T
flow; (b) shea
a yield stress
γ
(9)of flow behaviour can be observed under steady shear depending on suspension
and stability, as shown in Fig. 12.2. Newtonian behavior is the simplest flow
ere viscosity is independent of shear rate (see curve (a) in Fig. 12.2).
or shear-thinning behaviour occurs when the viscosity decreases with shear rate
)). This response can be accompanied by a yield stress whose magnitude depends
th of the particle network (see curves (d) and (e)). If the flow curve is linear
system is referred to as Bingham plastic (curve (d)).
ypes of rheological behavior exhibited by colloidal dispersions: (a) Newtonian
r thinning; (c) shear thickening; (d) Bingham plastic; and (e) pseudoplastic with
[46].
22
Chapter 2/ Literature survey
Finally, dilatent or shear-thickening behaviour occurs when the viscosity increases with shear
rate (see curve (c)). The rheological properties of concentrated colloidal suspensions are often
time dependent. Thixotropic systems exhibit an apparent viscosity that decreases with time
under shear, but recovers to its original viscosity when flow ceases. The opposite behaviour is
referred to as rheopexy [46].
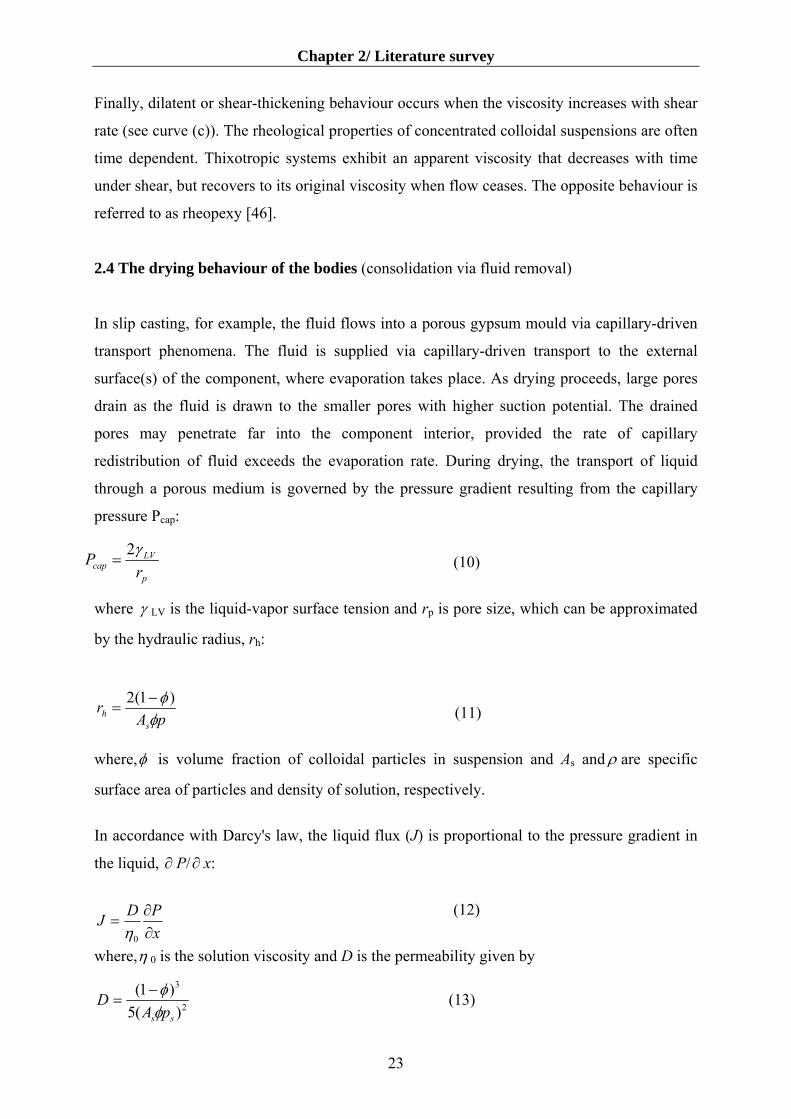
2.4 The drying behaviour of the bodies (consolidation via fluid removal)
In slip casting, for example, the fluid flows into a porous gypsum mould via capillary-driven
transport phenomena. The fluid is supplied via capillary-driven transport to the external
surface(s) of the component, where evaporation takes place. As drying proceeds, large pores
drain as the fluid is drawn to the smaller pores with higher suction potential. The drained
pores may penetrate far into the component interior, provided the rate of capillary
redistribution of fluid exceeds the evaporation rate. During drying, the transport of liquid
through a porous medium is governed by the pressure gradient resulting from the capillary
pressure Pcap:
p
LVcap r
P γ2= (10)
where γ LV is the liquid-vapor surface tension and rp is pore size, which can be approximated
by the hydraulic radius, rh:
pAr
sh φ
φ )1(2 −= (11)
where,φ is volume fraction of colloidal particles in suspension and As and ρ are specific
surface area of particles and density of solution, respectively.
In accordance with Darcy's law, the liquid flux (J) is proportional to the pressure gradient in
the liquid, P/ ∂ x: ∂
(12) xPDJ
∂∂
=0η
where,η 0 is tithe solu on viscosity and D is the permeability given by
2
3
)(5)1(
ss pAD
φφ−
= (13)
23

Chapter 2/ Literature survey
The length scale (lcap) over which capillary migration occurs during drying has been derived
previously:
2/1
20
3
)(5)1)((2
⎥⎦
⎤⎢⎣
⎡ −∆=
ssEcap pAV
PHlφη
φ (14)
where H is the layer thickness, VE is the evaporation rate, ρs is density of colloidal particles
and ∆P is the pressure drop estimated from Eq (10). The importance of capillary-driven liquid
migration is shown by comparing lcap to the characteristic size of the drying layer (or body) H.
When lcap> H, the liquid-vapor interface penetrates into the layer as an irregular front. In
contrast, when lcap<< H, the liquid-vapor interface penetrates into the body as a planar front.
This latter situation should be avoided, because it leads to a sharp stress gradient that
promotes cracking. As shown in Eq (14), lcap can be increased by decreasing the drying rate
VE, increasing the initial solids loading in suspension, or decreasing the fluid viscosity [47,
48].
2.5 Introduction to bioceramics
Revolution has occurred in the use of ceramics during the past four decades to improve the
quality of life. The development of advanced materials for biomedical applications is among
the most important problems facing modern materials engineering. This revolution is the
innovative use of specially designed ceramics for the repair, reconstruction, and replacement
of diseased or damaged parts of the body. Ceramics used for this purpose are termed
‘‘bioceramics’’ [49].
2.5.1 Bioceramic types and their properties
The class of ceramics used for repair and replacement of diseased and damaged parts of
musculoskeletal systems are termed bioceramics. Bioceramics have become a diverse class of
biomaterials presently including three basic types: bioinert high strength ceramics, bioactive
ceramics which form direct chemical bonds with bone or even with soft tissue of a living
organism; various bioresorbable ceramics that actively participate in the metabolic processes
of an organism with the predictable results [1]. Alumina (Al2O3), zirconia (ZrO2) and carbon
are termed bioinert. HA and bioglass are bioactive. Calcium phosphate ceramics are
categorized as bioresorbable. Bioceramics became an accepted group of materials for medical
24

Chapter 2/ Literature survey
applications, mainly for implants in orthopaedics, maxillofacial surgery and for dental
implants [49].
Applications include replacements for hips, knees, teeth, tendons, and ligaments and repair for
periodontal disease, maxillofacial reconstruction, augmentation and stabilization of the jaw
bone, spinal fusion, and bone repair after tumor surgery. Clinical success of bioceramics has
led to a remarkable advance in the quality of life for millions of people. The mechanisms of
tissue bonding to bioactive ceramics have resulted in the molecular design of bioceramics for
interfacial bonding with hard and soft tissue.This review is devoted to the use of bioceramics
as implants to repair parts of the body, usually the hard tissues of the musculo-skeletal system,
such as bones, joints, or teeth [2]. Resorbable biomaterials are designed to degrade gradually over time and be replaced by the
natural host tissue. Porous or particulate calcium phosphate ceramic materials, such as
tricalcium phosphate (TCP), are successful materials for resorbable, hard tissue replacements
when only low mechanical strength is required, such as in some repairs of the jaw or head [50,
51]. The concept of bioactive materials is intermediate between resorbable and bioinert
materials. A bioactive material is one that elicits a specific biological response at the interface
of the material, which results in the formation of a bond between the tissues and the material.
This concept has been used to produce many bioactive materials with a wide range of bonding
rates and thickness of interfacial bonding layers. All the bioactive materials form an
interfacial bond with adjacent tissue. However, the time dependence of bonding, the strength
of the bond, the mechanism of bonding, and the thickness of the bonding zone differ for the
various materials. Porous layer is accelerated by the bioactive HA ceramic, and the strength of
the bone–implant interface also is enhanced. Thus, bone bonding and biological fixation are
restricted to specific areas, which reduces stress shielding in other areas of bone contact [2].
2.5.2 Calcium phosphate ceramics types
Calcium phosphate-based bioceramics have been used in medicine and dentistry for 25 years.
Calcium phosphate (CaP) bioceramics in different forms (blocks, granules, cements, implant
coatings, composite component), from different origin (natural, biological or synthetic) and
varying composition are commercially available for use in dentistry and medicine. Calcium
phosphate compounds are abundant in nature and in living systems. Different types of
calcium phosphate (CaP) phases play dominant and significant role in biological systems [52].
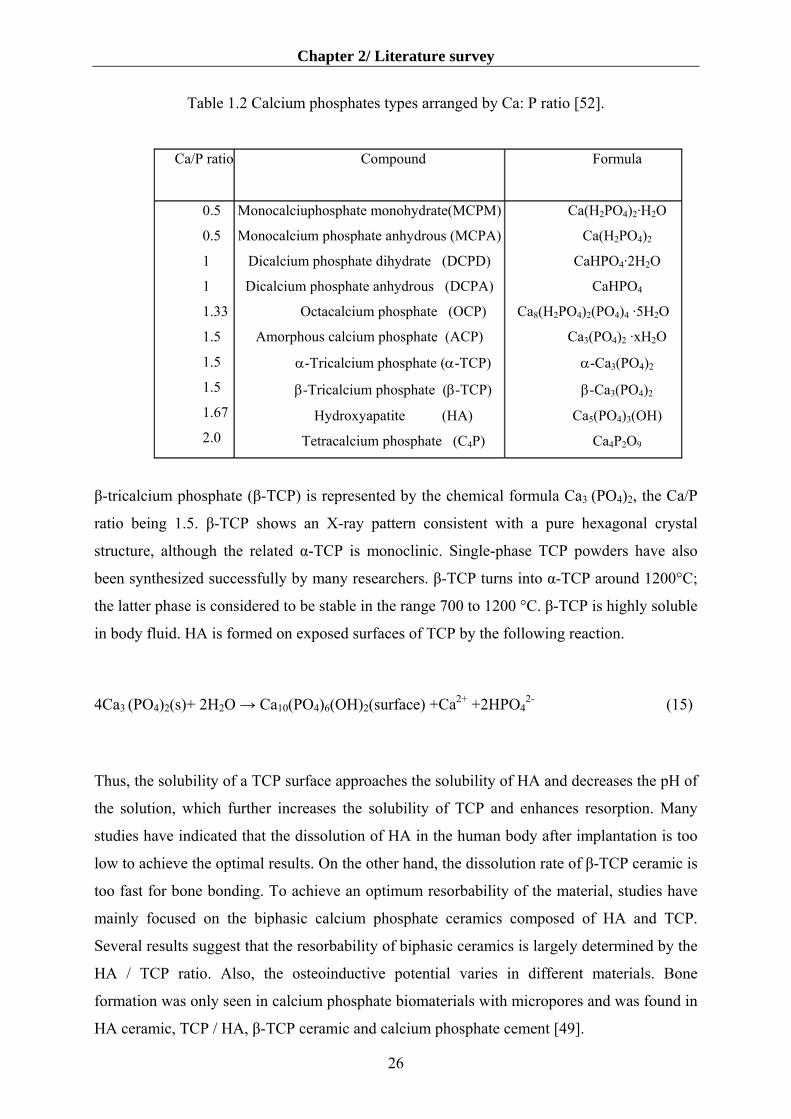
Table 1.2 show calcium phosphates types arranged by Ca: P ratio.
25
Chapter 2/ Literature survey
Table 1.2 Calcium phosphates types arranged by Ca: P ratio [52].
Ca/P ratio Compound
Formula
0.5
0.5
1
1
1.33
1.5
1.5
1.5
1.67
2.0
Monocalciuphosphate monohydrate(MCPM)
Monocalcium phosphate anhydrous (MCPA)
Dicalcium phosphate dihydrate (DCPD)
Dicalcium phosphate anhydrous (DCPA)
Octacalcium phosphate (OCP)
Amorphous calcium phosphate (ACP)
α-Tricalcium phosphate (α-TCP)
β-Tricalcium phosphate (β-TCP)
Hydroxyapatite (HA)
Tetracalcium phosphate (C4P)
Ca(H2PO4)2·H2O
Ca(H2PO4)2
CaHPO4·2H2O
CaHPO4
Ca8(H2PO4)2(PO4)4 ·5H2O
Ca3(PO4)2 ·xH2O
α-Ca3(PO4)2
β-Ca3(PO4)2
Ca5(PO4)3(OH)
Ca4P2O9
β-tricalcium phosphate (β-TCP) is represented by the chemical formula Ca3 (PO4)2, the Ca/P
ratio being 1.5. β-TCP shows an X-ray pattern consistent with a pure hexagonal crystal
structure, although the related α-TCP is monoclinic. Single-phase TCP powders have also
been synthesized successfully by many researchers. β-TCP turns into α-TCP around 1200°C;
the latter phase is considered to be stable in the range 700 to 1200 °C. β-TCP is highly soluble
in body fluid. HA is formed on exposed surfaces of TCP by the following reaction.
4Ca3 (PO4)2(s)+ 2H2O → Ca10(PO4)6(OH)2(surface) +Ca2+ +2HPO42- (15)
Thus, the solubility of a TCP surface approaches the solubility of HA and decreases the pH of
the solution, which further increases the solubility of TCP and enhances resorption. Many
studies have indicated that the dissolution of HA in the human body after implantation is too
low to achieve the optimal results. On the other hand, the dissolution rate of β-TCP ceramic is
too fast for bone bonding. To achieve an optimum resorbability of the material, studies have
mainly focused on the biphasic calcium phosphate ceramics composed of HA and TCP.
Several results suggest that the resorbability of biphasic ceramics is largely determined by the
HA / TCP ratio. Also, the osteoinductive potential varies in different materials. Bone
formation was only seen in calcium phosphate biomaterials with micropores and was found in
HA ceramic, TCP / HA, β-TCP ceramic and calcium phosphate cement [49].
26
Chapter 2/ Literature survey
2.5.3 Properties and applications of calcium phosphate bioceramics
The many desirable properties of calcium phosphate bioceramics have been documented.
These properties include similarity in composition to bone mineral; bioactivity (ability to
form bone apatite-like on their surfaces in vitro and ability to develop a direct and strong
bonding with the bone tissue); biocompatibility (ability to promote cellular function and
ability to form a uniquely strong interface with bone) and osteoconductivity (ability to provide
a scaffold or template for the formation of new bone). In addition, calcium phosphate
ceramics with the appropriate three-dimensional geometry, are able to bind and concentrate
bone morphogenic proteins in circulation and thus become osteoinductive (capable of
osteogenesis). Potential future applications of calcium phosphate bioceramics will include
drug delivery system, growth factor carriers, effective carriers of bioactive peptide or bone
cells, periodontal ligament cells, mesechymal cells and will therefore be useful in tissue
engineering for regeneration of hard tissues [53].
Applications include coatings of orthopedic and dental implants, alveolar ridge augmentation,
maxillofacial surgery, otolaryngology, and scaffolds for bone growth and as powders in total
hip and knee surgery. Different phases of calcium phosphate ceramics are used depending
upon whether a resorbable or bioactive material is desired. The stable phases of calcium
phosphate ceramics depend considerably upon temperature and the presence of water, either
during processing or in the use environment. At body temperature, only two calcium
phosphates are stable in contact with aqueous media, such as body fluids: at pH <4.2, the
stable phase is CaHPO4. 2H2O (dicalcium phosphate, brushite, C2P), whereas, at pH >4.2, the
stable phase is Ca10(PO4)6(OH)2 (HA). At higher temperatures, other phases, such as
Ca3(PO4)2 (β-tricalcium phosphate, C3P, TCP) and Ca4P2O9 (tetracalcium phosphate, C4P) are
present. The unhydrated, high-temperature calcium phosphate phases interact with water, or
body fluids, at 37 °C to form HA. Thus, the solubility of a TCP surface approaches the
solubility of HA and decreases the pH of the solution, which further increases the solubility of
TCP and enhances resorption [53]. De Groot [50] has discussed the importance of the Ca: P
ratio in determining solubility and tendency for resorbtion in the body. The presence of
micropores in the sintered material can increase the solubility of these phases.
Sintering of calcium phosphate ceramics usually occurs at 1000–1500 °C, following
compaction of the powder into a desired shape. The phases formed at high temperature
depend on temperature and on the partial pressure of water (PH2O) in the sintering atmosphere.
When water is present, HA can be formed and is a stable phase up to 1360 °C, as shown in the
27
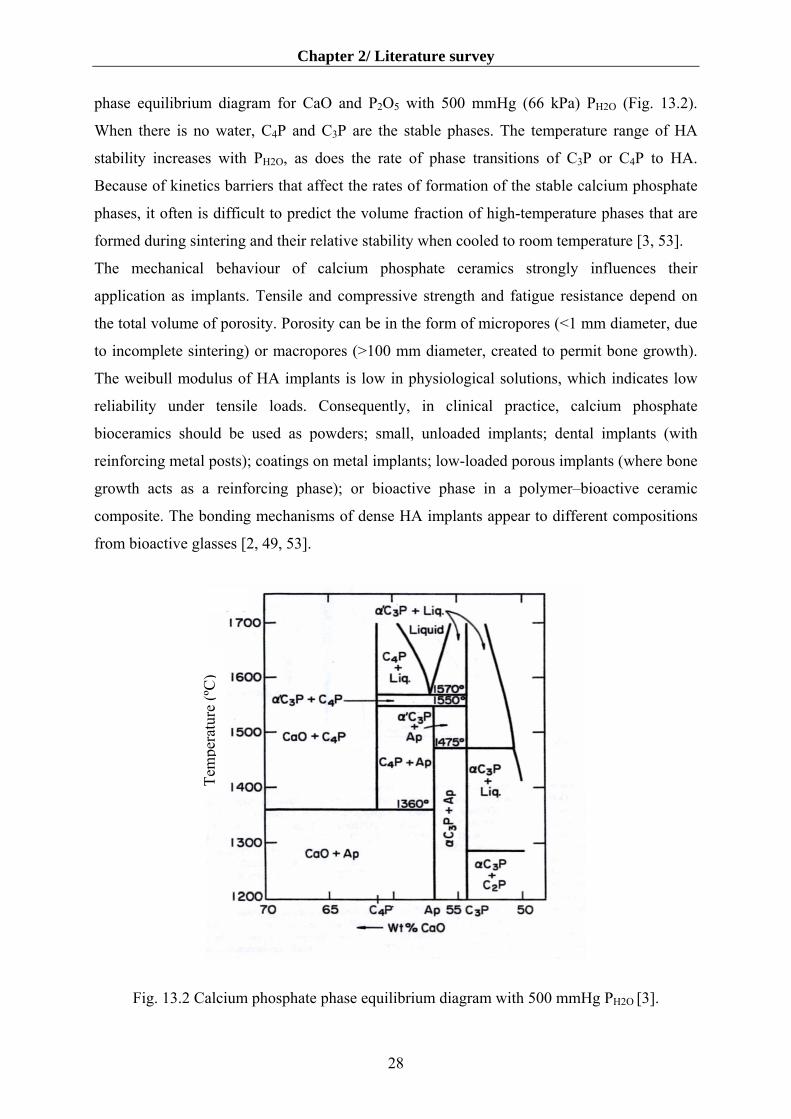
Chapter 2/ Literature survey
phase equilibrium diagram for CaO and P2O5 with 500 mmHg (66 kPa) PH2O (Fig. 13.2).
When there is no water, C4P and C3P are the stable phases. The temperature range of HA
stability increases with PH2O, as does the rate of phase transitions of C3P or C4P to HA.
Because of kinetics barriers that affect the rates of formation of the stable calcium phosphate
phases, it often is difficult to predict the volume fraction of high-temperature phases that are
formed during sintering and their relative stability when cooled to room temperature [3, 53].
The mechanical behaviour of calcium phosphate ceramics strongly influences their
application as implants. Tensile and compressive strength and fatigue resistance depend on
the total volume of porosity. Porosity can be in the form of micropores (<1 mm diameter, due
to incomplete sintering) or macropores (>100 mm diameter, created to permit bone growth).
The weibull modulus of HA implants is low in physiological solutions, which indicates low
reliability under tensile loads. Consequently, in clinical practice, calcium phosphate
bioceramics should be used as powders; small, unloaded implants; dental implants (with
reinforcing metal posts); coatings on metal implants; low-loaded porous implants (where bone
growth acts as a reinforcing phase); or bioactive phase in a polymer–bioactive ceramic
composite. The bonding mechanisms of dense HA implants appear to different compositions
from bioactive glasses [2, 49, 53].
Fig. 13.2 Cal
Tem
pera
ture
(ºC
)
cium phosphate phase equilibrium diagram with 500 mmHg PH2O [3].
28

Chapter 2/ Literature survey
2.5.4. HA-based ceramics
The greatest potential for bone substitution is shown by materials based on hydroxyapatite
(HA), which can develop tight bonding with bone tissue, exhibits osteoconductive behaviour,
is stable toward bioresorption, and has no adverse effects on the human organism [53, 54].
The biological behavior of HA ceramics depends on many factors, in particular, on their
chemical and phase composition, microstructure, pore size, and pore volume. In surgery has
been used of both dense and porous ceramics, depending on the requirements for the bearing
strength of implants. Porous ceramics have low strength and therefore are suitable for
implantation into tissues which experience no substantial stresses (operations for the middle
ear and some maxillofacial applications) and for local drug delivery. Pores in implants are
necessary for osteointegration, a process which depends on the pore size, volume, and
interconnectivity [55, 56].
It is believed that the minimum pore size for bone ingrowth into implants is 100–135 µm.
With increasing porosity and pore interconnectivity, the bone ingrowth and fixation processes
become more effective. The division of osteogenic cells is preceded by protein adsorption.
Consequently, the presence of submicron pores, comparable in size to blood-plasma
proteins must also favor biointegration [57].
2.5.5 Synthesis and properties of HA
HA powder can be prepared wet chemically, by solid-state reactions, and by hydrothermal
treatment. The preparation technique has a significant effect on the powder morphology,
specific surface, stoichiometry, and crystallinity. Therefore, control over all synthesis
conditions is critical for obtaining reproducible results [58].
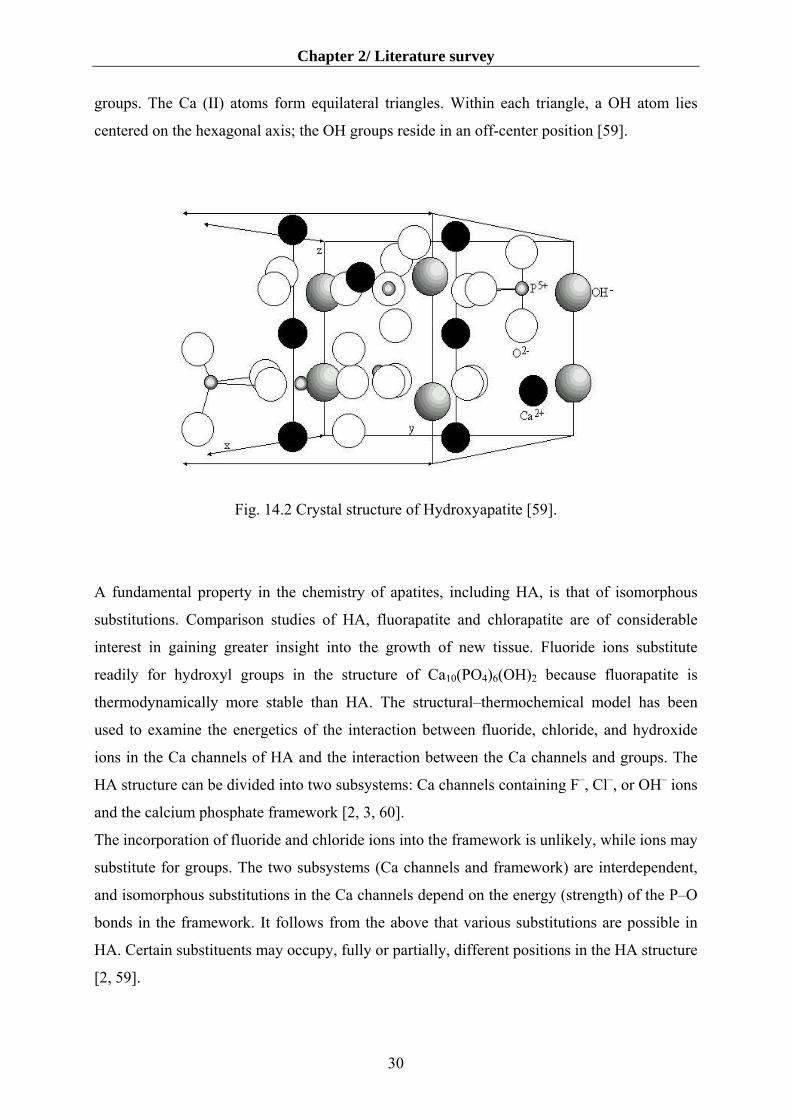
HA belongs to the apatite group and has the composition Ca10(PO4)6(OH)2 . The structure of
fluorapatite, a analog of HA, was first determined by Náray- Szabó. His works laid the
foundation for subsequent X-ray diffraction studies of HA, fluorapatite and chlorapatite. His
conclusions about the structure of fluorapatite were confirmed by later refinements. HA has a
hexagonal structure (P6 3/m, two formula units per unit cell) with lattice parameters a = 0.942
nm and c = 0.687 nm. The ideal formula of HA is Ca10(PO4)6(OH)2. The atomic structure of
HA and its projection along the c axis are shown in Fig. 14.2. The Ca atoms reside in two
positions: six atoms per unit cell are in position Ca (II) and four atoms are in position Ca (I).
Ca (I) is located on the threefold axis and is coordinated by nine oxygens of phosphate
29
Chapter 2/ Literature survey
groups. The Ca (II) atoms form equilateral triangles. Within each triangle, a OH atom lies
centered on the hexagonal axis; the OH groups reside in an off-center position [59].
Fig. 14.2 Crystal structure of Hydroxyapatite [59].
A fundamental property in the chemistry of apatites, including HA, is that of isomorphous
substitutions. Comparison studies of HA, fluorapatite and chlorapatite are of considerable
interest in gaining greater insight into the growth of new tissue. Fluoride ions substitute
readily for hydroxyl groups in the structure of Ca10(PO4)6(OH)2 because fluorapatite is
thermodynamically more stable than HA. The structural–thermochemical model has been
used to examine the energetics of the interaction between fluoride, chloride, and hydroxide
ions in the Ca channels of HA and the interaction between the Ca channels and groups. The
HA structure can be divided into two subsystems: Ca channels containing F–, Cl–, or OH– ions
and the calcium phosphate framework [2, 3, 60].
The incorporation of fluoride and chloride ions into the framework is unlikely, while ions may
substitute for groups. The two subsystems (Ca channels and framework) are interdependent,
and isomorphous substitutions in the Ca channels depend on the energy (strength) of the P–O
bonds in the framework. It follows from the above that various substitutions are possible in
HA. Certain substituents may occupy, fully or partially, different positions in the HA structure
[2, 59].
30

Chapter 2/ Literature survey
2.5.6 Dense HA ceramics
Calcium-phosphate-based ceramics can be fabricated by various techniques, depending on the
desired microstructure and properties of the material [2]. To produce implants capable of
withstanding mechanical loads, it is reasonable to use densely sintered ceramics, which
surpass porous ceramics in strength. Dense ceramics can be produced by pressing or slip
casting followed by pressureless sintering or hot uniaxial or isostatic pressing. The density of
the ceramics thus fabricated approaches theoretical density (3.16 g/cm3 [3]) [2, 61, 62].
The highest possible sintering temperature depends on the sintering atmosphere (partial
pressure of water vapor): increasing the ambient humidity stabilizes HA to higher
temperatures. At the same time, there is experimental evidence that HA with Ca : P = 1.68
does not decompose at temperatures of up to 1450 ºC over a period of 3 h [2].
The key characteristics of dense ceramics are bending strength, tensile strength, and fracture
toughness. The bending, compressive, and tensile strength values of HA ceramics lie in the
ranges 38–250, 120–150, and 38–300 MPa, respectively [2, 53, 54]. The large scatter is due to
the random strength distribution and the effects of residual microporosity, grain size,
impurities, etc. With increasing Ca : P ratio, the strength increases, reaches a peak at Ca : P .
1.67, and sharply decreases for Ca: P > 1.67 [2].
Roots of teeth fabricated of dense HA ceramics were studied in vivo and clinically. The
bonding between the gum and HA implant was comparable to that ensured by the natural
binder. Moreover, good bonding was achieved between the implant and bone. These results
are of great importance because inadequate bonding leads to an increased mobility and
eventually, loss of teeth. Unfortunately, most of the loaded dental implants were destroyed
within a year after implantation because of the low strength of the ceramic [2].
Among the most important applications of dense HA ceramics are hypodermic devices for
long-term ambulant intestinal dialysis, monitoring of blood pressure and sugar, and optical
examination of internal tissues. Dense HA ceramics exhibit excellent biocompatibility with
skin, far exceeding that of silicone rubber, which is widely used for these purposes [53, 2].
2.5.7 Porous HA ceramics
For a number of applications, porous ceramics containing interconnected channel pores are
more attractive. Such ceramics can be used as bone graft substitutes, e.g., for the superior
articular surface of the tibia, or in drug delivery systems [55, 56]. To ensure blood supply to
31
Chapter 2/ Literature survey
contact surfaces and bone ingrowth and fixation [57], the diameter of interconnected pores
must be at least 100– 135 µm. Also necessary are smaller pores, which favour protein
adsorption and adhesion of osteogenic cells. Thus, the pore-size distribution in porous
ceramics should be bimodal. Porous ceramics are commonly produced by burning out organic
pore formers (polyurethane sponges) or via foaming with the use of hydrogen peroxide [63,
64].
To modify the biological behavior of porous ceramics, the pore surface can be coated with
tricalcium phosphate (TCP). To this end, ceramic bodies are impregnated with a dibasic
ammonium phosphate solution and then heat-treated at 900 ºC [65].
Whereas the compressive strength of porous ceramics is sufficiently high, 2–100 MPa, their
bending strength (2–11 MPa) is lower than the necessary level by a factor of 2–3. With
increasing porosity, the strength of ceramics decreases sharply. The strength of implants
gradually increases in the process of bone ingrowth into the pore network [2]. According to
Martin [66], the bending strength of porous implants filled with 50–60% bone tissue is 40– 60
MPa.
Porous HA ceramics in the form of blocks and granules find many medical applications. A
very important application field for HA granules and porous ceramics is drug delivery. The
use of ceramics for solving this problem is a relatively new approach. Although the first
studies were carried out as early as 1930, ceramic drug delivery systems were devised only in
the 1980s, and the first clinical results were reported in 1998. A major problem with drug
delivery systems is to maintain a constant drug concentration in blood over a preset time
(slow pharmacokinetics), because periodic peroral or parenteral introduction of drugs may
result in drug accumulation to above the permissible concentration. The use of HA ceramics
for drug delivery ensures controlled, local drug release over a period of up to one year [67].
2.5.8 Glass-reinforced HA composites
Hench [3] has extensively studied ternary phases of oxides containing some P2O5 and
evaluated the biocompatibility of the quenched glasses of various compositions.
Glasses within the P2O5–CaO–Na2O system have been considered as having an enormous
potential as biomaterials, because their chemical composition is analogous to the inorganic
constituent of the mineral part of bone. Their biocompatibility and bioactivity have also been
demonstrated as being adequate, especially as temporary space fillers [68, 69]. Several
32
Chapter 2/ Literature survey
attempts [70, 71] have been made in order to reinforce hydroxyapatite and to approximate its
mechanical properties to those of bone.
The densification of HA was significantly enhanced by the presence of a liquid phosphate
phase chemically related to its composition during its sintering process. Densification
occurred by liquid formation, spreading and improving the diffusion mechanism. A strong
bonding was developed between HA and the phosphate-based glasses, which acted on the
solid HA particles reducing the interfacial energy and eliminating porosity. The presence of a
solid HA skeleton (favouring heterogeneous nucleation), the slow cooling rate after sintering,
and the tendency of HA to be transformed into tricalcium phosphate at high temperatures, led
to the appearance of crystalline α and β tricalcium phosphate (TCP) structures, as was
detected using X-ray diffraction. The following general tendency of transformation with
increasing sintering temperature was obsereved: HA→β-TCP→α-TCP. The amount of TCP
present in the microstructure of the composites depended on the chemical composition of the
glass added to hydroxyapatite, as was demonstrated in ealier works [72].
Different calcium phosphates exhibit widely different resorption properties. The resorption
property of calcium phosphates depends on Ca/PO4 ratio, degree of crystallinity and crystal
structure. It has been reported the development of resorbable Ca–P–O glass prepared from
CaO and P2O5 for tooth and bone implant applications. Calcium phosphate glass melts,
proven to be biocompatible in the first effort, were cast into carbon molds. In addition, most
of the glasses with contents of alkaline oxides can undergo a severe or complete dissolution
when in contact with physiological fluids and for this reason they can also be considered as
good candidates for bioresorbable implants [3].
33
Chapter 3/ Experimental procedure
3. Experimental procedure
3.1 Characterization of starting material
A commercial hydroxyapatite powder (Budenheim Company, Germany) with a
stoichiometric ratio of Ca/P=1.67 was used in this study.
The phosphate glass was prepared with a composition of 32 mol% CaO, 23 mol%
Na2O and 45 mol% P2O5. The starting reagents, which were used to prepare the glass,
were NaHPO4, P2O5 and CaCO3. The materials were mixed thoroughly and placed in
a platinum crucible, melted at 1000 ºC for 1 h, and then poured into a steel plate and
allowed to cool. The resulting glass was then ground to a fine powder using an agate
grinder. The glass powder was placed in a porcelain mill pot and dry milled for 24 h.
After this time, mixtures of HA with 6 wt% and 13 wt% glass had been prepared.
These powders were wet milled using methanol for further 24 hours. The resulting
slip was then dried at 70 ºC and the dry powder was sieved to 75 µm.
The particle size distribution and mean particle size (d50) of HA and glass were
determined by the laser diffraction method (Coulter LS230, USA). In order to avoid
agglomeration, ultrasonic treatment were used.
The specific surface area of HA powder was determined by the BET method
(Areameter; Model Strohlein, Germany). Before the measurement the powder was
heated to 200 °C for 30 minutes in order to remove water.
3.2 Slurry preparation and characterization
The slips were prepared by dispersing the HA powder in deionized water, using
mechanical stirring. The dispersion behavior of the HA particles was studied as a
function of the pH of the slurry and with the addition of two dispersing agents,
inorganic (calgon, or sodium hexametaphosphate (Merck Co.,Germany)), and organic
(ammonium polyacrylate (NH4PAA) solution (Dispex A40, Allied Colloids, Bradford,
34

Chapter 3/ Experimental procedure
UK)). The amount of dispersant used here is expressed as a dry weight of the powder
basis, equivalent to the wt. /wt. basis of the hydroxyapatite powder.
The HA slips were prepared in deionized water, with optimum amounts of dispersing
agents; then milled in plastic jars for 12-24 h, using Al2O3 milling media.
3.2.1 Viscosity measurements
Viscosity measurements are widely used to characterize the rheological properties of
concentrated suspensions commonly used in ceramic processing. They can be used as
a method of analysis of determining the optimum amount of dispersant required for
stabilizing a suspension. The rheological characterization of the slurries was performed with a coaxial-
cylinders shear-rate-controlled viscosimeter (Haake VT 550, Germany).
Measurements were performed at 25 °C. Flow curves were obtained under continuous
shear conditions by changing the rate of shear from 0 to 500 s-1. The shear rate was
subsequently reduced to 0 s-1 repeating the cycle three times, in order to determine the
steady-state viscosity and flow behaviour.
3.2.2 Measurement of the zeta potential
When an electrical field is applied to a suspension of charged colloidal particles, the
particles move with a velocity that is proportional to the applied field strength. The
motion is referred to as electrophoresis. It can provide valuable information on the
sign and magnitude of the surface charge and surface potential. The measured
potential is called the ξ-potential and the value of the ξ-potential is a valuable guide to
the stability of colloidal suspensions. Modern instrumentation allow the ξ-potential to
be measured automatically. For dilute electrolyte solutions, the ξ-potential is given
by:
(16)
where η is the viscosity of the liquid, ε is the dielectric constant of the liquid, ε0 is the
permittivity of free space and u is the electrophoretic mobility.
35

Chapter 3/ Experimental procedure
The zeta potential was determined with a zetasizer (Matec MBS-8000, USA) by
measuring the electrophoretic mobility of the particles. Zeta potentials were measured
at 3.33 wt.% suspensions with the variation of pH and added dispersant. The pH value
of the slurries was adjusted through addition of 1 m KOH and 1 m HCl .
3.3 Layer-wise slurry deposition process
The slurry was processed by a LSD machine device designed by the Clausthal
University of Technology [13]. The machine consists of a robot controlled by a PC
that is used to deposit ceramic layers by a doctor blade. After spreading, the layer is
dryed and locally sintered. Then a new layer is deposited and the process is repeated
until the ceramic prototype is completed. The machine is equipped with a continuous
CO2 laser ( λ =10.6 µm) with a beam diameter of 300 µm, a suitable range for most
ceramics to effectively absorb the radiant energy in the infrared range of the energy
spectrum.
The LSD process utilizes a CAD file to define the geometry of an object to be
produced. The file is sliced into a number of layers that represent cross sections of the
object.
Fig. 1.3 LSD device
36

Chapter 3/ Experimental procedure
The layer information is used to control a laser scanner that directs a CO2 laser to
reproduce the layer by selective sintering. Each scanned layer represents a cross
section of the sliced CAD model with stereolithography (Stl) format. Finally, an
object is created by sequentially sintering the layers with a scanning laser beam.
No support structure is needed as the non-fused powder remains in place to act as a
support itself. Excess powder in each layer helps to support the part during the build.
Fig. 1.3 shows LSD device.
3.4 Characterization of the LSD HA and glass-reinforced HA composite parts
Layers has been laser sintered and also green bodies were air-sintered in the
temperature range of 1000-1300 °C for 2-3 h, cooling inside an SiC furnace. Sintering
tests were carried out in all cases with the heating rate was 10 ºC/min. The sintered
samples, polished successively with 400 and 600 grit SiC emery and 2 µ Al2O3, were
etched with 0.1M acetic acid for 2 min and HCl for 15 second. Also laser sintered
samples were thermal etched at 1300 °C for 0.5 h.
3.4.1 SEM investigation
The microstructures of the sintered HA parts were examined using scanning electron
microscopy (SEM; Model Camscan CS4, UK). Porosity of the sintered samples was
examined by SEM. A gold layer was sputter coated onto the samples prior to SEM
observation.
3.4.2 XRD analysis
Phase compositions of samples were determined by X-ray diffraction (XRD; Model
PW 1710, Philips, The Netherlands) using CuKα radiation at 40 kV and 30 mA.
Quantitative phase analysis was performed by using from pure HA, α-TCP, β –TCP
and C4P as reference materials. Philips APD analysis software has been used for
calculating of the samples phases values to compare with reference materials. It has
been evaluted by calculating the area of the most intense peak of samples. All the
37

Chapter 3/ Experimental procedure
peaks of the ceramic were compared with JCPDS powder diffraction data card No. 9-
432 and were assigned to HA.
All peak area calculations were performed using curve fitting and the error was
estimated to be around ±2% of the mean value.
3.4.3 DTA analysis
Thermal behavior of HA powder was examined by simultaneous thermo analysis
(STA; Model 429, Netzsch, Germany) at a heating rate of 10 ºC/min up to 1550 ºC in
air atmosphere.
3.4.4 FTIR analysis
Fourier transform infrared spectroscopy (FTIR) (Bruker-vector 33, USA) was
conducted since it allows analyzing materials characteristics that can not be
differentiated by means of X-ray diffraction. The powders and the crushed laser
sintered samples were mixed with dried potassium bromide (KBr) powders at a
concentration of 1 wt. % and subsequently compressed to produce a transparent tablet.
The infrared spectrum with a resolution of 8 cm-1 and the scan number of 4 was
adopted with a spectral region from 400 to 4000 cm-1. FTIR analysis was applied to
examine the contents of OH− groups in the samples types.
3.4.5 Porosimetry measurement
Mercury porosimetry measurements were carried out on a micromeritics poresizer
(Strumentazione, Carlo Erba 200, Italy)) to determine the pore size distribution. This
method requirs sample volumes in the range 2 cm3.
The obtained porosities were gathered in 5 porosimetric intervals of pore radius. The
values coming from the porosimeter are taking into account the porosity of the sample
(in practice the overall volume of mercury threaded into the ceramic body referred to
the volume of the sample), was calculated the absolute porosity (AP%) listed in
another column; a third column reports the volumetric porosity (VP) as the amount of
porosity referred to the sample volume. The pore-size distribution follows the
relation:
38

Chapter 3/ Experimental procedure
d=- P
θγ cos4 (17)
where d is the pore diameter,γ is the surface tension, θ is the contact angle, and P is
the mercury pressure. The pore diameter was calculated from the pressure applied to
the ceramic bulk, and the total open porosity was calculated from the mercury
intrusion volume.
3.4.6 Density measurement
The Archimedes water immersion technique was found to be the best in measuring
density and open porosity. Specimen density was measured on each sintered specimen
using the Archimedes principle. The measurements were carried out in distilled water.
These were then compared with the theoretical densities (density of 3.16 g/cm3 for
HA).
Also, the HA-glass layer-wise sintered bulk density was measured by Archimedes
method and relative values were calculated assuming that the theoretical density of
glass powder has been determined with picnometry method to be 2.60 g/cm3. From
these, the overall theoretical density of the sample could be determined by:
(PHA . ρHA) + (P glass . ρ glass) = Overall theoretical density (18)
which, P and ρ are weight % and density of material, respectively.
39

Chapter 4/ Results and discussion
4. Results and discussion
This research was divided in two parts: (1) investigation on rheological properties of
the hydroxyapatite slurries that play an important role in facilitating the layering
operation (2) studying the compositional and structural changes of the samples of HA
and HA glass-reinforced composite layer-wise slurry deposited after laser treatment
and comparing with sintered layers by conventional sintering. One ultimate aim in
this process is to fabricate the three-dimensional parts directly from ceramic materials
without using any intermediate binders.
4.1 Dispersion of hydroxyapatite powder in aqueous media
4.1.1 Particle/ floc size distribution
The particle/floc size distribution of HA powder showed that the HA powders with a
median diameter (d50) of 4.89 and 4.58 µm for the as-received and the calcined
powders at 1000 ºC, respectively, were highly agglomerated when dispersed in
deionized water (Fig. 1.4). On the contrary, the particles were well dispersed in the
presence of NH4PAA and calgon as dispersant agents, as shown by the shift in the
particle-size distribution curves to finer ranges with minimum values for particle sizes
(dispersant of NH4PAA: d10=0.476 µ m, d50 = 1.962 µ m, d90 = 6.747 µm; dispersant
of calgon : d10 = 0.557 µ m, d50 = 2.227 µm, d90 = 4.924 µm).
4.1.2 The effect of dispersants on aqueous dispersibility of the HA powder
The effect of dispersant on the dispersibility of the commercial hydroxyapatite
powder was investigated by measuring the viscosity and the zeta potential of the
suspension. Fig. 2.4 shows the zeta potential vs. pH of HA powder with and without
dispersants in water. When the pH value is below and above the isoelectrical point,
the charge on the surface of HA particles is positive and negative, respectively.
In general, the dispersion of ceramic powders in suspensions can be improved when
the absolute value of the zeta potential is increased after an addition of dispersant. In
the alkaline region the zeta potential is slightly improved in the presence of a
40

Chapter 4/ Results and discussion
dispersant as expected, since the charge of the polyelectrolyte is added to the particles
surface charge.
Fig. 1.4 Particle-size distribution of HA as-received and calcined powders in
deionized water, with and without dispersant
Fig. 2.4 Zeta potential vs. pH of HA suspensions with and without dispersants.
41
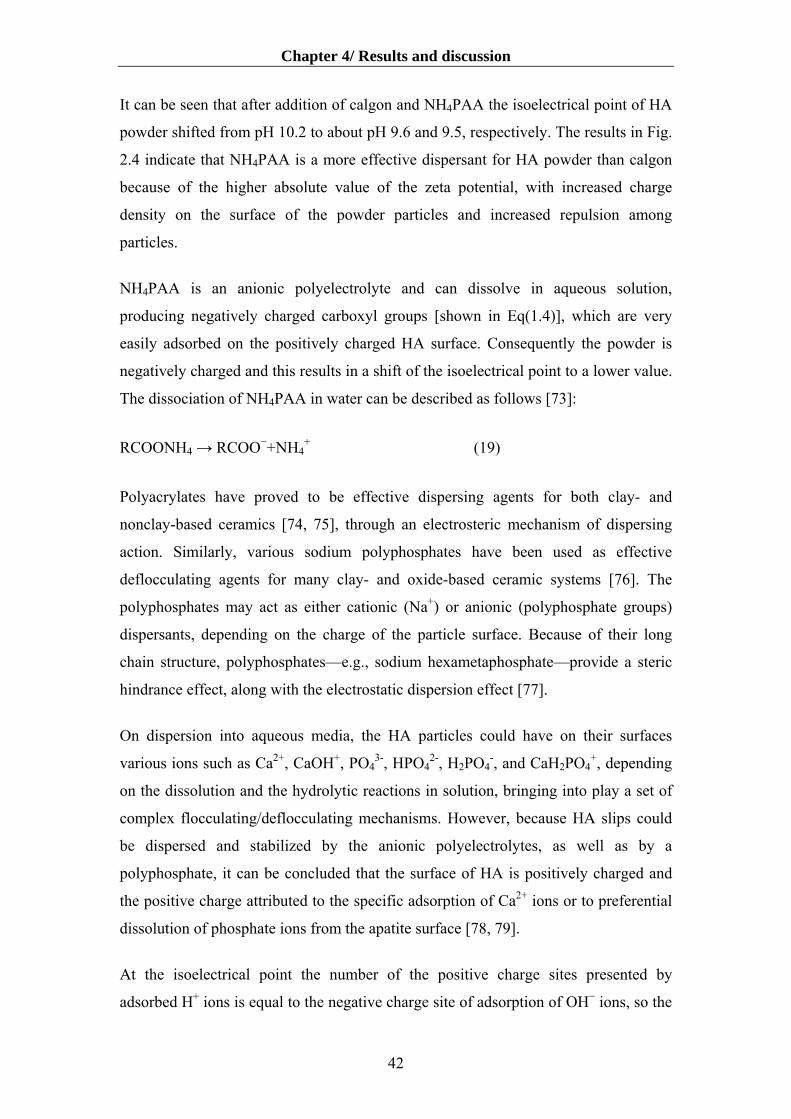
Chapter 4/ Results and discussion
It can be seen that after addition of calgon and NH4PAA the isoelectrical point of HA
powder shifted from pH 10.2 to about pH 9.6 and 9.5, respectively. The results in Fig.
2.4 indicate that NH4PAA is a more effective dispersant for HA powder than calgon
because of the higher absolute value of the zeta potential, with increased charge
density on the surface of the powder particles and increased repulsion among
particles.
NH4PAA is an anionic polyelectrolyte and can dissolve in aqueous solution,
producing negatively charged carboxyl groups [shown in Eq(1.4)], which are very
easily adsorbed on the positively charged HA surface. Consequently the powder is
negatively charged and this results in a shift of the isoelectrical point to a lower value.
The dissociation of NH4PAA in water can be described as follows [73]:
RCOONH4 → RCOO−+NH4+ (19)
Polyacrylates have proved to be effective dispersing agents for both clay- and
nonclay-based ceramics [74, 75], through an electrosteric mechanism of dispersing
action. Similarly, various sodium polyphosphates have been used as effective
deflocculating agents for many clay- and oxide-based ceramic systems [76]. The
polyphosphates may act as either cationic (Na+) or anionic (polyphosphate groups)
dispersants, depending on the charge of the particle surface. Because of their long
chain structure, polyphosphates—e.g., sodium hexametaphosphate—provide a steric
hindrance effect, along with the electrostatic dispersion effect [77].
On dispersion into aqueous media, the HA particles could have on their surfaces
various ions such as Ca2+, CaOH+, PO43-, HPO4
2-, H2PO4-, and CaH2PO4
+, depending
on the dissolution and the hydrolytic reactions in solution, bringing into play a set of
complex flocculating/deflocculating mechanisms. However, because HA slips could
be dispersed and stabilized by the anionic polyelectrolytes, as well as by a
polyphosphate, it can be concluded that the surface of HA is positively charged and
the positive charge attributed to the specific adsorption of Ca2+ ions or to preferential
dissolution of phosphate ions from the apatite surface [78, 79].
At the isoelectrical point the number of the positive charge sites presented by
adsorbed H+ ions is equal to the negative charge site of adsorption of OH− ions, so the
42
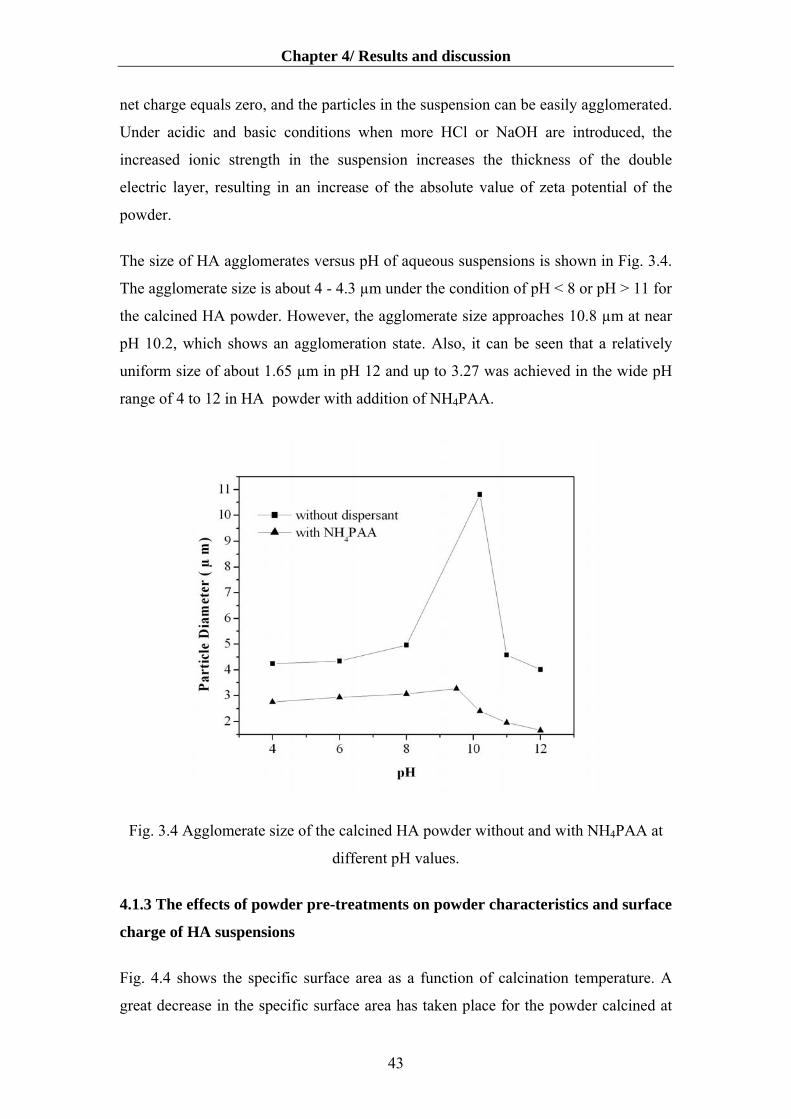
Chapter 4/ Results and discussion
net charge equals zero, and the particles in the suspension can be easily agglomerated.
Under acidic and basic conditions when more HCl or NaOH are introduced, the
increased ionic strength in the suspension increases the thickness of the double
electric layer, resulting in an increase of the absolute value of zeta potential of the
powder.
The size of HA agglomerates versus pH of aqueous suspensions is shown in Fig. 3.4.
The agglomerate size is about 4 - 4.3 µm under the condition of pH < 8 or pH > 11 for
the calcined HA powder. However, the agglomerate size approaches 10.8 µm at near
pH 10.2, which shows an agglomeration state. Also, it can be seen that a relatively
uniform size of about 1.65 µm in pH 12 and up to 3.27 was achieved in the wide pH
range of 4 to 12 in HA powder with addition of NH4PAA.
Fig. 3.4 Agglomerate size of the calcined HA powder without and with NH4PAA at
different pH values.
4.1.3 The effects of powder pre-treatments on powder characteristics and surface
charge of HA suspensions
Fig. 4.4 shows the specific surface area as a function of calcination temperature. A
great decrease in the specific surface area has taken place for the powder calcined at
43

Chapter 4/ Results and discussion
temperature between 700 and 1000 °C. The surface area decreased from 65.2 m2/g,
for the as-received powder to 4.6 m2/g for the powder calcined at 1000 °C.
Fig. 4.4 Influence of the heat treatment on specific surface area (BET) of HA powders.
The particle size distributions reported in Fig. 5.4 are evidence that as-received
powder is characterized by larger agglomerates formed primary particles in
comparison with the pre-treatments powders at 900 and 1000 ºC in the presence of 1
wt% NH4PAA as the dispersing agent. It can be also observed that the as-received
powder seems much more difficult to dispersing compared to the calcined-powder.
This confirms the increased difficulties of dispersing the as-received powders. The
calcination of HA powder prepared at 1000 ºC was pure single phase HA, as shown
by the X-ray diffraction presented in Fig. 6.4. The reflections of the XRD spectrum
very well agree with as-received HA powder.
FTIR spectra (Figs. 7.4 (a, b)) provide evidence that the presence of a higher amount
of HPO42- in powders as-received in comparison with the powder calcined at 1000
ºC. On the contrary, the O-H stretch band around 3450 cm-1 is more accentuated for
the powder calcined at 1000 °C.
The study of the behavior of HA powder in aqueous media gives some information
about its actual chemical reactivity in the biological environment, because it is mainly
44
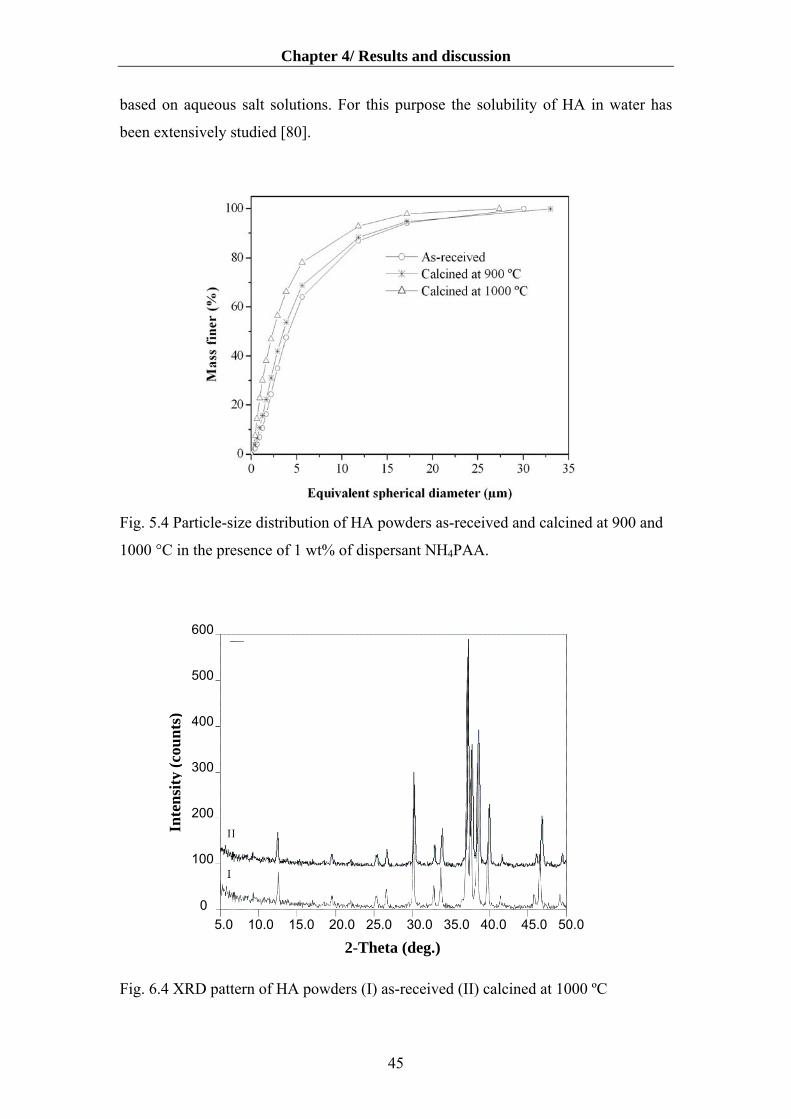
Chapter 4/ Results and discussion
based on aqueous salt solutions. For this purpose the solubility of HA in water has
been extensively studied [80].
Fig. 5.4 Particle-size distribution of HA powders as-received and calcined at 900 and
1000 °C in the presence of 1 wt% of dispersant NH4PAA.
600 500 400 300 200 100
Inte
nsity
(cou
nts)
0 5.0 1 .0 15.0 20.0 25.0 30.0 35.0 40.0 45.0 50.0 0
Fig. 6.4 XRD pattern
5.0
2-Theta (deg.)
of HA powders (І) as-received (ІІ) calcined at 1000 ºC
45
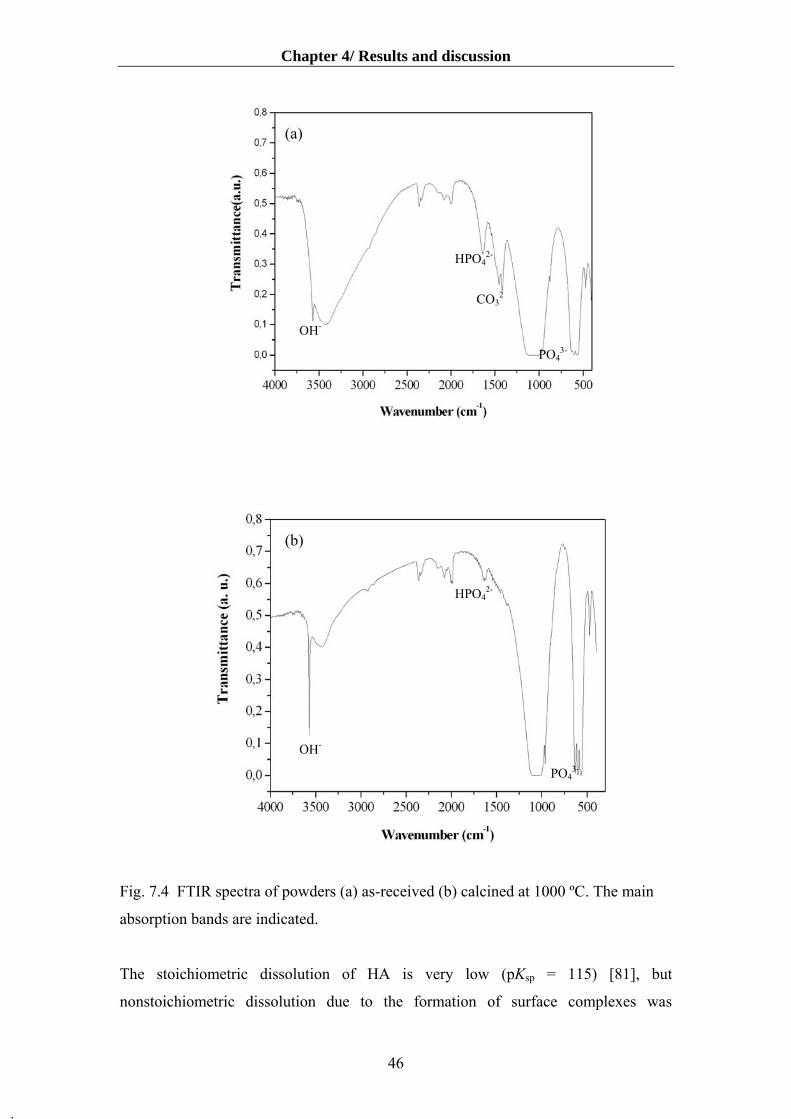
Chapter 4/ Results and discussion
(a)
2
OH-
HPO42-
(b)
HP
OH-
Fig. 7.4 FTIR spectra of powders (a) as-received (b) c
absorption bands are indicated.
The stoichiometric dissolution of HA is very l
nonstoichiometric dissolution due to the formatio
46
CO3
PO43-
O42-
PO43-
alcined at 1000 ºC. The main
ow (pKsp = 115) [81], but
n of surface complexes was
3
Chapter 4/ Results and discussion
demonstrated to occur and to cause phenomena of meta-stable equilibrium solubility
[82].
In particular, a solid surface complex Ca2(HPO4)(OH)2, formed by HA hydrolysis
mechanism, controls the solubility equilibria, according to the following equations
[80, 83]:
Ca10(PO4)6(OH)2 + 6H2O = 4Ca2(HPO4)(OH)2 + 2Ca2+ + 2HPO42- (20)
4Ca2(HPO4)(OH)2 = 8Ca2+ + 4HPO42- + 8OH- (21)
The resulting non-stoichiometric Ca/P ratio in solution (1:1 for Eq. (20) or 2:1 for Eq.
(21)) depends on which dissolution reaction prevails. If HA is prepared in water, the
surface is, presumably, just covered with surface complex Ca2(HPO4)(OH)2 and
subjected either to the equilibrium shown in Eq. (21) or to adsorption phenomena of
ionic species present in solution [84].
Generally speaking, the surface charge of apatite solids is the result of pH and
preferential dissolution or adsorption of calcium and phosphate ions, since H+, OH-,
and lattice ions are the potential determining ions. The formation of surface
complexes between potential-determining ions further complicates the estimation of
ion activity product and surface potential [85].
Fig. 8.4 reports the influence of different pre-treatments on zeta potential of HA
powder. It can be seen that the pH of the isoelectrical point (10.8) of the as-received
powder is located at about pH 9.5 for the calcined powder at 1000 ºC. This pre-
treatment is believed to be the one that less interferes with the surface charge
properties. Conversely, calcinations accentuated the surface acidity of HA powder
shifting the pHiep from 10.8 to 9.5. The zeta-potential curves for the as-received
powder and calcined powders are almost coincident, especially in the acidic side of
pH range. For pH values higher than 9.5, the zeta potential of the calcined powder
appears more negative compared to the as-received powder.
Therefore calcinations would be responsible for an increase of the surface groups,
enhancing a more negative potential and consequently, the repulsion between
particles. The highest specific surface area of as-received powder, reflecting in the
formation of the highest quantity of the Ca2(HPO4)(OH)2 complex, provides a shift of
the natural pH toward the most basic value.
47

Chapter 4/ Results and discussion
Fig. 8.4 Influence of pre-treatment on zeta-potential of HA powders a) as-received; b)
calcined at 800 ºC; c) calcined at 900 ºC; d) calcined at 1000 ºC (deagglomaration in
water with presence of 1 wt.% NH4PAA).
The establishment of a cationic specific adsorption determines a shift of the pHiep of
the as-received powder toward basic pH. This strong shift (about pHiep of 10.8) can be
due to the the higher content of Ca2+ ions, leached from the surface complex. In the
basic side of the titration curve the absolute value of the zeta-potential seems to be
related to the Ca2+ concentration in the solution. In fact, above the pHiep, the absolute
value of the zeta potential is smaller, with a higher content of Ca2+ in solution (the
zeta potential at pH 12.2 is -29, -24, -20 and -14 mV for calcined powders in 1000,
900, 800 °C and as-received powder respectively). Above pHiep, the particles become
negatively charged and start to repel the dissociation of the groups of the
polyelectrolyte chain.
The surface chemistry of powders dispersed in aqueous media can be modified in
order to produce repulsive inter-particle forces that promote dispersion. Polyacrylates
have proved to be effective dispersing agents for both clay- and nonclay-based
ceramics, through an electrosteric mechanism of dispersing action. Their combination
48
Chapter 4/ Results and discussion
is important especially in the case of high solids concentration where the average
inter-particle distance is short [86, 87].
The calcination at 1000 °C resulted in a significant increase of the absolute value of
zeta-potential. Fig. 9.4 shows optimum values of dispersant for the 66 wt% slurry in
different calcination temperatures. At low amounts of dispersant, the electric double
layer is not enough to achieve stabilization and prevails the attraction between
particles but at optimum value of dispersant, slurry achieves stability and the lowest
viscosity. When a higher amount of dispersant is added, the electric double layer is
compressed by too high electrolyte concentration and the electrostatic repulsion is less
effective and therefore, the viscosity increases. Besides, an excess of non-adsorbed
polyelectrolyte in solution could provide a viscosity increase. It is observed that the
lowest dispersant values could be obtained when powder is calcined at 1000 °C. The
minimum viscosity is reached in concentrations of 0.35 wt% NH4PAA when the
powder is calcined at 1000 °C. Whereas, for HA calcined at 900 °C the best
concentration was 2.2 wt% NH4PAA. A great decrease of viscosity is observed when
the HA calcined powder at 1000 °C were used, being those slurries prepared with
very fluid with viscosity of 0.24 Pa s at 100 s-1 for 66 wt% solid.
In order to study the content of admissible solid, slurries containing 66 wt% of the as-
received HA powder were prepared using a concentration of 3.5 wt% NH4PAA. The
slurries had a paste-like consistency. In the case of the as-received powders, the
starting solid loading could not exceed 41wt% due to more accentuated viscous
characteristic of these suspensions.
The slurries made of powder calcined at 1000 °C were always more fluid than those
made of powder calcined at 900 °C for the all concentrations of the studied dispersant.
Part of the liquid in slurry is immobilised inside the pores of agglomerates, therefore
the effective volume of liquid would be higher in powder with lower porosity.
Porosity decrease significantly as the calcination temperature increases. Therefore, the
viscosity of powder calcined at 1000 °C would be lower.
Therefore, in addition to the chemical composition and surface area of the powder,
another factor influencing slurry fluidity should be presented. Calcination affects on
reduction of the dispersant dramatically. This difference is significant and reveals that
49
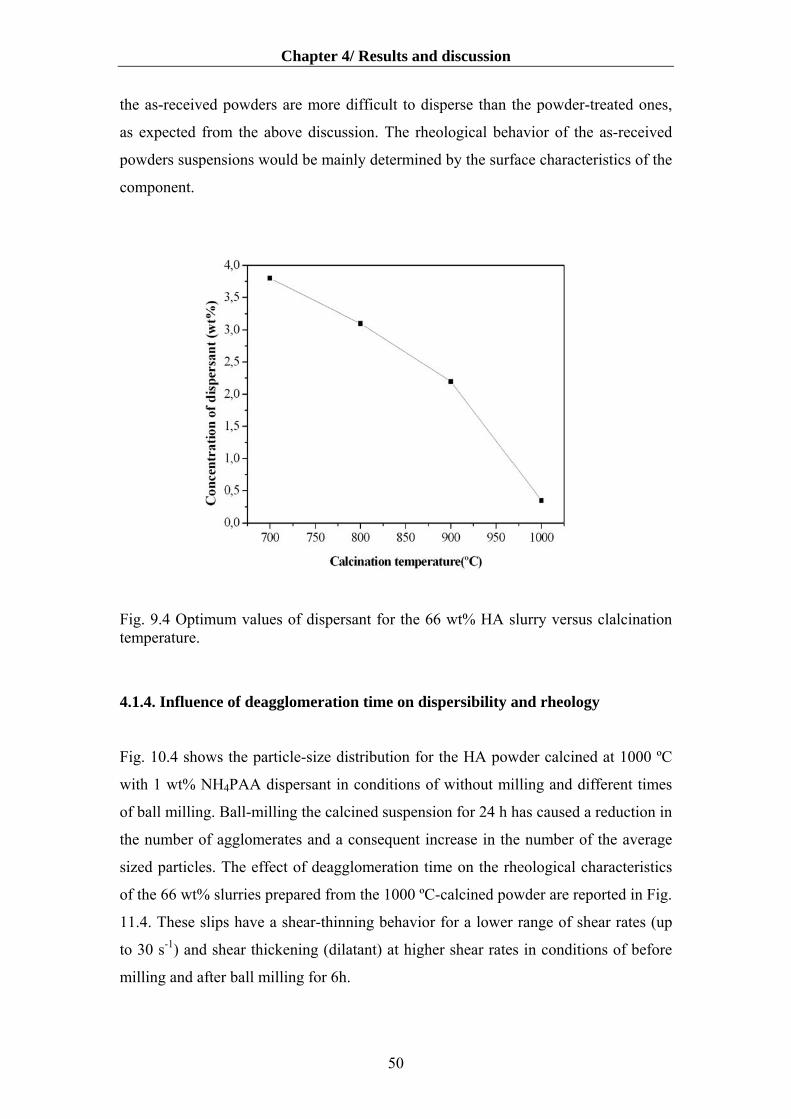
Chapter 4/ Results and discussion
the as-received powders are more difficult to disperse than the powder-treated ones,
as expected from the above discussion. The rheological behavior of the as-received
powders suspensions would be mainly determined by the surface characteristics of the
component.
Fig. 9.4 Optimum values of dispersant for the 66 wt% HA slurry versus clalcination temperature.
4.1.4. Influence of deagglomeration time on dispersibility and rheology
Fig. 10.4 shows the particle-size distribution for the HA powder calcined at 1000 ºC
with 1 wt% NH4PAA dispersant in conditions of without milling and different times
of ball milling. Ball-milling the calcined suspension for 24 h has caused a reduction in
the number of agglomerates and a consequent increase in the number of the average
sized particles. The effect of deagglomeration time on the rheological characteristics
of the 66 wt% slurries prepared from the 1000 ºC-calcined powder are reported in Fig.
11.4. These slips have a shear-thinning behavior for a lower range of shear rates (up
to 30 s-1) and shear thickening (dilatant) at higher shear rates in conditions of before
milling and after ball milling for 6h.
50
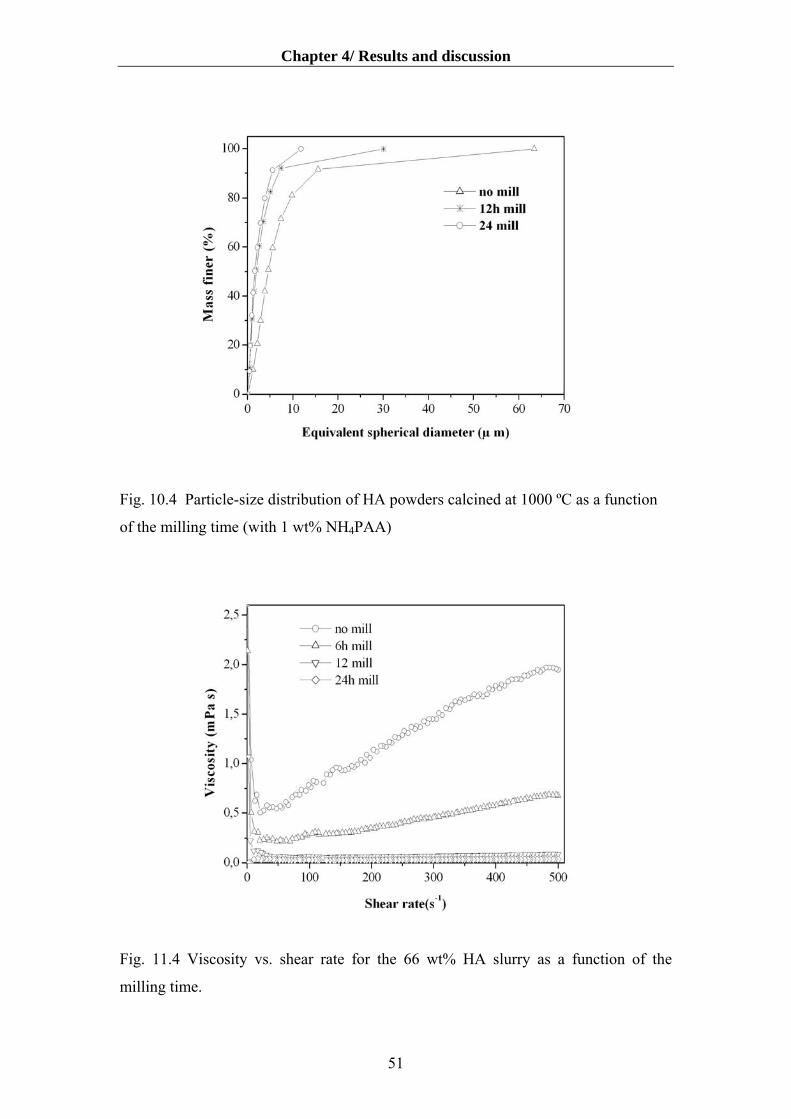
Chapter 4/ Results and discussion
Fig. 10.4 Particle-size distribution of HA powders calcined at 1000 ºC as a function
of the milling time (with 1 wt% NH4PAA)
Fig. 11.4 Viscosity vs. shear rate for the 66 wt% HA slurry as a function of the
milling time.
51
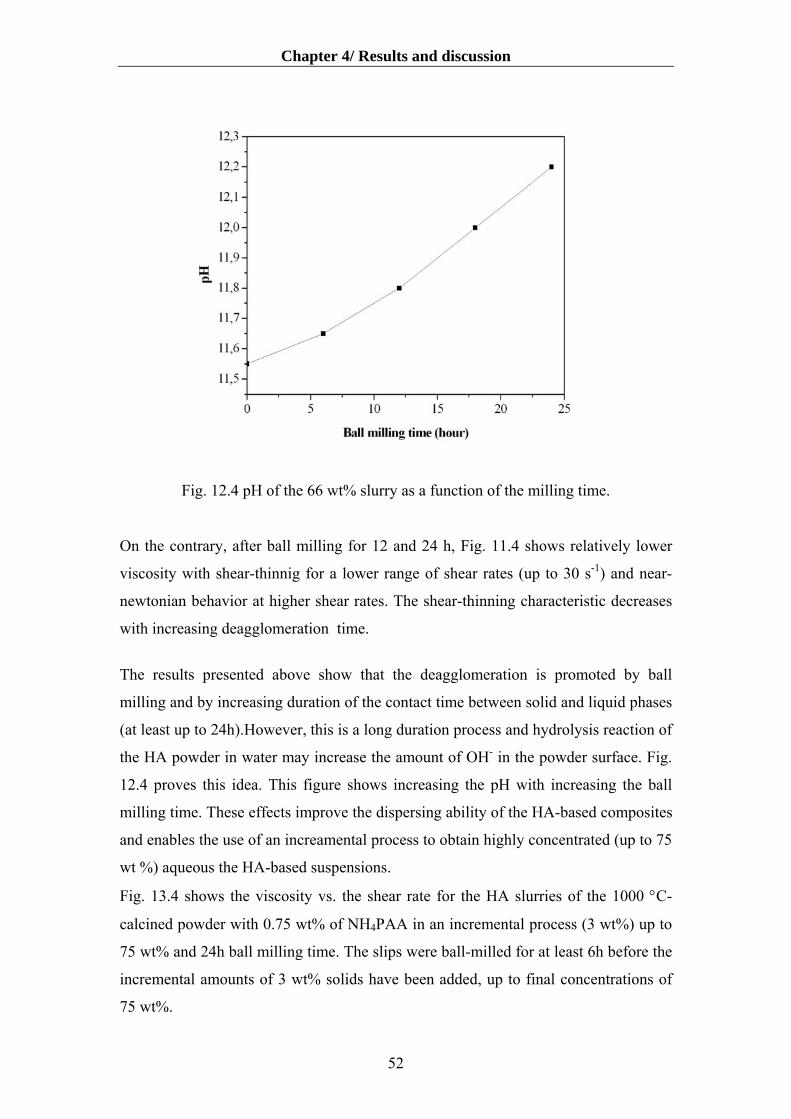
Chapter 4/ Results and discussion
Fig. 12.4 pH of the 66 wt% slurry as a function of the milling time.
On the contrary, after ball milling for 12 and 24 h, Fig. 11.4 shows relatively lower
viscosity with shear-thinnig for a lower range of shear rates (up to 30 s-1) and near-
newtonian behavior at higher shear rates. The shear-thinning characteristic decreases
with increasing deagglomeration time.
The results presented above show that the deagglomeration is promoted by ball
milling and by increasing duration of the contact time between solid and liquid phases
(at least up to 24h).However, this is a long duration process and hydrolysis reaction of
the HA powder in water may increase the amount of OH- in the powder surface. Fig.
12.4 proves this idea. This figure shows increasing the pH with increasing the ball
milling time. These effects improve the dispersing ability of the HA-based composites
and enables the use of an increamental process to obtain highly concentrated (up to 75
wt %) aqueous the HA-based suspensions.
Fig. 13.4 shows the viscosity vs. the shear rate for the HA slurries of the 1000 °C-
calcined powder with 0.75 wt% of NH4PAA in an incremental process (3 wt%) up to
75 wt% and 24h ball milling time. The slips were ball-milled for at least 6h before the
incremental amounts of 3 wt% solids have been added, up to final concentrations of
75 wt%.
52
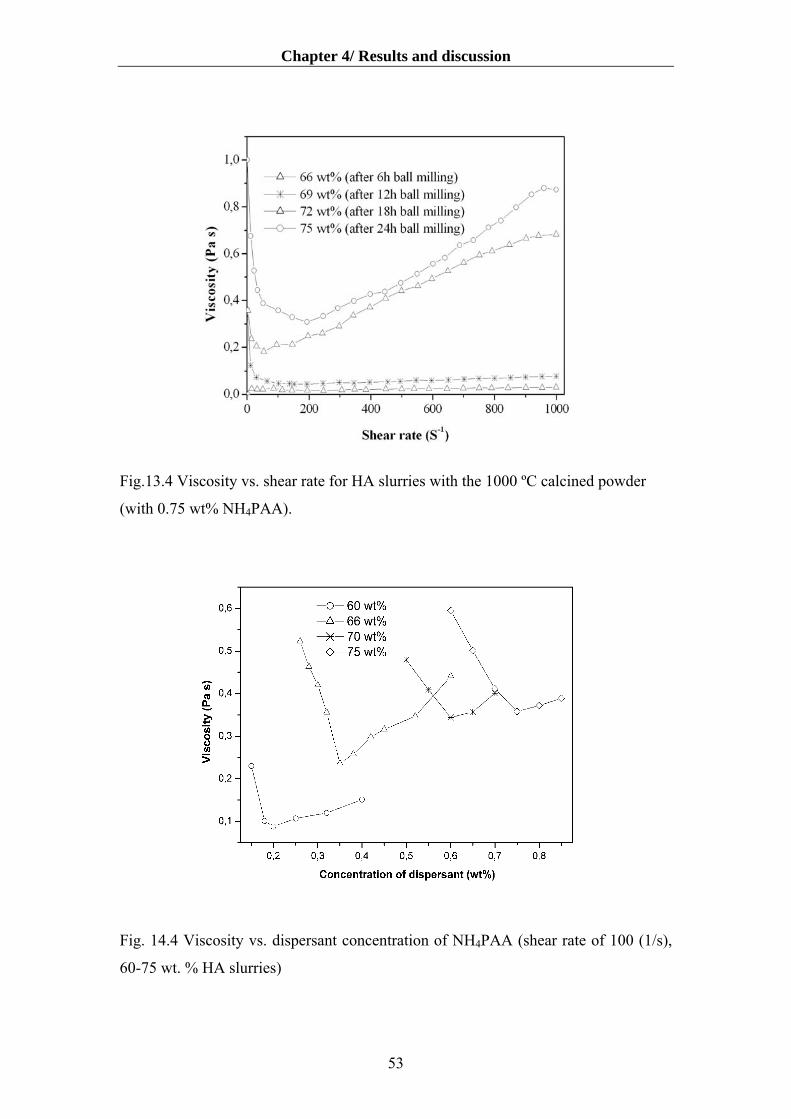
Chapter 4/ Results and discussion
Fig.13.4 Viscosity vs. shear rate for HA slurries with the 1000 ºC calcined powder
(with 0.75 wt% NH4PAA).
Fig. 14.4 Viscosity vs. dispersant concentration of NH4PAA (shear rate of 100 (1/s),
60-75 wt. % HA slurries)
53
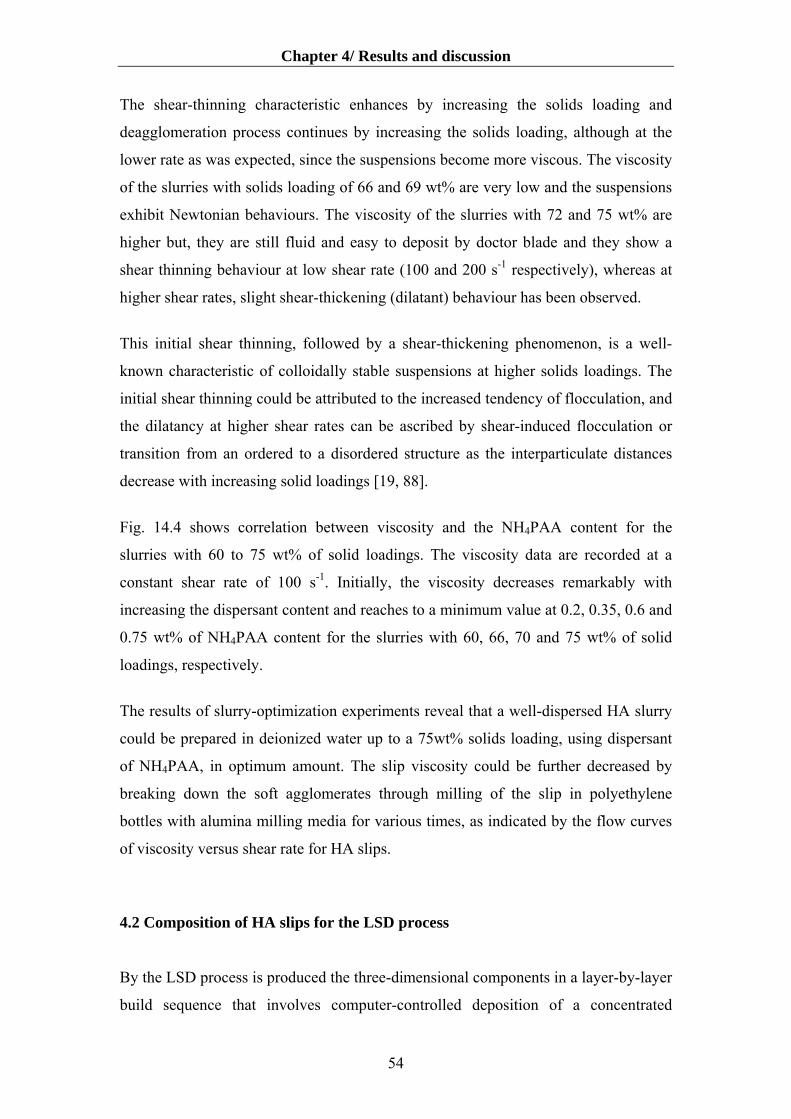
Chapter 4/ Results and discussion
The shear-thinning characteristic enhances by increasing the solids loading and
deagglomeration process continues by increasing the solids loading, although at the
lower rate as was expected, since the suspensions become more viscous. The viscosity
of the slurries with solids loading of 66 and 69 wt% are very low and the suspensions
exhibit Newtonian behaviours. The viscosity of the slurries with 72 and 75 wt% are
higher but, they are still fluid and easy to deposit by doctor blade and they show a
shear thinning behaviour at low shear rate (100 and 200 s-1 respectively), whereas at
higher shear rates, slight shear-thickening (dilatant) behaviour has been observed.
This initial shear thinning, followed by a shear-thickening phenomenon, is a well-
known characteristic of colloidally stable suspensions at higher solids loadings. The
initial shear thinning could be attributed to the increased tendency of flocculation, and
the dilatancy at higher shear rates can be ascribed by shear-induced flocculation or
transition from an ordered to a disordered structure as the interparticulate distances
decrease with increasing solid loadings [19, 88].
Fig. 14.4 shows correlation between viscosity and the NH4PAA content for the
slurries with 60 to 75 wt% of solid loadings. The viscosity data are recorded at a
constant shear rate of 100 s-1. Initially, the viscosity decreases remarkably with
increasing the dispersant content and reaches to a minimum value at 0.2, 0.35, 0.6 and
0.75 wt% of NH4PAA content for the slurries with 60, 66, 70 and 75 wt% of solid
loadings, respectively.
The results of slurry-optimization experiments reveal that a well-dispersed HA slurry
could be prepared in deionized water up to a 75wt% solids loading, using dispersant
of NH4PAA, in optimum amount. The slip viscosity could be further decreased by
breaking down the soft agglomerates through milling of the slip in polyethylene
bottles with alumina milling media for various times, as indicated by the flow curves
of viscosity versus shear rate for HA slips.
4.2 Composition of HA slips for the LSD process
By the LSD process is produced the three-dimensional components in a layer-by-layer
build sequence that involves computer-controlled deposition of a concentrated
54
Chapter 4/ Results and discussion
colloidal suspension. Current challenges to this approach involve controlling
macroscopic shape evolution during deposition to avoid unwanted deformation.
The lower content of solid (<66 wt%) in the slurries has caused cracking after drying
due to excessive shrinkage and the higher content of solid (>75wt%) in the slurry has
too high viscosity for deposition.
A stable suspension has been achieved with viscosity of 0.36 Pa s at shear rate of 100
s-1 for 75 wt% solid loading with 0.75 wt% NH4PAA as dispersant, which is suitable
to deposit by doctor blade. The suspensions generally exhibited a transition from
shear thinning to shear thickening flow as shear rate exceeded a certain critical level.
But, at the applied speed of pump (1300-1600 rpm/min) the slurries have a shear
thinning behavior. During the process, no sedimentation occurred for several hours.
In order to facilitation of the layering operation, 0.02 wt% surfactant (sodium dodecyl
sulfate, Fluka Co., Germany) and defoamer (surfynol DF-58, Air products Co.,
Holand) has been used. These materials are added to slurry and mixed for 10 minutes.
A well dispersed and highly stable slurry with low viscosity and high solid content to
control the shrinkage are the required characteristics to obtain the defect free green
layers. Slurry preparation usually involves particle deflocculation and dispersion in a
solvent using dispersants and slurry homogenization with mixing and ball milling,
which strongly influence the green layers characteristics.
4.3 The drying behaviour of the HA layers at the LSD process
In the LSD process, shaping and drying processes occur simultaneously. During
drying, the fluid is removed via evaporative processes. This technique yields flat, thin
ceramic sheets with thickness as such as 100 µm.
After minimal drying, the next deposited suspension undergoes a liquid to solid
transition.
The layer thickness at the LSD process depends on
a. Viscosity of the slurry
b. Speed of the doctor blade moving
c. Doctor-blade gap setting
d. Reservoir depth behind the doctor blade (corresponding to pump speed)
In the most cases, the speed of the doctor blade moving and the pump speed are
between 100-120 mm/s and 1300-1600 rpm/min, respectively.
55
Chapter 4/ Results and discussion
The problems in layering and drying behaviour are the cracks during drying that has
been solved by higher solid loading and lower viscosity (more milling) of the
optimized slurries (according of Eq (14), see; chapter 2).
Also, in practice, high dispersant content can lead to problems during drying. Cracks
have been observed at higher additive concentration (more of 1 wt %). This
observation was attributed to bridging effects resulted from salt precipitation in the
final stage of drying. The migration of such species to the external surface of these
layers during drying was also evident which leading to severe microstructural
nonuniformity.
However, the drying temperature has been adjusted at 90 °C by heating of the ceramic
substrate. Slower drying (lower temperature and /or air flow) have been helped to
avoid the cracks formation (according of Eq (14)).
Drying is a critical step in colloidal processing of ceramic films and bulk forms. It is a
multistage process that involves capillary-driven fluid flow, viscous deformation of
the body (or film), evaporation, and diffusion. Removal of the liquid vehicle required
for colloidal processing often leads to problems with dimensional control,
segregation, and cracking [89, 90].
A minimum solid loading of 66 wt% showed to be effective in avoiding cracks
formation and uneven shrinkage and forth shape maintenance. In these cases, the solid
loadings in slurries are typically limited to about 75 wt%. Ideally, the slurries should
have the highest solids loading with the lowest viscosity. High solids loading help to
reduce the shrinkage and related cracking possibilities during the sintering of green
body, while low viscosity reduces defects as such as cracks and delamination in
deposited layers.
4.4 Comparative study of the LSD green layers
As expected, the films produced from dispersed suspensions yielded higher packing
densities than those produced from aggregated suspensions. As described, one must
tailor interparticle forces, suspension rheology, consolidation, and drying behavior to
achieve the optimal microstructure for a given application. Problems such as large
shrinkage during firing and green body cracking are likely to appear.
56

Chapter 4/ Results and discussion
The slurry was deposited to a thin tape on ceramic substrate with doctor blade initial
gap setting of 100 µm. This gap is kept constant in all the experiments. After 2
minutes of drying, the next layer is deposited. The fabricated green layers were used
for comparative studies based on visual inspection, green density. The green density
of the layers was determined using a geometrical technique. Three samples (2 cm×2
cm) are taken from different locations of green layers. The thickness of the sample
were measured at different locations on the samples by using a micrometer with the
accuracy of 0.001 mm and an average was taken for the calculation of the volume. By
knowing the mass and volume, the green density was calculated. High green density
and solid content indicate that the powder is filled in the green tape uniformly. By
using the highest solid loading, the HA suspension is attained crack-free parts,
produced green bodies having densities at the range of 56.6% of theoretical (3.16
g·cm-3). Fig. 15.4 shows the green density of HA layers as a function of the solid
loading of the slurries.
Fig. 15.4 Geen density of HA layers as a function of solid loading of slurries.
57
Chapter 4/ Results and discussion
4.5 Laser sintering of the HA layers
4.5.1 The effect of laser parameters on microstructure
The slurries with solid loadings of 66 and 75 wt% showed to be effective in avoiding
cracks formation and uneven shrinkage. A continuous CO2 laser beam controlled by a
PC was used to sinter each layer that was deposited by doctor blade casting.
The rate of energy absorbed by the surface area depends on the intensity of the laser
irradiation, the period of a single exposure, the number of total exposures, and the
time between each exposure. According to the optical properties of the powder, a
portion of irradiation is absorbed and the reminder is reflected. The absorbed energy
is either conducted into the powder bed or transferred to the surroundings through
radiation or convection at the surface [91].
Nelson [91, 92] has shown that one of the key processing parameters in the selective
laser sintering (SLS) process is the absorbed energy density (AED)
⎟⎠⎞
⎜⎝⎛
⎟⎠⎞
⎜⎝⎛
⎟⎠⎞
⎜⎝⎛=
SSBSAED
πω2
P ωω 22 (22)
ω is the effective laser beam radius, P is the laser power, BS is the beam speed, and
SS is the scan spacing. The first term on the right hand side of Eq.(22) is the power
density of the laser beam, the second indicates the time that a circle of radius is under
the laser beam during one single pulse, and the third estimates the number of pulses
received by the same circle. Practically, the distance between two adjacent scan lines,
SS, is less than the laser beam diameter to permit each point of the surface to receive
several pulses [92, 93].
AED from Eq.(9.4) can be expressed in (cal/cm2) as:
( )( )SSBSAED =
P9.23 (23)
where P is the laser power in watt, BS is the laser speed in m/s, and SS is the scan
vector spacing in µm.
58

Chapter 4/ Results and discussion
Fig. 16.4 Variation in the penetration depth with absorbed energy density.
The penetration depth (Dp) increases by increasing the laser power (P) and by the
decreasing the beam speed (BS). Fig. 16.4 shows the penetration depth vs. variation
of AED. In the LSD process the largest slice thickness is limited by the penetration
depth. Fig. 17.4 shows the morphology of a cross section of the samples sintered at
different conditions.
The slice thickness is an important factor that influences the period of the whole
process and surface roughness. A reduced layer thickness causes a decrease in surface
roughness and an increase in accuracy of the shape since the step effect is minimized.
But it takes more time to build up a component than large slice thickness does. Thus,
density decreases and the surface finishing improves. A reduction of the layer
thickness allows for a faster scan velocity, because the necessary sintering depth is
also reduced to ensure a fusion to the previous layer is reduced, too. In our
experiments, the smallest layer is 100 µm high.
After laser sintering of each layer, the powder is cooled by convection and radiation
heat exchange to its surface and by conduction into neighbour layers. The laser beam
speed and the scanned vector length may determine the cooling period. The scan
spacing should not be too large, because the cross section of a layer may not be
59
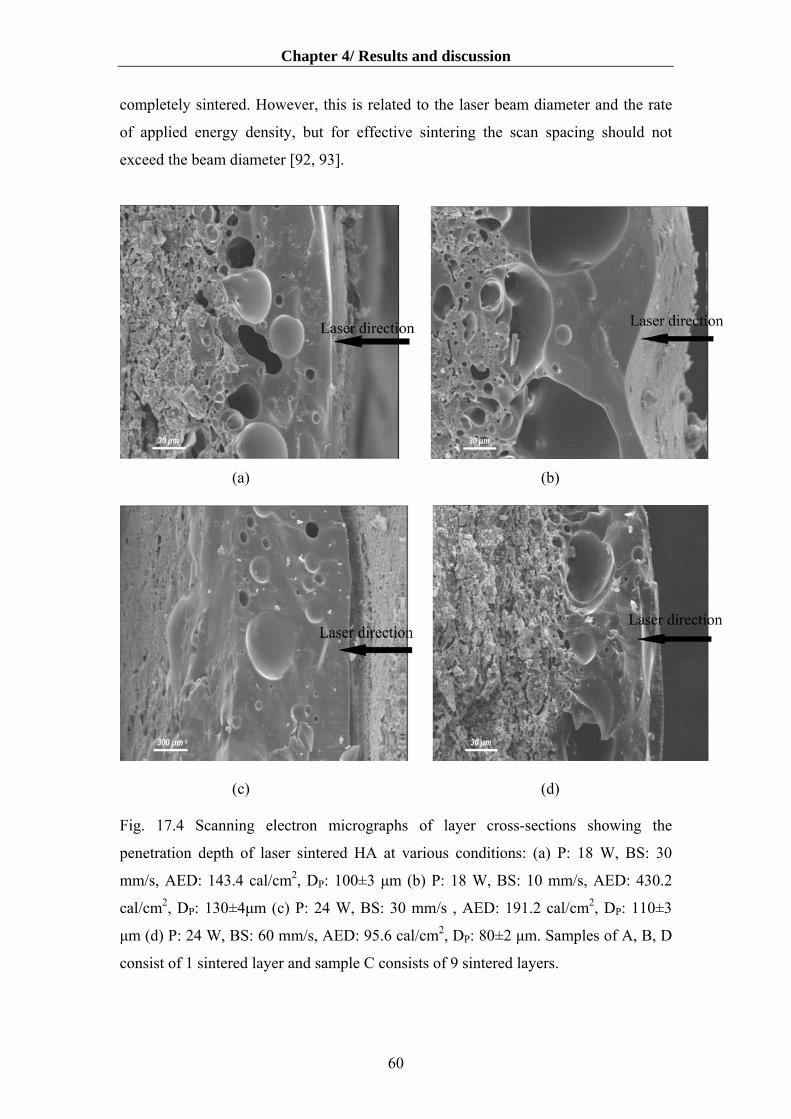
Chapter 4/ Results and discussion
completely sintered. However, this is related to the laser beam diameter and the rate
of applied energy density, but for effective sintering the scan spacing should not
exceed the beam diameter [92, 93].
(a) (b)
(c) (d) Fig. 17.4 Scanning electron micrographs of layer cross-sections showing the
penetration depth of laser sintered HA at various conditions: (a) P: 18 W, BS: 30
mm/s, AED: 143.4 cal/cm2, DP: 100±3 µm (b) P: 18 W, BS: 10 mm/s, AED: 430.2
cal/cm2, DP: 130±4µm (c) P: 24 W, BS: 30 mm/s , AED: 191.2 cal/cm2, DP: 110±3
µm (d) P: 24 W, BS: 60 mm/s, AED: 95.6 cal/cm2, DP: 80±2 µm. Samples of A, B, D
consist of 1 sintered layer and sample C consists of 9 sintered layers.
60

Chapter 4/ Results and discussion
In practice, in laser sintering of HA samples, the distortion is more than shrinkage,
especially for direct laser sintering in which high temperature is applied to sinter high
melting-point materials like HA. The shrinkage affects not only the final dimensions
of parts, but also result in distortion and warpage. In general, the distortion and
warpage can be eliminated by optimizing the process parameters like laser power,
scanning speed and scanning spacing etc, for the direct laser sintering process.
Therefore, here, the optimized parameters have been discussed.
In these experiments, the thickness of the slurry layer and the scan spacing (SS) were
kept constant at 100 µm, the beam speed and the laser power were varied in the range
of 10 - 60 mm/s and 18 - 24 W, respectively. The absorbed energy density (AED) was
varied in the range of 95.6 – 430.2 cal/cm2 as estimated by Eq. (23).
The microstructures analyzed by SEM are shown in Fig. 18.4. The sintered samples
have a pore size of 40 -80 µm when the energy density, AED, varies between 95.6-
191.2 cal/cm2. A higher amount of energy increases the temperature locally at the
powder bed, which to result in a large amount of liquid phase formation. An increase
in laser power leads to an increase in the density of the specimen, since more energy
is delivered into the powder and larger melt pools fill up the porous structures of
previous layers. As the laser power was increased, a transition from sintering mode to
the remelting of sub-layers was observed. However, surface roughness also increases
because the molten particles tend to form larger spherical structures. Increasing the
scan speed has the opposite effect due to higher velocity of the laser, less energy is
delivered into the powder bed and less material is melted and less time is available for
the formation of agglomerations.
The maximum density achieved was approx. 63-68 % of theoretical density. The
morphology of the obtained the layers is depending on the absorbed energy density.
At high energy density, the porosity is finely dispersed.
Fig. 19.4 shows the pore size distribution of the green layers and laser sintered
samples at different cases of absorbed energy density.
61

Chapter 4/ Results and discussion
(a) (b)
©
Fig.18.4 Surfaces of the laser sintered samples (SEM) (a) P: 18 W, BS: 30 mm/s,
AED: 143.4 cal/cm2 (b) P: 24 W, BS: 60 mm/s, AED: 95.6 cal/cm2 (c) P: 24 W, BS:
30 mm/s, AED: 191.2 cal/cm2
62
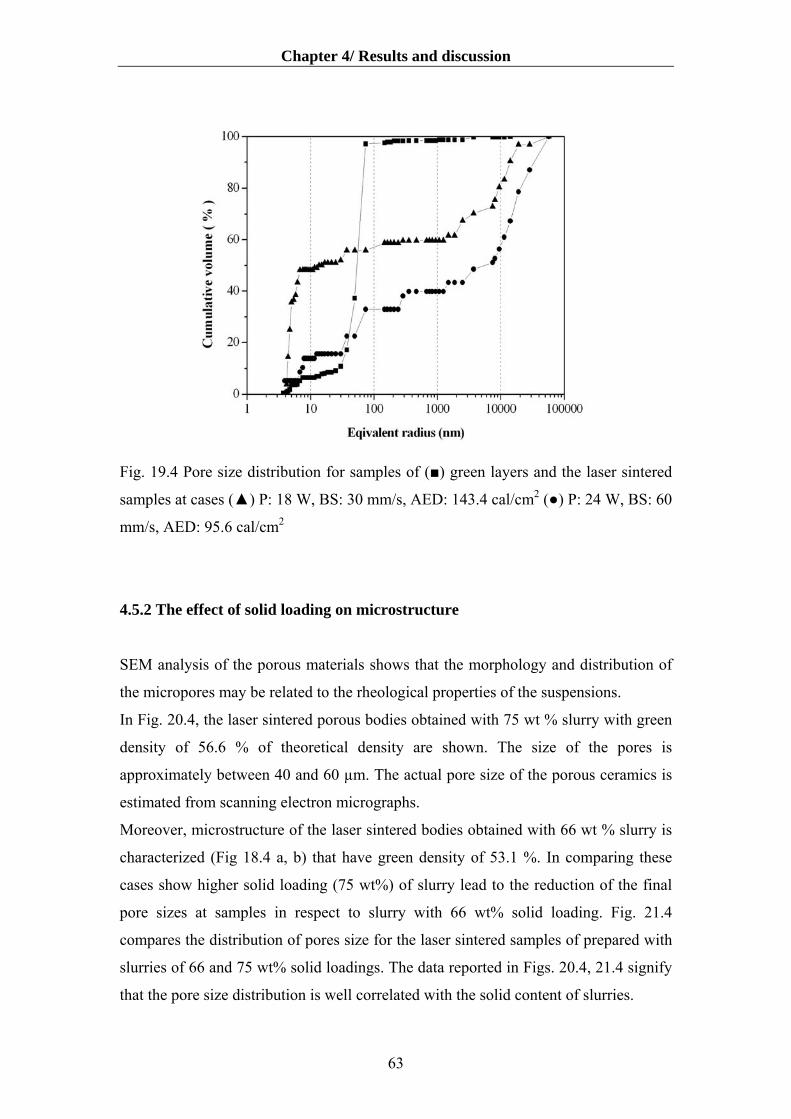
Chapter 4/ Results and discussion
Fig. 19.4 Pore size distribution for samples of (■) green layers and the laser sintered
samples at cases (▲) P: 18 W, BS: 30 mm/s, AED: 143.4 cal/cm2 (●) P: 24 W, BS: 60
mm/s, AED: 95.6 cal/cm2
4.5.2 The effect of solid loading on microstructure
SEM analysis of the porous materials shows that the morphology and distribution of
the micropores may be related to the rheological properties of the suspensions.
In Fig. 20.4, the laser sintered porous bodies obtained with 75 wt % slurry with green
density of 56.6 % of theoretical density are shown. The size of the pores is
approximately between 40 and 60 µm. The actual pore size of the porous ceramics is
estimated from scanning electron micrographs.
Moreover, microstructure of the laser sintered bodies obtained with 66 wt % slurry is
characterized (Fig 18.4 a, b) that have green density of 53.1 %. In comparing these
cases show higher solid loading (75 wt%) of slurry lead to the reduction of the final
pore sizes at samples in respect to slurry with 66 wt% solid loading. Fig. 21.4
compares the distribution of pores size for the laser sintered samples of prepared with
slurries of 66 and 75 wt% solid loadings. The data reported in Figs. 20.4, 21.4 signify
that the pore size distribution is well correlated with the solid content of slurries.
63

Chapter 4/ Results and discussion
(a) (b)
Fig. 20.4 Surfaces of the laser sintered samples (SEM) (a) P: 18 W, BS: 30 mm/s,
AED: 143.4 cal/cm2 (b) P: 24 W, BS: 60 mm/s, AED: 95.6 cal/cm2. (for slurries with
75 wt% solid loading).
Fig. 21.4 The pore size distribution of the laser sintered samples at case of P: 24 W,
BS: 60 mm/s, AED: 95.6 cal/cm2 (●) 66 wt% solid loading (▲) 75 wt% solid loading
64
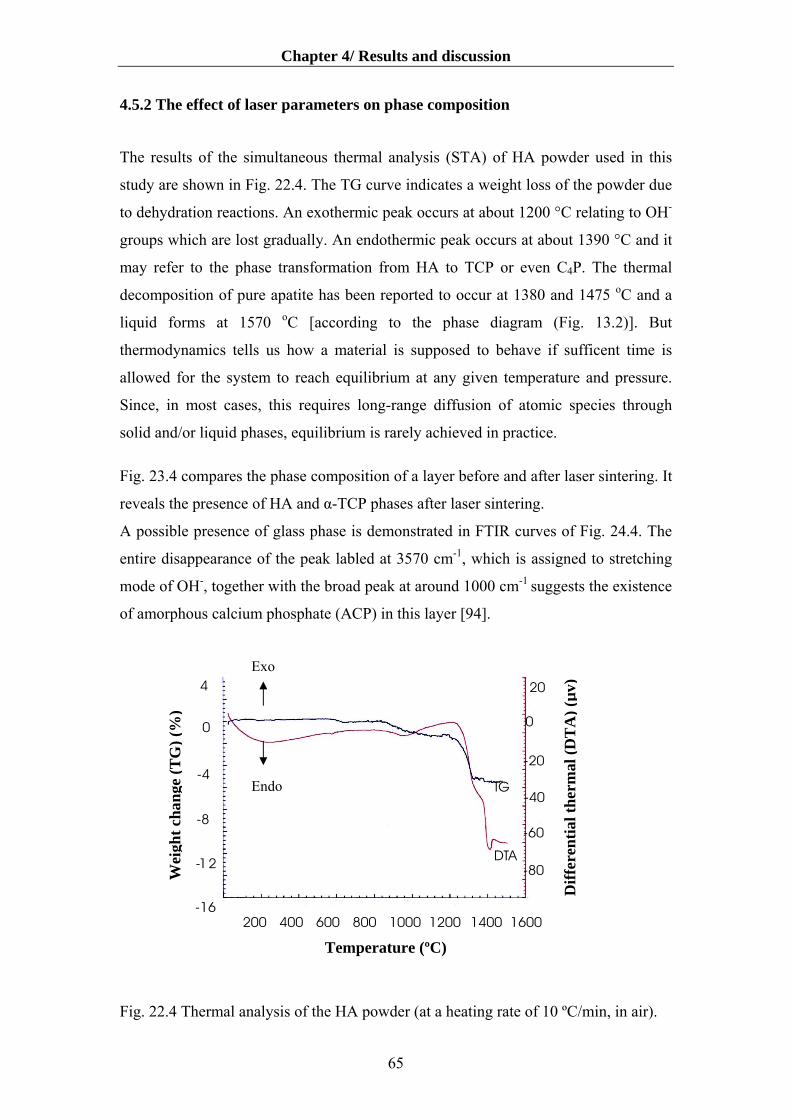
Chapter 4/ Results and discussion
4.5.2 The effect of laser parameters on phase composition
The results of the simultaneous thermal analysis (STA) of HA powder used in this
study are shown in Fig. 22.4. The TG curve indicates a weight loss of the powder due
to dehydration reactions. An exothermic peak occurs at about 1200 °C relating to OH-
groups which are lost gradually. An endothermic peak occurs at about 1390 °C and it
may refer to the phase transformation from HA to TCP or even C4P. The thermal
decomposition of pure apatite has been reported to occur at 1380 and 1475 oC and a
liquid forms at 1570 oC [according to the phase diagram (Fig. 13.2)]. But
thermodynamics tells us how a material is supposed to behave if sufficent time is
allowed for the system to reach equilibrium at any given temperature and pressure.
Since, in most cases, this requires long-range diffusion of atomic species through
solid and/or liquid phases, equilibrium is rarely achieved in practice.
Fig. 23.4 compares the phase composition of a layer before and after laser sintering. It
reveals the presence of HA and α-TCP phases after laser sintering.
A possible presence of glass phase is demonstrated in FTIR curves of Fig. 24.4. The
entire disappearance of the peak labled at 3570 cm-1, which is assigned to stretching
mode of OH-, together with the broad peak at around 1000 cm-1 suggests the existence
of amorphous calcium phosphate (ACP) in this layer [94].
200 400 600 800 1000 1200 1400 1600
(DTA
)(µv)D
i f fere
nti a
l th erm
al
-16
-12
-8
-4
0
4
-80
-60
-40
-20
0
20
TG
DTA
T
Exo
Diff
eren
tial t
herm
al (D
TA
) (µv
)
emperature (°C)
We
igh t
cha
ng
e ( T
G)(%
)
Wei
ght c
hang
e (T
G) (
%)
Endo
Temperature (ºC)
Fig. 22.4 Thermal analysis of the HA powder (at a heating rate of 10 ºC/min, in air).
65

Chapter 4/ Results and discussion
600
500
400
300
200
100
0
a
b
c
HAPTcp
2-Theta
Intensity
10.0 15.0 20.0 25.0 30.0 35.0 40.0 45.0 50.0
HAP α-TCP
Inte
nsity
(cou
nts)
2-Theta (deg.)
Fig. 23.4 XRD plots showing one HA layer a) before laser sintering; b) after laser
sintering: P: 24 W, BS: 30 mm/s, AED: 191.2 cal/cm2; c)after laser sintering: P:
18W, BS: 10 mm/s, AED: 430.2 cal/cm2.
(b)(a)
OH-O -
Fig. 24.4 FTIR spectra of (a) HA powder and (b) the laser
BS: 10 mm/s, AED: 430.2 cal/cm2.
66
H
sintered layer (P: 18W,

Chapter 4/ Results and discussion
It has been shown that ACP was beneficial for accelerated fixation and remodeling of
the prothesis in the calcium phosphate coatings [95].
As the energy density level of the laser is increased, the amount of other involved
chemical compounds increases (Fig. 25.4).
400
350
300
Inte
nsity
(cou
nts)
10.0
Inte
nsity
(cou
nts)
300
400
350
●(a)
▲
2
●
350
300
Inte
nsity
(cou
nts)
10.0
▲
(b)
300
350
10.0
Inte
nsity
(cou
nts)
●
10.0
Fig. 25.4. XRD plots of the
478 cal/cm2; b) P: 24W, BS
● HA α-TCP
■ C P
2-Theta (deg20.0 30.0
4
▲
●
▲■
■
2-Theta (deg20.0 30.0
4
●
2-Theta (
20.0 30.0
●
▲▲■ ■■
■
2-Theta (
20.0 30.0
laser sintered HA laye
: 10 mm/s, AED: 573.6
67
.)
●
.)
d
d
rs
c
40.0
●●
● ●■
40.0
eg)
40.0
●
●
■
eg)
40.0
a) P: 20
al/cm2.
50
● ● ● ● ■
50.
5
●■
50
W,
.0
0
0.0
.0
BS: 1
60.0
60.0
60.
● ●
● ■ ●
60.0
0 mm/s
0
●
● HA α-TCP
■ C P
25050
100100
50 50
150150
200200
00
0 0
50 50
100100
250250
200200
150150
, AED:
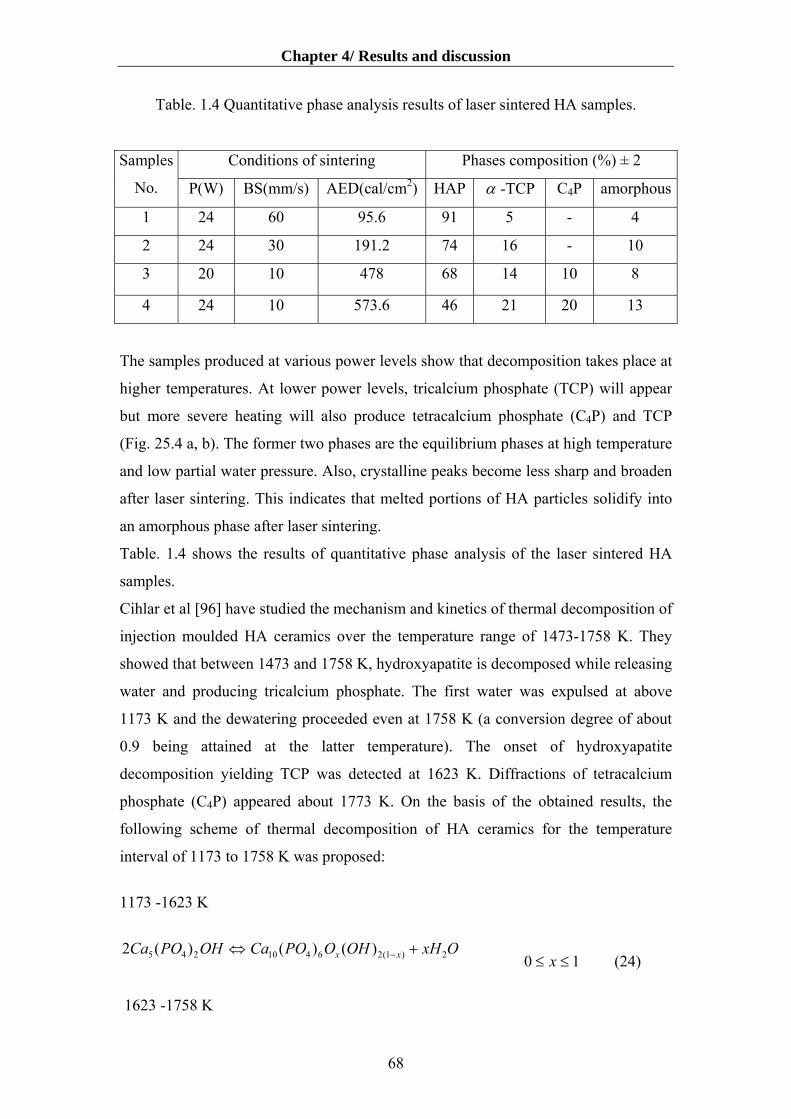
Chapter 4/ Results and discussion
Table. 1.4 Quantitative phase analysis results of laser sintered HA samples.
Conditions of sintering Phases composition (%) ± 2 Samples
No. P(W) BS(mm/s) AED(cal/cm2) HAP α -TCP C4P amorphous
1 24 60 95.6 91 5 - 4
2 24 30 191.2 74 16 - 10
3 20 10 478 68 14 10 8
4 24 10 573.6 46 21 20 13
The samples produced at various power levels show that decomposition takes place at
higher temperatures. At lower power levels, tricalcium phosphate (TCP) will appear
but more severe heating will also produce tetracalcium phosphate (C4P) and TCP
(Fig. 25.4 a, b). The former two phases are the equilibrium phases at high temperature
and low partial water pressure. Also, crystalline peaks become less sharp and broaden
after laser sintering. This indicates that melted portions of HA particles solidify into
an amorphous phase after laser sintering.
Table. 1.4 shows the results of quantitative phase analysis of the laser sintered HA
samples.
Cihlar et al [96] have studied the mechanism and kinetics of thermal decomposition of
injection moulded HA ceramics over the temperature range of 1473-1758 K. They
showed that between 1473 and 1758 K, hydroxyapatite is decomposed while releasing
water and producing tricalcium phosphate. The first water was expulsed at above
1173 K and the dewatering proceeded even at 1758 K (a conversion degree of about
0.9 being attained at the latter temperature). The onset of hydroxyapatite
decomposition yielding TCP was detected at 1623 K. Diffractions of tetracalcium
phosphate (C4P) appeared about 1773 K. On the basis of the obtained results, the
following scheme of thermal decomposition of HA ceramics for the temperature
interval of 1173 to 1758 K was proposed:
1173 -1623 K
OxHOHOPOCaOHPOCa xx 2)1(26410245 )()()(2 +⇔ − 10 ≤≤ x (24)
1623 -1758 K
68

Chapter 4/ Results and discussion
OHxCaOPOCaOHOPOCa xx 2243)1(26410 )1()(3)()( −++⇔− (25)
C4P started to form at temperatures above 1750 K according to the equation
(26)
OPOCaCaOPOCa 244243 )()( →+
The first equation of the scheme, describing conversion of HA to oxyapatite (HOA)
and liberation of water, was examined thermogravimetrically. No significant
differences were established between the diffraction spectra of HA and HOA. The
second equation of the scheme, describing the thermal decomposition of HOA to α -
TCP and CaO, is based on the results of diffraction analysis. Diffraction lines of two
crystalline phases, HOA and α -TCP, were found in the spectra within the
temperature range of 1623 to 1758 K. Whereas, numerous authors [97, 98, 99] stated
that the onset of decomposition of HA to TCP and C4P occurred at the same
temperature, in their case and under all conditions the formation of C4P was
confirmed to take place at temperatures higher at least 130 K than the formation of
TCP (1623 vs. >1758 K). The minimum temperature of TCP established 1623 K by
the other authors [97, 98, 99] that does not likewise agree exactly with the literary
data. It has been assumed that the differences are most likely due to different
arrangements of their experiments (kinetic study of decomposition of HA ceramics),
to the purity of reagents and to water vapor content in the furnace atmosphere. The
mechanism of thermal decomposition of HA ceramics involves four processes:
sintering, removal of water, decomposition of HA to TCP, and formation of C4P [96].
The sintering caused the HA ceramics to shrink by at least 30 vol%. On neglecting the
fact that thermal exposure changes the composition of the HA ceramics, the 30%
shrinkage would correspond to a relative density of about 0.93. During sintering, the
“open” porous structure was transformed into closed pores. The time required for
maximum shrinkage and closing of pores in the HA ceramics was decreasing with
increasing temperature. An equilibrium is established between HOA and H2O
(reaction 12.4) and the decomposition of HOA stopped. At higher temperature
( 1673 K), HOA started to decompose to TCP. The defects in the HOA lattice and its
transformation to the TCP lattice, as well as the surfaces at the grain boundaries allow
the water to be released during the second stage of decomposition. The decomposition
of HOA ceramic material to TCP starts on the surface at the points of defects, pores
≥
69

Chapter 4/ Results and discussion
and grain boundaries. The TCP grains first coated the entire surface of the sintered
ceramic material and only then its thickness starts to grow. The time dependence of
layer thickness is described by the parabolic law. The diffusion of water toward the
surface is the rate-determining step for the thermal decomposition of HOA and TCP.
Qualitative phase analysis of HOA decomposition products and kinetic analysis
proved that the transformation of HOA to TCP proceeds by a diffusion process.
However, the diffusion mechanism of decomposition holds only for the sintered HA
ceramics. The kinetic analysis of thermal decomposition of the powdered HA showed
that the rate of thermal decomposition of the powdered HA is controlled not only by
diffusion of water, but also by formation of nuclei of the newly arising TCP phase
[96].
In this work, it has been considered that the mechanism of thermal decomposition of
the laser sintered HA samples it is not the diffusion mechanism. In order to the laser
sintering happens at lower of second, it is possible by formation of nuclei of the newly
arising TCP phase (the similar to powder). Fig. 26.4 shows the laser sintered sample
that confirms this assumption.
Fig. 26.4 showing the HA laser sintered sample at P: 18W, BS: 10 mm/s, AED: 430.2
cal/cm2.
The laser sintering process is very rapid compared to a classical furnace (around 500
°C/h) in which amorphization of secondary phases can be expected. The laser
70
Chapter 4/ Results and discussion
sintering process at the order of milliseconds at high temperatures represents a typical
thermo-kinetic. The amount of hydroxyl ion removal depends on the heating time and
the intensity of the heat source. At the high energy intensity of laser (AED: 717
cal/cm2), the dehydroxylated region forms an amorphous phase. The amorphous phase
is illustrated in Fig. 27.4a as the rise above the background. The amount of
amorphous phase in this case is found to be approximately 70 wt %. Therefore, a
more ACP will form from the melted HA as a result of the high energy density of
laser and the rapid cooling rate of the laser sintering process.
Various intrinsic factors could be responsible for the formation of the amorphous
phase. The two most important factors, which determine the glass forming abilities of
a material, are the viscosity and the increase in viscosity with decreasing temperature
[100]. The phase diagram CaO-P2O5 exhibits numerous eutectic points, one of which
lies very close to the composition of hydroxyapatite. This infers that the cooling of a
hydroxyapatite melt produces a "liquidus temperature effect" enabling the liquid to
cool to lower temperatures before solidification, and increasing the likelihood of
producing an amorphous phase. The glass formation tendency is further accentuated
by the composition and complexity of the crystal structure of hydroxyapatite.
Phosphate tetrahedra are glass formers and the large entropy of fusion, could
accentuate the glassforming ability of hydroxyapatite [101, 102].
The free energy of the hydroxyapatite formation is larger than oxyapatite, and hence,
the driving force for nucleation of hydroxyapatite is higher. The hydroxyl-depleted
area is thus more sensitive to the cooling rate and remains as an amorphous phase
under rapid cooling conditions [103, 104].
Laser sintering produces the amorphous phase, not only due to the high cooling rate
but also to the removal of hydroxyl ions, which it make difficult for forming the
crystalline phase. The hydroxide content can be controlled either by processing
parameters or, alternatively, by the powder-processing stage. Obviously, water
molecules play an important role in promoting the transformation of amorphous
apatite to HA crystalline in the experiments, here.
The DTA curve of sample (with 70 % glass) shows an exothermic peak at around 880
°C (Fig. 28.4). The exothermic process is related to crystallization of the amorphous
phase that can be proved by XRD and FTIR. Therefore, the sample is heated at 880
°C for 3h with the heating rate of 1 and 5° C. The specimen is examined by XRD after
the heat treatment.
71

Chapter 4/ Results and discussion
140
120
80
60
20
0
Inte
nsity
(cou
nts)
70.0
60.0
50.0
40.0
30.0
20.0
10.0
0.0
2-Theta (deg.)
●▲
▲
●
▲
● HA ▲α-TCP
(a)
(b)
120
140
20
70 ● 60 ●
50 ▼ 40 ▲
100
80
60
40
20
0
●
▼
● HA ▲ α-TCP ▼ β-TCP
●
100
80
60
20
0
2-Theta (deg.)
▲
●
▼
●
●
●
30
10
10 10 20
▲▲ ●
Fig. 27.4 X-ray diff
sintered at P: 30 W
treatment in air at (b)
(rate of heating of 1°
(c)
2- )Theta (deg.10.0 20.0 30.0 40.0 50.0 60.0
10.0 20.0 30.0 40.0 50.0 60.0
▲ ▲
● ●
0
10.0 15.0 20.0 25.0 30.0 35.0 40.0 45.0 50.010.0 15.0 20.0 25.0 30.0 35.0 40.0 45.0 50.0
4
60
40 40
100 100
80
10.0 15.0 20.0 25.0 30.0 35.0 40.0 45.0 50.0
10.0 15.0 20.0 25.0 30.0 35.0 40.0 45.0 50.0 0
0
2-Theraction patterns of the
, Bs: 10 mm/s, AED
3 h at 880 °C (rate of
C/min)
7
ta l
:
h
2
● HA ▲ α-TCP ▼ β-TCP
(deg.)aser sinte
717 cal/
eating of
red
cm2
5°C
HA sam
and sam
/min) an
●
ples at (a) as-laser
ples of post heat
d (c) 3 h at 880 °C

Chapter 4/ Results and discussion
Figs 27.4b, c show the amorphous phase transformation to the crystallin phase after
the heat treatment. The heat treatment of the laser sintered samples at the temperature
of 880°C has led to gradual recrystallization of apatite and tricalcium phosphate. This
appearance is a diffusion process in order to the heating rate of 1°C/min was more
effective for crystallization. The peaks become sharper and the amorphous hump
nearly disappears after the heat treatment. The data in Fig. 27.4 suggest that
crystallization is increasing while those indicate that a more transformation of the
amorphous to HA requires the heating rate of 1 °C/min. The crystallization requires
more time for diffusion of the atoms or groups into lattice sites.
The recrystallization of the amorphous phase during the heat treatment usually
consists of nucleation and growth of the nucleus. The nucleation rate and growth
velocity (u) of crystal nucleases are in proportion to the diffusion coefficient, which is
D = Doexp(-f /kT), where T, f, Do, and k represent the absolute temperature, the
activation energy for the diffusion, the diffusion constant, and Boltzman’s constant (k
= 1.38066 × 10⁻²³), respectively [105].
Also, FTIR spectra has shown in Fig. 29.4 reveals that the heat treatment enables the
samples to react with the air moisture and to incorporate hydroxyl ions into the
amorphous structure. Water molecules can be easily reacted with the amorphous
apatite and OH groups fill the lattice vacancies, which are resulted from the
dehydration of HA during laser sintering.
Regaining of OH- ions from the atmosphere can be followed via FTIR spectra, as
shown in Fig. 29.4. The OH- bands at 630 and 3572 cm-1 and the PO3- 4 peaks at 961,
1049 and 1092 cm-1 become more prominent after heat treatment at 880 °C and are
sharper for the heat treated samples with the heating rate of 1 °C/min than for those
given the heating rate of 5 °C/min.
Of curse, after laser sintering, the HA is dehydroxylated and transformed into
oxyapatite (OHA) and partly decomposed to TCP and C4P depending on the laser
sintering conditions. These crystal types and the amorphous phase of calcium
phosphate are more soluble than HA [106]. Therfore, the crystallinity of the HA
layers is thought to play an important role in determining the solubility of the HA
parts. In this study, a post heat treatment can be employed on the as-received laser-
sintered HA in order to improve the crystallinity of the samples.
73

Chapter 4/ Results and discussion
Fig. 28.4 Thermal analysis of the laser sintered HA samples at P: 30W, Bs: 10mm/s,
AED: 717 Cal/cm2.
Fig. 29.4 FTIR spectra of the laser sintered HA samples at (a) as-laser sintered at P:
30 W, BS: 10 mm/s, AED: 717 cal/cm2 and samples after the heat treatment in air at
(b) 3 h at 880 °C (the heating rate of 5 °C/min) and (c) 3 h at 880 °C (the heating rate
of 1 °C/min)
Tra
nsm
ittan
ce (a
rbitr
ary
units
) D
iffer
entia
l the
rmal
(DT
A) (
µV)
Temperature (ºC)
Wavenumber (cm-1)
74
Chapter 4/ Results and discussion
4.6 Conventional sintering of the HA layers
The layer-wise HA samples with 75 wt% solid were sintered at the temperature range
of 1000-1300 °C for 2-3 h.
4.6.1 Microstructure of the sintered HA layers
The typical density values of the sintered products are plotted in Fig. 30.4 versus the
sintering temperatures for 2 h soaking time. The increased densification observed as a
function of temperature has reached a maximum of 99.1% of theoretical density at
1300°C. Scanning electron micrographs of the polished and etched surfaces of the
sintered layers are presented in Figs. 31.4(a)-(d) indicating a uniform grain-size
distribution of 1-5 µm. A comparison of Figs. 31.4(a)-(d) reveals that some grain
growths occur by sintering at the higher temperature and higher soaking time.
Fig. 32.4 compares the pore size distribution of the conventionally sintered sample at
1300 °C (2h) with the laser sintered sample at P: 24 W, BS: 60 mm/s, AED: 95.6
cal/cm2. The laser sintered sample have the broader pore size distribution.
Fig. 30.4 Sintered density of HA layers as a function of sintering temperature.
75
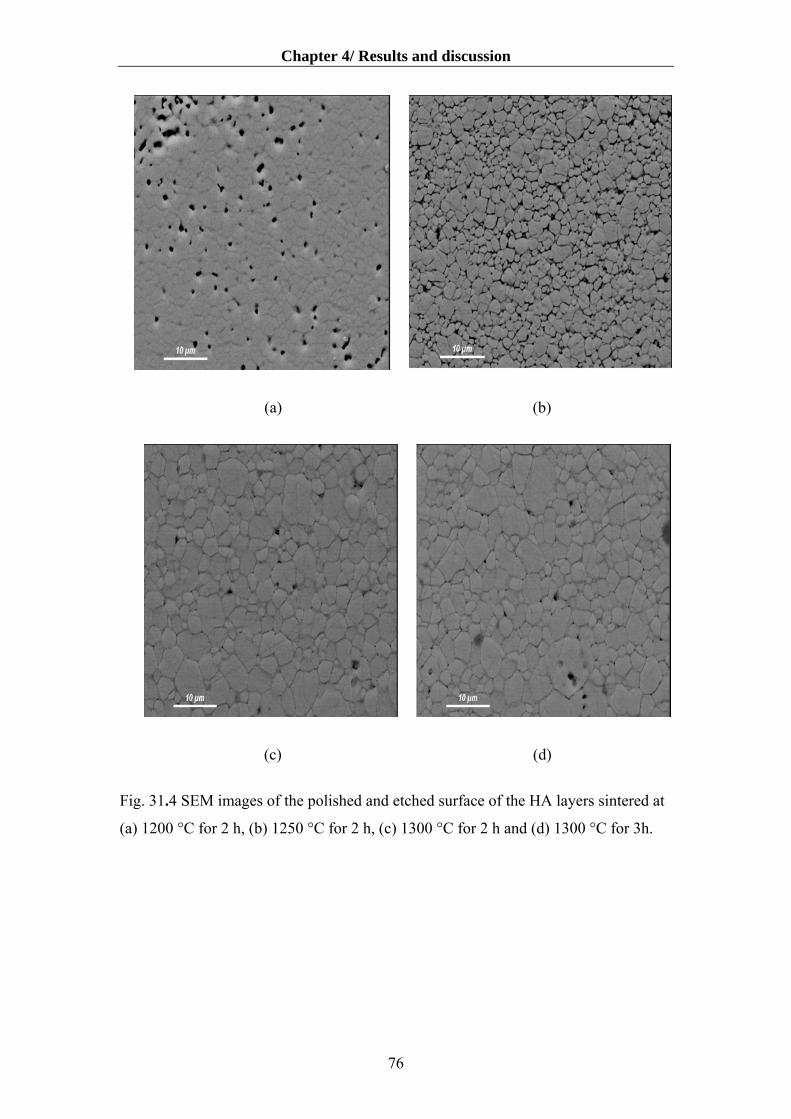
Chapter 4/ Results and discussion
(a) (b)
(c) (d)
Fig. 31.4 SEM images of the polished and etched surface of the HA layers sintered at
(a) 1200 °C for 2 h, (b) 1250 °C for 2 h, (c) 1300 °C for 2 h and (d) 1300 °C for 3h.
76

Chapter 4/ Results and discussion
Fig. 32.4 Pore size distribution for samples: (▲) conventionally sintered at 1300 °C
(2h), (●) laser sintered at P: 24 W, BS: 60 mm/s, AED: 95.6 cal/cm2.
4.6.2 Composition of the sintered HA layers
The HA sample sintered at 1300 ºC was pure single phase HA, as shown by the X-ray
diffraction presented in Fig. 33.4. The reflections of the XRD spectrum agree very
well with the as-received HA powder.
600
Inte
nsity
(Cou
nts)
Fig. 33.4 X
200 100 0
500 400 300
5.0 10.0 15.0 20.0 25.0 30.0 35.0 40.0 45.0 50.0
2-Theta (deg.)
RD pattern showing of I)HA powder II)conventionally sintered HA layers
77
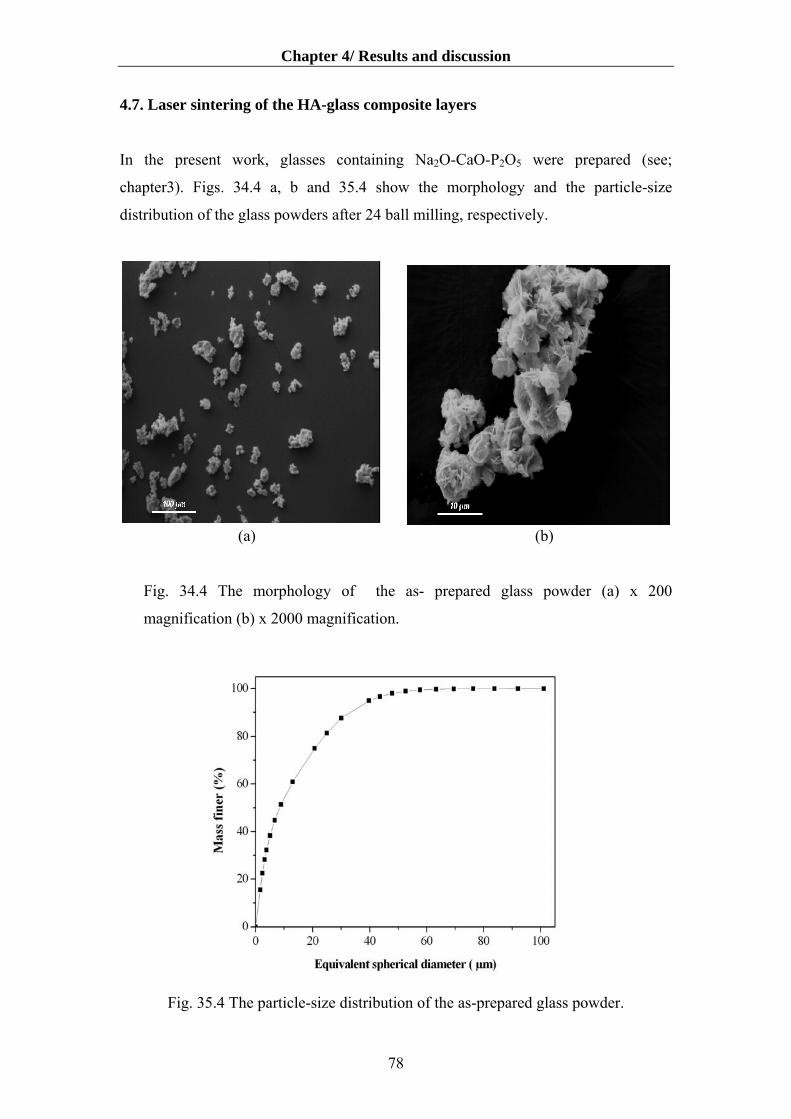
Chapter 4/ Results and discussion
4.7. Laser sintering of the HA-glass composite layers
In the present work, glasses containing Na2O-CaO-P2O5 were prepared (see;
chapter3). Figs. 34.4 a, b and 35.4 show the morphology and the particle-size
distribution of the glass powders after 24 ball milling, respectively.
(a) (b)
Fig. 34.4 The morphology of the as- prepared glass powder (a) x 200
magnification (b) x 2000 magnification.
Fig. 35.4 The particle-size distribution of the as-prepared glass powder.
78
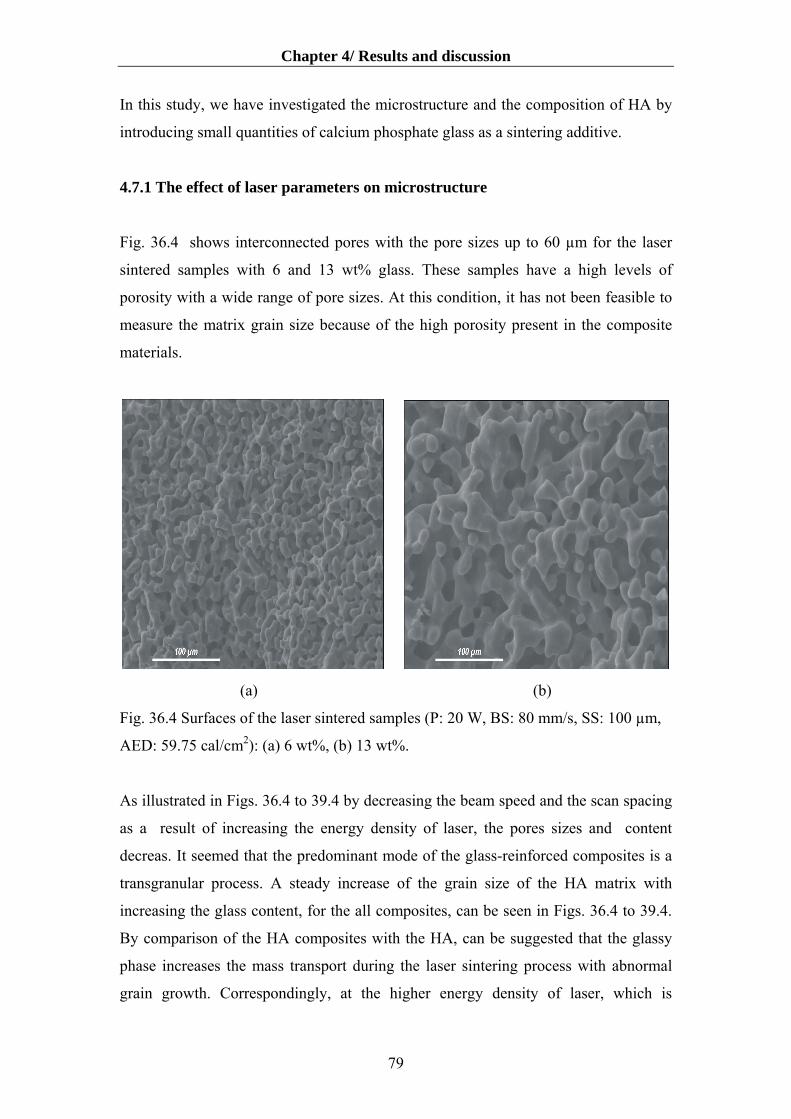
Chapter 4/ Results and discussion
In this study, we have investigated the microstructure and the composition of HA by
introducing small quantities of calcium phosphate glass as a sintering additive.
4.7.1 The effect of laser parameters on microstructure
Fig. 36.4 shows interconnected pores with the pore sizes up to 60 µm for the laser
sintered samples with 6 and 13 wt% glass. These samples have a high levels of
porosity with a wide range of pore sizes. At this condition, it has not been feasible to
measure the matrix grain size because of the high porosity present in the composite
materials.
(a) (b)
Fig. 36.4 Surfaces of the laser sintered samples (P: 20 W, BS: 80 mm/s, SS: 100 µm,
AED: 59.75 cal/cm2): (a) 6 wt%, (b) 13 wt%.
As illustrated in Figs. 36.4 to 39.4 by decreasing the beam speed and the scan spacing
as a result of increasing the energy density of laser, the pores sizes and content
decreas. It seemed that the predominant mode of the glass-reinforced composites is a
transgranular process. A steady increase of the grain size of the HA matrix with
increasing the glass content, for the all composites, can be seen in Figs. 36.4 to 39.4.
By comparison of the HA composites with the HA, can be suggested that the glassy
phase increases the mass transport during the laser sintering process with abnormal
grain growth. Correspondingly, at the higher energy density of laser, which is
79
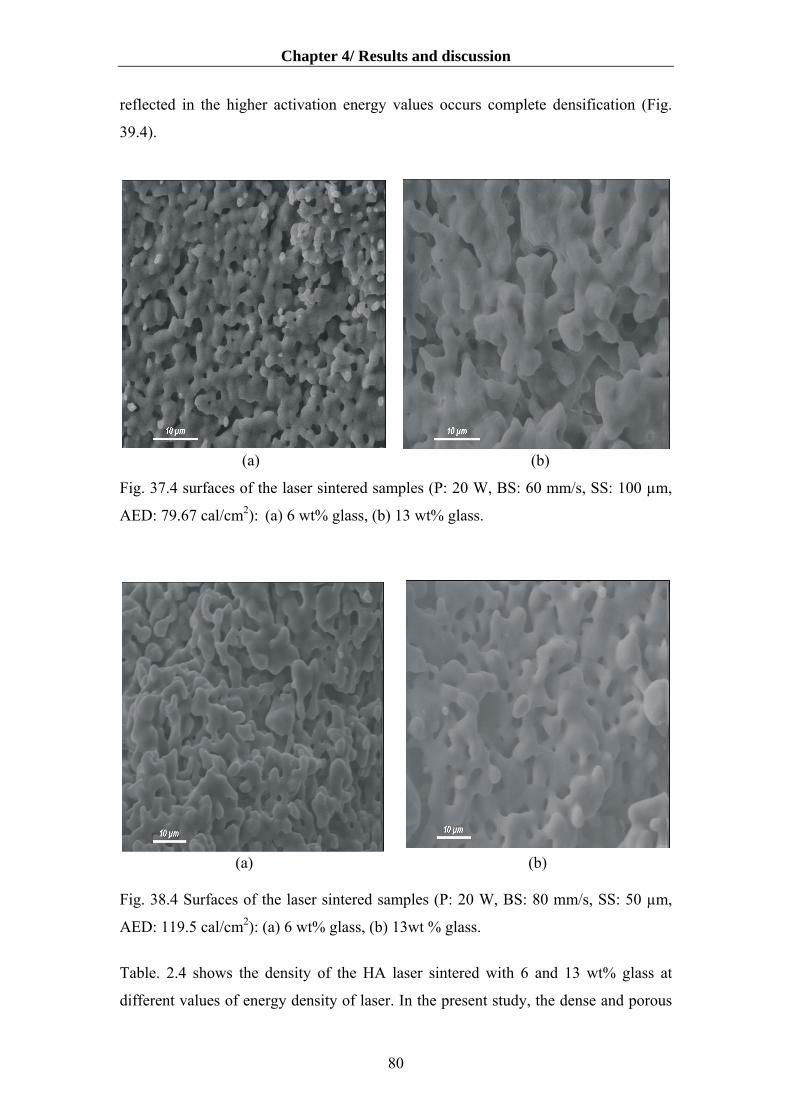
Chapter 4/ Results and discussion
reflected in the higher activation energy values occurs complete densification (Fig.
39.4).
(a) (b)
Fig. 37.4 surfaces of the laser sintered samples (P: 20 W, BS: 60 mm/s, SS: 100 µm,
AED: 79.67 cal/cm2): (a) 6 wt% glass, (b) 13 wt% glass.
(a) (b)
Fig. 38.4 Surfaces of the laser sintered samples (P: 20 W, BS: 80 mm/s, SS: 50 µm,
AED: 119.5 cal/cm2): (a) 6 wt% glass, (b) 13wt % glass.
Table. 2.4 shows the density of the HA laser sintered with 6 and 13 wt% glass at
different values of energy density of laser. In the present study, the dense and porous
80
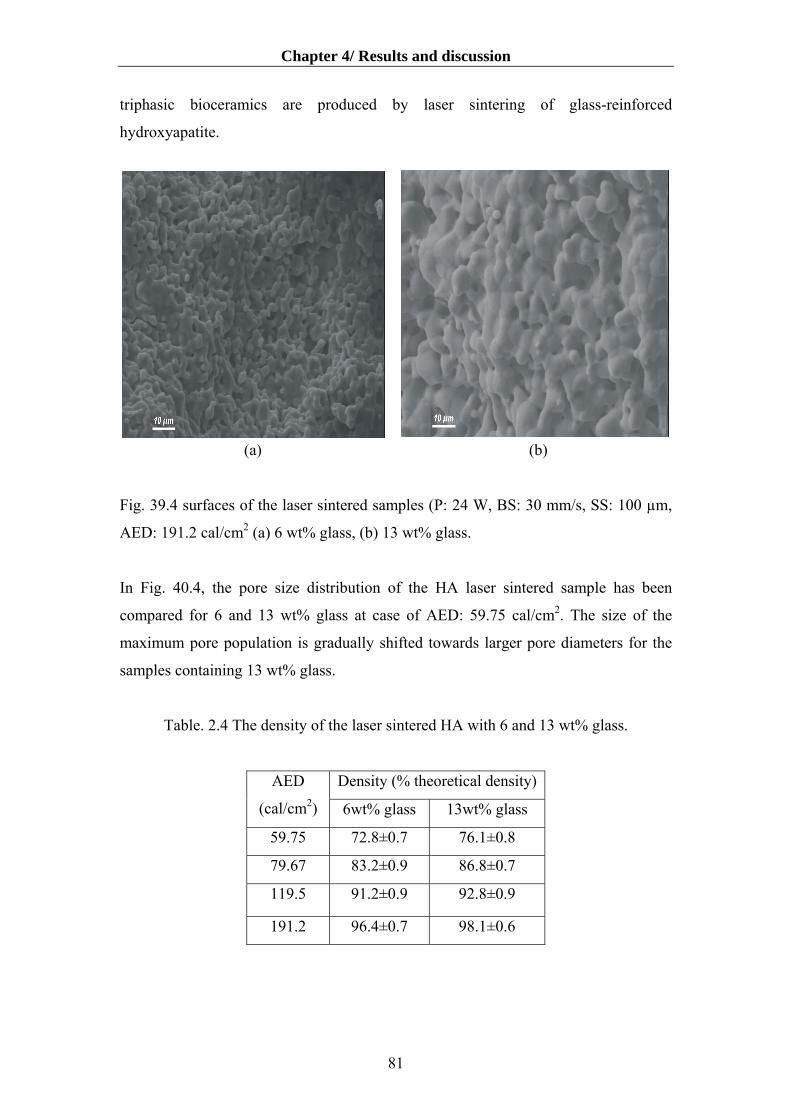
Chapter 4/ Results and discussion
triphasic bioceramics are produced by laser sintering of glass-reinforced
hydroxyapatite.
(a) (b)
Fig. 39.4 surfaces of the laser sintered samples (P: 24 W, BS: 30 mm/s, SS: 100 µm,
AED: 191.2 cal/cm2 (a) 6 wt% glass, (b) 13 wt% glass.
In Fig. 40.4, the pore size distribution of the HA laser sintered sample has been
compared for 6 and 13 wt% glass at case of AED: 59.75 cal/cm2. The size of the
maximum pore population is gradually shifted towards larger pore diameters for the
samples containing 13 wt% glass.
Table. 2.4 The density of the laser sintered HA with 6 and 13 wt% glass.
Density (% theoretical density)AED
(cal/cm2) 6wt% glass 13wt% glass
59.75 72.8±0.7 76.1±0.8
79.67 83.2±0.9 86.8±0.7
119.5 91.2±0.9 92.8±0.9
191.2 96.4±0.7 98.1±0.6
81
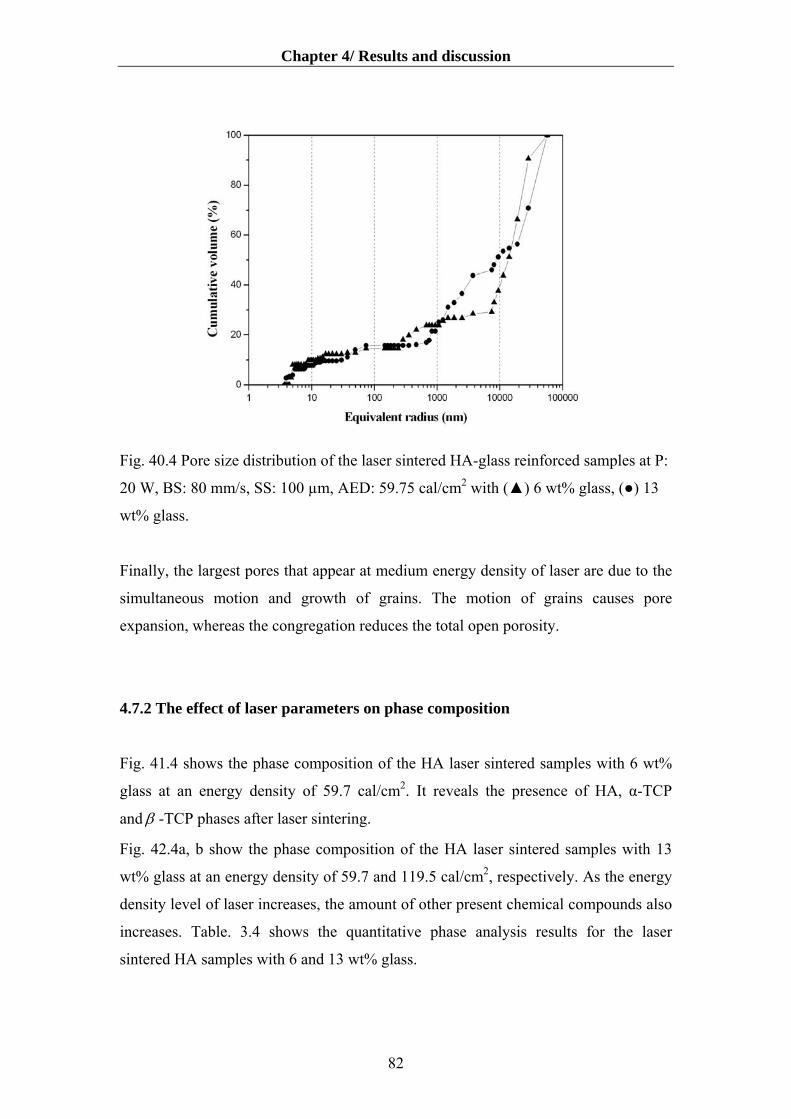
Chapter 4/ Results and discussion
Fig. 40.4 Pore size distribution of the laser sintered HA-glass reinforced samples at P:
20 W, BS: 80 mm/s, SS: 100 µm, AED: 59.75 cal/cm2 with (▲) 6 wt% glass, (●) 13
wt% glass.
Finally, the largest pores that appear at medium energy density of laser are due to the
simultaneous motion and growth of grains. The motion of grains causes pore
expansion, whereas the congregation reduces the total open porosity.
4.7.2 The effect of laser parameters on phase composition
Fig. 41.4 shows the phase composition of the HA laser sintered samples with 6 wt%
glass at an energy density of 59.7 cal/cm2. It reveals the presence of HA, α-TCP
and β -TCP phases after laser sintering.
Fig. 42.4a, b show the phase composition of the HA laser sintered samples with 13
wt% glass at an energy density of 59.7 and 119.5 cal/cm2, respectively. As the energy
density level of laser increases, the amount of other present chemical compounds also
increases. Table. 3.4 shows the quantitative phase analysis results for the laser
sintered HA samples with 6 and 13 wt% glass.
82

Chapter 4/ Results and discussion
● HA ▲ α-TCP ▼ β-TCP
●
● ▼
▼▲
▲
▲
●
Inte
nsity
(cou
nts)
2-Th
Fig. 41.4. XRD patterns of the laser-sintere
BS: 80 mm/s, SS: 100 µm, AED: 59.7cal/cm
The final microstructure consists of HA,
addition of the higher glass amount, the tr
more extensive. At high sintering temp
transformed into α -TCP.
The use of P2O5-glasses as a sintering aid h
and α -TCP phases. Furthermore, phosp
decomposition of the HA phase to β-tricalc
to further inversion of the β-TCP phase t
phase changes can be brought about by ion
that occur during liquid phase sintering in w
on the chemical nature of the glass. The gla
form secondary phases. This was proposed
composite. Some glasses may contain mine
be responsible for structural changes in th
Physical considerations must be highlighte
glasses on HA. The phosphate glasses, w
83
.
●
●
●
●●
▼▲ ●
● ●
0
eta (deg.)
d HA layers with 6 wt % gl2.
α -TCP, β -TCP and glas
ansformation of HA intoα
eratures (>1200 °C), β -TC
as caused the transformation
hate glasses are known to
ium phosphate (β-TCP) an
o α-tricalcium phosphate (
ic substitutions between the
hich the extent of substitut
ss causes breakdown of som
as a mechanism for reinfo
ral ions such as Na+ or Mg
e HA lattice during the sin
d to explain the effect of th
hen incorporated into HA,
●
0
as
s.
, β
P
o
f
d c
α-
g
ion
e
rc2+
te
e
m
2-Theta (deg.)10 0. 20.0 30.0 40.0 50 0. 60 10.0 20.0 30.0 40.0 50.0 60.
250
200
150
100
50
0
Inte
nsity
(cou
nts)
250 200 150 100 50 0
s at P: 20 W,
In fact with
-TCP is the
is partially
f HA into β
acilitate the
an also lead
TCP). These
lass and HA
can depend
of the HA to
ement of the
which could
ring process.
se phosphate
elt at lower
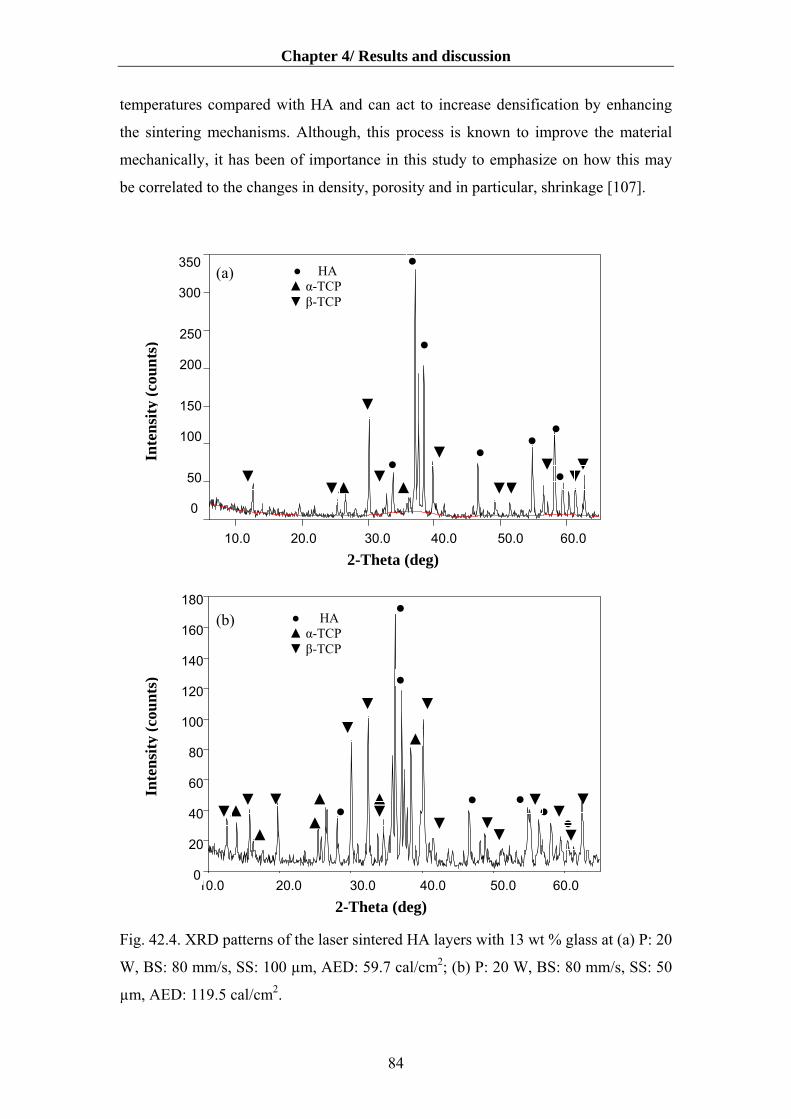
Chapter 4/ Results and discussion
temperatures compared with HA and can act to increase densification by enhancing
the sintering mechanisms. Although, this process is known to improve the material
mechanically, it has been of importance in this study to emphasize on how this may
be correlated to the changes in density, porosity and in particular, shrinkage [107].
Inte
2-Theta (de10.0 20.0 30.0
● HA ▲ α-TCP ▼ β-TCP
●
▲ ▲▼▼
▼
▼
(a)
2-Theta (
10.0 20.0 30.0
Inte
nsity
(cou
nts)
2-Theta (de10.0 20.0 30.0
▼ ▲▲
▲ ▲
▲▼
▼
▼
●
●
●● HA ▲ α-TCP ▼ β-TCP
b)
2-Theta (de 10.0 20.0 30.0 0
Inte
nsity
(cou
nts)
Fig. 42.4. XRD patterns of the laser sintered H
W, BS: 80 mm/s, SS: 100 µm, AED: 59.7 ca
µm, AED: 119.5 cal/cm2.
84
g.)
●
de
g.)4
g
▲
A
l/c
40.0 50.0
●▼
▼▼
g) 40.0 50.0
●
0.0 50.0
▼
▼▼
●▼
)40.0 50.0
●
layers with 13
m2; (b) P: 20 W
▼ ▼ ▼
60.0
60.0
▼ ▼
●▼●
▼▼
wt
, B
60 60
%
S:
●
350
300
cns
ity (
ount
s)
350
300
180
160
140
120
100
80
60
40
20
0
Inte
nsity
(cou
nts)
▼
(
180
160
140
120
100
80
60
40
20
●
250
200
250 200
150
100
150 100
50
0
50 0
●
.0.0
glass at (a) P: 20
80 mm/s, SS: 50

Chapter 4/ Results and discussion
Table. 3.4 Quantitative phase analysis results of the laser sintered glass-reinforced HA
samples.
Phase composition
(%) ± 2
Laser sintering conditions
β-
TCP
α-
TCP
HA AED(Cal/cm2)
(SS µm)
BS(mm/s)
P(W)
Composition
of sample
(wt% glass)
3 4 87 59.7 100 80 20
5 12 77 119.5 50 80 20
6
5 7 75 59.7 100 80 20
14 27 46 119.5 50 80 20
13
Georgiou et al [107] has shown that approximately at 900 °C HA starts to undergo
shrinkage but, compositions of both 2.5 and 5 wt% glass undergo shrinkage at
approximately 1000 °C. Shrinkage is governed by the rate of densification and
through reduction in porosity. It is therefore important to mention any correlation
between porosity and shrinkage and also if additional factors such as secondary
phases correlate with changes observed for shrinkage.
Both the glass-HA materials contain a fraction of β-TCP and α-TCP secondary phases
sintered at 1200 and 1300 °C. Decomposition of HA to β-TCP and subsequent
inversion to α-TCP introduces an increase in unit cell volume, which may explain
why the glass-HA materials undergo less shrinkage. A higher percentage of glass
leads to less shrinkage.
This also applies to the differences in the level of shrinkage between the glass-HA
materials with 6 and 13 wt% glass, since the glass-HA (13 wt%) contains a higher
amount of the β and α-TCP phase (that β and α-TCP have the larger unit cell volume
than HA). These differences seen in porosity level show some correlation with the
level of shrinkage. However, it seems that the presence of the secondary phases
predominate the level of shrinkage.
Figs. 43.4 a, b show the laser sintered glass-reinforced layers with 50 layers deposited
on the ceramic substrate and 3-dimensional parts, respectively. Visual inspection of
the sintered parts revealed no bubbling, delamination or cracking.
.
85

Chapter 4/ Results and discussion
(a)
(b)
Fig. 43.4. Laser sintered HA glass-reinforced layers (a) deposited on the ceramic
substrate (b) 3-dimensional parts (50 layers)
4.8 Conventional sintering of the HA-glass layers
4.8.1 Microstructure of the sintered HA-glass layers
Figs. 44.4, 45.4 show microstructure of the conventionally sintered samples with 6
and 13 wt% glass. Glass-reinforced HA composites show larger grain size than the
HA sintered at all sintering temperatures.
Lower activation energies for grain growth are observed for the composites compared
to the unreinforced hydroxyapatite, which should be attributed to the presence of a
liquid glassy phase that promotes atomic diffusion during the sintering process [107,
108].
86

Chapter 4/ Results and discussion
(a) (b)
Fig. 44.4 SEM images of the polished and etched surface of the conventionally
sintered HA composite at 1200 °C for 2 h with (a) 6 wt% glass, (b) 13 wt% glass.
(a) (b)
Fig. 45.4 SEM images of the polished and etched surface of the conventionally
sintered HA composite at 1300 °C for 2 h with (a) 6 wt% glass, (b) 13 wt% glass.
Steady increase of grain size is observed when the sintering temperature increases, for
all composites. However, in some cases, the grain boundaries could not be clearly
observed. The density data of the HA samples with 6 and 13 wt% glass are given in
Table 4.4. It can be observed that the bulk density increases with increasing amounts
of glass content. The full densification over 99.5 % of the theoretical density is
87
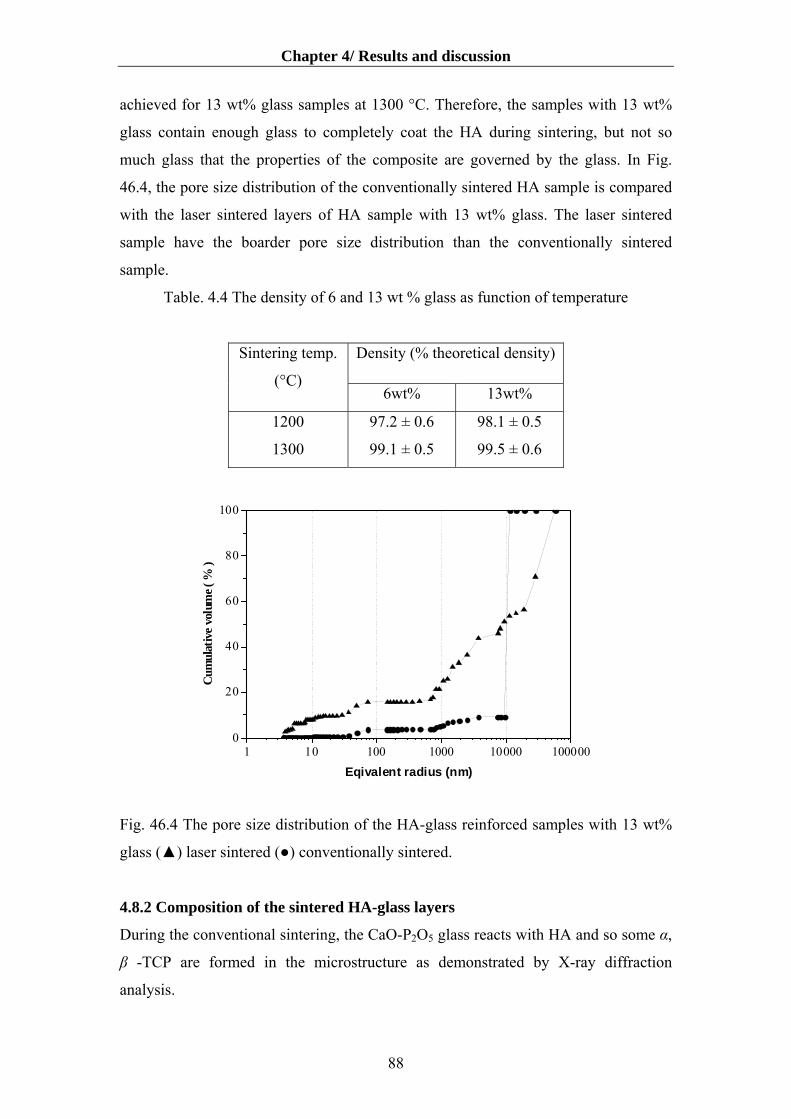
Chapter 4/ Results and discussion
achieved for 13 wt% glass samples at 1300 °C. Therefore, the samples with 13 wt%
glass contain enough glass to completely coat the HA during sintering, but not so
much glass that the properties of the composite are governed by the glass. In Fig.
46.4, the pore size distribution of the conventionally sintered HA sample is compared
with the laser sintered layers of HA sample with 13 wt% glass. The laser sintered
sample have the boarder pore size distribution than the conventionally sintered
sample.
Table. 4.4 The density of 6 and 13 wt % glass as function of temperature
Density (% theoretical density) Sintering temp.
(°C) 6wt% 13wt%
1200
1300
97.2 ± 0.6
99.1 ± 0.5
98.1 ± 0.5
99.5 ± 0.6
1 10 100 1000 10000 1000000
20
40
60
80
100
Cum
ulat
ive
volu
me (
% )
Eqivalent radius (nm)
Fig. 46.4 The pore size distribution of the HA-glass reinforced samples with 13 wt%
glass (▲) laser sintered (●) conventionally sintered.
4.8.2 Composition of the sintered HA-glass layers
During the conventional sintering, the CaO-P2O5 glass reacts with HA and so some α,
β -TCP are formed in the microstructure as demonstrated by X-ray diffraction
analysis.
88

Chapter 4/ Results and discussion
250
200
150
100
50
0
2- )Theta (deg.
●● HA ▲ α-TCP ▼ β-TCP
Innt
s)
●
▼ ● ●
▲ ▼
▼▲▲
▼▲▲ ▼● ▼ ▼
10.0 20.0 30.0 4
2-Theta (
10.0 20.0 30.0 40
Fig. 47.4 XRD pattern of the HA conventiona
glass.
0
0
0
2-Theta (deg.)10.0 20.0 30.0 4
Inte
nsity
(cou
nts)
2 2
●● HA
▲ α-TCP ▼ β-TCP
1 1
●
▲▼ ▲ ▼ ▼
▲▲▼▼
0
2-Theta (
10.0 20.0 30.0 40
Fig. 48.4 XRD pattern of the HA conventionally
Figs. 47.4, 48.4 show the phase composition o
1300 °C with 6 and 13 wt% glass, respectively.
It reveals the presence of HAP, α-TCP and
sintering. The amount of TCP depends upon the
89
▼ ● ▼
0 0.
deg.)
.0 5
lly sinter
0.0
▲▼ ●
▼
deg.)
.0 5
sintered a
f the HA
β -TCP
content o
50.0 60 0.0.0 60.0
ed a 1300 °
50.0 60.
● ▼
● ▼
0.0 60.0
1300 °C wit
conventiona
phases after
f the glass ad
●
●
C with 6 wt%
●
nsity
(cou
ntIn
tes) 250
200
tens
ity (c
ou 150
100
50
0
200
150
Inte
nsity
(cou
nts)
50
00
10
5
50
00
0
h 13wt%glass.
lly sintered at
conventional
ded to prepare

Chapter 4/ Results and discussion
the composite. In fact with addition of the higher glass amount, the transformation of
HA intoα , β -TCP is the more extensive. At high sintering temperatures (>1200
°C), β -TCP is partially transformed into α -TCP.
A possible explanation for the lower sintering temperature required for having
triphasic bioceramics when using glass powders rely on the sintering mechanism. The
glass used in these studies has a low liquidous temperature and sintering occurs with
the presence of liquid phase, which causes a better interaction between particles and
thus favors the phase transformation. This is accounted for by the promoting the effect
of the liquid phase formed in firing on the rearrangement of the crystal lattice of
hydroxyapatite and its transformation into tricalcium phosphate. Tricalcium
phosphate identified starting at 1150 °C reflects the part of hydroxyapatite that has
recrystallized with participation of the liquid phase. This is related to decomposition
caused by the addition of the glass, which is highly reactive at high temperatures and
forces major chemical changes associated with the hydroxyl site. Furthermore, ions
from the glass may take a more interstitial role, modifying the unit cell and not
allowing the expected changes that normally occur on sintering HA to take place
[107, 108].
90

Chapter 5/ Conclusion and outlook
5. Conclusion and outlook
The present study is aimed at investigating the optimization of an aqueous dispersion of HA
powder synthesized by powder pre-treatments. The project has been involved in several areas
of effort, including formulation of a low-shrinkage slurry system, development and
production of HA layers suitable for the laser sintering process. Also, this work includes the
direct laser sintering process without using a binder in the slurry and compares it with
conventional sintering of layers. All of these interrelated parameters must be controlled so
that sintering defects are prevented.
The rheological properties of the hydroxyapatite slurries has played an important role in
facilitating the layering operation. The dispersing and stability behaviour of HA powders in
aqueous media was monitored by the particle size, viscosity and zeta potential analyses as a
function of pH of the slurry and the quantity of two dispersing inorganic and organic agents.
Process feasibility and quality is dependent on the processing parameters like the solids
loading, slurry rheology, deposition rate and drying rate. Each of these can affect the
properties of ceramic layers such as thickness, surface quality, microstructure and porosity.
The current work was focused on the preparation of well-dispersed HA ceramic slurries for
layer-wise deposition. The influence of the powder calcination temperature on phase
composition, specific surface area, optimum concentration of dispersant and rheological
behaviour was studied. The calcination temperature affects on the surface area that plays an
important role in the rheological behaviour of the suspensions. The specific surface area of the
starting powder strongly influences the maximum solid loading of the suspensions, which
show complex rheological behaviour.
The most influential process parameters on microstructure and composition of the samples are
found to be the laser power, the laser beam speed and the scan spacing. The penetration depth
of the laser is increased by increasing the laser power and decreasing the beam speed. In the
LSD process, the largest slice thickness is limited by the penetration depth. When the beam
speed and the laser power vary in the range of 10 - 60 mm/s and 18 - 24 W respectively, the
maximum slice thickness achieved is 100 µm. The sintered samples has a pore size of 40 - 80
µm. After laser sintering, the presence of α-tricalcium phosphate (TCP), tetracalcium
phosphate (C4P) and amorphous calcium phosphate (ACP) are detected. The presence of these
phases depends on the laser sintering conditions. The X-ray diffraction, FTIR and SEM have
91
Chapter 5/ Conclusion and outlook
been used to investigate the influence of the laser parameters on the formation of the phases
of TCP and ACP that are beneficial for accelerated fixation and remodeling of the prothesis.
The laser sintered samples have a high porosity that the pore size of the samples could be
expressed as a function of the laser parameters and the green density of layer.
Also, this present research includes comparing of the direct laser sintering process with the
conventional sintering of layers.
This study shows tricalcium phosphate coexisting with hydroxyapatite, an amorphous phase
and perhaps oxyapatite at low energy levels of laser. The presence of tetracalcium phosphate
at higher energy levels has been proved. The crystallinity and purity of HA decreased with
increasing laser power and decreasing scan speed.
It is desirable to increase the crystallinity of the HA laser sintered parts and decrease the fast-
degraded calcium phosphates. There are two ways to increase the crystallinity of the HA
parts: varying of the laser sintering parameters and post-heat treatment. To achieve an
optimum resorbability of the material, studies can be focused on the multiphasic calcium
phosphate ceramics composed of HA and TCP and amorphous.
The results indicate that phase transformations are produced by (a) preferential removal of
hydroxyl and phosphate leading to a change in melt compositions, and (b) the high cooling
rate due to the laser sintering process. Hydroxyl group removal promotes the amorphous
phase and oxyapatite.
Hydroxyapatie has two intrinsic properties that enable it to form an amorphous phase. First, it
is made up phosphates, which are glass formers, and second, the composition of
hydroxyapatite is very close to the eutectic composition, thus inducing a liquidus effect. The
high energy interaction of the laser with the powder layer associated with the rapid heat
transfer may be sufficient to form the amorphous phase. The rapid solidification arising from
the high cooling rates in laser sintering has produced amorphous phases from crystalline
hydroxyapatite. The laser sintering produces the amorphous phase, not only due to the high
cooling rate but also to the removal of hydroxyl ions, which make it more difficult for the
crystalline phase to form. The hydroxide content can be controlled by the processing
parameters or, alternatively, by the powder-processing stage. Calcination at higher
temperatures reduces the hydroxyl content, which affects on further dehydroxylation during
laser sintering. Thus, a hydroxyl deficient feedstock material will more likely give rise to an
amorphous phase compared to a powder with high hydroxyl content.
Formation of the amorphous phase can be attributed to many factors and can be discussed
from the kinetics and thermodynamics perspectives. The free energy of formation is larger for
92

Chapter 5/ Conclusion and outlook
hydroxyapatite than oxyapatite (a completely dehydroxylated hydroxyapatite) and hence, the
driving force for nucleation of hydroxyapatite is higher. The hydroxyl-depleted area is thus
more sensitive to the cooling rate and remains as an amorphous phase under rapid cooling
conditions.
Despite these intrinsic factors and properties of the feedstock material, the laser sintering
conditions play a role in forming the amorphous phase of hydroxyapatite layers. The laser
parameters such as laser power, laser beam speed and scan spacing contribute the amount of
amorphous phase formed. The first parameter that is recognized to produce the larger level of
amorphicity is the beam speed. The longer time at the elevated temperature produces more
dehydoxylation, which influences the formation of the amorphous phase.
Laser sintering, a newly investigated technique for producing the HA bulks, has the ability to
produce both the dense and porous and both the crystalline and the amorphous bulks.
Also, in this study, the fabrication of the porous and dense glass-reinforced HA composite by
laser sintering and conventional sintering has been investigated. In the study, a phosphate
glass is successfully develpoed that can form a melting glass within milliseconds when
exposed to a continuous-wave CO2 laser of medium energy density in the glass-reinforced HA
composites. The CaO-P2O5 glasses with the addition of Na2O are used as a sintering aid of
hydroxyapatite, and thus glass-reinforced hydroxyapatite composites are obtained.
Using a laser sintering process, we successfully fabricated a porous body with a continuous
pore structure of 30-60 µm diameter. The glasses have promoted significant changes in the
microstructure of the composites, namely by the formation of tricalcium phosphate secondary
phases, β and α-TCP. The final microstructure consists of a triphasic bioceramic after the laser
sintering.
The addition level of 13 wt% glass has caused a higher transformation of HA into the
secondary β- and α-TCP phases than the 6 wt % glass ones. By increasing the energy density
of laser, the porosity of the composites has decreased faster than the sintered HA and all
composite samples showed a higher densification than HA. The densification has occurred by
liquid formation and spreading, improving the diffusion mechanism. A strong bonding is
developed between the HA and the phosphate-based glasses, which acts on the solid HA
particles reducing the interfacial energy and eliminating porosity.
Finally, the largest pores that appear at the medium energy density of laser are due to the
simultaneous motion and growth of grains. The motions of grains cause the pore expansion,
whereas the total open porosity is reduced by congregation.
93
Chapter 5/ Conclusion and outlook
In this work both the dense and highly porous structures HA and glass-reinforced
hydroxyapatite were obtained. The multi-layers up to 50 layers have also been obtained for
the HA/glass system.
This report was focused on the phase compositional and microstructural changes observed by
means of XRD, FTIR and SEM after laser sintering and the conventional sintering.
The relationship between the composition and microstructure of the porous HA and HA-glass
composite with its bioresorption needs to investigating in detail in further research. An
appropriate porosity can be coupled with bioactivity of bodies provides a growth of the bone
tissue to achieve a full integration with the living bones, that this subject is recommended for
future work.
Also, it is suggested to revolve around laser-sintered second phase-reinforced HA (such as
HA/zirconia) composite in order to evaluate the mechanical properties. Many studies have
promoted ceramic/ceramic bio-composites as a potential for implant applications. One
possibility is the reinforcement of HA with particulate zirconia. Previous researches have
shown that the addition of ZrO2 as a second phase to HA significantly increases the bonding
strength of composite material. Consequently, the addition of ZrO2 can improve the
mechanical properties of the LSD parts.
In LSD system, spot size varies as a function of axial position. The spot size is generally
increased as a function of distance from the beam waist. Therefore, effect of this parameter on
the laser sintered parts can be investigated in future work.
94
Chapter 6/ References
6. Refrences
[1] L. L. Hench, “Bioceramics,” J. Am. Ceram. Soc., 81 (1998) 1705-28.
[2] W. Suchanek and M. Yoshimura, “Processing and properties of hydroxyapatite-based
biomaterials for use as hard tissue replacement implants,” J. Mat. Res., 13 (1998) 94-117.
[3] L. L. Hench, “Bioceramics: From concept to clinic,” J. Am. Ceram. Soc., 74 (1991) 1487-
510.
[4] C. P. A. T. Klein, A. A. Driessen, K. de Groot and A. van den Hoof, “Biodegradation
behaviour of various calcium phosphate materials in bone tissue,” J. Biomed. Mater. Res., 17
(1983) 769-84.
[5] N. Ikeda, K. Kawanabe and T. Nanamura, “Quatitative composition of osteconduction of
porous Dense A-W glass-ceramic and hydroxyapatite granules (Effect of granule and pore
size),” Biomaterials., 20 (1999) 1087-95.
[6] C. Schwatz, B. Jacquemaire, P. Lecestre and P. Frayssinet, “Biphasic synthetic bone
substitute use in orthopaedic and trauma surgery: Clinical, rediological and histological
results,” J. Mater. Sci; Mater. Med., 10 (1999) 821-25.
[7] E. Caroline Victorria and F. D. Gnanam, “Synthesis and characterization of biphasic
calcium phosphate,” Trends Biomater. Artif. Organs., 16 (2002) 12-14.
[8] L. L. Hench and E. C. Ethridge, Biomaterials, An Interfacial Approach, Academic Press,
New York, 1982.
[9] S. H. Kwon, Y. K. Jun, S. H. Hong, I. S. Lee, H. E. Kim and Y. Y. Won, “Clacium
phoshate bioceramics with various proposities and dissolution rates,” J. Am. Ceram. Soc., 85
(2002) 3129-31.
[10] C. Steidle, D. Klosterman, R. Chartoff, G. Graves, N. Osborne, “Automated Fabrication
of Custom Bone Implant Using Rapid Prototyping,” 44th International SAMPE Symposium
and Exhibition , Long Beach , CA , May 1999.
[11] J. Darsell , S. Bose, L. Hosick and A. Bendyopadkyay , “From CT scan to ceramic Bone
Graft,” J. Am. Ceram. Soc., 86 (2003) 1076-80.
95
Chapter 6/ References
[12] D. L. Bourell, J. J. Beaman, H. L. Marcus, and J. W. Barlow, “Solid Freeform
Fabrication, an advanced manufacturing approach,” Proceedings of the Solid Freeform
Fabrication Symposium, The University of Texas at Austin , Austin , TX , 1990, pp 1-7.
[13] T. Krause, S. Engler, J. Günster, J. G. Heinrich, “Verfahren und Vorrichtung zur
Herstellung von keramischen Formkörpern,” EP 1 266 878 A1 (2002).
[14] J. Günster, S. Engler, J.G.Heinrich, “Forming of complex shaped ceramic products via
layer-wise slurry deposition,” Bull. Eur. Ceram. Soc., 1 (2003) 25-28.
[15] Z. Sadeghian, J. G. Heinrich and F. Moztarzadeh, “Direct laser sintering of
hydroxyapatite implants by the layer-wise slurry deposition process,” cfi / Ber. DKG 81
(2004) (E 39-E 43).
[16] C. Galassi, E. Roncari, A. Ravaglioli and R.martinetti , in “Euro-Ceramics,” edited by G.
de With, R. A. Terpstra, R. Metselaar (Elsevier Applied Science, Essex, 1989), Vol. 3, p. 43.
[17] R. G. Horn, “Surface forces and their Action in ceramic materials,” J. Am. Ceram. Soc.,
73 (1990) 1117-35.
[18] M. Persson, A. Forsgren, E. Carlstrom, L. Kall, B. Kronberg, R. Pompe and R. Carlsson
“High tech ceramics” (ed.) P. Vincenzini (Elsevier Science, Amsterdam, 1987) p. 623
[19] R. Ramachandra Rao, H. N. Roopa and T. S. Kannan, “Dispersion, slip casting and
reaction nitridation of silicon carbide mixtures,” J. Eur. Ceram. Soc., 19 (1999) 2145-2153.
[20] J. N. Israelachvili, “Intermolecular and Surface Forces,” (Academic Press, London, U.K.,
1985) pp. 288.
[21] B. Vincent, “The Stability of Solid / Liquid Dispersions in the Presence of Polymers,” In
Solid / Liquid Dispersions. Edited by Th. F. Tadros. Academic Press, London, U.K., 1987,
pp. 149-62.
[22] E. G. Nordstrom and K. H. Karlsson, “Slip-cast apatite ceramics,” Am. Ceram. Soc.
Bull., 69 (1990) 824-27.
[23] M. Toriyama, A. Ravaglioli, C. Galassi, E. Roncari and A. Piancastelli, “Slip casting of
mechanochemically synthesised hydroxyapatite,” J. Mater. Sci., 30 (199 3216-21.
[24] Z. Sadeghian, J. G. Heinrich and F. Moztarzadeh, “Dispersion of hydroxyapatite powder
in aqueous media,” J. Adv. Appl. Ceram., (accepted for publication).
[25] Z. Sadeghian, J. G. Heinrich and F. Moztarzadeh, “Preparation of highly concentrated
aqueous hydroxyapatite suspensions for slip casting,” J. Mat. Sci., (accepted for publication).
96
Chapter 6/ References
[26] Z. Sadeghian, J. G. Heinrich and F. Moztarzadeh, “Influence of powder pre-treatments
and milling on dispersion ability of aqueous hydroxyapatite-based suspensions,” J. Ceram.
Int. (accepted for publication).
[27] A. Tampieri, G. Celotti, F. Szontagh and E. Landi, “Sintering and characterization of HA
and TCP bioceramics with control of their strength and phase purity”, J. Mater. Sci., Materials
in Medicine., 8 (1997) 29 –37.
[28] S. F. Hulbert, J. C. Bokros, L. L. Hench, J. Wilson, and G. Heimke, “Ceramics in
Clinical Applications: Past, Present and Future”; pp. 189–213 in High Tech Ceramics. Edited
by P. Vincenzini. Elsevier, Amsterdam, Netherlands, 1987.
[29] A. Gebhardt: Rapid Prototyping; Werkzeuge für die schnelle Produktentwicklung; Carl
Hanser-Verlag; München, Wien (1996)
[30] J. C. Knowles, S. Talal and J. D. Santos., “Sintering effects in a glass reinforced
hydroxyapatite,” Biomaterials., 17 (1996) 1437-1442.
[31] M.R. Towler, H.K. Varma, S.M. Best, W. Bonfield, 5th World Biomaterials Congress,
Tornoto, 29th May - 2nd June, 1, 975 (1996).
[32] M. Lopes, F. Monteiro, D. Santos, “Glass-reinforced hydroxyapatite composites: fracture
toughness and hardness dependence on microstructural characteristics,” Biomaterials., 20
(1999) 2085-2090.
[33] M. Prado da Silva, A. Lemos, J. Ferreira, J. D. Santos, “Porous glass reinforced
hydroxyapatite materials produced with different organic addetives,” J. Non-Cryst. Sol., 304
(2002) 286-292.
[34] L. L. Hench, J. Wilson,. "An Introduction to Bioceramics" (1 ed., Gainesville, USA,
World Scientific)., 1 (1993) 154.
[35] C. K. Chua, K. F. Leong & C. S. Lim, Rapid Prototyping Principles and Applications,
Wohlers Associates, Inc. , Colorado, 2nd Edition, 2003.
[36] J. G. Heinrich, New developments in the solid freeform fabrication of ceramic
components. cfi / Ber. DKG., 76 (1999) 29-35.
[37] D. L. Bourell, J. J. Beaman, H. L. Marcus, J. W. Barlow, in Proc. Solid Freeform
Fabrication Symposium, Austin, TX: University of Texas Mechanical Engineering, 1990.
97

Chapter 6/ References
[38] C. Kia and L. Fia: Rapid prototyping: Principles and Applications in manufacturing. John
Wiley & sons Ltd., (1997)
[39] J. J. Beaman, J. W. Barlow, D. L.Bourell, R. H. Crawford: Solid Freeform Fabrication: A
new Direction in Manufacturing. Kluwer Academic Publishers, 1997.
[40] N. Ikawa, T. Kishinami, F. Kimura: Rapid Product Development – Proceedings of the
8th International Conference on Production Engineering (8th ICPE). Chapman & Hall, 1997.
[41] L.Lü, J. Fuh, Y.-S. Wong: Laser-Induced Materials and Processes for Rapid Prototyping.
Kluwer Academic Publishers, 2001.
[42] D. H. Napper, "Polymeric Stabilization of Colloidal Dispersions", Academic Press,
London, U.K., 1983
[43] R. J. Hunter, Foundations of Colloid Science, Vols. 1 and 2; pp. 168-224. Oxford
University Press, Oxford, U.K., 1987 and 1989.
[44] J. Blaakmeer, M. R. Bohmer, M. A. Cohen Stuart, and G. J. Fleer, "Adsorption of Weak
Polyelectrolytes on Highly Charged Surfaces: Poly (acrylic acid) on polystyrene latex with
strong cationic groups," Macromolecules., 23 (1990) 2301-309.
[45] J. Y. Walz and A. Sharma, "Effect of long-range interactions on the depletion force
between colloidal Particles," J. Colloid Interface Sci., 168 (1994) 485.
[46] L. Bergström, "Rheology of Concentrated Suspensions"; pp. 193-239 in Surface and
Colloid Chemistry in Advanced Ceramic Processing. Edited by R. J. Pugh and L. Bergström.
Marcel Dekker, New York, 1994.
[47] G. W. Scherer, "Phsics of Drying"; pp. 179-97 in Ultrastructure Processing of Advanced
Materials. Edited by D. R.Uhlmann and D. R. Ulrich. Wiley, New York, 1992.
[48] R. C. Chiu and M. J. Cima, "Drying of granular ceramic films: II, Drying stress and
saturation uniformity," J. Am. Ceram. Soc., 76 (1993) 2769-77.
[49] T.V. Thamaraiselvi and S. Rajeswari, " Evaluation of bioceramic materials - a review",
Trends Biomater. Artif. Organs., 18 (2004) 9-17.
[50] K. de Groot, Bioceramics of Calcium-Phosphate. CRC Press, Boca Raton, FL, 1983.
[51] K. de Groot, C. P. A. T. Klein, J. G. C. Wolke, and J. de Blieck-Hogervorst, ‘‘Chemistry
of Calcium Phophate Bioceramics’’; pp. 3–15 in Handbook of Bioactive Ceramics, Vol. II.
Edited by T. Yamamuro, L. L. Hench, and J. Wilson. CRC Press, Boca Raton, FL, 1990.
98
Chapter 6/ References
[52] R. Z. Legeros and J. P. Legeros, " Calcium Phosphate Bioceramics: Past, Present and
Future", Key. Engineering Materials, vol. 240-2, pp 3-10 (2003).
[53] M. Jarcho,‘‘Calcium phosphate ceramics as hard tissue prosthetics,’’ Clin. Orthop. Relat.
Res., 157 (1981) 259.
[54] L. L. Hench, ‘‘Bioceramics and the Future, Ceramics and Society,’’ Vincenzini, P., Ed.,
Faenza: Techna, 1995, pp. 101–120.
[55] A. Krajewski, A. Ravaglioli, E. Roncari, et al., ‘‘Porous ceramic bodies for drug
delivery, ’’ J. Mater. Sci.: Mater. Med., 11 (2000) 763–772.
[56] W. Paul and C. P. Sharma, ‘‘Development of porous spherical hydroxyapatite granules:
application towards protein delivery,’’ J. Mater. Sci.: Mater. Med., 10 (1999) 383–388.
[57] J. X. Lu, B. Flautre and K. Anselme, ‘‘Role of interconnections in porous bioceramics on
bone recolonization in vitro and in vivo,’’ J. Mater. Sci., Mater. Med., 10 (1999) 111–120.
[58] H.J. Monma, ‘‘Processing of synthetic hydroxyapatite,’’ J. Ceram. Soc. Jpn., Dent. Res.,
8 (1980) 97–102.
[59] V. P. Orlovskii, G. E. Sukhanova, Zh. A. Ezhova and G. V. Rodicheva, ‘‘Hydroxyapatite
bioceramics, ’’ Zh. Vses. Khim. O–va. im. D.I. Mendeleeva., 36 (1991) 683–688.
[60] V. P. Orlovskii, S. P. Ionov and R.A. Rusakova, ‘‘Hydroxyapatite phase relations in the
system CaCl2–(NH4)2HPO4–NH4OH–H2O,’’ Dokl. Akad. Nauk., 325 (1992) 522.
[61] K. Hosoi, T. Hashida, H. Takahashi et al., ‘‘New processing technique for
hydroxyapatite ceramics by the hydrothermal hot-pressing method,’’ J. Am. Ceram. Soc., 80
(1996) 2771–2774.
[62] R. Z. LeGeros, Biodegradation and bioresorption of calcium phosphate ceramics, J. Clin.
Mater., 35 (1993) 65.
[63] A. Uchida, Y. Shinto, N. Araki and K. Ono, Slow release of anticancer drugs from
porous calcium hydroxyapatite ceramic, J. Orthop. Res., 10 (1992) 440–445.
[64] A. Slosarzyk, E. Stobierska and Z. Paszkiewicz, ‘‘Porous hydroxyapatite ceramics,’’ J.
Mater. Sci. Lett., 19 (1999) 1163.
[65] K. Donath, ‘‘Relation of tissue to calcium phosphate ceramics,’’ Osseous., 1 (1991) 100.
[66] R.B. Martin, ‘‘Bone as a ceramic composite material, ’’ Mater. Sci. Forum., 7 (1999) 5–
16.
[67] A. K. Dash, and G. C. Cudworth, ‘‘Therapeutic applications of implantable drug delivery
systems,’’ J. Pharmacol. Toxicol. Methods., 1 (1998) 1–12.
[68] J. Bunrnie and T. Gilchrist, in "ceramics in surgery", edited by P. Vincencezini; Elsevier
Science Publishers, Amesterdam (1983) p. 169
99
Chapter 6/ References
[69] F. Pernot, P. Baldet and P. Rabischong, in "ceramics in surgery", edited by P.
Vincencezini; Elsevier Science Publishers, Amesterdam (1983) p. 177.
[70] R. D. Rawlings, P. S. Rogers and P. M. Stokes, in "ceramics in surgery", edited by P.
Vincencezini; Elsevier Science Publishers, Amesterdam (1987) p. 73.
[71] W. Bonfield, in "Annals of the New York Academy of Science", edited by P. Ducheyne
and J. E. C. Lemmons, 253 (1988) p. 173.
[72] J. D. Santos, J. C. Knowles, G. W. Haastinges and W. Bonfield, UK Patent No.
9213774.4, June (1993).
[73] Yi, Z. Z., Xie, Z. P., Huang, Y., J. T. and Cheng, Y. B., ‘‘Study on gelcasting and
properties of recrystallized silicon carbide,’’ Ceram. Int., 28 (2002) 369-376.
[74] Terpstra, R. A., van der Heijde, J. C. T., Swaanen, P., Zhang, X. and Gubbels, G., ‘‘Slip
Casting of Hydroxyapatite Ceramics;’’ In Proceedings of the Third European Ceramic Society
Conference, Euro-Ceramics, Vol. 3, Engineering Ceramics. Edited by P. Duran, J. F.
Fernandez and S. L. Faenza Editrice Iberica, San Vicente, Spain (1993) pp. 61-66.
[75] A. B. Corradi, T. Manfredini, G. C.Pellacani and P. Pozzi, ‘‘Deflocculation of
concentrated aqueous clay suspensions with sodium polymethacrylates,’’ J. Am. Ceram. Soc.,
77 (1994) 509-13.
[76] S. Baklouti, C. Pagnoux, T.Chartier and J. F. Baumard, ‘‘Processing of aqueous α-Al2O3,
β-SiO2, and α-SiC suspensions with polyelectrolytes,’’ J. Eur. Ceram. Soc., 17 (1997) 1387-
92.
[77] J. Faison, and R. A. Haber, ‘‘Use of polyphosphates as deflocculants of alumina,’’
Ceram. Eng. Sci. Proc., 12 (1991) 106-15.
[78] P. Somasundaran, ‘‘Zeta potential of apatite in aqueous solutions and its change during
equilibration,’’ J. Colloid Interface Sci., 27 (1968) 659-66.
[79] D. M. Liu, ‘‘Preparation and characterisation of porous hydroxyapatite bioceramic via a
slip casting route,’’ Ceram. Int., 24 (1998) 441-46.
[80] T. S. B. Narasaraju and D. E. Phebe, ‘‘Review of some physico-chemical aspects of
hydroxylapatite,’’ J. Mater. Sci., 31 (1996) 1-21.
100

Chapter 6/ References
[81] Chander and D. Fuerstenau, ‘‘Solubility and Interfacial Properties of Hydroxyapatite: A
Review,’’ In Adsorption on and Surface Chemistry of Hydroxyapatite. Edited by D. N. Misra.
Plenum Press, New York, 1984, pp. 29-49.
[82] A. Chettry, Z. Wang, J. Hsu, J. L. Fox, A. A. Baig, A. M. Barry, H. Zhuang, M. Otsuka,
and W. I. Higuchi, ‘‘Metastable equilibrium solubility distribution of carbonated apatite as a
function of solution composition,’’ J. Colloid. Int. Sci., 218 (1999) 57-67.
[83] H. M. Rootare, V. R. Deitz, and F. G. Carpenter, ‘‘Solubility product phenomena in
hydroxyapatite-water Systems,’’ J. Colloid. Sci., 17 (1962) 179-206.
[84] V. K. La Mer, ‘‘The solubility behavior of hydroxyapatite,’’ J. Phys. Chem., 66 (1962)
973-78.
[85] P. Somasundaran and Y. H. C. Wang, ‘‘Surface Chemical Characteristics and Adsorption
Properties of Apatite,’’ In Adsorption on and Surface Chemistry of Hydroxyapatite. Edited by
D. N. Misra. Plenum Press, New York, 1984, pp. 129-49.
[86] A. B. Corradi, T. Manfredini, G. C. Pellacani, and P. Pozzi, ‘‘Deflocculation of
concentrated aqueous clay suspensions with sodium polymethacrylates,’’ J. Am. Ceram. Soc.,
77 (1994) 509-13.
[87] S. Baklouti, C. Pagnoux, T. Chartier, and J. F. Baumard, ‘‘Processing of aqueous -Al2O3,
-SiO2, and -SiC suspensions with polyelectrolytes,’’ J. Eur. Ceram. Soc., 17 (1997) 1387-92.
[88] L. Bergstrom, ‘‘Rheology of Concentrated Suspensions,’’ In Surface and Colloid
Chemistry in Advanced Ceramics Processing. Edited by Pugh, R. J. and Bergstrom, L.,
Marcel Dekker, New York, 1994, pp. 193-244.
[89] T. M. Shaw, ‘‘Drying as an immiscible displacement process with fluid counter flow,’’
Phys. Rev. Lett., 59 (1987) 1671-74.
[90] G. W. Scherer, ‘‘Drying gels, VIII. Revision and review,’’ J. Non-Cryst. Solids., 109
(1991) 171-82.
[91] Nelson, J. C., “Selective laser sintering: a definition of process and an empirical sintering
model,” PhD dissertation, The University of Texas at Austin, Austin, TX, 1993.
101

Chapter 6/ References
[92] J. C. Nelson, S. Xue, J. J. Barlow, H. L. Marcus, and D. L. Bourell, “Model of the
selective laser sintering of bisphenol-A polycarbonate,” Indust. & Eng. Chem. Res., 32 (1993)
305-17.
[93] J. C. Nelson, N. K. Vail, J. W. Barlow, J. J. Beaman, D. L. Bourell, and H. L. Marcus.,
“Selective laser sintering of polymer-coated silicon carbide powders,” Indust. & Eng. Chem.
Res., 34 (1995) 1641-1651.
[94] K.A. Khor, H.Li and P.Cheang, “Effect of particle size on microstructure of high velocity
oxy-fuel(HVOF) sprayed hydroxyapatite coatings”, Key Eng. Mater. 240 (2003) 311-314.
[95] P. Ducheyne , S. Radin , L.King , “Effect of particle size on microstructure of high
velocity oxy-fuel(HVOF) sprayed Hydroxyapatite coatings”, J. Biomed. Mater. Res., 27
(1993) 25.
[96] J. Cihlar, A. Buchal, M. Trunec, “Kinetics of thermal decomposition of hydroxyapatite
bioceramics”, J. Mat. Sci., 34 (1999) 6121-6131.
[97] A. Ravaglioli and A. Krajewski, “Bioceramics” (Chapman and Hall, London, 1992),
p.57.
[98] B. Locardi, V. E. Pazzaglia, C. Gabbi and B. Profilo, “Thermal behaviour of
hydroxyapatite intended for medical applications,” Biomaterials., 14 (1993) 437-441.
[99] R. Z. Legeros and J. P. Legeros, in “An Introduction to Bioceramics,” edited by L. L.
Hench and J. Wilson (World Scientifics, Singapore, 1993), p. 139.
[100] D. R. Uhlmann, “A kinetic study of glass formation,” J. Noncryst. Solids., 7 (1972)
337-348.
[101] P. V. Riboud, “Composition and stability of apatites in the system Cao-P2O5-iron.
oxide-H2O at high temperatures,” Ann. Chim., 8 (1973) 381-390.
[102] L. D. Pye, H. J. Stevens, and W. C. La Course (eds.), “Introduction to Glass Science,”
Plenum Press, New York, 1972.
[103] E. J. Duff, “Thermodynamical considerations concerning the stability of oxyapatite,
Ca10O(PO4)6, in aqueous media,” J. Inorg. Nucl. Chem., 34 (1972) 853-857.
[104] D. Williams, “Calcium phosphate and apatites” in Concise Encyclopedia of Medical
and Dental Materias, Pergamon Press, Oxford, 1990.
[105] R. Zallen, The physics of Amorphous Solids, Wiley, New York, 1983.
[106] P. Ducheyne, S. Radin, and L. King, ‘‘The effect of calcium phosphate ceramic
composition and structure on in vivo behavior. I. Dissolution,’’ J. Biomed. Mater. Res., 27
(1993) 25–34.
102

Chapter 6/ References
[107] G. Georgiou, J. C. Knowles, “Dynamic shrinkage behaviour of hydroxyapatite and
glass-reinforced hydroxyapatites,” J. Mat. Sci., 39 (2004) 2205-2208.
[108] S. Kihara, A. Watanabe., “Calcium phosphate glass-ceramic crown prepared by lost-
wax technique,” J. Am. Ceram. Soc., 67 (1984)100.
103
Lebenslauf
Zahra Sadeghian
26. 08. 1970 geboren in Tehran/Iran als Tochter von Hasan
und seiner Ehefrau Kokab, geb. Esfahan
Staatsangehörigkeit: Iranisch
1976 - 1981 Grundschule in Tehran/Iran
1981 - 1987 Rezvan- Gymnasium in Tehran/Iran
Schulabschluss mit Abitur am 20.06.1987
1987 - 1994 Studium der Werkstofftechnik an Technischen
der Universität Science and Technology of
Abschluss des Studiums mit dem Master
Science of Materials Engineering am 1.11.1994
1994 - 1998 Wissenschaftliche Mitarbeiterin am Institut für
Material Engineering der International
University of Qazvin
1998 - 2002 Angestelle am Saipa Malleable Auto Co.
01.01. 2003 - 31.03.2005 Wissenschaftliche Mitarbeiterin am Institut für
Nichtmetallische Werkstoffe der TU Clausthal


![POLY BIS-GMA/HA BASED HYBRID COMPOSITE · PDF fileA glycidyl methacrylate/hydroxyapatite ... composite materials such as: hydroxyapatite/gelatin ... alumina [11, 12], zirconia [13],](https://img.pdfslide.tips/doc/110x75/5aaa9a207f8b9a86188e38b9/poly-bis-gmaha-based-hybrid-composite-glycidyl-methacrylatehydroxyapatite.jpg)