Embed Size (px)
Citation preview


Product Labels
Equity Schemes This product is suitable for investors who are seeking* Riskometer
Sundaram Growth Fund• Long term capital growth
• Investment in equity & equity related securities,
Sundaram Select Focus• Long term capital growth
• Investment in equity & equity related instruments of select stocks
Sundaram Select Mid Cap• Long term capital growth
• Investment in diversified stocks that are generally termed as mid-caps
Sundaram S.M.I.L.E Fund• Long term capital growth
• Investment in diversified stocks that are generally termed as small and mid-caps
Sundaram Equity Multiplier• Long term capital growth
• Investment in equity & equity related securities
Sundaram Tax Saver• Long term capital growth with 3 year lock-in period
• Investment in equity & equity related securities
Sundaram Equity Plus*• Long term capital growth
• Investment in equity & equity related instruments to the extent of 65% and in Gold-ETF up to 35%
Sundaram Balanced Fund• Long term capital growth and current income
• A judicious mix of investments in equity and fixed income securities
Sundaram Rural India Fund• Long term capital growth
• Investment in equity and equity related instruments of companies focussing on Rural India
Sundaram Select Micro Cap-Series (I-X)^• Long term capital growth
• Investment predominantly in equity/equity-related instruments of companies that can be termed as micro-caps.
Sundaram TOP 100 Series (I-V)^• Long term capital growth
• Investment in equity/equity-related instruments of companies specified as eligible securities under RGESS.
Sundaram Select Small Cap Series (II-IV)^• Long term capital growth
• Investment predominantly in equity/equity-related instruments of companies that can be termed as small-caps.
Sundaram Value Fund Series (I-II-III)^• Long term capital growth
• Investment in a well diversified portfolio of stocks
Sundaram Long Term Tax Advantage Fund (I-II)^• Capital appreciation over a period of 10 years
• Investment in equity and equity related instruments of companies along with income tax benefit
Sundaram Infrastructure Advantage Fund• Long term capital growth Investment in equity and equity related instruments of companies engaged either directly or indirectly in infrastructure- and infrastructure
related activities or expected to benefit from the growth and development of infrastructure
Sundaram Financial Services Opportunities Fund• Long term capital growth
• Investment in equity and equity related instruments of companies engaged in Banking & Financial Services
Sundaram Entertainment Opportunities Fund• Long term capital growth
• Investment in equity and equity related instruments of companies focussing on opportunities in the entertainment business
Sundaram Select Thematic Funds - PSU
Opportunities
• Long term capital growth
• Investment in equity and equity related instruments of public sector companies
Sundaram Global Advantage• Long term capital growth
• Investment in units of overseas mutual funds & ETFs
Sundaram World Brand Fund Series (I-III)^
• Long term capital growth investment predominantly in equity & equity related Instruments listed on recognized overseas stock exchanges across the world
# ‘Plus’ used in the scheme name is only in terms of asset allocation and not in terms of return/yield. ^close-ended schemes
Fixed Income Schemes This product is suitable for investors who are seeking* Riskometer
Sundaram Bond Saver• Income over medium to long term,
• regular income by investing primarily in fixed income securities
Sundaram Gilt Fund
• Long term income,
• regular income through dedicated investments in gilts consistent
with preservation of capital
Sundaram Income Plus• Income over medium to long term,
• high yields by investing in fixed income securities
Sundaram Monthly
Income Plan
(Moderate /
Conservative)
• Income over medium to long term,
• regular income through investment in fixed income securities and
long term capital appreciation by investing a portion of the assets
in equity and equity related instruments
Sundaram Flexible
Fund Flexible Income
Plan
• income over short to medium term,
• reasonable returns from a portfolio comprising substantially of
fixed income and money market instruments by keeping the interest
rate risk of the fund low
Sundaram Banking &
PSU Debt Fund
• Income over a short to medium term investment horizon,•
Investment in money market and debt securities issued by banks
and public sectorentities/undertakings
* Investors should consult their financial advisers if in doubt about whether the product is suitable for them
Fixed Income Schemes This product is suitable for investors who are seeking* Riskometer
Sundaram Select Debt
Short-Term Asset Plan
• Income over short to medium term,
• to earn regular income by investing primarily in fixed income
securities
Sundaram Flexible
Fund Short-Term Plan
• Short term income
• reasonable returns from a portfolio comprising substantially of
fixed income and money market instruments by keeping the interest
rate risk of the fund low
Sundaram Ultra Short
Term Fund
• Short term income
• liquidity through investments made primarily in money market
and debt securities
Sundaram Money Fund
• Short term income
• preservation of capital, liquidity and lower level of risk through
investments made primarily in money market and debt securities
Sundaram Monthly
Income Plan
(Aggressive)
• Income over medium to long term,
• regular income through investment in fixed income securities and
long term capital appreciation by investing a portion of the assets
in equity and equity related instruments
www.sundarammutual.com June 2016 Page 2 Sundaram Mutual FundDesigned by Morningstar

Track Record Equity FundsFund/Period NAV Per
Unit ( )Fund(%)
Benchmark(%)
AdditionalBenchmark (%)
ExcessPoints (%)
Value of 10,000 invested
Fund Bmark A.Bmark
Sundaram Global Advantage Avinash AgarwalSince Inception - 3.3 3.2 8.0 0.2 13,378 13,176 19,77930/06/2015 to 30/06/2016 13.4 -6.1 -9.1 -1.0 2.930/06/2014 to 30/06/2015 14.3 -7.7 -2.0 10.0 -5.730/06/2013 to 30/06/2014 15.5 12.3 13.1 30.3 -0.8
Sundaram Tax Saver* S Krishnakumar & Madanagopal Ramu (w.e.f. Apr 01, 2015)Since Inception - 17.9 12.3 11.4 5.6 1,54,702 68,799 60,26430/06/2015 to 30/06/2016 77.6 5.3 0.4 -1.0 4.930/06/2014 to 30/06/2015 73.7 20.8 12.0 10.0 8.830/06/2013 to 30/06/2014 61.0 35.6 34.5 30.3 1.1
Sundaram Rural India Fund* S Krishnakumar & Avinash Agarwal (w.e.f. Jan 01, 2016)Since Inception - 11.7 8.3 8.4 3.5 30,814 22,373 22,70630/06/2015 to 30/06/2016 30.8 20.3 1.2 -1.0 19.130/06/2014 to 30/06/2015 25.6 19.9 11.4 10.0 8.530/06/2013 to 30/06/2014 21.4 38.7 36.7 30.3 2.0
Sundaram Select Micro Cap Series I* S Krishnakumar & Avinash Agarwal (w.e.f. Apr 01, 2015)Since Inception - 46.7 26.7 12.3 20.0 25,965 18,009 13,34330/06/2015 to 30/06/2016 26.0 4.6 6.5 -1.0 -1.930/06/2014 to 30/06/2015 24.8 45.4 8.6 10.0 36.9
Sundaram Select Micro Cap Series II*Since Inception - 48.1 29.8 13.2 18.3 25,904 18,809 13,50730/06/2015 to 30/06/2016 25.9 4.9 6.5 -1.0 -1.730/06/2014 to 30/06/2015 24.7 45.0 8.6 10.0 36.5
Sundaram Select Micro Cap Series III*Since Inception - 48.2 30.5 14.0 17.7 25,388 18,790 13,64630/06/2015 to 30/06/2016 25.4 4.7 6.5 -1.0 -1.930/06/2014 to 30/06/2015 24.3 45.4 8.6 10.0 36.8
Sundaram Select Micro Cap Series IV*Since Inception - 46.4 28.1 11.0 18.3 24,101 17,707 12,72730/06/2015 to 30/06/2016 24.1 4.8 6.5 -1.0 -1.830/06/2014 to 30/06/2015 23.0 46.9 8.6 10.0 38.3
Sundaram Select Micro Cap Series V*Since Inception - 24.5 7.2 1.8 17.4 14,942 11,350 10,32430/06/2015 to 30/06/2016 14.9 13.3 6.5 -1.0 6.8
Sundaram Select Micro Cap Series VI*Since Inception - 17.2 6.1 2.4 11.1 13,198 11,090 10,43130/06/2015 to 30/06/2016 13.2 13.3 6.5 -1.0 6.8
Sundaram Select Micro Cap Series VII*Since Inception - 17.2 4.7 -0.3 12.5 13,023 10,796 9,95930/06/2015 to 30/06/2016 13.0 12.9 6.5 -1.0 6.4
Sundaram S.M.I.L.E Fund S KrishnakumarSince Inception - 19.1 10.7 12.9 8.4 73,000 31,873 39,65530/06/2015 to 30/06/2016 73.0 7.3 6.5 -1.0 0.830/06/2014 to 30/06/2015 68.0 33.4 8.6 10.0 24.930/06/2013 to 30/06/2014 51.0 91.3 80.8 30.3 10.5
Sundaram Select Mid CapSince Inception - 29.6 19.6 16.7 10.0 3,68,803 1,20,974 86,27230/06/2015 to 30/06/2016 368.8 9.1 9.7 -1.0 -0.630/06/2014 to 30/06/2015 338.1 30.0 13.9 10.0 16.130/06/2013 to 30/06/2014 260.1 66.8 57.3 30.3 9.6
Sundaram Entertainment Opportunities* Shiv Chanani & Avinash Agarwal (w.e.f. Apr 01, 2015)Since Inception - 9.7 5.4 7.7 4.3 21,088 15,249 18,12530/06/2015 to 30/06/2016 21.1 14.2 17.7 -1.0 -3.430/06/2014 to 30/06/2015 18.5 7.1 5.7 10.0 1.430/06/2013 to 30/06/2014 17.2 37.9 27.9 30.3 10.0
Sundaram PSU Opportunities*Since Inception - 2.4 -5.7 7.3 8.0 11,619 6,848 15,78830/06/2015 to 30/06/2016 11.6 -1.9 -12.0 -1.0 10.230/06/2014 to 30/06/2015 11.8 0.5 -11.5 10.0 12.030/06/2013 to 30/06/2014 11.8 37.1 40.1 30.3 -3.0
www.sundarammutual.com June 2016 Page 3 Sundaram Mutual FundDesigned by Morningstar

Track Record Equity FundsFund/Period NAV Per
Unit ( )Fund(%)
Benchmark(%)
AdditionalBenchmark (%)
ExcessPoints (%)
Value of 10,000 invested
Fund Bmark A.Bmark
Sundaram Balanced Fund Shiv ChananiSince Inception - 12.5 - 11.4 - 66,142 - 56,29530/06/2015 to 30/06/2016 67.1 5.0 3.1 -1.0 1.930/06/2014 to 30/06/2015 63.9 6.5 10.6 10.0 -4.130/06/2013 to 30/06/2014 60.0 24.7 21.0 30.3 3.7
Sundaram Equity MultiplierSince Inception - 9.4 8.6 8.4 0.8 23,098 21,654 21,28430/06/2015 to 30/06/2016 23.1 1.5 1.2 -1.0 0.330/06/2014 to 30/06/2015 22.8 18.6 11.7 10.0 6.930/06/2013 to 30/06/2014 19.2 47.8 36.9 30.3 10.9
Sundaram Equity PlusSince Inception - 6.2 7.9 8.8 -1.8 13,561 14,767 15,36230/06/2015 to 30/06/2016 13.6 2.1 3.9 -1.0 -1.930/06/2014 to 30/06/2015 13.3 5.2 4.7 10.0 0.530/06/2013 to 30/06/2014 12.6 19.4 22.5 30.3 -3.1
Sundaram Financial Services OpportunitiesSince Inception - 14.1 15.0 8.0 -0.9 29,015 30,847 18,62530/06/2015 to 30/06/2016 29.0 1.3 -2.0 -1.0 3.330/06/2014 to 30/06/2015 28.6 19.5 20.0 10.0 -0.630/06/2013 to 30/06/2014 24.0 28.6 31.2 30.3 -2.6
Sundaram Growth FundSince Inception - 15.6 11.3 11.3 4.4 1,62,622 77,659 77,65930/06/2015 to 30/06/2016 112.8 -7.7 -1.0 -1.0 -6.830/06/2014 to 30/06/2015 122.3 3.6 10.0 10.0 -6.330/06/2013 to 30/06/2014 118.0 33.4 30.3 30.3 3.1
Sundaram Select FocusSince Inception - 19.8 16.7 16.7 3.1 1,23,715 86,272 86,27230/06/2015 to 30/06/2016 123.7 -2.1 -1.0 -1.0 -1.130/06/2014 to 30/06/2015 126.3 9.1 10.0 10.0 -0.830/06/2013 to 30/06/2014 115.8 35.4 30.3 30.3 5.1Common for all the performance related information: Past performance may or may not be sustained in future. Performance information is as of June 30, 2016. Returns are computed on a compounded annual basis for period morethan one year & on an absolute basis for one-year period using NAV of the Regular Plan (Growth Option). Value of 10000/- invested at inception is as on June 30, 2016. For Product Labels, please refer Page 2. Disclosures: Page 39.
*Jointly managed
www.sundarammutual.com June 2016 Page 4 Sundaram Mutual FundDesigned by Morningstar

Market Outlook - Equity
June witnessed the Sensex grow 1.2% to 27,000. The month was broadly dominated by
events around the ‘Brexit’ referendum that resulted in a ‘leave’ vote, taking the markets by
surprise. India continued to tag global markets, however with much reduced magnitude. On
the domestic front, India eased FDI norms in seven sectors and approved the pay commission
recommendations on the pay and pensions. The Indian markets saw a net outflow of $(0.2)bn.
in June. The rupee saw a depreciation of 0.4% to 67.5, as the dollar saw strengthening of
0.3% during the month.
Global
Global equity markets saw significant volatility in both equity and currency, broadly around the
Brexit referendum. While the first half of the month saw weak labour prints in the US, a pause
from the Federal Reserve (Fed.), inaction from the Bank of Japan (BoJ) and a Naira devaluation;
the ‘Brexit’ run-up was the dominant theme right through. The referendum result to ‘leave’
came as a rude shock to the market that was toying with a ‘remain’ vote; as indicated by the
betting markets. Equity markets fell with the pound seeing a sharp drop. The Euro also fell,
but by a lesser degree as the markets hastily extrapolated the ‘Brexit’ vote to translate quickly
enough into the start of Euro disintegration. Debt, gold and safe haven currencies saw quick
strength. The British Prime Minister resigned, placing the burden of triggering the Article 50
to his successor. This led to a state of political chaos in the UK that still continues. Triggering
the Article 50 is a required move to initiate UK’s exiting the EU. With no clear political direction,
initiating this move appears a bit postponed. In all this, the markets appear to have course-
corrected by covering up most of its losses by the end of the month. While the uncertainty
around the ‘Brexit’ remains, the market rally appears to have been broadly on policy signals
and part procrastination. Nevertheless, we continue to notice the markets shrugging off Yuan
moves that have seen a 3% depreciation in Q1 and hope to read this as part maturity.
Central banks
Fed. language remained completely unchanged with some acknowledgement of uncertainty
around the ‘Brexit’ referendum vote. The BoJ continued to disappoint the markets giving
increased impetus to a Yen appreciation. The RBI stood on hold on inflationary concerns. These
events were all before the referendum result. After the ‘leave’ vote and the market volatility
that followed, the Bank of England (BoE) was quick to announce GBP250 bn. in funds through
market operations to calm the markets. This is 2/3rd the QE the BoE has conducted so far.
The European Central bank (ECB) followed with an announcement to provide liquidity support
to the markets and the Fed. announced that it was prepared to provide the required dollar
liquidity to central banks. All large central banks appear to be hinting at more easing. At this
juncture of continued concerns on global growth as well, it appears a bit difficult to think of a
Fed. contemplating rate hikes.
The monetary space broadly saw 10 holds (US, Eurozone, UK, Poland, Australia, New Zealand,
Japan, Brazil, Thailand and India), two hikes (Mexico, Columbia) and one cut (South Korea).
Domestic
The month of June was filled with government announcements with the NDA seeing a marginal
increase in tally within the Rajya Sabha. The 7th pay commission recommendations on pay
and pensions were approved with a plan for disbursements in the current fiscal. Added to this,
FDI announcements were made in seven key sectors with a 100% in defence and local airlines.
Furthermore, the government reduced the prices of essential drugs and the CCEA approved
Rs.6,000 crore road projects in three states. Though the monsoon progress was a bit below
expectations, majority of the subdivisions have seen excess/normal rainfall. The macro front
was however muted with continued weakness in industrial production and a pickup in
wholesale and retail inflation on the back of a rise in food inflation. The monetary space saw
the RBI hold on inflationary pressures and also witnessed Mr.Rajan’s decision to return to
academia with his term as governor coming to an end.
Flows
Emerging market continued to see outflows in June, a tad lower than May. Asia-ex-Japan
continued to see a pickup in outflows, while EM ETFs saw a drop in the pace of outflows.
Developed market outflows continue with slightly more European outflows than US. Japan
appears to have seen a marginal inflow from the last month’s marginal outflow. Indian equity
markets saw an inflow of $0.8bn. and an outflow of $1bn. in debt.
Outlook
RBI continues to be supportive of growth and its move towards neutral liquidity was a positive
shift to a more stable and market linked policy rate. The Government’s commitment to spur
the infrastructure investment cycle is already reflecting in improved order books of many
players. The current budget has clearly targeted the weak rural economy and farm sector in
a bid to broad base growth. The stress in the banking system too has been addressed with
recognition, provision of bad loans and subsequent capitalisation commitments. The Govt. has
been laying the foundations for the road to sustainable growth through broader reforms &
efficient administration. Many growth indicators are turning positive and provide comfort on
the recovery. We have already entered the next business cycle and the soft commodity prices,
especially oil, is visibly translating into fiscal comfort and improved business confidence on
margins. While one maybe concerned about the soft earnings growth seen, the recent
quarterly results have seen a higher share of beats indicating better outlook.
Softer inflation and better growth will gradually lead to a shift in the saving pattern of Indian
households from physical to financial with a sharp bias towards equity. Mutual funds are well
positioned to absorb this incremental shift. Corporate earnings are set to enter a positive
growth trajectory driven by the domestic recovery. Our funds are very well positioned to reap
these benefits.
India stands taller, with the twin deficits well contained, inflation well under control, bottomed
out growth, a relatively stable currency and an extremely strong political mandate. Every bull
market is interspersed with both time and value corrections while reasons could be varied.
Every point of volatility would be an opportunity to buy India. The recent correction in the
markets underlines the same. With every turn of the markets, the India-differentiation story
gathers more interest, momentum and conviction in that order. This would get louder in the
coming quarters and a stable rupee would give comfort to the inflows. We continue to remain
positive on our equity markets with a medium to long term outlook.
www.sundarammutual.com June 2016 Page 5 Sundaram Mutual FundDesigned by Morningstar

Market Outlook - Fixed IncomeDebt markets The market observed two key events during the month, first was the unexpectedannouncement by RBI Governor Raghuram Rajan that he won’t accept a second term as RBIgovernor and the second was the news of BREXIT (UK decided to leave EU) which resultedin volatility in global markets and a bit of that was also felt in domestic markets. Howevermarket recovered sooner than expected. The 10 year G-sec yield traded in the range of 7.44% -7.53% during the month. This was alsosupported by the easy liquidity in the system which kept the spread between money marketyields and overnight rates low. Further market is taking comfort from RBI commitment onliquidity which is reflected in yields of longer tenure bonds which rallied more than benchmarkgovernment bond. Liquidity improved significantly yet remained in negative zone in month of June with averagearound INR 420 bn vs INR 1000 bn (Rev Repo, Repo, MSF and SLF). RBI conducted OMO ofINR 250 bn in month of June as it has changed liquidity stance from tight liquidity to neutralliquidity. Liquidity turned into positive zone in first week of June. This has led to fall in shortterm rates and lack of issuance has favoured the same too. Domestic Macro Factors Industrial production (IIP) declined by 0.80% in April vs. 0.3% y-o-y in March (revised up from0.1% YoY). This was lower than market expectation of rise of 0.6%. This contraction in IIP wasdue to decline in capital goods and consumer non-durables. However consumer durablescontinue to pick-up for the third consecutive month. In terms of use-based classification,capital goods production contracted by 24.9% against decline of 15.3% in March 2016. Basicgoods production increased by 4.8% in April vs 4.4% in March 2016. Manufacturing outputdeclined by 3.1% vs. decline of 1% in March 2016; mining growth accelerated to 1.4% vs0.3% in March. Electricity growth continues to improve and printed at 14.60% compare to11.8% in March. The recent trend in IIP indicate towards uneven growth recovery being led by a pickup indiscretionary consumption as visible in increased demand in consumer durables, increasingFDI and public capex whereas weak external demand conditions and weak growth in privatesector capex could be a constraint for recovery in growth. We expect that increasedgovernment spending on Infrastructure and government’s efforts to debottleneck investmentand policy reforms industrial production will improve in coming months. India’s external trade deficit increased to USD $ 6.3 bn from $ 4.8 bn in April. This was higherthan the market consensus of $6.0bn. This increase was due to higher imports led by capitalgoods, electronic goods, oil and artificial resins, and plastic materials. Gold imports alsoexpanded rising to US$1.5bn in May vs. US$1.2bn in April. Overall total imports declined by13.2% y-o-y in May compared to 23.1% y-o-y in April. Core imports (ex-oil, ex-gold) contractedby 2.3% y-o-y vs. a 17.4% in April. Oil imports decreased due to moderation in oil prices andconsumption and printed at 30.5% vs decline of 24.0% in April. Exports continue to contract
for the 18th consecutive month, the fall has moderated to -0.8% in May-16 vs. -6.7% in April-16. INR depreciated by 0.39% in June and closed at 67.53/$ from 67.26/$ in May. India’s forexreserves were close to at $360.80 bn in the week ending June 24, 2016. Inflation Headline CPI inflation accelerated to 5.76 % y-o-y in April from 5.47% in April (revised upwardsfrom 5.39% reported earlier). This was also higher than market expectation of 5.60%. Thisacceleration in headline CPI inflation was due to higher food prices. Food inflation acceleratedto 7.6% in May from 6.4% (revised upwards from 6.3% earlier) in April and core CPI (ex food& fuel) inflation decreased to 4.5% from 4.7% in April. Core CPI (ex food & fuel) after removingtransportation from miscellaneous category remained steady at 5.2% in May. WPI inflation accelerated to 0.79% from 0.34% in April, this was also higher than marketexpectation of 0.50%. This uptick was mainly due to higher-than-expected rise in globalcommodity prices including fuel. The March 2016 inflation also got revised upwards to-0.45%YoY from -0.85% reported earlier. Food inflation accelerated to 7.4% in May from 5.5%in April. The non-food, non-global commodity prices increased to 1.8% YoY in May from 2.0%YoY in April. We expect that in the coming months WPI will remain in positive zone. However the pace of
increase is expected to remain muted. The emerging trends in food prices and globalcommodity prices will be the key data to watch for in the next few months. Rainfall in the Jun-Sep period will have an important bearing on actual food price trend over the medium term.A normal monsoon should lead to benign food prices. However monsoon is not the only factordetermining food prices as minimum support prices and rural wage growth also have significantbearing on it. Outlook Post Brexit the U.K would have a two-year time frame to negotiate a new treaty that wouldreplace the existing one. The GBP has witnessed significant depreciation in run up to Brexitand is expected to further depreciate as uncertainty will continue over the actual agreementUK would be able to negotiate. The Euro would also see weakness, but relatively lessercompared to the GBP. The Bank of England (BoE) has already committed to provide GBP 250 bn in funds to supportthe markets as a backstop facility. The rates are already at a low of 0.5% and BoE may notwant to take rates to the negative trajectory in the near term. Largely global markets have recovered, there is no contagion effect as the markets expectthat Central banks around the world would infuse liquidity, ease rates or support marketsthrough QE like operations. However there is a real risk that the UK referendum will result inmore such referendum demands in the Eurozone member countries. FOMC held rates steady in its June meeting keeping their near term forecast of two rate hikesof FY 2016 unchanged. However for 2017-18 they have reduced forecast to three hikes a yearfrom four hikes projected earlier. Fed Chair shared her view that committee has grown moreuncertain in light with global developments( including fallout of Brexit ) about the neutralrate . Indian macros are relatively stronger than other emerging market economies and this isconfirmed by market reaction to Brexit, so far. Going ahead on domestic front inflation will be the key data to watch out for. Inflation isexpected to hover around 5%-6% in coming months which is the upper bound of the newmonetary policy framework .However any sharp uptick in food prices or global commodity
prices along with award of 7th Pay commission can impact CPI in coming quarters. The directimpact of this revision will be lesser than expected as government withheld the increase inHRA recommended by the commission. The indirect impact however will be observed with alag in coming months. Rainfall trend has improved significantly with cumulative rainfall deficit narrowing to 6% as ofJuly 3 vs. a deficit of 15% last week. Spatial distribution has also improved as 82% of thecropped area received normal or above-normal rainfall. This will be critical for food inflation.RBI will be looking at the headline number after taking out these transient components fromthe Index. On Liquidity and FX rates, we expect, going ahead the management of FCNR B maturities willbe crucial for domestic markets. FCNR B deposits of over USD 26 bn are having maturitiesbetween Sep-Nov 2016 and a larger part of those may not get rolled over putting pressureon INR, interest rates and bank deposit base. We believe that RBI is done with the rate cut cycle for now and if inflation surprises on thedownside a further room for 25 to 50 basis points can come up but now RBI is likely to focuson transmission of rates with inducing liquidity to the extent that it becomes neutral. This canresult in lower money market rates and lower bond yields over the coming quarters despiteno rate cuts. It will be interesting to see how change of guard at RBI and operationalization of MonetaryPolicy Committee in coming months affects the conduct of Monetary policy and decisionmaking. Focus Fixed Income Funds Focus on 6 month to 12 month bucket for accrual products. Funds we can look in order of riskreturn appetite are Ultra short term Fund, Income Plus and Flexible Short Term Fund. SelectDebt Short term fund looks good for scaling up as pure accrual money fund will start aligningitself near repo rate + 30 to 50 basis points. In medium term funds PSU Debt fund and Flexible Fund Flexible Income look good while alreadyinvested investors in Long term Income and GILT should start switching into medium and shortterm funds as the long bond yields move lower.
www.sundarammutual.com June 2016 Page 6 Sundaram Mutual FundDesigned by Morningstar
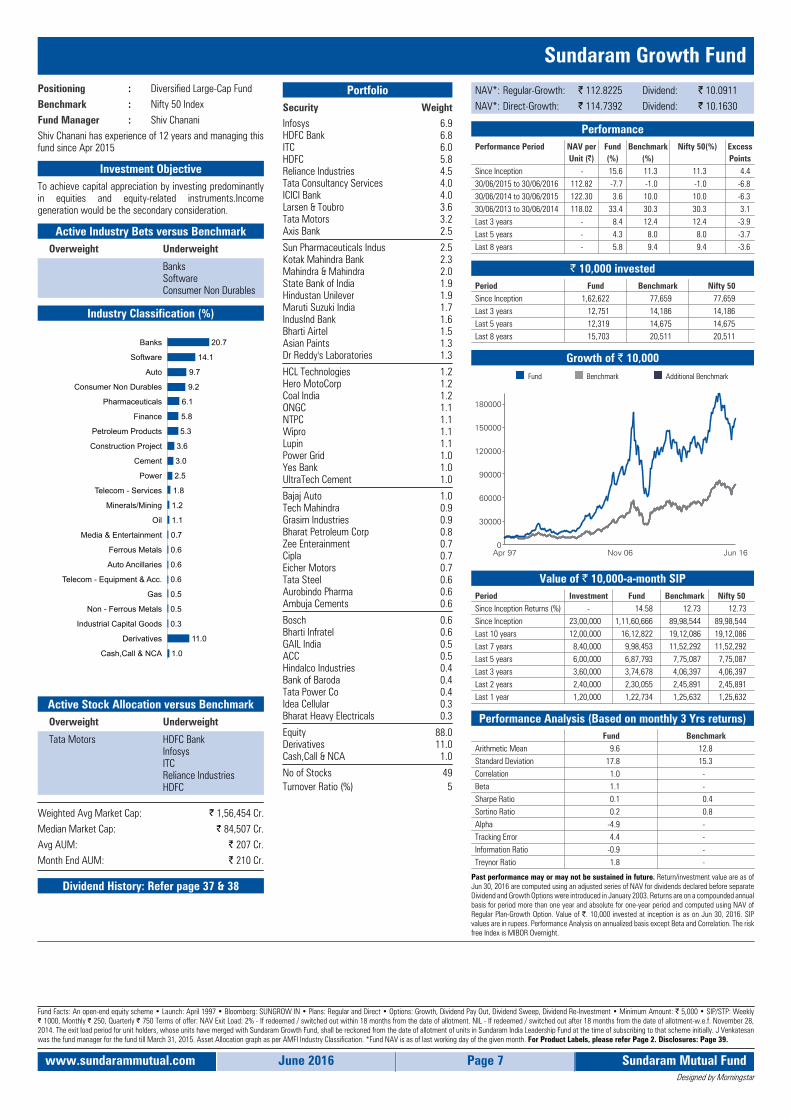
Sundaram Growth FundPositioning : Diversified Large-Cap FundBenchmark : Nifty 50 IndexFund Manager : Shiv ChananiShiv Chanani has experience of 12 years and managing thisfund since Apr 2015
Investment ObjectiveTo achieve capital appreciation by investing predominantlyin equities and equity-related instruments.Incomegeneration would be the secondary consideration.
Active Industry Bets versus BenchmarkOverweight Underweight
BanksSoftwareConsumer Non Durables
Industry Classification (%)
1.0
11.0
0.3
0.5
0.5
0.6
0.6
0.6
0.7
1.1
1.2
1.8
2.5
3.0
3.6
5.3
5.8
6.1
9.2
9.7
14.1
20.7
0 7 14 21 28 35 42
Cash,Call & NCA
Derivatives
Industrial Capital Goods
Non - Ferrous Metals
Gas
Telecom - Equipment & Acc.
Auto Ancillaries
Ferrous Metals
Media & Entertainment
Oil
Minerals/Mining
Telecom - Services
Power
Cement
Construction Project
Petroleum Products
Finance
Pharmaceuticals
Consumer Non Durables
Auto
Software
Banks
Active Stock Allocation versus BenchmarkOverweight Underweight
Tata Motors HDFC BankInfosysITCReliance IndustriesHDFC
Weighted Avg Market Cap: 1,56,454 Cr.Median Market Cap: 84,507 Cr.Avg AUM: 207 Cr.Month End AUM: 210 Cr.
Dividend History: Refer page 37 & 38
PortfolioSecurity WeightInfosys 6.9HDFC Bank 6.8ITC 6.0HDFC 5.8Reliance Industries 4.5Tata Consultancy Services 4.0ICICI Bank 4.0Larsen & Toubro 3.6Tata Motors 3.2Axis Bank 2.5
Sun Pharmaceuticals Indus 2.5Kotak Mahindra Bank 2.3Mahindra & Mahindra 2.0State Bank of India 1.9Hindustan Unilever 1.9Maruti Suzuki India 1.7IndusInd Bank 1.6Bharti Airtel 1.5Asian Paints 1.3Dr Reddy's Laboratories 1.3
HCL Technologies 1.2Hero MotoCorp 1.2Coal India 1.2ONGC 1.1NTPC 1.1Wipro 1.1Lupin 1.1Power Grid 1.0Yes Bank 1.0UltraTech Cement 1.0
Bajaj Auto 1.0Tech Mahindra 0.9Grasim Industries 0.9Bharat Petroleum Corp 0.8Zee Enterainment 0.7Cipla 0.7Eicher Motors 0.7Tata Steel 0.6Aurobindo Pharma 0.6Ambuja Cements 0.6
Bosch 0.6Bharti Infratel 0.6GAIL India 0.5ACC 0.5Hindalco Industries 0.4Bank of Baroda 0.4Tata Power Co 0.4Idea Cellular 0.3Bharat Heavy Electricals 0.3
Equity 88.0Derivatives 11.0Cash,Call & NCA 1.0
No of Stocks 49Turnover Ratio (%) 5
NAV*: Regular-Growth: 112.8225 Dividend: 10.0911NAV*: Direct-Growth: 114.7392 Dividend: 10.1630
PerformancePerformance Period NAV per
Unit ( )Fund(%)
Benchmark(%)
Nifty 50(%) ExcessPoints
Since Inception - 15.6 11.3 11.3 4.430/06/2015 to 30/06/2016 112.82 -7.7 -1.0 -1.0 -6.830/06/2014 to 30/06/2015 122.30 3.6 10.0 10.0 -6.330/06/2013 to 30/06/2014 118.02 33.4 30.3 30.3 3.1Last 3 years - 8.4 12.4 12.4 -3.9Last 5 years - 4.3 8.0 8.0 -3.7Last 8 years - 5.8 9.4 9.4 -3.6
10,000 investedPeriod Fund Benchmark Nifty 50Since Inception 1,62,622 77,659 77,659Last 3 years 12,751 14,186 14,186Last 5 years 12,319 14,675 14,675Last 8 years 15,703 20,511 20,511
Growth of 10,000 Fund Benchmark Additional Benchmark
0
30000
60000
90000
120000
150000
180000
Apr 97 Nov 06 Jun 16
Value of 10,000-a-month SIPPeriod Investment Fund Benchmark Nifty 50Since Inception Returns (%) - 14.58 12.73 12.73Since Inception 23,00,000 1,11,60,666 89,98,544 89,98,544Last 10 years 12,00,000 16,12,822 19,12,086 19,12,086Last 7 years 8,40,000 9,98,453 11,52,292 11,52,292Last 5 years 6,00,000 6,87,793 7,75,087 7,75,087Last 3 years 3,60,000 3,74,678 4,06,397 4,06,397Last 2 years 2,40,000 2,30,055 2,45,891 2,45,891Last 1 year 1,20,000 1,22,734 1,25,632 1,25,632
Performance Analysis (Based on monthly 3 Yrs returns)Fund Benchmark
Arithmetic Mean 9.6 12.8Standard Deviation 17.8 15.3Correlation 1.0 -Beta 1.1 -Sharpe Ratio 0.1 0.4Sortino Ratio 0.2 0.8Alpha -4.9 -Tracking Error 4.4 -Information Ratio -0.9 -Treynor Ratio 1.8 -
Past performance may or may not be sustained in future. Return/investment value are as ofJun 30, 2016 are computed using an adjusted series of NAV for dividends declared before separateDividend and Growth Options were introduced in January 2003. Returns are on a compounded annualbasis for period more than one year and absolute for one-year period and computed using NAV ofRegular Plan-Growth Option. Value of . 10,000 invested at inception is as on Jun 30, 2016. SIPvalues are in rupees. Performance Analysis on annualized basis except Beta and Correlation. The riskfree Index is MIBOR Overnight.
Fund Facts: An open-end equity scheme • Launch: April 1997 • Bloomberg: SUNGROW IN • Plans: Regular and Direct • Options: Growth, Dividend Pay Out, Dividend Sweep, Dividend Re-Investment • Minimum Amount: 5,000 • SIP/STP: Weekly 1000, Monthly 250, Quarterly 750 Terms of offer: NAV Exit Load: 2% - If redeemed / switched out within 18 months from the date of allotment. NIL - If redeemed / switched out after 18 months from the date of allotment-w.e.f. November 28,
2014. The exit load period for unit holders, whose units have merged with Sundaram Growth Fund, shall be reckoned from the date of allotment of units in Sundaram India Leadership Fund at the time of subscribing to that scheme initially. J Venkatesanwas the fund manager for the fund till March 31, 2015. Asset Allocation graph as per AMFI Industry Classification. *Fund NAV is as of last working day of the given month. For Product Labels, please refer Page 2. Disclosures: Page 39.
www.sundarammutual.com June 2016 Page 7 Sundaram Mutual FundDesigned by Morningstar

Sundaram Tax SaverPositioning : Multi-Cap (Large-Cap Bias)Benchmark : S&P BSE 200 IndexFund Manager : S Krishnakumar
Madanagopal RamuS Krishnakumar has experience of 16 years and is managingthis fund since Apr 2015 Madanagopal Ramu has experienceof 9 years and is managing this fund since Apr 2015
Investment ObjectiveTo achieve capital appreciation by investing predominantlyin equities and equity-related instruments. A three-year lock-in period shall apply in line with the regulation for ELSSschemes.
Active Industry Bets versus BenchmarkOverweight Underweight
CementIndustrial ProductsIndustrial Capital Goods
SoftwareConsumer Non DurablesPharmaceuticals
Industry Classification (%)
2.60.20.40.80.91.21.31.51.52.02.12.32.32.32.72.93.43.73.94.84.85.05.5
7.57.78.0
18.9
0 6 12 18 24 30 36
Cash,Call & NCAUnlisted Equity
Healthcare ServicesChemicals
Auto AncillariesConstruction
FertilisersTelecom - Services
GasHotels, Resorts & Other Recr.
Construction ProjectPower
Media & EntertainmentPesticides
Consumer DurablesPetroleum Products
TransportationPharmaceuticalsTextile Products
Industrial Capital GoodsConsumer Non Durables
SoftwareIndustrial Products
AutoFinanceCement
Banks
Active Stock Allocation versus BenchmarkOverweight Underweight
Ramco CementsTata Motors Class AKarur Vysya BankBajaj FinancePVR
HDFCTata Consultancy ServicesInfosysTata MotorsKotak Mahindra Bank
Weighted Avg Market Cap: 68,943 Cr.Median Market Cap: 13,438 Cr.Avg AUM: 1,227 Cr.Month End AUM: 1,244 Cr.
Dividend History: Refer page 37 & 38
PortfolioSecurity WeightHDFC Bank 4.9Ramco Cements 4.6Tata Motors Class A 3.8ICICI Bank 3.6ITC 3.3Bajaj Finance 3.0Infosys 2.7Karur Vysya Bank 2.6Yes Bank 2.5Reliance Industries 2.4
UPL 2.3PVR 2.3CESC 2.3UltraTech Cement 2.2Larsen & Toubro 2.1Gateway Distriparks 2.1Indian Hotels Co 2.0Arvind 1.9SRF 1.9Grindwell Norton 1.8
Honeywell Automation 1.8Mahindra & Mahindra 1.6Axis Bank 1.6Glenmark Pharmaceuticals 1.6Fag Bearings India 1.5Indraprastha Gas 1.5Ujjivan Financial Services Ltd 1.5Bajaj Finserv 1.5Tata Communications 1.4GlaxoSmithKline Consumer 1.4
Federal Bank 1.4Titan Company 1.4Century Plyboards (India) 1.4ALSTOM T&D India 1.3Coromandel International 1.3Oracle Financial Services 1.3Gujarat Pipavav Port 1.3Strides Shasun 1.3Mahindra CIE Automotive 1.3Century Textiles & Indus 1.2
State Bank of India 1.2Phoenix Mills 1.2Equitas Holding Ltd 1.1Indian Bank 1.1Maruti Suzuki India 1.0Hero MotoCorp 1.0Motherson Sumi Systems 0.9Sterlite Technologies 0.9HCL Technologies 0.9Inox Wind 0.9
Sun Pharmaceuticals Indus 0.8Solar Industries India 0.8Sanghvi Movers 0.8Max Financial Services 0.6Indian Oil Corp 0.5HealthCare Global Enterprises Ltd 0.4Sterlite Power Transmission Ltd 0.2Ashok Leyland 0.1
Equity 97.5Cash,Call & NCA 2.5
No of Stocks 58Turnover Ratio (%) 50
NAV*: Regular-Growth: 77.5779 Dividend: 13.1809NAV*: Direct-Growth: 78.4351 Dividend: 13.3600
PerformancePerformance Period NAV per
Unit ( )Fund(%)
Benchmark(%)
Nifty 50(%) ExcessPoints
Since Inception - 17.9 12.3 11.4 5.630/06/2015 to 30/06/2016 77.58 5.3 0.4 -1.0 4.930/06/2014 to 30/06/2015 73.65 20.8 12.0 10.0 8.830/06/2013 to 30/06/2014 60.98 35.6 34.5 30.3 1.1Last 3 years - 19.9 14.8 12.4 5.1Last 5 years - 13.0 8.7 8.0 4.3Last 8 years - 12.6 10.0 9.4 2.7
10,000 investedPeriod Fund Benchmark Nifty 50Since Inception 1,54,702 68,799 60,264Last 3 years 17,246 15,121 14,186Last 5 years 18,405 15,181 14,675Last 8 years 25,907 21,371 20,511
Growth of 10,000 Fund Benchmark Additional Benchmark
0
30000
60000
90000
120000
150000
Nov 99 Mar 08 Jun 16
Value of 10,000-a-month SIPPeriod Investment Fund Benchmark Nifty 50Since Inception Returns (%) - 19.58 14.16 13.07Since Inception 19,90,000 1,24,52,583 72,83,621 65,46,502Last 10 years 12,00,000 23,29,131 19,81,612 19,12,086Last 7 years 8,40,000 13,44,565 11,88,016 11,52,292Last 5 years 6,00,000 9,00,405 8,05,026 7,75,087Last 3 years 3,60,000 4,62,152 4,20,345 4,06,397Last 2 years 2,40,000 2,64,916 2,49,807 2,45,891Last 1 year 1,20,000 1,29,869 1,26,111 1,25,632
Performance Analysis (Based on monthly 3 Yrs returns)Fund Benchmark
Arithmetic Mean 19.8 15.0Standard Deviation 17.6 15.4Correlation 1.0 -Beta 1.1 -Sharpe Ratio 0.8 0.5Sortino Ratio 1.6 1.2Alpha 3.2 -Tracking Error 4.8 -Information Ratio 1.1 -Treynor Ratio 12.2 -
Past performance may or may not be sustained in future. Return/investment value are as ofJun 30, 2016 are computed using an adjusted series of NAV for dividends declared before separateDividend and Growth Options were introduced in May 2005. Returns are on a compounded annualbasis for period more than one year and absolute for one-year period and computed using NAV ofRegular Plan-Growth Option. Value of 10,000 invested at inception is as on Jun 30, 2016. SIP valuesare in rupees. Performance Analysis on annualized basis except Beta and Correlation. The risk freeIndex is MIBOR Overnight.
Fund Facts: An open-end ELSS scheme • Launch: November 1999 • Bloomberg: SNDTAXG IN • Plans: Regular & Direct • Options: Growth, Dividend Pay Out, Dividend Sweep, The dividend reinvestment option has been discontinued w.e.f. March 11,2015. Outstanding units in the Reinvestment option which are under lock-in shall continue to be so until expiry of three years from the date of original investment • Minimum Amount: 500 • SIP/STP: Weekly 1000, Monthly 250, Quarterly 750Terms of offer: NAV Exit Load: Nil (lock-in period 36 months). J Venkatesan was the fund manager for the fund till March 31, 2015. Asset Allocation graph as per AMFI Industry Classification.* Fund NAV is as of last working day of the given month. ForProduct Labels, please refer Page 2. Disclosures: Page 39.
www.sundarammutual.com June 2016 Page 8 Sundaram Mutual FundDesigned by Morningstar

Sundaram Select FocusPositioning : Concentrated Large-Cap FundBenchmark : Nifty 50 IndexFund Manager : Shiv ChananiShiv Chanani has experience of 12 years and managing thisfund since Apr 2015
Investment ObjectiveTo achieve capital appreciation by investing in equity andequity related instruments of select stocks
Active Industry Bets versus BenchmarkOverweight Underweight
Petroleum ProductsSoftwarePesticides
PharmaceuticalsAutoFinance
Industry Classification (%)
9.9
-2.0
0.0
0.1
0.2
0.5
1.0
1.1
1.4
1.6
2.2
2.6
2.8
4.1
4.4
6.2
10.7
11.3
18.0
23.8
-30-22-14-62
101826344250
Cash,Call & NCA
Derivatives
Services
Healthcare Services
Telecom - Equipment & Acc.
Auto Ancillaries
Gas
Pharmaceuticals
Minerals/Mining
Telecom - Services
Pesticides
Power
Cement
Construction Project
Finance
Auto
Petroleum Products
Consumer Non Durables
Software
Banks
Active Stock Allocation versus BenchmarkOverweight Underweight
Indian Oil CorpHindustan PetroleumCognizant Technology AHDFC BankState Bank of India
HDFCSun Pharmaceuticals IndusAsian PaintsDr Reddy's LaboratoriesHero MotoCorp
Weighted Avg Market Cap: 1,65,868 Cr.Median Market Cap: 1,26,425 Cr.Avg AUM: 343 Cr.Month End AUM: 344 Cr.
Dividend History: Refer page 37 & 38
PortfolioSecurity WeightHDFC Bank 9.2ITC 7.8Infosys 7.5Reliance Industries 4.8Larsen & Toubro 4.1Kotak Mahindra Bank 3.9Tata Consultancy Services 3.7State Bank of India 3.5ICICI Bank 3.4Axis Bank 3.1
Hindustan Unilever 2.7Indian Oil Corp 2.6Hindustan Petroleum 2.3Cognizant Technology A 2.2HDFC 2.2Maruti Suzuki India 2.1Mahindra & Mahindra 2.1Tata Motors 2.0HCL Technologies 2.0Wipro 1.6
Bharti Airtel 1.6ACC 1.4Coal India 1.4NTPC 1.4Grasim Industries 1.4Power Grid 1.3Bayer CropScience 1.2Max Financial Services 1.1Sun Pharmaceuticals Indus 1.1Castrol India 1.0
Rural Electrification 1.0GAIL India 1.0Oracle Financial Services 1.0UPL 1.0Dabur India 0.9IndusInd Bank 0.6Motherson Sumi Systems 0.5Bharti Infratel 0.2Apollo Hospitals 0.1Max India Ltd 0.1
Max Venture and Industries Ltd 0.0
Equity 92.1Derivatives -2.0Cash,Call & NCA 9.9
No of Stocks 41Turnover Ratio (%) 61
NAV*: Regular-Growth: 123.7153 Dividend: 13.3847NAV*: Direct-Growth: 125.5741 Dividend: 13.5703
PerformancePerformance Period NAV per
Unit ( )Fund(%)
Benchmark(%)
Nifty 50(%) ExcessPoints
Since Inception - 19.8 16.7 16.7 3.130/06/2015 to 30/06/2016 123.72 -2.1 -1.0 -1.0 -1.130/06/2014 to 30/06/2015 126.34 9.1 10.0 10.0 -0.830/06/2013 to 30/06/2014 115.77 35.4 30.3 30.3 5.1Last 3 years - 13.1 12.4 12.4 0.7Last 5 years - 7.6 8.0 8.0 -0.4Last 8 years - 7.6 9.4 9.4 -1.8
10,000 investedPeriod Fund Benchmark Nifty 50Since Inception 1,23,715 86,272 86,272Last 3 years 14,469 14,186 14,186Last 5 years 14,392 14,675 14,675Last 8 years 17,935 20,511 20,511
Growth of 10,000 Fund Benchmark Additional Benchmark
0
30000
60000
90000
120000
Jul 02 Jul 09 Jun 16
Value of 10,000-a-month SIPPeriod Investment Fund Benchmark Nifty 50Since Inception Returns (%) - 14.18 12.82 12.82Since Inception 16,70,000 48,53,335 43,58,916 43,58,916Last 10 years 12,00,000 18,27,975 19,12,086 19,12,086Last 7 years 8,40,000 11,17,391 11,52,292 11,52,292Last 5 years 6,00,000 7,66,767 7,75,087 7,75,087Last 3 years 3,60,000 4,05,856 4,06,397 4,06,397Last 2 years 2,40,000 2,42,536 2,45,891 2,45,891Last 1 year 1,20,000 1,22,999 1,25,632 1,25,632
Performance Analysis (Based on monthly 3 Yrs returns)Fund Benchmark
Arithmetic Mean 13.5 12.8Standard Deviation 15.5 15.3Correlation 1.0 -Beta 1.0 -Sharpe Ratio 0.4 0.4Sortino Ratio 1.0 0.8Alpha 0.8 -Tracking Error 3.5 -Information Ratio 0.2 -Treynor Ratio 6.7 -
Past performance may or may not be sustained in future. Returns/investment value are as ofJun 30, 2016. Returns are on a compounded annual basis for period more than one year and absolutefor one-year period and computed using NAV of Regular Plan-Growth Option. Value of 10,000invested at inception is as on Jun 30, 2016. SIP values are in rupees. Performance Analysis onannualized basis except Beta and Correlation. The risk free Index is MIBOR Overnight.
Fund Facts: An open-end equity scheme • Launch: July 2002 • Bloomberg: SUNSFOG IN • Plans: Regular & Direct • Options: Growth, Dividend Pay Out, Dividend Sweep, Dividend Re-Investment • Minimum Amount: 5,000 • SIP/STP: Weekly 1000,Monthly 250, Quarterly 750 Terms of offer: NAV Exit Load: Nil (w.e.f. February 03, 2014). J Venkatesan was the fund manager for the fund till March 31, 2015. Asset Allocation graph as per AMFI Industry Classification.* Fund NAV is as of last workingday of the given month. For Product Labels, please refer Page 2. Disclosures: Page 39.
www.sundarammutual.com June 2016 Page 9 Sundaram Mutual FundDesigned by Morningstar

Sundaram Select Mid CapPositioning : Pure Mid-Cap FundBenchmark : S&P BSE Midcap IndexFund Manager : S KrishnakumarS Krishnakumar has experience of 16 years and is managingthis fund since Nov 2012
Investment ObjectiveTo achieve capital appreciation by investing in diversifiedstocks that are generally termed as mid-caps.
Active Industry Bets versus BenchmarkOverweight Underweight
Industrial ProductsTextile ProductsCement
Consumer Non DurablesPharmaceuticalsFinance
Industry Classification (%)
2.00.81.01.01.01.11.31.31.41.41.51.61.92.12.52.82.93.03.13.23.44.0
5.26.56.87.4
9.29.8
10.9
0 4 8 12 16 20
Cash,Call & NCAConstruction
Telecom - ServicesPower
ChemicalsConstruction Project
RetailingHealthcare Services
TransportationPetroleum Products
Hotels, Resorts & Other Recr.Textiles - Cotton
AutoPharmaceuticals
PaperConsumer Non Durables
FertilisersPesticides
GasSoftware
Media & EntertainmentConsumer Durables
CementTextile ProductsAuto Ancillaries
Industrial Capital GoodsBanks
Industrial ProductsFinance
Active Stock Allocation versus BenchmarkOverweight Underweight
Fag Bearings IndiaSRFRamco CementsIndraprastha GasWABCO India
Zee EnterainmentYes BankIBHFLShriram Transport FinanceHindustan Petroleum
Weighted Avg Market Cap: 11,992 Cr.Median Market Cap: 7,905 Cr.Avg AUM: 3,616 Cr.Month End AUM: 3,750 Cr.
Dividend History: Refer page 37 & 38
PortfolioSecurity WeightFag Bearings India 4.5SRF 3.8Ramco Cements 3.2Indraprastha Gas 3.1Bajaj Finance 3.0UPL 3.0WABCO India 2.8Arvind 2.7Bajaj Finserv 2.6TNPL 2.5
Sundaram Clayton 2.5Yes Bank 2.4Honeywell Automation 2.4Timken India 2.2Mahindra CIE Automotive 2.1Federal Bank 2.0Ashok Leyland 1.9Karur Vysya Bank 1.9Ujjivan Financial Services Ltd 1.8Cholamandalam Investment 1.7
Vardhman Textiles 1.6E I D Parry India 1.6Indian Bank 1.6HSIL 1.5Jyothy Laboratories 1.5Exide Industries 1.5Castrol India 1.4Gateway Distriparks 1.4Mphasis 1.3PVR 1.3
DCB Bank 1.3HealthCare Global Enterprises Ltd 1.3GlaxoSmithKline Consumer 1.3Coromandel International 1.3Trent 1.3Whirlpool of India 1.3Strides Shasun 1.2Thermax 1.2Mahindra & Mahindra Finl 1.2Titan Company 1.2
BEML 1.1Indian Hotels Co 1.1Century Textiles & Indus 1.1Engineers India 1.1Dish TV India 1.0Oracle Financial Services 1.0Tata Chemicals 1.0Jagran Prakashan 1.0CESC 1.0Tata Communications 1.0
Grindwell Norton 1.0Alstom India 0.9Persistent Systems 0.9Glenmark Pharmaceuticals 0.9Prism Cement 0.8Inox Wind 0.8Phoenix Mills 0.8ALSTOM T&D India 0.7Max Financial Services 0.6Mahindra Holidays 0.4
Bharat Electronics 0.2Bayer CropScience 0.0Mahanagar Gas Ltd 0.0
Equity 98.0Cash,Call & NCA 2.0
No of Stocks 63Turnover Ratio (%) 29
NAV*: Regular-Growth: 368.8032 Dividend: 33.7783NAV*: Direct-Growth: 375.2066 Dividend: 34.4606
PerformancePerformance Period NAV per
Unit ( )Fund(%)
Benchmark(%)
Nifty 50(%) ExcessPoints
Since Inception - 29.6 19.6 16.7 10.030/06/2015 to 30/06/2016 368.80 9.1 9.7 -1.0 -0.630/06/2014 to 30/06/2015 338.11 30.0 13.9 10.0 16.130/06/2013 to 30/06/2014 260.12 66.8 57.3 30.3 9.6Last 3 years - 33.2 25.2 12.4 8.0Last 5 years - 19.2 11.3 8.0 7.9Last 8 years - 19.7 10.2 9.4 9.5
10,000 investedPeriod Fund Benchmark Nifty 50Since Inception 3,68,803 1,20,974 86,272Last 3 years 23,654 19,645 14,186Last 5 years 24,111 17,095 14,675Last 8 years 42,241 21,753 20,511
Growth of 10,000 Fund Benchmark Additional Benchmark
0
30000
60000
90000
120000
150000
180000
210000
240000
270000
300000
330000
360000
Jul 02 Jul 09 Jun 16
Value of 10,000-a-month SIPPeriod Investment Fund Benchmark Nifty 50Since Inception Returns (%) - 25.10 14.95 12.82Since Inception 16,70,000 1,16,71,915 51,57,323 43,58,916Last 10 years 12,00,000 33,32,206 21,86,868 19,12,086Last 7 years 8,40,000 17,77,321 13,52,270 11,52,292Last 5 years 6,00,000 11,26,798 9,37,417 7,75,087Last 3 years 3,60,000 5,37,241 4,90,816 4,06,397Last 2 years 2,40,000 2,77,684 2,69,276 2,45,891Last 1 year 1,20,000 1,30,665 1,29,884 1,25,632
Performance Analysis (Based on monthly 3 Yrs returns)Fund Benchmark
Arithmetic Mean 31.0 24.3Standard Deviation 20.0 18.2Correlation 1.0 -Beta 1.1 -Sharpe Ratio 1.3 1.0Sortino Ratio 3.0 2.3Alpha 5.3 -Tracking Error 5.5 -Information Ratio 1.4 -Treynor Ratio 25.4 -
Past performance may or may not be sustained in future. Returns/investment value are as ofJun 30, 2016. Returns are on a compounded annual basis for period more than one year and absolutefor one-year period and computed using NAV of Regular Plan-Growth Option. Value of 10,000invested at inception is as on Jun 30, 2016 . SIP values are in rupees. Performance Analysis onannualized basis except Beta and Correlation. The risk free Index is MIBOR Overnight.
Fund Facts: An open-end equity scheme • Launch: July 2002 • Bloomberg: SUNSMIG IN • Plans: Regular & Direct • Options: Growth, Dividend Pay Out, Dividend Sweep, Dividend Re-Investment • Minimum Amount: 5,000 • SIP/STP: Weekly 1000,Monthly 250, Quarterly 750 Terms of offer: NAV Exit Load: 1% if redeemed within 12 months from date of allotment. Asset Allocation graph as per AMFI Industry Classification.* Fund NAV is as of last working day of the given month. For ProductLabels, please refer Page 2. Disclosures: Page 39.
www.sundarammutual.com June 2016 Page 10 Sundaram Mutual FundDesigned by Morningstar

Sundaram S.M.I.L.E FundPositioning : Small CapBenchmark : S&P BSE Smallcap IndexFund Manager : S KrishnakumarS Krishnakumar has experience of 16 years and is managingthis fund since Dec 2006
Investment ObjectiveTo primarily achieve capital appreciation by investing indiversified stocks that are generally termed as small and mid-caps and by investing in other equities.
Active Industry Bets versus BenchmarkOverweight Underweight
Industrial Capital GoodsCementIndustrial Products
SoftwareConsumer Non DurablesFinance
Industry Classification (%)
0.50.40.50.81.11.11.21.31.41.41.51.82.52.72.83.03.13.64.54.75.25.65.76.8
8.911.5
16.6
0 6 12 18 24 30
Cash,Call & NCAUnlisted Equity
GasHealthcare Services
PesticidesHotels, Resorts & Other Recr.
TradingFertilisers
Telecom - Equipment & Acc.Engineering Services
PowerMedia & Entertainment
Consumer Non DurablesTextile ProductsAuto AncillariesTransportation
Construction ProjectChemicals
Consumer DurablesSoftware
PharmaceuticalsBanks
FinanceConstruction
Industrial ProductsCement
Industrial Capital Goods
Active Stock Allocation versus BenchmarkOverweight Underweight
V-Guard IndustriesNavin Fluorine IntlKarur Vysya BankJK CementRane Holdings
Federal BankMindTreeBharat Finl InclusionVoltasCholamandalamInvestment
Weighted Avg Market Cap: 3,037 Cr.Median Market Cap: 2,567 Cr.Avg AUM: 1,135 Cr.Month End AUM: 1,169 Cr.
Dividend History: Refer page 37 & 38
PortfolioSecurity WeightV-Guard Industries 5.1Navin Fluorine Intl 3.6Karur Vysya Bank 3.3JK Cement 3.1Gateway Distriparks 3.0HeidelbergCement India 3.0Praj Industries 3.0PNC Infratech 2.9Strides Shasun 2.9Rane Holdings 2.9
Himatsingka Seide 2.7NRB Bearings 2.5Take Solutions 2.4Ashoka Buildcon 2.3ITD Cementation India 2.3Ramco Systems 2.3HSIL 2.3Century Plyboards (India) 2.3DCB Bank 2.2Timken India 2.2
TD Power Systems 2.2India Cements 2.1TRF 1.9ISGEC Heavy Engineering 1.8Ramco Cements 1.8INOX Leisure 1.8Sundaram Fasteners 1.6Brigade Enterprises 1.6Ramco Industries 1.5Heritage Foods 1.5
Sanghvi Movers 1.5Kalpataru Power 1.5KSB Pumps 1.4Sterlite Technologies 1.4Amrutanjan Health Care 1.4Astra Microwave Products 1.4Carborundum Universal 1.3Chambal Fertilisers 1.3LG Balakrishnan & Bros 1.2Redington (India) 1.2
Max Financial Services 1.2Adlabs Entertainment 1.1Va Tech Wabag 1.1Insecticides (India) 1.1Balrampur Chini Mills 1.0Suven Life Sciences 0.9Texmaco Rail & Eng 0.9Ujjivan Financial Services Ltd 0.9Thyrocare Technologies Ltd 0.8Equitas Holding Ltd 0.8
Gammon Infrastructure 0.5Mahanagar Gas Ltd 0.5Sterlite Power Transmission Ltd 0.4Easun Reyrolle 0.3Hindustan Dorr-Oliver 0.3Indian Hume Pipe Co 0.2Max India Ltd 0.0
Equity 99.5Cash,Call & NCA 0.5
No of Stocks 57Turnover Ratio (%) 41
NAV*: Regular-Growth: 73.0001 Dividend: 20.6298NAV*: Direct-Growth: 74.2057 Dividend: 21.0511
PerformancePerformance Period NAV per
Unit ( )Fund(%)
Benchmark(%)
Nifty 50(%) ExcessPoints
Since Inception - 19.1 10.7 12.9 8.430/06/2015 to 30/06/2016 73.00 7.3 6.5 -1.0 0.830/06/2014 to 30/06/2015 68.02 33.4 8.6 10.0 24.930/06/2013 to 30/06/2014 50.97 91.3 80.8 30.3 10.5Last 3 years - 39.9 27.9 12.4 12.0Last 5 years - 19.2 7.7 8.0 11.5Last 8 years - 17.5 7.3 9.4 10.2
10,000 investedPeriod Fund Benchmark Nifty 50Since Inception 73,000 31,873 39,655Last 3 years 27,398 20,911 14,186Last 5 years 24,061 14,468 14,675Last 8 years 36,394 17,609 20,511
Growth of 10,000 Fund Benchmark Additional Benchmark
0
20000
40000
60000
Feb 05 Oct 10 Jun 16
Value of 10,000-a-month SIPPeriod Investment Fund Benchmark Nifty 50Since Inception Returns (%) - 17.94 9.06 9.86Since Inception 13,60,000 40,20,100 23,22,218 24,37,961Last 10 years 12,00,000 31,27,571 19,56,588 19,12,086Last 7 years 8,40,000 17,25,287 12,48,533 11,52,292Last 5 years 6,00,000 11,59,880 9,07,446 7,75,087Last 3 years 3,60,000 5,58,892 4,83,526 4,06,397Last 2 years 2,40,000 2,69,556 2,57,439 2,45,891Last 1 year 1,20,000 1,28,400 1,27,627 1,25,632
Performance Analysis (Based on monthly 3 Yrs returns)Fund Benchmark
Arithmetic Mean 37.2 27.0Standard Deviation 25.5 21.4Correlation 0.9 -Beta 1.1 -Sharpe Ratio 1.3 1.0Sortino Ratio 2.8 2.2Alpha 6.7 -Tracking Error 8.7 -Information Ratio 1.4 -Treynor Ratio 29.7 -
Past performance may or may not be sustained in future. Returns/investment value are as ofJun 30, 2016. Returns are on a compounded annual basis for period more than one year and absolutefor one-year period and computed using NAV of Regular Plan-Growth Option. Value of 10,000invested at inception is as on Jun 30, 2016 . SIP values are in rupees. Performance Analysis onannualized basis except Beta and Correlation. The risk free Index is MIBOR Overnight.
Fund Facts: An open-end equity scheme • Launch: February 2005 • Bloomberg: SMILEG IN • Plans: Regular & Direct • Options: Growth, Dividend Pay Out, Dividend Sweep, Dividend Re-Investment • Minimum Amount: 5,000 • SIP/STP: Weekly 1000, Monthly 250, Quarterly 750. Terms of offer: NAV Exit Load: 1% if redeemed within 12 months from date of allotment. The scheme benchmark has been changed to S&P BSE Small Cap Index from CNX Mid Cap Index w.e.f. 01-Aug-2013. AssetAllocation graph as per AMFI Industry Classification.* Fund NAV is as of last working day of the given month. For Product Labels, please refer Page 2. Disclosures: Page 39.
www.sundarammutual.com June 2016 Page 11 Sundaram Mutual FundDesigned by Morningstar

Sundaram Equity MultiplierPositioning : Diversified Equity FundBenchmark : Nifty 500 IndexFund Manager : Shiv ChananiShiv Chanani has experience of 12 years and managing thisfund since Apr 2015
Investment ObjectiveThe objective of the scheme would be to seek capitalappreciation by investing in equity & equity relatedinstruments.
Active Industry Bets versus BenchmarkOverweight Underweight
ChemicalsGasPetroleum Products
AutoPharmaceuticalsPower
Industry Classification (%)
15.7
-2.0
0.1
0.5
0.7
0.7
0.9
0.9
1.1
1.6
1.8
2.6
3.6
4.4
4.6
4.8
5.2
7.9
8.7
8.9
11.1
16.3
... ... ...-4 2 8
... ... ... ...
Cash,Call & NCA
Derivatives
Services
Pesticides
Retailing
Power
Industrial Capital Goods
Transportation
Telecom - Services
Cement
Auto Ancillaries
Industrial Products
Gas
Construction Project
Pharmaceuticals
Chemicals
Auto
Petroleum Products
Finance
Consumer Non Durables
Software
Banks
Active Stock Allocation versus BenchmarkOverweight Underweight
ELANTAS Beck IndiaProcter & GambleSKF IndiaAstraZeneca PharmaIndiaSanofi India
ITCState Bank of IndiaAsian PaintsDr Reddy's LaboratoriesSun Pharmaceuticals Indus
Weighted Avg Market Cap: 1,02,202 Cr.Median Market Cap: 14,218 Cr.Avg AUM: 159 Cr.Month End AUM: 166 Cr.
Dividend History: Refer page 37 & 38
PortfolioSecurity WeightHDFC Bank 6.0Infosys 6.0Reliance Industries 4.4HDFC 3.8Larsen & Toubro 2.7ELANTAS Beck India 2.6ITC 2.4ICICI Bank 2.3Kotak Mahindra Bank 2.3Tata Consultancy Services 2.2
Mahindra & Mahindra 2.0Procter & Gamble 1.8SKF India 1.7Tata Motors 1.7AstraZeneca Pharma India 1.6Grasim Industries 1.5Maruti Suzuki India 1.5Sanofi India 1.5Wipro 1.3IndusInd Bank 1.3
Gujarat Narmada Valley 1.3Hindustan Petroleum 1.3Mahanagar Gas Ltd 1.3Kesoram Industries 1.2Indian Oil Corp 1.2DCB Bank 1.2GAIL India 1.2Indraprastha Gas 1.1Axis Bank 1.1Bharti Airtel 1.1
Hindustan Unilever 1.1Max Financial Services 1.1Rural Electrification 1.0State Bank of Mysore 1.0Gulf Oil Lubricants India 1.0SBBJ 1.0Hexaware Technologies 1.0Ujjivan Financial Services Ltd 1.0Akzo Nobel India 1.0Gateway Distriparks 0.9
ALSTOM T&D India 0.9Sun Pharmaceuticals Indus 0.9Huhtamaki PPL 0.9ICRA 0.9BASF India 0.9Ashoka Buildcon 0.9IDFC 0.9Bombay Burmah Trading 0.9Godfrey Phillips India 0.8NCC 0.8
Torrent Power 0.7Bharti Retail 0.7J.B. Chemicals 0.6ZF Steering Gear (India) 0.6VST Industries 0.5UPL 0.5Gillette India 0.5Oracle Financial Services 0.4HCL Technologies 0.2Max India Ltd 0.1
Max Venture and Industries Ltd 0.1
Equity 86.3Derivatives -2.0Cash,Call & NCA 15.7
No of Stocks 61Turnover Ratio (%) 251
NAV*: Regular-Growth: 23.0984 Dividend: 17.2527NAV*: Direct-Growth: 23.5723 Dividend: 17.6482
PerformancePerformance Period NAV per
Unit ( )Fund(%)
Benchmark(%)
Nifty 50(%) ExcessPoints
Since Inception - 9.4 8.6 8.4 0.830/06/2015 to 30/06/2016 23.10 1.5 1.2 -1.0 0.330/06/2014 to 30/06/2015 22.75 18.6 11.7 10.0 6.930/06/2013 to 30/06/2014 19.18 47.8 36.9 30.3 10.9Last 3 years - 21.2 15.7 12.4 5.5Last 5 years - 10.1 9.1 8.0 1.1Last 8 years - 11.1 10.2 9.4 0.9
10,000 investedPeriod Fund Benchmark Nifty 50Since Inception 23,098 21,654 21,284Last 3 years 17,790 15,475 14,186Last 5 years 16,192 15,434 14,675Last 8 years 23,183 21,792 20,511
Growth of 10,000 Fund Benchmark Additional Benchmark
0
10000
20000
Feb 07 Oct 11 Jun 16
Value of 10,000-a-month SIPPeriod Investment Fund Benchmark Nifty 50Last 5 years 6,00,000 8,68,698 8,17,288 7,75,087Last 3 years 3,60,000 4,52,066 4,25,688 4,06,397Last 2 years 2,40,000 2,55,021 2,51,002 2,45,891Last 1 year 1,20,000 1,24,543 1,26,376 1,25,632
Performance Analysis (Based on monthly 3 Yrs returns)Fund Benchmark
Arithmetic Mean 20.4 15.8Standard Deviation 14.9 15.7Correlation 0.9 -Beta 0.9 -Sharpe Ratio 1.0 0.6Sortino Ratio 2.3 1.3Alpha 6.3 -Tracking Error 5.3 -Information Ratio 1.0 -Treynor Ratio 16.5 -
Past performance may or may not be sustained in future. Returns/investment value are as ofJun 30, 2016. Returns are on a compounded annual basis for period more than one year and absolutefor one-year period and computed using NAV of Regular Plan-Growth Option. Value of 10,000invested at inception is as on Jun 30, 2016. SIP values are in rupees. SIP performance is computedsince the fund became open ended. Performance Analysis on annualized basis except Beta andCorrelation. The risk free Index is MIBOR Overnight.
Fund Facts: An open-end equity scheme • Launch: February 2007 • Bloomberg: SNDEMUG IN • Plans: Regular & Direct • Options: Growth, Dividend Pay Out, Dividend Sweep, Dividend Re-Investment • Minimum Amount: 5,000 • SIP/STP: Weekly 1000, Monthly 250, Quarterly 750 Terms of offer: NAV Exit Load: Is Nil. S Krishnakumar & Shiv Chanani were jointly managing the fund till March 31, 2015. MIBOR Overnight Benchmark being used for Calculation. Asset Allocation graph as per
AMFI Industry Classification.* Fund NAV is as of last working day of the given month. For Product Labels, please refer Page 2. Disclosures: Page 39.
www.sundarammutual.com June 2016 Page 12 Sundaram Mutual FundDesigned by Morningstar

Sundaram Rural India FundPositioning : Rural ProsperityBenchmark : S&P BSE 500 IndexFund Manager : S Krishnakumar
Avinash AgarwalS Krishnakumar has experience of 16 years and is managingthis fund since Apr 2015 Avinash Agarwal has experience of10 years and is managing this fund since Apr 2015
Investment ObjectiveThe primary investment objective of the scheme is togenerate consistent long-term returns by investingpredominantly in equity & equity related instruments ofcompanies that are focusing on Rural India.
Active Industry Bets versus BenchmarkOverweight Underweight
PesticidesConsumer Non DurablesConsumer Durables
SoftwareBanksPharmaceuticals
Industry Classification (%)
8.2
1.1
1.5
1.6
2.6
2.7
3.3
3.4
4.2
4.8
6.1
6.3
7.6
7.6
7.8
11.8
19.4
0 7 14 21 28 35
Cash,Call & NCA
Petroleum Products
Textiles - Cotton
Paper
Construction Project
Textile Products
Fertilisers
Industrial Capital Goods
Cement
Chemicals
Media & Entertainment
Consumer Durables
Finance
Auto
Banks
Pesticides
Consumer Non Durables
Active Stock Allocation versus BenchmarkOverweight Underweight
V-Guard IndustriesJagran PrakashanUPLHeritage FoodsMahindra & Mahindra
InfosysHDFCHDFC BankReliance IndustriesTata Consultancy Services
Weighted Avg Market Cap: 37,354 Cr.Median Market Cap: 10,186 Cr.Avg AUM: 173 Cr.Month End AUM: 194 Cr.
Dividend History: Refer page 37 & 38
PortfolioSecurity WeightMahindra & Mahindra 4.4ITC 3.6V-Guard Industries 3.4UPL 3.4Jagran Prakashan 3.1Heritage Foods 2.9Asian Paints 2.7Ujjivan Financial Services Ltd 2.7Balrampur Chini Mills 2.4Yes Bank 2.1
Bayer CropScience 2.1Bajaj Auto 2.0Century Plyboards (India) 2.0Blue Star 2.0PI Industries 2.0Ramco Cements 1.9IndusInd Bank 1.9Equitas Holding Ltd 1.9Procter & Gamble 1.9Insecticides (India) 1.9
INOX Leisure 1.8Navin Fluorine Intl 1.8Tata Chemicals 1.7Himatsingka Seide 1.7NCC 1.7ICICI Bank 1.6TNPL 1.6Vardhman Textiles 1.5Axis Bank 1.4Rallis India 1.4
Nestle India 1.4Whirlpool of India 1.4Coromandel International 1.3Gujarat Narmada Valley 1.3Dabur India 1.3Ambuja Cements 1.3Hindustan Unilever 1.3Zee Enterainment 1.2Bajaj Finance 1.1Bharat Petroleum Corp 1.1
Monsanto India 1.1E I D Parry India 1.0K.P.R. Mill 1.0HSIL 1.0Shriram City Union Fin 1.0UltraTech Cement 1.0Tata Coffee 1.0KRBL 0.9Chambal Fertilisers 0.9Maruti Suzuki India 0.9
Larsen & Toubro 0.9Mahindra & Mahindra Finl 0.9HDFC Bank 0.8VST Tillers Tractors 0.3
Equity 91.8Cash,Call & NCA 8.2
No of Stocks 54Turnover Ratio (%) 192
NAV*: Regular-Growth: 30.8139 Dividend: 20.6309NAV*: Direct-Growth: 31.3111 Dividend: 20.9716
PerformancePerformance Period NAV per
Unit ( )Fund(%)
Benchmark(%)
Nifty 50(%) ExcessPoints
Since Inception - 11.7 8.3 8.4 3.530/06/2015 to 30/06/2016 30.81 20.3 1.2 -1.0 19.130/06/2014 to 30/06/2015 25.61 19.9 11.4 10.0 8.530/06/2013 to 30/06/2014 21.36 38.7 36.7 30.3 2.0Last 3 years - 26.0 15.5 12.4 10.5Last 5 years - 15.2 8.7 8.0 6.5Last 8 years - 12.8 9.8 9.4 3.0
10,000 investedPeriod Fund Benchmark Nifty 50Since Inception 30,814 22,373 22,706Last 3 years 20,005 15,396 14,186Last 5 years 20,298 15,181 14,675Last 8 years 26,223 21,148 20,511
Growth of 10,000 Fund Benchmark Additional Benchmark
0
10000
20000
30000
May 06 Jun 11 Jun 16
Value of 10,000-a-month SIPPeriod Investment Fund Benchmark Nifty 50Since Inception Returns (%) - 14.39 9.71 9.05Since Inception 12,10,000 25,83,608 20,09,498 19,40,064Last 10 years 12,00,000 25,51,907 19,82,098 19,12,086Last 7 years 8,40,000 15,45,817 11,92,336 11,52,292Last 5 years 6,00,000 10,14,749 8,10,197 7,75,087Last 3 years 3,60,000 5,20,141 4,23,955 4,06,397Last 2 years 2,40,000 2,94,404 2,50,624 2,45,891Last 1 year 1,20,000 1,40,643 1,26,367 1,25,632
Performance Analysis (Based on monthly 3 Yrs returns)Fund Nifty 500
Arithmetic Mean 24.6 15.8Standard Deviation 16.2 15.7Correlation 0.9 -Beta 1.0 -Sharpe Ratio 1.2 0.6Sortino Ratio 2.7 1.3Alpha 9.2 -Tracking Error 5.3 -Information Ratio 1.9 -Treynor Ratio 20.1 -
Past performance may or may not be sustained in future. Returns/investment value are as ofJun 30, 2016. Returns are on a compounded annual basis for period more than one year and absolutefor one-year period and computed using NAV of Regular Plan-Growth Option. Value of 10,000invested at inception is as on Jun 30, 2016. SIP values are in rupees. Performance Analysis onannualized basis except Beta and Correlation. The risk free Index is MIBOR Overnight. Risk Measuresare calculated based on Nifty 500 Index.
Fund Facts: An open-end equity scheme • Launch: May 2006 • Bloomberg: SNDRUIG IN • Plans: Regular & Direct • Options: Growth, Dividend Pay Out, Dividend Sweep, Dividend Re-Investment • Minimum Amount: 5,000 • SIP/STP: Weekly 1000,Monthly 250, Quarterly 750. Terms of offer: NAV Exit Load: 1% if redeemed within 12 months from date of allotment. J Venkatesan & S Bharath were jointly managing the fund till March 31, 2015. Asset Allocation graph as per AMFI IndustryClassification.* Fund NAV is as of last working day of the given month. For Product Labels, please refer Page 2. Disclosures: Page 39.
www.sundarammutual.com June 2016 Page 13 Sundaram Mutual FundDesigned by Morningstar

Sundaram Infrastructure Advantage FundPositioning : Capex/InfrastructureBenchmark : S&P BSE 100 IndexFund Manager : S Krishnakumar
Madanagopal RamuS Krishnakumar has experience of 16 years and is managingthis fund since Jan 2013 [ before conversion] MadanagopalRamu has experience of 9 years and is managing this fundsince Jan 2016
Investment ObjectiveTo generate consistent long-term returns by investingpredominantly in equity/equity-related instruments ofcompanies engaged either directly or indirectly ininfrastructure- and infrastructure related activities orexpected to benefit from the growth and development ofinfrastructure
Active Industry Bets versus BenchmarkOverweight Underweight
Industrial Capital GoodsConstruction ProjectIndustrial Products
SoftwareConsumer Non DurablesAuto
Industry Classification (%)
3.1
0.3
0.9
2.0
2.2
2.9
4.1
4.5
4.6
4.7
5.3
6.1
7.6
7.7
11.8
14.8
17.5
0 6 12 18 24 30 36
Cash,Call & NCA
Unlisted Equity
Telecom - Equipment & Acc.
Consumer Non Durables
Power
Engineering Services
Consumer Durables
Transportation
Finance
Construction
Petroleum Products
Gas
Industrial Products
Cement
Construction Project
Banks
Industrial Capital Goods
Active Stock Allocation versus BenchmarkOverweight Underweight
Indraprastha GasRamco CementsHoneywell AutomationLarsen & ToubroALSTOM T&D India
InfosysITCHDFCTata Consultancy ServicesHDFC Bank
Weighted Avg Market Cap: 50,567 Cr.Median Market Cap: 4,324 Cr.Avg AUM: 577 Cr.Month End AUM: 593 Cr.
Dividend History: Refer page 37 & 38
PortfolioSecurity WeightLarsen & Toubro 7.2Indraprastha Gas 6.1Ramco Cements 5.1Honeywell Automation 4.2Kotak Mahindra Bank 3.7ALSTOM T&D India 3.5Bajaj Finserv 3.3Yes Bank 3.3Cummins India 3.2HDFC Bank 3.0
PNC Infratech 2.8Ashoka Buildcon 2.8Blue Star 2.6Va Tech Wabag 2.4Bharat Petroleum Corp 2.4State Bank of India 2.3Inox Wind 2.3Kalpataru Power 2.2Gateway Distriparks 2.1Thermax 2.0
Kansai Nerolac Paints 2.0ITD Cementation India 1.9Reliance Industries 1.9ICICI Bank 1.7HSIL 1.5UltraTech Cement 1.5Alstom India 1.5Navkar Corporation 1.5Techno Electric & Eng Co 1.3Sterlite Technologies 1.3
HDFC 1.3Praj Industries 1.1Shree Cement 1.1Timken India 1.1Indian Oil Corp 1.0Gujarat Pipavav Port 1.0BEML 1.0DCB Bank 0.9Sanghvi Movers 0.8Astra Microwave Products 0.8
Mahindra CIE Automotive 0.7Texmaco Rail & Eng 0.7Carborundum Universal 0.7Hindustan Dorr-Oliver 0.5Gammon Infrastructure 0.5Ingersoll Rand (India) 0.5TD Power Systems 0.4Sterlite Power Transmission Ltd 0.3Grindwell Norton 0.2
Equity 96.9Cash,Call & NCA 3.1
No of Stocks 49Turnover Ratio (%) 22
NAV*: Regular-Growth: 25.3145 Dividend: 24.1806NAV*: Direct-Growth: 25.6910 Dividend: 24.5483
PerformancePerformance Period NAV per
Unit ( )Fund(%)
Benchmark(%)
Nifty 50(%) ExcessPoints
Since Inception - 18.4 10.5 9.9 7.930/06/2015 to 30/06/2016 25.31 0.1 -0.4 -1.0 0.530/06/2014 to 30/06/2015 25.28 16.6 9.3 10.0 7.3
10,000 investedPeriod Fund Benchmark Nifty 50Since Inception 14,519 12,475 12,309
Growth of 10,000 Fund Benchmark Additional Benchmark
0
5000
10000
15000
Apr 14 May 15 Jun 16
Value of 10,000-a-month SIPPeriod Investment Fund Benchmark Nifty 50Since Inception Returns (%) - 6.46 3.60 3.24Since Inception 2,60,000 2,79,129 2,70,580 2,69,527Last 2 years 2,40,000 2,52,377 2,46,766 2,45,891Last 1 year 1,20,000 1,24,836 1,25,843 1,25,632
Performance Analysis (Based on monthly 3 Yrs returns)Fund Benchmark
Arithmetic Mean 22.3 13.7Standard Deviation 22.2 15.5Correlation 0.9 -Beta 1.3 -Sharpe Ratio 0.7 0.4Sortino Ratio 1.4 0.9Alpha 4.5 -Tracking Error 10.4 -Information Ratio 0.8 -Treynor Ratio 11.9 -
Past performance may or may not be sustained in future. Return/investment value are as ofJun 30, 2016. Returns are on a compounded annual basis for period more than one year and absolutefor one-year period and computed using NAV of Regular Plan-Growth Option. Value of 10,000invested at inception is as on Jun 30, 2016. SIP values are in rupees. Performance Analysis onannualized basis except Beta and Correlation. The risk free Index is MIBOR Overnight.
Fund Facts: An open-end equity scheme • Launch: September 2005 (pertains to Sundaram Capex Opportunities Fund) • Bloomberg: SUNCAPG IN • Plans: Regular & Direct • Options: Growth, Dividend Pay Out, Dividend Sweep, Dividend Re-Investment• Minimum Amount: 1,00,000 • SIP/STP: Weekly 1000, Monthly 250, Quarterly 750 Terms of offer: NAV Exit Load: 1% if redeemed within 12 months from date of allotment. S Krishnakumar & S Bharath were jointly managing the fund till March31, 2015. Disclaimer: The dividend portfolio of Sundaram Capex Opportunities has been merged into the growth portfolio of the Scheme and then converted into a new thematic scheme named Sundaram Infrastructure Advantage Fund with separategrowth and dividend options and a common portfolio for both options w.e.f. April 07, 2014. Sundaram Energy Opportunities Fund merged into Sundaram Infrastructure Advantage Fund w.e.f. April 15, 2014. Asset Allocation graph as per AMFI IndustryClassification. Sundaram Capex Opportunities has declared a total of 5 dividends with a total quantum of 105% since its inception (Sep 2005) till the merger. * Fund NAV is as of last working day of the given month. For Product Labels, please referPage 2. Disclosures: Page 39.
www.sundarammutual.com June 2016 Page 14 Sundaram Mutual FundDesigned by Morningstar

Sundaram Financial Services OpportunitiesPositioning : Financial ServicesBenchmark : Nifty Bank PR IndexFund Manager : Shiv ChananiShiv Chanani has experience of 12 years and managing thisfund since Apr 2015
Investment ObjectiveSeek capital appreciation by investing predominantly inequity and equity related securities of indian companiesengaged in banking and financial Services.
Active Industry Bets versus BenchmarkOverweight Underweight
FinanceServices
Banks
Industry Classification (%)
7.9
-2.0
0.1
14.5
79.5
-... -... -...-7 20 47 74
1... 1... 1...
Cash,Call & NCA
Derivatives
Services
Finance
Banks
Active Stock Allocation versus BenchmarkOverweight Underweight
Ujjivan Financial ServicesLtdMax Financial ServicesLIC Housing FinanceIDFCEquitas Holding Ltd
HDFC BankICICI BankAxis BankState Bank of IndiaIndusInd Bank
Weighted Avg Market Cap: 1,32,479 Cr.Median Market Cap: 18,951 Cr.Avg AUM: 128 Cr.Month End AUM: 130 Cr.
Dividend History: Refer page 37 & 38
PortfolioSecurity WeightHDFC Bank 24.0ICICI Bank 14.8Kotak Mahindra Bank 8.8Axis Bank 8.2State Bank of India 6.2IndusInd Bank 5.1Yes Bank 4.3Ujjivan Financial Services Ltd 3.1Max Financial Services 2.5Bank of Baroda 2.0
LIC Housing Finance 1.9IDFC 1.8Equitas Holding Ltd 1.6SBBJ 1.6DCB Bank 1.5Repco Home Finance 1.5Indian Bank 1.4ICRA 1.2IDFC Bank 1.0Rural Electrification 0.8
Punjab National Bank 0.6Max India Ltd 0.1Max Venture and Industries Ltd 0.1
Equity 94.1Derivatives -2.0Cash,Call & NCA 7.9
No of Stocks 23Turnover Ratio (%) 212
NAV*: Regular-Growth: 29.0150 Dividend: 16.5145NAV*: Direct-Growth: 29.4780 Dividend: 16.8297
PerformancePerformance Period NAV per
Unit ( )Fund(%)
Benchmark(%)
Nifty 50(%) ExcessPoints
Since Inception - 14.1 15.0 8.0 -0.930/06/2015 to 30/06/2016 29.02 1.3 -2.0 -1.0 3.330/06/2014 to 30/06/2015 28.64 19.5 20.0 10.0 -0.630/06/2013 to 30/06/2014 23.98 28.6 31.2 30.3 -2.6Last 3 years - 15.9 15.6 12.4 0.3Last 5 years - 7.9 9.8 8.0 -1.9Last 8 years - 14.1 17.2 9.4 -3.1
10,000 investedPeriod Fund Benchmark Nifty 50Since Inception 29,015 30,847 18,625Last 3 years 15,563 15,439 14,186Last 5 years 14,647 15,950 14,675Last 8 years 28,819 35,678 20,511
Growth of 10,000 Fund Benchmark Additional Benchmark
0
10000
20000
30000
Jun 08 Jun 12 Jun 16
Value of 10,000-a-month SIPPeriod Investment Fund Benchmark Nifty 50Since Inception Returns (%) - 12.78 14.32 10.03Since Inception 9,60,000 16,21,639 17,28,980 14,46,815Last 7 years 8,40,000 12,40,951 12,95,330 11,52,292Last 5 years 6,00,000 8,40,727 8,52,031 7,75,087Last 3 years 3,60,000 4,55,308 4,44,077 4,06,397Last 2 years 2,40,000 2,59,634 2,51,358 2,45,891Last 1 year 1,20,000 1,31,888 1,27,922 1,25,632
Performance Analysis (Based on monthly 3 Yrs returns)Fund Nifty 500
Arithmetic Mean 18.2 15.8Standard Deviation 26.4 15.7Correlation 0.9 -Beta 1.5 -Sharpe Ratio 0.4 0.6Sortino Ratio 0.7 1.3Alpha -6.2 -Tracking Error 13.6 -Information Ratio 0.0 -Treynor Ratio 6.2 -
Past performance may or may not be sustained in future. Returns/investment value are as ofJun 30, 2016. Returns are on a compounded annual basis for period more than one year and absolutefor one-year period and computed using NAV of Regular Plan-Growth Option. Value of 10,000invested at inception is as on Jun 30, 2016. SIP values are in rupees. Performance Analysis onannualized basis except Beta and Correlation. The risk free Index is MIBOR Overnight. Risk Measuresare calculated based on Nifty 500 Index.
Fund Facts: An open-ended Financial Services sector scheme • Launch: June 2008 • Bloomberg: SNDFSRG IN • Plans: Regular & Direct • Options: Growth, Dividend Pay Out, Dividend Sweep, Dividend Re-Investment • Minimum Amount: 1,00,000• SIP/STP: Weekly 1000, Monthly 250, Quarterly 750 Terms of offer: NAV Exit Load: 1% - If redeemed / switched out within 12 months from the date of allotment. NIL - If redeemed / switched out after 12 months from the date of allotment w.e.f.November 20, 2015. J Venkatesan was the fund manager for the fund till March 31, 2015. The scheme has been converted into sector fund effective from 01-Aug-2013. Asset Allocation graph as per AMFI Industry Classification.* Fund NAV is as of lastworking day of the given month. For Product Labels, please refer Page 2. Disclosures: Page 39.
www.sundarammutual.com June 2016 Page 15 Sundaram Mutual FundDesigned by Morningstar

Sundaram Entertainment OpportunitiesPositioning : EntertainmentBenchmark : Nifty Media IndexFund Manager : Shiv Chanani
Avinash AgarwalShiv Chanani has experience of 12 years and managing thisfund since Oct 2013 Avinash Agarwal has experience of 10years and is managing this fund since Apr 2015
Investment ObjectiveTo achieve long term capital appreciation by investingprimarily in the equity and equity related instruments ofcompanies that focus on opportunities in the entertainmentbusiness.
Active Industry Bets versus BenchmarkOverweight Underweight
Hotels, Resorts And OtherRecreational ActivitiesRetailingConsumer Non Durables
Media & Entertainment
Industry Classification (%)
13.7
0.5
0.1
0.7
1.0
2.1
2.3
2.4
3.8
4.5
5.9
8.5
54.5
0 18 36 54 72 90...
Cash,Call & NCA
Derivatives
Gas
Services
Consumer Durables
Construction
Telecom - Services
Software
Textile Products
Consumer Non Durables
Retailing
Hotels, Resorts & Other Recr.
Media & Entertainment
Active Stock Allocation versus BenchmarkOverweight Underweight
TrentINOX LeisureIndian Hotels CoEIHShemaroo Entertainment
Zee EnterainmentSun TV NetworkDish TV IndiaD B CorpTV18 Broadcast
Weighted Avg Market Cap: 11,800 Cr.Median Market Cap: 4,332 Cr.Avg AUM: 31 Cr.Month End AUM: 32 Cr.
Dividend History: Refer page 37 & 38
PortfolioSecurity WeightZee Enterainment 17.9PVR 4.8INOX Leisure 4.5Dish TV India 3.8TV18 Broadcast 3.5Jagran Prakashan 3.4T.V. Today Network 2.8Trent 2.6Sun TV Network 2.3Indian Hotels Co 2.2
EIH 2.1Network 18 Media & Inv 2.1Shemaroo Entertainment 2.0Mahindra Holidays 1.9Info Edge (India) 1.9HT Media 1.8Bharti Retail 1.8New Delhi Television 1.7Phoenix Mills 1.6Raymond 1.5
Den Networks 1.4K.P.R. Mill 1.3Shoppers Stop 1.3Hathway Cable & Datacom 1.3Coffee Day Enterprises 1.3Tata Communications 1.2United Spirits 1.2D B Corp 1.2Westlife Development 1.2OnMobile Global 1.1
United Breweries 1.1Talwalkars 1.1Whirlpool of India 1.0Tata Global Beverages 1.0Indian Terrain Fashions 1.0Max Venture and Industries Ltd 0.7Brigade Enterprises 0.5Mastek 0.4Future Enterprises 0.3Mahanagar Gas Ltd 0.1
Equity 85.8Derivatives 0.5Cash,Call & NCA 13.7
No of Stocks 40Turnover Ratio (%) 40
NAV*: Regular-Growth: 21.0878 Dividend: 15.4371NAV*: Direct-Growth: 21.3729 Dividend: 15.6359
PerformancePerformance Period NAV per
Unit ( )Fund(%)
Benchmark(%)
Nifty 50(%) ExcessPoints
Since Inception - 9.7 5.4 7.7 4.330/06/2015 to 30/06/2016 21.09 14.2 17.7 -1.0 -3.430/06/2014 to 30/06/2015 18.46 7.1 5.7 10.0 1.430/06/2013 to 30/06/2014 17.23 37.9 27.9 30.3 10.0Last 3 years - 19.0 16.7 12.4 2.3Last 5 years - 8.1 13.1 8.0 -5.0Last 8 years - 9.7 7.3 9.4 2.4
10,000 investedPeriod Fund Benchmark Nifty 50Since Inception 21,088 15,249 18,125Last 3 years 16,875 15,903 14,186Last 5 years 14,779 18,499 14,675Last 8 years 20,964 17,528 20,511
Growth of 10,000 Fund Benchmark Additional Benchmark
0
10000
20000
Jun 08 Jun 12 Jun 16
Value of 10,000-a-month SIPPeriod Investment Fund Benchmark Nifty 50Since Inception Returns (%) - 10.75 13.33 10.03Since Inception 9,60,000 14,91,056 16,58,652 14,46,815Last 7 years 8,40,000 12,30,586 13,26,757 11,52,292Last 5 years 6,00,000 8,78,192 9,17,186 7,75,087Last 3 years 3,60,000 4,57,490 4,60,997 4,06,397Last 2 years 2,40,000 2,72,083 2,78,425 2,45,891Last 1 year 1,20,000 1,29,347 1,31,660 1,25,632
Performance Analysis (Based on monthly 3 Yrs returns)Fund Nifty 500
Arithmetic Mean 19.2 15.8Standard Deviation 18.1 15.7Correlation 0.8 -Beta 1.0 -Sharpe Ratio 0.7 0.6Sortino Ratio 1.4 1.3Alpha 3.7 -Tracking Error 9.6 -Information Ratio 0.4 -Treynor Ratio 13.0 -
Past performance may or may not be sustained in future. Returns/investment value are as ofJun 30, 2016. Returns are on a compounded annual basis for period more than one year and absolutefor one-year period and computed using NAV of Regular Plan-Growth Option. Value of 10,000invested at inception is as on Jun 30, 2016. SIP values are in rupees. Performance Analysis onannualized basis except Beta and Correlation. The risk free Index is MIBOR Overnight. Risk Measuresare calculated based on Nifty 500 Index.
Fund Facts: An open-ended Media and Entertainment sector scheme • Launch: June 2008 • Bloomberg: SNDEORG IN • Plans: Regular & Direct • Options: Growth, Dividend Pay Out, Dividend Sweep, Dividend Re-Investment • Minimum Amount: 1,00,000 • SIP/STP: Weekly 1000, Monthly 250, Quarterly 750 Terms of offer: NAV Exit Load: 1% if redeemed within 12 months from date of allotment. Fund Facts: An open-ended Media and Entertainment sector scheme • Launch: June 2008• Bloomberg: SNDEORG IN • Plans: Regular & Direct • Options: Growth, Dividend Pay Out, Dividend Sweep, Dividend Re-Investment • Minimum Amount: 5,000 • SIP/STP: Weekly 1000, Monthly 250, Quarterly 750 Terms of offer: NAV ExitLoad: 1% if redeemed within 12 months from date of allotment. J Venkatesan & Shiv Chanani were jointly managing the fund till March 31, 2015. The scheme has been converted into sector fund effective from 01-Aug-2013. Asset Allocation graph asper AMFI Industry Classification. * Fund NAV is as of last working day of the given month.* Fund NAV is as of last working day of the given month. For Product Labels, please refer Page 2. Disclosures: Page 39.
www.sundarammutual.com June 2016 Page 16 Sundaram Mutual FundDesigned by Morningstar

Sundaram PSU OpportunitiesPositioning : Public SectorBenchmark : S&P BSE PSU IndexFund Manager : Shiv Chanani
Avinash AgarwalShiv Chanani has experience of 12 years and managing thisfund since Oct 2013 Avinash Agarwal has experience of 10years and is managing this fund since Apr 2015
Investment ObjectiveThe fund seeks capital appreciation by investing in equity andequity-related securities of public sector companies to theextent of at least 65%. The fund may also invest in bondsand other fixed-income instruments issued by public sectorentities. Under normal circumstances, cash may be deployedin fixed income and money market instruments. Exposure tooverseas securities shall not exceed 35% of assets and shallbe only related to the theme.
Active Industry Bets versus BenchmarkOverweight Underweight
FinanceGasPetroleum Products
Minerals/MiningBanksOil
Industry Classification (%)
6.1
0.9
1.0
1.2
1.2
1.4
1.6
4.7
6.9
8.1
8.4
10.7
14.8
15.9
17.2
0 6 12 18 24 30 36
Cash,Call & NCA
Fertilisers
Paper
Telecom - Services
Chemicals
Transportation
Engineering Services
Industrial Capital Goods
Oil
Minerals/Mining
Gas
Finance
Power
Banks
Petroleum Products
Active Stock Allocation versus BenchmarkOverweight Underweight
Ujjivan Financial ServicesLtdIndraprastha GasIndian BankHindustan PetroleumGujarat State Petronet
ONGCCoal IndiaState Bank of IndiaBharat Petroleum CorpNMDC
Weighted Avg Market Cap: 68,756 Cr.Median Market Cap: 11,977 Cr.Avg AUM: 80 Cr.Month End AUM: 83 Cr.
Dividend History: Refer page 37 & 38
PortfolioSecurity WeightCoal India 8.1Indian Oil Corp 7.9State Bank of India 7.7NTPC 6.6Ujjivan Financial Services Ltd 5.8ONGC 5.2Hindustan Petroleum 4.8Power Grid 4.5Indian Bank 3.4Indraprastha Gas 3.0
GAIL India 2.8Bharat Petroleum Corp 2.6Gujarat State Petronet 2.6Power Finance 2.5PTC India 1.9Bharat Heavy Electricals 1.8Bharat Electronics 1.8CARE 1.8Bank of Baroda 1.7Dredging Corp of India 1.6
Balmer Lawrie & Company 1.4Punjab National Bank 1.3Oil India 1.3SBBJ 1.2Gujarat Narmada Valley 1.2NHPC 1.2Tata Communications 1.2BEML 1.0TNPL 1.0Chennai Petroleum Corp 0.9
Mangalore Refinery 0.9Rashtriya Chemicals 0.9Neyveli Lignite Corp 0.7Oriental Bank of Commerce 0.6IDFC 0.6Seamec 0.5Mahanagar Gas Ltd 0.0
Equity 94.0Cash,Call & NCA 6.0
No of Stocks 37Turnover Ratio (%) 35
NAV*: Regular-Growth: 11.6191 Dividend: 10.5798NAV*: Direct-Growth: 11.7992 Dividend: 10.7511
PerformancePerformance Period NAV per
Unit ( )Fund(%)
Benchmark(%)
Nifty 50(%) ExcessPoints
Since Inception - 2.4 -5.7 7.3 8.030/06/2015 to 30/06/2016 11.62 -1.9 -12.0 -1.0 10.230/06/2014 to 30/06/2015 11.84 0.5 -11.5 10.0 12.030/06/2013 to 30/06/2014 11.79 37.1 40.1 30.3 -3.0Last 3 years - 10.5 2.9 12.4 7.6Last 5 years - 1.4 -4.7 8.0 6.1
10,000 investedPeriod Fund Benchmark Nifty 50Since Inception 11,619 6,848 15,788Last 3 years 13,508 10,898 14,186Last 5 years 10,735 7,862 14,675
Growth of 10,000 Fund Benchmark Additional Benchmark
0
5000
10000
15000
Jan 10 Apr 13 Jun 16
Value of 10,000-a-month SIPPeriod Investment Fund Benchmark Nifty 50Since Inception Returns (%) - 4.26 -2.73 8.99Since Inception 7,70,000 8,84,296 7,04,730 10,31,207Last 5 years 6,00,000 7,02,574 5,81,903 7,75,087Last 3 years 3,60,000 4,14,881 3,58,593 4,06,397Last 2 years 2,40,000 2,46,119 2,21,736 2,45,891Last 1 year 1,20,000 1,28,284 1,21,948 1,25,632
Performance Analysis (Based on monthly 3 Yrs returns)Fund Nifty 500
Arithmetic Mean 12.5 15.8Standard Deviation 22.7 15.7Correlation 0.9 -Beta 1.3 -Sharpe Ratio 0.2 0.6Sortino Ratio 0.4 1.3Alpha -7.6 -Tracking Error 11.7 -Information Ratio -0.4 -Treynor Ratio 3.2 -
Past performance may or may not be sustained in future. Returns/investment value are as ofJun 30, 2016. Returns are on a compounded annual basis for period more than one year and absolutefor one-year period and computed using NAV of Regular Plan-Growth Option. Value of 10,000invested at inception is as on Jun 30, 2016. SIP values are in rupees. Performance Analysis onannualized basis except Beta and Correlation. The risk free Index is MIBOR Overnight. Risk Measuresare calculated based on Nifty 500 Index.
Fund Facts: An open-end equity scheme • Launch: January 2010 • Bloomberg: SNDPSUG IN • Plans: Regular & Direct • Options: Growth, Dividend Pay Out, Dividend Sweep, Dividend Re-Investment • Minimum Amount: 1,00,000 • SIP/STP: Weekly 1000, Monthly 250, Quarterly 750 Terms of offer: NAV Exit Load: Is Nil. J Venkatesan & Shiv Chanani were jointly managing the fund till March 31, 2015. The scheme benchmark has been changed to S&P BSE PSU Index from CNX PSE Index w.e.f.
01-August-2013. Asset Allocation graph as per AMFI Industry Classification.* Fund NAV is as of last working day of the given month. For Product Labels, please refer Page 2. Disclosures: Page 39.
www.sundarammutual.com June 2016 Page 17 Sundaram Mutual FundDesigned by Morningstar

Sundaram Global AdvantagePositioning : Thematic-Overseas Investment
Benchmark : MSCI EM Index
Fund Manager : Avinash Agarwal
Fund Adviser : Fund Quest, a member of BNP Paribas Investment Partners
Investment ObjectiveTo achieve capital appreciation by investing in units of overseas mutual funds and exchangetraded funds, domestic money market instruments. Income generation may only be asecondary objective.
Salient Features• 100% in global markets (an India allocation is possible based on outlook)• Actively managed diversified multi-manager portfolio• Advisor is FundQuest, a Investment Partner• Exposure to multiple asset classes through mutual funds & exchange-traded funds• Allocation across global emerging equities, commodities & real estate.• Exposure in ETFs that track an index of companies in the real estate business and in
commodities and not an index that tracks real-estate and commodities directly• Active bets within each asset class based on economy & market outlook• Complementary strategies to lower volatility and fund manager risk• Emerging Markets: • Neutral 70% • Minimum 60% • Maximum 100%• Real Estate: • Neutral 15% • Minimum 0% • Maximum 40%• Commodities: • Neutral 15% • Minimum 0% • Maximum 40%
Dividend History: Refer page 37 & 38
NAV*: Regular-Growth: 13.4158 Dividend: 11.5013
NAV*: Direct-Growth: 13.6396 Dividend: 12.3154
PerformancePerformance Period NAV per
Unit ( )Fund(%)
Benchmark(%)
Nifty 50(%) ExcessPoints (%)
Since Inception - 3.3 3.2 8.0 0.230/06/2015 to 30/06/2016 13.42 -6.1 -9.1 -1.0 2.930/06/2014 to 30/06/2015 14.30 -7.7 -2.0 10.0 -5.730/06/2013 to 30/06/2014 15.49 12.3 13.1 30.3 -0.8Last 3 years - -0.9 0.3 12.4 -1.2Last 5 years - 2.4 1.9 8.0 0.5Last 8 years - 2.7 2.3 9.4 0.3
10,000 investedPeriod Fund Benchmark Nifty 50Since Inception 13,378 13,176 19,779Last 3 years 9,721 10,075 14,186Last 5 years 11,237 10,987 14,675Last 8 years 12,333 12,036 20,511
Asset Allocation (%)Asset Class/Geography Neutral Current
Asia 40.00 52.02Latin America 15.00 6.62Eastern Europe 15.00 9.87Commodity Funds 15.00 5.77Real Estate Funds 15.00 19.53Cash 0.00 6.20Total 100.00 100.00
Funds owning stocks of commodity companies and funds owning stocks of real estate companies are used to invest in therespective asset classes.
Fund-of-Funds PortfolioFund Weight
Emerging Europe
Nevsky Eastern European Europe 5.44
Parvest World Energy Europe 4.43
Fidelity South East Asia Asia 19.14
DB Tracker Emerging Markets Asia 18.01
Templeton Asia Asia 14.86
Parvest Latin America Latam 0.00
DB Tracker Latin America Latam 6.62
Real Estate (Funds owning stocks of real estate companies, not real estate)
Morgan Stanley Asian Property REIT 11.06
Morgan Stanley Global Property REIT 8.47
Commodities (Funds owning stocks of commodity companies, not commodities)
First State Global Resources GSCI 5.77
Sub-funds Total 93.8
Cash 6.2
Average AUM: 22 Cr.
Month End AUM: 22 Cr.
Past performance may or may not be sustained in future. Returns/investment value are as of Jun 30, 2016. Returnsare on a compounded annual basis for period more than one year and absolute for one-year period and computed using NAVof Regular Plan-Growth Option. Value of 10,000 invested at inception is as on Jun 30, 2016.
Fund Facts: Open-end fund-of-funds scheme • Launch: September 2007 • Bloomberg: SNDGADG IN • Plans: Regular & Direct • Options: Growth, Dividend Pay Out, Dividend Sweep, Dividend Re-Investment • Minimum Amount: 5,000 • SIP/STP:Weekly 1000, Monthly 250, Quarterly 750 Terms of offer: NAV Exit Load: 1% if redeemed within 12 months from date of allotment. MIBOR Overnight Benchmark being used for Calculation. Asset Allocation graph as per AMFI Industry Classification.*Fund NAV is as of last working day of the given month.For Product Labels, please refer Page 2. Disclosures: Page 39.
www.sundarammutual.com June 2016 Page 18 Sundaram Mutual FundDesigned by Morningstar

Sundaram Equity PlusPositioning : Large-Cap Equity with a Dash
of Gold ETFBenchmark : Domestic Price of Gold Index
(35%)Nifty 50 Index (65%)
Fund Manager : Shiv ChananiShiv Chanani has experience of 12 years and managing thisfund since Jan 2013
Investment ObjectiveSeek capital appreciation by investing in equity and equity-related instruments listed in India to the extent of at least65% and in gold-ETF up to 35%. Investment in overseasmarkets, if any, shall not exceed the permissible limit net ofexisting usage of the mutual fund’s entitlement. Exposure tooverseas securities shall also not exceed 35% of assets.
Industry Classification (%)
0.2
31.8
0.9
0.9
1.2
2.0
2.3
2.4
3.0
5.0
5.4
6.5
8.1
12.9
17.4
0 11 22 33 44 55 66
Cash,Call & NCA
ETFs
Auto Ancillaries
Minerals/Mining
Telecom - Services
Cement
Power
Pharmaceuticals
Construction Project
Finance
Auto
Petroleum Products
Consumer Non Durables
Software
Banks
Weighted Avg Market Cap: 1,31,295 Cr.Median Market Cap: 1,37,952 Cr.Avg AUM: 50 Cr.Month End AUM: 50 Cr.
Dividend History: Refer page 37 & 38
PortfolioSecurity WeightInfosys 6.7HDFC Bank 6.4HDFC 5.0ITC 4.4Reliance Industries 3.8ICICI Bank 3.3Tata Consultancy Services 3.0Larsen & Toubro 3.0State Bank of India 2.6NTPC 2.3
Hindustan Unilever 2.3Kotak Mahindra Bank 2.3Mahindra & Mahindra 2.3Axis Bank 2.1UltraTech Cement 2.0Indian Oil Corp 2.0Maruti Suzuki India 1.7Wipro 1.7HCL Technologies 1.5Tata Motors Class A 1.4
Asian Paints 1.4Bharti Airtel 1.2Dr Reddy's Laboratories 1.0Coal India 0.9Bosch 0.9Lupin 0.8IndusInd Bank 0.7Bharat Petroleum Corp 0.6Sun Pharmaceuticals Indus 0.6
Equity 68.0ETFs 31.8Cash,Call & NCA 0.2
No of Stocks 29Turnover Ratio (%) 36
NAV*: Regular-Growth: 13.5611 Dividend: 12.4841NAV*: Direct-Growth: 13.8823 Dividend: 12.7664
PerformancePerformance Period NAV per
Unit ( )Fund(%)
Benchmark(%)
Nifty 50(%) ExcessPoints
Since Inception - 6.2 7.9 8.8 -1.830/06/2015 to 30/06/2016 13.56 2.1 3.9 -1.0 -1.930/06/2014 to 30/06/2015 13.29 5.2 4.7 10.0 0.530/06/2013 to 30/06/2014 12.63 19.4 22.5 30.3 -3.1Last 3 years - 8.6 10.1 12.4 -1.4Last 5 years - 6.2 7.6 8.0 -1.4
10,000 investedPeriod Fund Benchmark Nifty 50Since Inception 13,561 14,767 15,362Last 3 years 12,823 13,334 14,186Last 5 years 13,540 14,421 14,675
Growth of 10,000 Fund Benchmark Additional Benchmark
0
5000
10000
15000
May 11 Dec 13 Jun 16
Value of 10,000-a-month SIPPeriod Investment Fund Benchmark Nifty 50Since Inception Returns (%) - 6.23 7.49 10.11Since Inception 6,10,000 7,15,674 7,39,147 7,89,908Last 5 years 6,00,000 7,02,150 7,24,715 7,75,087Last 3 years 3,60,000 3,93,209 4,00,579 4,06,397Last 2 years 2,40,000 2,48,912 2,53,725 2,45,891Last 1 year 1,20,000 1,26,273 1,28,631 1,25,632
Performance Analysis (Based on monthly 3 Yrs returns)Fund Benchmark
Arithmetic Mean 8.7 10.0Standard Deviation 8.4 8.8Correlation 0.9 -Beta 0.9 -Sharpe Ratio 0.3 0.4Sortino Ratio 0.6 1.1Alpha -0.4 -Tracking Error 3.0 -Information Ratio -0.5 -Treynor Ratio 2.5 -
Past performance may or may not be sustained in future. Returns/investment value are as ofJun 30, 2016. Returns are on a compounded annual basis for period more than one year and absolutefor one-year period and computed using NAV of Regular Plan-Growth Option. Value of 10,000invested at inception is as on Jun 30, 2016. SIP values are in rupees. Performance Analysis onannualized basis except Beta and Correlation. The risk free Index is MIBOR Overnight.
Fund Facts: A Open-ended Equity Scheme • Launch: May 2011 • Bloomberg code: SUNEQPG IN EQUITY • Plans: Regular & Direct • Options: Growth, Dividend Payout, Dividend Reinvestment • Minimum amount: 5,000 • SIP: Weekly 1,000, Monthly, 250, Quarterly 750 • Terms of offer: NAV • Exit Load: 1% if redeemed within 12 months from the date of allotment. Asset Allocation graph as per AMFI Industry Classification. The Benchmark for Equity Plus is 65% Nifty 50 and 35% price of gold.
The Price of gold has hitherto been taken from the spot prices quoted at MCX. However following the jeweller’s strike effective 9 March 2016 there have been no spot quotes for price of gold on MCX. Hence we have taken the daily quotes of the April5 Futures contracts on MCX as substitute for the spot gold prices from 9 March 2016. * Fund NAV is as of last working day of the given month. For Product Labels, please refer Page 2. Disclosures: Page 39.
www.sundarammutual.com June 2016 Page 19 Sundaram Mutual FundDesigned by Morningstar

Sundaram Select Micro Cap Series I-VPositioning : Pure Micro Cap Fund
Benchmark : S&P BSE Smallcap Index
Fund Manager : S KrishnakumarAvinash Agarwal
S Krishnakumar has experience of 16 years and is managing this fundsince Jan 2014 Avinash Agarwal has experience of 10 years and ismanaging this fund since Apr 2015
Investment ObjectiveTo seek capital appreciation by investing predominantly in equity/equity-related instruments of companies that can be termed as micro-caps. Acompany whose market capitalisation is equal to or lower than that of the301st stock by market cap on the NSE at the time of investment will beconsidered to be in micro-cap category.
NAV*Series I
Growth DividendRegular 25.9646 15.8842Direct 26.7352 16.4788
Series IIGrowth Dividend
Regular 25.9044 15.8261Direct 26.6120 16.3856
Series IIIGrowth Dividend
Regular 25.3884 15.4927Direct 26.0476 16.0183
Series IVGrowth Dividend
Regular 24.1010 14.1673Direct 24.6982 14.6328
Series VGrowth Dividend
Regular 14.9415 13.3384Direct 15.2362 13.6263
Portfolio
Security Weight
SeriesI
SeriesII
SeriesIII
SeriesIV
KSB Pumps 5.4 5.3 5.4 5.4HeidelbergCement India 5.4 5.4 5.4 5.2Timken India 4.9 4.9 4.9 4.9Grindwell Norton 4.6 4.6 4.6 4.6Hitachi Home & Life 4.6 4.6 4.6 4.6ELANTAS Beck India 3.8 3.8 3.8 3.8Honeywell Automation 3.8 3.8 3.8 3.5Ador Welding 3.6 3.6 3.6 3.6Schneider Electric Infr 3.5 3.4 3.5 3.5Ingersoll Rand (India) 3.3 3.4 3.5 3.5
BASF India 3.2 3.2 3.2 3.2NRB Bearings 3.0 3.0 3.0 3.0JK Cement 2.8 2.8 2.8 2.8Mahindra CIE Automotive 2.8 2.8 2.8 2.8Novartis India 2.5 2.5 2.5 2.5Take Solutions 2.3 2.3 2.3 2.3Vesuvius India 2.2 2.2 2.2 2.2Salzer Electronics 2.0 2.0 2.0 2.0Blue Star 2.0 2.0 2.1 2.0DCB Bank 1.9 1.9 1.9 2.0
BEML 1.9 1.9 1.9 1.9Alstom India 1.9 1.8 1.9 1.8Ujjivan Financial Services Ltd 1.7 1.7 1.7 1.7Goodyear India 1.6 1.6 1.7 1.7Repco Home Finance 1.6 1.6 1.6 1.4SML Isuzu 1.5 1.4 1.5 1.5INOX Leisure 1.5 1.5 1.5 1.5ITD Cementation India 1.4 1.4 1.4 1.4HSIL 1.3 1.3 1.3 1.3Accelya Kale Solutions 1.3 1.2 1.2 1.2
SQS India BFSI 1.3 1.3 1.3 1.3Monsanto India 1.2 1.2 1.2 0.8Insecticides (India) 1.1 1.1 1.0 1.0ZF Steering Gear (India) 1.1 1.1 1.1 1.1Godfrey Phillips India 1.1 1.1 1.1 1.0Navkar Corporation 0.9 0.9 0.9 0.9Subros 0.9 0.9 0.9 0.9Kennametal India 0.9 0.9 0.9 0.9Shree Pushkar Chemicals 0.9 0.9 0.9 0.9INEOS Styrolution India 0.9 0.9 0.9 0.9
Sterlite Technologies 0.7 0.7 0.7 0.7Easun Reyrolle 0.7 0.6 0.6 0.6Accel Frontline 0.6 0.6 0.6 0.6Gillette India 0.6 0.6 0.6 0.6Merck 0.6 0.6 0.5 0.6Sundaram Fasteners 0.5 0.5 0.5 2.0Sterlite Power Transmission Ltd 0.2 0.2 0.2 0.2
Security Weight
SeriesV
Himatsingka Seide 6.0V-Guard Industries 4.5PVR 4.2Navin Fluorine Intl 3.8Heritage Foods 3.7Grindwell Norton 3.6Blue Star 3.5Timken India 3.2JK Cement 3.2Century Plyboards (India) 3.2
Praj Industries 2.9Ashoka Buildcon 2.8MM Forgings 2.6India Cements 2.6DCB Bank 2.4Ador Welding 2.4Greaves Cotton 2.3Rane Holdings 2.2E I D Parry India 2.2Madhucon Projects 2.2
PNC Infratech 2.0Salzer Electronics 2.0Repco Home Finance 1.9HT Media 1.8HSIL 1.8KSB Pumps 1.7Can Fin Homes 1.7Ujjivan Financial Services Ltd 1.7Alstom India 1.7Shanthi Gears 1.6
Premier Explosives 1.4Texmaco Rail & Eng 1.4Gateway Distriparks 1.3Techno Electric & Eng Co 1.2Sundaram Fasteners 1.2PTC India 1.2Navkar Corporation 1.1WPIL 1.1Sterlite Technologies 1.0Insecticides (India) 1.0
Shree Pushkar Chemicals 0.9Subros 0.9Gammon Infrastructure 0.9Hitachi Home & Life 0.8Kennametal India 0.6Sterlite Power Transmission Ltd 0.3ZF Steering Gear (India) 0.1
Equity 97.6 97.4 97.6 98.2Cash,Call & NCA 2.4 2.6 2.4 1.8
Equity 98.1Cash,Call & NCA 1.9
No of Stocks 47 47 47 47 No of Stocks 47
Avg AUM ( Cr) 107 70 59 44Month End AUM ( Cr) 112 74 62 46Turnover Ratio (%) 26.66 26.54 25.98 27.12
Avg AUM ( Cr) 171Month End AUM ( Cr) 178Turnover Ratio (%) 28.90
Fund Facts: Sundaram Select Micro Cap (Series I-IV) tenure : 5 years Sundaram Select Microcap (Series V) tenure is 42 Months • Launch: Series-I-January 2014, Series-II-January 2014, Series-III-February 2014, Series-IV-March 2014, Series-V-September2014 • Bloomberg: Select Micro Cap - Series 1-SSMC1RG IN EQUITY, Select Micro Cap - Series 2-SSMC2RG IN EQUITY, Select Micro Cap - Series 3- SSMC3RG IN EQUITY, Select Micro Cap - Series 4- SSMC4RG IN EQUITY, Select Micro Cap - Series5- SSMC5RG IN EQUITY• Plans: Regular & Direct • Options: Growth, Dividend Pay Out • Exit Load: Nil.* Fund NAV is as of last working day of the given month.For Product Labels, please refer Page 2. Disclosures: Page 39.
www.sundarammutual.com June 2016 Page 20 Sundaram Mutual FundDesigned by Morningstar

Sundaram Select Micro Cap Series VI-XPositioning : Pure Micro Cap Fund
Benchmark : S&P BSE Smallcap Index
Fund Manager : S KrishnakumarAvinash Agarwal
S Krishnakumar has experience of 16 years and is managing this fundsince Jan 2014 Avinash Agarwal has experience of 10 years and ismanaging this fund since Apr 2015
Investment ObjectiveTo seek capital appreciation by investing predominantly in equity/equity-related instruments of companies that can be termed as micro-caps. Acompany whose market capitalisation is equal to or lower than that of the301st stock by market cap on the NSE at the time of investment will beconsidered to be in micro-cap category.
NAV*Series VIGrowth Dividend
Regular 13.1980 12.7018Direct 13.4399 12.9415
Series VIIGrowth Dividend
Regular 13.0228 12.5268Direct 13.2273 12.7358
Series VIIIGrowth Dividend
Regular 11.2361 11.2361Direct 11.2769 11.2769
Series IXGrowth Dividend
Regular 11.1946 11.1946Direct 11.2319 11.2319
Series XGrowth Dividend
Regular 11.1610 11.1610Direct 11.1888 11.1888
Portfolio
Security Weight
SeriesVI
SeriesVII
Himatsingka Seide 5.9 5.9V-Guard Industries 4.5 4.5PVR 4.2 4.2Timken India 3.7 3.7Heritage Foods 3.7 3.7Blue Star 3.7 3.6Grindwell Norton 3.7 3.5Navin Fluorine Intl 3.5 3.4Century Plyboards (India) 3.2 3.3JK Cement 3.1 3.0
Praj Industries 3.0 3.0Ashoka Buildcon 2.8 2.8India Cements 2.6 2.6DCB Bank 2.5 2.4Ador Welding 2.4 2.4MM Forgings 2.4 2.3E I D Parry India 2.3 2.4Greaves Cotton 2.3 2.3Rane Holdings 2.2 2.3Madhucon Projects 2.2 2.2
PNC Infratech 2.0 2.0Repco Home Finance 1.9 1.9Salzer Electronics 1.9 1.9Can Fin Homes 1.7 1.7Ujjivan Financial Services Ltd 1.7 1.7HT Media 1.7 1.7HSIL 1.7 1.8Alstom India 1.7 1.6Shanthi Gears 1.6 1.6KSB Pumps 1.5 1.6
Premier Explosives 1.5 1.5Texmaco Rail & Eng 1.4 1.4PTC India 1.4 1.3Gateway Distriparks 1.3 1.3Techno Electric & Eng Co 1.3 1.3WPIL 1.1 1.1Navkar Corporation 1.1 1.1Sterlite Technologies 1.0 0.9Sundaram Fasteners 1.0 1.2Insecticides (India) 1.0 1.0
Shree Pushkar Chemicals 0.9 0.9Subros 0.9 0.9Hitachi Home & Life 0.8 0.8Gammon Infrastructure 0.8 0.9Kennametal India 0.6 0.6ZF Steering Gear (India) 0.1 0.1Sterlite Power TransmissionLtd
- 0.2
Security Weight
SeriesVIII
SeriesIX
SeriesX
HeidelbergCement India 5.1 5.1 5.0HealthCare Global Enterprises Ltd 4.4 4.5 4.5Astra Microwave Products 4.0 4.0 4.0V-Guard Industries 4.0 4.0 4.0Carborundum Universal 3.6 3.6 3.6Blue Star 3.5 3.5 3.4Kalpataru Power 3.3 3.3 3.3Himatsingka Seide 2.9 2.9 3.1Grindwell Norton 2.9 2.9 2.9KEI Industries 2.8 2.8 2.8
India Cements 2.6 2.6 2.6Va Tech Wabag 2.6 2.6 2.5Shanthi Gears 2.6 2.6 2.6Century Plyboards (India) 2.3 2.3 2.3Quick Heal Technologies Ltd 2.2 2.2 2.2TNPL 2.1 2.1 2.1PNC Infratech 2.1 2.1 2.1Equitas Holding Ltd 2.0 2.0 2.0Mphasis 2.0 2.0 2.0Techno Electric & Eng Co 2.0 2.0 2.0
Gateway Distriparks 2.0 2.0 2.0Praj Industries 2.0 2.0 2.0ITD Cementation India 1.8 1.8 1.9NCC 1.8 1.8 1.8Alstom India 1.8 1.8 1.8Texmaco Rail & Eng 1.8 1.8 1.7Salzer Electronics 1.7 1.8 1.6HT Media 1.7 1.7 1.7Ujjivan Financial Services Ltd 1.7 1.7 1.7PTC India 1.6 1.6 1.6
Navin Fluorine Intl 1.5 1.5 1.5Dhampur Sugar Mills 1.4 1.4 1.4Insecticides (India) 1.3 1.3 1.3Premier Explosives 1.3 1.3 1.3Navkar Corporation 1.2 1.2 1.1MM Forgings 1.1 1.1 1.1WPIL 1.1 1.1 1.1ZF Steering Gear (India) 1.1 1.1 1.1Madhucon Projects 1.1 1.1 0.9Hitachi Home & Life 1.0 1.0 1.0
Sterlite Technologies 1.0 1.0 1.0Rane Holdings 1.0 1.0 1.0Heritage Foods 0.9 0.9 0.9T.V. Today Network 0.9 0.9 0.9Ashoka Buildcon 0.9 0.9 0.9Kennametal India 0.8 0.8 0.8Ramco Industries 0.7 0.8 0.1Subros 0.6 0.6 0.9KSB Pumps 0.6 0.6 0.6Sterlite Power Transmission Ltd 0.3 0.3 0.3Ashok Leyland 0.1 0.1 0.1Ador Welding 0.1 0.1 0.1
Equity 97.6 97.9Cash,Call & NCA 2.1 2.1Others 0.3 -
Equity 96.7 96.9 96.1Cash,Call & NCA 3.3 3.1 3.9
No of Stocks 46 47 No of Stocks 52 52 52
Avg AUM ( Cr) 251 135Month End AUM ( Cr) 262 140Turnover Ratio (%) 27.15 24.58
Avg AUM ( Cr) 101 60 39Month End AUM ( Cr) 106 63 41Turnover Ratio (%) 25.11 23.59 24.67
Fund Facts: Sundaram Select Micro Cap (Series VI) tenure is 42 Months; (Series VII) tenure is 1400 days; (Series VIII and IX) tenure is 5 years; • Launch: Series VI-October 2014; Series VII-October 2014; Series VIII October 2015; Series IX November2015 & Series X Dec 2015• Bloomberg: Select Micro Cap - Series 6- SSMC6RG IN EQUITY; Series 7- SSMC7RG IN EQUITY; Series 8 - SSMC8RG IN EQUITY; Series 9 - SSMC9RG IN EQUITY & Series 10 - SSM10RG IN EQUITY• Plans: Regular & Direct •Options: Growth, Dividend Pay Out • Exit Load: Nil.* Fund NAV is as of last working day of the given month.For Product Labels, please refer Page 2. Disclosures: Page 39.
www.sundarammutual.com June 2016 Page 21 Sundaram Mutual FundDesigned by Morningstar
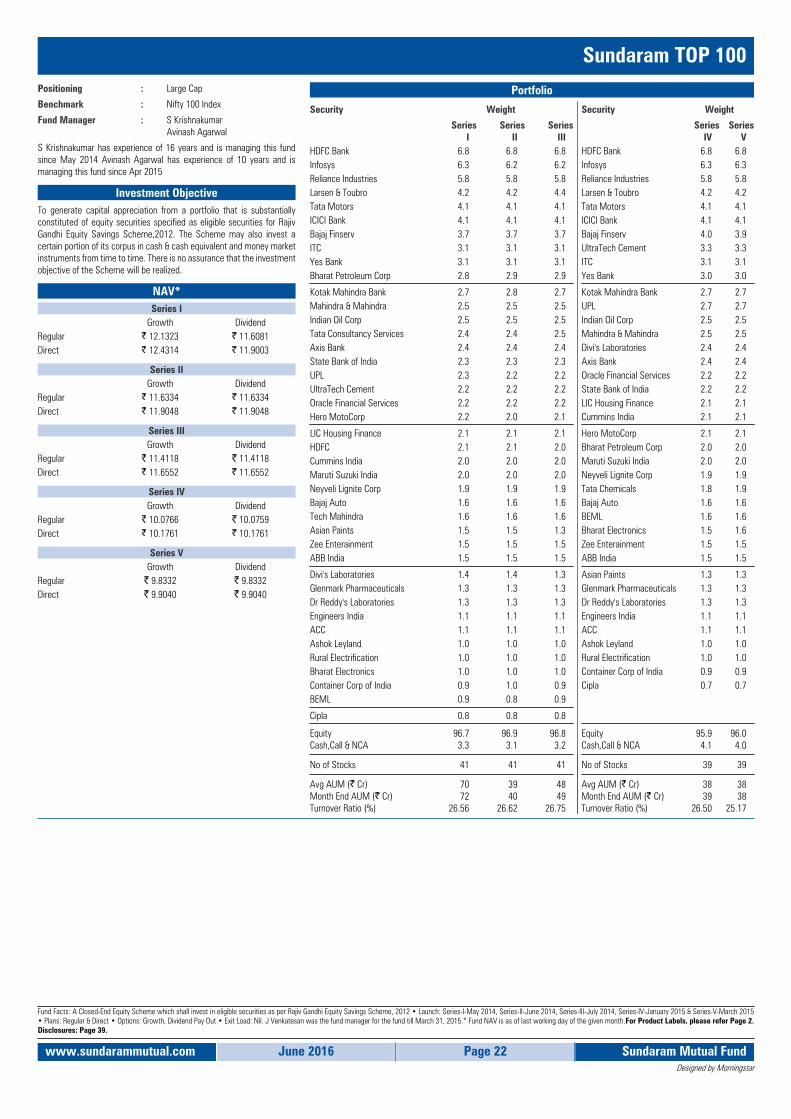
Sundaram TOP 100Positioning : Large Cap
Benchmark : Nifty 100 Index
Fund Manager : S KrishnakumarAvinash Agarwal
S Krishnakumar has experience of 16 years and is managing this fundsince May 2014 Avinash Agarwal has experience of 10 years and ismanaging this fund since Apr 2015
Investment ObjectiveTo generate capital appreciation from a portfolio that is substantiallyconstituted of equity securities specified as eligible securities for RajivGandhi Equity Savings Scheme,2012. The Scheme may also invest acertain portion of its corpus in cash & cash equivalent and money marketinstruments from time to time. There is no assurance that the investmentobjective of the Scheme will be realized.
NAV*Series I
Growth DividendRegular 12.1323 11.6081Direct 12.4314 11.9003
Series IIGrowth Dividend
Regular 11.6334 11.6334Direct 11.9048 11.9048
Series IIIGrowth Dividend
Regular 11.4118 11.4118Direct 11.6552 11.6552
Series IVGrowth Dividend
Regular 10.0766 10.0759Direct 10.1761 10.1761
Series VGrowth Dividend
Regular 9.8332 9.8332Direct 9.9040 9.9040
Portfolio
Security Weight
SeriesI
SeriesII
SeriesIII
HDFC Bank 6.8 6.8 6.8Infosys 6.3 6.2 6.2Reliance Industries 5.8 5.8 5.8Larsen & Toubro 4.2 4.2 4.4Tata Motors 4.1 4.1 4.1ICICI Bank 4.1 4.1 4.1Bajaj Finserv 3.7 3.7 3.7ITC 3.1 3.1 3.1Yes Bank 3.1 3.1 3.1Bharat Petroleum Corp 2.8 2.9 2.9
Kotak Mahindra Bank 2.7 2.8 2.7Mahindra & Mahindra 2.5 2.5 2.5Indian Oil Corp 2.5 2.5 2.5Tata Consultancy Services 2.4 2.4 2.5Axis Bank 2.4 2.4 2.4State Bank of India 2.3 2.3 2.3UPL 2.3 2.2 2.2UltraTech Cement 2.2 2.2 2.2Oracle Financial Services 2.2 2.2 2.2Hero MotoCorp 2.2 2.0 2.1
LIC Housing Finance 2.1 2.1 2.1HDFC 2.1 2.1 2.0Cummins India 2.0 2.0 2.0Maruti Suzuki India 2.0 2.0 2.0Neyveli Lignite Corp 1.9 1.9 1.9Bajaj Auto 1.6 1.6 1.6Tech Mahindra 1.6 1.6 1.6Asian Paints 1.5 1.5 1.3Zee Enterainment 1.5 1.5 1.5ABB India 1.5 1.5 1.5
Divi's Laboratories 1.4 1.4 1.3Glenmark Pharmaceuticals 1.3 1.3 1.3Dr Reddy's Laboratories 1.3 1.3 1.3Engineers India 1.1 1.1 1.1ACC 1.1 1.1 1.1Ashok Leyland 1.0 1.0 1.0Rural Electrification 1.0 1.0 1.0Bharat Electronics 1.0 1.0 1.0Container Corp of India 0.9 1.0 0.9BEML 0.9 0.8 0.9
Cipla 0.8 0.8 0.8
Security Weight
SeriesIV
SeriesV
HDFC Bank 6.8 6.8Infosys 6.3 6.3Reliance Industries 5.8 5.8Larsen & Toubro 4.2 4.2Tata Motors 4.1 4.1ICICI Bank 4.1 4.1Bajaj Finserv 4.0 3.9UltraTech Cement 3.3 3.3ITC 3.1 3.1Yes Bank 3.0 3.0
Kotak Mahindra Bank 2.7 2.7UPL 2.7 2.7Indian Oil Corp 2.5 2.5Mahindra & Mahindra 2.5 2.5Divi's Laboratories 2.4 2.4Axis Bank 2.4 2.4Oracle Financial Services 2.2 2.2State Bank of India 2.2 2.2LIC Housing Finance 2.1 2.1Cummins India 2.1 2.1
Hero MotoCorp 2.1 2.1Bharat Petroleum Corp 2.0 2.0Maruti Suzuki India 2.0 2.0Neyveli Lignite Corp 1.9 1.9Tata Chemicals 1.8 1.9Bajaj Auto 1.6 1.6BEML 1.6 1.6Bharat Electronics 1.5 1.6Zee Enterainment 1.5 1.5ABB India 1.5 1.5
Asian Paints 1.3 1.3Glenmark Pharmaceuticals 1.3 1.3Dr Reddy's Laboratories 1.3 1.3Engineers India 1.1 1.1ACC 1.1 1.1Ashok Leyland 1.0 1.0Rural Electrification 1.0 1.0Container Corp of India 0.9 0.9Cipla 0.7 0.7
Equity 96.7 96.9 96.8Cash,Call & NCA 3.3 3.1 3.2
Equity 95.9 96.0Cash,Call & NCA 4.1 4.0
No of Stocks 41 41 41 No of Stocks 39 39
Avg AUM ( Cr) 70 39 48Month End AUM ( Cr) 72 40 49Turnover Ratio (%) 26.56 26.62 26.75
Avg AUM ( Cr) 38 38Month End AUM ( Cr) 39 38Turnover Ratio (%) 26.50 25.17
Fund Facts: A Closed-End Equity Scheme which shall invest in eligible securities as per Rajiv Gandhi Equity Savings Scheme, 2012 • Launch: Series-I-May 2014, Series-II-June 2014, Series-III-July 2014, Series-IV-January 2015 & Series-V-March 2015• Plans: Regular & Direct • Options: Growth, Dividend Pay Out • Exit Load: Nil. J Venkatesan was the fund manager for the fund till March 31, 2015.* Fund NAV is as of last working day of the given month.For Product Labels, please refer Page 2.Disclosures: Page 39.
www.sundarammutual.com June 2016 Page 22 Sundaram Mutual FundDesigned by Morningstar

Sundaram Select Small CapPositioning : Small Cap
Benchmark : S&P BSE Smallcap Index
Fund Manager : S Krishnakumar
S Krishnakumar has experience of 16 years and is managing this fundsince Nov 2014
Investment ObjectiveTo seek capital appreciation by investing predominantly in equity/equity-related instruments of companies that can be termed as small-caps.However, there can be no assurance that the investment objective of theScheme will be realized.The fund will invest in stocks that are equal to orlower than the 101st stock and upto 300th stock in the NSE (after sortingthe stocks by market-cap in descending order)
NAV*Series II
Growth DividendRegular 10.8136 10.8136Direct 10.9667 10.9667
Series IIIGrowth Dividend
Regular 10.6676 10.6676Direct 10.7422 10.7587
Series IVGrowth Dividend
Regular 10.6252 10.6252Direct 10.6899 10.6899
Portfolio
Security Weight
SeriesII
Ramco Cements 4.6Bajaj Finserv 4.4Mahindra & Mahindra Finl 4.3Indraprastha Gas 4.0SRF 3.6Fag Bearings India 3.4Coromandel International 3.2Equitas Holding Ltd 3.2Vardhman Textiles 3.2Mphasis 3.1
Phoenix Mills 3.1Arvind 3.1Redington (India) 3.1Karur Vysya Bank 2.7Thermax 2.5Neyveli Lignite Corp 2.5Castrol India 2.4Max Financial Services 2.4UPL 2.4Federal Bank 2.4
Exide Industries 2.3CESC 2.3Century Textiles & Indus 2.3Whirlpool of India 2.1Titan Company 2.0Indian Bank 2.0Allahabad Bank 2.0GlaxoSmithKline Consumer 1.8Inox Wind 1.5Glenmark Pharmaceuticals 1.5
Schneider Electric Infr 1.4Prism Cement 1.4JK Cement 1.3Mahindra CIE Automotive 1.2Century Plyboards (India) 1.2Dish TV India 1.0Bharat Electronics 0.9Ashok Leyland 0.1Max India Ltd 0.1Max Venture and Industries Ltd 0.0
Security Weight
SeriesIII
SeriesIV
Ramco Cements 4.6 4.6Bajaj Finserv 4.4 4.4Mahindra & Mahindra Finl 4.3 4.3Indraprastha Gas 3.9 3.9SRF 3.6 3.6Fag Bearings India 3.3 3.3Coromandel International 3.3 3.2Equitas Holding Ltd 3.2 3.2Redington (India) 3.1 3.1Mphasis 3.1 3.1
Vardhman Textiles 3.1 3.1Phoenix Mills 3.1 3.1Arvind 3.1 3.1Karur Vysya Bank 2.7 2.7Thermax 2.6 2.6Neyveli Lignite Corp 2.5 2.5Max Financial Services 2.4 2.4Federal Bank 2.4 2.4Castrol India 2.4 2.4UPL 2.4 2.4
CESC 2.3 2.3Exide Industries 2.3 2.3Century Textiles & Indus 2.2 2.2Whirlpool of India 2.1 2.1Titan Company 2.0 2.0Indian Bank 2.0 2.0Allahabad Bank 1.9 1.9GlaxoSmithKline Consumer 1.7 1.8Inox Wind 1.6 1.6Glenmark Pharmaceuticals 1.4 1.4
Prism Cement 1.4 1.4Schneider Electric Infr 1.4 1.4JK Cement 1.3 1.3Mahindra CIE Automotive 1.2 1.2Century Plyboards (India) 1.2 1.2Dish TV India 1.0 1.0Bharat Electronics 0.9 0.9Ashok Leyland 0.1 0.1Max India Ltd 0.1 0.1Max Venture and Industries Ltd 0.0 0.0
Equity 92.0Cash,Call & NCA 8.0
Equity 91.7 91.7Cash,Call & NCA 8.3 8.3
No of Stocks 40 No of Stocks 40 40
Avg AUM ( Cr) 63Month End AUM ( Cr) 66Turnover Ratio (%) 39.41
Avg AUM ( Cr) 39 42Month End AUM ( Cr) 41 44Turnover Ratio (%) 36.05 34.12
Fund Facts: A Closed-End Equity Scheme • Launch: Series-II – November 2014 • Launch: Series-III – March 2015 • Launch: Series-IV – April 2015 • Plans: Regular & Direct • Options: Growth, Dividend Pay Out • Exit Load: Nil.* Fund NAV is as of lastworking day of the given month.For Product Labels, please refer Page 2. Disclosures: Page 39.
www.sundarammutual.com June 2016 Page 23 Sundaram Mutual FundDesigned by Morningstar

Sundaram Value FundPositioning : Multi Cap
Benchmark : S&P BSE 500 Index
Fund Manager : S Krishnakumar
Series 1: S Krishnakumar has experience of 16years and is managing this fund since Apr 2015.Series 2: S Krishnakumar has experience of 16years and is managing this fund since Apr 2015Madanagopal Ramu has experience of 9 years andis managing this fund since Jan 2016. Series 3: SKrishnakumar has experience of 16 years and ismanaging this fund since Feb 2016 MadanagopalRamu has experience of 9 years and is managingthis fund since Feb 2016.
Investment ObjectiveTo provide capital appreciation by investing in a welldiversified portfolio of stocks through fundamentalanalysis. However, there can be no assurance thatthe investment objective of the scheme will berealized.
NAV*Series I
Growth DividendRegular 10.4169 10.4169Direct 10.5244 10.5243
Series IIGrowth Dividend
Regular 11.1061 11.1061Direct 11.2017 11.2017
Series IIIGrowth Dividend
Regular 11.5780 11.5780Direct 11.5934 11.5934
Portfolio
Security Weight
SeriesI
Vindhya Telelinks 5.1Century Plyboards(India)
4.8
CholamandalamInvestment
4.4
Strides Shasun 4.4Navin Fluorine Intl 4.4Sundaram Clayton 4.3Vardhman Textiles 4.0Redington (India) 3.1Karur Vysya Bank 3.0Astra MicrowaveProducts
2.9
NRB Bearings 2.8Mahindra & MahindraFinl
2.8
ISGEC HeavyEngineering
2.7
TNPL 2.7Madhucon Projects 2.5India Cements 2.4Ingersoll Rand (India) 2.4Indraprastha Gas 2.2Dhampur Sugar Mills 2.1Arvind 2.1
UPL 2.0HSIL 2.0SRF 1.8Elecon Engineering Co 1.8Subros 1.7LG Balakrishnan & Bros 1.6Whirlpool of India 1.5Alstom India 1.3Kalpataru Power 1.2Indian Terrain Fashions 1.2
Ramco Industries 1.2Bombay BurmahTrading
1.1
HealthCare GlobalEnterprises Ltd
1.0
Balmer Lawrie &Company
1.0
Brigade Enterprises 1.0Sterlite Technologies 1.0Texmaco Rail & Eng 0.8Gujarat Narmada Valley 0.7Sterlite PowerTransmission Ltd
0.2
Security Weight
SeriesII
Vindhya Telelinks 5.5Bajaj Finserv 5.1Vardhman Textiles 4.7Navin Fluorine Intl 3.9Jagran Prakashan 3.8Tata Motors 3.6Indian Oil Corp 3.6Larsen & Toubro 3.3Indian Bank 2.9Tata Chemicals 2.9
Arvind 2.8TNPL 2.8NRB Bearings 2.8Greaves Cotton 2.6Aditya Birla Nuvo 2.5Neyveli Lignite Corp 2.5India Cements 2.4UPL 2.4Alstom India 2.4Indraprastha Gas 2.4
Blue Star 2.3Praj Industries 2.3Engineers India 2.3Chambal Fertilisers 2.1Subros 2.1Karur Vysya Bank 2.1Dhampur Sugar Mills 2.1HealthCare GlobalEnterprises Ltd
2.0
LG Balakrishnan & Bros 2.0Coal India 2.0
Mahindra & Mahindra 2.0Ramco Industries 1.9HSIL 1.7Bajaj Auto 1.7Bharat Electronics 1.6Inox Wind 1.3TD Power Systems 1.2BEML 0.9Gujarat Narmada Valley 0.6Mphasis 0.5
Security Weight
SeriesIII
ACC 5.2HealthCare GlobalEnterprises Ltd
4.7
Tata Motors 4.2Gujarat Narmada Valley 4.2Grasim Industries 4.0Tata Motors Class A 4.0ICICI Bank 3.9Reliance Industries 3.8Brigade Enterprises 3.7Mphasis 3.5
Mahindra & Mahindra 3.0NRB Bearings 2.7Engineers India 2.7Ashoka Buildcon 2.7Century Textiles & Indus 2.5Arvind 2.5Navin Fluorine Intl 2.4India Cements 2.4Indraprastha Gas 2.1Axis Bank 2.1
State Bank of India 2.1Dhampur Sugar Mills 2.1Lupin 2.1Exide Industries 2.0Rural Electrification 2.0Larsen & Toubro 2.0ONGC 1.9NCC 1.8K.P.R. Mill 1.7WPIL 1.6
Inox Wind 1.5HCL Technologies 1.4CESC 1.3Indian Bank 1.2Bharat HeavyElectricals
1.0
BEML 1.0LG Balakrishnan & Bros 0.6
Equity 89.3Derivatives 9.8Cash,Call & NCA 0.8
Equity 99.3Cash,Call & NCA 0.6Others 0.1
Equity 93.4Cash,Call & NCA 6.6
No of Stocks 39 No of Stocks 40 No of Stocks 37
Avg AUM ( Cr) 99Month End AUM ( Cr) 103Turnover Ratio (%) 31.83
Avg AUM ( Cr) 25Month End AUM ( Cr) 26Turnover Ratio (%) 38.00
Avg AUM ( Cr) 28Month End AUM ( Cr) 29Turnover Ratio (%) 53.19
Fund Facts: A Closed-End Equity Scheme • Launch: Series-I – December 2014, Series-II – February 2015 & Series-III – February 2016 • Plans: Regular & Direct • Options: Growth, Dividend Pay Out • Exit Load: Nil.* Fund NAV is as of last working dayof the given month.For Product Labels, please refer Page 2. Disclosures: Page 39.
www.sundarammutual.com June 2016 Page 24 Sundaram Mutual FundDesigned by Morningstar

Sundaram World Brand FundPositioning : Large Cap
Benchmark : MSCI ACWI Index
Fund Manager : Avinash Agarwal
Avinash Agarwal has experience of 10 years and is managing this fund sinceJan 2016
Investment ObjectiveTo provide long term capital appreciation to investors by primarily investing inequity and equity related securities listed on recognized overseas stockexchanges across the world.However, there can be no assurance that theinvestment objective of the scheme will be realized
NAV*Series I
Growth DividendRegular 10.6058 10.6058Direct 10.7446 10.7446
Series IIGrowth Dividend
Regular 10.6248 10.6248Direct 10.7591 10.7591
Series IIIGrowth Dividend
Regular 10.7516 10.7516Direct 10.8805 10.8805
Portfolio
Security Weight
SeriesI
SeriesII
SeriesIII
Amazon.com 6.8 6.8 6.8Alphabet A 6.3 6.4 6.3General Electric 6.2 6.2 6.2McDonald's 6.1 6.2 6.1Microsoft 5.9 5.9 5.9Coca-Cola 5.4 5.4 5.4IBM 4.6 4.6 4.6Apple 4.3 4.3 4.3Toyota Motor ADR 3.9 3.9 3.9BMW 3.2 3.1 3.2
Intel 3.2 3.2 3.2Procter & Gamble 3.1 3.1 3.1Cisco Systems 3.0 3.0 3.0Oracle 2.9 2.9 2.9Walt Disney 2.8 2.8 2.8Facebook A 2.8 2.8 2.8LVMH Moet Hennessy Louis 2.3 2.3 2.3Daimler 2.3 2.2 2.2Hennes & Mauritz ADR 2.3 2.3 2.3United Parcel Service Class B 2.3 2.3 2.3
Honda Motor ADR 2.3 2.3 2.3Nike B 2.2 2.3 2.2PepsiCo 2.2 2.2 2.2SAP 2.1 2.1 2.1Hewlett Packard 1.8 1.8 1.8INDITEX 1.7 1.7 1.7Anheuser-Busch InBev ADR 1.7 1.7 1.7American Express 1.6 1.6 1.6JPMorgan Chase 1.5 1.5 1.5HP 1.2 1.2 1.2
eBay 0.8 0.8 0.8LVMH Moet Hennessy Louis ADR 0.5 0.5 0.5
Equity 99.1 99.3 99.1Cash,Call & NCA 0.9 0.7 0.9
No of Stocks 32 32 32
Avg AUM ( Cr) 48 43 31Month End AUM ( Cr) 48 43 31Turnover Ratio (%) 0.06 0.06 0.06
Fund Facts: A Closed-End Equity Scheme • Launch: Series-I, II & III – December 2014 • Plans: Regular & Direct • Options: Growth, Dividend Pay Out • Exit Load: Nil.* Fund NAV is as of last working day of the given month.For Product Labels, pleaserefer Page 2. Disclosures: Page 39.
www.sundarammutual.com June 2016 Page 25 Sundaram Mutual FundDesigned by Morningstar

Sundaram Long Term Tax Advantage FundPositioning : ELSS
Benchmark : S&P BSE 500 Index
Fund Manager : S Krishnakumar
S Krishnakumar has experience of 16 years and is managing this fundsince March 2015
Investment ObjectiveThe investment objective of the scheme is to generate capital appreciationover a period of ten years by investing predominantly in equity and equity-related instruments of companies along with income tax benefit.However, there is no guarantee or assurance that the investmentobjective of the scheme will be achieved.
NAV*Series I
Growth DividendRegular 10.0492 10.0492Direct 10.1217 10.1217
Series IIGrowth Dividend
Regular 10.7459 10.7459Direct 10.7558 10.7560
Portfolio
Security Weight
SeriesI
HDFC Bank 6.1Prism Cement 5.8Reliance Industries 5.2Larsen & Toubro 5.1State Bank of India 5.0UltraTech Cement 4.9Yes Bank 4.7Ramco Cements 4.3ICICI Bank 4.2Axis Bank 4.0
Century Textiles & Indus 3.8UPL 3.6LIC Housing Finance 3.6Ingersoll Rand (India) 3.5Arvind 3.2Vardhman Textiles 3.1Indian Oil Corp 3.1ITC 2.9NRB Bearings 2.7TD Power Systems 2.5
Mahindra & Mahindra 2.3Premier Explosives 2.1Thermax 2.1Sterlite Technologies 2.1Rural Electrification 2.0BEML 1.9Motherson Sumi Systems 1.8Schneider Electric Infr 1.3Thyrocare Technologies Ltd 1.1Sterlite Power Transmission Ltd 0.5
Navin Fluorine Intl 0.2
Security Weight
SeriesII
State Bank of India 5.0Reliance Industries 4.8Natco Pharma 4.8HealthCare Global Enterprises Ltd 4.4ICICI Bank 4.3ACC 4.2Gujarat Narmada Valley 4.0ITC 3.9Larsen & Toubro 3.9Dish TV India 3.0
HCL Technologies 2.9Ashoka Buildcon 2.9NRB Bearings 2.8Thermax 2.2Yes Bank 2.1Indian Oil Corp 2.1Mahindra & Mahindra 2.1Axis Bank 2.1Sterlite Technologies 2.0Bharat Electronics 2.0
Rural Electrification 2.0Bayer CropScience 1.9BEML 1.9NCC 1.9Motherson Sumi Systems 1.8Lupin 1.7Thyrocare Technologies Ltd 1.5Siemens 1.1Fag Bearings India 1.1Vardhman Textiles 1.0
Bharat Heavy Electricals 1.0TD Power Systems 1.0Nestle India 1.0Ashok Leyland 0.9Navin Fluorine Intl 0.9Sterlite Power Transmission Ltd 0.5Mahanagar Gas Ltd 0.1
Equity 98.8Cash,Call & NCA 1.2
Equity 86.8Cash,Call & NCA 13.2
No of Stocks 31 No of Stocks 37
Avg AUM ( Cr) 25Month End AUM ( Cr) 26Turnover Ratio (%) 42.70
Avg AUM ( Cr) 19Month End AUM ( Cr) 19Turnover Ratio (%) 61.64
Fund Facts: A Closed-End Equity Linked Savings Scheme • Launch: Series-I – March 2015 • Plans: Regular & Direct • Options: Growth, Dividend payout • Exit Load: Nil.* Fund NAV is as of last working day of the given month.For Product Labels,please refer Page 2. Disclosures: Page 39.
www.sundarammutual.com June 2016 Page 26 Sundaram Mutual FundDesigned by Morningstar

Sundaram Balanced FundPositioning : Balanced PortfolioBenchmark : CRISIL Balanced Fund IndexFund Manager : Shiv ChananiShiv Chanani has experience of 12 years and managing thisfund since Jan 2013
Investment ObjectiveThe scheme seeks to generate capital appreciation andcurrent income through a judicious mix of investments inequities and fixed income securities.
Industry Classification (%)
13.9
8.3
10.9
0.8
0.9
1.4
1.4
1.8
1.8
1.9
2.6
2.8
3.6
3.6
4.2
6.6
7.0
7.5
9.1
9.9
0 5 10 15 20 25
Others
Cash,Call & NCA
Corporate Bond & NCDs
Industrial Products
Telecom - Equipment & Acc.
Healthcare Services
Consumer Durables
Textile Products
Gas
Pharmaceuticals
Media & Entertainment
Industrial Capital Goods
Construction Project
Power
Auto
Software
Cement
Finance
Consumer Non Durables
Banks
Weighted Avg Market Cap: 66,893 Cr.Median Market Cap: 55,971 Cr.Avg AUM: 108 Cr.Month End AUM: 111 Cr.Avg Maturity of Portfolio: 7.40 YearsAvg Duration of Portfolio: 4.85 YearsYTM of Portfolio: 7.59 %
Dividend History: Refer page 37 & 38
PortfolioSecurity WeightEquity 66.9Ramco Cements 3.3Tata Consultancy Services 2.8ITC 2.7Infosys 2.6UltraTech Cement 2.3Kotak Mahindra Bank 2.2Axis Bank 2.2Larsen & Toubro 2.2CESC 2.2HDFC Bank 2.1Dabur India 2.1Asian Paints 2.0Mahindra & Mahindra 1.9HDFC 1.9Mahanagar Gas Ltd 1.8Ujjivan Financial Services Ltd 1.8Arvind 1.8State Bank of India 1.5Power Grid 1.5ACC 1.5Ashoka Buildcon 1.4Whirlpool of India 1.4Siemens 1.4Cholamandalam Investment 1.4PVR 1.4GlaxoSmithKline Consumer 1.3ABB India 1.3IDFC 1.3Maruti Suzuki India 1.3Zee Enterainment 1.2Oracle Financial Services 1.1Bajaj Finance 1.1Dr Reddy's Laboratories 1.1Hero MotoCorp 1.0IndusInd Bank 1.0Hindustan Unilever 1.0Bharti Infratel 0.9DCB Bank 0.9Lupin 0.8Mahindra CIE Automotive 0.8Apollo Hospitals 0.8HealthCare Global Enterprises Ltd 0.6Corporate Bond & NCDs 10.9Housing Development FinanceCorporation Ltd
9.1
Yes Bank Ltd 1.9Cash,Call & NCA 8.3CBLO 7.8Cash & Other Net Current Assets 0.5Others 13.87.59% Govt Stock 2029 9.07.80% Govt Stock 2021 4.66.35% Govt Stock 2020 0.2
No of Stocks 42Turnover Ratio (%) 91
NAV*: Regular-Growth: 67.1344 Dividend: 14.3012NAV*: Direct-Growth: 68.2349 Dividend: 14.5867
PerformancePerformance Period NAV per
Unit ( )Fund(%)
Benchmark(%)
Nifty 50(%) ExcessPoints
Since Inception - 12.5 - 11.4 -30/06/2015 to 30/06/2016 67.13 5.0 3.1 -1.0 1.930/06/2014 to 30/06/2015 63.94 6.5 10.6 10.0 -4.130/06/2013 to 30/06/2014 60.03 24.7 21.0 30.3 3.7Last 3 years - 11.7 11.3 12.4 0.4Last 5 years - 6.9 8.7 8.0 -1.7Last 8 years - 9.2 9.7 9.4 -0.5
10,000 investedPeriod Fund Benchmark Nifty 50Since Inception 66,142 - 56,295Last 3 years 13,947 13,798 14,186Last 5 years 13,986 15,151 14,675Last 8 years 20,198 20,941 20,511
Growth of 10,000 Fund Benchmark Additional Benchmark
0
20000
40000
60000
Jun 00 Jun 08 Jun 16
Value of 10,000-a-month SIPPeriod Investment Fund Benchmark Nifty 50Since Inception Returns (%) - 12.32 - 13.29Since Inception 19,20,000 56,21,940 - 61,55,306Last 10 years 12,00,000 18,60,613 19,30,472 19,12,086Last 7 years 8,40,000 11,18,322 11,63,626 11,52,292Last 5 years 6,00,000 7,62,714 7,75,250 7,75,087Last 3 years 3,60,000 4,14,417 4,12,868 4,06,397Last 2 years 2,40,000 2,55,514 2,52,992 2,45,891Last 1 year 1,20,000 1,28,895 1,25,926 1,25,632
Performance Analysis (Based on monthly 3 Yrs returns)Fund Nifty 500
Arithmetic Mean 11.7 15.8Standard Deviation 11.2 15.7Correlation 1.0 -Beta 0.7 -Sharpe Ratio 0.5 0.6Sortino Ratio 1.0 1.3Alpha 0.9 -Tracking Error 6.0 -Information Ratio -0.7 -Treynor Ratio 7.8 -
Past performance may or may not be sustained in future. Returns/investment value are as ofJun 30, 2016. Returns are on a compounded annual basis for period more than one year and absolutefor one-year period and computed using NAV of Regular Plan-Growth Option. Value of 10,000invested at inception is as on Jun 30, 2016. SIP values are in rupees. Performance Analysis onannualized basis except Beta and Correlation. The risk free Index is MIBOR Overnight.
Fund Facts: An open-end hybrid scheme • Launch: June 2000 • Bloomberg: SNDBALG IN • Plans: Regular & Direct • Options: Growth, Dividend Pay Out, Dividend Sweep, Dividend Re-Investment • Minimum Amount: 5,000 • SIP/STP: Weekly 1000, Monthly 250, Quarterly 750 Terms of offer: NAV Exit Load: 1% if redeemed within 12 months from date of allotment. * Portfolio Yield is computed only for the amount invested. Asset Allocation graph as per AMFI Industry Classification. * FundNAV is as of last working day of the given month. For Product Labels, please refer Page 2. Disclosures: Page 39.
www.sundarammutual.com June 2016 Page 27 Sundaram Mutual FundDesigned by Morningstar

Sundaram Monthly Income Conservative Plan (Equity of up to 10%)Positioning: : Monthly Income Plan
Benchmark : CRISIL MIP Blended FundIndex
Fund Manager : Dwijendra SrivastavaShiv ChananiSiddharth ChaudharySandeep Agarwal
Dwijendra Srivastava has got experience of about 12 yearsand is managing this fund since July 2010. SiddharthChaudhary has got experience of about 9 years in Banking& Fund Management and is managing this fund since Sep2010. Sandeep Agarwal has got 7 years of experience andmanaging this fund since September 2012. The equityportion of the fund will be managed by Shiv Chanani, whohas got 12 years of experience
Investment ObjectiveTo generate regular income through investment In Fixedincome securities. The secondary objective is to generatelong term capital appreciation by investing a portion of theschemes assets in equity and equity related instruments.
Asset Allocation
5.4
2.3
85.2
6.5
0.7
0 29 58 87... ... ... ...
Cash,Call & NCA
Reverse Repo/CBLO
Corporate Bond & NCDs
G-Sec / T-Bills
Equity
Average Maturity of Portfolio : 2.73 Years
Average Duration of Portfolio : 2.28 Years
YTM of Portfolio : 8.22 %
Rating Profile
5.4
2.3
0.7
13.0
72.2
6.5
0... ... ... ... ... ... ...
Cash,Call & NCA
Reverse Repo/CBLO
Equity
High Investment Grade
Highest Investment Grade
Sovereign
Average AUM : 79 Cr.
Month End AUM : 79 Cr.
PortfolioSecurity Rating Weight
Equity 0.7Kotak Mahindra Bank 0.2Hindustan Unilever 0.2Mahindra & Mahindra 0.1Wipro 0.1Larsen & Toubro 0.1Government Securities / Treasury Bills 6.58.39% RJ SDL Spl 2019 Sov 6.5Corporate Bond & NCDs 85.2Cholamandalam Investment And Fin. Co.Ltd
AA 13.0
Rural Electrification Corporation Ltd AAA 10.9Aditya Birla Finance Ltd AA+ 10.1Small Industries Development Bank OfIndia
AAA 10.0
Power Finance Corporation Ltd. AAA 9.6Power Grid Corporation Of India Ltd AAA 9.2IOT Utkal Energy Services Ltd AAA 8.7L&T Housing Finance Ltd AA+ 7.5National Bank For Agriculture And RuralDevelopment
AAA 3.1
Tata Sons Ltd AAA 2.6Bajaj Finance Ltd AA+ 0.5Reverse Repo/CBLO 2.3CBLO 2.3Cash,Call & NCA 5.4Cash & Other Net Current Assets 5.4
NAV*: Regular-Growth: 14.6384 MonthlyDividend:
11.8904
NAV*: Direct-Growth: 14.9056
Long-Term Performance Jun 16Performance Fund
(%)
Benchmark
(%)
CRISIL 10 Yr
GILT (%)
Excess
Points (%)
Since Inception 6.22 8.39 6.76 -2.1830/06/2015 to 30/06/2016 9.24 8.60 10.01 0.6430/06/2014 to 30/06/2015 10.80 11.05 11.76 -0.2530/06/2013 to 30/06/2014 -0.13 8.28 -2.47 -8.41Last 3 years 6.53 9.31 6.24 -2.78Last 5 years 6.81 9.04 7.56 -2.23
10,000 investedPerformance Fund Benchmark CRISIL 10 Yr GILT
Since Inception 14,638 16,639 15,117Last 3 years 12,091 13,063 11,994Last 5 years 13,906 15,425 14,400
Past performance may or may not be sustained in future. Returns/investment value areas of Jun 30, 2016. Returns are on a compounded annual basis for period more than one yearand absolute for one-year period and computed using NAV of Regular Plan-Growth Option.Value of 10,000 invested at inception is as on Jun 30, 2016.
Fund Facts: An open-end income scheme • Launch: March 2010 (Conservative Plan & Aggressive Plan) • Bloomberg: SUNMICG IN • Plans: Regular & Direct Options: Growth, Dividend Pay Out, Dividend Re-Investment (Monthly, Quarterly & Half Yearly),Bonus option discontinued w.e.f. 20-07-15 • Minimum Amount: 5000 • SIP/STP: Weekly 1000 • Monthly 250 • Quarterly 750 • Terms of offer: NAV • Exit Load: Conservative Plans (w.e.f.: 14/05/14): 2.5% - If redeemed / switched-out within12 months from the date of allotment, 2.0% - If redeemed / switched-out after 12 months but within 24 months from the date of allotment. NIL - If redeemed / switched-out after 24 months from the date of allotment.* Portfolio Yield is computed onlyfor the amount invested • Ratings are provided by CRISIL / CARE / FITCH / ICRA / BRW agencies • Dividend History: Please visit www.sundarammutual.com * Fund NAV is as of last working day of the given month.For Product Labels, please referPage 2. Disclosures: Page 39.
www.sundarammutual.com June 2016 Page 28 Sundaram Mutual FundDesigned by Morningstar

Sundaram Monthly Income Aggressive Plan (Equity of up to 30%)Positioning: : Monthly Income Plan
Benchmark : CRISIL MIP Blended FundIndex
Fund Manager : Dwijendra SrivastavaShiv ChananiSiddharth ChaudharySandeep Agarwal
Dwijendra Srivastava has got experience of about 12 yearsand is managing this fund since July 2010. SiddharthChaudhary has got experience of about 9 years in Banking& Fund Management and is managing this fund since Sep2010. Sandeep Agarwal has got 7 years of experience andmanaging this fund since September 2012. The equityportion of the fund will be managed by Shiv Chanani, whohas got 12 years of experience
Investment ObjectiveTo generate regular income through investment in fixedincome securities. The secondary objective is to generatelong term capital appreciation by investing a portion of theschemes assets in equity and equity related instruments
Asset Allocation
2.7
7.0
70.5
19.8
0 24 48 72 96... ... ...
Cash,Call & NCA
Reverse Repo/CBLO
Corporate Bond & NCDs
Equity
Average Maturity of Portfolio : 3.44 Years
Average Duration of Portfolio : 2.46 Years
YTM of Portfolio : 8.82 %
Rating Profile
2.7
7.0
19.8
24.4
46.1
0... ... ... ... ... ... ...
Cash,Call & NCA
Reverse Repo/CBLO
Equity
High Investment Grade
Highest Investment Grade
Average AUM : 111 Cr.
Month End AUM : 110 Cr.
PortfolioSecurity Rating Weight
Equity 19.8Ujjivan Financial Services Ltd 1.8Indraprastha Gas 1.7Jyothy Laboratories 1.6Ramco Cements 1.5Karur Vysya Bank 1.4Persistent Systems 1.3TNPL 1.3Bajaj Finance 1.1Blue Dart Express 1.1Tata Chemicals 1.0AstraZeneca Pharma India 1.0Mahanagar Gas Ltd 1.0IDFC 0.9Mahindra CIE Automotive 0.8Glenmark Pharmaceuticals 0.7Inox Wind 0.7HealthCare Global Enterprises Ltd 0.6HSIL 0.4Navkar Corporation 0.1Corporate Bond & NCDs 70.5Talwandi Sabo Power Ltd AA- 11.6Cholamandalam Investment And Fin. Co.Ltd
AA 9.2
Housing Development FinanceCorporation Ltd
AAA 9.1
Power Grid Corporation Of India Ltd AAA 7.2Power Finance Corporation Ltd. AAA 7.1Indiabulls Housing Finance Ltd AAA 6.4Rural Electrification Corporation Ltd AAA 6.2Tata Sons Ltd AAA 4.8Indian Railway Finance Corporation Ltd AAA 4.6Bank Of India A+ 3.7Bajaj Finance Ltd AA+ 0.6Reverse Repo/CBLO 7.0CBLO 7.0Cash,Call & NCA 2.7Cash & Other Net Current Assets 2.7
NAV*: Regular-Growth: 16.2860 MonthlyDividend:
13.5625
NAV*: Direct-Growth: 16.4620
Long-Term Performance Jun 16Performance Fund
(%)
Benchmark
(%)
CRISIL 10 Yr
GILT (%)
Excess
Points (%)
Since Inception 8.03 8.39 6.76 -0.3730/06/2015 to 30/06/2016 7.74 8.60 10.01 -0.8630/06/2014 to 30/06/2015 15.00 11.05 11.76 3.9430/06/2013 to 30/06/2014 10.86 8.28 -2.47 2.57Last 3 years 11.16 9.31 6.24 1.85Last 5 years 9.08 9.04 7.56 0.04
10,000 investedPerformance Fund Benchmark CRISIL 10 Yr GILT
Since Inception 16,286 16,639 15,117Last 3 years 13,738 13,063 11,994Last 5 years 15,451 15,425 14,400
Past performance may or may not be sustained in future. Returns/investment value areas of Jun 30, 2016. Returns are on a compounded annual basis for period more than one yearand absolute for one-year period and computed using NAV of Regular Plan-Growth Option.Value of 10,000 invested at inception is as on Jun 30, 2016.
Fund Facts: • Bank of India ratings are rated by Brick work (BW) and CRISIL . BW has assigned AA- for the same. An open-end income scheme • Launch: March 2010 • Bloomberg: SUNMIAG IN • Plans: Regular & Direct Options: Growth, Dividend PayOut, Dividend Re-Investment (Monthly, Quarterly & Half Yearly), Bonus option discontinued w.e.f. 20-07-15 • Minimum Amount: 5000 • SIP/STP: Weekly 1000 • Monthly 250 • Quarterly 750 • Terms of offer: NAV • Exit Load: Aggressive Plan:NIL • Portfolio Yield is computed only for the amount invested • Ratings are provided by CRISIL / CARE / FITCH / ICRA / BRW agencies • Dividend History: Please visit www.sundarammutual.com • Bank of India ratings are rated by Brick work ( BW )and CRISIL . BW has assigned AA- for the same. * Fund NAV is as of last working day of the given month.For Product Labels, please refer Page 2. Disclosures: Page 39.
www.sundarammutual.com June 2016 Page 29 Sundaram Mutual FundDesigned by Morningstar

Sundaram Monthly Income Moderate Plan (Equity of up to 20%)Positioning: : Monthly Income Plan
Benchmark : CRISIL MIP Blended FundIndex
Fund Manager : Dwijendra SrivastavaShiv ChananiSiddharth ChaudharySandeep Agarwal
Dwijendra Srivastava has got experience of about 12 yearsand is managing this fund since July 2010. SiddharthChaudhary has got experience of about 9 years in Banking& Fund Management and is managing this fund since Sep2010. Sandeep Agarwal has got 7 years of experience andmanaging this fund since September 2012. The equityportion of the fund will be managed by Shiv Chanani, whohas got 12 years of experience
Investment ObjectiveTo generate regular income through investment In Fixedincome securities. The Secondary objective is to Generatelong term capital appreciation by investing a portion of theschemes assets in equity and equity related instruments
Asset Allocation
4.8
7.3
65.1
9.2
13.7
0 22 44 66 88... ... ...
Cash,Call & NCA
Reverse Repo/CBLO
Corporate Bond & NCDs
G-Sec / T-Bills
Equity
Average Maturity of Portfolio : 1.72 Years
Average Duration of Portfolio : 1.38 Years
YTM of Portfolio : 8.77 %
Rating Profile
4.8
7.3
13.7
29.3
35.8
9.2
0
Cash,Call & NCA
Reverse Repo/CBLO
Equity
High Investment Grade
Highest Investment Grade
Sovereign
Average AUM : 22 Cr.
Month End AUM : 22 Cr.
PortfolioSecurity Rating Weight
Equity 13.7Mahindra & Mahindra 2.3Hindustan Unilever 2.2Reliance Industries 2.2Larsen & Toubro 2.0Wipro 2.0ICICI Bank 1.9State Bank of India 1.0Government Securities / Treasury Bills 9.28.39% RJ SDL Spl 2019 Sov 9.2Corporate Bond & NCDs 65.1Talwandi Sabo Power Ltd AA- 13.3Power Finance Corporation Ltd. AAA 12.0Cholamandalam Investment And Fin. Co.Ltd
AA 9.1
Tata Capital Financial Services Ltd AA+ 9.1Power Grid Corporation Of India Ltd AAA 6.9Bank Of India A+ 4.5Nabha Power Ltd AAA 4.1Bajaj Finance Ltd AA+ 3.7Sundaram BNP Paribas Home FinanceLtd
AA 2.3
Reverse Repo/CBLO 7.3CBLO 7.3Cash,Call & NCA 4.8Cash & Other Net Current Assets 4.8
NAV*: Regular-Growth: 20.5782 MonthlyDividend:
11.6260
NAV*: Direct-Growth: 21.2026 MonthlyDividend:
11.9434
Long-Term Performance Jun 16Performance Fund
(%)
Benchmark
(%)
CRISIL 10 Yr
GILT (%)
Excess
Points (%)
Since Inception 5.97 7.73 5.32 -1.7730/06/2015 to 30/06/2016 3.81 8.60 10.01 -4.7930/06/2014 to 30/06/2015 8.25 11.05 11.76 -2.8030/06/2013 to 30/06/2014 6.63 8.28 -2.47 -1.65Last 3 years 6.21 9.31 6.24 -3.09Last 5 years 5.79 9.04 7.56 -3.25Last 8 years 5.81 8.73 7.39 -2.92
10,000 investedPerformance Fund Benchmark CRISIL 10 Yr GILT
Since Inception 20,578 25,285 19,071Last 3 years 11,984 13,063 11,994Last 5 years 13,254 15,425 14,400Last 8 years 15,714 19,542 17,693
Past performance may or may not be sustained in future. Returns/investment value areas of Jun 30, 2016. Returns are on a compounded annual basis for period more than one yearand absolute for one-year period and computed using NAV of Regular Plan-Growth Option.Value of 10,000 invested at inception is as on Jun 30, 2016.
Fund Facts: • Bank of India ratings are rated by Brick work (BW) and CRISIL . BW has assigned AA- for the same. An open-end income scheme • Launch: January 2004 • Bloomberg: SUNMIFG IN • Plans: Regular & Direct Options: Growth, DividendPay Out, Dividend Re-Investment (Monthly, Quarterly & Half Yearly), Bonus option discontinued w.e.f. 20-07-15 • Minimum Amount: 5000 • SIP/STP: Weekly 1000 • Monthly 250 • Quarterly 750 • Terms of offer: NAV • Exit Load: (w.e.f. 5thMarch 2013): 1% if redeemed within 9 months. * Portfolio Yield is computed only for the amount invested • Ratings are provided by CRISIL / CARE / FITCH / ICRA / BRW agencies.• Dividend History: Please visit www.sundarammutual.com • Bank ofIndia ratings are rated by Brick work ( BW ) and CRISIL . BW has assigned IND AA- for the same. * Fund NAV is as of last working day of the given month.For Product Labels, please refer Page 2. Disclosures: Page 39.
www.sundarammutual.com June 2016 Page 30 Sundaram Mutual FundDesigned by Morningstar

Sundaram Money FundPositioning: : Liquid Fund
Benchmark : CRISIL Liquid Fund Index
Fund Manager : Dwijendra SrivastavaSiddharth Chaudhary
Dwijendra Srivastava has got experience of about 12 yearsand is managing this fund since July 2010. SiddharthChaudhary has got experience of about 9 years in Banking& Fund Management and is managing this fund since Sep2010.
Investment ObjectiveTo provide a level of income consistent with thepreservation of capital, liquidity and lower level of risk,through investments made primarily in money market anddebt securities. The aim is to optimize returns whileproviding liquidity.
Asset Allocation
3.8
6.9
4.1
2.8
55.2
23.2
4.0
0 19 38 57 76 95... ...
Cash,Call & NCA
Reverse Repo/CBLO
Term Deposits
Corporate Bond & NCDs
Commercial Paper
Certificate of Deposits
G-Sec / T-Bills
Average Maturity of Portfolio : 0.12 Years
Average Duration of Portfolio : 0.12 Years
YTM of Portfolio : 7.39 %
Rating Profile
3.8
6.9
4.1
81.2
4.0
0... ... ... ... ... ... ...
Cash,Call & NCA
Reverse Repo/CBLO
Term Deposits
Highest Investment Grade
Sovereign
Average AUM : 7,023 Cr.
Month End AUM : 6,168 Cr.
PortfolioSecurity Rating Weight
Government Securities / Treasury Bills 4.091 DTB 29092016 Sov 3.591 DTB 25082016 Sov 0.5Certificate of Deposits 23.2Axis Bank Ltd A1+ 7.1Vijaya Bank A1+ 5.5Oriental Bank Of Commerce A1+ 3.9Punjab and Sind Bank A1+ 3.0Andhra Bank A1+ 2.2HDFC Bank Ltd A1+ 0.9Corporation Bank A1+ 0.4Kotak Mahindra Bank Ltd A1+ 0.1Indusind Bank Ltd A1+ 0.1Commercial Paper 55.2Tata Capital Financial Services Ltd A1+ 5.9ECL Finance Ltd A1+ 4.8National Fertilizers Ltd A1+ 4.7Aditya Birla Finance Ltd A1+ 4.7National Bank For Agriculture And RuralDevelopment
A1+ 4.2
Dewan Housing Finance Corporation Ltd A1+ 4.0Bajaj Finance Ltd A1+ 3.9Power Finance Corporation Ltd. A1+ 3.3Indiabulls Housing Finance Ltd A1+ 3.1Hero Fincorp Ltd A1+ 2.4Tata Power Solar Systems Ltd A1+ 2.2Tata Power Trading Company Ltd A1+ 2.2Tata Motors Ltd A1+ 1.6TVS Credit Services Ltd A1+ 1.6JM Financial Products Ltd A1+ 1.0Edelweiss Commodities Services Ltd A1+ 0.8Aditya Birla Nuvo Ltd A1+ 0.8Export-Import Bank Of India A1+ 0.8ICICI Securities Ltd A1+ 0.8Birla TMT Holdings Private Ltd A1+ 0.8Housing Development FinanceCorporation Ltd
A1+ 0.4
Tata Motors Finance Ltd A1+ 0.4TGS Investment And Trade Private Ltd A1+ 0.4The Tata Power Company Ltd A1+ 0.1Corporate Bond & NCDs 2.8Power Finance Corporation Ltd. AAA 2.4Shriram Transport Finance Company Ltd AA+ 0.4Term Deposits 4.1Yes Bank Ltd - 7.15 - 06/09/2016 4.1Reverse Repo/CBLO 6.9Reverse Repo 6.9Cash,Call & NCA 3.8Cash & Other Net Current Assets 3.8
NAV*: Regular-Growth: 32.5120 MonthlyDividend:
10.4985
NAV*: Direct-Growth: 32.5879 MonthlyDividend:
10.6402
Near-Term Performance Jun 16Performance Fund
(%)
Benchmark
(%)
CRISIL 91 D
TBill (%)
Excess
Points (%)
Last 7 days 7.58 8.20 6.84 -0.62Last 15 days 7.48 7.46 6.84 0.02Last 1 month 7.54 7.81 6.99 -0.27
Long-Term Performance Jun 16Performance Fund
(%)
Benchmark
(%)
CRISIL 91 D
TBill (%)
Excess
Points (%)
Since Inception 7.96 7.50 6.40 0.4530/06/2015 to 30/06/2016 8.01 7.88 7.54 0.1330/06/2014 to 30/06/2015 8.83 8.77 8.69 0.0630/06/2013 to 30/06/2014 9.47 9.68 8.81 -0.21Last 3 years 8.77 8.77 8.34 -0.01Last 5 years 9.01 8.62 8.26 0.39Last 8 years 8.09 7.73 6.68 0.36
10,000 investedPerformance Fund Benchmark CRISIL 91 D TBill
Since Inception 22,436 21,460 19,254Last 3 years 12,870 12,872 12,720Last 5 years 15,403 15,126 14,877Last 8 years 18,643 18,151 16,781
Past performance may or may not be sustained in future. Returns/investment value areas of Jun 30, 2016. Returns are on a compounded annual basis for period more than one yearand simple annualised basis for upto one-year period and computed using NAV of RegularPlan-Growth Option. Value of 10,000 invested at inception is as on Jun 30, 2016.
•Fund Facts: An open-end liquid scheme • Launch: March 2000 • Bloomberg: SUNMFIG IN • Plans: Regular & Direct • Options: Growth, Dividend Pay Out (Monthly), Dividend Reinvestment (Daily, Weekly, Fortnightly, Monthly & Quarterly), Bonus optiondiscontinued w.e.f. 20-07-15 • Minimum Amount: 1,000/- • Terms of offer: NAV • Exit Load: Nil * Portfolio Yield is computed only for the amount invested • Ratings are provided by CRISIL / CARE / FITCH / ICRA / BRW agencies • Dividend History:Please visit www.sundarammutual.com * Fund NAV is as on last day of the month.For Product Labels, please refer Page 2. Disclosures: Page 39.
www.sundarammutual.com June 2016 Page 31 Sundaram Mutual FundDesigned by Morningstar

Sundaram Ultra Short-Term FundPositioning: : Income Fund
Benchmark : CRISIL Liquid Fund Index
Fund Manager : Dwijendra SrivastavaSiddharth Chaudhary
Dwijendra Srivastava has got experience of about 12 yearsand is managing this fund since July 2010. SiddharthChaudhary has got experience of about 9 years in Banking& Fund Management and is managing this fund since Sep2010.
Investment ObjectiveTo provide a level of income consistent with liquiditythrough investments made primarily in money market anddebt securities.
Asset Allocation
0.8
3.2
1.0
20.1
21.8
53.2
0 18 36 54 72 90... ...
Cash,Call & NCA
Reverse Repo/CBLO
Term Deposits
Corporate Bond & NCDs
Commercial Paper
Certificate of Deposits
Average Maturity of Portfolio : 0.58 Years
Average Duration of Portfolio : 0.52 Years
YTM of Portfolio : 7.69 %
Rating Profile
0.8
3.2
1.0
1.0
94.0
0... ... ... ... ... ... ...
Cash,Call & NCA
Reverse Repo/CBLO
Term Deposits
High Investment Grade
Highest Investment Grade
Average AUM : 2,199 Cr.
Month End AUM : 2,008 Cr.
PortfolioSecurity Rating Weight
Certificate of Deposits 53.2Axis Bank Ltd A1+ 10.3IDBI Bank Ltd A1+ 9.1ICICI Bank Ltd A1+ 8.1IDFC Bank Ltd A1+ 7.3Corporation Bank A1+ 6.6National Bank For Agriculture And RuralDevelopment
A1+ 5.9
Export-Import Bank Of India A1+ 3.6Indusind Bank Ltd A1+ 2.5Commercial Paper 21.8Piramal Enterprises Ltd A1+ 6.0STCI Finance Ltd A1+ 5.1TVS Credit Services Ltd A1+ 2.4Religare Securities Ltd A1+ 2.4Family Credit Ltd A1+ 2.4JM Financial Products Ltd A1+ 2.0IFMR Capital Finance Private Ltd A1+ 1.2Export-Import Bank Of India A1+ 0.2Corporate Bond & NCDs 20.1Indiabulls Housing Finance Ltd AAA 4.1National Bank For Agriculture And RuralDevelopment
AAA 2.5
Capital First Ltd AA+ 2.5Power Finance Corporation Ltd. AAA 2.2Shriram Transport Finance Company Ltd AA+ 2.1Tata Capital Financial Services Ltd AA+ 1.3Housing Development FinanceCorporation Ltd
AAA 1.1
Cholamandalam Investment And Fin. Co.Ltd
AA 1.0
ONGC Mangalore Petrochemicals Ltd AAA 1.0LIC Housing Finance Ltd AAA 0.9Dewan Housing Finance Corporation Ltd AAA 0.8Small Industries Development Bank OfIndia
AAA 0.5
Axis Bank Ltd AAA 0.3Sundaram BNP Paribas Home FinanceLtd
AA 0.0
Term Deposits 1.0Idfc Bank Ltd - 6.9 - 24/08/2016 1.0Reverse Repo/CBLO 3.2Reverse Repo 3.2Cash,Call & NCA 0.8Cash & Other Net Current Assets 0.8
NAV*: Regular-Growth: 21.0808 MonthlyDividend:
10.9062
NAV*: Direct-Growth: 21.4049 MonthlyDividend:
11.0607
Near-Term Performance Jun 16Performance Fund
(%)
Benchmark
(%)
CRISIL 91 D
TBill (%)
Excess
Points (%)
Last 7 days 7.03 8.20 6.84 -1.16Last 15 days 7.43 7.46 6.84 -0.03Last 1 month 7.81 7.81 6.99 0.00
Long-Term Performance Jun 16Performance Fund
(%)
Benchmark
(%)
CRISIL 91 D
TBill (%)
Excess
Points (%)
Since Inception 8.45 7.65 6.56 0.8030/06/2015 to 30/06/2016 7.98 7.88 7.54 0.1130/06/2014 to 30/06/2015 8.61 8.77 8.69 -0.1630/06/2013 to 30/06/2014 9.82 9.68 8.81 0.14Last 3 years 8.80 8.77 8.34 0.03Last 5 years 9.21 8.62 8.26 0.59Last 8 years 8.40 7.73 6.68 0.67
10,000 investedPerformance Fund Benchmark CRISIL 91 D TBill
Since Inception 21,081 19,689 17,939Last 3 years 12,883 12,872 12,720Last 5 years 15,545 15,126 14,877Last 8 years 19,069 18,151 16,781
Past performance may or may not be sustained in future. Returns/investment value areas of Jun 30, 2016. Returns are on a compounded annual basis for period more than one yearand simple annualised basis for upto one-year period and computed using NAV of RegularPlan-Growth Option. Value of 10,000 invested at inception is as on Jun 30, 2016.
Fund Facts: An open-end income scheme • Launch: April 2007 • Bloomberg: SNDLPSG IN • Plans: Regular & Direct • Options: Growth, Dividend Pay Out (Weekly, Fortnightly, Monthly & Quarterly) & Dividend Reinvestment (Daily, Weekly, Fortnightly,Monthly & Quarterly), Bonus option discontinued w.e.f. 20-07-15 • Minimum Amount: 1000 • SIP/STP: Weekly 1000 • Monthly 1000 • Quarterly 3000; • Terms of offer: NAV • Exit Load: Nil.* Portfolio Yield is computed only for the amountinvested • Ratings are provided by CRISIL / CARE / FITCH / ICRA / BRW agencies • Dividend History: Please visit www.sundarammutual.com * Fund NAV is as of last working day of the given month.For Product Labels, please refer Page 2.Disclosures: Page 39.
www.sundarammutual.com June 2016 Page 32 Sundaram Mutual FundDesigned by Morningstar

Sundaram Bond SaverPositioning: : Medium-term Fixed IncomeBenchmark : CRISIL Composite Bond Fund
IndexFund Manager : Dwijendra Srivastava
Sandeep AgarwalDwijendra Srivastava has got experience of about 12 yearsand is managing this fund since July 2010. SandeepAgarwal has got 7 years of experience and managing thisfund since September 2012.
Investment ObjectiveTo earn regular income by investing primarily in fixed incomesecurities, which may be paid as dividend or reinvested atthe option of the Investor. A secondary objective is toattempt to keep the value of its units reasonably stable.
Asset Allocation
-2.5
4.3
26.7
9.8
61.7
-96-75-54-33-129
30517293114135
Cash,Call & NCA
Reverse Repo/CBLO
Corporate Bond & NCDs
Commercial Paper
G-Sec / T-Bills
Average Maturity of Portfolio : 6.93 YearsAverage Duration of Portfolio : 4.43 YearsYTM of Portfolio : 8.19 %
PortfolioSecurity Rating Weight
Government Securities / Treasury Bills 61.77.59% Govt Stock 2026 Sov 36.47.72% GS 2025 Sov 5.29.60% Maharashtra SDL 2023 Sov 2.87.68% Govt Stock 2023 Sov 2.68.43% Maharashtra SDL 2024 Sov 1.908.33% RJ SDL Spl 2025 Sov 1.408.29% RJ SDL Spl 2024 Sov 1.408.15% RJ SDL Spl 2021 Sov 1.408.27% RJ SDL Spl 2022 Sov 1.408.27% RJ SDL Spl 2023 Sov 1.408.01% RJ SDL Spl 2020 Sov 1.407.86% RJ SDL Spl 2019 Sov 1.408.19% RJ SDL Spl 2026 Sov 1.407.75% RJ SDL Spl 2018 Sov 1.4Commercial Paper 9.8STCI Finance Ltd A1+ 5.0JM Financial Products Ltd A1+ 4.9Corporate Bond & NCDs 26.7Housing Development FinanceCorporation Ltd
AAA 7.7
LIC Housing Finance Ltd AAA 7.3Talwandi Sabo Power Ltd AA- 6.5Nuclear Power Corporation Of India Ltd AAA 2.6Hindalco Industries Ltd AA- 2.6Reverse Repo/CBLO 4.3CBLO 4.3Cash,Call & NCA -2.5Cash & Other Net Current Assets -2.5
Average AUM : 198 Cr.Month End AUM : 194 Cr.
NAV*Growth Annual Dividend
Regular 42.8004 11.4150
Growth Annual Dividend
Direct 44.0156 11.7227
Long-Term Performance Jun 16Performance Fund
(%)Benchmark
(%)CRISIL 10 Yr
GILT(%)Excess
Points (%)
Since Inception 8.16 - -30/06/2015 to 30/06/2016 7.87 10.16 10.01 -2.2930/06/2014 to 30/06/2015 9.18 11.10 11.76 -1.9130/06/2013 to 30/06/2014 2.91 4.60 -2.47 -1.69Last 3 years 6.62 8.58 6.24 -1.96Last 5 years 8.18 9.02 7.56 -0.84Last 8 years 7.32 8.18 7.39 -0.86
10,000 investedPerformance Fund Benchmark CRISIL 10 Yr GILT
Since Inception 42,800 - -Last 3 years 12,123 12,805 11,994Last 5 years 14,825 15,410 14,400Last 8 years 17,602 18,761 17,693
Past performance may or may not be sustained in future. Returns/investment value areas of Jun 30, 2016. Returns are on a compounded annual basis for period more than one yearand absolute for one-year period and computed using NAV of Regular Plan- Growth Option.Value of 10,000 invested at inception is as on Jun 30, 2016.
Rating Profile
-2.5
4.3
9.1
27.5
61.7
-96-75-54-33-12930517293114135
Cash,Call & NCA
Reverse Repo/CBLO
High Investment Grade
Highest Investment Grade
Sovereign
Fund Facts: An open-end fixed income scheme • Launch: December 1997 • Bloomberg: SUNBONA IN • Plans: Regular & Direct • Options: Growth, Dividend Pay Out & Dividend Re-Investment (Quarterly, Half Yearly & Annual), Bonus option discontinued w.e.f. 20-07-15 • Minimum Amount: 5000 •Terms of offer: NAV •* Portfolio Yield is computed only for the amount invested Exit Load: 1% if redeemed within one year from the date of allotment. (w.e.f. August 24, 2012) • Ratings are provided by CRISIL / CARE / FITCH / ICRA / BRW agencies. Dividend History: Please visit www.sundarammutual.com* Fund NAV is as of last working day of the given month.For Product Labels, please refer Page 2. Disclosures: Page 39.
Sundaram Gilt FundPositioning: : An open end Gilt FundBenchmark : ICICI Securities MibexFund Manager : Dwijendra Srivastava
Sandeep AgarwalDwijendra Srivastava has got experience of about 12 yearsand is managing this fund since July 2010. SandeepAgarwal has got 7 years of experience and managing thisfund since September 2012.
Investment ObjectiveTo generate regular income through dedicated investmentsin gilts consistent with preservation of capital.
Asset Allocation
-13.4
22.9
90.5
-164-134-104-74-44-14164676106136166196226
Cash,Call & NCA
Reverse Repo/CBLO
G-Sec / T-Bills
Average Maturity of Portfolio : 7.21 YearsAverage Duration of Portfolio : 5.02 YearsYTM of Portfolio : 7.30 %
PortfolioSecurity Rating Weight
Government Securities / Treasury Bills 90.57.59% Govt Stock 2026 Sov 44.07.68% Govt Stock 2023 Sov 29.38.15% Govt Stock 2026 Sov 15.08.43% Maharashtra SDL 2024 Sov 2.1Reverse Repo/CBLO 22.9CBLO 22.9Cash,Call & NCA -13.4Cash & Other Net Current Assets -13.4
Average AUM : 34 Cr.Month End AUM : 34 Cr.
NAV*Growth Dividend
Regular 25.1550 11.6974
Growth Dividend
Direct 25.4993 11.9036
Long-Term Performance Jun 16Performance Fund
(%)Benchmark
(%)CRISIL 10 Yr
GILT(%)Excess
Points (%)
Since Inception 6.27 - -30/06/2015 to 30/06/2016 7.12 11.06 10.01 -3.9430/06/2014 to 30/06/2015 9.33 11.42 11.76 -2.0930/06/2013 to 30/06/2014 12.75 5.45 -2.47 7.30Last 3 years 9.71 9.28 6.24 0.43Last 5 years 10.10 9.72 7.56 0.38Last 8 years 7.43 8.96 7.39 -1.53
10,000 investedPerformance Fund Benchmark CRISIL 10 Yr GILT
Since Inception 25,155 - -Last 3 years 13,208 13,053 11,994Last 5 years 16,186 15,906 14,400Last 8 years 17,752 19,875 17,693
Past performance may or may not be sustained in future.Returns/investment value areas of Jun 30, 2016. Returns are on a compounded annual basis for period more than one yearand absolute for one year period and computed using NAV of Regular Plan-Growth Option.Value of 10,000 invested at inception is as on Jun 30, 2016.
Rating Profile
-13.4
22.9
90.5
... ... ...9 39 69 99
... ...
Cash,Call & NCA
Reverse Repo/CBLO
Sovereign
Fund Facts: An open-end fixed income scheme • Launch: May 2001 • Bloomberg: SUNGILG IN • Plans: Regular & Direct • Options: Growth, Dividend Pay Out & Dividend Re-Investment, Bonus option discontinued w.e.f. 20-07-15 • Minimum Amount: 5000 • Terms of offer: NAV • Exit Load: Nil •Ratings are provided by CRISIL / CARE / FITCH / ICRA / BRW agencies • Dividend History: Please visit www.sundarammutual.com.* Portfolio Yield is computed only for the amount invested. * Fund NAV is as of last working day of the given month.For Product Labels, please refer Page 2. Disclosures:Page 39.
www.sundarammutual.com June 2016 Page 33 Sundaram Mutual FundDesigned by Morningstar

Sundaram Income PlusPositioning: : An open end Income FundBenchmark : CRISIL Composite Bond Fund
IndexFund Manager : Sandeep AgarwalSandeep Agarwal has got 7 years of experience andmanaging this fund since September 2012.
Investment ObjectiveTo obtain high yields by investing in fixed income securities.Capital appreciation is secondary objective whenconsistent with its primary objective.
Asset Allocation
1.5
1.0
40.5
33.5
23.5
0 14 28 42 56 70 84 98
Cash,Call & NCA
Reverse Repo/CBLO
Corporate Bond & NCDs
Commercial Paper
Certificate of Deposits
Average Maturity of Portfolio : 1.10 YearsAverage Duration of Portfolio : 0.50 YearsYTM of Portfolio : 7.76 %
PortfolioSecurity Rating Weight
Certificate of Deposits 23.5Corporation Bank A1+ 10.3IDBI Bank Ltd A1+ 6.6National Bank For Agriculture And RuralDevelopment
A1+ 3.3
ICICI Bank Ltd A1+ 3.3Commercial Paper 33.5Tata Power Solar Systems Ltd A1+ 6.8Tata Power Trading Company Ltd A1+ 6.8STCI Finance Ltd A1+ 6.7Piramal Enterprises Ltd A1+ 6.7JM Financial Products Ltd A1+ 6.5Corporate Bond & NCDs 40.5Power Finance Corporation Ltd. AAA 10.5Indiabulls Housing Finance Ltd AAA 9.5National Housing Bank AAA 7.0National Bank For Agriculture And RuralDevelopment
AAA 6.9
Housing Development FinanceCorporation Ltd
AAA 3.5
Shriram Transport Finance Company Ltd AA+ 1.6Dewan Housing Finance Corporation Ltd AAA 1.4Indian Railway Finance Corporation Ltd AAA 0.2Reverse Repo/CBLO 1.0CBLO 1.0Cash,Call & NCA 1.5Cash & Other Net Current Assets 1.5
Average AUM : 143 Cr.Month End AUM : 144 Cr.
NAV*Growth Monthly Dividend
Regular 22.6045 11.6158
Growth Monthly Dividend
Direct 22.7718 11.7001
Long-Term Performance Jun 16Performance Fund
(%)Benchmark
(%)CRISIL 10 Yr
GILT(%)Excess
Points (%)
Since Inception 6.03 6.84 6.45 -0.8130/06/2015 to 30/06/2016 7.57 10.16 10.01 -2.5930/06/2014 to 30/06/2015 11.03 11.10 11.76 -0.0730/06/2013 to 30/06/2014 9.69 4.60 -2.47 5.09Last 3 years 9.42 8.58 6.24 0.84Last 5 years 8.25 9.02 7.56 -0.77Last 8 years 6.22 8.18 7.39 -1.95
10,000 investedPerformance Fund Benchmark CRISIL 10 Yr GILT
Since Inception 22,605 25,138 23,867Last 3 years 13,104 12,805 11,994Last 5 years 14,872 15,410 14,400Last 8 years 16,216 18,761 17,693
Past performance may or may not be sustained in future. Returns/investment value areas of Jun 30, 2016. Returns are on a compounded annual basis for period more than one yearand absolute for one-year period and computed using NAV of Regular Plan- Growth Option.Value of 10,000 invested at inception is as on Jun 30, 2016.
Rating Profile
1.5
1.0
97.6
0... ... ... ... ... ... ...
Cash,Call & NCA
Reverse Repo/CBLO
Highest Investment Grade
Fund Facts: An open-end fixed income scheme • Launch: July 2002 • Bloomberg: SUNINCG IN • Plans: Regular & Direct • Options: Growth, Dividend Payout (Weekly, Fortnightly, Monthly, Quarterly, Half Yearly) & Dividend Re-investment (Weekly, Fortnightly, Monthly) Bonus option discontinued w.e.f.20-07-15 • Minimum Amount: 5000 • Terms of offer: NAV • Exit Load: NIL (w.e.f. February 25, 2015) • Ratings are provided by CRISIL / CARE / FITCH / ICRA / BRW agencies • Dividend History: Please visit www.sundarammutual.com.* Portfolio Yield is computed only for the amount invested.*Fund NAV is as of last working day of the given month.For Product Labels, please refer Page 2. Disclosures: Page 39.
Sundaram Flexible Fund Short-Term PlanPositioning: : Income FundBenchmark : CRISIL Short Term Bond Fund
IndexFund Manager : Dwijendra Srivastava
Siddharth ChaudharyDwijendra Srivastava has got experience of about 12 yearsand is managing this fund since July 2010. SiddharthChaudhary has got experience of about 9 years in Banking& Fund Management and is managing this fund since Sep2010.
Investment ObjectiveTo generate reasonable returns by creating a portfoliocomprising substantially of fixed income instruments andmoney market instruments by keeping the interest rate riskof the fund low.
Asset Allocation
0.0
2.8
97.2
0 33 66 99... ... ... ...
Cash,Call & NCA
Reverse Repo/CBLO
Certificate of Deposits
Average Maturity of Portfolio : 0.67 YearsAverage Duration of Portfolio : 0.67 YearsYTM of Portfolio : 7.20 %
PortfolioSecurity Rating Weight
Certificate of Deposits 97.2Corporation Bank A1+ 11.0ICICI Bank Ltd A1+ 10.7Indusind Bank Ltd A1+ 10.7Small Industries Development Bank OfIndia
A1+ 10.4
IDBI Bank Ltd A1+ 9.5Axis Bank Ltd A1+ 8.3Vijaya Bank A1+ 8.0Andhra Bank A1+ 6.7Export-Import Bank Of India A1+ 6.5National Bank For Agriculture And RuralDevelopment
A1+ 5.1
Canara Bank A1+ 4.0HDFC Bank Ltd A1+ 2.7State Bank Of Hyderabad A1+ 1.3Bank Of Maharashtra A1+ 1.3Punjab and Sind Bank A1+ 1.1Reverse Repo/CBLO 2.8Reverse Repo 1.7CBLO 1.0Cash,Call & NCA 0.0Cash & Other Net Current Assets 0.0
Average AUM : 1,701 Cr.Month End AUM : 1,785 Cr.
NAV*Growth Monthly Dividend
Regular 24.3421 10.8409
Growth Monthly Dividend
Direct 24.4147 10.8448
Near-Term Performance Jun 16Performance Fund
(%)Benchmark
(%)CRISIL 1 Yr T-
Bill (%)Excess
Points (%)
Last 7 days 6.3 11.8 7.6 -5.5Last 15 days 7.3 11.1 7.2 -3.8Last 1 month 8.2 9.4 7.4 -1.2
Long-Term Performance Jun 16Performance Fund
(%)Benchmark
(%)CRISIL 1 Yr
TBill(%)Excess
Points (%)
Since Inception 8.38 8.00 6.25 0.3830/06/2015 to 30/06/2016 8.25 8.91 7.65 -0.6630/06/2014 to 30/06/2015 8.84 9.56 8.54 -0.7230/06/2013 to 30/06/2014 8.60 8.81 5.93 -0.20Last 3 years 8.56 9.09 7.37 -0.53Last 5 years 9.04 9.07 7.60 -0.03
10,000 investedPerformance Fund Benchmark CRISIL 1 Yr TBill
Since Inception 17,964 17,509 15,550Last 3 years 12,798 12,986 12,380Last 5 years 15,424 15,445 14,426
Past performance may or may not be sustained in future. Returns/investment value areas of Jun 30, 2016. Returns are on a compounded annual basis for period more than one yearand absolute for one-year period and computed using NAV of Regular Plan-Growth Option.Value of 10,000 invested at inception is as on Jun 30, 2016.
Rating Profile
0.0
2.8
97.2
0... ... ... ... ... ... ...
Cash,Call & NCA
Reverse Repo/CBLO
Highest Investment Grade
Fund Facts: Flexible Fund Short-Term Plan: An open-end income scheme • Launch: December 2004 • Bloomberg: SUFSTRG IN • Plans: Regular & Direct • Options: Growth, Dividend Pay Out (Monthly) & Dividend Re-Investment (Daily, Weekly & Monthly), Bonus option discontinued w.e.f. 20-07-15 •Minimum Amount: 5,000 • SIP/STP (into the scheme): Weekly 1000 • Monthly 250 • Quarterly 750 • Terms of offer: NAV • Exit Load: Nil (w.e.f.16/04/2013). • Ratings are provided by CRISIL / CARE / FITCH / ICRA / BRW agencies • Dividend History: Please visit www.sundarammutual.com* Fund NAV is as of last working day of the given month.For Product Labels, please refer Page 2. Disclosures: Page 39.
www.sundarammutual.com June 2016 Page 34 Sundaram Mutual FundDesigned by Morningstar

Sundaram Flexible Fund Flexible Income PlanPositioning: : Income FundBenchmark : CRISIL Composite Bond Fund
IndexFund Manager : Dwijendra Srivastava
Sandeep AgarwalDwijendra Srivastava has got experience of about 12 yearsand is managing this fund since July 2010. SandeepAgarwal has got 7 years of experience and managing thisfund since September 2012.
Investment ObjectiveTo generate reasonable returns by creating a portfoliocomprising substantially of fixed income instruments andmoney market instruments by keeping the interest rate riskof the fund low.
Asset Allocation
2.8
3.8
86.9
6.5
0 29 58 87... ... ... ...
Cash,Call & NCA
Reverse Repo/CBLO
Corporate Bond & NCDs
G-Sec / T-Bills
Average Maturity of Portfolio : 6.61 YearsAverage Duration of Portfolio : 4.76 YearsYTM of Portfolio : 8.20 %
PortfolioSecurity Rating Weight
Government Securities / Treasury Bills 6.57.68% Govt Stock 2023 Sov 6.5Corporate Bond & NCDs 86.9Power Grid Corporation Of India Ltd AAA 14.9Power Finance Corporation Ltd. AAA 14.9Rural Electrification Corporation Ltd AAA 14.9LIC Housing Finance Ltd AAA 11.3Export-Import Bank Of India AAA 9.1Reliance Ports And Terminals Ltd AAA 6.4Reliance Utilities And Power Private Ltd AAA 4.8Indian Railway Finance Corporation Ltd AAA 4.2Tata Sons Ltd AAA 3.2Housing Development FinanceCorporation Ltd
AAA 1.6
NHPC Ltd AAA 1.6Reverse Repo/CBLO 3.8CBLO 3.8Cash,Call & NCA 2.8Cash & Other Net Current Assets 2.8
Average AUM : 632 Cr.Month End AUM : 622 Cr.
NAV*Growth Annual Dividend
Regular 21.3571 12.5085
Growth
Direct 21.4587 -
Long-Term Performance Jun 16Performance Fund
(%)Benchmark
(%)CRISIL 10 Yr
GILT(%)Excess
Points (%)
Since Inception 7.00 7.78 5.77 -0.7830/06/2015 to 30/06/2016 9.73 10.16 10.01 -0.4430/06/2014 to 30/06/2015 10.79 11.10 11.76 -0.3130/06/2013 to 30/06/2014 5.10 4.60 -2.47 0.50Last 3 years 8.51 8.58 6.24 -0.07Last 5 years 7.66 9.02 7.56 -1.36
10,000 investedPerformance Fund Benchmark CRISIL 10 Yr GILT
Since Inception 16,361 17,251 15,039Last 3 years 12,780 12,805 11,994Last 5 years 14,469 15,410 14,400
Past performance may or may not be sustained in future. Returns/investment value areas of Jun 30, 2016. Returns are on a compounded annual basis for period more than one yearand absolute for one-year period and computed using NAV of Regular Plan- Growth Option.Value of 10,000 invested at inception is as on Jun 30, 2016.
Rating Profile
2.8
3.8
86.9
6.5
0... ... ... ... ... ... ...
Cash,Call & NCA
Reverse Repo/CBLO
Highest Investment Grade
Sovereign
Fund Facts: An open-end income scheme • Launch: December 2004 • Bloomberg: SUNFLRG IN • Plans: Regular & Direct Options: Growth, Dividend Pay Out & Dividend Re-Investment (Monthly, Quarterly, Half Yearly & Annual), Bonus option discontinued w.e.f. 20-07-15 • Minimum Amount: 5000 *Portfolio Yield is computed only for the amount invested• Terms of offer: NAV • Exit Load: Nil (w.e.f. May 10, 2013)• Ratings are provided by CRISIL/CARE/Fitch/IND agencies • Dividend History: Please visit www.sundarammutual.com * Fund NAV is as of last working day of the given month.ForProduct Labels, please refer Page 2. Disclosures: Page 39.
Sundaram Banking & PSU Debt FundPositioning: : An open end Income FundBenchmark : CRISIL Short Term Bond Fund
IndexFund Manager : Siddharth Chaudhary
Sandeep AgarwalSiddharth Chaudhary has got experience of about 9 yearsin Banking & Fund Management and is managing this fundsince March 2015. Sandeep Agarwal has got 7 years ofexperience and managing this fund since March 2015.
Investment ObjectiveTo generate income and capital appreciation by primarilyinvesting in a portfolio of high quality debt and moneymarket securities that are issued by banks, public sectorundertakings and public Financial Institutions.
Asset Allocation
1.3
1.3
33.7
63.8
0 21 42 63 84... ... ...
Cash,Call & NCA
Reverse Repo/CBLO
Corporate Bond & NCDs
Certificate of Deposits
Average Maturity of Portfolio : 1.86 YearsAverage Duration of Portfolio : 1.56 YearsYTM of Portfolio : 7.57 %
PortfolioSecurity Rating Weight
Certificate of Deposits 63.8IDBI Bank Ltd A1+ 20.7Corporation Bank A1+ 20.5Axis Bank Ltd A1+ 12.3Export-Import Bank Of India A1+ 10.3Corporate Bond & NCDs 33.7LIC Housing Finance Ltd AAA 11.0National Bank For Agriculture And RuralDevelopment
AAA 8.8
Housing Development FinanceCorporation Ltd
AAA 8.7
Power Finance Corporation Ltd. AAA 5.2Reverse Repo/CBLO 1.3CBLO 1.3Cash,Call & NCA 1.3Cash & Other Net Current Assets 1.3
Average AUM : 23 Cr.Month End AUM : 23 Cr.
NAV*Growth Monthly Dividend
Regular 10.9950 10.7474
Growth Monthly Dividend
Direct 11.0287 10.9645
Long-Term Performance Jun 16Performance Fund
(%)Benchmark
(%)Additional
Benchmark (%)Excess
Points (%)
Since Inception 7.80 8.73 - -0.9330/06/2015 to 30/06/2016 8.17 8.91 - -0.74
10,000 investedPerformance Fund Benchmark Additional
Benchmark (%)
Since Inception 10,995 11,115 -
Rating Profile
1.3
1.3
97.5
0... ... ... ... ... ... ...
Cash,Call & NCA
Reverse Repo/CBLO
Highest Investment Grade
Fund Facts: An open-end income scheme • Launch: March 2015 • Bloomberg: SUBANRG IN• Plans: Regular & Direct • Options: Growth, Dividend Pay Out (Weekly, Monthly, Quarterly) & Dividend Re-Investment (Daily, Weekly, Monthly, Quarterly), Bonus option discontinued w.e.f. 20-07-15 • MinimumAmount: Rs 5,000 • Terms of offer: NAV • Exit Load: Nil • Ratings are provided by CRISIL / CARE / FITCH / ICRA / BRW agencies • Dividend History: Please visit www.sundarammutual.com.* Portfolio Yield is computed only for the amount invested. *Fund NAV is as of last working day of the givenmonth.For Product Labels, please refer Page 2. Disclosures: Page 39.
www.sundarammutual.com June 2016 Page 35 Sundaram Mutual FundDesigned by Morningstar

Sundaram Select Debt Short Term Asset PlanPositioning: : Short-term Fixed Income
Benchmark : CRISIL Liquid Fund Index
Fund Manager : Dwijendra SrivastavaSandeep Agarwal
Dwijendra Srivastava has got experience of about 12 yearsand is managing this fund since July 2010. SandeepAgarwal has got 7 years of experience and managing thisfund since September 2012.
Investment ObjectiveTo earn regular income by investing primarily in fixed incomesecurities, which may be paid as dividend or reinvested atthe option of the investor. A secondary objective is toattempt to keep the value of its units reasonably stable.
Asset Allocation
-1.3
0.6
64.1
3.4
13.2
20.0
-96-74-52-30-814365880102124146
Cash,Call & NCA
Reverse Repo/CBLO
Corporate Bond & NCDs
Commercial Paper
Certificate of Deposits
G-Sec / T-Bills
Average Maturity of Portfolio : 3.33 Years
Average Duration of Portfolio : 2.11 Years
YTM of Portfolio : 7.85 %
Rating Profile
-1.3
0.6
2.5
78.2
20.0
-117-91-65-39-1313396591117143169
Cash,Call & NCA
Reverse Repo/CBLO
High Investment Grade
Highest Investment Grade
Sovereign
Average AUM : 883 Cr.
Month End AUM : 723 Cr.
PortfolioSecurity Rating Weight
Government Securities / Treasury Bills 20.07.68% Govt Stock 2023 Sov 4.97.59% Govt Stock 2026 Sov 3.507.86% RJ SDL Spl 2019 Sov 2.48.39% RJ SDL Spl 2019 Sov 1.808.33% RJ SDL Spl 2025 Sov 0.808.29% RJ SDL Spl 2024 Sov 0.808.15% RJ SDL Spl 2021 Sov 0.808.27% RJ SDL Spl 2022 Sov 0.808.27% RJ SDL Spl 2023 Sov 0.808.01% RJ SDL Spl 2020 Sov 0.808.19% RJ SDL Spl 2026 Sov 0.807.75% RJ SDL Spl 2018 Sov 0.88.32% Punjab SDL 2025 Sov 0.78.81% Haryana SDL 2018 Sov 0.57.59% Govt Stock 2029 Sov 0.0Certificate of Deposits 13.2Export-Import Bank Of India A1+ 3.3IDBI Bank Ltd A1+ 3.3Corporation Bank A1+ 3.3Small Industries Development Bank OfIndia
A1+ 3.3
Commercial Paper 3.4TGS Investment And Trade Private Ltd A1+ 3.4Corporate Bond & NCDs 64.1LIC Housing Finance Ltd AAA 10.9Power Finance Corporation Ltd. AAA 9.9National Bank For Agriculture And RuralDevelopment
AAA 5.9
National Housing Bank AAA 5.6Housing Development FinanceCorporation Ltd
AAA 5.5
Shriram Transport Finance Company Ltd AA+ 4.9Small Industries Development Bank OfIndia
AAA 4.2
Rural Electrification Corporation Ltd AAA 3.6Tata Capital Financial Services Ltd AA+ 3.2ONGC Mangalore Petrochemicals Ltd AAA 2.8Cholamandalam Investment And Fin. Co.Ltd
AA 2.5
Power Grid Corporation Of India Ltd AAA 2.4Indian Railway Finance Corporation Ltd AAA 1.4HDB Financial Services Ltd AAA 1.4Reverse Repo/CBLO 0.6CBLO 0.6Cash,Call & NCA -1.3Cash & Other Net Current Assets -1.3
NAV*: Regular-Growth: 26.4348 MonthlyDividend:
12.3125
NAV*: Direct-Growth: 27.1596 MonthlyDividend:
12.4658
Long-Term Performance Jun 16Performance Fund
(%)
Benchmark
(%)
CRISIL 1 Yr
TBill (%)
Excess
Points (%)
Since Inception 7.28 6.79 5.90 0.5030/06/2015 to 30/06/2016 7.85 7.88 7.65 -0.0330/06/2014 to 30/06/2015 9.06 8.77 8.54 0.2930/06/2013 to 30/06/2014 8.54 9.68 5.93 -1.14Last 3 years 8.48 8.77 7.37 -0.29Last 5 years 9.70 8.62 7.60 1.09Last 8 years 7.93 7.73 6.62 0.19
10,000 investedPerformance Fund Benchmark CRISIL 1 Yr TBill
Since Inception 26,435 24,793 22,095Last 3 years 12,768 12,872 12,380Last 5 years 15,898 15,126 14,426Last 8 years 18,416 18,151 16,707
Past performance may or may not be sustained in future. Returns/investment value areas of Jun 30, 2016. Returns are on a compounded annual basis for period more than one yearand absolute for one-year period and computed using NAV of Regular Plan-Growth Option.Value of 10,000 invested at inception is as on Jun 30, 2016.
Fund Facts: An open-end fixed income scheme • Launch: September 2002 • Bloomberg: SNDSTAG IN • Plans: Regular & Direct • Options: Growth, Dividend Pay Out (Weekly, Fortnightly, Monthly, Quarterly, HalfYearly, Annual) & Dividend Re-Investment(Weekly, Fortnightly, Monthly), Bonus option discontinued w.e.f. 20-07-15 • Minimum Amount: 5000 • Terms of offer: NAV • Exit Load: Nil (w.e.f. September 30, 2014) • Dividend History: Please visit www.sundarammutual.com.* Portfolio Yield iscomputed only for the amount invested • Ratings are provided by CRISIL / CARE / FITCH / ICRA / BRW agencies.* Fund NAV is as of last working day of the given month.For Product Labels, please refer Page 2. Disclosures: Page 39.
www.sundarammutual.com June 2016 Page 36 Sundaram Mutual FundDesigned by Morningstar

18.7135
12.9185
13.5672
13.9621
14.0713
13.8423
13.4779
12.2230
12.3625
13.8476
13.9941
14.1829
14.3168
30.8219
31.3947
Dividend History Equity & Balanced FundsSundaram Growth Fund
Plan Record Date % per unit NAVRegular 29/09/1999 20.0 2.00 18.0100
Regular 15/05/2000 30.0 3.00 16.5100
Regular 22/01/2003 20.0 2.00 12.7500
Regular 11/07/2003 15.0 1.50 12.7029
Regular 26/09/2003 20.0 2.00 13.8651
Regular 30/01/2004 55.0 5.50 16.3450
Regular 11/03/2005 20.0 2.00 14.8026
Regular 03/10/2005 15.0 1.50 15.7881
Regular 03/02/2006 22.5 2.25 16.9088
Regular 31/05/2006 35.0 3.50 15.6277
Regular 16/11/2007 65.0 6.50 16.8477
Regular 19/02/2010 20.0 2.00 12.6986
Direct 25/04/2014 15.0 1.50 14.0192
Regular 25/04/2014 15.0 1.50 13.9282
Direct 25/03/2015 41.9 4.19 15.9634
Regular 25/03/2015 40.3 4.03 15.7384
Sundaram Select Mid CapPlan Record Date % per unit NAVRegular 27/06/2003 25.0 2.50 12.9763
Regular 21/11/2003 40.0 4.00 17.2790
Regular 27/02/2004 35.0 3.50 14.3580
Regular 17/09/2004 20.0 2.00 13.1843
Regular 18/02/2005 20.0 2.00 15.0341
Regular 23/09/2005 20.0 2.00 17.3439
Regular 17/02/2006 25.0 2.50 20.0785
Regular 18/08/2006 20.0 2.00 20.9924
Regular 27/10/2006 40.0 4.00 17.0980
Regular 09/02/2007 25.0 2.50 16.2821
Regular 24/04/2009 10.0 1.00 10.5291
Regular 04/09/2009 10.0 1.00 17.7666
Regular 20/11/2009 15.0 1.50 18.7957
Regular 05/02/2010 15.0 1.50 17.4552
Regular 12/11/2010 20.0 2.00 21.3708
Direct 25/10/2013 10.0 1.00 18.0744
Regular 25/10/2013 10.0 1.00 18.0130
Regular 21/03/2014 10.0 1.00 18.7068
Direct 21/03/2014 10.0 1.00 18.7968
Direct 10/10/2014 10.0 1.00 27.4620
Regular 10/10/2014 10.0 1.00 27.1509
Direct 12/06/2015 10.0 1.00 31.8043
Regular 12/06/2015 10.0 1.00 31.3029
Direct 23/03/2016 10.0 1.00
Regular 23/03/2016 10.0 1.00
Sundaram Tax SaverPlan Record Date % per unit NAVRegular 26/03/2004 50.0 5.00 15.9938
Regular 28/01/2005 50.0 5.00 18.1404
Regular 30/09/2005 30.0 3.00 18.2146
Regular 03/03/2006 30.0 3.00 19.6287
Regular 25/08/2006 15.0 1.50 15.9708
Regular 08/12/2006 25.0 2.50 15.0084
Regular 23/03/2007 20.0 2.00 14.4832
Regular 28/12/2007 30.0 3.00 19.0117
Regular 28/03/2008 15.0 1.50 12.5348
Regular 18/09/2009 10.0 1.00 14.8173
Regular 29/01/2010 20.0 2.00 13.6615
Regular 19/03/2010 10.0 1.00 12.0734
Plan Record Date % per unit NAVRegular 16/12/2010 15.0 1.50 12.4542
Regular 09/05/2014 5.0 0.50 12.4184
Direct 09/05/2014 5.0 0.50 12.4583
Direct 19/09/2014 5.0 0.50 14.6522
Regular 19/09/2014 5.0 0.50 14.5717
Regular 26/12/2014 5.0 0.50 14.6950
Direct 26/12/2014 5.0 0.50 14.7920
Regular 13/03/2015 5.0 0.50 15.6900
Direct 13/03/2015 5.0 0.50 15.8056
Direct 19/06/2015 5.0 0.50 14.9176
Regular 19/06/2015 5.0 0.50 14.7880
Direct 18/09/2015 5.0 0.50
Regular 18/09/2015 5.0 0.50
Direct 24/12/2015 5.0 0.50
Regular 24/12/2015 5.0 0.50
Direct 11/03/2016 5.0 0.50
Regular 11/03/2016 5.0 0.50
Direct 24/06/2016 5.0 0.50
Regular 24/06/2016 5.0 0.50
Sundaram Balanced FundPlan Record Date % per unit NAVRegular 28/11/2003 35.0 3.50 15.8144
Regular 18/03/2005 42.5 4.25 16.1315
Regular 28/10/2005 20.0 2.00 13.1592
Regular 14/12/2007 30.0 3.00 19.4805
Regular 08/05/2009 15.0 1.50 11.1517
Regular 11/09/2009 10.0 1.00 15.2120
Regular 11/03/2011 60.0 6.00 16.4776
Direct 28/08/2015 0.5 0.05 14.1545
Regular 28/08/2015 0.5 0.05 13.9261
Regular 18/09/2015 0.5 0.05
Direct 18/09/2015 0.5 0.05
Regular 02/11/2015 0.5 0.05
Direct 02/11/2015 0.5 0.05 14.2025
Regular 23/11/2015 0.5 0.05 13.7251
Direct 23/11/2015 0.5 0.05 13.9624
Regular 18/12/2015 0.5 0.05
Direct 18/12/2015 0.5 0.05 13.8045
Direct 22/01/2016 0.5 0.05 13.1578
Regular 22/01/2016 0.5 0.05 12.9253
Direct 22/02/2016 0.5 0.05
Regular 22/02/2016 0.5 0.05 12.6857
Direct 18/03/2016 0.5 0.05 13.2807
Regular 18/03/2016 0.5 0.05 13.0375
Regular 22/04/2016 0.5 0.05 13.4214
Direct 22/04/2016 0.5 0.05 13.6826
Direct 20/05/2016 0.5 0.05 13.8413
Regular 20/05/2016 0.5 0.05 13.5745
Regular 17/06/2016 0.5 0.05 14.1352
Direct 17/06/2016 0.5 0.05 14.4157
Sundaram Select FocusPlan Record Date % per unit NAVRegular 20/06/2003 20.0 2.00 12.5018
Regular 12/09/2003 25.0 2.50 14.1481
Regular 20/08/2004 40.0 4.00 14.7882
Regular 04/03/2005 20.0 2.00 14.6757
Regular 27/01/2006 20.0 2.00 18.7917
Regular 02/06/2006 50.0 5.00 18.1959
Regular 24/11/2006 35.0 3.50 12.8259
Plan Record Date % per unit NAVRegular 30/11/2007 65.0 6.50 15.2286
Regular 26/03/2010 20.0 2.00 12.9233
Regular 10/12/2010 20.0 2.00 12.0333
Sundaram S.M.I.L.E FundPlan Record Date % per unit NAVRegular 14/10/2005 10.0 1.00 13.0045
Regular 10/03/2006 10.0 1.00 15.5295
Regular 23/02/2007 20.0 2.00 13.5046
Regular 07/12/2007 60.0 6.00 17.8655
Regular 31/07/2009 20.0 2.00 14.0713
Regular 26/03/2010 30.0 3.00 14.9741
Regular 08/04/2011 10.0 1.00 12.4419
Direct 02/05/2014 10.0 1.00 13.4810
Regular 02/05/2014 10.0 1.00 13.3788
Direct 14/11/2014 10.0 1.00 19.9305
Regular 14/11/2014 10.0 1.00 19.6876
Regular 12/06/2015 10.0 1.00 20.1145
Direct 12/06/2015 10.0 1.00 20.4224
Direct 18/03/2016 10.0 1.00
Regular 18/03/2016 10.0 1.00 18.3781
Sundaram Financial Services OpportunitiesPlan Record Date % per unit NAVRegular 12/06/2009 10.0 1.00 11.8580
Regular 06/11/2009 20.0 2.00 14.0743
Regular 18/02/2011 30.0 3.00 15.4510
Direct 25/04/2014 15.0 1.50 13.2483
Regular 25/04/2014 15.0 1.50 13.1526
Sundaram Entertainment OpportunitiesPlan Record Date % per unit NAVRegular 05/06/2009 10.0 1.00 12.6534
Regular 12/03/2010 20.0 2.00 13.7327
Regular 04/07/2014 10.0 1.00 12.8115
Sundaram Rural IndiaPlan Record Date % per unit NAVRegular 17/11/2006 10.0 1.00 11.4221
Regular 24/12/2010 30.0 3.00 14.6803
Direct 02/05/2014 10.0 1.00 12.1832
Regular 02/05/2014 10.0 1.00 13.1157
Sundaram PSU OpportunitiesPlan Record Date % per unit NAVRegular 07/01/2011 10.0 1.00 11.3935
Sundaram Equity MultiplierPlan Record Date % per unit NAVRegular 20/12/2007 30.0 3.00 16.4246
Direct 02/05/2014 10.0 1.00 12.7558
Regular 02/05/2014 10.0 1.00 12.6689
Sundaram Global Advantage FundPlan Record Date % per unit NAVDirect 31/05/2013 4.0 0.40 13.9784
Regular 31/05/2013 10.4 1.04 13.9118
Direct 28/11/2014 10.0 1.00 14.4304
Regular 28/11/2014 10.0 1.00 13.6089
Sundaram Select Micro CapPlan Record Date % per unit NAV
Series IDirect 28/04/2014 5.0 0.50 11.7981
Regular 28/04/2014 5.0 0.50 11.7346
Direct 06/06/2014 10.0 1.00 14.9732
www.sundarammutual.com June 2016 Page 37 Sundaram Mutual FundDesigned by Morningstar
13.3042

16.1222
Dividend History Equity & Balanced FundsPlan Record Date % per unit NAV
Series IRegular 06/06/2014 10.0 1.00 14.8620
Direct 14/08/2014 10.0 1.00 15.1717
Regular 14/08/2014 10.0 1.00 15.0027
Direct 17/10/2014 10.0 1.00 15.8570
Regular 17/10/2014 10.0 1.00 15.6212
Regular 05/12/2014 15.0 1.50 17.2576
Direct 05/12/2014 15.0 1.50 17.5761
Regular 13/02/2015 5.0 0.50 17.0585
Direct 13/02/2015 5.0 0.50 17.4601
Regular 26/05/2015 10.0 1.00 16.3419
Direct 26/05/2015 10.0 1.00 16.8179
Direct 07/08/2015 5.0 0.50 17.9291
Regular 07/08/2015 5.0 0.50 17.3558
Regular 08/01/2016 5.0 0.50
Direct 08/01/2016 5.0 0.50 16.6793
Series IIDirect 28/04/2014 5.0 0.50 11.7732
Regular 28/04/2014 5.0 0.50 11.7235
Regular 06/06/2014 10.0 1.00 14.8452
Direct 06/06/2014 10.0 1.00 14.9380
Regular 14/08/2014 10.0 1.00 14.9777
Direct 14/08/2014 10.0 1.00 15.1266
Direct 17/10/2014 10.0 1.00 15.8131
Regular 17/10/2014 10.0 1.00 15.5998
Direct 05/12/2014 15.0 1.50 17.5008
Regular 05/12/2014 15.0 1.50 17.2095
Direct 13/02/2015 5.0 0.50 17.3393
Regular 13/02/2015 5.0 0.50 16.9682
Direct 26/05/2015 10.0 1.00 16.7000
Regular 26/05/2015 10.0 1.00 16.2547
Regular 07/08/2015 5.0 0.50 17.2845
Direct 07/08/2015 5.0 0.50 17.8216
Direct 08/01/2016 5.0 0.50 16.5829
Series IIRegular 08/01/2016 5.0 0.50 16.0594
Series IIIRegular 23/05/2014 5.0 0.50 13.9001
Direct 23/05/2014 5.0 0.50 13.9624
Direct 06/06/2014 10.0 1.00 14.7634
Regular 06/06/2014 10.0 1.00 14.6855
Direct 14/08/2014 10.0 1.00 14.9148
Regular 14/08/2014 10.0 1.00 14.7826
Direct 17/10/2014 10.0 1.00 15.5716
Regular 17/10/2014 10.0 1.00 15.3778
Direct 05/12/2014 15.0 1.50 17.1571
Regular 05/12/2014 15.0 1.50 16.8904
Regular 13/02/2015 5.0 0.50 16.6814
Direct 13/02/2015 5.0 0.50 17.0259
Regular 26/05/2015 10.0 1.00 15.9750
Direct 26/05/2015 10.0 1.00 16.3927
Regular 07/08/2015 5.0 0.50 16.9604
Direct 07/08/2015 5.0 0.50 17.4643
Direct 08/01/2016 5.0 0.50 16.2344
Regular 08/01/2016 5.0 0.50 15.7428
Series IVRegular 30/05/2014 5.0 0.50 13.2421
Direct 30/05/2014 5.0 0.50 13.2921
Regular 20/06/2014 10.0 1.00 13.8867
Direct 20/06/2014 10.0 1.00 13.9549
Regular 14/08/2014 10.0 1.00 12.7889
Direct 14/08/2014 10.0 1.00 13.8974
Regular 17/10/2014 10.0 1.00 13.2447
Direct 17/10/2014 10.0 1.00 14.4084
Regular 05/12/2014 15.0 1.50 14.2595
Direct 05/12/2014 15.0 1.50 15.9908
Direct 13/02/2015 5.0 0.50 15.7648
Regular 13/02/2015 5.0 0.50 15.4627
Series IVRegular 26/05/2015 10.0 1.00 14.7589
Direct 26/05/2015 10.0 1.00 15.1285
Regular 07/08/2015 5.0 0.50 15.5428
Direct 07/08/2015 5.0 0.50 15.9884
Regular 08/01/2016 5.0 0.50 14.4473
Direct 08/01/2016 5.0 0.50 14.8834
Series VRegular 13/02/2015 5.0 0.50 12.7304
Direct 13/02/2015 5.0 0.50 12.8560
Regular 07/08/2015 5.0 0.50 13.8199
Direct 07/08/2015 5.0 0.50 14.0633
Regular 08/01/2016 5.0 0.50 13.4502
Direct 08/01/2016 5.0 0.50 13.7073
Series VIRegular 07/08/2015 5.0 0.50 12.7844
Direct 07/08/2015 5.0 0.50 12.9841
Series VIIDirect 07/08/2015 5.0 0.50 12.8045
Regular 07/08/2015 5.0 0.50 12.6342
Sundaram Equity PlusPlan Record Date % per unit NAVRegular 11/07/2014 10.0 1.00 11.4447
Direct 11/07/2014 10.0 1.00 11.5413
Sundaram TOP 100Plan Record Date % per unit NAV
Series IDirect 12/12/2014 5.0 0.50 11.7027
Regular 12/12/2014 5.0 0.50 11.5734
Sundaram Infrastructure Advantage FundPlan Record Date % per unit NAVRegular 18/03/2016 10.0 1.00 22.2884
Direct 18/03/2016 10.0 1.00 22.5989
www.sundarammutual.com June 2016 Page 38 Sundaram Mutual FundDesigned by Morningstar

DisclosuresPast performance may or may not be sustained in future and should not be used as a basis for comparison with other investments. Past performance is no guarantee of future result. Mutual Fund investments are subject to market risks, read allscheme related documents carefully. There can be no assurance or guarantee that fund's objectives will be achieved. NAV may go up or down, depending on the factors and forces affecting the securities market. The names of the schemes donot in any manner indicate either quality or future prospects and returns.
For more details on fund-specific features, detailed risk factors and information onSundaram Asset Management, please read the Statement of Additional Informationand Scheme Information Document available at www.sundarammutual.com.Specific to information in the Fact Sheet: Portfolio Attributes: For SundaramMoney Fund and Sundaram Bond Saver, the portfolio attributes indicated are featuresthat would normally be adhered to. There could also be changes if there are significantshifts in underlying of the fixed-income market. Disclaimer for dividend: Dividendis declared on the face value of 10 per unit. After declaration and payment of dividend(including re-investment), the ex-dividend NAV will decline to the extent of the dividendpayment. Exposure to derivatives: The value indicated for derivatives representsthe exposure to equity through to index futures, index options, stock futures and stockoptions. The margin may be only a proportion of the exposure and to the extent, it islower, cash in the fund’s accounts will be higher. Portfolio Weights & NAV: Stockand sector weights have been rounded to one-decimal place and so may not addexactly to 100%. NAV information in this document is as on June 30, 2016 unlessotherwise specified. Returns are based on NAV as of June 30, 2016Average AUMfor month June 2016. Returns: As per the SEBI standards for performance reporting,“since inception” returns are calculated based on 10 invested at inception of thefunds. For this purpose the inception date is deemed to be the date of allotment.Returns are computed using the NAV of Regular Plan - Growth Option where a separateDividend and Growth option is available from inception and an adjusted-series of NAVfor Sundaram Growth Fund and Sundaram Tax Saver for dividends declared beforeseparate Dividend & Growth Options were introduced. Returns for period in excess ofone year is on a compounded annual basis; the returns are net of fees and expensesbut before taking into effect of entry load. Returns to investors may be lower to theextent of entry load and timing of investment in the fund. Returns are net of feesand expenses. Past performance may or may not be sustained in future and thenumbers should not be used as a basis for comparison with other investments.Performance Analysis are on an annualized basis as of June 30, 2016 Computationis based on the month-end NAV of the fund, designated benchmark of the schemeand CNX Nifty. The risk free Index is MIBOR Overnight.
Data Source: Bloomberg; Computation: In-houseFund Features: Scheme Type, Investment Objective, Plans, Options, Entry Load andExit Load have been outlined in the respective fund-specific Fact Sheet pages. NAVwill be published on every business day.Asset Allocation: Sundaram Growth Fund: • Equity and equity-relatedinstruments (including investment in derivatives): 80%-100% • Money marketinstruments up to 20% • Exposure in derivative shall not exceed 50% of the net assetsof the scheme • The Scheme may invest up to 35 of the net assets in overseassecurities. Sundaram Select Focus: • Equity and equity-related instruments(including investment in derivatives): 75%-100% • Cash, cash equivalents, moneymarket instruments: Not exceeding 25% • Exposure in derivative shall not exceed 50%of the net assets of the scheme • The Scheme may invest up to 35% of the net assetsin overseas securities. The scheme can at any time hold upto a maximum of 50 stocks.Sundaram Select Mid Cap: • Equity and equity-related instruments (includinginvestment in derivatives): 75%-100% • Cash, cash equivalents, money marketinstruments: not exceeding 25% • Exposure in derivative shall not exceed 50% of thenet assets of the scheme • The Scheme may invest up to 35% of the net assets inoverseas securities. Sundaram S.M.I.L.E Fund (Small and Medium IndianLeading Equities): • Equity instruments – small-cap and mid-cap stocks (includinginvestments in derivatives): At least 65% • Other Equities (including investment inderivatives): Not exceeding 35% • Money market instruments: Not exceeding 15% •Exposure in derivative shall not exceed 50% of the net assets of the scheme • TheScheme may invest up to 35% of the net assets in overseas securities. SundaramTax Saver: • Equity & equity-related instruments: 80%-100% • Corporate and PSUBonds Up to 20% • Money market instruments: Up to 20%. In conformity with GOInotification dated 28-Dec-1992 on ELSS 1992, under normal circumstances, aminimum of 80% of the funds of this Scheme will be invested in equities or equityrelated instruments. The balance portion would be invested in debt and money marketinstruments. Sundaram Equity Multiplier: • Equity & equity-related Instruments(including investment in derivatives): 65%-100% • Debt instruments includingsecuritised debt & Money Market Instruments: up to 35% (securitised debt up to amaximum of 30%) • Exposure in derivative shall not exceed 50% of the net assets ofthe scheme. Select Thematic Funds: Sundaram Infrastructure AdvantageFund: • Equity and Equity related instruments of companies Engaged in Infrastructuresector (including investment in derivatives) 65%–100% • Other Equities (Includinginvestment in Derivatives) 0%-35% • Fixed Income Instruments issued by Companiesengaged in Infrastructure Sector 0%–35% • Money Market Instruments 0%-15%Sundaram Rural India Fund: • Equity & equity-related securities of companies thatare focusing on Rural India (including investment in derivatives): 70%-100% • Otherequities (including investment in derivatives): 0%-30% • Money market instruments0%- 15% • Exposure in derivative shall not exceed 50% of the net assets of the scheme• The Scheme may invest up to 35% of the net assets in overseas securities. The fundmay also invest in equity and equity-related instruments listed in overseas markets aswell as overseas funds/ETFs that invest in or track agri-commodity stocks. The schemewill not invest in funds/ETFs that have direct exposure to commodities. SundaramPSU Opportunities Fund: • Equity & equityrelated Instruments in the targeted theme(including investment in derivatives): 65%-100% • Equity & equity-related Instrumentsother than the targeted theme (including investment in derivatives): up to 35% • Fixedincome/money market instruments: up to 35% • Exposure in derivative shall notexceed 50% of the net assets of the scheme • The Scheme may invest up to 35% ofthe net assets in overseas securities. Sundaram Balanced Fund: • Equity andequityrelated instruments (including investment in derivatives): 40%-75% • FixedIncome instruments: 25%-60%, Including securitised debt up to 10% • Exposure inderivative shall not exceed 50% of the net assets of the scheme • The Scheme mayinvest up to 35% of the net assets in overseas securities. Sundaram GlobalAdvantage: Unit of mutual funds and exchange-traded funds listed on overseas stockexchanges 85%-100%; Domestic Moneymarket instruments 0%-15%. SundaramEquity Plus: • Equity & equity-related instruments listed in India 65%-85% • Gold-ETF 15%-35% • Fixed Income & Money Market Instruments 0%-20%. Exposure toderivatives will be to 50% of the net asset value of the Scheme at the time oftransaction. Exposure to overseas securities shall also not exceed 35% of assets. Thetotal asset allocation including exposure to derivatives would not exceed 100% of thenet assets of the Scheme. Sundaram Select Micro Cap: • Equity & equity-relatedsecurities of micro-cap companies: 65%-100% • Other equity & equity-relatedsecurities: 0%-35% • Fixed Income and money market securities: 0%-35% SundaramTop 100: • Equity securities specified as eligible securities for RGESS: 95%-100% •Cash & Cash Equivalents and Money Market Instruments*: 0%-5% (*investment madein money market instruments shall have residual maturity of upto 91 days.) SundaramSelect Small Cap: Equity & equity-related securities of small-cap companies 65% •100% • Other equity & equity-related securities 0%-35% • Fixed Income and money
market securities 0%-35%. Sundaram World Brand Fund: Equity and Equity relatedInstruments listed on recognized overseas stock exchanges across the world*65%-100% • Domestic Fixed Income and Money Market Instruments 0%-35% *TheScheme will not have any exposure to equity and equity related securities issued byIndian securities and to companies listed in stock exchange(s) in India. SundaramValue Fund: Equity & Equity related securities 80%-100% • Fixed Income and moneymarket securities 0%-20%. Sector Funds: Sundaram Financial ServicesOpportunities: • Equity and equity related instruments of Indian companies engagedin Banking and Financial Services: 80%-100% • Other equities 0%-20% • Fixed Incomeand Money market instruments 0%-20% • Exposure in derivative shall not exceed 50%of the net assets of the scheme Sundaram Entertainment Opportunities: • Equityand equity related instruments of Indian companies engaged in Media andEntertainment Sector: 80%-100% • Other equities 0%-20% • Fixed Income and Moneymarket instruments 0%-20% • Exposure in derivative shall not exceed 50% of the netassets of the scheme Sundaram Money Fund: • Money Market Investments, debtsecurities (including securitised debt up to a maximum of 50% of the net asset valueof the scheme) 0% - 100%. The scheme shall invest in debt and money marketsecurities with maturity of up to 91 days only. Ultra Short-Term Fund: • Moneymarket securities and/ or debt securities with residual or average maturity of less thanor equal to 370 days or put options within a period not exceeding 370 days 70% - 100%• Debt securities which have residual or average maturity of more than 370 days 0%- 30% (Including Securitised Debt up to 30%). Sundaram Flexible Fund-Short TermPlan: • Money Market Instruments (CDs, CPs, CBLO, REPO, MIBOR Instruments,Debt Securities with initial maturity of less than one year/GOI Secs./Treasury Bills)65%- 100% • Fixed Income Instruments Government of India & Corporate DebtSecurities (including Securitised Debt) 0%-35%. Sundaram Flexible Fund-FlexibleIncome Plan: Fixed Income Instruments, Government of India & Corporate DebtSecurities (including Securitised Debt) 65%-100% • Money Market Instruments likeCPs, CBLO, REPO, MIBOR Instruments, Debt Securities with initial maturity of less thanone year/GOI Secs./Treasury Bills 0%-35% Investment in securitised debt will be up to35% of the net assets. Sundaram Bond Saver: • Debt instruments 65%-100% •Money market instruments 0%-40%. Sundaram Monthly Income Plan:Conservative Plan: • Government Securities 90%-100% • Debt Securities, MoneyMarket instruments & Cash (Including money at Call, other than securitised debt)90%-100% • Equity & Equity related securities 0%-10% • Investment in SecuritisedDebt will be up to 75% of the net assets of the Plan. Moderate Plan: • Governmentsecurities 80%-100% • Debt Securities, Money Market instruments & Cash (Includingmoney at Call, other than securitised debt) 80%-100% • Equity and equity-relatedsecurities 0%-20%. • Investment in Securitised Debt will be up to 75% of the netassets of the Plan. Aggressive Plan: • Government securities 70%-100% • DebtSecurities, Money Market instruments & Cash (Including money at Call, other thansecuritised debt) 70%-100% • Equity and equity-related securities 0%-30%. •Investment in Securitised Debt will be up to 70% of the net assets of the Plan.Pending deployment of funds in terms of the investment objective, the funds may beinvested in short-term deposits with scheduled commercial banks in accordance withapplicable SEBI guidelines.Sundaram Long Term Tax Advantage Fund: • Equity & Equity related securities80-100%; Fixed Income & Money Market Securities : 0-20%Scheme-Specific Risk Factors:Applicable for all funds: Change in Government policy in general and changes intax benefits applicable to mutual funds may impact the returns to Investors Applicableto equity schemes (except Sundaram Tax Saver): For any overseas investmentsin the equity funds, country risk, currency risk and geopolitical risk, to name a few.Sundaram Select Focus: Higher volatility due to a concentrated portfolio.Sundaram Select Mid Cap: Lack of liquidity at times and volatility. SundaramSmall and Medium Indian Leading Equities Fund (S.M.I.L.E) Fund: Small-capstocks are generally more illiquid. Sundaram Equity Multiplier: Risk of non-diversification. Sundaram Infrastructure Advantage Fund: Long gestationperiods; pace at which investments materialize; incidence of taxation, governmentpolicy & firm-level inefficiency. Sundaram Select Thematic Funds Rural IndiaFund: Vagaries of nature such as erratic monsoon, failure of crop & drought, to namea few; cyclical / seasonal factrs For any overseas investments relevant to rural-theme:country risk, currency risk and geopolitical risk. Sundaram Select Thematic FundsPSU Opportunities: Geo-political developments. As the schemes will invest in theinstruments of public sector companies, it will be affected by the government policieson PSU. As a thematic fund, there will be concentration risk compared to a diversifiedfund. For any overseas investments in the equity funds, country risk, currency risk andgeopolitical risk, to name a few. The Scheme may use techniques such as interest rateswaps, options on interest rates, futures and forward rate agreement and otherderivative instruments that are / may be permitted under SEBI/RBI Regulation. Thesetechniques and instruments, if imperfectly used, have the risk of the Scheme incurringlosses due to mismatches, particularly in a volatile market. Sundaram GlobalAdvantage: Currency risk, country risk, geo-political risk and emerging markets risk.Sundaram Equity Plus: Global demand-supply trends, purchases/sales by centralbanks, delays in bringing new mines on line, macro-economic variables, geo-politicalfactors, seasonality in demand, changes in duty and tariffs and liquidity may have animpact on prices of gold and consequently on the NAV of the Scheme to the extentinvestment is made in gold-ETF. Investment in ETFs will be subject to risks of theunderlying Scheme including tracking error. If and to the extent, the portfolio includesoverseas stocks, investors will be exposed to country risk, currency risk, geo-politicalrisk, legal restrictions and regulation changes in geography other than India. The equityportfolio will be subject to market risk, liquidity risk and non-diversification, to name afew. There is risk of capital loss and non attainment of the stated investment objective.This is a concise summary of Scheme-specific risk factors available in detail in theScheme Information Document. Sundaram Long Term Tax Advantage Fund: Thefund would be investing in equity and equity related instruments, debt and moneymarket instruments (such as term/notice money market,repos, reverse repos and anyalternative to the call money market as may be directed by the RBI). The liquidity ofthe scheme’s investment is inherently restricted by trading volumes and settlementperiods. In the event of an inordinately large number of redemption requests, or of arestructuring of the scheme’s investment portfolio, these periods may becomesignificant. In view of the same, the trustees have the right in their sole discretion tolimit redemptions (including suspending redemptions) under certain circumstances.Redemptions of units under the scheme is available only after a three year lock-inperiod from the date of allotment of units. Sundaram Select Micro Cap: To seekcapital appreciation by investing predominantly in equity/equity-related instruments ofcompanies that can be termed as micro-caps. A company whose market capitalisationis equal to or lower than that of the 301st stock by market cap on the NSE at the timeof investment will be considered to be in micro-cap category. Sundaram Top 100:To generate capital appreciation from a portfolio that is substantially constituted ofequity securities specified as eligible securities for Rajiv Gandhi Equity Savings Scheme,
2012. The Scheme may also invest a certain portion of its corpus in cash & cashequivalent and money market instruments from time to time of Sundaram TOP 100.Sector Funds: Sundaram Financial Services Opportunities: The scheme beingsector specific will be affected by the risks associated with the Financial Servicessector. Investing in a sectoral fund is based on the premise that the Fund will seek toinvest in companies belonging to a specific sector. This will limit the capability of theFund to invest in another sector. The fund would invest in equity and equity relatedsecurities of companies engaged in the financial services sector and henceconcentration risk is expected to be high. Also, as with all equity investing, there isthe risk that companies in that specific sector will not achieve its expected earningsresults, or that an unexpected change in the market or within the company will occur,both of which may adversely affect investment results. Thus investing in a sectorspecific fund could involve potentially greater volatility and risk. The risk factorsassociated with the Sectoral Fund are in addition to the standard risk factors applicableto all the Schemes of the Mutual Fund. Sundaram Entertainment Opportunities:The scheme being sector specific will be affected by the risks associated with theMedia sector. Investing in a sectoral fund is based on the premise that the Fund willseek to invest in companies belonging to a specific sector. This will limit the capabilityof the Fund to invest in another sector. The fund would invest in equity and equityrelated securities of companies engaged in the media sector and hence concentrationrisk is expected to be high. Also, as with all equity investing, there is the risk thatcompanies in that specific sector will not achieve its expected earnings results, or thatan unexpected change in the market or within the company will occur, both of whichmay adversely affect investment results. Thus investing in a sector specific fund couldinvolve potentially greater volatility and risk. The risk factors associated with theSectoral Fund are in addition to the standard risk factors applicable to all the Schemesof the Mutual Fund. Sundaram Money Fund: Sundaram Money Fund is a MoneyMarket Scheme. Changes in the prevailing rates of interest are likely to affect the valueof the scheme's holdings and consequently the value of the scheme's Units. Thescheme may use derivative instruments like Interest Rate Swaps, Forward RateAgreements or other derivative instruments for the purpose of hedging and portfoliobalancing and trading, as permitted under the Regulations and guidelines. Usage ofderivatives will expose the plans to certain risks inherent to such derivatives.Sundaram Ultra Short-Term Fund: Sundaram Ultra Short-Term Fund is not a MoneyMarket Scheme. Changes in the prevailing rates of interest are likely to affect the valueof the scheme's holdings and consequently the value of the scheme's Units. Thescheme may use derivative instruments like Interest Rate Swaps, Forward RateAgreements or other derivative instruments for the purpose of hedging and portfoliobalancing and trading, as permitted under the Regulations and guidelines. Usage ofderivatives will expose the plans to certain risks inherent to such derivatives.Sundaram Bond Saver: Changes in the prevailing rates of interest are likely to affectthe value of the scheme’s holdings and consequently the value of the scheme’s Units.Credit Risk: Credit Risk refers to the risk of default in interest (coupon) payment and/or principal repayment. All debt instruments except those issued by the Governmentof India carry this risk. Price Risk: As long as the Scheme will be invested, its Net AssetValue (NAV) is exposed to market fluctuations, and its value can go up as well as down.The portfolio of fixed-income securities that the Scheme invests in would be exposedto price changes on a day-to-day basis. These price changes may occur due toinstrument-specific factors as well as general macroeconomic conditions. In general,price of fixed-income securities go up when interest rates fall, and vice versa. MarketRisk: The Scheme may also be subject to price volatility due to such factors as interestsensitivity, market perception or the creditworthiness of the issuer and general marketliquidity. Risk associated with securitised debt is similar to the listed factors.General Risk Factors: All mutual funds and securities investments are subjectto market risks, and there can be no assurance or guarantee that fund'sobjectives will be achieved. NAV may go up or down, depending on thefactors and forces affecting the securities market. Main types are market risk,liquidity risk, credit risk and systemic risks. At times, liquidity of investments may beimpaired. There is uncertainty of dividend distribution and risk of capital loss. Pastperformance of the Sponsor/Asset Management Company/Fund does not indicate thefuture performance. Investors in the schemes are not being offered any guaranteed orindicated returns. The names of the schemes do not in any manner indicateeither quality or future prospects and returns.General Disclaimer: This document is issued by Sundaram Asset Management, aninvestment manager registered with the Securities and Exchange Board of India inIndia and is produced for information purposes only. It is not a prospectus or schemeinformation document offer document or an offer or solicitation to buy any securitiesor other investment or Scheme Information Document.Information and opinion contained in this document are published for the assistanceof the recipient only; they are not to be relied upon as authoritative or taken as asubstitution for exercise of judgment by any recipient. They are subject to changewithout any notice and not intended to provide the sole basis of any evaluation of theinstrument discussed or offer to buy. It is neither a solicitation to sell nor shall it formthe basis of or be relied upon in connection with any contract or commitmentwhatsoever or be taken as investment advice.The information and opinions contained in this communication have been obtainedfrom sources that Sundaram Asset Management believes to be reliable; norepresentation or warranty, express or implied, is made that such information isaccurate or complete and it should not be relied upon as such. Sundaram AssetManagement neither guarantees its accuracy and/or completeness nor does itguarantee to update the information from time to time.This communication is for private circulation only and for the exclusive and confidentialuse of the intended recipient(s) only. Any other distribution, use or reproduction of thiscommunication in its entirety or any part thereof is unauthorized and strictly prohibited.By accepting this document you agree to be bound by the foregoing limitations.This communication is for general information only without regard to specificobjectives, financial situations and needs of any particular person who may receive itand Sundaram Asset Management is not soliciting any action based on this document.Sundaram Asset Management in the discharge of its functions, may use any of thedata presented in this document for its decision-making purpose and is not bound todisclose the same. Copies of the Statement of Additional Information, SchemeInformation Document and application form with Key Information Memorandum maybe obtained from the offices of Sundaram Mutual offices and its authorized distributorsor downloaded from www.sundarammutual.com. For scheme specific risk factors,asset allocation, load structure, fund facts and taxation aspects please refer theStatement of Additional Information and Scheme Information Document availableonline and at branches/Investor Service Centres.Statutory: Mutual Fund: Sundaram Mutual Fund is a trust under Indian Trusts Act,1882 Sponsor: (Liability is to 1 lakh): Sundaram Finance Investment Manager:Sundaram Asset Management Company. Trustee: Sundaram Trustee Company.
For Product Labels, please refer Page 2.
Mutual Fund investments are subject to market risks, read all scheme related documents carefully.
www.sundarammutual.com June 2016 Page 39 Sundaram Mutual FundDesigned by Morningstar

Track Record Liquid/Fixed-Income Funds
Fund / Benchmark30/06/2015 to
30/06/2016 (%)30/06/2014 to
30/06/2015 (%)30/06/2013 to
30/06/2014 (%)Last 7 days
(%)Last 15 days
(%)Last 1 month
(%)Since Inception
Returns (%) 10,000
Sundaram Money Fund 8.0 8.8 9.5 7.6 7.5 7.5 8.0 22,436
Crisil Liquid Fund Index 7.9 8.8 9.7 8.2 7.5 7.8 7.5 21,460
CRISIL 91 Days T-Bill Index 7.5 8.7 8.8 6.8 6.8 7.0 6.4 19,254
Sundaram Ultra Short-Term Fund 8.0 8.6 9.8 7.0 7.4 7.8 8.5 21,081
Crisil Liquid Fund Index 7.9 8.8 9.7 8.2 7.5 7.8 7.7 19,689
CRISIL 91 Days T-Bill Index 7.5 8.7 8.8 6.8 6.8 7.0 6.6 17,939
Fund / Benchmark30/06/2015 to
30/06/2016 (%)30/06/2014 to
30/06/2015 (%)30/06/2013 to
30/06/2014 (%)Last 3 years
(%)Last 5 years
(%)Last 8 years
(%)Since Inception
Returns (%) 10,000
Sundaram Bond Saver 7.9 9.2 2.9 6.6 8.2 7.3 8.2 42,800
CRISIL Composite Bond Fund Index 10.2 11.1 4.6 8.6 9.0 8.2 - -
CRISIL 10 Yr GILT Index 10.0 11.8 -2.5 6.2 7.6 7.4 - -
Sundaram Flexible Fund Flexible Income Plan 9.7 10.8 5.1 8.5 7.7 - 7.0 16,361
CRISIL Composite Bond Fund Index 10.2 11.1 4.6 8.6 9.0 - 7.8 17,251
CRISIL 10 Yr GILT Index 10.0 11.8 -2.5 6.2 7.6 - 5.8 15,039
Sundaram Flexible Fund Short-Term Plan 8.3 8.8 8.6 8.6 9.0 - 8.4 17,964
CRISIL Short-Term Bond Fund Index 8.9 9.6 8.8 9.1 9.1 - 8.0 17,509
CRISIL 1 Yr T-Bill Index 7.7 8.5 5.9 7.4 7.6 - 6.3 15,550
Sundaram Gilt Fund 7.1 9.3 12.8 9.7 10.1 7.4 6.3 25,155
ICICI Securities Mibex TR INR 11.1 11.4 5.5 9.3 9.7 9.0 - -
CRISIL 10 Yr GILT Index 10.0 11.8 -2.5 6.2 7.6 7.4 - -
Sundaram Income Plus 7.6 11.0 9.7 9.4 8.3 6.2 6.0 22,605
CRISIL Composite Bond Fund Index 10.2 11.1 4.6 8.6 9.0 8.2 6.8 25,138
CRISIL 10 Yr GILT Index 10.0 11.8 -2.5 6.2 7.6 7.4 6.5 23,867
Sundaram Monthly Income Aggressive Plan(Equity of up to 30%)
7.7 15.0 10.9 11.2 9.1 - 8.0 16,286
CRISIL MIP Blended Index 8.6 11.1 8.3 9.3 9.0 - 8.4 16,639
CRISIL 10 Yr GILT Index 10.0 11.8 -2.5 6.2 7.6 - 6.8 15,117
Sundaram Monthly Income Conservative Plan(Equity of up to 10%)
9.2 10.8 -0.1 6.5 6.8 - 6.2 14,638
CRISIL MIP Blended Index 8.6 11.1 8.3 9.3 9.0 - 8.4 16,639
CRISIL 10 Yr GILT Index 10.0 11.8 -2.5 6.2 7.6 - 6.8 15,117
Sundaram Monthly Income Moderate Plan(Equity of up to 20%)
3.8 8.3 6.6 6.2 5.8 5.8 6.0 20,578
CRISIL MIP Blended Index 8.6 11.1 8.3 9.3 9.0 8.7 7.7 25,285
CRISIL 10 Yr GILT Index 10.0 11.8 -2.5 6.2 7.6 7.4 5.3 19,071
Sundaram Select Debt Short Term Asset Plan 7.9 9.1 8.5 8.5 9.7 7.9 7.3 26,435
Crisil Liquid Fund Index 7.9 8.8 9.7 8.8 8.6 7.7 6.8 24,793
CRISIL 1 Yr T-Bill Index 7.7 8.5 5.9 7.4 7.6 6.6 5.9 22,095
Total Expense Ratio for the Month:Scheme Regular Plan / Direct Plan: Sundaram Growth Fund: 2.91%/ 2.76%, Sundaram Tax Saver: 2.49%/ 2.34%, Sundaram Select Focus: 2.86%/ 2.71%, Sundaram Select Mid Cap: 2.30%/ 2.15%, Sundaram S.M.I.L.E Fund:2.50%/ 2.35%, Sundaram Equity Multiplier: 2.96%/ 2.81%, Sundaram Rural India Fund: 2.93%/ 2.43%, Sundaram Infrastructure Advantage Fund: 2.73%/ 2.58%, Sundaram Financial Services Opportunities: 2.95%/ 2.45%,Sundaram Entertainment Opportunities: 3.06%/ 2.91%, Sundaram PSU Opportunities: 3.06%/ 2.91%, Sundaram Global Advantage: 1.53%/ 1.28%, Sundaram Equity Plus: 2.87%/ 2.22%, Sundaram Select Micro Cap Series - I:3.03%/ 2.68%, Sundaram Select Micro Cap Series - II: 3.04%/ 2.69%, Sundaram Select Micro Cap Series - III: 3.05%/ 2.70%, Sundaram Select Micro Cap Series - IV: 3.05%/ 2.70%, Sundaram Select Micro Cap Series - V:2.92%/ 2.57%, Sundaram Select Micro Cap Series - IX: 2.99%/ 2.61%, Sundaram Select Micro Cap Series - VI: 2.87%/ 2.52%, Sundaram Select Micro Cap Series - VII: 2.97%/ 2.62%, Sundaram Select Micro Cap Series - VIII:2.99%/ 2.60%, Sundaram Select Micro Cap Series - X: 2.99%/ 2.61%, Sundaram TOP 100 - I: 3.04%/ 2.69%, Sundaram TOP 100 - II: 3.04%/ 2.69%, Sundaram TOP 100 - III: 3.04%/ 2.69%, Sundaram TOP 100 - IV: 3.03%/2.68%, Sundaram TOP 100 - V: 3.03%/ 2.68%, Sundaram Select Small Cap - II: 3.04%/ 2.69%, Sundaram Select Small Cap - III: 3.04%/ 2.69%, Sundaram Select Small Cap - IV: 3.04%/ 2.69%, Sundaram Value Fund - I: 3.03%/2.68%, Sundaram Value Fund - II: 3.04%/ 2.69%, Sundaram Value Fund - III: 3.01%/ 2.66%, Sundaram World Brand Fund - I: 3.04%/ 2.71%, Sundaram World Brand Fund - II: 3.04%/ 2.71%, Sundaram World Brand Fund - III:3.04%/ 2.71%, Sundaram Long Term Tax Advantage Fund - I: 3.04%/ 2.69%, Sundaram Long Term Tax Advantage Fund - II: 2.62%/ 2.28%, Sundaram Balanced Fund: 3.04%/ 2.89%, Sundaram Monthly Income ConservativePlan (Equity of up to 10%): 0.76%/ 0.36%, Sundaram Monthly Income Aggressive Plan (Equity of up to 30%): 2.78%/ 2.58%, Sundaram Monthly Income Moderate Plan (Equity of up to 20%): 2.67%/ 1.77%, Sundaram MoneyFund: 0.24%/ 0.15%, Sundaram Ultra Short-Term Fund: 0.91%/ 0.42%, Sundaram Bond Saver: 2.64%/ 2.52%, Sundaram Gilt Fund: 1.99%/ 1.49%, Sundaram Income Plus: 2.24%/ 0.19%, Sundaram Select Debt Short TermAsset Plan: 1.46%/ 0.49%, Sundaram Flexible Fund Short-Term Plan: 0.28%/ 0.25%, Sundaram Flexible Fund Flexible Income Plan: 0.83%/ 0.68%, Sundaram Banking & PSU Debt Fund: 0.61%/ 0.43%
www.sundarammutual.com June 2016 Page 40 Sundaram Mutual FundDesigned by Morningstar

Fund Managers
S KrishnakumarCIO-Equity
Funds Managed: Sundaram S.M.I.L.E Fund, Sundaram Select Mid Cap, Sundaram Select Small Cap Series,Sundaram Value Fund Series I, Sundaram Value Fund Series II*,Sundaram Value Fund Series III*,SundaramTax Saver*, Sundaram Select Micro Cap Series*, Sundaram TOP 100*, Sundaram Rural India Fund*,Sundaram Infrastructure Advantage Fund* and Sundaram Long Term Tax Advantage Fund Series I,Sundaram Long Term Tax Advantage Fund Series II.
Shiv Chanani, CFAFund Manager-Equity
Funds Managed: Sundaram Balanced Fund, Sundaram Equity Multiplier, Sundaram Equity Plus, SundaramFinancial Services Opportunities Fund, Sundaram Growth Fund, Sundaram Select Focus, SundaramEntertainment Opportunities Fund* & Sundaram Select Thematic Funds - PSU Opportunities*, SundaramMonthly Income Plan.
Avinash AgarwalAssistant Fund Manager-Equity
Funds Managed: Sundaram Entertainment Opportunities Fund*, Sundaram Select Thematic Funds - PSUOpportunities* Sundaram Global Advantage, Sundaram World Brand Fund, Sundaram TOP 100*,Sundaram Rural India Fund* & Sundaram Select Micro Cap Series*.
Madanagopal RamuAssistant Fund Manager-Equity
Funds Managed: Sundaram Tax Saver*, Sundaram Infrastructure Advantage Fund*, Sundaram Value FundSeries II, Sundaram Value Fund Series III*.
Dwijendra Srivastava, CFACIO-Fixed Income
Funds Managed*: Sundaram Money Fund, Sundaram Ultra Short-Term Fund, Sundaram Flexible FundShort-Term Plan, Sundaram Flexible Fund Flexible Income Plan, Sundaram Gilt Fund, Sundaram BondSaver, Sundaram Select Debt Short-Term Asset Plan, Sundaram Capital Protection Oriented Funds,Sundaram Monthly Income Plan, Sundaram Fixed Term Plans and Sundaram Fixed Income Interval Funds,Sundaram Income Plus.
Siddharth ChaudharyFund Manager-Fixed Income
Funds Managed*: Sundaram Money Fund, Sundaram Ultra Short-Term Fund, Sundaram Flexible FundShort-Term Plan, Sundaram Capital Protection Oriented Funds, Sundaram Monthly Income Plan, SundaramBanking & PSU Debt Fund*, Sundaram Fixed Income Interval Funds and Sundaram Hybrid Fund Series.
Sandeep AgarwalFund Manager-Fixed Income
Funds Managed: Sundaram Flexible Fund Flexible Income Plan*, Sundaram Gilt Fund*, Sundaram BondSaver*, Sundaram Select Debt Short-Term Asset Plan*, Sundaram Monthly Income Plan*, SundaramBanking & PSU Debt Fund*, Sundaram Fixed Term Plans* and Sundaram Income Plus.
* Jointly Managed Funds
www.sundarammutual.com June 2016 Page 41 Sundaram Mutual FundDesigned by Morningstar

Systematic Investment Plan: Performance of 10,000-a-month SIP
Sundaram Tax SaverAn open-end ELSS scheme
Period Investment Fund Benchmark Add. Benchmark
Since Inception 19,90,000 1,24,52,583 72,83,621 65,46,502
Last 10 years 12,00,000 23,29,131 19,81,612 19,12,086
Last 7 years 8,40,000 13,44,565 11,88,016 11,52,292
Last 5 years 6,00,000 9,00,405 8,05,026 7,75,087
Last 3 years 3,60,000 4,62,152 4,20,345 4,06,397
Last 2 years 2,40,000 2,64,916 2,49,807 2,45,891
Last 1 year 1,20,000 1,29,869 1,26,111 1,25,632Past performance may or may not be sustained in future. Return/investment value are as of Jun 30, 2016 Effective compoundedannual return of a constant amount SIP every month in percentage are computed using NAV of Regular Plan-Growth Option. Investment andvalue for the fund and benchmark are in rupees.
Period Investment Fund Benchmark Add. Benchmark
Since Inception 16,70,000 48,53,335 43,58,916 43,58,916
Last 10 years 12,00,000 18,27,975 19,12,086 19,12,086
Last 7 years 8,40,000 11,17,391 11,52,292 11,52,292
Last 5 years 6,00,000 7,66,767 7,75,087 7,75,087
Last 3 years 3,60,000 4,05,856 4,06,397 4,06,397
Last 2 years 2,40,000 2,42,536 2,45,891 2,45,891
Last 1 year 1,20,000 1,22,999 1,25,632 1,25,632Past performance may or may not be sustained in future. Return/investment value are as of Jun 30, 2016 Effective compoundedannual return of a constant amount SIP every month in percentage are computed using NAV of Regular Plan-Growth Option. Investment andvalue for the fund and benchmark are in rupees.
Sundaram Select FocusAn open-end equity scheme
Sundaram Select Mid CapAn open-end equity scheme
Period Investment Fund Benchmark Add. Benchmark
Since Inception 16,70,000 1,16,71,915 51,57,323 43,58,916
Last 10 years 12,00,000 33,32,206 21,86,868 19,12,086
Last 7 years 8,40,000 17,77,321 13,52,270 11,52,292
Last 5 years 6,00,000 11,26,798 9,37,417 7,75,087
Last 3 years 3,60,000 5,37,241 4,90,816 4,06,397
Last 2 years 2,40,000 2,77,684 2,69,276 2,45,891
Last 1 year 1,20,000 1,30,665 1,29,884 1,25,632Past performance may or may not be sustained in future. Return/investment value are as of Jun 30, 2016 Effective compoundedannual return of a constant amount SIP every month in percentage are computed using NAV of Regular Plan-Growth Option. Investment andvalue for the fund and benchmark are in rupees.
Period Investment Fund Benchmark Add. Benchmark
Since Inception 13,60,000 40,20,100 23,22,218 24,37,961
Last 10 years 12,00,000 31,27,571 19,56,588 19,12,086
Last 7 years 8,40,000 17,25,287 12,48,533 11,52,292
Last 5 years 6,00,000 11,59,880 9,07,446 7,75,087
Last 3 years 3,60,000 5,58,892 4,83,526 4,06,397
Last 2 years 2,40,000 2,69,556 2,57,439 2,45,891
Last 1 year 1,20,000 1,28,400 1,27,627 1,25,632Past performance may or may not be sustained in future. Return/investment value are as of Jun 30, 2016 Effective compoundedannual return of a constant amount SIP every month in percentage are computed using NAV of Regular Plan-Growth Option. Investment andvalue for the fund and benchmark are in rupees.
Sundaram S.M.I.L.E FundAn open-end equity scheme
Mutual Fund investments are subject to market risks, read all scheme related documents carefully.For Product Labels, please refer Page 2. Disclosures: Page 39. SIP performance of each open-end equity fund is also available in the respective fund pages.