Embed Size (px)
Citation preview
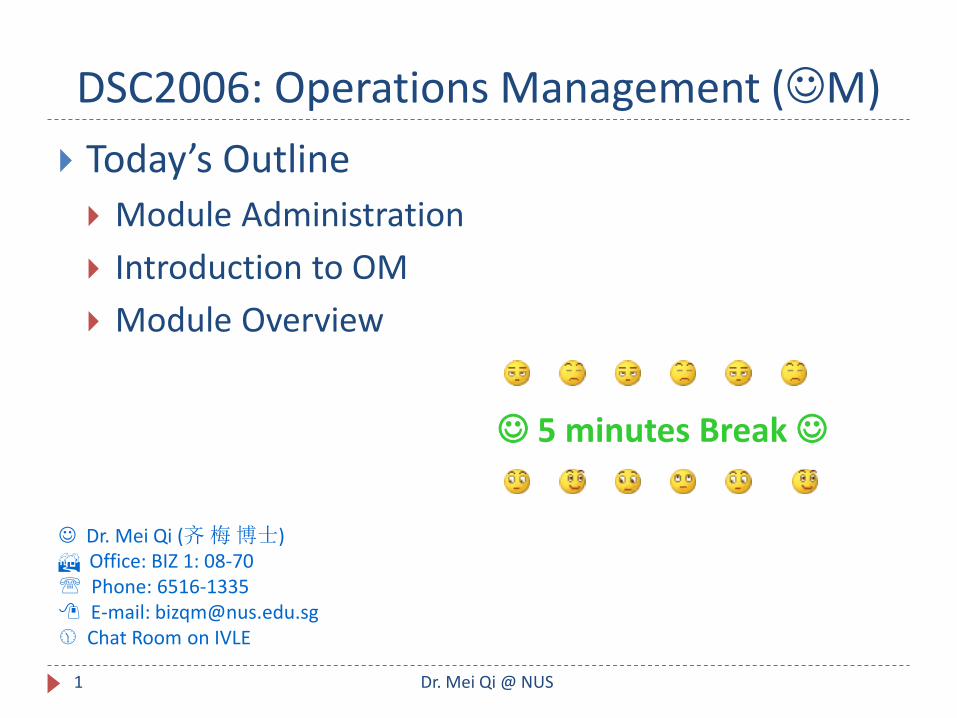
DSC2006: Operations Management (M)
Today’s Outline
Module Administration
Introduction to OM
Module Overview
Dr. Mei Qi (齐 梅 博士) Office: BIZ 1: 08-70 Phone: 6516-1335 E-mail: [email protected] Chat Room on IVLE
5 minutes Break
1 Dr. Mei Qi @ NUS
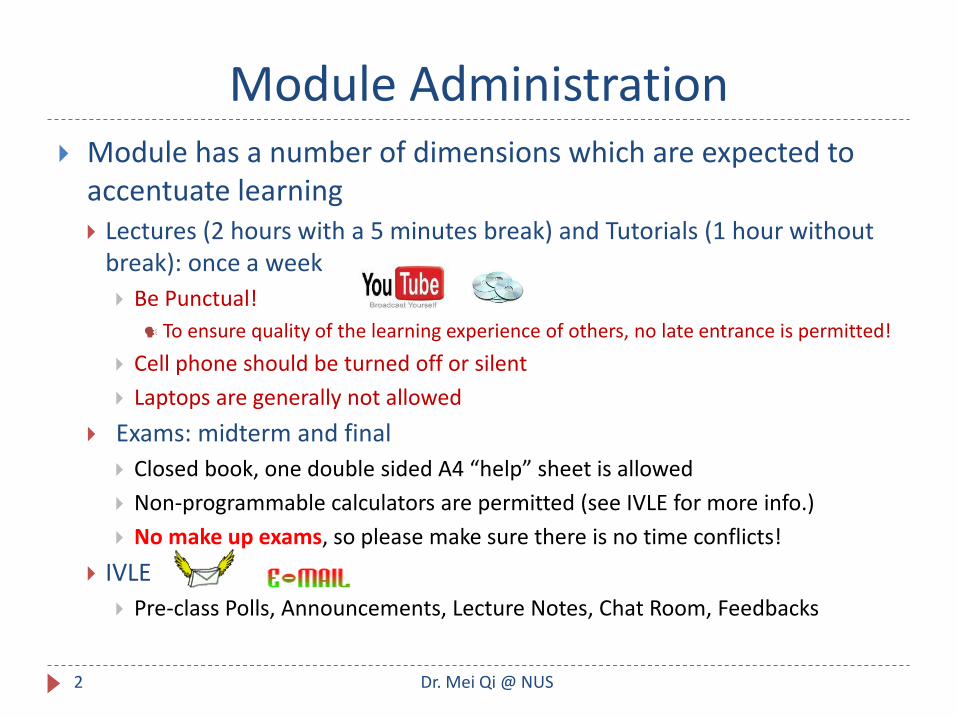
Module Administration Module has a number of dimensions which are expected to
accentuate learning Lectures (2 hours with a 5 minutes break) and Tutorials (1 hour without
break): once a week
Be Punctual!
To ensure quality of the learning experience of others, no late entrance is permitted!
Cell phone should be turned off or silent
Laptops are generally not allowed
Exams: midterm and final
Closed book, one double sided A4 “help” sheet is allowed
Non-programmable calculators are permitted (see IVLE for more info.)
No make up exams, so please make sure there is no time conflicts!
IVLE
Pre-class Polls, Announcements, Lecture Notes, Chat Room, Feedbacks
2 Dr. Mei Qi @ NUS
It’s a Beautiful World Companies offering variety Products and Services
3 Dr. Mei Qi @ NUS
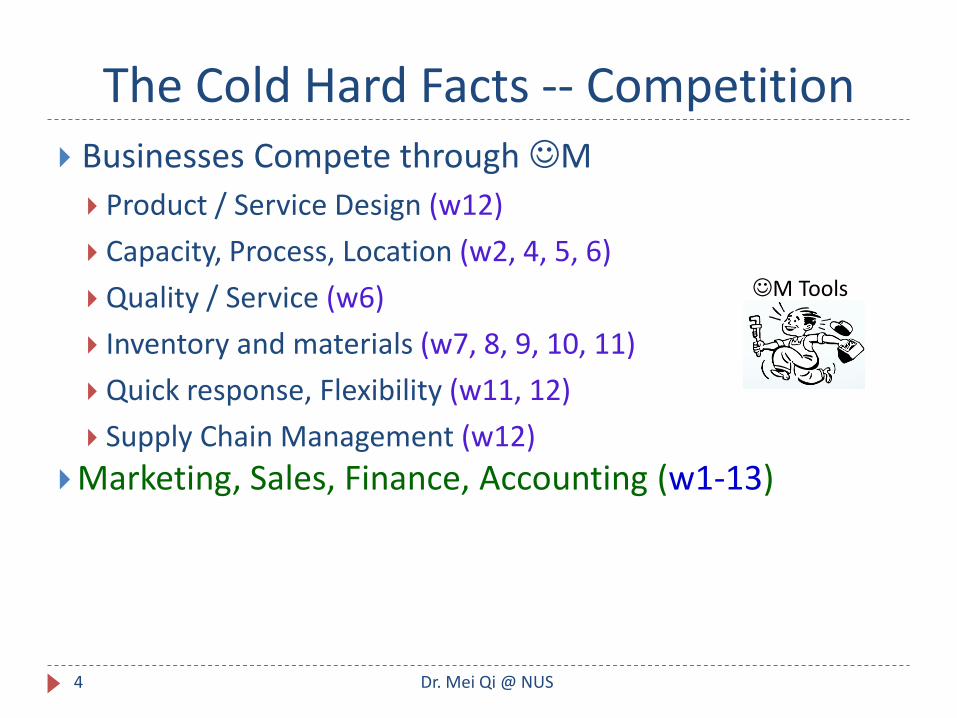
The Cold Hard Facts -- Competition Businesses Compete through M
Product / Service Design (w12)
Capacity, Process, Location (w2, 4, 5, 6)
Quality / Service (w6)
Inventory and materials (w7, 8, 9, 10, 11)
Quick response, Flexibility (w11, 12)
Supply Chain Management (w12)
Marketing, Sales, Finance, Accounting (w1-13)
4 Dr. Mei Qi @ NUS
M Tools
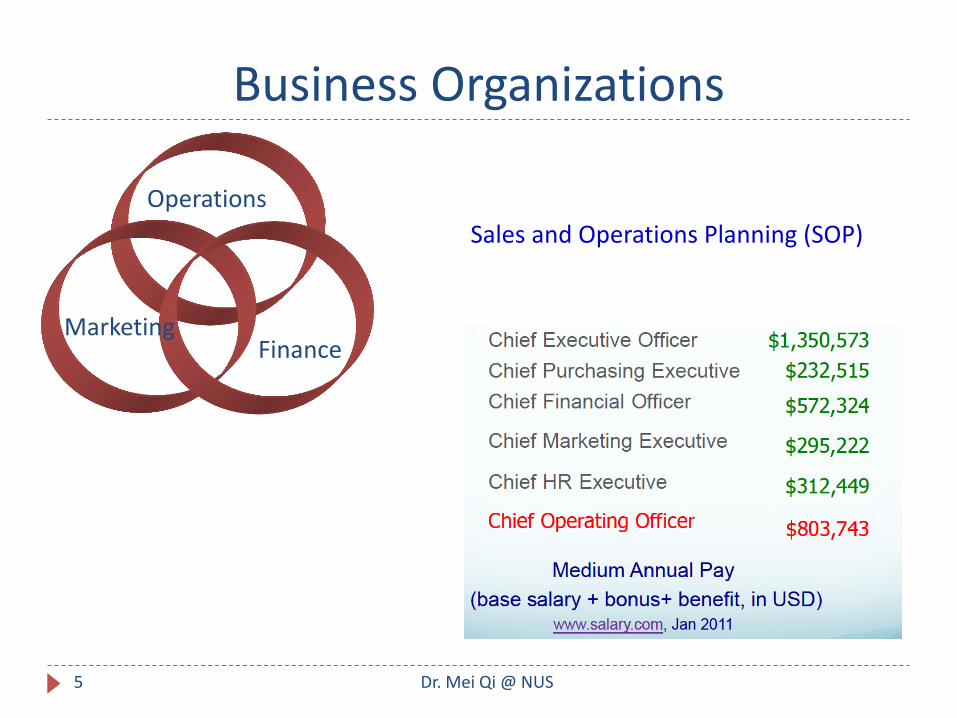
Operations
Finance Marketing
Business Organizations
5
Sales and Operations Planning (SOP)
Dr. Mei Qi @ NUS
NUS: Asia’s Global Business School
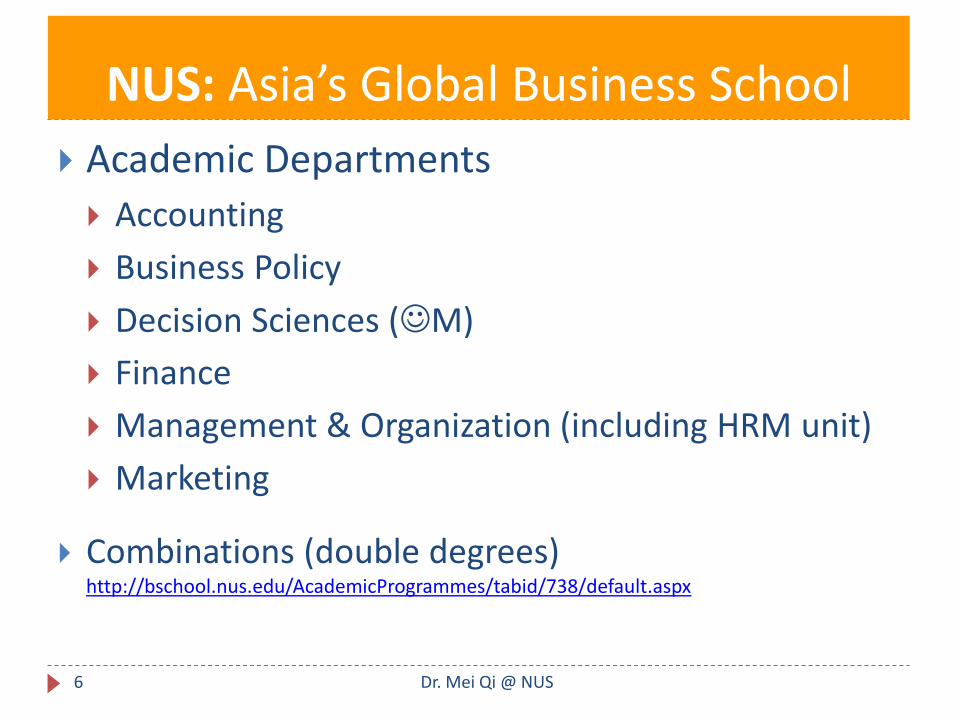
Academic Departments
Accounting
Business Policy
Decision Sciences (M)
Finance
Management & Organization (including HRM unit)
Marketing
Combinations (double degrees) http://bschool.nus.edu/AcademicProgrammes/tabid/738/default.aspx
6 Dr. Mei Qi @ NUS
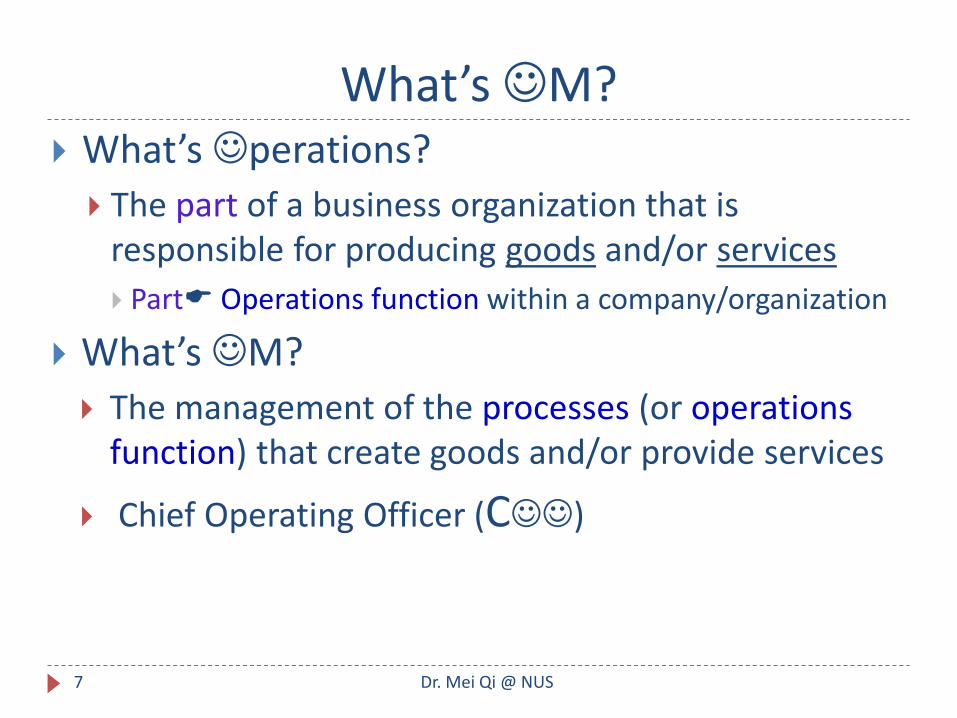
What’s M? What’s perations?
The part of a business organization that is responsible for producing goods and/or services
Part Operations function within a company/organization
What’s M?
The management of the processes (or operations function) that create goods and/or provide services
Chief Operating Officer (C)
7 Dr. Mei Qi @ NUS
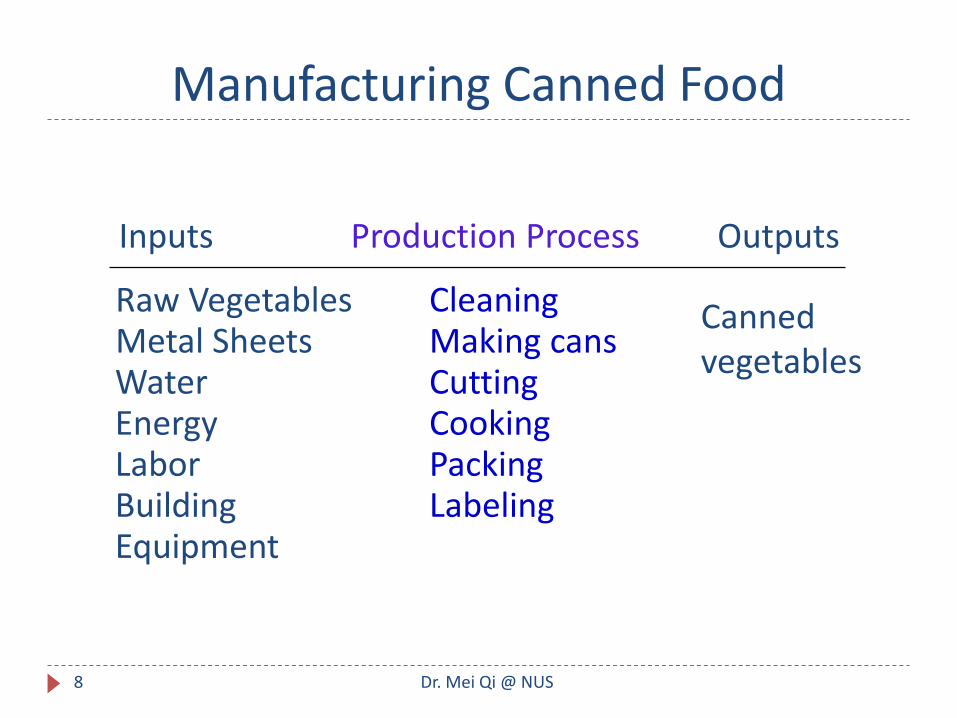
Inputs Production Process Outputs
Manufacturing Canned Food
Canned vegetables
Raw Vegetables Metal Sheets Water Energy Labor Building Equipment
Cleaning Making cans Cutting Cooking Packing Labeling
8 Dr. Mei Qi @ NUS
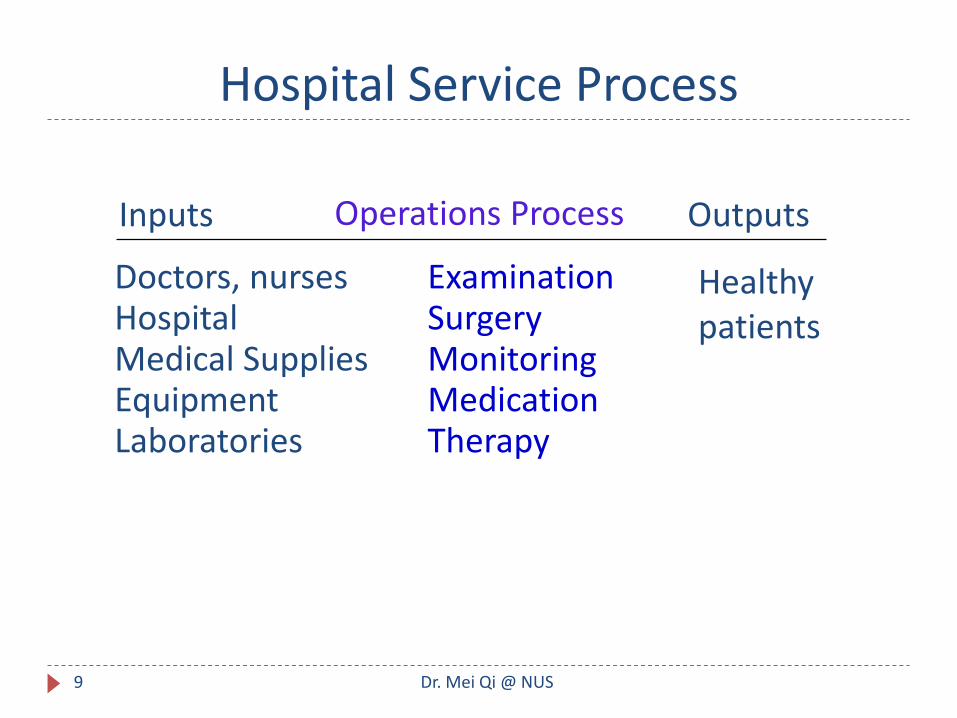
Inputs Operations Process Outputs
Healthy patients
Doctors, nurses Hospital Medical Supplies Equipment Laboratories
Examination Surgery Monitoring Medication Therapy
Hospital Service Process
9 Dr. Mei Qi @ NUS
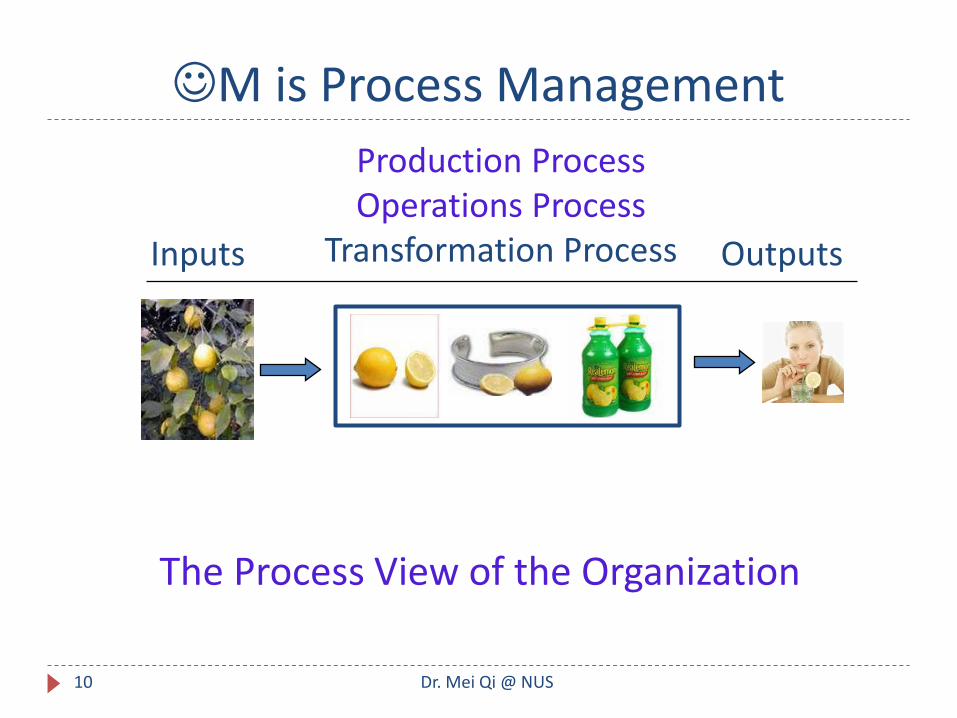
M is Process Management
The Process View of the Organization
Inputs
Production Process Operations Process
Transformation Process
Outputs
10 Dr. Mei Qi @ NUS
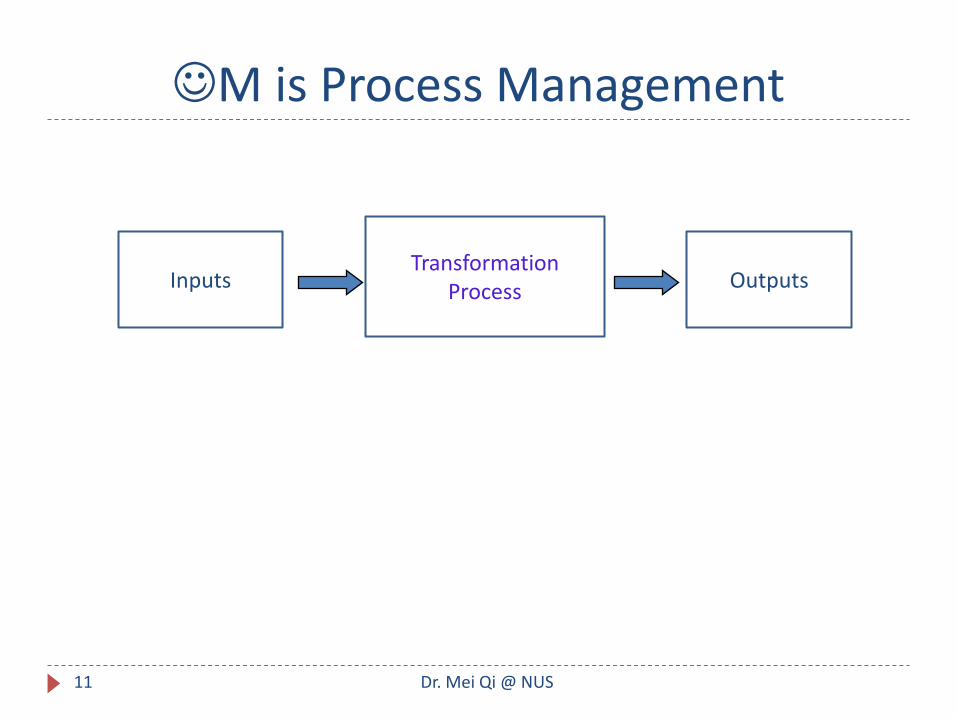
M is Process Management
Outputs Inputs Transformation
Process
11 Dr. Mei Qi @ NUS
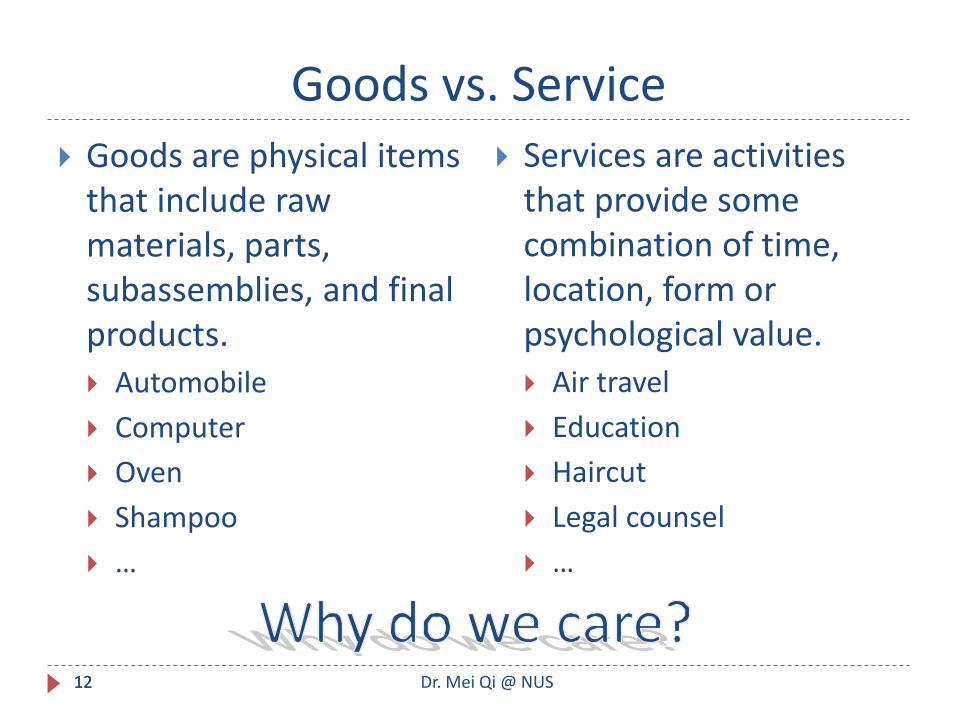
Goods vs. Service Goods are physical items
that include raw materials, parts, subassemblies, and final products. Automobile
Computer
Oven
Shampoo
…
Services are activities that provide some combination of time, location, form or psychological value. Air travel
Education
Haircut
Legal counsel
…
12 Dr. Mei Qi @ NUS 12
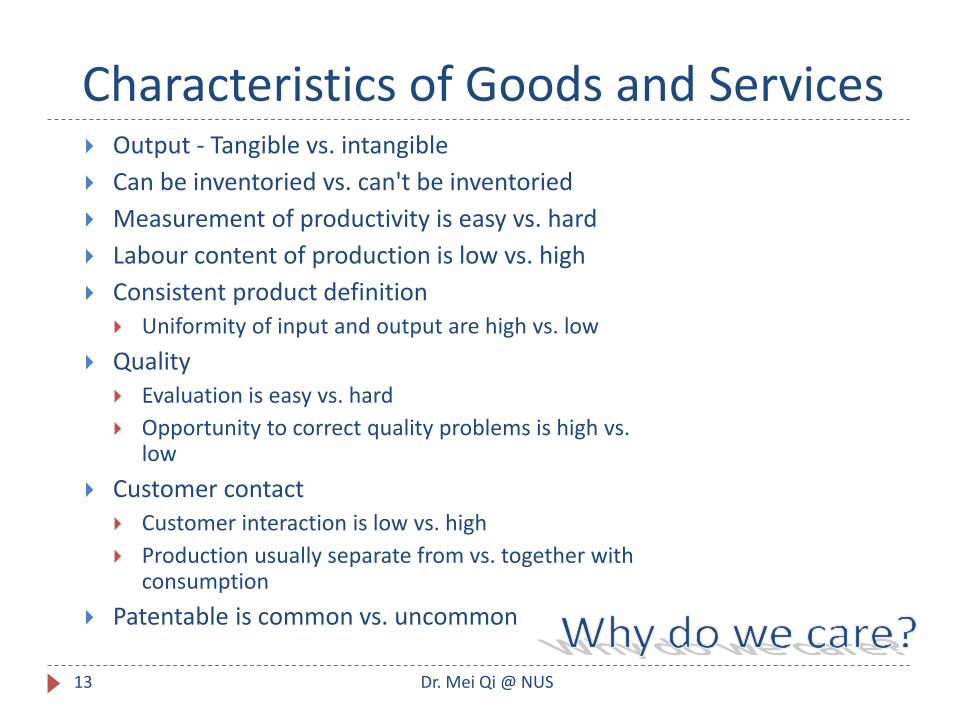
Characteristics of Goods and Services Output - Tangible vs. intangible
Can be inventoried vs. can't be inventoried
Measurement of productivity is easy vs. hard
Labour content of production is low vs. high
Consistent product definition Uniformity of input and output are high vs. low
Quality Evaluation is easy vs. hard
Opportunity to correct quality problems is high vs. low
Customer contact Customer interaction is low vs. high
Production usually separate from vs. together with consumption
Patentable is common vs. uncommon
13 Dr. Mei Qi @ NUS
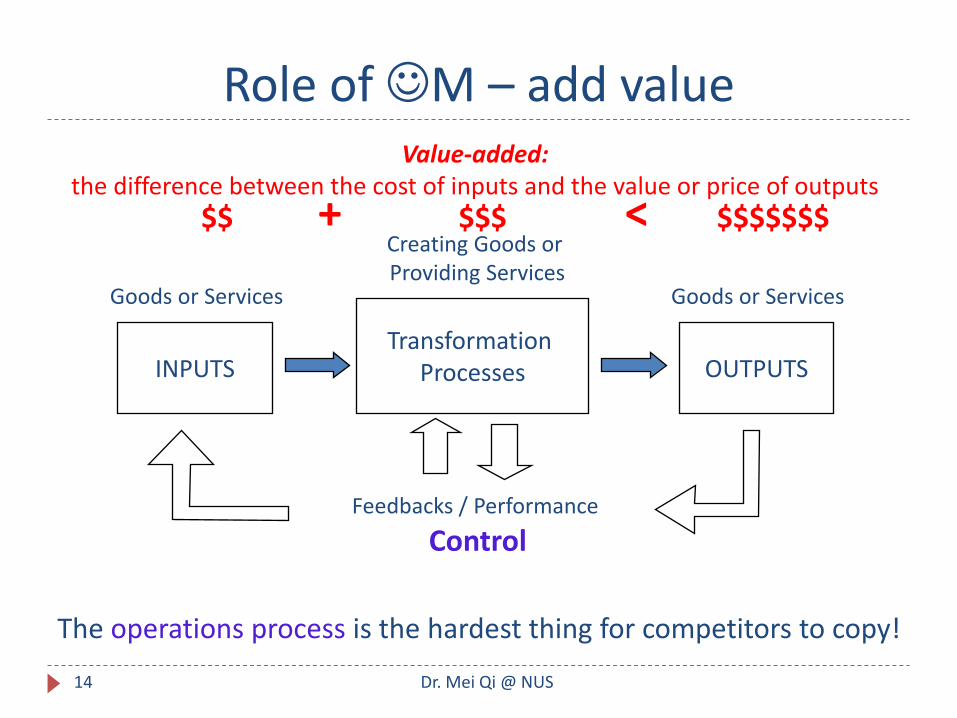
Role of M – add value
INPUTS Transformation
Processes OUTPUTS
Control Feedbacks / Performance
Goods or Services Goods or Services
Creating Goods or Providing Services
The operations process is the hardest thing for competitors to copy!
$$$$$$$ $$$ $$ < +
Value-added: the difference between the cost of inputs and the value or price of outputs
14 Dr. Mei Qi @ NUS
Stock Prices and Profits Is maximizing stock price the same thing as maximizing
profit?
Simply put: yes.
A company's stock price will factor in many different variables including the type of industry the firm operates in, but profits (or earnings) are a very strong proxy of a company's stock price. In the short run, a company's stock price can make small to large price adjustments, depending on news releases and earnings reports. In the long run, a firm's stock price will depend largely on the firm's overall earnings. So, earnings will be one of the strongest drivers for a company's stock.
http://www.investopedia.com
15 Dr. Mei Qi @ NUS
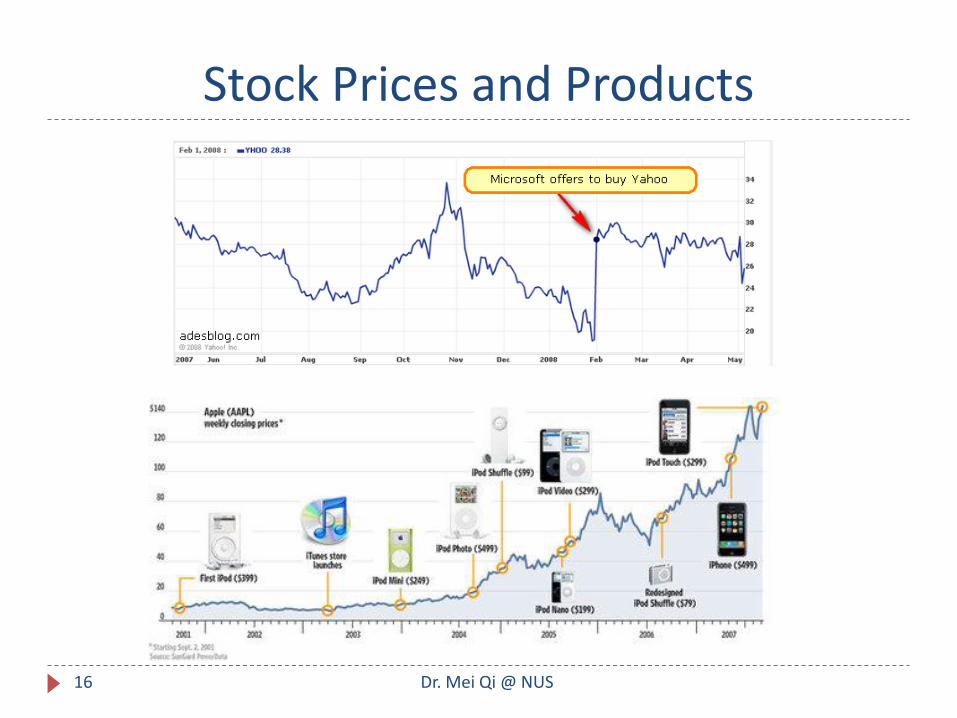
Stock Prices and Products
16 Dr. Mei Qi @ NUS
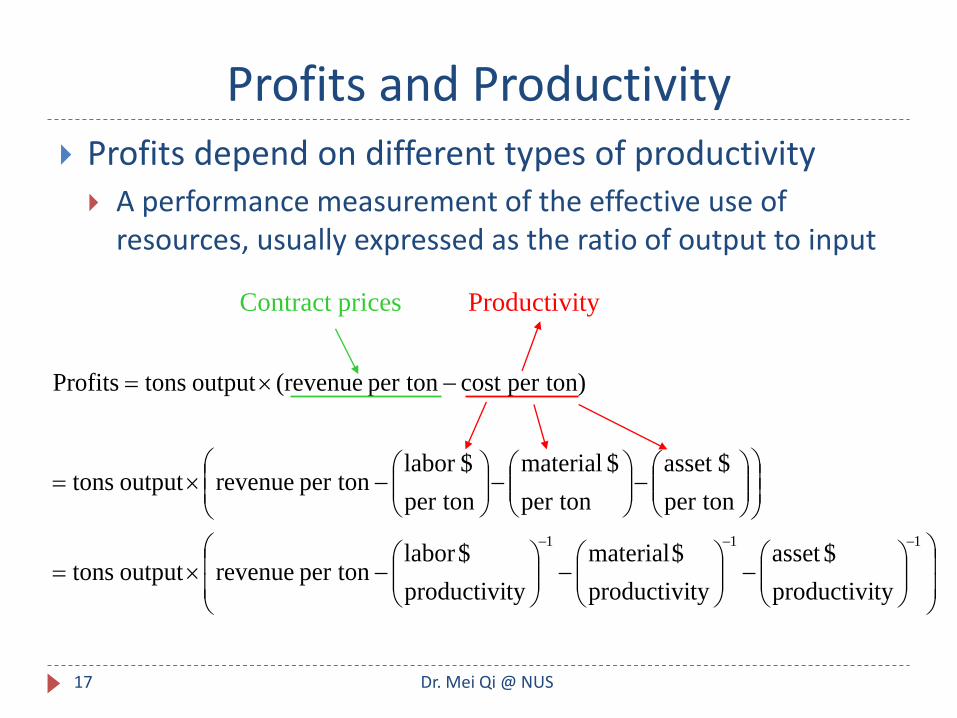
Profits and Productivity Profits depend on different types of productivity
A performance measurement of the effective use of resources, usually expressed as the ratio of output to input
111
typroductivi
$asset
typroductivi
$material
typroductivi
$labortonperrevenueoutputtons
tonper
$asset
tonper
$material
tonper
$labortonperrevenueoutputtons
ton)percosttonper(revenueoutputtonsProfits
Contract prices Productivity
17 Dr. Mei Qi @ NUS
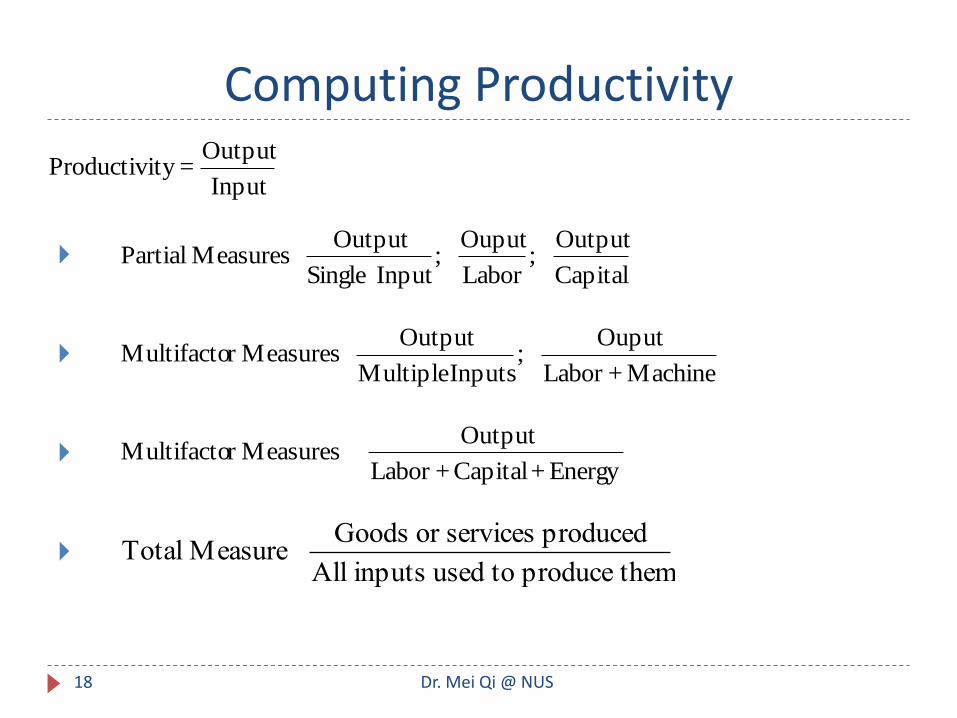
Computing Productivity
18
Capital
Output ;
Labor
Ouput ;
Input Single
Output Measures Partial
Machine+Labor
Ouput ;
Inputs Multiple
Output Measuresr Multifacto
Total Measure Goods or services produced
All inputs used to produce them
Input
Output=tyProductivi
Energy+Capital+Labor
Output Measuresr Multifacto
Dr. Mei Qi @ NUS
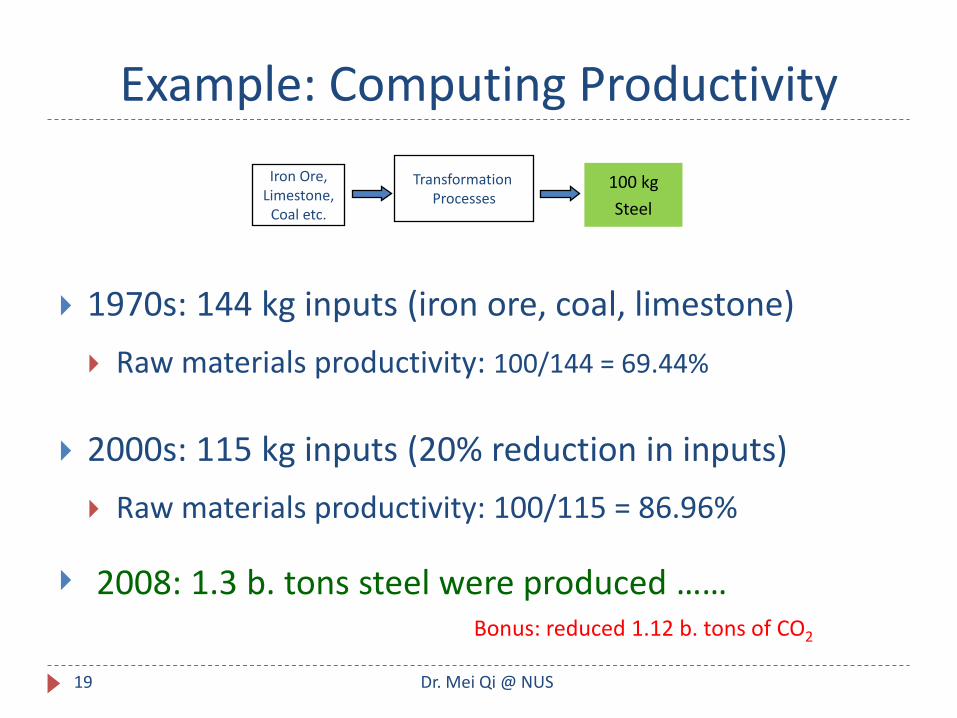
Example: Computing Productivity
1970s: 144 kg inputs (iron ore, coal, limestone)
Raw materials productivity: 100/144 = 69.44%
2000s: 115 kg inputs (20% reduction in inputs)
Raw materials productivity: 100/115 = 86.96%
Iron Ore, Limestone,
Coal etc. Steel
Transformation Processes
100 kg
Steel
19
2008: 1.3 b. tons steel were produced …… Bonus: reduced 1.12 b. tons of CO2
Dr. Mei Qi @ NUS
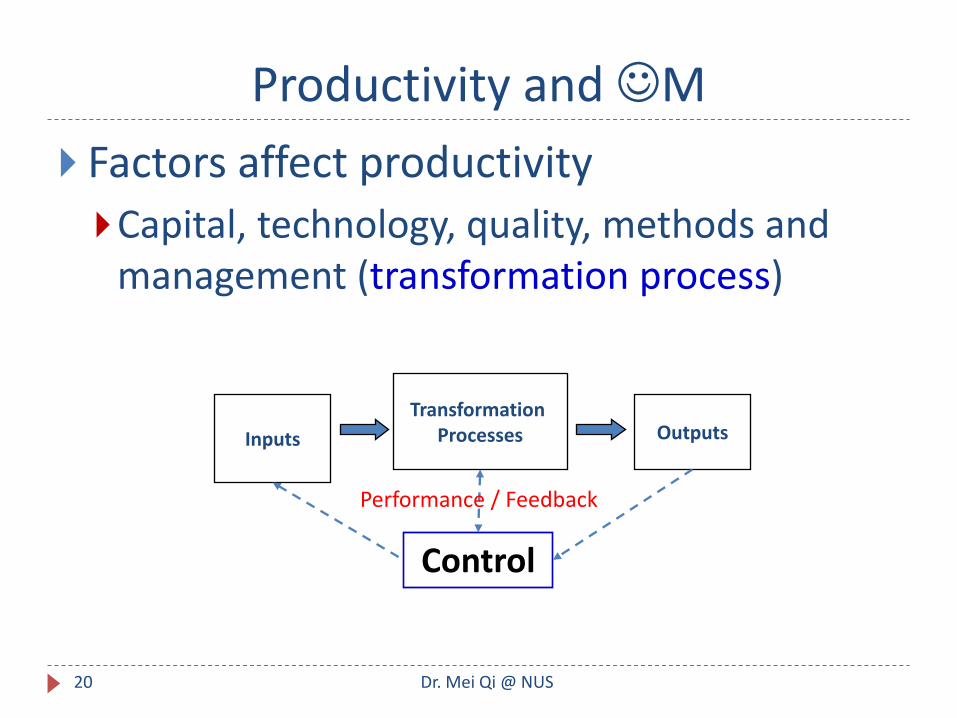
Productivity and M
Factors affect productivity
Capital, technology, quality, methods and management (transformation process)
Inputs Outputs
Control
Performance / Feedback
Transformation Processes
20 Dr. Mei Qi @ NUS
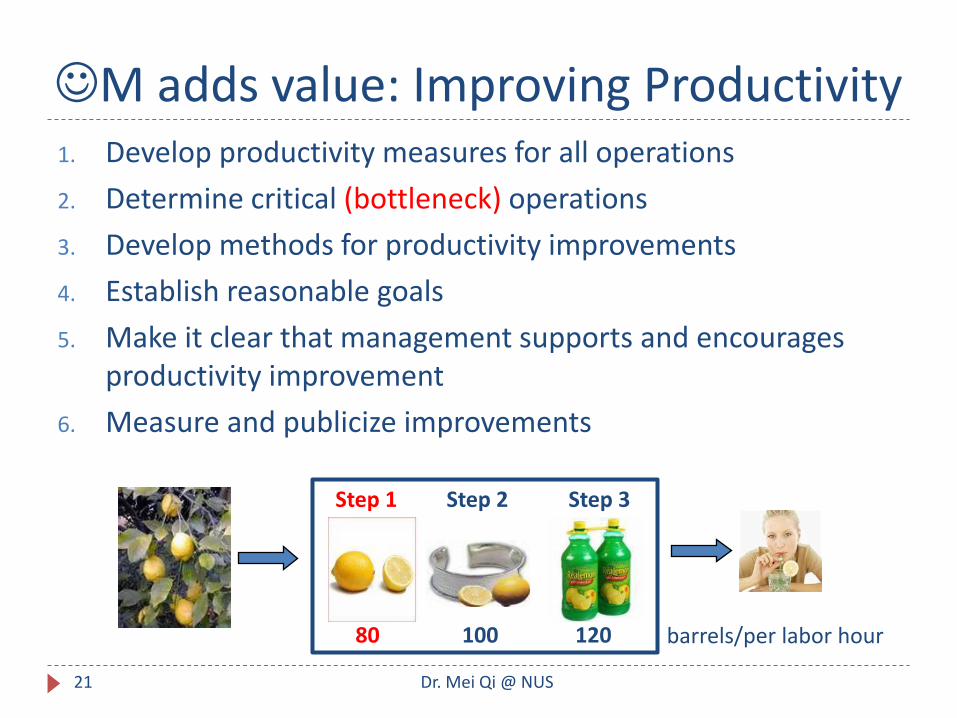
M adds value: Improving Productivity 1. Develop productivity measures for all operations
2. Determine critical (bottleneck) operations
3. Develop methods for productivity improvements
4. Establish reasonable goals
5. Make it clear that management supports and encourages productivity improvement
6. Measure and publicize improvements
80 100 120
Step 1 Step 2 Step 3
21
barrels/per labor hour
Dr. Mei Qi @ NUS
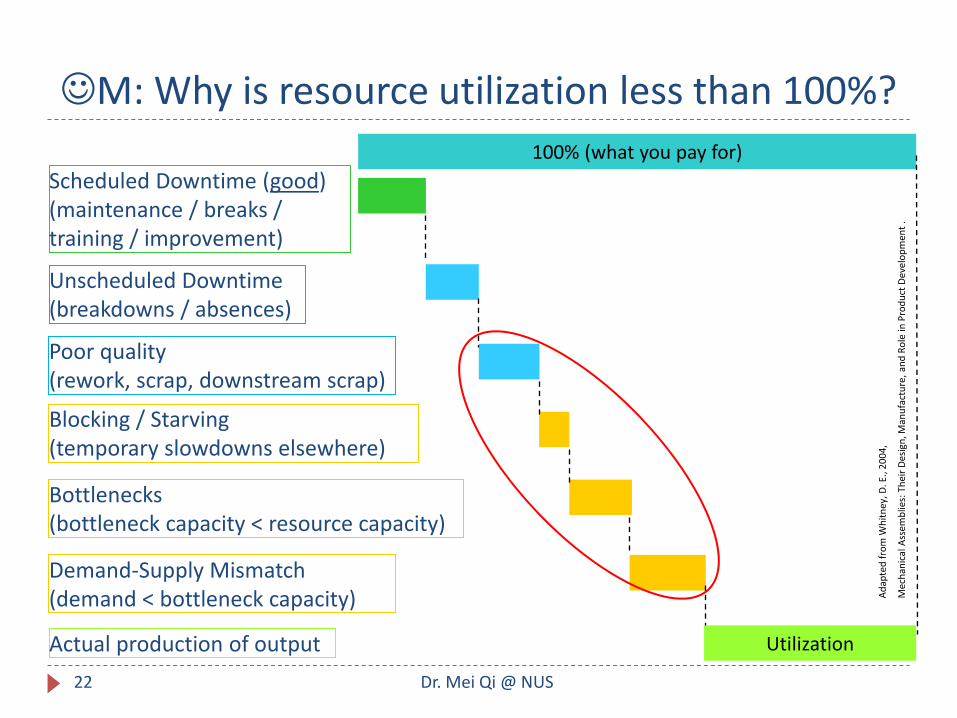
M: Why is resource utilization less than 100%?
100% (what you pay for)
Scheduled Downtime (good) (maintenance / breaks / training / improvement)
Unscheduled Downtime (breakdowns / absences)
Blocking / Starving (temporary slowdowns elsewhere)
Poor quality (rework, scrap, downstream scrap)
Bottlenecks (bottleneck capacity < resource capacity)
Demand-Supply Mismatch (demand < bottleneck capacity)
Utilization Actual production of output
Ad
apte
d f
rom
Wh
itn
ey, D
. E.,
20
04
,
Mec
han
ical
Ass
emb
lies:
Th
eir
Des
ign
, Man
ufa
ctu
re,
and
Ro
le in
Pro
du
ct D
evel
op
men
t .
22 Dr. Mei Qi @ NUS
Poor quality (defects) Poor quality can lead to
poor customer satisfaction (reduced incentives, i.e. revenue)
rework or scrap, which causes lower utilization directly but also indirectly as sources of blocking and starving
Usually poor quality results from poorly designed or non-standardized processes or training
Process improvements that improve quality also increase utilization and thus productivity (w6) Training
Process standardization
Process redesign
23
Utilization
Dr. Mei Qi @ NUS
M Tools
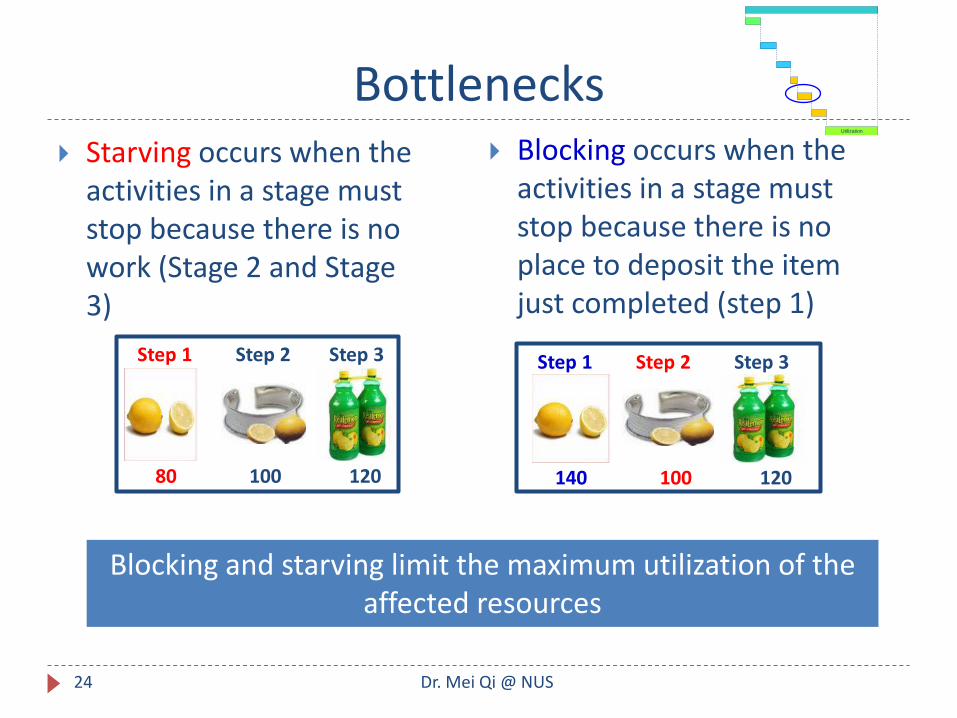
Bottlenecks Starving occurs when the
activities in a stage must stop because there is no work (Stage 2 and Stage 3)
Blocking occurs when the activities in a stage must stop because there is no place to deposit the item just completed (step 1)
80 100 120
Step 1 Step 2 Step 3
140 100 120
Step 1 Step 2 Step 3
Blocking and starving limit the maximum utilization of the affected resources
Utilization
Dr. Mei Qi @ NUS 24
Improving productivity through… … an understanding of bottlenecks (w2)
Prioritize process improvements and redesign
Increase capacity at bottlenecks
Reduce structural idle time at bottlenecks by redesigning processes
Prioritize technological improvements at bottlenecks
Reduce setup times at bottlenecks
Reduce blocking and starving of the bottleneck by
creating buffers before and after bottlenecks (space, inventory, manpower, flexibility)
Reducing variability that causes blocking or starving of the bottleneck
Place inspection just prior to bottleneck operations (you do not want faulty product to be processed on a bottleneck)
Prevent scrap downstream from the bottleneck
Utilization
25 Dr. Mei Qi @ NUS
M Tools
Blocking and Starving What causes blocking or starvation:
Bottlenecks
“seasonality”: no containers available in the morning, plenty in the afternoon (predictable variability)
unpredictable variability: machine breakdowns, traffic jams, absenteeism
What to do to improve productivity?
Buffer or suffer (not free though: time + inventory) (w7,8,9)
Synchronize (not easy: Line balancing and scheduling) (w4,5)
Process improvements to remove causes of variability (w6)
26
Utilization
Dr. Mei Qi @ NUS
M Tools
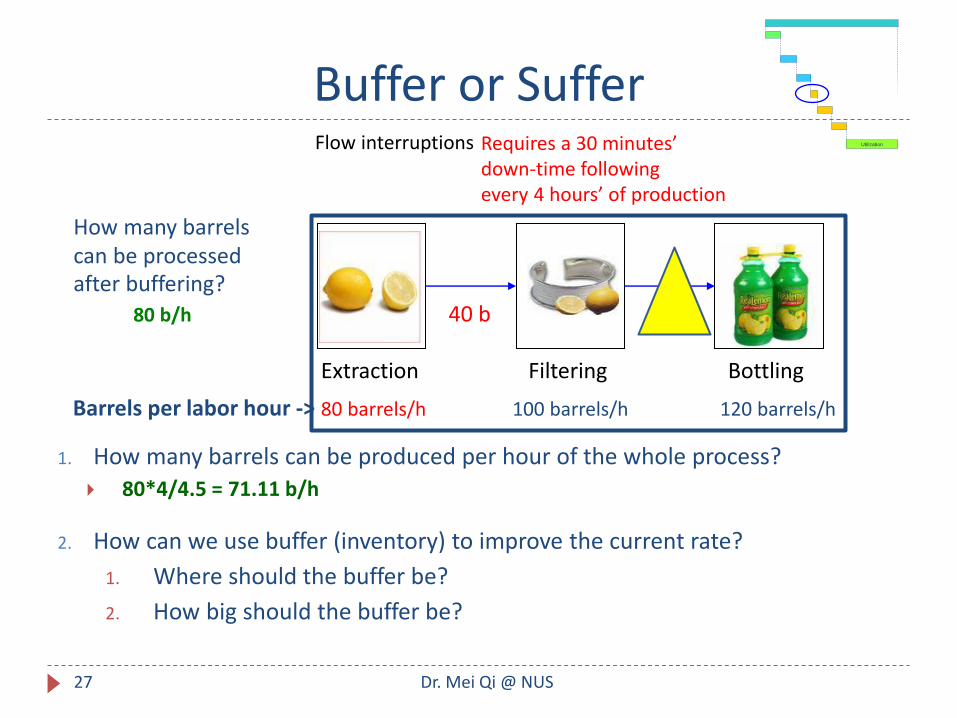
Extraction Bottling
Requires a 30 minutes’ down-time following every 4 hours’ of production
Filtering
Buffer or Suffer
1. How many barrels can be produced per hour of the whole process?
80*4/4.5 = 71.11 b/h
2. How can we use buffer (inventory) to improve the current rate?
1. Where should the buffer be?
2. How big should the buffer be?
80 barrels/h 100 barrels/h 120 barrels/h
40 b
Barrels per labor hour ->
How many barrels can be processed after buffering?
80 b/h
Flow interruptions
27
Utilization
Dr. Mei Qi @ NUS
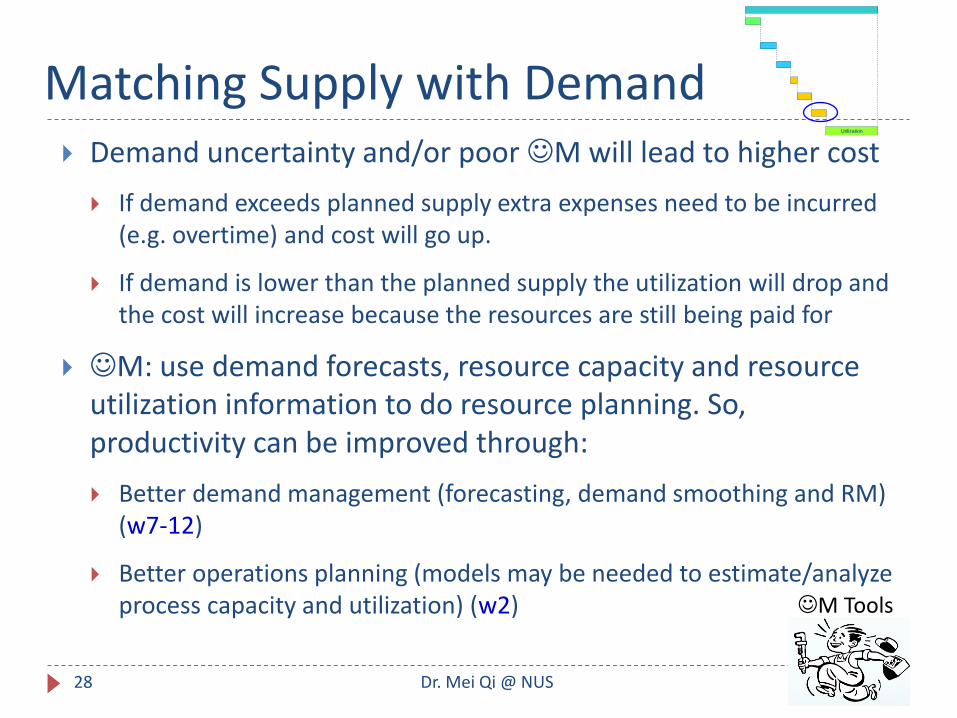
Matching Supply with Demand Demand uncertainty and/or poor M will lead to higher cost
If demand exceeds planned supply extra expenses need to be incurred (e.g. overtime) and cost will go up.
If demand is lower than the planned supply the utilization will drop and the cost will increase because the resources are still being paid for
M: use demand forecasts, resource capacity and resource utilization information to do resource planning. So, productivity can be improved through:
Better demand management (forecasting, demand smoothing and RM) (w7-12)
Better operations planning (models may be needed to estimate/analyze process capacity and utilization) (w2)
Utilization
28 Dr. Mei Qi @ NUS
M Tools
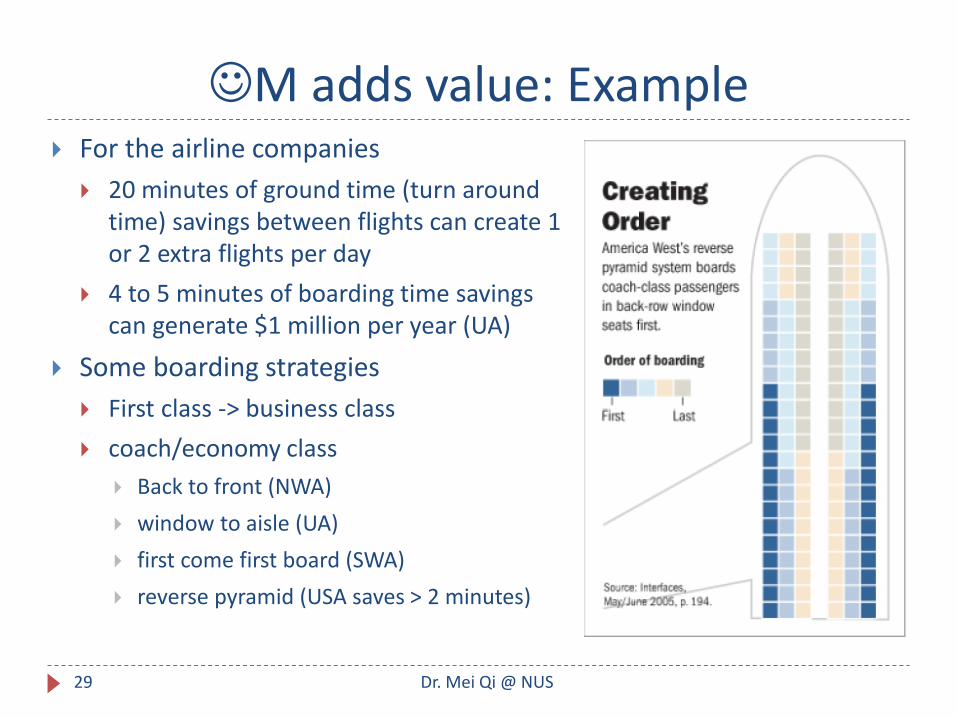
M adds value: Example For the airline companies
20 minutes of ground time (turn around time) savings between flights can create 1 or 2 extra flights per day
4 to 5 minutes of boarding time savings can generate $1 million per year (UA)
Some boarding strategies
First class -> business class
coach/economy class
Back to front (NWA)
window to aisle (UA)
first come first board (SWA)
reverse pyramid (USA saves > 2 minutes)
Dr. Mei Qi @ NUS 29
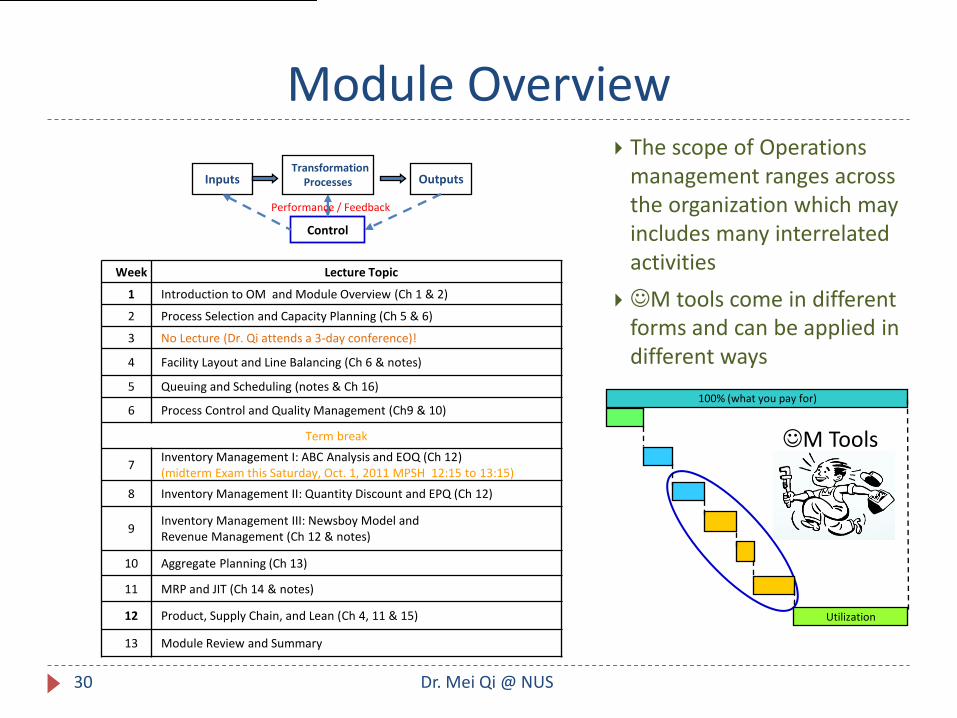
Module Overview The scope of Operations
management ranges across the organization which may includes many interrelated activities
M tools come in different forms and can be applied in different ways
Inputs Outputs
Control
Performance / Feedback
Transformation Processes
100% (what you pay for)
Utilization
M Tools
Week Lecture Topic
1 Introduction to OM and Module Overview (Ch 1 & 2)
2 Process Selection and Capacity Planning (Ch 5 & 6)
3 No Lecture (Dr. Qi attends a 3-day conference)!
4 Facility Layout and Line Balancing (Ch 6 & notes)
5 Queuing and Scheduling (notes & Ch 16)
6 Process Control and Quality Management (Ch9 & 10)
Term break
7 Inventory Management I: ABC Analysis and EOQ (Ch 12) (midterm Exam this Saturday, Oct. 1, 2011 MPSH 12:15 to 13:15)
8 Inventory Management II: Quantity Discount and EPQ (Ch 12)
9 Inventory Management III: Newsboy Model and Revenue Management (Ch 12 & notes)
10 Aggregate Planning (Ch 13)
11 MRP and JIT (Ch 14 & notes)
12 Product, Supply Chain, and Lean (Ch 4, 11 & 15)
13 Module Review and Summary
30 Dr. Mei Qi @ NUS
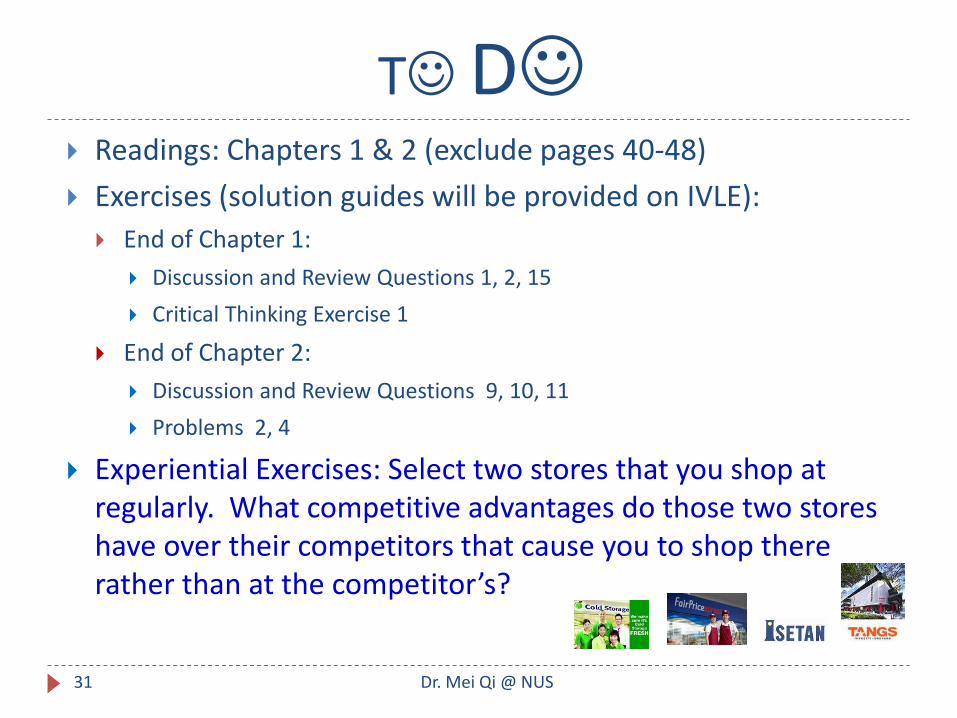
T D Readings: Chapters 1 & 2 (exclude pages 40-48)
Exercises (solution guides will be provided on IVLE):
End of Chapter 1:
Discussion and Review Questions 1, 2, 15
Critical Thinking Exercise 1
End of Chapter 2:
Discussion and Review Questions 9, 10, 11
Problems 2, 4
Experiential Exercises: Select two stores that you shop at regularly. What competitive advantages do those two stores have over their competitors that cause you to shop there rather than at the competitor’s?
31 Dr. Mei Qi @ NUS


![Lect1 Introduction [호환 모드] - Yonsei Universitytera.yonsei.ac.kr/class/2013_1/lecture/Lect1 Introduction... · 2013-03-12 · Introduction Textbook: Lecture Notes Class web](https://img.pdfslide.tips/doc/110x75/5f89c6a06045620cf16d76a2/lect1-introduction-eeoe-yonsei-introduction-2013-03-12-introduction.jpg)