Embed Size (px)
Citation preview
Nature © Macmillan Publishers Ltd 1998
8
letters to nature
NATURE | VOL 393 | 28 MAY 1998 369
19. Barber, G. A. Observations on the mechanisms of the reversible epimerization of GDP-D-mannose toGDP-L-galactose by an enzyme from Chlorella pyrenidosa. J. Biol. Chem. 254, 7600–7603 (1979).
20. Barber, G. A. Synthesis of L-galactose by plant enzyme systems. Arch. Biochem. Biophys. 147, 619–623(1971).
21. Feingold, D. S. in Encyclopedia of Plant Physiology, Vol. 13A (eds Loewus, F. A. & Tanner, W.) 3–76(Springer, Berlin, 1982).
22. Roberts, R. M. & Harrer, E. Determination of L-galactose in polysaccharide material. Phytochemistry12, 2679–2682 (1973).
23. Harris, G. C. et al. Mannose metabolism in corn and its impact on leaf metabolites, photosynthetic gasexchange, and chlorophyll fluorescence. Plant Physiol. 82, 1081–1089 (1986).
24. Conklin, P. L., Williams, E. H. & Last, R. L. Environmental stress sensitivity of an ascorbic acid-deficient Arabidopsis mutant. Proc. Natl Acad. Sci. USA 93, 9970–9974 (1996).
25. Conklin, P. L., Pallanca, J. E., Last, R. L. & Smirnoff, N. L-Ascorbic acid metabolism in the ascorbate-deficient Arabidopsis mutant vtc1. Plant Physiol. 115, 1277–1285 (1997).
26. Chen, Y-T., Isherwood, F. A. & Mapson, L. W. Quantitative estimation of ascorbic acid and relatedsubstances in biological extracts by separation on a paper chromatogram. Biochem. J. 55, 821–823(1953).
27. Andrews, M. A. Capillary gas-chromatographic analysis of monosaccharides: improvements andcomparisons using trifluoroacetylation and trimethylsilylation of sugar O-benzyl and O-methyloximes. Carbohydrate Res. 194, 1–19 (1989).
28. Ghebragzabher, M., Ruffini, S., Monaldi, B. & Lato, M. Thin layer chromatography ofmonosaccharides. J. Chromatogr. 127, 133–162 (1976).
29. Dawson, R. M. C., Elliott, D. C., Elliott, W. H. & Jones, K. M. (eds) Data for Biochemical Research 2ndedn. (Clarendon, Oxford, 1969).
Acknowledgements. The research was supported by a BBSRC studentship (G.L.W.), a Nuffield StudentBursary (M.A.J.) and Zeneca Agrochemicals. We thank Nippon-Roche for the gift of L-sorbosone. Earlierwork by J. Pallanca, funded by the BBSRC BOMRIP programme, provided a basis for this research. Wethank M. Raymond for technical assistance; J. Kingdon and J. Hindley for growing the plants; and W.Schuch for his support.
Correspondence and requests for materials should be addressed to N.S. (e-mail: [email protected]).
Visual input evokestransientandstrongshunting inhibitioninvisual cortical neuronsLyle J. Borg-Graham, Cyril Monier & Yves Fregnac
Equipe Cognisciences, Institut Alfred Fessard, CNRS, Avenue de la Terrasse,91198 Gif sur Yvette, France. . . . . . . . . . . . . . . . . . . . . . . . . . . . . . . . . . . . . . . . . . . . . . . . . . . . . . . . . . . . . . . . . . . . . . . . . . . . . . . . . . . . . . . . . . . . . . . . . . . . . . . . . . . . . . . . . . . . . . . . .
The function and nature of inhibition of neurons in the visualcortex have been the focus of both experimental and theoreticalinvestigations1–7. There are two ways in which inhibition cansuppress synaptic excitation2,8. In hyperpolarizing inhibition,negative and positive currents sum linearly to produce a netchange in membrane potential. In contrast, shunting inhibitionacts nonlinearly by causing an increase in membrane conduc-tance; this divides the amplitude of the excitatory response.Visually evoked changes in membrane conductance have beenreported to be nonsignificant or weak, supporting the hyper-polarization mode of inhibition3,9–12. Here we present a newapproach to studying inhibition that is based on in vivo whole-cell voltage clamping. This technique allows the continuousmeasurement of conductance dynamics during visual activation.We show, in neurons of cat primary visual cortex, that theresponse to optimally orientated flashed bars can increase thesomatic input conductance to more than three times that of theresting state. The short latency of the visually evoked peak ofconductance, and its apparent reversal potential suggest a domi-nant contribution from g-aminobutyric acid ((GABA)A) receptor-mediated synapses. We propose that nonlinear shunting inhibi-tion may act during the initial stage of visual cortical processing,setting the balance between opponent ‘On’ and ‘Off ’ responses indifferent locations of the visual receptive field.
In the visual cortex, there are two major types of receptive fields,‘simple’ and ‘complex’, based partly on the degree of spatial overlapbetween On and Off responses (evoked by an increase or decrease inlight contrast, respectively) in the visual field4,13. Simple receptivefields have distinct On and Off subfields, whereas these are over-
lapping in complex cells. We can consider how intracortical inhibi-tion works during visual cortical processing at different levels. At thefunctional level, inhibition could help in the push–pull organiza-tion of opponent responses (for example, hyperpolarization isevoked by a decrease in light contrast in the On subfield) seen insimple receptive fields4. It could also control the spatial tuning of Onand Off excitation, as intracortical blockade of g-aminobutyric acid(GABA)A receptors results in loss of segregation of On and Offexcitatory responses in simple cells, whether measured extra-cellularly1 or intracellularly14.
At the biophysical level, even if shunting inhibition does exist,there is still a quantitative issue concerning its functional impor-tance. As the reversal potential for GABAA-mediated channels,which are probably responsible for the shunt in membrane con-ductance, is near the resting potential, shunting inhibition mustproduce a large change in the postsynaptic conductance to sig-nificantly counteract excitation. Simulations show that this shuntshould be visible as a 100–200% increase in the somatic inputconductance, Gin(t), relative to the no-stimulus condition (char-acterized as Grest)
2,15. However, measurements from current clamprecordings have indicated limited conductance changes (relative
Figure 1 The visually evoked relative change in input conductance DGin(t) and its
apparent reversal potential Erev(t) are derived from the current waveforms
measured by two to four voltage-clamp protocols, illustrated here for the
subthreshold response of an end-stopped simple cell to an Off transition of a
flashing bar (full response is shown in Fig. 2e, cell 4, position 8). a, Voltage
responses under current clamp and predicted Vm (arrow) from voltage-clamp
currents, assuming a linear model. b, Responses under voltage clamp for four
command holding potentials. c, I/V characteristics derived from linear regres-
sions corresponding to the resting state (squares), the slope of which gives Grest,
and during visual activation (circles) at the time T marked by a dotted line in (a–e),
the slope of which gives Gin(T). The voltage axis, Vh, corresponds to the command
holding potential corrected for Rs. The interpolated voltage at zero current of the
I/V characteristic at anygiven time predicts the current clamp response (Vm(t) in c.
The stability of the recording, and the justificationof a linearapproximation for this
subthreshold example, are shown by the close match between the original and
the interpolated traces superimposed in a. d, Relative DGin(t), derived con-
tinuously over the complete duration of the visual stimulation. e, Erev(t). f, Phase
plot of relative DGin(t) versus Erev(t), where each point represents averages taken
over 1ms, illustrating the various trajectories in time (arrow for time T). In this case,
the conductance response at time 0 is .105% of the input conductance at rest
because the tail of the On response starts 1000 ms earlier. All responses in this
paper are averages of 10 trials.

Nature © Macmillan Publishers Ltd 1998
8
letters to nature
370 NATURE | VOL 393 | 28 MAY 1998
DGin(t) typically in the order of 5–20%) during optimal and non-optimal visual activation3,8–11.
We aimed to examine the balance between the excitation andinhibition underlying the spatial opponency of On and Offresponses, and to identify the biophysical nature of the inhibition,using a new method for the continuous measurement of conduc-tance dynamics. The standard approach to characterize Gin(t) (usedin the visual cortex in vitro16,17 and in vivo9,12,18) is to measure voltagedeflections in response to injected current pulses. A major con-straint of this method is that although the rate of repetition of thepulses should be at least twice the highest frequency in theconductance signal, the pulse rate is limited by the resting timeconstant to account for the capacitive component of the inputimpedance. Voltage-dependent channels activated by the voltagechange during a current pulse or by action potentials, and theelectrical shunt introduced by sharp microelectrodes, also tend tounderestimate the relative DGin(t). Another approach10 relies onmeasuring the amplitude of electrically evoked test excitatorypostsynaptic potentials (EPSPs) during the visual response. How-ever, as the peak of the EPSP is reached within a few milliseconds, itsamplitude approaches that of the peak response to a currentimpulse delivered at the soma, in this case given by the ratio ofthe EPSP driving force and cell capacitance. Thus, this technique isan insensitive measure of DGin(t).
To overcome these constraints, we derived the entire DGin(t)waveform from whole-cell, steady-state, voltage-clamp recordings.After characterization of receptive fields under current clamp (see,for example, Fig. 1a), we repeated the measurements of the responseto the same visual stimulus under voltage clamp (continuous mode,no compensation for the access resistance, Rs) at two to four holdingpotentials, Vh (Fig. 1b). We then derived Gin(t), where time isreferenced to the visual stimulus, from the slope of the linearregression (I/V characteristic) of the points given by the measuredaveraged current, Im(t), and the holding potential, Vh, corrected forthe drop across Rs ðVhðtÞ ¼ VhðtÞ 2 Rs 3 ImðtÞÞ (Fig. 1c). The relativeDGin(t) was then taken as 100 3 ðGinðtÞ 2 GrestÞ=Grestð%Þ (Fig. 1d).
As with any somatic-based impedance measurement, thismethod does not overcome the loss of visibility of dendriticinputs due to synaptic interactions or cable attenuation, or con-tamination by currents from poorly clamped voltage-dependentdendritic membrane19,20. Rather, the advantage of using the voltage-clamp method is that distortion of synaptic events by transientvoltage-dependent channels and capacitance near to the recordingsite are minimized. This method also allows the continuous estimationof the apparent somatic reversal potential of the visual response,Erev(t). This value is taken as the voltage of the intersection betweenthe I/V characteristic at every time t and at rest (Fig. 1e) wheneverthe relative difference in their slopes (that is, relative DGin(t)) was
10
9
8
7
6
4
3
2
1
5
10
9
8
7
6
5
4
3
2
1
10
9
8
7
6
5
4
3
2
1
1
2
3
4
5
6
7
8
9
10
1
2
3
4
5
67
8910
1
2
3
45
6
7
89
10
1
2
3
4
5
6
500 ms 500 ms500 ms50 %10 mV
ConductanceVoltageSpike
25 Hz
Cell 2 (S)
Cell 3 (C)
Cell 4 (SH)
Cell 1 (S)
a b
c
d
e
50 %
50 ms
50 ms
Cell 2, Position 5, ON
Voltage
Conductance
10 mV
1
2
3
4
56
7
8
910
Figure 2 Response–plane receptive field maps based
on spike activity (peri-stimulus histograms, PSTHs, left
column), voltage (centre) and conductance (right)
measurements. a, Time course of the voltage
responses (top, 100 pA and bottom, 0 pA injected
current) and of the conductance observed for the
dominant On response of cell 2 in position 5. b–e,
Response–plane maps for two simple cells (cells 1, 2,
b, c) one complex cell (cell 3, d) and one end-stopped
simple cell (cell 4, e). Stimuli are optimally oriented light
bars flashed On and Off during two consecutive
periods of 1 s, in adjacent locations in the visual field,
spaced by 0.78 for cell 1, 0.58 for cell 2, and 18 for cells 3
and 4. For cell 4, a long bar stimulus was used to
emphasize the inhibitory response. PSTHs are shown
in the absence (b, d) or presence (c, e) of a constant
depolarizing current (100 pA in c, 300 pA in e). Grest and
Rs values were, respectively,17 nS and 60MQ for cell 1,
40 nS and 25MQ for cell 2, 15 nS and 20MQ for cell 3,
and 29nS and 15MQ for cell 4. Horizontal scale,
500ms; vertical scales, 25 action potential per
second for the PSTHs, 10mV for the voltage traces,
and 50% for relative DGin(t).

Nature © Macmillan Publishers Ltd 1998
8
letters to nature
NATURE | VOL 393 | 28 MAY 1998 371
.5%. This criterion allows a precise determination of the intersec-tion point of the two characteristics. Assuming that the change inthe visually evoked somatic conductance reflects the compositesynaptic input reaching the soma, Erev(t) characterizes the balancebetween excitation and inhibition over time. Finally, to indicatemore clearly the type of synaptic input underlying the conductancechanges, we constructed phase plots of the relative DGin(t) againstErev(t) (Fig. 1f).
The recordings from seven cells, from a total population of 109cells first characterized in current clamp (see Methods), were stableenough in terms of Rs and visual responsiveness to allow reliablemeasurement of both visually evoked voltages and synapticcurrents in receptive fields (response-plane maps21). Previous stu-dies of On/Off opponency have concluded, on a qualitative basis,that the dominant and opponent responses in simple cells resultfrom pure excitation and from pure subtractive inhibition,respectively4,9,22,23. However, comparison of the temporal profilesof the post-stimulus time histograms (PSTHs), and the averagedevoked synaptic potential under current clamp, shows that bothtypes of response in simple cells (Fig. 2b, c) may include compositeexcitatory/inhibitory input (for example, in Fig. 2c the dominantresponse in cell 2 position 5, and in Fig. 2b the opponent responsesin cell 1, positions 5 and 6).
The conductance profiles derived from the voltage-clamp mea-surements show that, for a given position in the receptive field, Onand Off stimuli trigger a similar transient increase of Gin(t) (Fig. 2).The average value for the largest relative conductance increases seenin each cell was 113% (s:d: ¼ 58%, n ¼ 7; see Fig. 3). In general, themaximum and global shape of the DGin(t) waveform did not parallelthe overall spike output or the waveform of the voltage record (see,for example, positions 5–6 for cell 1 in Fig. 2b, and positions 5–7 forcell 2 in Fig. 2c). Detailed examination shows that the rising phaseand maximum of the conductance peaks are associated with anabsence of spikes for both dominant and opponent responses, evenwhen applying a depolarizing current to increase the cell’s respon-siveness (Fig. 2a, inset), indicating a transient early suppressiveeffect. The largest peaks (138% 6 69%, n ¼ 4) were observed forthree simple cells and one end-stopped simple cell (Figs 2b, c, e and4). Three complex cells showed smaller but still significant con-ductance transients (80% 6 29%, n ¼ 3; Figs 2d and 4).
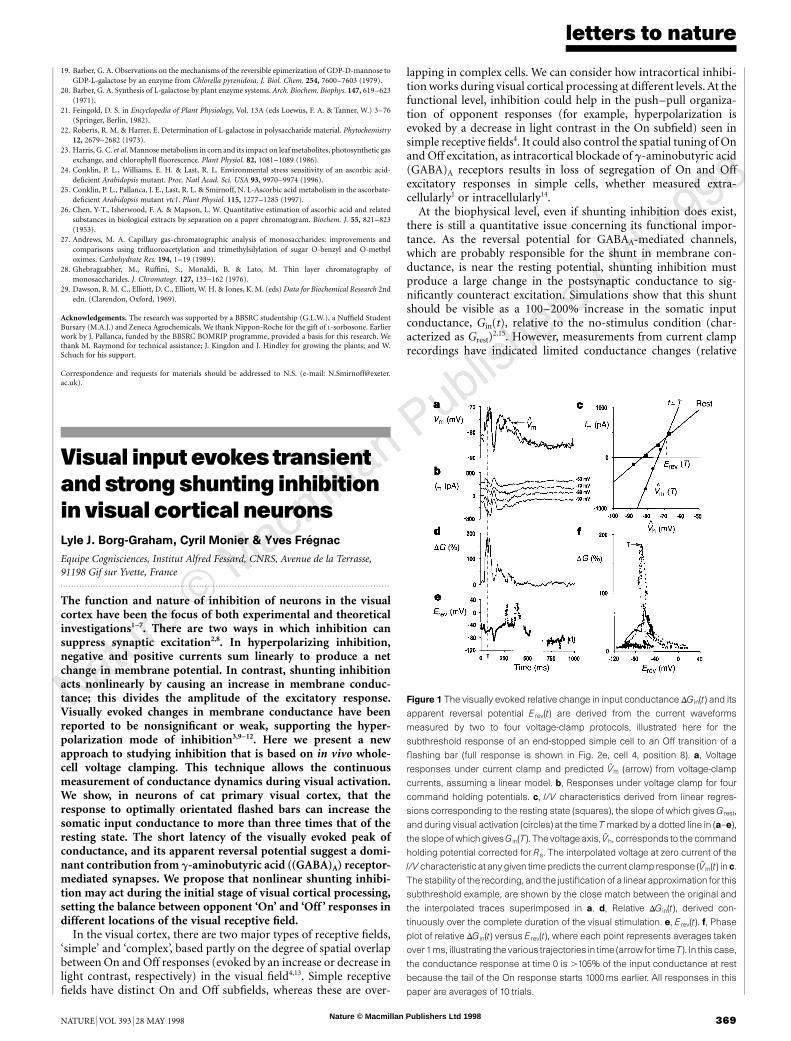
Phase plots for relative DGin(t) versus Erev(t) indicate a proto-typical bounded region for the synaptic dynamics that is indepen-dent both of the resting potential of the cell and of its functionaltype (Fig. 4). The extrapolated Erev peak values of all state trajec-tories converge near −60 to −70 mV. The averaged value of the actualpeaks established for all seven cells ( 2 63:3 mV 6 5:5 mV), whencompared to the reversal potentials of the major classes of currentsgated by excitatory and inhibitory transmitters, concurs with theGABAA reversal potential measured in vitro with identical patchpipette solutions ( 2 64 6 9 mV) (ref. 24). The main difference inthe trajectories associated with specific On or Off responses is that,typically, more positive potentials were produced when the pre-ferred stimulus was present (for example, the On response inposition 6 for cell 1 and position 7 for cell 3; see Fig. 4), and morenegative potentials were produced in response to both preferred andopponent stimuli (for example, cell 4 in Fig. 4e), indicating GABAB
receptor activation16. The trajectories often reached Erev valuesbeyond those expected for either GABAB (less than −90 mV)or a-amino-3-hydroxy-5-methyl-4-isoxazole propionic acid(AMPA) (.0 mV), which can be accounted for by voltageescape of distal inputs20. The early onset of the larger con-ductance peaks, occurring sometimes as early as 50–70 ms afterstimulation (Fig. 3b), further supports the conclusion that theseresponses are dominated by GABAA rather than GABAB activa-tion (GABAB activation occurs after longer latencies16). In somecases, early excitatory input is subsequently shunted by the largeinhibitory input, with Erev moving rapidly to a value close tothe GABAA reversal potential (Fig. 4a, chronogram inset). Theconsistent shape of the phase plots has two possible interpreta-tions, not mutually exclusive. First, shunting inhibition is thelargest component of synaptic activation that reaches the soma.Second, the shape of the peak may be constrained by therelative visibility at the soma of proximal GABAA inputscompared with more distal excitatory (and perhaps GABAB)inputs15,25.
These findings are consistent with the two following observa-tions. First, synaptic excitation and inhibition seem to overlapstrongly during visual activation5,26 as is the case when synapticactivation is produced by electrical activation of thalamic orintracortical axons in vitro16 and in vivo18. Second, both electricalstimulation of intracortical pathways and iontophoretically appliedGABA evoke a significant conductance increase in vitro as well as invivo14,16,18, contradicting the suggestion that, whatever the mode ofactivation, the effects of inhibition in vivo should differ from thoseobtained in vitro17.
These results argue against an extreme schematization of thesynaptic basis for the spatial discreteness of On and Off subfieldsand opponency of their On and Off spike responses, according towhich each subfield in simple cells is constructed exclusively fromeither On excitation only and Off inhibition only in On regions, or
0
50
100
150
200
250
- - - - - 0
0
50
100
150
200
250
0 200 400 600 800 1000
-
-
-
-
-
0
0 200 400 600 800 1000
250
150
100
50
–80 –60 –40 –20 0
Latency (ms)
150
100
50
0 600 800
800
Latency (ms)
–20
–40
200
–100
0
250
0
–60
–80
–100
0
200
1,000400200
4002000 600 1,000
c
b
a
∆G
(%)
Erev (mV)
∆G
(%)
Ere
v (m
V)
Figure 3 Relationships between amplitude, latency and apparent reversal
potential of the maximum values of relative DGin(t). Each point in the graphs
corresponds to one stimulus condition (On or Off light or dark bar flashed at a
givenposition). Results from seven cells (11protocols) for all tested positionshave
been pooled. The responses with the maximum value of the relative DGin(t) for
each cell are marked by open circles. Black and blue symbols refer to simple and
complex cells, respectively. a, Maximal DG versus Erev. b, Maximal DG versus
latency. c, Erev versus latency.

Nature © Macmillan Publishers Ltd 1998
8
letters to nature
372 NATURE | VOL 393 | 28 MAY 1998
vice versa4,13. Rather, the profiles of Erev(t) for dominant andopponent responses, and the study of synaptic responses underbicuculline application14, indicate that both On and Off responsesnormally combine excitatory and inhibitory inputs. We proposethat excitatory and inhibitory synaptic inputs interact to shape theresponse for each On or Off transition of the stimulus by controllingthe global gain of the cortical spiking response. A strongly shuntingGABAA input would be decisive during an early, nonlinear step ofprocessing, allowing the dynamic emergence of the On/Off oppo-nency expressed by small networks of reciprocally connected simplecells. If this shunting priming signal is weak, these circuits wouldthen operate in a complex-like mode that lacks this form offunctional selectivity. M. . . . . . . . . . . . . . . . . . . . . . . . . . . . . . . . . . . . . . . . . . . . . . . . . . . . . . . . . . . . . . . . . . . . . . . . . . . . . . . . . . . . . . . . . . . . . . . . . . . . . . . . . . . . . . . . . . . . . . . . .
Methods
We recorded cells in the primary visual cortex of anaesthetized (Althesin),paralysed kittens and adult cats as described26,27. For data-processing andvisual-stimulation protocols we used in-house software. Patch electrode (3–5 MQ) solutions contained 140 mM K-gluconate, 10 mM HEPES, 4 mM ATP,2 mM MgCl2, 0.4 mM GTP and 0.5 mM EGTA (KOH), with pH adjusted to 7.3and the osmolarity adjusted to 285 mosM. We obtained whole-cell patchrecordings (Axoclamp 2A amplifier) to depths <2,000 mm. The estimate ofRs was revised as necessary over the course of the experiment and, in some cases,off-line by fitting the response to subthreshold hyperpolarizing current steps tothe sum of two exponentials, with the faster exponential corresponding to thecontribution of the electrode. Estimation of Rs was also confirmed by equal-ization of the height of the initial spike in response to different strengths ofsustained depolarizing current. No significant correlation was found betweenRs and the peak value of Gint(t). We measured a tip offset potential of 10 mV,which was subtracted from the voltage records off-line28.
We characterized electrophysiological and receptive-field properties undercurrent clamp for 109 cells, each of which was recorded for .10 min(mean 6 s:d: ¼ 35 6 26 min, range 11–146 min), seal resistance in attachedmode Rseal . 2 GQ (3:7 6 1:6 GQ, range 2–10 GQ), and Rs , 60 MQ
(22 6 15 MQ, range 4–60 MQ). In these cells the average input resistance Rin
was 84.8 MQ (664.3 MQ, range 14–320 MQ), the average membrane timeconstant t0 was 14.3 ms (612.4 ms), and the average resting potential was−72.8 mV (69 mV).
We determined principal On and Off fields first by hand under currentclamp using moving bars whose dimensions were adjusted to maximize firing,and then quantitatively by flashing optimally oriented bars (width 0.1–1.0degrees) of both positive and negative contrasts at ten adjacent non-
overlapping positions across the receptive field. Visual-stimulation protocolswere begun 10–15 minutes after whole-cell access, and lasted typically for 1 h.Receptive fields were classified as simple or complex on the basis of spikeactivity27,29. In the case of reduced levels of visually evoked firing (see, forexample, Fig. 2b), we classified a subfield as simple when there was a clearopponent hyperpolarization in the voltage record4.
Received 14 October 1997; accepted 2 March 1998.
1. Sillito, A. M. The contribution of inhibitory mechanisms to the receptive field properties of neuronesin striate cortex of the cat. J. Physiol. 250, 305–329 (1975).
2. Koch, C. & Poggio, T. in Models of the Visual Cortex (eds Rose, D. & Dobson, V. G.) 408–419 (J. Wileyand Sons, Chichester, 1985).
3. Douglas, R. J., Martin, K. A. C. & Whitteridge, D. Selective responses of visual cortical cells do notdepend on shunting inhibition. Nature 332, 642–644 (1988).
4. Ferster, D. Spatially opponent excitation and inhibition in simple cells of the cat visual cortex. J.Neurosci. 8, 1172–1180 (1988).
5. Volgushev, M., Pei, X., Vidyasagar, T. R. & Creutzfeldt, O. D. Excitation and inhibition in orientationselectivity of cat visual cortex neurons revealed by whole-cell recordings in vivo. Vis. Neurosci. 10,1151–1155 (1993).
6. Bush, P. C. & Sejnowski, T. J. Effects of inhibition and dendritic saturation in simulated neocorticalpyramidal cells. J. Neurophys. 71, 2183–2193 (1994).
7. Carandini, M. & Heeger, D. J. Summation and division by neurons in primate visual cortex. Science264, 1333–1336 (1994).
8. Eccles, J. C. The Physiology of Synapses (Springer, Berlin, 1964).9. Berman, N. J., Douglas, R. J., Martin, K. A. C. & Whitteridge, D. Mechanisms of inhibition in cat visual
cortex. J. Physiol. 440, 697–722 (1991).10. Ferster, D. & Jagadeesh, B. EPSP-IPSP interactions in cat visual cortex studied with in vivo whole-cell
patch recording. J. Neurosci. 12, 1262–1274 (1992).11. Carandini, M. & Ferster, D. A tonic hyperpolarization underlying contrast adaptation in cat visual
cortex. Science 276, 949–952 (1997).12. Pei, X., Volgushev, M., Vidyasagar, T. R. & Creutzfeldt, O. D. Whole-cell recording and conductance
measurements in cat visual cortex in vivo. Neuroreport 2, 485–488 (1991).13. Hubel, D. H. & Wiesel, T. N. Receptive fields, binocular interaction and functional architecture in the
cat’s visual cortex. J. Physiol. 160, 106–154 (1962).14. Shulz, D., Bringuier, V. & Fregnac, Y. Complex-like structure of simple visual cortical receptive fields is
masked by GABAA intracortical inhibition. Soc. Neurosci. Abstr. 19, 638 (1993b).15. Koch, C., Douglas, R. & Wehmeier, U. Visibility of synaptically induced conductance changes: theory
and simulations of anatomically characterized cortical pyramidal cells. J. Neurosci. 10, 1728–1744 (1990).16. Connors, B. W., Malenka, R. C. & Silva, L. R. Two inhibitory postsynaptic potentials and GABAA and
GABAB receptor mediated responses in neocortex of rat and cat. J. Physiol. 406, 443–468 (1988).17. Berman, N. J., Douglas, R. J. & Martin, K. A. C. The conductances associated with inhibitory
postsynaptic potentials are larger in visual cortical neurones in vitro than in similar neurones in intact,anaesthetized rats. J. Physiol. 418, 107 (1989).
18. Dreifuss, J. J., Kelly, J. S. & Krnjevic, K. Cortical inhibition and gamma-aminobutyric acid. Exp. BrainRes. 9, 137–154 (1969).
19. Rall, W. in Neural Theory and Modeling (ed. Reiss, R. F.) 73–97 (Stanford Univ., 1964).20. Spruston, N., Jaffe, D. B., Williams, S. H. & Johnston, D. Voltage- and space-clamp errors associated
with the measurement of electronically remote synaptic events. J. Neurophys. 70, 781–802 (1993).21. Palmer, L. A. & Davis, T. A. Receptive field structure in cat striate cortex. J. Neurophys. 46, 260–295
(1981).22. Jagadeesh, B., Wheat, H. S. & Ferster, D. Linearity of summation of synaptic potentials underlying
direction sleectivity in simple cells of the cat visual cortex. Science 262, 1901–1904 (1993).23. Nelson, S., Toth, L., Sheth, B. & Sur, M. Orientation selectivity of cortical neurons during intracellular
blockade of inhibition. Science 265, 774–777 (1994).24. Barker, J. L. & Harrison, N. L. Outward rectification of inhibitory postsynaptic currents in cultured rat
hippocampal neurones. J. Physiol. 403, 41–55 (1988).
* **
*
*
**
*
**
*
65
3 5
65
5
7
7
6
250
–150 –100 –50 0 50
80
60
20
8
0
100
40
0
200
150
100
50
0
Cell 1 (S)
Cell 2 (S)
Cell 3 (C)
Cell 4 (SH)
∆G(%
)
Erev (mV)
Cell 2, Position 5, ONa
c
d
e
b
180 ms
60 ms300 ms
–20–80 –60 –40
Figure 4 Phase plots of relative DGin(t) versus Erev(t) for positions in the receptive
fields (indicated in corner of each graph) eliciting the largest conductance or
spike responses. a, The chronogram corresponds to the first 300ms of the
dominant response (0 nA) detailed in Fig. 2a. b–e, Plots correspond to the same
cells shown in Fig. 2b–e. Asterisks under the plots indicate the cells’ resting
potentials (−76mV for cell 1, −74mV for cell 2, −68mV for cell 3 and −80mV for cell
4). Black and red dots correspond to the On and Off responses, respectively.

Nature © Macmillan Publishers Ltd 1998
8
letters to nature
NATURE | VOL 393 | 28 MAY 1998 373
25. Anderson, J. C., Douglas, R. J., Martin, K. A. C. & Nelson, J. C. Map of the synapses formed with thedendrites of spiny stellate neurons of cat visual cortex. J. Comp. Neurol. 341, 25–38 (1994).
26. Bringuier, V., Fregnac, Y., Baranyi, A., Debanne, D. & Shulz, D. Synaptic origin and stimulusdependency of neuronal oscillatory activity in the primary visual cortex of the cat. J. Physiol. 500,751–774 (1997).
27. Debanne, D., Shulz, D. & Fregnac, Y. Activity-dependent regulation of ON and OFF responses in catvisual cortical receptive fields. J. Physiol. 500, 523–548 (1998)..
28. Neher, E. in Methods in Enzymology: Ion Channels (eds Rudy, B. & Iverson, L. E.) 123–131 (Academic,New York, 1992).
29. Orban, G. A. Neuronal Operations in the Visual Cortex (Springer, Berlin, Heidelberg, 1984).
Acknowledgements. We thank V. Bringuier and F. Chavane for help with some experiments; N. Gazeres,T. Bal, K. Grant, R. Kado, P.-M. Lledo, N. Ropert and D. Shulz for comments; and G. Sadoc and L. Glaeserfor software assistance. This work was supported by HFSP and GIS Cognisciences grants (to Y.F.). L.J.B.G.was funded by fellowships from the CNRS and Foundations Philippe and Fyssen.
Correspondence and requests for materials should be addressed to Y.F. (e-mail: [email protected]).
Acutestress facilitateslong-lastingchanges incholinergic geneexpressionDaniela Kaufer*, Alon Friedman*†, Shlomo Seidman*& Hermona Soreq*
* Department of Biological Chemistry, The Alexander Silberman Life SciencesInstitute, The Hebrew University of Jerusalem, Jerusalem 91904, Israel† Departments of Physiology and Neurosurgery, Faculty of Health Science, andZlotowski Center for Neuroscience, Ben Gurion University, Beersheva 84105, Israel. . . . . . . . . . . . . . . . . . . . . . . . . . . . . . . . . . . . . . . . . . . . . . . . . . . . . . . . . . . . . . . . . . . . . . . . . . . . . . . . . . . . . . . . . . . . . . . . . . . . . . . . . . . . . . . . . . . . . . . . .
Acute traumatic stress may lead to post-traumatic stress disorder(PTSD)1, which is characterized by delayed neuropsychiatricsymptoms including depression, irritability, and impaired cognitiveperformance2. Curiously, inhibitors of the acetylcholine-hydrolysingenzyme acetylcholinesterase may induce psychopathologies thatare reminiscent of PTSD3,4. It is unknown how a single stressfulevent mediates long-term neuronal plasticity. Moreover, nomechanism has been proposed to explain the convergent neuro-psychological outcomes of stress and of acetylcholinesteraseinhibition. However, acute stress elicits a transient increase in theamounts released of the neurotransmitter acetylcholine and a phaseof enhanced neuronal excitability5. Inhibitors of acetylcholinesterasealso promote enhanced electrical brain activity6, presumably byincreasing the survival of acetylcholine at the synapse. Here wereport that there is similar bidirectional modulation of genes thatregulate acetylcholine availability after stress and blockade ofacetylcholinesterase. These calcium-dependent changes in geneexpression coincide with phases of rapid enhancement anddelayed depression of neuronal excitability. Both of these phasesare mediated by muscarinic acetylcholine receptors. Our resultssuggest a model in which robust cholinergic stimulation triggersrapid induction of the gene encoding the transcription factor c-Fos.This protein then mediates selective regulatory effects on the long-lasting activities of genes involved in acetylcholine metabolism.
The molecular mechanisms translating a traumatic life experi-ence into long-term neuropsychological sequelae are expected toinvolve complex changes in gene regulation. We have previouslyshown that adult FVB/N mice subjected to either forced swimmingstress or inhibitors of the acetylcholine-hydrolysing enzymeacetylcholinesterase (AChE) exhibit dramatic increases in levels ofmessenger RNA encoding the early immediate transcription factorc-Fos in the brain7. In vitro, sagittal corticohippocampal brain slicesexposed to AChE inhibitors showed enhanced neuronal excitabilityand similar increases in cortical c-fos gene expression within 10 min(Fig. 1a). These increases are mediated by cholinergic stimulation ofmuscarinic acetylcholine receptors.
The presence of c-Fos-binding sites in the promoters of keycholinergic genes, such as the genes encoding AChE8,9, the acetyl-
choline-synthesizing enzyme choline acetyltransferase (ChAT)10,and the vesicular acetylcholine transporter (VAChT)11, indicatedthat elevated c-Fos levels might activate regulatory pathway(s)leading to long-term changes in the expression of proteins mediat-ing brain cholinergic neurotransmission. We performed quantita-tive reverse transcription with polymerase chain reaction (RT-PCR)on cortical RNA extracted either from mice 10–90 min after forcedswimming or from brain slices after exposure to the cholinesterase
a
VAChT
ChAT
AChE
c-Fos
Cycle no.
Syn
cont
rol
stre
ss
1 mV10 ms
Control
b
a-A
ChE
%
Control Stress
in vivo in vitro
a-AChE
a-AChE
1,000
150
120
120
700
Figure 1 Acute stress and anticholinesterases modulate CNS gene expression
similarly. a, RT-PCR analysis was performed on RNA extracted from the cortex of
control mice and stressed mice or from sagittal corticohippocampal slices
incubated with 1mM DFP or 1mM pyridostigmine (a-AChE). Products were
sampled every third cycle, electrophoresed, and stained with ethidium bromide.
Data reflect c-Fos mRNA levels 10min after stress or AChE inhibition, and AChE,
ChAT, VAChT and synaptophysin (Syn) RNA levels 30min after treatment. The
figure shows representative gels and relative band intensities (mean 6 s.d.),
calculated from densitometric analysis of a single cycle verified to be within the
linear range of product accumulation for the specific PCR reaction. On average,
five RNA samples were analysed for each treatment group. For c-Fos, AChE,
ChATandVAChT, the differences inRNA levelsobservedbetween the control and
either stress or a-AChE samples were all found to be statistically significant
(P , 0:02) in a two-tailed Student’s t-test. RNA from non-treated control animals
generated patterns similar to those from non-treated slices (not shown). b, AChE
inhibition increases neuronal excitability. The figure shows extracellular evoked
potentials recorded in the CA1 area before (control) or 30min following (a-AChE)
addition of 1mM DFP to the perfusing solution. One of five reproducible
experiments.