Embed Size (px)
Citation preview

Lincoln University Digital Thesis
Copyright Statement
The digital copy of this thesis is protected by the Copyright Act 1994 (New Zealand).
This thesis may be consulted by you, provided you comply with the provisions of the Act and the following conditions of use:
you will use the copy only for the purposes of research or private study you will recognise the author's right to be identified as the author of the thesis and
due acknowledgement will be made to the author where appropriate you will obtain the author's permission before publishing any material from the
thesis.
An Empirical Analysis of Internet Banking
Adoption in New Zealand
A thesis
Submitted in partial fulfilment
Of the requirements for the Degree of
Master of Commerce of Management
at
Lincoln University
by
Junhua Du
Lincoln University, Canterbury, New Zealand
2011
ii
Abstract of a thesis submitted in partial fulfilment of the requirements for the Degree
of M. C. M
An Empirical Analysis of Internet Banking Adoption
in New Zealand
By Junhua Du
Technological developments, particularly in the area of telecommunications and
information technology, are revolutionizing the banking industry, including New
Zealand’s banking sector. These developments have prompted new delivery channels
and banking systems including Automatic Teller Machine (ATM), telephone banking,
personal computer banking (PC), and Internet banking. Internet banking has become
one of the most rapidly diffused banking technologies. From a bank’s perspective,
Internet banking can reduce costs, increase the speed of service, expand the market,
and improve overall customer service. From the consumers’ perspectives, Internet
banking can lower services fees, and allow customers to manage their finances more
conveniently, anytime and anywhere. However, despite the efforts of the banking
sector, numerous consumers are still not using Internet banking services. This
research investigates the factors that affect consumers’ adoption of Internet banking
services in New Zealand.
iii
The findings reveal that User-friendly Website, Marketing Communications,
Perceived Risks, Price, and Internet Access/Internet Familiarity have an impact on
customers’ decisions to adopt Internet banking. The results also reveal that the Young
Age and the High Income Groups are more likely to adopt Internet banking.
The results of this research will help banks and financial institutions to implement
efficient services marketing strategies to increase the rate of Internet banking
adoption, and in turn, increase banks’ revenue and competitiveness. Furthermore, this
research provides useful information for future researchers who study the links
between customers’ decision making and Internet banking.
Keywords: Internet banking, decision factors, logit analysis, New Zealand.
iv
Acknowledgement
I would like to thank all people who helped and inspired me during my master thesis
study. This thesis would not have been possible without the support of them.
First of all, I would like to express my deep appreciation to my main supervisor Mr.
Michael D. Clemes, a respectable, responsible and resourceful scholar, thanking him
for all the valuable guidance, advice, insightful discussions, patience, kindness, and
encouragement throughout the research. I am also greatly indebted to Mike’s tireless
editing which was fast and thorough. Thank you to my associate supervisor, Dr.
Christopher Gan, for his assistance and advice, especially in the data analysis process.
Thanks and love in abundance to my parents, who provided much support, both
financial and emotional. Thanks for their endless love and support throughout my life.
Special thanks to my partner, Zhou Shang, who helped, encouraged and entertained
me when I am having hard times with my thesis.
Thanks to all my good friends, near and far, especially to Helen Zhang who assisted
me with the initial statistical analysis. My appreciation also goes to my postgraduate
colleagues and staff in the Commerce division for their support and assistance.
v
Table of Contents
Abstract ii
Acknowledgement iv
Table of Consents v
List of Tables x
List of Figures xii
List of Appendices xiii
Chapter 1 Introduction 1
1.1 Introduction 1
1.2 History and Evolution of Internet Banking 2
1.3 Consumer Beliefs about Internet Banking 5
1.4 Internet Banking in New Zealand 6
1.5 Research Justification and Objectives 8
1.6 Research Contribution 10
1.7 Structure of the Thesis 10
Chapter 2 Literature Review 11
2.1 Introduction 11
2.2 Internet Banking 11
2.2.1 The Definition of Internet Banking 11
2.2.2 Studies on Consumers’ Adoption of Internet Banking 12
2.3 Factors Influencing Adoption of Internet Banking 14
2.3.1 Convenience Factor 14
2.3.1.1 The Definitions of Convenience 14
2.3.1.2 Convenience Dimensions and Services 14
2.3.1.3 Time-saving, Effort-saving and Convenience 15
2.3.1.4 The Importance of Convenience 16
2.3.1.5 The Convenience of Factor in Internet Banking 17
2.3.2 User-friendly Website Factor 18
2.3.2.1 The Definition of a User-friendly Website 18
2.3.2.2 User-friendly Website Measurements 18
vi
2.3.2.3 The Importance of a User-friendly Website 20
2.3.3 Internet Access Factor 21
2.3.3.1 The Market Growth of Internet Access 21
2.3.3.2 The Growth in Internet Activities 23
2.3.4 Internet Familiarity Factor 24
2.3.4.1 The Concept of Familiarity 24
2.3.4.2 Familiarity with the Internet in an Internet Banking Context 25
2.3.5 Marketing Communications 26
2.3.5.1 Advertising 27
2.3.5.2 Personal Selling 28
2.3.6 Word-of Mouth 29
2.3.7 Perceived Risk Factor 31
2.3.7.1 The Concept of Perceived Risk 31
2.3.7.2 Perceived Risk and Service Sector 32
2.3.7.3 Types of Perceived Risks 33
2.3.7.4 Perceived Risks in Internet Banking 34
2.3.8 Price Factor 35
2.3.8.1 The Definitions of Price 35
2.3.8.2 The Importance of Price 36
2.3.9 Demographic Characteristics 37
Chapter 3 Model and Hypotheses 38
3.1 Introduction 38
3.2 Conceptual Gaps 38
3.3 The conceptual Research Model 39
3.4 The Research Model Based on the Factor Analysis 41
3.5 Hypothesis Development 43
3.6 Hypotheses Relating to Objective One and Two 43
3.6.1 Convenience Factor 43
3.6.2 User-friendly Website Factor 44
3.6.3 Internet Access/Internet Familiarity Factor 46
3.6.4 Marketing Communications Factor 49
3.6.5 Word-of Mouth Factor 50
3.6.6 Perceived Risk Factor 51
vii
3.6.7 Price Factor 52
3.6.8 Self-Image Factor 53
3.7 Hypotheses Relating to Research Objective Three 54
3.7.1 Demographic Characterises 54
3.8 Chapter Summary 57
Chapter 4 Research Methodology 58
4.1 Introduction 58
4.2 Research Design 58
4.3 Sampling Method 58
4.4 Sample Size 59
4.5 Questionnaire Development 60
4.5.1 Focus Group Interviews 60
4.5.2 Questionnaire Format 61
4.5.3 Pre-testing Procedures 62
4.6 Date Collect Procedures 63
4.7 Data Analysis Techniques 63
4.7.1 Factor Analysis 63
4.7.1.1 Modes of Factor Analysis 64
4.7.1.2 Types of Factor Analysis 65
4.7.1.3 Assumptions for Factor Analysis 67
4.7.1.4 Test for Determining Appropriateness of Factor Analysis 68
4.7.1.5 Factor Extraction in Principal Components 70
4.7.1.6 Factor Rotation 71
4.7.1.7 Interpretation of Factors 74
4.7.2 Summated Scale 75
4.7.2.1 Content Validity 75
4.7.2.2 Dimensionality 76
4.7.2.3 Reliability 76
4.7.3 Logistic Regression Analysis 77
4.7.3.1 Qualitative Choice Analysis 77
4.7.4 Statistical Assumptions for Logistic Regression 86
4.7.4.1 Outliers 86
4.7.4.2 Linearity 87
viii
4.7.4.3 Multicollinearity 87
4.7.4.4 Data Level 88
4.7.5 Sensitivity Analysis 88
4.7.6 T-test and Analysis of Variance (ANOVA) 89
4.7.6.1 T-test 89
4.7.6.2 Analysis of Variance (ANOVA) 90
4.8 Chapter Summary 92
Chapter 5 Results and Discussion 93
5.1 Introduction 93
5.2 Sample and Response Rate 93
5.3 Descriptive Statistics 94
5.4 Assessment of the Data Set 95
5.4.1 Statistical Assumptions for Factor Analysis 95
5.4.1.1 Examination of the Correlation Matrix 96
5.4.1.2 Inspection of the Anti-Image Correlation Matrix 96
5.4.1.3 Barlett’s Test of Sphericity 96
5.4.1.4 Kaiser-Meyer-Olkin Measure of Sampling Adequacy 97
5.4.2 Factor Analysis Results 97
5.4.2.1 The Latent Roots Criterion 97
5.4.2.2 The Scree Test 98
5.4.2.3 Factor Rotation 98
5.4.2.4 Factor Interpretation 99
5.4.3 Assessment of Summated Scales 100
5.4.3.1 Content Validity 100
5.4.3.2 Dimensionality 100
5.4.3.3 Reliability 101
5.4.4 Statistical Assumptions for Logistic Regression Models 101
5.4.4.1 Outliers 101
5.4.4.2 Multicollinearity 102
5.4.4.3 Data Level 102
5.5 Results Relating to Research Objective One 102
5.6 Results Relating to Research Objective Two 105
5.7 Results Relating to Research Objective Three 108
ix
5.7.1 Age Relating to Internet Banking Adoption 111
5.7.2 Material Status Relating to Internet Banking Adoption 112
5.7.3 Qualification Relating to Internet Banking Adoption 112
5.7.4 Occupation Relating to Internet Banking Adoption 113
5.7.5 Income Relating to Internet Banking Adoption 113
5.8 Chapter Summary 113
Chapter 6 Conclusions and Implications 115
6.1 Introduction 115
6.2 Conclusions Relating to Research Objective One 115
6.3 Conclusions Relating to Research Objective Two 118
6.4 Conclusions Relating to Research Objective Three 119
6.5 Theoretical Implications 121
6.6 Managerial Implications 122
6.7 Limitations and Avenues for Future Research 131
6.8 Conclusion 132
References 133
x
List of Tables
Table 4.1: Modes of Factor Analysis 65
Table 4.2: Guidelines for Identifying Significant Factor Loadings 74
Table 5.1: Description Statistic of Demographic Characteristics 155
Table 5.2: The Correlation Matix for Internet Banking Adoption 157
Table 5.3: Anti-Image Correlation 160
Table 5.4: KMO and Barlett’s Test 163
Table 5.5: Factor Extraction 164
Table 5.6: VARIMAX Rotated Component Matrix 165
Table 5.7: Pattern Matrix with OBLIMIN Rotation 166
Table 5.8: Questionnaire Items with Orthogonal (VARIMAX) Rotation 167
Table 5.9: The Reliability Test for Measures of Internet Banking Adoption 168
Table 5.10: Person Correlation Matrix 170
Table 5.11: Logistic Regression Results for Influencing Factors and
Demographic Characteristics on Internet Banking Adoption 171
Table 5.12: Summary of Logistic Regression Results 102
Table 5.13: Hypotheses 1 to 8 Test Results Summary 103
Table 5.14: Marginal Effects of Customers’ Adoption of Internet Banking 105
Table 5.14a: Summary of Marginal Effects of Influencing Factors
(exclude Demographic Characteristics) 105
Table 5.14b: Summary of Marginal Effects of Customers’
Demographic Characteristics 107
Table 5.15: Hypotheses 9 to 18 Test Results Summary 109
Table 5.16: T-test Results Relating to Gender 172
Table 5.17: ANOVA (F-tests) Results Relating to Age 172
Table 5.18: ANOVA (F-tests) Results Relating to Marital Status 173
Table 5.19: ANOVA (F-tests) Results Relating to Qualification 173
Table 5.20: ANOVA (F-tests) Results Relating to Occupation 174
Table 5.21: ANOVA (F-tests) Results Relating to Annual Income 174
Table 5.22: Scheffe Output for Age (Multiple Comparisons) 175
Table 5.23: Scheffe Output for Marital Status (Multiple Comparisons) 176
Table 5.24: Scheffe Output for Qualification (Multiple Comparisons) 177
Table 5.25: Scheffe Output for Occupation (Multiple Comparisons) 178

xi
Table 5.26: Scheffe Output for Annual Income (Multiple Comparisons) 179

xii
List of Figures
Figure 3.1: The Conceptual Research Model 40
Figure 3.2: Internet Banking Decision Factors Model 42
Figure 5.1: The Scree Plot 98

xiii
List of Appendices
Appendix 1: Cover Letter 180
Appendix 2: Questionnaire 181
1
Chapter 1 Introduction
1.1 Introduction
Since the 1970s, Electronic Commerce (E-commerce) has emerged as a new concept
in the business vocabulary (Wigand, 1997). E-commerce refers to sharing business
information, maintaining business relationships, and conducting business transactions
using telecommunications networks. Traditional E-commerce, conducted using
information technologies centering on electronic data interchange (EDI) over
proprietary value-added networks, has moved rapidly to the Internet (Zwass, 1996).
The increasing popularity and interest in using the Internet is driven by its World
Wide Web (WWW) subset and has created great opportunities for many organizations,
from small businesses to large corporations, including financial institutions
(Lallmahamood, 2007; Chau and Lai, 2003; Rashid and AI-Qirim, 2001). Banks are
currently gaining several benefits from WWW technology (Lallmahamood, 2007).
In particular, banks and financial institutions that have implemented WWW delivery
of their services have captured a large share of the financial market (Tan and Teo,
2000).
Internet banking refers to the use of the Internet as a delivery channel for banking
services, including traditional banking services such as balance enquiry, printing
2
statements, fund transfers to other accounts and bill payments (Frust, Lang and Nolle,
2000) and new banking services such as electronic regular payments and direct credit
for salaries (Mukherjee and Nath, 2003). Internet banking has created new ways of
banking in the main areas of distribution, production, payment and trading
(Jayawardhena and Foley, 2000; Llevwellyn, 1997).
1.2 History and Evolution of Internet Banking
Banks operate in a strategic information system environment which indicates that they
are information-intensive and highly dependent on information technology as their
core technology (Broadbent and Weill, 1993). The developments in information
technology have had an enormous effect on the development of more user-friendly
banking services and increased the transaction and communication speed between
banks and customers (Akinci, Aksoy and Atilgan, 2004; Giannakoudi, 1999).
The revolution of information technology in the banking industry began in the early
1970s, with the introduction of the automated teller machine (ATM) which was first
installed by Barclays Bank in the United Kingdom (UK) (Introna and Whittaker, 2005;
Giannakoudi, 1999). ATMs allow customers to deposit money, withdraw cash,
request a balance and pay bills at any time. ATM services not only provide
convenience for customers, but also decrease operating costs for the bank (Rose and
Hudgins, 2008). However, ATMs lack personalized services and do not have the
3
ability to sell peripheral services, such as a mortgage plan (Rose and Hudgins, 2008).
The next technology developed by banks was telephone banking which was firstly
introduced by Seattle First National Bank in the United States (US) in the late 1970s
(Shapiro, 1999). Telephone banking is more cost-effective than ordinary branch
banking and the process increases customer convenience as well as expanding access
to a wide variety of services for customers (Mols, Bukh and Nielsen, 1999). However,
telephone banking lacks visual verification (Giannakoudi, 1999), and customers
cannot perform self-banking activities by using telephone banking (Guru,
Vaithilingam, Ismail and Prasad, 2000).
Owing to the popularity of personal computers, PC-banking was launched during the
late 1980s and the early 1990s (Polasik and Wisniewski, 2009; Giannakoudi, 1999).
The first bank to offer PC-banking was Citibank in the US (Shapiro, 1999).
PC-banking requires its users to install propriety software on home computers and
allows banking transactions and the accessing of account information with a bank‘s
server in an offline mode (Polasik and Wisniewski, 2009; Shapiro, 1999). PC-banking
is capable of delivering high-quality graphic pages (Shapiro, 1999) and increasing
speed as well as improving the flexibility of business transactions (Guru et al., 2000).
However, PC-banking is complicated to use and the closed system technology
provides only a closed network, which is limited to existing clients (Chang, 2003;
Mols et al., 1999).
4
Internet banking emerged in the 1990s and was first launched by the Wells Fargo bank
in the US. There is a wide agreement that the channel has had a substantial impact on
bank markets (Karjaluoto, Matila and Pento, 2002).
From the viewpoint of the banks, Internet banking helps banks to maintain profitable
growth through reducing the operation and fixed costs (Hernando and Nieto, 2007;
Chung and Paynter, 2002, Sathye, 1999). Jayawardhena and Foley (2000) reported
that a simple transaction cost for a non-cash payment at a branch is likely to cost a
bank as much as 11 times more than over the Internet based on a sample of New
Zealand banks. Chung and Paynter (2002) estimated that an Internet transaction only
costs a bank $0.05 while a paper transaction at a branch cost approximately $1. In
addition, Internet banking enhances marketing and communication, as it serves 24
hours a day and a customer can be guided through a catalogue of products and
services (Jayawardhena and Foley, 2000). Moreover, an Internet banking system
allows banks to expand their business geographically without investing in the
establishment of new branches and, as a result, the customer base is broadened
(Giannakoudi, 1999).
From the viewpoint of consumers, Internet banking is attractive because of its
convenience and lower fees. Internet banking users can perform financial transactions
at anytime and anywhere without queuing at bank branches (Sayar and Wolfe, 2007).
5
Moreover, Internet banking offers lower fees or better rates on deposit and loans
which enable the cost savings to be passed on to consumers (Polasik and Wisniewski,
2009). Furthermore, Internet banking provides customer rapid updating,
richness-information (Palmer, 2002; Shapiro, 1999), speedy transaction access (Mavri
and Loannou, 2006) and absolute self-service (Eriksson and Nilsson, 2007).
Internet banking has become one of the most popular banking channels and the
decision to provide Internet banking is perceived to be a vital strategy for customer
retention and remaining competitive for banks and financial institutions (Kim,
Widdows and Yilmazer, 2005).
1.3 Consumer Beliefs about Internet Banking
The adoption of Internet banking has been a challenging issue for banks and the
object of various academic studies (Karjaluoto et al., 2002). According to
Athanassopuolos and Labrouko (1999), price, speed and the bank‘s reputation seemed
to be important criteria for the adoption of Internet banking in Greece. Daniel (1999)
concludes that in the United Kingdom, customers tend to value convenience,
increased choice of access to the bank, and improved control over the banking
activities and finances using Internet banking. Furthermore, consumers‘ regard
accessibility, functionality and services at low price as important in Internet banking
(Karjaluoto et al., 2002). Wang, Wang, Lin and Tang (2003) find evidence that
6
perceived ease of use, perceived usefulness and perceived credibility all have
significant positive effects on customers‘ intention to adopt Internet banking in
Taiwan. Gerrard and Cunningham (2003) find that Internet banking adopters
compared with non-Internet banking adopters believe Internet banking to be more
convenient, less complex, and more compatible. Lee (2009) notes that perceived risks,
in terms of security/privacy risk is the greatest obstacle to Internet banking adoption.
Lockett and Litter (1997) indicate that two negative attributes of Internet banking are
risks and complexity, whereas the most important perceived positive attribute of
Internet banking is 24 hours and 7 days availability. Furthermore, Gerrard,
Cunningham and Devlin (2006) use a content analysis procedure and examine eight
factors which explain why consumers are not using Internet banking in Singapore. In
order of frequency, the factors are: perceptions about risk, the need, lacking
knowledge, inertia, inaccessibility, human touch, pricing and IT fatigue.
1.4 Internet Banking in New Zealand
The New Zealand banking industry started in 1840 when the earliest European settlers
arrived. From the beginning, legislation shaped New Zealand‘s banking industry and
placed specific restrictions on the services bank could provide. Until 1984, the New
Zealand banking industry operated under Government controlled economic conditions
and was underdeveloped as the industry offered lower quality and more expensive
services to bank customers. Since 1987, the deregulation programme in the banking
7
industry in New Zealand has removed the previous legislation and allowed banks and
other financial institutions to freely develop their own strategies to meet bank
customers‘ needs. Deregulation increased competition and boosted information
technology and telecommunications evolution in the New Zealand banking industry
(Willis, Dickens and Tripe, 2006).
The substantial upgrade of the telecommunication infrastructure and the high degree
of computer and Internet penetration provided a favourable situation for the
development of Internet banking in New Zealand (Chung and Paynter, 2002). Since
Auckland Savings Bank (ASB) first introduced an Internet banking service in mid
1996, increasing numbers of bank institutions have been offering their Internet
banking services in New Zealand. BankDirect commenced online banking in October
1997, followed by National Bank of New Zealand (NBNZ) and Bank of New Zealand
(BNZ), both of which offered Internet banking in late 1999 (Barton, 2000). Australia
and New Zealand Banking Group (ANZ) launched its website in the first half of 2000,
Westpac Banking Group (Westpac) soon after and the TSB Bank (TSB) introduced
Internet banking in early 2001 (Chung and Paynter, 2002). Kiwibank was the last
bank to offer Internet banking in 2002 (Bruce, 2002; O‘Connell, 2002). Among these
banks, the ANZ, BNZ, ASB, WestpacTrust and NBNZ dominate the market in New
Zealand as they control more than 90 percent of the online banking market (Taylor,
2002). In addition, the ASB, Westpac and NBNZ are the most popular banking
8
Internet sites (Neilsen, 2008).
The population of Internet banking users has rapidly increased since Internet banking
was introduced in New Zealand. According to Taylor (2002), the number of Internet
banking users was about 310,000 in 2000, and it increased to around 480,000 in 2001
(Taylor, 2002). Recent research shows that the number of Internet banking users
reached over 1 million in 2008 (Neilsen, 2008; Statistics New Zealand, 2008). More
than two thirds (68%) of Internet users accessed online banking sites in January 2008
which indicates that Internet banking has become a mainstream activity in the retail
banking market in New Zealand (Neilsen, 2008).
1.5 Research Justification and Objectives
Although many consumers have turned to Internet banking because of its greater
convenience, low cost, and speed (Kerem, 2003; Chang, 2003), numerous consumers
are still not using Internet banking services due to several factors, such as lack of
Internet access and perceived risks (Lee, 2009; Lichtenstein and Williamson, 2006).
Gerrard and Cunningham (2003) point out that the relative success of Internet banking
can be gauged by identifying the number of current users and anticipated future
adopters. Hence, there is a need to understand the factors that influence customers‘
choices of Internet banking.
9
Several published studies have investigated the key determinants that affect
consumers‘ adoption of Internet banking (Suki, 2010; Polasik and Wisniewski, 2009;
Padachi, Rojid and Seetanah, 2007; Chiemeke, Evwiekpaefe and Chete, 2006;
Gerrard et al., 2006; Eriksson, Kerem and Nilsson, 2005; Wang et al., 2003; Gerrard
and Cunningham, 2003; Karjaluoto et al., 2002; Liao and Cheung, 2002). However,
the key determinants are inconclusive for the New Zealand banking sector due to
economic, social, political and cultural differences and there are limited empirical
studies which have examined the main drivers underlying a customer‘s decision to
adopt Internet banking in New Zealand. This empirical research is intended to fill this
gap and focuses on the factors that influence customers‘ Internet banking adoption in
the New Zealand banking industry. The study also examines if the results and findings
are similar to previous studies.
The research objectives of this study are:
(1) To identify the factors that affect bank customers‘ adoption of Internet banking in
New Zealand.
(2) To determine the most important factors that affect bank customers‘ adoption of
Internet banking in New Zealand.
(3) To examine the impacts of demographic characteristics on bank customers‘
adoption of Internet banking in New Zealand.
10
1.6 Research Contribution
This study aims to make several contributions to the marketing literature in both the
academic and managerial sectors of the banking industry. This study seeks to identify
the factors that influence consumers to adopt Internet banking in New Zealand.
Secondly, this study also determines the most important factors that affect customers‘
adoption of Internet banking. Thirdly, the study determines the impact that the
demographic characteristics have on Internet banking. The findings of this research
will enable banks to develop effective strategies to attract more customers to utilize
Internet banking and this will help them maintain competitiveness in the New Zealand
banking industry.
1.7 Structure of the Thesis
Chapter One provides an overview of Internet banking, the research justification and
objectives. Chapter Two reviews the literature on adoption of Internet banking and
examines the factors influencing customers‘ adoption of Internet banking. Chapter
Three explains the variable selection, theoretical model formulation, and develops 18
testable hypotheses. Chapter Four details the methodology used to test the hypotheses.
Chapter Five presents the empirical results. Finally, Chapter Six provides the
conclusions of the research findings, implications, limitations and recommendations
for the future research.
11
Chapter 2 Literature Review
2.1 Introduction
This chapter reviews the previous studies on the adoption of Internet banking and
focuses on the major factors influencing customers‘ decisions to adopt Internet
banking, such as Convenience, User-friendly Website, Internet Access, Internet
Familiarity, Marketing Communications, Word-of-Mouth, Perceived Risks, Price, and
Demographic Characteristics.
2.2 Internet Banking
2.2.1 The Definition of Internet Banking
Internet banking can be defined as the delivery of banking services to customers
through the Internet network (Yiu, Grant and Edgar, 2007). At the basic level, Internet
banking means establishing a Web page by a bank to provide information about its
product and services (Daniel, 1999). At an advance level, Internet banking is the
enabling of ―transactional‖ banking services to customers over the Internet
(Karjaluoto et al., 2002). Banking services involve: verifying account balances,
moving funds from one account to another, confirming that transactions have taken
place, ensuring checks have been cleared, placing orders for new cheque books,
submitting applications for loans and credit cards, and carrying out bill payments
12
(Rose and Hudgins, 2008).
2.2.2 Studies on Consumers’ Adoption of Internet Banking
Previous studies have identified a number of criteria that consumers consider
important in the adoption of Internet banking.
Gerrard and Cunningham (2003) measure the factors relating to the adoption of
Internet banking using a sample of Singapore consumers. The factor analysis results
indicate that social desirability, compatibility, convenience, complexity,
confidentiality, accessibility, economic benefits and computer proficiency are the
influential factors of Internet banking adoption. Polatoglu and Ekin (2001) conduct an
exploratory study of consumer acceptance of Internet banking in Turkey. The authors
examine consumer-related factors, such as complexity, perceived risk and relative
advantages, as well as organizational factor such as marketing effort that affect the
adoption of Internet banking. The authors also find that young, affluent and highly
educated groups are more likely to accept Internet banking than other groups.
Jaruwachirathanakul and Fink (2005) identify factors, such as the features on the web
site, perceived usefulness, and perceived behaviroual control that encourage
consumers to use Internet banking services in Thailand. The significant demographic
characteristics to Internet adoption are gender, educational level, and income. Wang et
al. (2003) examine the determinants of user acceptance of Internet banking in Taiwan.

13
The results of the study demonstrate the significant effect of computer self-efficacy,
perceived ease of use, perceived usefulness and perceived credibility on the
consumers‘ behavioural intention to adopt Internet banking.
Polasik and Wisniewski (2009) identify five main factors affect consumers‘ decisions
to adopt Internet banking: perceived security, Internet experience, marketing exposure,
use of other banking products, and demographic characteristics in Poland. Padachi et
al. (2007) use factor analysis to identify the factors that affect the adoption of Internet
banking in Mauritius. The results of their study reveal that the most significant factor
is ease of use and the other important factors are trust, cost of computers, Internet
accessibility, convenience, and security. Sathye (1999) find there are six factors that
affect the adoption of Internet banking by Australia consumers. In order of frequency,
the factors are: security concerns, lack of awareness of the benefits of Internet
banking, ease of use, price, resistance to change, accessibility to computers/Internet.
Chiemeke et al. (2006) investigate the adoption of Internet banking in Nigeria and
finds the main factors that inhibit the adoption of Internet banking are security and
inadequate operational facilities including proper telecommunications and power. The
author suggests that further improvements on security and provision of key
ingredients of Internet banking including confidentiality, effective communication
integrity and availability should be considered in order to satisfy customers‘
requirements and increase the rate of Internet banking adoption.
14
2.3 Factors Influencing Adoption of Internet Banking
2.3.1 Convenience Factor
2.3.1.1 The Definitions of Convenience
The American Heritage Dictionary (1992) defines convenience (noun) as ―the quality
of being suitable to one‘s comfort, purposes, or needs‖ and as ―something that
increases comfort or saves work.‖ Convenient (adj.) has been defined as ―easy to
reach; accessible‖ and ―suited or favorable to one‘s comfort, purpose, or needs‖. In
the context of a service encounter, convenience has been described in terms of
lifestyle, not having to travel, personal safety, and not having to wait (Lichtenstein
and Williamson, 2006).
2.3.1.2 Convenience Dimensions and Services
There are various definitions of the convenience construct in the services marking
literature. Among all of the definitions of convenience, Brown (1990) offers one of
the most thorough views. Brown (1990) argues that convenience should be seen as a
multidimensional construct. The concept of convenience is proposed to have five
dimensions: time, place, acquisition, use, and execution (Brown, 1990).
Time dimension: Services may be provided at a time that is more convenient for the
customer. For example: some banks are open 12 or more hours per week day and on
15
Saturday (Brown, 1990).
Place dimension: Services may be provided in a place that is more convenient for the
customer. Providing services in the homes of customers is a common example (Brown,
1990).
Acquisition dimension: Firms may make it easier for the customer, financially and
otherwise, to purchase their services. Accepting credit cards and developing credit
plans are examples of this dimension (Brown, 1990).
Use dimension: Services may be made more convenient for the customer to use.
Banking by electronic channels offers some customers increased ease in making
payments and performing other financial transactions (Brown, 1990).
Execution dimension: The most obvious convenience is simply having someone
provide the service. For example, banks have done well by providing electronic
banking services which can help customers accomplish bank enquires (Brown, 1990).
2.3.1.3 Time-saving, Effort-saving and Convenience
Convenience was originally understood as ease of acquisition and convenience in
purchasing, for which minimal physical or mental effort or time was required
16
(Copeland, 1923). The growth in the demand for convenient services and goods
results from the view that time is a scarce and valuable resource (Anderson, 1971). As
economic theory explains, regardless of income or wealth, a person has only 24 hours
in any given day. Time cannot be stockpiled and vanishes constantly and irreversibly.
Time‘s value derives from its scarcity (Voli, 1998). Becker (1965) suggests that the
scarcity of time influences the demand for time-saving goods and services. Brown
(1990) states that time-saving is not a separate dimension of convenience. Saving time
may be a benefit of a convenient service and the reason a consumer is interested in the
service (Brown, 1990).
Effort can be defined as the amount of energy put into a behavior or series of
behaviors (Mohr and Bitner, 1995). In a common sense, effort is equated with ―really
trying‖ with ―putting a lot into‖ the situation (Mohr and Bitner, 1995). Consumers‘
energy expenditure or effort is considered to be a distinct type of non-monetary cost
that, like time, influences perceived convenience (Berry, Seiders and Grewal, 2002).
Effort-saving can be viewed as a part of a consumer‘s motivation which directs
consumer behavior for convenience consumption (Anderson, 1971).
2.3.1.4 The Importance of Convenience
Anderson (1972) notes that convenience may influence consumption behavior.
Service convenience is also seen as instrumental to consumers for determining the
17
choice of a service and evaluating a firm‘s service performance (Mohr and Bitner,
1995; Anderson, 1972). In consumer services research, convenience has increasingly
been recognized as a salient product attribute and as a basis for making purchase
decisions (Voli, 1998).
Convenience is one of the key issues surrounding customer acceptance or rejection of
a channel (Bucklin, 1966). Wan, Luk and Chow (2005) empirically confirm that
convenience has a significant impact on customers‘ adoption of banking channels in
Hong Kong. Likewise, adoption research, which has been conducted on self-service
technologies used in banking, has identified convenience as one of the most important
factors. (Black, Lockett and Ennew, 2001; Polatoglu and Ekin, 2001; Suganthi,
Balachandher and Balachandran, 2001; Loudon and Della Bitta, 1993).
2.3.1.5 Convenience Factor in Internet banking
Convenience is one of the most beneficial features of Internet banking (Liao and
Cheung, 2002; Daniel, 1999). People can bank online to pay bills, check balances,
transfer funds, apply for auto loans and mortgages, and use other complementary
services at the tip of a finger anytime from anywhere (Yu and Lo, 2007; Ramsaran,
2003). Lichtenstein and Williamson (2006) indicate that time saving and 24/7 access
appear to be the most important aspects of the convenience of Internet banking
services. Devlin (1995) explains that as people become more time and leisure
18
conscious, the convenience aspects of Internet banking will be increasingly valued.
2.3.2 User-friendly Website Factor
2.3.2.1 The Definition of a User-friendly Website
A website can be considered as an information system and the customer as an
end-user of the information system (Jun and Cai, 2001). A user-friendly website refers
to the fluency or ease with which a user is able to interact with an information system
(Nantel and Glaser, 2008; Hiller, 2003).
2.3.2.2 User-friendly Website Measurements
Diniz (1998) argues that banks use websites to provide information, to conduct
transactions and to improve customer relationships. A user-friendly bank website
requires website usability which can be measured by: download delay, navigation,
information content, interactivity, and responsiveness (Yang, Cai and Zhou, 2005)
Download delay, which is also called download waiting or response time, refers to the
length of time the consumer has to wait, after clicking on a Website‘s URL, to be able
to use the Website for specific activities (Dabholkar and Sheng, 2008; Palmer, 2002).
On the client side, delays are due to bandwidth internet connection limitations. On the
server side, delays are related to large numbers and sizes of images and limitations on
19
advanced software technologies (Rose, Evaristo and Straub, 2003).
Navigation reflects the website‘s capacity to help users to find the information and
carry out operations easily (Palmer, 2002). Graphical design, layout, and actual
content tools (home buttons, search for keywords, back to top buttons, help menu
buttons) are the main components in providing the navigability of a bank website
(Hernandez-Ortega, Jimenez-Martinez and Hoyos, 2007; Palmer, 2002).
Information content refers to use of text, graphics, and multimedia features to present
information in a website (Palmer, 2002). An informative bank website can provide
insight into the detailed and specific information with respect to products or services
(e.g. prices, rates, loans), the company (e.g. mission, projects, balance sheet) or other
relevant topics (e.g. recruitment, application forms, ways to contact banks) (Huizingh,
2000; Stamoulis, 2000).
Interactivity is defined as the availability and effectiveness of customers‘ support tools
on a website, and the degree to which they facilitate two-way communication with
customers (Srinivasan, Anderson and Ponnavolu, 2002). At a basic level, e-mail and
feedback forms are methods by which a client can make suggestions and lodge
complaints (Brown, 1990). Advanced technologies, such as videoconference may be
also offered as a support to help customers make financial decisions (Diniz, 1998).
20
Responsiveness refers to the site ability to respond to user queries (Cyr, Head and
Ivanoy, 2009). Responsive bank websites present feedback to customers and provide
site managers with the ability to answer frequently asked questions (Palmer, 2002).
2.3.2.3 The Importance of a User-friendly Website
The website acts as a ―window‖ that enables customers‘ initial interaction with the
organization (Zhang and Dran, 2002). The features of user-friendly bank website such
as quick response, easy navigation, richness of information content, and responsive
interaction play important roles in increasing web users‘ satisfaction (Al-Hawari and
Ward, 2006; Jayawardhena and Foley, 2000). This satisfaction increases the
probability of obtaining loyal customers. On the other hand, a poor website design
may prevent users from finalizing the desired transactions and, consequently, the users
will not revisit the financial entity (Hernandez-Ortega et al., 2007).
In addition, a user-friendly bank website can be linked to attracting customers‘
intentions to purchase a financial service (Bai, Law and Wen, 2008; Waite and
Harrison, 2004), perceived online system quality in the success of Internet banking
(Jun and Cai, 2001), valuing efficiency of services (Padachi et al., 2007), inducing
trust among customers (Bose and Leung, 2008), and enhancing banks‘ ability in
financial performance (AI-Hawari and Ward, 2006).
21
2.3.3 Internet Access Factor
Internet access is a bundle of complementary services which at a minimum includes
the services of a terminal and information transportation services to an Internet
gateway (Bauer , Berne and Maitland., 2002).
2.3.3.1 The Market Growth of Internet Access
Internet access growth and potential market size are affected by a number of issues.
The most directly relevant to this current study are:
Methods to access the Internet
Current access to the Internet is usually via computers. With the development of the
technology, the Internet is available to be accessed through televisions or mobile
phones (Papagiannidis, Berry and Li., 2006; Fan, 2005; Makki, Pissinou, and Daroux,
2003).
Places to access the Internet
Private homes and public facilities, such as a cyber café, are the main sources of
Internet access. In addition, offices, institutions, and libraries also provide access to
the Internet (Oyelaran-Oyeyinka and Adeya, 2004; Luyt, 2006; Sim and Koi, 2002).
22
Types of Internet access connection
Traditionally, connection to the Internet has been through dial-up connections. Recent
research indicates that there is a fast growth in broadband access in most countries
(Bauer et al., 2002). A dial-up service is typically provided through a telephone line
and modem. However, this method has a limited capacity and relatively slow data
transmission rates (28-56kbps) (GAO, 2001).
A broadband connection, provided by digital subscriber line (DSL), cable modem,
fixed wireless, and satellite, offers transmission rates up to 20-50 times faster than a
traditional dial-up connection so that downloading a web page is noticeably faster.
Broadband is characterized by its ―always on‖ nature which means that there is no
wait to get online when the computer is on (Savage and Waldman, 2005).
Cost of Internet access
The cost of Internet access has two components. The first component is the cost of
transport from computers to the Internet backbone which is typically paid to telephone
and cable companies. The second component is the monthly subscription charge to
Internet service providers (ISPs) who provide portals to the wide array of activities,
information, and services available on the world wide web (Savage and Waldman,
2005).
23
In New Zealand, flat-rate subscription charges in 2009 ranged from NZ$10-NZ$27.95
per month for dial-up Internet access and approximately NZ$29.95-NZ$229.95 per
month for broadband connection. Broadband charges depend on the amount of data
usage in a month (Telecom, 2009; Telstraclear, 2009). Lowing access cost to the
Internet may potentially lead to an increase in the number of users (Chaudhuri, Flamm
and Horrigan, 2005)
Cost of computers
The decrease in the price of computers has improved the affordability of the
equipment necessary for Internet access (Chaudhuri et al., 2005)
Perceived value of the Internet
Consumers must believe they need and will use the Internet before having the
intention of going online (Chaudhuri et al., 2005). As new networks are added to the
Internet and more people share their knowledge, the value of the Internet and its
usefulness to the users is expected to increase (McCarthy, 2000).
2.3.3.2 The Growth in Internet Activities
People‘s everyday activities have changed with the growth in the number of people
with internet access and the increase in the range of transactions that can be
accomplished online. People can conduct a greater range of activities in Internet
24
cyberspace, which mainly includes e-mailing, Web surfing, watching movies,
listening to music, chat rooms, online auctions, online shopping, and online banking
(Ren and Kwan, 2008). Among these activities, Doesburg (2005) finds that in New
Zealand, online banking was the most common commercial activity when private
individuals use the Internet.
2.3.4 Internet Familiarity Factor
2.3.4.1 The Concept of Familiarity
Alba and Hutchinson (1987) define familiarity as ―the number of product-related
experiences that have been accumulated by the consumer.‖ Luhmann (1988)
maintains that familiarity is the knowledge people have of a product or service, based
on their experience and previous contacts.
Familiarity, related to experience, has a positive effect on the degree of consumer skill
and favors an increase in the individual trust in one‘s own abilities (Flavián, Guinalíu
and Gurrea, 2006). Alba and Hutchinson (1987) note that an increase in product
familiarity results in an increase in consumers‘ ability to perform product-related tasks
successfully. More specifically, familiarity reduces the cognitive efforts required to
perform the tasks as well as improving consumers‘ ability to analyse information, to
elaborate on given information, and to remember product information (Alba and
25
Hutchinson, 1987).
Familiarity affects consumer decision making and is considered to be a central
construct with which to explain consumer choice processes (Johnson and Russo, 1984;
Punj and Staelin, 1983; Park and Lessig, 1981). Flavián et al. (2006) illustrate that
familiarity has a positive influence on the interest of consumers in a product or a
service and makes the process of decision-making easier for experienced consumers.
Experienced users have a good level of relevant knowledge and a high degree of
attribute processing skill for the decision-making task in the medium (Bettman and
Park, 1980). Park and Lessig (1981) emphasize that a high familiarity decision maker
requires less decision time and is expected to have higher confidence in the choice
than a low familiarity decision maker, owing to the high familiarity decision maker‘s
greater product usage experience and ownership.
2.3.4.2 Familiarity in an Internet Banking Context
In the Internet context, familiarity has been loosely operationalised to mean
experience in using the Internet in general (Mäenpää, Kale, Kuusela and Mesiranta,
2008; Rodgers, Negash and Suk, 2005; Corbitt, Thanasankit and Yi, 2003; Pechtl,
2003; Miyazaki and Fernandez, 2001). Ward and Lee (2000) argue that more
experienced Internet users tend to search less and be more confident when operating
online. Mandel and Johnson (1999) claim that the level of Internet experience has a
26
significant effect on consumers‘ choice and final preferences. Corbitt et al. (2003) find
that there is a positive correlation between consumers‘ web experience and
e-commerce participation.
Within Internet banking, Internet familiarity is important in understanding consumers‘
perceptions, attitudes and behavior in an online banking environment (Polasik and
Wisniewski, 2009; Mäenpää et al., 2008; Lassar, Manolis and Lassar, 2005; Lee,
Kwon and Schumann, 2005; Lee and Lee, 2001;). Lee and Lee (2001) emphasize that
consumers‘ Internet familiarity improves the ability to use Web browsers
appropriately and increases the confidence in using Internet banking technology.
Internet familiarity can be measured by level of skills on the Internet, level of Internet
comfort, experience in purchasing on the Internet (Lassar et al., 2005; Park and Stoel,
2005; Lee and Lee, 2001); the length of time that the consumer has been using the
Internet (Polasik and Wisniewski, 2009; Lassar et al., 2005; Pechtl, 2003; Novak,
Hoffman and Yung, 2000), and the intensity of Internet use in a certain period (Lassar
et al., 2005).
2.3.5 Marketing Communications Factor
Marketing communication is the process of effectively communicating product
(service) information or ideas to target audiences (Burnett and Moriarty, 1998). In a
general sense, marketing communication is used to inform customers about services
27
provided by an organisation, to persuade customers that a specific service product
offers the best solution to a customer‘s needs, to remind customers of service product
availability, and to motivate customers to act (Lovelock, Patterson and Walker, 1998).
The primary task of marketing communications is to ensure that prospective
customers accurately perceive the services that are important to them and to influence
customers‘ purchase decisions (Lovelock et al., 1998).
Marketing communications have various types of strategic forms and different forms
have different capabilities, which result in different marketing exposure and consumer
reactions (Burnett and Moriarty, 1998; Rossiter and Percy, 1987). A marketing
communication strategy has been identified as a factor in the success of new
consumer financial services (Easingwood and Storey, 1991).
In a banking context, the most widely applied forms of marketing communications are
advertising and personal selling (Laskey, Seaton and Nicholls, 1992; Berry and
Tantaka, 1990).
2.3.5.1 Advertising
Advertising is defined as ―any paid form of nonpersonal presentation and the
promotion of ideas, goods, or services by an identified sponsor‖ (Mill, 2007, p. 83).
Advertising may come in the form of mass media such as television, newspaper, radio,
28
magazines, yellow pages and the Internet (Mill, 2007).
In a service context, advertising is most commonly used to create awareness and
stimulate interest in the service offered, to educate customers about service features
and applications, to establish or redefine a competitive position, and to help make
services more tangible (Lovelok et al., 1998).
Within bank marketing, banks are emphasizing advertising in order to carry their
message to current and potential customers (Laskey et al., 1992). Effective bank
advertising can influence consumers‘ attitudes toward the bank and bank services,
which in turn, affect the intention to purchase (Page and Luding, 2003; Laskey et al.,
1992).
2.3.5.2 Personal Selling
Personal selling is the face-to-face interpersonal communication by a representative
from the firm to make sales and build customer relationships (Burnett and Moriarty,
1998). Examples include the in-store assistance of a sales clerk (retail selling) or a
sales call at home (door-to-door selling) (Burnett and Moriarty, 1998).
Personal selling is considered to be the backbone of communication in services
marketing (Kasper, Helsdingen and Vries, 1999). The benefit of personal selling is
29
that the salesperson is in an excellent position to encourage the customer to act. The
one-on-one interaction of personal selling means that a salesperson can effectively
respond to and overcome objections (customers‘ concerns or reservations about the
service product) so that the customer is more likely to buy (Burnett and Moriarty,
1998). In addition, the personal touch can provide security, confidence and credibility
to customers in services and it has a strong probability of leading to a sale (Kasper et
al., 1999).
In a banking context, personal selling has come to the forefront as newer services are
becoming more complex than straight-forward checking and saving (Berry and
Kantaka, 1990). The customer-banker interactions that personal selling offers answer
customers‘ questions immediately, gives more explanations about the service products,
and provides persuasion and reassurance to customers in making purchase decisions
(Howcroft, Hewer and Durkin, 2003; Berry and Kantaka, 1990).
2.3.6 Word-of-Mouth Factor
Word-of-Mouth (WOM) refers to informal communication between consumers about
products and services (Neal, Quester and Hawkins, 2004). Schiffman and Kanuk
(1997) stated that WOM implies face to face communication. WOM can take place in
a telephone conversation or within the context of a chat group on the Internet.
However, none of the consumers involved in WOM represent a commercial selling
30
source that would gain directly from the sale (Schiffman and Kanuk, 1997). The main
bases for WOM networks are friends, family and colleagues (Bruyn and Lilien, 2008;
Arndt, 1967).
WOM carries particular weight not only as a key information source for consumers,
but also as a method of influencing the consumer‘s attitude and behaviour (Kasper et
al., 1999). The importance of WOM resides in the fact that consumers‘ choice and
purchase decision are usually effected by WOM, especially when the purchase is in a
services context (Lovelok et al., 1998; Bayus 1985; Lutz and Reilly, 1973). Thus, the
WOM process offers special solutions to the ―problem‖ of intangibility of services
and WOM can help to overcome a service‘s problem of credibility (Bayus 1985).
Consumers can obtain information vicariously about experience qualities by asking
acquaintances about the services. In addition, WOM is perceived to be more reliable
and less biased than other communication sources (Lovelok et al., 1998). Positive
WOM has been found to decrease customers‘ perception of risk and increase their
intention to buy a service (File and Prince, 1992). Negative WOM can be extremely
detrimental to a company‘s service offerings and is similarly well-established as a
significant deterrent to consumer purchase intent. (Lovelock et al., 1998; File and
Prince, 1992; Bolfing, 1989).
31
In a banking context, Owusu-Frimpong (1999) argues that WOM is an effective
marketing communication that informs customers about bank services. Likewise, File
and Prince (1992) indicate that WOM is an important construct in the information
search processes of consumers selecting financial services. The author also suggests
that positive WOM is weighed heavily in the buyer behaviour stages leading up to a
decision to purchase financial services.
2.3.7 Perceived Risks Factor
2.3.7.1 The Concept of Perceived Risk
Perceived risk refers to ―the nature and amount of risk perceived by a consumer in
contemplating a particular purchase decision‖ (Cox and Rich, 1967). The amount of
risk involved in any behavioral act is a function of two factors: the amount that would
be lost if the consequences of the act are not favorable and the individual‘s subjective
feeling or degree of certainty that the consequences will be unfavorable (Cox, 1967).
According to Bauer (1967), the concept of risk is organized around the idea that
consumer behavior involves risk in the sense that any action of a consumer will
produce consequences that they cannot anticipate with anything approaching certainty,
some of which is likely to be unpleasant. Cox (1967) states that the concept of risk
can be best understood when the consumer is viewed as having a set of buying goals
32
associated with each purchase. To the extent that the consumer realizes that all the
buying goals are not attained, risk is perceived (Cox, 1967). Kogan and Wallach (1964)
suggest that the concept of perceived risk consists of a chance (or probability) aspect
and a danger (or the severity of negative consequences) aspect. Cunningham (1967)
conceptualizes perceived risk in terms of two components: uncertainty involved in a
purchase, and the consequences of taking an unfavorable action.
Perceived risk is powerful in explaining a consumer‘s behavior because consumers
are more often motivated to avoid mistakes than to maximize utility in purchasing
(Mitchell, 1999). Risk is often present in a choice situation as consumers cannot
always be certain that a planned purchase will achieve satisfactory goals. The
uncertainty may result from factors inherent in the product, the place of purchase and
the mode of purchase (Cox and Rich, 1967).
2.3.7.2 Perceived Risks and Service Sector
Consumers perceive greater risks when purchasing services other than goods, because
services are intangible, non-standardized, and often sold without guarantees or
warranties (Murray and Schlacter, 1990; Zeithaml, 1981). Consumers can rarely
return a service to the service provider once the service has been consumed, and in
particular, some services are so technical or specialized that consumers possess
neither the knowledge nor the experience to evaluate them, even after having
33
consumed the service (Zeithaml, 1981).
Uncertainties associated with the purchase of services and the possibility of service
failure result in a very high degree of risk in the services purchase situation. Some
degree of perceived risk probably accompanies all purchase transactions and
consequently, perceived risk is an important factor in explaining how consumers
purchase services (Guseman, 1981; Zeithami, 1981 cited in Weng, 2005).
2.3.7.3 Types of Perceived Risks
Perceived risk is generally regarded as being a composite of several categories of risk.
Six types or components of perceived risk have been identified: financial,
performance, psychological, physical, social, and time (Jacoby and Kaplan, 1972;
Roselius, 1971).
1. Financial risk- the service outcome will cause the consumer monetary loss.
2. Performance risk- the service will not perform as well as consumers anticipates.
3. Psychological risk- consumers suffer mental stress and a lower self-image.
4. Physical risk- a service is harmful to consumers‘ health and the purchasers will
receive physical injury.
5. Social risk- social ostracism and fear of being seen in a negative light by others.
6. Time risk- consumers will lose too much time because of a bad purchase.
(Source: Laukkanen, Manolis and Laukkanen, 2009; Lee, 2009; Weng, 2005; Lim,
34
2003)
2.3.7.4 Perceived Risks in Internet Banking
The dimensions of perceived risk may vary according to the service (product) class
(Featherman and Pavlou, 2003). Lee (2009) argues that Internet banking does not
incur any threat to human life; therefore, physical risk should not be necessarily
measured. Littler and Melanthiou (2006) add security risk in the case of Internet
banking. Therefore, the following six types of perceived risk in Internet banking have
been identified:
1. Security/privacy risk: Refers to security/privacy threats whereby a fraud or a hacker
may get unauthorized access to the online bank user‘s account and fraudulently
acquire sensitive information, such as usernames, passwords and credit card details.
Both fraud and hacker intrusion can lead to potential monetary loss and violate users‘
privacy (Lee, 2009; Littler and Melanthiou, 2006).
2. Financial risk: Represents the possibility of monetary loss due to transaction error
or bank account misuse (Lee, 2009). The consumer may perceive that if mistakes are
made, reversing a transaction or a refund may not be possible.
3. Performance risk: Refers to an unexpected breakdown of system servers or
disconnection from the Internet while conducting online transactions and the
consumer may not be certain whether the transactions are performed or not (Lee,
2009).
35
4. Psychological risk: Occurs when something goes wrong with Internet banking
transactions and consumers are likely to feel frustrated or annoyed, and their self
image may be adversely affected by the adoption of Internet banking (Littler and
Melanthiou, 2006) .
5. Social risk: Refers to the possibility that using Internet banking may result in the
disapproval of one‘s family, friends or work group. Consumers who are not adopting
Internet banking may have negative or positive opinions depending on how Internet
banking is viewed by other people (Lee, 2009).
6. Time risk: Related to the significant length of time involved in learning and using
Internet banking (Lee, 2009). Time risk is also related to the time involved in dealing
with erroneous transactions or the failure to effect transactions expeditiously (Litter
and Melanthiou, 2006).
2.3.8 Price Factor
2.3.8.1 Definitions of Price
Zeithaml (1998) maintains that from a customer‘s cognitive conception, price is
something that must be given up or sacrificed to obtain certain kinds of products or
services. An overall perceived price is a combination of monetary price and
non-monetary price (Chen, Gupta and Rom, 1994).
36
In the context of banking, price has additional components. Banks not only charge
fees for the services, but also impose interest charges on loans and pay interest on
certain types of accounts, thus price has a wider meaning in the banking industry
(Gerrard and Cunningham, 2003).
2.3.8.2 The Importance of Price
Rothwell and Gardiner (1984) observe that the price factor is one of the fundamental
sets of factors defining user needs. In situations of choice, Engel, Blackwell and
Miniard (1995) argue that price is a cue used by consumers to select an alternative and
a consumer‘s choice relies heavily on the price of alternatives. Colgate and Hedge
(2001) identify price as having the most impact on customer switching in the banking
industry. Howard (1977) gives importance to the price factor in the adoption and
diffusion of innovation. Javalgi, Armaco and Hoseini (1989) find that price emerged
as one of the most important factors in customers‘ bank selection.
Rayport and Sviokla (1994) emphasize the pricing aspect in the electronic distribution
of goods and services. The Wallis Report (1997) notes that for consumers to use
technologies, the price to use them has to be reasonable compared to alternatives.
Sathye (1999) argues that, in the context of Internet banking, two kinds of price are
involved: the normal cost associated with internet activities, and the bank cost and
charges.
37
2.3.9 Demographic Characteristics
Demographic variables have been used as a basis for understanding consumer
characteristics for a considerable time (Lewis, 1981; Block and Roering, 1976). In this
sense, demographics are used as a proxy for the way consumers will behave
(Blackwell, D‘Souza, Taghian, Miniard and Engel, 2006). Kotler (1982) classifies
demographic characteristics as age, sex, income, occupation, education, race, religion,
nationality, family size, and family life cycle.
The popularity of using demographic factors is attributable to the observed
relationship between the consumption of certain products and certain demographic
factors (Block and Roering, 1976). Demographic information can be also used to
guide new product development, product repositioning, brand extension, distribution
strategies or media and creative appeals in communications programs (Blackwell et
al., 2006). In addition, demographic trends can be used to predict changes in demand
for, and consumption of, specific products and services by monitoring the population
groups which will be growing in the future (Blackwell et al., 2006).
38
Chapter 3 Model and Hypotheses
3.1 Introduction
This chapter discusses the conceptual gaps identified in the literature review presented
in Chapter Two. A conceptual model of the Internet banking choice factors is
presented and the eighteen hypotheses that are proposed for this study are discussed.
The hypotheses address the following three research objectives:
(3) To identify the factors that affect bank customers‘ adoption of Internet banking in
New Zealand.
(4) To determine the most important factors that affect bank customers‘ adoption of
Internet banking in New Zealand.
(4) To examine the impacts of demographic characteristics on bank customers‘
adoption of Internet banking in New Zealand.
3.2 Conceptual Gaps
The literature review has identified three research gaps in customers‘ adoption of
Internet banking in the New Zealand banking industry. These are:
(1) Limited published research on the factors influencing customers‘ adoption of
Internet banking in the New Zealand banking industry.
(2) Limited published research in academic marketing journals focusing on customers‘
adoption of Internet banking in the New Zealand banking industry.
39
(3) Limited empirical research on customers‘ adoption of Internet banking in the New
Zealand banking industry.
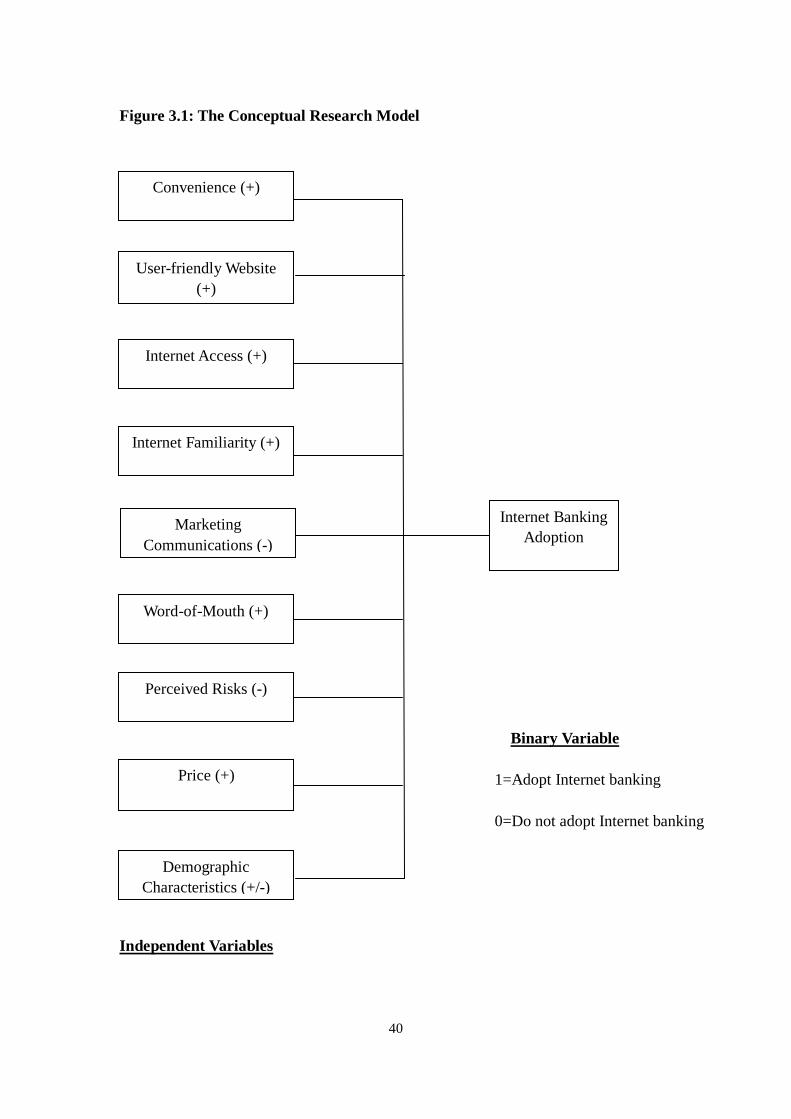
3.3 The Conceptual Research Model
The conceptual research model (see Figure 3.1) developed in this study was based on
the review of the literature in Chapter Two and the focus group discussions (see
Section 4.5.1). The research model suggests that consumers make a decision on the
adoption of Internet banking based on nine factors: Convenience, User-friendly
Website, Internet Access, Internet Familiarity, Marketing Communications,
Word-of-Mouth, Perceived Risks, Price and Demographic Characteristics (gender, age,
marital status, qualification, occupation and household income).
40
Figure 3.1: The Conceptual Research Model
Binary Variable
1=Adopt Internet banking
0=Do not adopt Internet banking
Independent Variables
Convenience (+)
Price (+)
User-friendly Website
(+)
Internet Access (+)
Internet Familiarity (+)
Marketing
Communications (-)
Word-of-Mouth (+)
Perceived Risks (-)
Demographic
Characteristics (+/-)
Internet Banking
Adoption
41
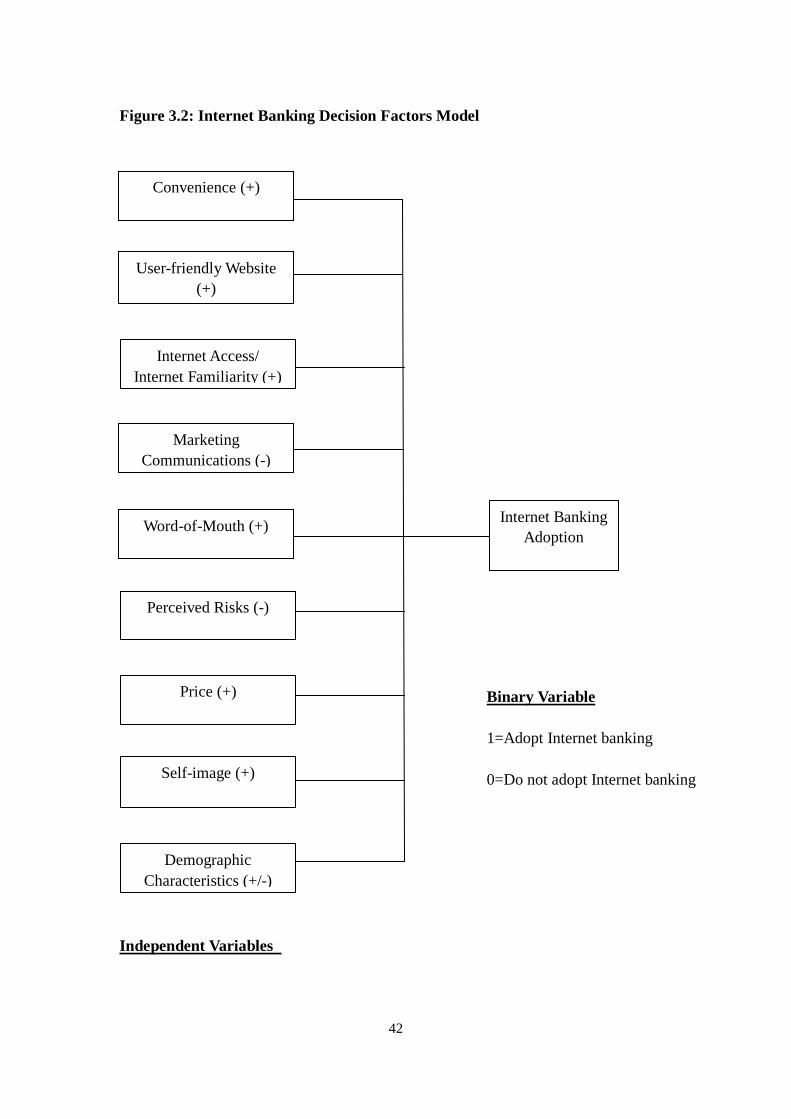
3.4 Research Model Based on the Factor Analysis
Due to the exploratory nature of this study, an exploratory factor analysis was
performed (see Section 5.4.1) to obtain a reliable factor structure. After conducting
factor analysis, Internet Access and Internet Familiarity combined into one factor, and
an additional factor named Self-Image was derived. Therefore, the nine decision
factors in this study were derived from the literature review, focus group discussions,
factor analysis and logistic regression. Moreover, the nine factors were identified to
improve the research model and develop the hypotheses used in this study. The Nine
factors are: Convenience, User-friendly Website, Internet Access/Internet Familiarity,
Marketing Communications, Word-of-Mouth, Perceived Risks, Price, and Self-image.
Furthermore, the demographic characteristics: gender, age, marital status,
qualification, occupation and household income, are retained in the model. The final
version of the research model is presented in Figure 3.2.
42
Figure 3.2: Internet Banking Decision Factors Model
Binary Variable
1=Adopt Internet banking
0=Do not adopt Internet banking
Independent Variables
Convenience (+)
Self-image (+)
User-friendly Website
(+)
Internet Access/
Internet Familiarity (+)
Marketing
Communications (-)
Word-of-Mouth (+)
Perceived Risks (-)
Price (+)
Demographic
Characteristics (+/-)
Internet Banking
Adoption
43
3.5 Hypothesis Development
The hypotheses developed for this study were based on the factor structure derived
from the exploratory factor analysis. Eighteen hypotheses are established to satisfy the
three research objectives. Hypotheses 1 to 8 address Research Objective One and Two;
and Hypotheses 9 to 18 address Research Objective Three.
3.6 Hypotheses Relating to Objective One and Two
3.6.1 Convenience Factor
A number of studies report that one of the main factors driving people to use Internet
banking is convenience (Padachi et al., 2007; Gerrard and Cunningham, 2003; Bughin,
2001; Polatoglu and Ekin, 2001; Thornton and White, 2001; Mols et al., 1999).
Lichtenstein and Williamson (2006) conclude that in the Australian banking context,
the convenience perception factor in terms of time saved and 24/7 access, has the
most impact on making the decision to bank online. In addition, Sohail and
Shanmugham (2003) report that time savings and the ease of carrying out bank
transactions are the most important aspects of convenience, which in turn, affect the
adoption of Internet banking services.
Liao and Cheung (2002) empirically identify convenience as a significant quality
attribute in the perceived usefulness of Internet banking, which positively influences
44
consumers‘ willingness to use Internet-based e-banking. Lee et al. (2005) find that
consumers perceive convenience to be an important determinant of intention to adopt
the Internet banking services. Likewise, Podder‘s (2005) investigations find that
perceived convenience has a positive effect on a consumer‘s behavioral intention to
adopt Internet banking. Yu and Lo (2007) discover that perceived convenience
significantly influences consumers‘ actual behavior to bank online.
Thus, the following hypothesis is proposed:
H1: There is a positive relationship between perceived convenience and Internet
banking adoption.
3.6.2 User-friendly Website Factor
Usability is one of the main factors considered in the Technology Acceptance Model
(TAM), which analyses users‘ attitudes and the adoption of new technology (Hu, Chau,
Sheng and Tam, 1999; Straub, Limayem and Karahanna-Evaristo, 1995; Davis, 1989).
Shih (2004) applies TAM to predict user acceptance of e-shopping and claims that
website usability determines consumers‘ attitudes toward e-shopping.
Lichtenstein and Williamson (2006) consider that user-friendliness or usability is
closely linked to consumers‘ perceptions of complexity and website design issues. The
authors argue that the complexity of a bank website prevents consumer from pursuing
Internet banking. Moreover, Lee (2009) indicates that slowness to download and
45
difficulty in navigation can negatively influence consumers‘ attitudes to banking
online.
A user-friendly website has features of a quick response time, easy navigation, rich
information content, and responsive interaction with customers (see Chapter Two).
Richness of information and a responsive interaction provision on banking websites
can facilitate consumers‘ acquisition of the details of financial services at the bank,
which also provide support for customer when choosing Internet banking services.
(Lichtenstein and Williamson, 2006; Waite and Harrison, 2004). In addition, Shih
(2004) states that variety in the information content and the quick responses from a
bank website positively influence consumer attitudes towards the use of Internet
banking. Sohail and Shanmugham (2003) show that easy navigation in a bank‘s
website is one of the major variables affecting the adoption of Internet banking.
User-friendliness is related to ‗ease of use‘ (Liao and Cheung, 2002). Padachi et al.
(2007) empirically investigate whether a user-friendly bank site is an important
determinant of ease of use, which affects the adoption of Internet banking services.
Akinci et al. (2004) demonstrate that a user-friendly website is regarded as one of the
important criteria to influences consumers‘ selection and adoption of Internet banking
services. Jaruwachirathankul and Fink (2005) conclude it is essential for banks to
provide a well-designed and user-friendly website to attract potential adopters‘
46
attention.
Hence, the following hypothesis is proposed:
H2: There is a positive relationship between a user-friendly website and Internet
banking adoption.
3.6.3 Internet Access/Internet Familiarity Factor
One factor that determines the level of demand for internet banking services is the
number of people having access to the Internet (Sohail and Shanmugham, 2003). In
New Zealand, the number of internet users was 725,000 in 2001 and doubled to
1,500,000 in 2008. During the same period, the number of Internet banking users
doubled as well from 480,000 to 1,020,000 (Neilsen, 2008; Statistics New Zealand,
2008; Taylor, 2002).
Lichtenstein and Williamson (2006) suggest that missing or inadequate internet
accessibility is a key factor which influences a consumer‘s decision to use an Internet
banking service. The authors find that people with a home internet connection with
limited access hours (for cost-based reasons) use their access time for other purposes
rather than utilizing Internet banking. O‘Connell (1996) identifies that a lack of access
to the Internet is a possible reason for the slow adoption of Internet banking.
Moreover, Karjaluoto et al. (2002) find that a reason that non-users do not adopt
Internet banking is that they do not have access to the Internet.
47
Centeno (2004) indicates that Internet banking is only one of many applications used
by Internet users and there is insufficient incentive for consumers to acquire the
necessary computer and Internet infrastructure just to use this application.
Consequently, it seems that having a pre-existing Internet access, either at home, at
work, at university, or at a Public Internet Access Point is crucial for Internet banking
adoption. In addition, Sathye (1999) empirically investigates the availability of access
to the Internet as a prerequisite for the adoption of Internet banking. Furthermore,
Sohail and Shanmugham (2003) identify Internet access as one of the major factors
affecting the adoption of Internet banking services and discover that the more
widespread the access to the Internet, the greater the possibility of the use of Internet
banking (Sathye, 1999).
Since Internet banking services are delivered through the medium of the Internet,
consumers need to be familiar with computers in general and should be, to some
extent, proficient in the use of web browsers (Lee et al., 2005). Lassar et al. (2005)
note that Internet experience is important in understanding how belief in one‘s
capability to organize and execute Internet banking affects the use of the technology.
As O‘Cass and Fenech (2003) illustrate that accumulated sufficient Internet
experience creates a belief in Internet users‘ ability to use the Internet for commercial
purposes. Polasik and Wisniewski (2009) determine that Internet
familiarity/experience is an important factor that influences customers to adopt
48
Internet banking.
Four variables are suggested to construct the consumers‘ Internet familiarity. The first
variable is level of Internet skills and Internet comfort (Lassar et al., 2005; Lee et al.,
2005; Black et al., 2001). Proficient users of Internet consider accessing Internet
banking services to be less complex and show a great proclivity to use them (Polasik
and Wisniewsk, 2009; Black et al., 2001). The second important variable is online
purchase experience (Park and Stoel, 2005; Lee and Lee, 2001). Dickerson and
Gentry (1983) state that consumers‘ adoption of technology-based products is largely
influenced by their prior experience with similar technologies. Lee et al. (2005)
determine that consumers who have used the service medium of the Internet in the
past, such as online shopping, perceive online banking as compatible. Lee and Lee
(2001) find that consumers with experience purchasing through the Internet feel
comfortable about online financial transactions, and therefore are more likely to adopt
Internet banking. The third variable is the length of Internet use, which was utilized
previously in Polasik and Wisniewsk‘s (2009) study. The authors determine that
individuals who have used Internet for a longer period will be more familiar with the
Internet environment, and are likely to open an online banking account. Furthermore,
Lassar et al. (2005) suggest that the intensity of web usage is an important indicator of
experience, which positively affects Internet banking adoption.
Therefore, the following hypothesis is proposed:
49
H3: There is a positive relationship between the availability of Internet access/Internet
Familiarity and Internet banking adoption.
3.6.4 Marketing Communications Factor
The adoption or rejection of an innovation begins when ―the consumer becomes
aware of the product/service‖ (Rogers and Shoemaker, 1971). Sathye (1999) identifies
lack of awareness as one of the main factors affecting consumers‘ adoption of Internet
banking in Australia. Marketing communications create an opportunity to eliminate
any existing information barriers and stimulate consumers‘ exposure to the benefits of
Internet banking (Polasik and Wisniewski, 2009; Neal et al., 2004).
As discussed in the previous literature review (Section 2.5), the most widely applied
forms of marketing communications in the context of banking are advertising and
personal selling (Laskey et al., 1992; Berry and Dantak, 1990). Polatoglu and Ekin
(2001) note that marketing efforts such as advertising influences Internet banking
acceptance in Turkey. Laukkanen et al. (2009) emphasize the importance of
face-to-face contact and find that interpersonal face-to-face communication provided
by banks can inform consumers of the option of banking having the Internet. Prasad
and Arumbaka (2009) show that most customers in India do not know how to become
an Internet banking user, or how to use the technology due to lack of marketing efforts
on the part of banks. Lichtenstein and Williamson (2006) note that ineffective

50
marketing communication, such as ineffective advertising, television or radio has
eluded the attention of many banking consumers who may be prospective adopters of
Internet banking.
Therefore, the following hypothesis is proposed:
H4: There is a negative relationship between ineffective marketing communications
and Internet banking adoption.
3.6.5 Word-of-Mouth Factor
Word-of-Mouth (WOM) is particularly important in service marketing due to the
heterogeneity of service quality, the higher associated risk, and the intangible nature
of services (Bansal and Voyer, 2000; Ekelund, Mixon and Ressler, 1995; Jolson and
Bushman, 1978). Consumers have been found to rely on WOM to reduce the level of
perceived risk and the uncertainty that is often associated with the service purchase
decision (Murray, 1991). Researchers have demonstrated that WOM plays an
important role in the information diffusion in consumer markets and shaping
consumers‘ attitudes. In addition, researchers identified that personal conversations
and the exchange of information among acquaintances not only affects consumer
expectations (Anderson and Salisbury, 2003; Zeithanml and Bitner, 1996; Herr,
Kardes and Kim, 1991), but also influence consumers‘ choices and purchase decisions
(Arndt, 1967; Whyte and William, 1954).
51
Kim and Prabhaker (2000) suggest that WOM referral is a key antecedent of initial
trust in electronic channel, which has effect on the adoption of Internet banking. In
addition, Yu and Lo (2007) find that the adoption of Internet banking is significantly
influenced by friends, family, colleagues, and/or peers.
Hence, the following hypothesis is proposed:
H5: There is a positive relationship between positive Word-of-Mouth and Internet
banking adoption.
3.6.6 Perceived Risks Factor
The role of perceived risk has been investigated widely in the business area in
understanding a consumer‘s intended and actual purchase behavior (Im, Kim and Han,
2008; Kim, Ferrin and Rao, 2008; Lopez-Nicolas and Molina-Castillo, 2008; Forsythe
and Shi, 2003). In an e-service context, perceived risk regarding the uncertainty of the
value of services, the technological unpredictability of the Internet, and the
impersonal nature of online transactions, reduces the consumer‘s perception of control
over the purchasing process (Featherman and Pavlou, 2003; Pavlou, 2003).
Cooper (1997) identifies risk as an important characteristic of a consumer‘s
perception in the adoption of innovation. In some empirical studies, perceived risk is
identified as having a significant negative and direct effect on consumers‘ adoption of
Internet banking (Lee, 2009; Kuisma, Laukkanen and Hiltunen, 2007; Polatoglu and
52
Ekin; 2001; Tan and Teo, 2000). In addition, the security/privacy risk, as one of main
dimensions of perceived risk, appears to the most inhibiting factor in the adoption of
Internet banking (Lee, 2009; Rotchanakitumnuai and Speece, 2003).
Therefore, the following hypothesis is proposed:
H6: There is a negative relationship between higher perceived risks and Internet
banking adoption.
3.6.7 Price Factor
Liao and Cheung (2002) conduct an empirical study on consumer attitudes toward
Internet-based e-banking and indicate that price and cost imply a constraint on actual
purchases, which must be taken into account in the expectations and perceptions of
the usefulness of Internet e-retail banking.
As transactions on the Internet are either considerably lower priced or without any fee
at all, price incentives have been successfully used by banks to motivate consumers to
use Internet banking (Kerem, 2003). Polatoglu and Ekin (2001) identify that Internet
banking users are significantly satisfied with cost savings through banking on the
Internet. On the other hand, Sathye (1999) argues that the unreasonable cost of
Internet banking activities and bank charges has a negative effect on Internet banking
adoption. Wallis Report (1997) states that for consumers to use new technologies, the
technologies must be reasonably priced relative to the alternative. According to
53
Athanassopuolos and Labroukos (1999) and Karjaluoto, Mattlia and Pento (1999),
price is deemed to be an important criterion for the adoption of Internet banking.
Hence, the following hypothesis is proposed:
H7: There is a positive relationship between low price and Internet banking adoption.
3.6.8 Self-Image Factor
Self-image is the subconscious view on how a person sees themselves in life (The
American Salesman, 1996). Sharp (2002) notes that self-image represents your own
beliefs about your strengths and weaknesses, your own understanding of possibilities
and limitations. Our reactions to life and other people, the way we think, act, respond
and even our abilities, often are determined by subconscious self-image (Sportelli,
2008). People with a good self-image are more willing to take risks and even see
those risks as a means to getting to the next step. On the other hand, people who have
a poor self-image often go through life without using their talent and they also may
live in a restrictive, very cautionary way and take very small and deliberate steps (The
American Salesman, 1996). Sportelli (2008) argues that each of us builds a self-image
by past experiences, successes, failures, accomplishments and disappointments.
In a service context, the attitude or purchase intention towards a service is highly
dependent on the extent to which these services display similarities to the consumer‘s
self-image (Graeff, 1996). Kleijnen, Ruyter and Andreassen (2005) find that
54
self-image has a significant impact on consumer attitudes and the adoption decision
regarding service innovations (mobile services). Globerson and Maggard (1991)
identify that self-image is one of the major factors that affect consumers‘ preferences
for using the self-service technology. Mäenpää et al. (2008) conclude that self-image
is different between low-familiar Internet banking users and highly familiar Internet
banking users. Littler and Melanthiou (2006) argue that a lower self-image is a
potential source of psychological risk which affects consumer behaviour towards
Internet banking services.Therefore, the following hypothesis is proposed:
H8: There is a positive relationship between a high self-image and Internet banking
adoption.
3.7 Hypotheses Relating to Research Objective Three
3.7.1 Demographic Characteristics
Consumers‘ demographic characteristics have been widely used to distinguish the
differences between segments of customers (Kotler, 1982). In terms of assessing
Internet banking, demographic characteristics, such as age, gender, occupation, annual
income, educational qualifications, and marital status may have an effect on the
consumer‘s use of Internet banking (Gan, Clemes, Limsombunchai and Weng, 2006).
Gao and Owolabi (2008) find that female respondents are more likely to adopt

55
Internet banking than males in Nigeria. Deutshce Bank Research (2010) concludes
that women are more like to use online banking than men in Latvia.
Therefore, the following hypothesis is formulated:
H9: There is a positive relationship between females and consumers‘ adoption of
Internet banking.
Polisak and Wisniewski (2009) find that the younger individuals tend to have higher
adoption rates of Internet banking. Kim et al. (2005) demonstrates that consumers
who are younger are more likely to adopt Internet banking. Bauer and Hein (2006)
identify that older consumers are less likely to adopt Internet banking. In addition,
according to Flavián et al. (2006), younger people are most likely to carry out
transactions via the Internet and alternatively, older people are less likely to use online
banking. Therefore, the following relationships are hypothesized:
H10: There is a positive relationship between younger age and consumers‘ adoption of
Internet banking.
H11: There is a negative relationship between older age and consumers‘ adoption of
Internet banking.
Mattila, Kajaluoto and Pento (2003) identify that married consumers are more likely
to use Internet banking than unmarried or widowed ones. Wan et al. (2005) find that
the adoption of Internet banking is higher in the higher-level occupations, such as
56
managerial and professional, than lower-level occupations, such as labouring. Stavins
(2001) identifies white-collar and married consumers are more likely to adopt Internet
banking. Therefore, the following hypotheses are proposed:
H12: There is a positive relationship between marital status and consumers‘ adoption
of Internet banking.
H13: There is a positive relationship between higher-level occupations and consumers‘
adoption of Internet banking.
Wan et al. (2005) suggest that educational level is associated with the adoption of
Internet banking. Polatoglu and Ekin (2001) points out that highly educated
consumers are more likely to accept Internet banking. Yiu et al. (2007) find that
consumers with a Bachelor‘s degree or above have a much higher Internet banking
adoption rate than those people less qualified. Polasik and Wisniewski (2009) find that
lack of formal education hinder Internet banking adoption. In addition, Gerrard et al.
(2006) identify that less-educated people are less likely to use Internet banking.
Therefore, the following relationships are hypothesized:
H14: There is a positive relationship between a higher educational level and
consumers‘ adoption of Internet banking.
H15: There is a negative relationship between a lower educational level and
consumers‘ adoption of Internet banking.
In terms of consumers‘ income level in Internet banking, Lassar et al. (2005) establish
57
that income is the only demographic variable to significantly affect the adoption of
Internet banking. Wan et al. (2005) find that income positively influences the adoption
of Internet banking. Padachi et al. (2007) find that higher income people are more
likely to use online banking. Flavián et al. (2006) conclude that lower income people
are less likely to conduct banking operations on Internet.
Therefore, the following hypotheses are proposed:
H16: There is a positive relationship between higher incomes and consumers‘
adoption of Internet banking.
H17: There is a negative relationship between lower incomes and consumers‘
adoption of Internet banking.
H18: There are some different perceptions of the Internet banking adoption factors
within demographic groups.
3.8 Chapter Summary
This chapter identified three research gaps in the literature pertaining to customers‘
adoption of Internet banking. The conceptual research model and a research model
based on the factor analysis were presented, along with eighteen testable hypotheses.
58
Chapter 4 Research Methodology
4.1 Introduction
This chapter outlines the research plan and methods used to test the fourteen
hypothesizes developed in Section 3.3, and to answer the three objectives stated in
Section 3.1. The research plan includes research design, discussion of the sampling
method, sample size, data collection method, and questionnaire development. Finally,
the data analysis techniques (factor analysis and logistic regression analysis) used in
this study are discussed.
4.2 Research Design
Bank customers in Christchurch were chosen as the sample to examine the factors
affecting their decision between Internet banking. Focus group interviews were used
to develop a suitable survey questionnaire. Due to the geographic dispersion of the
sample, the large target sample size required, and time and monetary constraints, a
mail survey was used to collect data. A pre-test of the questionnaire was conducted
before the questionnaire was mailed to the sample respondents.
4.3 Sampling method
The data was collected using a mail survey of Christchurch residents. The data was
collected from respondents 18 years and older. A systematic random sampling method
59
was applied in this research. The systematic random sampling procedure represents a
true probability method, as every sampling unit has an equal chance of being chosen
for the sample (Sekaran, 2003). In addition, systematic random sampling is often
recommended for consumer attitude surveys and consumer behaviour surveys
(Sekaran, 2003; Cavana, Delahaye and Sekaran, 2001) as the method is suitable when
the population frame is large (Sekaran, 2003). The sample used in this survey was
drawn from the 2009/2010 Christchurch Telecom White Pages.
4.4 Sample Size
Sample size is considered an important factor in order to make generalizations with
confidence about the constructs under investigation. Therefore, the sample size should
provide reliable estimates and reflect the population parameters as closely as possible
with a narrow margin of error (Sekaran, 2003). This research targeted bank customers
in Christchurch. According to the 2006 New Zealand census, the population of
Christchurch was 348,435. Based on Mendenhall, Reinmuth and Beaver (1993)
formula, the sample size required to achieve a 95% level of confidence was estimated
at 3841. The expected response rate is 25 percent, thus 1500 survey questionnaires
were mailed out.
1 Sample Size Formula: finite population without replacement:
2
/2
2 2
/2( 1)
NZ pqn
N e Z pq
60
4.5 Questionnaire development
The lack of published research relating to Internet banking adoption factors in New
Zealand make it is necessary to collect primary data to test the 14 hypotheses and to
answer the research objectives of this study. As this research is exploratory, a
thorough review of the literature and focus group discussions were used to help
identify the factors that consumers consider important when deciding to adopt Internet
banking services. Initially, the factors derived from the literature review and feedback
from the focus groups were used to assist in developing the questionnaire.
4.5.1 Focus Group Interviews
The literature review presented in Chapter Two identified the potential primary factors
influencing customers‘ choice of Internet banking in the New Zealand banking
industry. However, in order to develop additional insights into the factors affecting
customer‘s adoption of Internet banking and to help develop a suitable survey
questionnaire, it was necessary to conduct focus group interviews.
Focus group research has been used to ―review consumers‘ hidden needs, wants,
attitudes, feelings, behaviours, perceptions, and motives regarding services, products,
or practices‖ (Hair, Bush and Ortinau, 2003, p.223). In addition, Greenhaum (1998)
suggests that the focus group interview is the most popular method for attitude
research. Integrating focus group interviews with quantitative methods such as
61
questionnaire surveys is critical for developing and creating reliable measurement
scales (Hair et al., 2010). Morgan (1998) states that focus group interviews enable
researchers to not only facilitate questionnaire design, but also to help researchers to
refine wordings on particular questions.
Greenhaum (1998) recommends using four to six participants in conducting a focus
group interview. Two focus groups (each consisting of six participants) were
conducted for this study. Participants were asked to explain the factors that influenced
them to adopt Internet banking. Participates were also asked to identify the factors
that they considered to be the most influential in their decision to adopt Internet
banking. In addition, participants were encouraged to list any additional factors that
influenced their decision to bank online. Focus group members also suggested some
additional factors to include in the analysis.
The information gathered from the focus group interviews were recorded and
transcribed, and along with the findings from the literature review were used to help
develop the survey questionnaire.
4.5.2 Questionnaire Format
The questionnaire consists of four sections. Section One is designed to identify which
group the customer belongs to: Internet banking user, or non-Internet banking user.
62
Section Two addresses questions relating to the factors that may influence bank
customers‘ decisions to adopt Internet banking. Section Three addresses questions
relating to the factors that may influence consumers‘ decisions to not adopt Internet
banking. The last section captures customers‘ demographic information, such as
gender, age, marital status, qualification, occupation, and income (see Appendix B,
page 181).
In order to improve the reliability of the constructs, a multiple-item measurement
scale was used (Churchill, 1979). A seven-point Likert scale is the optimum size
compared to five and ten point scales (Schall, 2003). Therefore, a seven-point
weighted Likert scale was used to measure all the items in Section Two and Section
Three of the questionnaire, where 1=‖Strongly Disagree‖ to 7=‖Strongly Agree‖.
4.5.3 Pre-testing Procedures
A pre-test is necessary to assess the reliability and validity of a questionnaire. In the
pre-test procedure, a random sample of 30 bank customers aged 18 years and over
was drawn to clarify the questions and statements in the questionnaire. The
respondents were asked to make comments on any ambiguous or unclear questions.
Some minor wording modifications to the survey questionnaire were made as a result
of this process. The final version of the questionnaire is in Appendix 2.
63
4.6 Data Collect Procedures
In this research, a survey questionnaire was used to collect the data. The data
collection procedures followed the guidelines set out by Dillman (2007). The survey
includes a cover letter, a copy of the questionnaire and a prepaid reply envelope.
Based on a random sample chose from the New Zealand White Pages-Christchurch
(2009), 1500 questionnaires were sent to potential respondents.
4.7 Data Analysis Techniques
For Objective One, exploratory factor analysis was used to determine the factors that
contributed to Internet banking adoption. Subsequently, a logit regression analysis
was used to identify the factors that influence customers to adopt Internet banking.
Sensitivity analysis was used to answer Research Objective Two. Marginal effect
analysis ranks the factors that cause consumers to adopt Internet banking from the
most important to the least important. T-tests and one-way ANOVA were applied to
answer Research Objective Three.
4.7.1 Factor Analysis
Factor analysis is a multivariate statistical method whose primary purpose is to define
the underlying structure among the variables in the analysis (Hair, Black, Babin and
Anderson, 2010). Factor analysis is an interdependence technique in which all
variables are simultaneously considered (Hair et al., 2010). ―The general purpose of
64
factor analysis is to find a way to summarize the information contained in a number of
original variables into a smaller set of new, composite dimensions or factors with a
minimum loss of information-that is, to search for and define the fundamental
constructs or dimensions assumed to underlie the original variables‖ (Hair et al., 2010,
p. 96). Stewart (1981) summarises three functions of factor analysis: (1) minimizing
the number of variables while the amount of information in the analysis is maximized;
(2) searching qualitative and quantitative data distinctions when the data is too large;
and (3) testing hypotheses about the number of distinctions or factors underlying a set
of data. Factor analysis as used in this research to answer two objectives: one is to
identify underlying structure in the data and two is to reduce number of variables into
a more manageable set (Hair et al., 2010).
The following sections explain the different types of factor analysis, the assumptions
of factor analysis, and the appropriateness of factoring a correlation matrix, a factor
rotation, and interpretation of resulting factors.
4.7.1.1 Modes of Factor Analysis
There are several modes of factor analysis (see Table 4.1), and all of the modes of
factor analysis provide information about the dimensional structure of data (Stewart,
1981). According to Hair et al. (2010), the selection of the appropriate mode of factor
analysis depends on the research objective. In this study, the objective is to identify
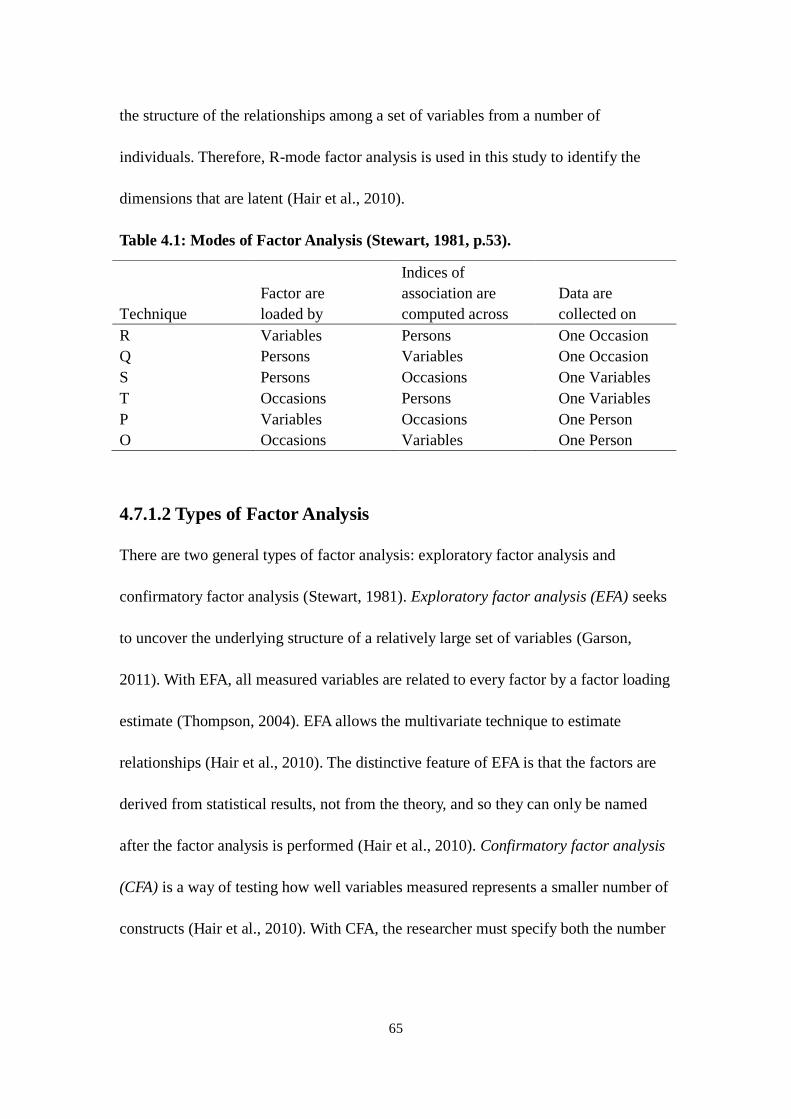
65
the structure of the relationships among a set of variables from a number of
individuals. Therefore, R-mode factor analysis is used in this study to identify the
dimensions that are latent (Hair et al., 2010).
Table 4.1: Modes of Factor Analysis (Stewart, 1981, p.53).
Technique
Factor are
loaded by
Indices of
association are
computed across
Data are
collected on
R Variables Persons One Occasion
Q Persons Variables One Occasion
S Persons Occasions One Variables
T Occasions Persons One Variables
P Variables Occasions One Person
O Occasions Variables One Person
4.7.1.2 Types of Factor Analysis
There are two general types of factor analysis: exploratory factor analysis and
confirmatory factor analysis (Stewart, 1981). Exploratory factor analysis (EFA) seeks
to uncover the underlying structure of a relatively large set of variables (Garson,
2011). With EFA, all measured variables are related to every factor by a factor loading
estimate (Thompson, 2004). EFA allows the multivariate technique to estimate
relationships (Hair et al., 2010). The distinctive feature of EFA is that the factors are
derived from statistical results, not from the theory, and so they can only be named
after the factor analysis is performed (Hair et al., 2010). Confirmatory factor analysis
(CFA) is a way of testing how well variables measured represents a smaller number of
constructs (Hair et al., 2010). With CFA, the researcher must specify both the number
66
of factors that exist within a set of variables and which factor each variable will load
highly on before the results can be computed (Hair et al., 2010). CFA seeks to test
hypothesis about the structure of a data set that has been formed by prior research
(Stewart, 1981). Hence, EFA was used in this study as the decision factors that impact
on Internet banking adoption have not been determined in a New Zealand context.
EFA has two widely used models to obtain factor solutions: common factor analysis
and component factor analysis (Hair et al., 2010). The selection of an appropriate
model is based on two criteria: (1) the objectives of the factor analysis and (2) the
amount of prior knowledge about the variance in the variables (Hair et al., 2010).
Common factor analysis is used primarily to recover the underlying factors in the
original variables. In contrast, component factor analysis is used when the objective is
summarizing information (variance) in a large set of variables into a minimum
number of factors (Aaker, Kumar, Day and Lawley, 2005). Hair et al. (2010) note that
component factor analysis is appropriate when prior knowledge suggests that specific
and error variance presents a relatively small proportion of the total variance. Thus,
component factor analysis is appropriate method for this study.
67
4.7.1.3 Assumptions for Factor Analysis
Hair et al. (2010) identified several critical conceptual and statistical assumptions for
factor analysis. These assumptions are:
No Selection Bias/Proper Specification. Factor analysis is a method of exploring
data whose structure is unknown. The method has no means of determining the
appropriateness of data other than the correlation among variables (Hair et al., 2010).
Garson (2011) indicates that the exclusion of relevant variables and the inclusion of
irrelevant variables in the correlation matrix being factored will substantially affect
the factors that are uncovered. Therefore, researchers must ensure that the observed
patterns are conceptually valid and appropriate for the study when using factor
analysis (Hair et al., 2010).
Linearity. Factor analysis is a linear procedure. If non-linearity is present, the
solution may be problematic (Coakes, Steed and Price, 2008). The smaller the sample
size, the more important it is to screen the data for linearity (Garson, 2011). Therefore,
it is necessary to identify any departures from linearity that may affect the correlations
(Hair et al., 2010).
Normality. This assumption measures whether the differences are normally
distributed between the obtained and predicted dependent variable scores (Stewart,
68
1981). Any significantly large variation from the normal distribution will cause
invalid tests (Hair et al., 2010).
Homoscedasticity. Factor analysis assumes homoscedasticity that diminishes the
observed correlations (Hair et al., 2010).
However, if the data matrix has sufficient correlations to justify the application of
factor analysis, the statistical assumptions of linearity, normality, and homosedasticity
do not have to be met (Hair et al., 2010). The methods to justify sufficient correlations
for factor analysis are discussed in the following section.
4.7.1.4 Test for Determining Appropriateness of Factor Analysis
Hair et al. (2010) suggested that there are several methods to determine whether the
correlations in the data matrix are sufficient for factor analysis. The following
methods were applied to the data in this study to ensure the data was appropriate for
exploratory factor analysis.
(i) Examination of the Correlation Matrix.
Examination of the correlation matrix is one of the simplest procedures of
determining the appropriateness of factor analysis. As factor analysis is
concerned with the homogeneity of items, a pattern of low correlations
indicates a heterogeneous set of items which may suggest the factoring is
69
inappropriate (Stewart, 1981). Factor analysis is appropriate if visual
inspection of the correlation matrix reveals a substantial number of
correlations greater than 0.30 (Hair et al., 2010).
(i) Inspection of the Anti-Image Correlation Matrix
The anti-image correlation matrix represents the negative value of the partial
correlations (Hair, et al., 2010). If the anti-image matrix does have many
nonzero off-diagonal entries, the correlation matrix is not appropriate for
factoring. The inverse of the correlation matrix should be near diagonal if the
matrix is appropriate for factoring (Stewart, 1981).
(ii) Bartlett’s Test of Sphericity
Bartlett‘s test of Sphericity provides the statistical probability that the
correlation matrix has significant correlations among the variables (Hair et al.,
2010). The hypothesis tested is that the correlation matrix came from a
population of variables that are independent. Rejection of the hypothesis is an
indication that the data are appropriate for factor analysis (Stewart, 1981).
(iii) Kaiser-Meyer-Olkin Measure of Sampling Adequacy (MSA)
MSA is used to measure the extent to which variables belong together (Stewart,
1981). The index ranges from 0 to 1, equal1 when each variable is perfectly
70
predicted without error by the other variables (Hair et al., 2010). Kaiser and
Rice (1974) give the different levels of MAS: 0.90+ (marvelours), 0.80+
(meritorious), 0.70+ (middling), 0.60+ (mediocre), 0.50+ (miserable), and
below 0.50 (unacceptable).
4.7.1.5 Factor Extraction in Principal Components Analysis
For a large set of variables, factor extraction starts by extracting the combinations of
variables that explain the greatest amount of variance (Hair, et al., 2010). There are
two commonly used criteria to determine the number of factors to extract, which are:
(1) latent root criterion, and (2) scree plot (Stewart, 1981).
Latent Root Criterion
The latent root criterion is the most commonly used technique (Aaker et al., 2005).
The rationale for the latent root criterion is that any individual factor should account
for the variance of at least a single variable if it is to be retained for interpretation.
With factor analysis each factor contributes a value of 1 to the total eigenvalue
(Stewart, 1981). Thus, only the factors having latent roots or eigenvalues greater than
1 are considered significant; all factors with latent roots less than 1 are considered
insignificant and are disregarded (Stewart, 1981). This technique is most reliable if
the number of variables in the factor analysis is between 20 and 50 (Hair et al., 2010).
71
Scree Test Criterion
The scree test is derived by plotting the latent roots against the number of factors in
their order of extraction, and the shape of the resulting curve is used to evaluate the
cutoff point (Hari et al., 2010). Stewart (1981, p. 58) explains the procedure:
―A straight edge is laid across the bottom portion of the roots to see where they
form an approximately straight line. The point where the factors curve above the
straight line gives the number of factors, the last factor being the one whose
eigenvalue immediately precedes the straight line.‖
4.7.1.6 Factor Rotation
Factor loadings are the correlation coefficients between the variables and factors.
Factor loadings are normally used to interpret the role each variable plays in defining
each factor (Aaker et al., 2005). Loadings indicate the degree of correspondence
between the variables and the factors (Hair et al., 2010). Factor rotation simplifies the
factor structure and maximizes a variable‘s loading on a single factor, thus improving
interpretation. Two commonly used factor rotation methods are the orthogonal factor
rotation and the oblique factor rotation (Brown, 2006).
Orthogonal Factor Rotation
Orthogonal factor rotation is the simplest case of rotation, in which the factor axes are
maintained at 90 degrees which means the factors are not correlated (Hair et al., 2010).
72
There are three major orthogonal methods: VARIMAX, QUARTIMAX and
EQUIMAX.
The VARIMAX method maximizes the sum of variances of required loadings of the
factor matrix (Hair et al., 2010). Each factor tends to have either large or small
loadings of any particular variable (Garson, 2011). In a VARIMAX rotational
approach, when the loadings are close to +1 or -1, it indicates a clear positive or
negative association between the variable and the factor; and when the loading is
close to 0, it indicates a lack of association (Hair et al., 2010). The VARIMAX method
has proved successful as an analytic approach to obtaining an orthogonal rotation of
factors (Hair et al., 2010).
The QUARTIMAX rotation attempts to maximize the spread of factor loadings for a
variable across all factors. Consequently, a variable loads highly onto a single factor
(Field, 2000). The QUARTIMAX method has not proved especially successful in
producing simpler structures (Hair et al., 2010).
The EQUIMAX method is a compromise between the VARIMAX and QUARTIMAX
methods. EQUIMAX tries to accomplish some simplification of factors and variables.
However, EQUIMAX has not gained wide-spread acceptance and is used infrequently
(Hair et al., 2010).
73
Oblique Factor Rotation
Oblique rotations are similar to orthogonal rotations, except that oblique rotations do
not require the rotation process to keep the factors uncorrelated (Meyers, Gamst and
Guarino, 2006). Oblique solutions have been found particularly useful in the theory
building and play a significant role in the development of consumer behavior theory
(Stewart, 1981). Two common methods in oblique factor rotation are OBLIMIN and
PROMAX.
OBLIMIN is a standard method when seeking a non-orthogonal (oblique) solution.
OBLIMIN can produce higher eigenvalues but diminished interpretability of the
factors (Garson, 2011). PROMAS is similar to OBLIMIN but computationally faster
than OBLIMIN and therefore is sometimes used for larger datasets (Garson, 2011).
No specific rules have been developed to guide the researcher in selecting a particular
orthogonal or oblique rotational technique (Hair et al., 2010). Correlated factors and
hierarchical factor solutions are intuitively attractive and theoretically justified in
many marketing applications (Stewart, 1981). Stewart (1981) suggests both an
orthogonal and an oblique rotation should be performed, particularly in exploratory
work. Therefore, in this research, a VARIMAX orthogonal rotation and an OBLIMIN
oblique rotation are applied to the data.
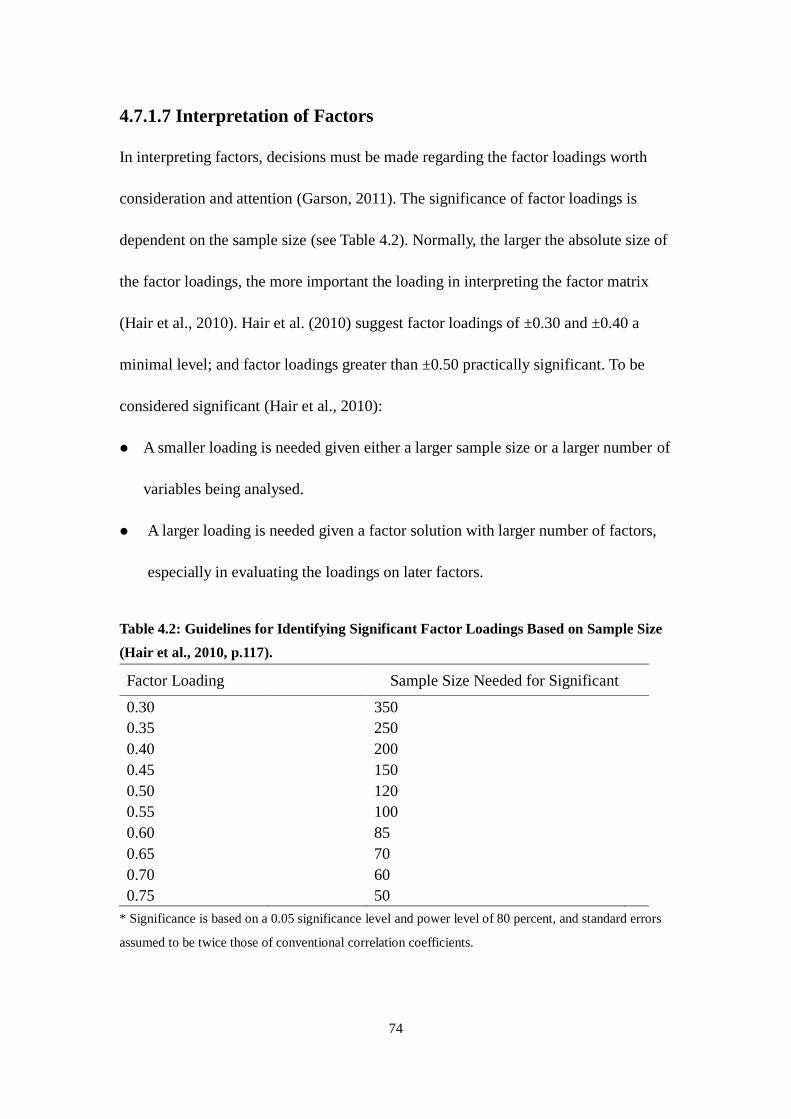
74
4.7.1.7 Interpretation of Factors
In interpreting factors, decisions must be made regarding the factor loadings worth
consideration and attention (Garson, 2011). The significance of factor loadings is
dependent on the sample size (see Table 4.2). Normally, the larger the absolute size of
the factor loadings, the more important the loading in interpreting the factor matrix
(Hair et al., 2010). Hair et al. (2010) suggest factor loadings of ±0.30 and ±0.40 a
minimal level; and factor loadings greater than ±0.50 practically significant. To be
considered significant (Hair et al., 2010):
A smaller loading is needed given either a larger sample size or a larger number of
variables being analysed.
A larger loading is needed given a factor solution with larger number of factors,
especially in evaluating the loadings on later factors.
Table 4.2: Guidelines for Identifying Significant Factor Loadings Based on Sample Size
(Hair et al., 2010, p.117).
Factor Loading Sample Size Needed for Significant
0.30 350
0.35 250
0.40 200
0.45 150
0.50 120
0.55 100
0.60 85
0.65 70
0.70 60
0.75 50
* Significance is based on a 0.05 significance level and power level of 80 percent, and standard errors
assumed to be twice those of conventional correlation coefficients.

75
Most factors solutions do not result in a simple structure solution where there is a
single high loading for each variable loads on only one factor. Hence some variables
may have moderate-size loadings on more than one factor and this is termed
cross-loading. The researcher needs to underline all the significant loadings for a
variable on all the factors. Furthermore, the researcher needs to examine all of the
significant variables for a particular factor, and assign a name or label to a factor that
accurately reflects the variables loading on that factor (Hair et al., 2010).
4.7.2 Summated Scale
A summated scale is formed by combining several individual variables into a single
composite measure. All of the variables loading highly on a factor are combined, and
the total, or more commonly, the average score of the variables is used as a
replacement variable (Hair et al., 2010).
The summated scale reduces measurement error and represents the multiple aspects of
concept in a single measure. However, before forming any a summated scale, the
content validity, dimensionality, and reliability of the measure must be assessed (Hair
et al., 2010).
4.7.2.1 Content Validity
Content validity assesses the correspondence of the variables to be included in a
76
summated scale (Hair et al., 2010). A display of content validity indicates that the
items are adequate and are representative of the concept they are intended to measure
(Churchill, 1979).
4.7.2.2 Dimensionality
Dimensionality is an underlying assumption and essential requirement for creating a
summated scale is that the items are unidimensional and they are strongly associated
with each other and represent a single concept (Hair et al., 2010). The test of
unidimensionality is that each summated scale should consist of items loading on a
single factor (Hair et al., 2010).
4.7.2.3 Reliability
Reliability measures the accuracy, precision and consistency between multiple
measurements of variables (Cooper and Schindler, 2006). A commonly used measure
of reliability is internal consistency, which applies to test whether the individual items
of the scale measuring the same construct and thus be highly intercorrelated (Hair et
al., 2010).
Cronbach‘s Alpha is one of the most widely used measures to test internal consistency
(Churchill, 1979). Churchill (1979) recommends that a Cronbach coefficient alpha
greater than 0.60 is adequate for expressing reliability in exploratory research.
77
4.7.3 Logistic Regression Analysis
4.7.3.1 Qualitative Choice Analysis
A Qualitative choice situation is one in which a decision-maker faces different options
among which one has to be selected (Elleithy, 2008). Qualitative choice analysis is
widely used in describing decision-makers‘ choices in certain areas such as
transportation, energy, housing, telecommunications and banking (Train, 1993). The
construction of qualitative choice models in which the dependent variable takes on a
dichotomous or polychotomous character, have been applied to economic, business
and marketing analysis (Greene, 2003). Generally, the purpose of qualitative response
models is to determine the probability (or likelihood) that a decision maker, with a
given set of attributes, makes one choice rather than the alternative (Liao, 1994).
Amemiya (1981) suggested that using qualitative choice modeling in economic and
behavioural research has become more important because of the existence of many
discrete variables. Ennew and Binks (1996) use a logit model to identify factors
affecting bank customer retention and defection. Gan et al. (2006) apply a logit
analysis to examine the consumers‘ choice of banking channels in New Zealand. In
addition, Clemes, Gan and Zhang (2010) use logistic regression to analyze the factors
that impact on Chinese customers‘ bank switching behaviour. Gounaris and Koritos
(2008) also employ logistic regression analysis to investigate the drivers of the
78
Internet banking adoption decision in Greece.
Qualitative choice models are synonymous with discrete models (Greene, 2003). The
nature of the choice to be made depends upon the problem faced by the decision
maker. The restrictions placed upon the choices are (Elleithy, 2008; Train, 1993):
a. The number of alternatives in the set is finite;
b. The alternatives are mutually exclusive; that is, the person‘s choosing one
alternative in the set necessarily implies that the person does not choose another
alternative; and
c. The set of alternative is exhaustive; that is, all possible alternatives are included,
and so the person necessarily chooses one alternative from the set.
Examples of determining qualitative choices include entering or not entering the labor
market, or choosing between modes of transport (Train, 1993). Marketing researchers
use qualitative choice models to study consumer demand and to predict competitive
business responses, enabling choice modelers to solve a range of problems, such as
product development and demand estimation (Garrow, 2010; Ida, 2009; Train, 1993).
In this study, whether an individual chooses to adopt Internet banking or not adopt
Internet banking falls into the realm of qualitative choice.
79
Any choice situation in which the decision or choice is represented by a continuous
variable is not a qualitative choice situation (Train, 1993). Basically, qualitative
choice models designate a class of models, such as logit and probit, which attempt to
relate the probability of making a particular choice to various explanatory factors and
calculate the probability that the decision-maker will choose a particular choice or
decision from a set of choices or decisions ( ), given data observed by the research.
This choice probability ( ) depends on the observed characteristics of the
decision-maker ( ). The choice probability can be specified as a parametric function
of the general form (Train, 1993):
(4.1)
Where f is the function relating the observed data to the choice probabilities specified
up to some vector of parameters, . By relating qualitative choice models to utility
theory, a clear meaning of the choice probabilities emerges from the derivation of
probabilities from utility theory. The utility from each alternative depends on various
factors, including the characteristics of the decision-maker. By labeling the vector of
all relevant characteristics of person n as and the vector of all characteristics of
alternative i chosen by person n as , utility is a function of these factors (Train,
1993):
(4.2)
80
For all i in , the set of alternatives.
Based on Marshall‘s consumer demand theory of utility maximization, the
decision-maker therefore chooses the alternative from which he or she derives the
greatest utility. The individual choice can be said to be deterministic, and he or she
will choose i ( ) if U ( U ( for (i, j and j . To specify
the choice probability in qualitative choice models, U ( for each i in can be
divided into two sub functions, a systematic component that depends only on factors
that the research observes and another that represents all factors and aspects of utility
that are unknown or excluded by the research, labeled in . Thus,
(4.3)
Where are the observed attributes of alternative in and are the observable
characteristics of decision-maker n.
and (4.4)
hence, and (4.5)
Qualitative choice models are used to compute probability of choices being made, and
they attempt to relate the probability of making a particular choice to various
explanatory factors (Sellar, Chavas and Stoll, 1982). Probabilities have to be between
81
zero and one. Estimation of parameters to maximize the probability of the choice
by use of a linear probability model and ordinary least squares (OLS) is not
preferable due to the return of probabilities outside the unit interval (Stynes and
Peterson, 1984). In addition, the use of a linear probability model causes
heteroscedastic errors and as a consequence, t-tests of significance are not valid
(Miller and Hay, 1981). Therefore, it is preferable to use either a logit or probit model.
Different qualitative choice models are obtained by specifying different distributions
of unknown component of utility, , and deriving functions for the choice
probabilities (Ben-Akiva and Lerman, 1995; Train, 1993). If the error term is assumed
to be Gumbel-distributed, then the above represents the standard binary logit model.
However, if the error term is assumed to be normally distributed, then the model
becomes the binary probit model (Greene, 2003; Train, 1993; Ben-Akiva and Lerman,
1985). The binary logit model is used in this research because of the binary nature of
the approach and the differences between the two models are slight (Maddala, 2001).
The model is estimated by the maximum likelihood method used in LIMDEP version
7.0 software.
Thus, the choice probabilities can then be expressed as:
positive scale parameter, ie. .
or, (4.6)
82
The maximum likelihood estimator is consistent, asymptotically efficient2 and
asymptotically normal3.
For example, consumers who are considering Internet banking services are faced with
a simple binary choice situation; to adopt Internet banking, or not to adopt Internet
banking. The consumer‘s utility associated with adopting Internet banking is denoted
as and the utility associated with not adopting Internet banking as is denoted as
, which is represented as:
and (4.7)
The consumer will choose to adopt Internet banking if , and the utility of
each choice depends on the vector of observable attributes of the choices and the
vector observable consumer characteristics, summarized as . All unobservable and
excluded attributes and consumer characteristics are represented by the error term, ,
that is assumed to be independently and identically Gumbel distributed. The choice
probability of is given as
where . In an Internet banking
decision, the vector of observable consumer characteristics is represented in
2 Asymptotically efficient means that for large n, no other consistent estimator has a smaller variance.
3 Asymptotically normal means that for large n, they closely approximate the normal distribution, even
if the distribution from which the observations were drawn was not normal (Ramanathan, 1992).
83
parametric function form:
IBANK= f (CV, UFW, IA/IF, MC, WOM, PR, PI, SI, GEN, AGE, MAR, EDU, OCC,
INC, ) (4.8)
Where IBANK is the dependent variable which identifies whether an individual has
adopted or did not adopted Internet banking.
IBANK = 1 if the respondent has adopted Internet banking; 0 otherwise
CV = Convenience
UFW = User-friendly Website
IA/IF = Internet Access/ Internet Familiarity
MC = Marketing Communication
WOF = Word-of-Mouth
PR = Perceived Risks
PI = Price
SI = Self-Image
84
Demographic Characteristics:
GEN ( ) = Dummy variables for gender
Gender; 1 if respondent is a male; 0 otherwise
AGE ( ) = Dummy variables for age group
Age Group 1; 1 if respondent is between 18 to 35 years old;
0 otherwise
Age Group 2; 1 if respondent is between 36 to 50 years old;
0 otherwise
Age Group 3; 1 if respondent is 51 years old and over;
0 otherwise
MAR ( ) = Dummy variables for marital status
Marital status 1; 1 if respondent is single/never married;
0 otherwise
Marital status 2; 1 if respondent is married; 0 otherwise
Martial status 3; 1 if respondent is divorced/separated or in a
de facto relationship; 0 otherwise
85
EDU ( ) = Dummy variables for educational qualifications
Education 1; 1 if respondent completed low-level education
(e.g. Primary, Secondary, Fifth form, Bursary, Other);
0 otherwise
Education 2; 1 if respondent completed middle-level
education (e.g. Trade qualification, Diploma/Certification);
0 otherwise
Education 3; 1 if respondent completed high-level education
(e.g. Bachelor Degree, Postgraduate Degree); 0 otherwise
OCC ( ) = Dummy variables for occupational status
Occupation 1; 1 if respondent is professional; 0 otherwise
Occupation 2; 1 if respondent is retired; 0 otherwise
Occupation 3; 1 if respondent is sales (e.g. Sales/Services,
tradesperson, clerical); 0 otherwise
Occupation 4; 1 if respondents is others (e.g. student,
labourer, farmer, unemployed, home maker, other);
0 otherwise
86
INC ( ) = Dummy variables for annual income levels
Income 1: 1 if respondent annual income is low income level
(e.g. Under $10,000-39,000); 0 otherwise
Income 2: 1 if respondent annual income is middle income
level (e.g. $40,000-69,000); 0 otherwise
Income 3: 1 if respondent annual income is high income
level (e.g. $70,000 and over); 0 otherwise
= Error term
4.7.4 Statistical Assumptions for Logistic Regression
4.7.4.1 Outliers
Outliers are observations that have large residual values, or an observation that is far
removed from the rest of the observations (Hair et al., 2010). Outliers can potentially
influence the estimates of the regression parameters, and can produce confusing
results and mask important information that could be obtained from the regression
(Dielman, 2001; Maddala, 2001). Therefore, outliers should be deleted or modified
from the analysis to reduce the disproportionate influences in the overall results
(Aaker et al., 2005).
87
4.7.4.2 Linearity
Linearity predicts values that fall in a straight line by having a constant unit change of
dependent variable for a constant unit change of the independent variable (Hair et al.,
2010).
Logistic regression does not assume linear relationship between the dependent and the
independent variables. However, it assumes a linear relationship between the
independents and the log odds (logit) of the dependent (Garson, 2010). Linearity can
be examined through residual plots (Hair et al., 2010). According to Norusis (1994), if
the assumption of linearity is met, the residuals should be randomly dispersed around
the horizontal line through zero.
4.7.4.3 Multicollinearity
Multicollinearity represents the degree to which any variable‘s effect can be predicted
or accounted for by the other variables in the analysis. When multicollinarity arises,
the ability to define any variable‘s effect is diminished (Hair et al., 2010). Logistic
regression does not accept multicollinearity as the high interrelationship of the
independent variables can cause the inflation of the standard error of the logit
coefficients (Garson, 2010). Hair et al. (2010) suggest the simplest way to identify the
collinearity between variables is to examine the correlation matrix for the independent
variables. The acceptable level of correlation between each pair of the independent
88
variables should be at 0.80 or less (Bryman and Cramer, 1999).
4.7.4.4 Data Level
When the dependent variable is dichotomours (two categories), binary logistic
regression is used, and when dependent variable is polytomous (three or more
categories), multinomial logistic regression is applied (Dewberry, 2004). The
independent variables may be either categorical (not numerical) or quantitative
(numerical). In a logistic regression analysis, some of the categorical independent
variables should be converted into dummy variables taking the values 0 and 1
(Freedman, 2005).
4.7.5 Sensitivity Analysis
Greene (2003) suggests that Maximum Likelihood Estimates (MLE) can be used to
estimate the logit model because it assumes large sample properties of consistency,
efficiency, normality of parameter estimates, and validity of the t-test significance.
The logit model avoides the major problem associated with Ordinary Least Square
(OLS) estimation of the standard linear probability model (Hair et al., 2010; Judge,
Hill, Griffiths and Lee, 1982). The authors also find that the MLE coefficient
estimates from the logit analysis have no direct interpretation with respect to the
probability of the dependent variable (Y=1) other than indicating a direction of
influence of probability.
89
Maddala (2001) recommends calculating changes in probabilities to indicate the
magnitude of the marginal effect. This indicates the partial derivatives of the
non-linear probability function evaluation at each variable‘s sample mean (Liao, 1994;
Pindyck and Rubinfeld, 1997). The marginal effect also indicates the marginal change
in the dependent variable, given a unit change in a selected independent variable,
while holding other variables constant (Liao, 1994). Therefore, in order to rank the
factors influencing customers to adopt Internet banking from the most the least
important level, the marginal effect for each of the estimated coefficient were
calculated.
4.7.6 T-test and Analysis of Variance (ANOVA)
T-test and Analysis of Variance (ANOVA) are two of the most common methods used
in assessing group means. A T-test compares a dependent variable across two groups,
while one-way AVONA is applied when there are three or more groups (Hair et al.,
2010).
4.7.6.1 T-test
T-test assesses the statistical significance of the difference between two sample means
for a single dependent variable. The test of differences between two group means can
be conceptualized as the difference between the means divided by the variability of
random means (Hair et al., 2010). Thus, the t statistic is a ratio of the difference
90
between the two samples to the standard error. In the case of the means for two
independent samples, the hypotheses can be written in the following form:
(4.9)
The formula for calculating the t-statistic value is:
T statistic
(4.10)
where: = Mean of Group 1
= Mean of Group 2
= Standard error of the difference in group means.
In this study, t-tests were used to test whether or not the mean sores of males and
females are significantly different with respect to Internet banking adoption.
4.7.6.2 Analysis of Variance (ANOVA)
Analysis of variance (ANOVA) is a statistical technique used to determine on the
basis of one dependent measure, whether samples from two or more groups come
from the populations with equal means (Hair et al., 2010). The authors suggest that
ANOVA is valid only if it is assumed that the dependent variable is normally
distributed, the groups are independent in their response on the dependent variable,
and variances are equal for all treatment groups.
ANOVA compares two independent estimates of the variance for the dependent
91
variable. One reflects the general variability of respondents within the group ( )
and the other represents the differences between groups attributable to the treatment
effects ( ) (Hair et al., 2010).
1. : Mean square within groups
2. : Mean square between groups
Given that null hypothesis of no group difference is not rejected, and
represent the independent estimates of the population variance. Therefore, the ratio of
to represents how much variance is attributable to the different treatments
versus the variance expected from random samplings, and is calculated as the follows
(Hair et al., 2010):
Although the F-test of ANOVA assesses the null hypothesis of equal means across all
groups, the result cannot address which means are different (Hair et al., 2010). For
example, in a three-group situation, all three groups may differ significantly, or two
may be equal but differ from the third. Hair et al. (2010) suggest five common post
hoc tests procedures: the Scheffe test, the Turkey‘s honestly significant difference test,
the Turkey‘s extension of the Fisher least significant approach, the Duncan‘s multiple
92
range test, and New man-Kules test to identify which comparisons among groups (e.g.,
group 1 versus group 2 and 3 ) have significant difference (Hair et al., 2010). Of the
five procedures, the Scheffe test is the most conservative method (Hair et al., 2010).
In this study, some demographic characteristics include three or more groups, such as
age, marital status, education, occupation, and annual income. Therefore, the F-test
for the ANOVA and the Scheffe test are used to test significant differences among
these groups.
4.8 Chapter Summary
This chapter outlined the research plan and the research methodology used to test the
fourteen hypotheses developed in Chapter Three. The research plan including the
research design, sample size selection, sampling methods, data collection methods and
survey questionnaire development were explained. The research methods, such as the
factor analysis and logistic regression analysis were discussed.
s
93
Chapter 5 Results and Discussion
5.1 Introduction
This Chapter presents the results of the data analysis according to the research
methods discussed in Chapter Four. The data set is examined to ensure the statistical
assumptions of factor analysis and logistic regression analysis are met. The results of
factor analysis, logistic regression analysis, T-tests, and ANOVA are presented, and
the eighteen hypotheses are tested. The results are discussed in terms of their relation
to each of the relevant research objectives.
5.2 Sample and Response Rate
A total of 462 survey questionnaires were returned from 1500 questionnaires
distributed using the mail sampling method. Further, 28 questionnaires were returned
to the sender as the addresses were no long current, 13 were not filled out, and 32
were partly filled out and not suitable for use. This resulted in 389 usable
questionnaires, or a 25.9% useable response rate.
The usable responses were above the minimum sample size of 345 as suggested by
Hair et al. (2010). In addition, Sekaran (2003) recommends that a quantity of useable
questionnaires between 300 and 500 are the appropriate size for most behavioural
research. Therefore, the sample size was considered to be acceptable for the purpose
94
of this research.
5.3 Descriptive Statistics
The descriptive statistics were obtained from the frequency analysis using SPSS
version 17.0. The data in Table 5.1 shows the descriptive statistics for the respondents
who adopted Internet banking and those who did not adopt Internet banking. From the
total 389 useable questionnaires, 63.5% (247) of the respondents were Internet
banking users, while 36.5% (142) of the respondents were non-Internet banking users.
The sample respondents consisted of 47% (183) males and 52.4% (204) females, and
71.2% (277) of the respondents were married at the time of the survey. The dominant
age groups were between 51 to 55 years old (17.5%) and 46 to 50 years (13.9%) old.
The main qualification level for the sample respondents were Diploma/Certification
(21.9%) and Bachelor Degree (18.3%). In terms of occupation, the dominant groups
were respondents who worked as professional (35.2%) and retired (26.2%). In
addition, the major income groups were between $40,000-$49,999 (14.7%) and
$20,000-$29,999 (13.1%).
The demographic characteristics of the 247 respondents who adopted Internet banking
and the 142 respondents who did not adopt Internet banking were similar in terms of
gender, and marital status. However, the age, qualification, occupation and income
characteristics for the respondents between the Internet banking users and
95
non-Internet banking users were different. The Young Age Group and Middle Age
Group were more likely to adopt Internet banking than Old Age Group (see Table 5.1).
The main qualification level of Internet banking users was Diploma/Certification
(23.1%), compared to non-Internet banking users who had Secondary Education
(22.5%). The dominant group who adopted Internet banking was Professional (48.6%),
whereas the dominant group who did not adopt Internet banking was Retired (48.6%).
Furthermore, the majority of Internet banking users had Middle and High Annual
Incomes, compared to the majority of non-Internet banking users who had Low
Annual Incomes.
5.4 Assessment of the Data Set
After the data was collected and tabulated, a series of statistical assumptions were met
to ensure the appropriateness of the data for factor analysis and logistic regression
analysis.
5.4.1 Statistical Assumptions for Factor Analysis.
In order to avoid the observed correlations between variables being diminished, the
statistical assumptions of normality, homoscedasticity and linearity for factor analysis
needed to be fulfilled. A data matrix that has sufficient correlation can be used to
justify factor analysis (Hair et al., 2010). As discussed in Section 4.7.1.4, the
statistical assumptions to test the data matrix include:
96
(i) Examination of the Correlation Matrix
(ii) Inspection of the Anti-image Correlation Matrix
(iii)Barlett‘s Test of Sphericity
(iv) Kaiser-Meyer-Olkin Measure of Sampling Adequacy
5.4.1.1 Examination of the Correlation Matrix
The correlation matrix (see Table 5.2) shows that most of substantial correlations are
above 0.30 as recommend by Hair et al. (2010). The correlations indicated that the
data shared common factors and was therefore appropriate for factor analysis.
5.4.1.2 Inspection of the Anti-Image Correlation Matrix
The visual inspection of the off-diagonal elements of the anti-image correlation matrix
(see Table 5.3) shows that the majority of these values are close to zero (absolute
value less than 0.01). This result indicates that the data set is appropriate for factor
analysis (Hair et al., 2010).
5.4.1.3 Barlett’s Test of Sphericity
Barlett‘s Test of Sphericity assesses whether the correlation matrix comes from a
population of variables that are independent (Stewart 1981). If the test value is large
and the level of signification is low, then the null hypothesis is rejected. Rejection of
the null hypothesis is an indication that the data set is appropriate for factor analysis
97
(Stewart, 1981). The test value in this study (see Table 5.4) is large at 12587.048 and
the level of significant is low 0.000. Therefore, the null hypothesis is rejected and the
data set is appropriate for factor analysis.
5.4.1.4 Kaiser-Meyer-Olkin Measure of Sampling Adequacy
The Kaiser-Meryer-Olkin (KMO) Indix measures values from 0 to 1. In this study, the
test result (see Table 5.4) is 0.925. According to Kaiser and Rice (1974), this MSA
value is ―marvelous‖ (0.90+), which indicates that the data set is appropriate for factor
analysis.
5.4.2 Factor Analysis Results
The assessment of statistical assumption tests indicated that data set is appropriate for
factor analysis. Therefore, principle component factor analysis was conducted on all
of the items that were consistent with information derived from the literature review
and focus group interviews. The results are interpreted using the following criteria.
5.4.2.1 The Latent Roots Criterion
Results of the latent root criterion indicate that eight factors should be extracted from
the 41 variables submitted for factor analysis (see Table 5.5). These eight factors
explain 70.98% of the variation in the data.
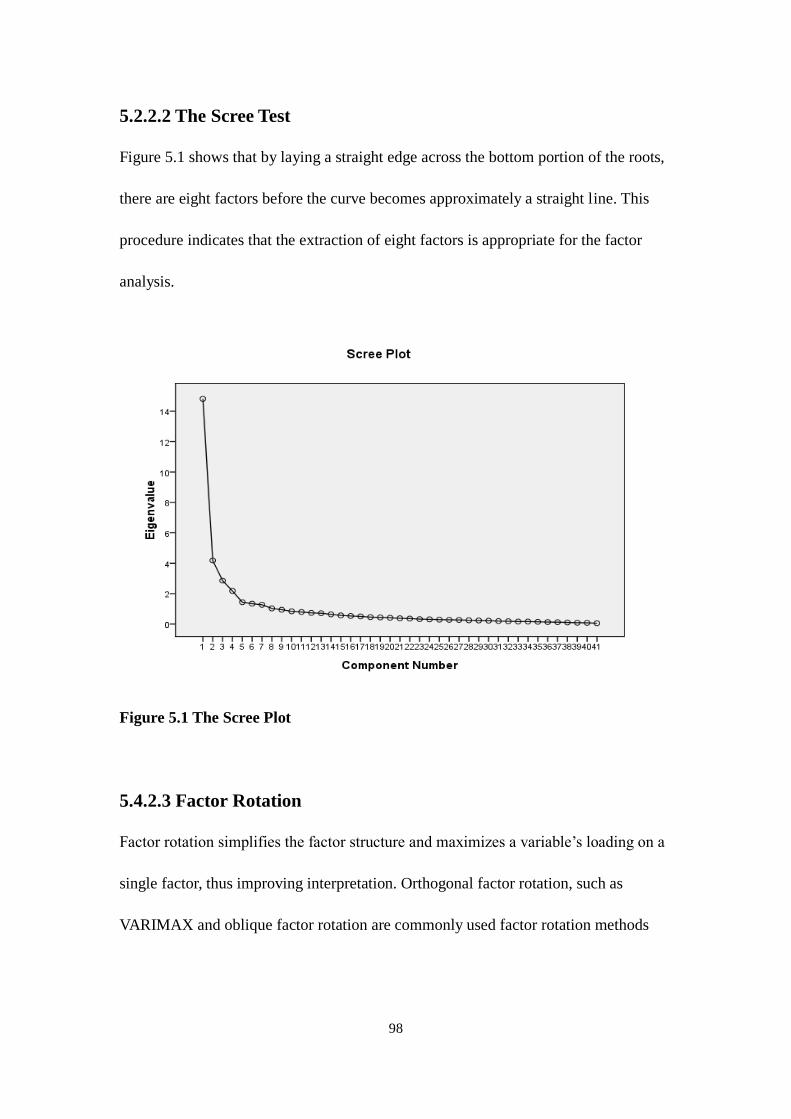
98
5.2.2.2 The Scree Test
Figure 5.1 shows that by laying a straight edge across the bottom portion of the roots,
there are eight factors before the curve becomes approximately a straight line. This
procedure indicates that the extraction of eight factors is appropriate for the factor
analysis.
Figure 5.1 The Scree Plot
5.4.2.3 Factor Rotation
Factor rotation simplifies the factor structure and maximizes a variable‘s loading on a
single factor, thus improving interpretation. Orthogonal factor rotation, such as
VARIMAX and oblique factor rotation are commonly used factor rotation methods

99
(Brown, 2006). In this study, both the VARIMAX and OBLIMIN roations display
similar factor loadings on most of the variables (see Table 5.6 and Table 5.7).
However, the VARIMAX rotation produces a better structure in terms of content
validity of the factors. Therefore, the final factor structure is based on the factor
loadings from the VARIMAX rotation.
5.4.2.4 Factor Interpretation
Hair et al. (2010) suggest that for a sample size of approximately 350 respondents,
factor loadings of 0.30 and above are significant. However, the authors also
recommend that values greater than ±0.50 are considered more practically significant.
Therefore, 0.50 is used as a cut-off point in this analysis as ±0.50 resulted in an
improved factor structure.
The results (see Table 5.6) derived from VARIMAX rotation show all of the rotated
items had significant loading above ±0.50. However, four variables (B37, B34, B36,
B38) are excluded from the factor structure because the factor loadings of four
variables are below ±0.50 and they do not load on any factors. In addition, three
variables (B22, B39, B5) have significant cross loadings on two separate factors. The
remaining 34 variables are cleanly sorted into 8 factors, and each factor is
subsequently named according to the construct they represented (see Table 5.6 and
Table 5.8). The eight factors are: (1) User-friendly Website; (2) Internet
100
Access/Internet Familiarity; (3) Perceived Risks; (4) Word-of-Mouth; (5) Price; (6)
Convenience; (7) Marketing Communications; and (8) Self-Image
5.4.3 Assessment of Summated Scales
Before summation of the items, the content validity, dimensionality and reliability of
measurement scales are assessed.
5.4.3.1 Content Validity
All of the items in the final VARIMAX rotation did not load exactly on the constructs
as proposed in the development of the items in the survey questionnaire that were
based on the results from the literature review and focus group discussions. However,
all the variables (items) comprising each factor were inspected by the researcher and
two marketing experts to ensure that the variables are adequate and a thorough
representation of the construct under investigation. Following this assessment, all
eight factors were considered to have adequate content validity.
5.4.3.2 Dimensionality
As discussed in Section 5.4.2.4, three variables (B22, B39, B5) out of a total of 41
variables loaded on two factors, indicating that these variables are associated with two
factors. Variable B22 and variable B5 highly loaded on one factor, and moderately
loaded on a different factor in the component matrix. Hence, B22 and B5 were
101
considered to represent the most highly loaded factors, which are Factor 2 and Factor
6 respectively. However, variable B39 exhibited very similar loadings on the two
factors and excluded from the data set.
5.4.3.3 Reliability
The remaining 35 variables (items) were subjected to reliability testing, except for
variable B35, which consisted of only one item representing Factor 8. The
Coronbach‘s Alpha coefficient was used to measure reliability. According to Churchill
(1979), a Cronbach‘s t Alpha of 0.60 or above is deemed to produce a reliable
measure in the exploratory research. The variables used in the summated scale and
their Cronbach‘s Alpha coefficients are presented in Table 5.9.
5.4.4 Statistical Assumptions for Logistic Regression Models
A series of statistical assumptions tests were conducted to ensure that the data met the
assumptions for logistic regression analysis.
5.4.4.1 Outliers
The outliers were identified and removed from the analysis in order to reduce the
effects of their influence on the regression analysis (Aaker et al., 2005).
102
5.4.4.2 Multicollinearity
The Person Correlation Matrix was used to inspect the correlation between the
independent variables. The result (see Table 5.10) shows that the correlations are all
below 0.80, indicating no multicollinearity problems were found in the regression
models.
5.4.4.3 Data Level
Due to the dichotomous nature of the dependent variable (adopt or non-adopt), binary
logistic regression was used in this study (Garson, 2010). All of the demographic
items which are categorical characteristics are coded as dummy variables in the
analysis.
5.5 Results Relating to Research Objective One
Research Objective One is to identify the factors that affect bank customers‘ adoption
of Internet banking. Logistic regression analysis was used to satisfy Research
Objective One (Hypothesis 1 through 8). Table 5.11 shows the logistic regression
results. The logistic regression model containing all predictors is statistically
significant (Chi-Square = 441.43, P value = 0.000, Degrees of Freedom = 15). The
summary results of logistic regression are show in Table 5.12.
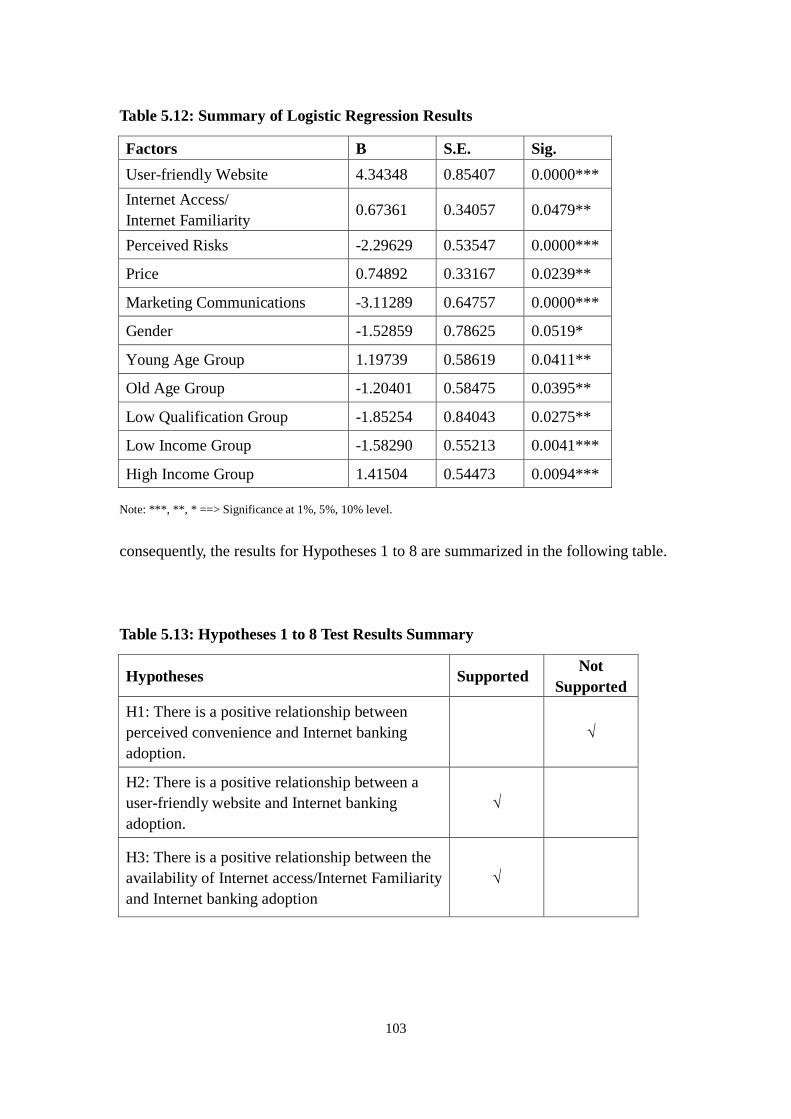
103
Table 5.12: Summary of Logistic Regression Results
Factors B S.E. Sig.
User-friendly Website 4.34348 0.85407 0.0000***
Internet Access/
Internet Familiarity 0.67361 0.34057 0.0479**
Perceived Risks -2.29629 0.53547 0.0000***
Price 0.74892 0.33167 0.0239**
Marketing Communications -3.11289 0.64757 0.0000***
Gender -1.52859 0.78625 0.0519*
Young Age Group 1.19739 0.58619 0.0411**
Old Age Group -1.20401 0.58475 0.0395**
Low Qualification Group -1.85254 0.84043 0.0275**
Low Income Group -1.58290 0.55213 0.0041***
High Income Group 1.41504 0.54473 0.0094***
Note: ***, **, * ==> Significance at 1%, 5%, 10% level.
consequently, the results for Hypotheses 1 to 8 are summarized in the following table.
Table 5.13: Hypotheses 1 to 8 Test Results Summary
Hypotheses Supported Not
Supported
H1: There is a positive relationship between
perceived convenience and Internet banking
adoption.
√
H2: There is a positive relationship between a
user-friendly website and Internet banking
adoption.
√
H3: There is a positive relationship between the
availability of Internet access/Internet Familiarity
and Internet banking adoption
√
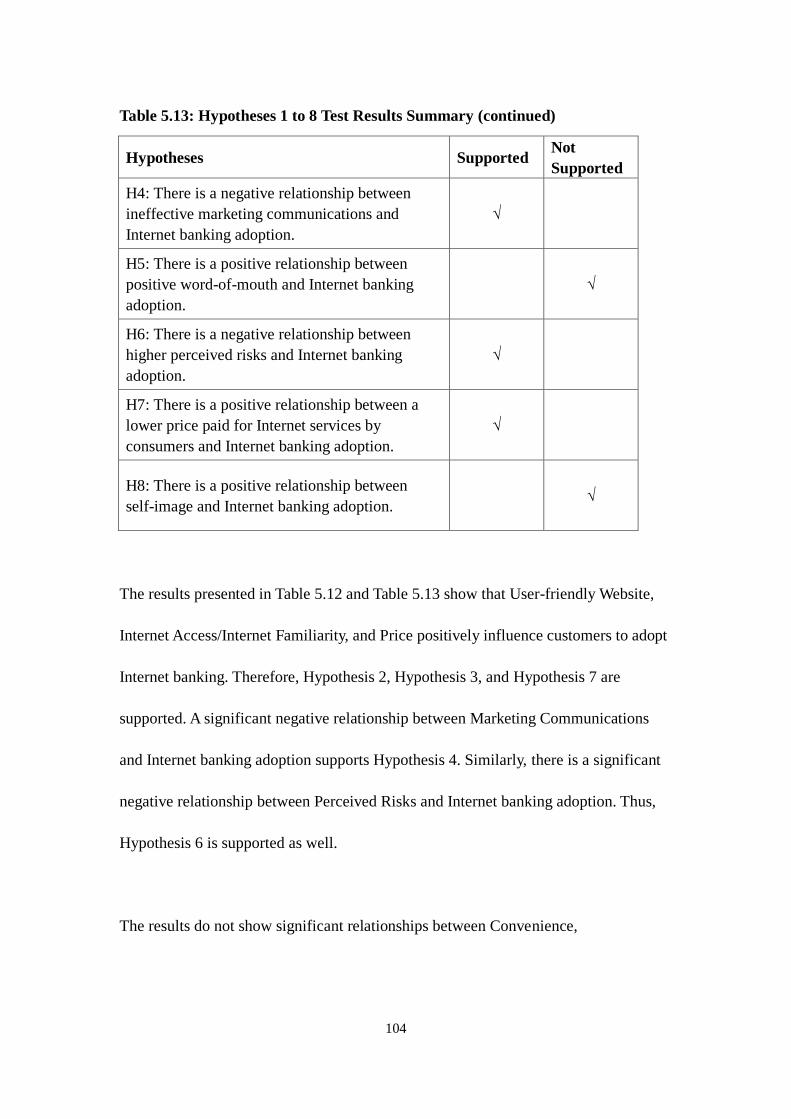
104
Table 5.13: Hypotheses 1 to 8 Test Results Summary (continued)
Hypotheses Supported Not
Supported
H4: There is a negative relationship between
ineffective marketing communications and
Internet banking adoption.
√
H5: There is a positive relationship between
positive word-of-mouth and Internet banking
adoption.
√
H6: There is a negative relationship between
higher perceived risks and Internet banking
adoption.
√
H7: There is a positive relationship between a
lower price paid for Internet services by
consumers and Internet banking adoption.
√
H8: There is a positive relationship between
self-image and Internet banking adoption. √
The results presented in Table 5.12 and Table 5.13 show that User-friendly Website,
Internet Access/Internet Familiarity, and Price positively influence customers to adopt
Internet banking. Therefore, Hypothesis 2, Hypothesis 3, and Hypothesis 7 are
supported. A significant negative relationship between Marketing Communications
and Internet banking adoption supports Hypothesis 4. Similarly, there is a significant
negative relationship between Perceived Risks and Internet banking adoption. Thus,
Hypothesis 6 is supported as well.
The results do not show significant relationships between Convenience,
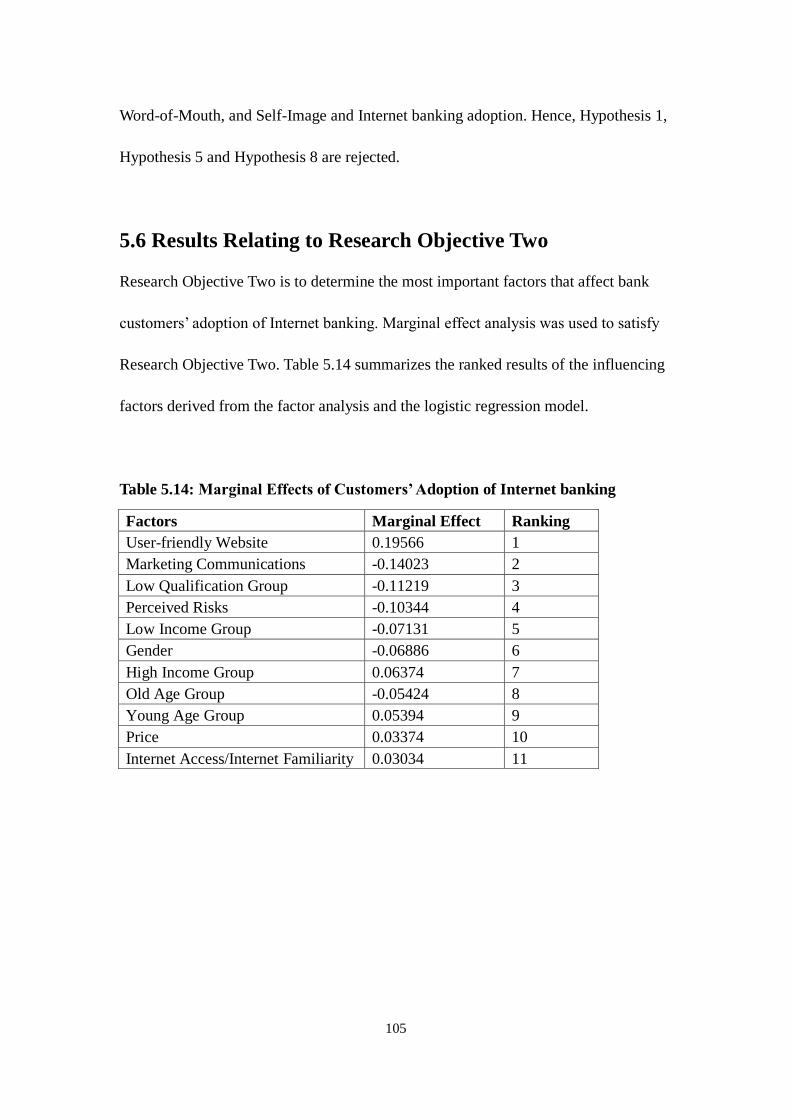
105
Word-of-Mouth, and Self-Image and Internet banking adoption. Hence, Hypothesis 1,
Hypothesis 5 and Hypothesis 8 are rejected.
5.6 Results Relating to Research Objective Two
Research Objective Two is to determine the most important factors that affect bank
customers‘ adoption of Internet banking. Marginal effect analysis was used to satisfy
Research Objective Two. Table 5.14 summarizes the ranked results of the influencing
factors derived from the factor analysis and the logistic regression model.
Table 5.14: Marginal Effects of Customers’ Adoption of Internet banking
Factors Marginal Effect Ranking
User-friendly Website 0.19566 1
Marketing Communications -0.14023 2
Low Qualification Group -0.11219 3
Perceived Risks -0.10344 4
Low Income Group -0.07131 5
Gender -0.06886 6
High Income Group 0.06374 7
Old Age Group -0.05424 8
Young Age Group 0.05394 9
Price 0.03374 10
Internet Access/Internet Familiarity 0.03034 11
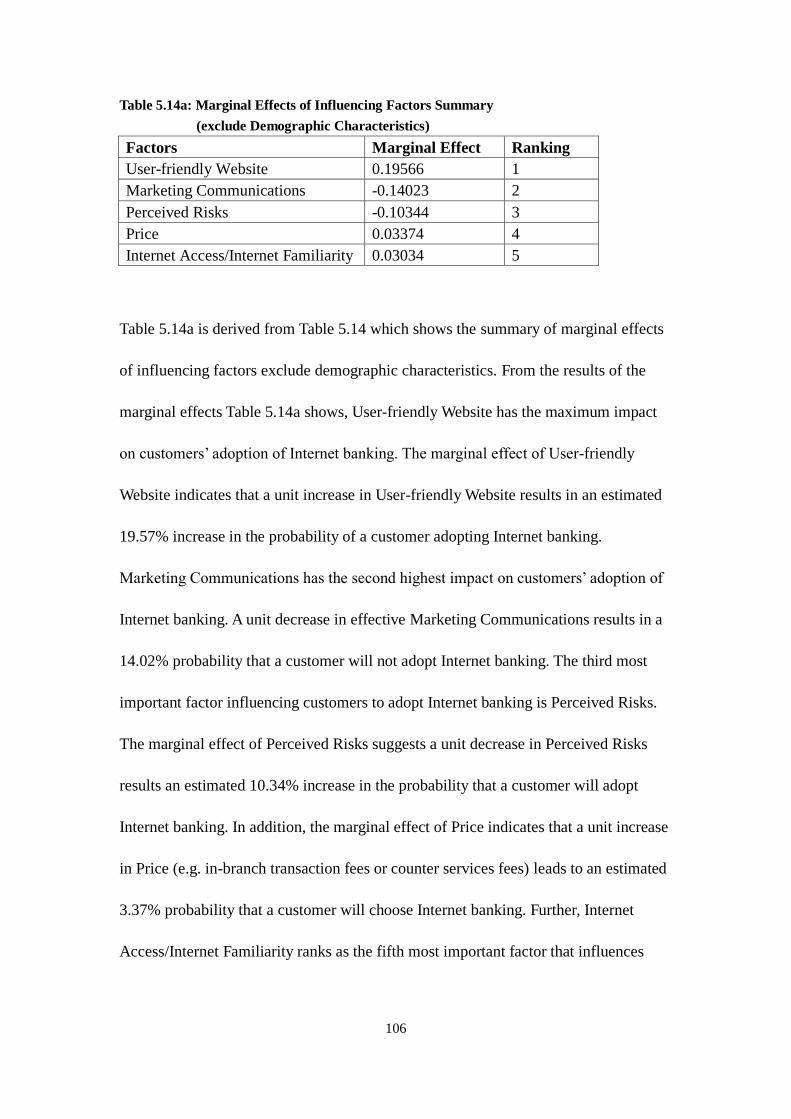
106
Table 5.14a: Marginal Effects of Influencing Factors Summary
(exclude Demographic Characteristics)
Factors Marginal Effect Ranking
User-friendly Website 0.19566 1
Marketing Communications -0.14023 2
Perceived Risks -0.10344 3
Price 0.03374 4
Internet Access/Internet Familiarity 0.03034 5
Table 5.14a is derived from Table 5.14 which shows the summary of marginal effects
of influencing factors exclude demographic characteristics. From the results of the
marginal effects Table 5.14a shows, User-friendly Website has the maximum impact
on customers‘ adoption of Internet banking. The marginal effect of User-friendly
Website indicates that a unit increase in User-friendly Website results in an estimated
19.57% increase in the probability of a customer adopting Internet banking.
Marketing Communications has the second highest impact on customers‘ adoption of
Internet banking. A unit decrease in effective Marketing Communications results in a
14.02% probability that a customer will not adopt Internet banking. The third most
important factor influencing customers to adopt Internet banking is Perceived Risks.
The marginal effect of Perceived Risks suggests a unit decrease in Perceived Risks
results an estimated 10.34% increase in the probability that a customer will adopt
Internet banking. In addition, the marginal effect of Price indicates that a unit increase
in Price (e.g. in-branch transaction fees or counter services fees) leads to an estimated
3.37% probability that a customer will choose Internet banking. Further, Internet
Access/Internet Familiarity ranks as the fifth most important factor that influences
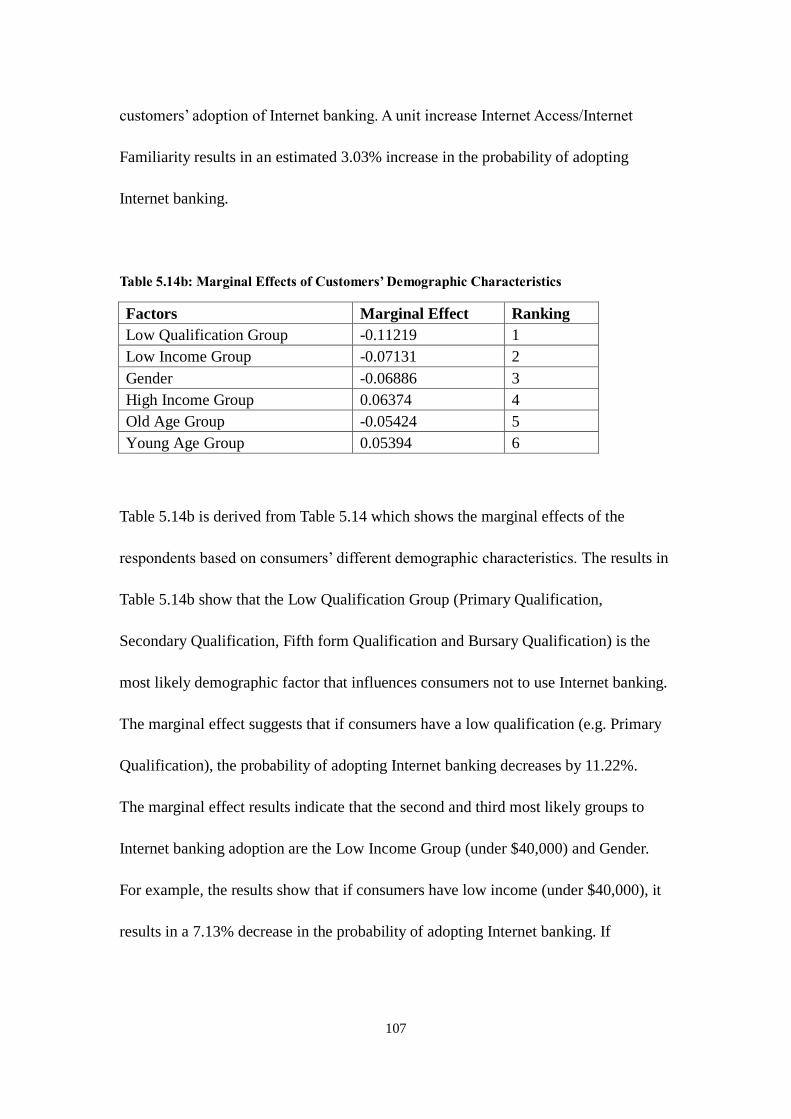
107
customers‘ adoption of Internet banking. A unit increase Internet Access/Internet
Familiarity results in an estimated 3.03% increase in the probability of adopting
Internet banking.
Table 5.14b: Marginal Effects of Customers’ Demographic Characteristics
Factors Marginal Effect Ranking
Low Qualification Group -0.11219 1
Low Income Group -0.07131 2
Gender -0.06886 3
High Income Group 0.06374 4
Old Age Group -0.05424 5
Young Age Group 0.05394 6
Table 5.14b is derived from Table 5.14 which shows the marginal effects of the
respondents based on consumers‘ different demographic characteristics. The results in
Table 5.14b show that the Low Qualification Group (Primary Qualification,
Secondary Qualification, Fifth form Qualification and Bursary Qualification) is the
most likely demographic factor that influences consumers not to use Internet banking.
The marginal effect suggests that if consumers have a low qualification (e.g. Primary
Qualification), the probability of adopting Internet banking decreases by 11.22%.
The marginal effect results indicate that the second and third most likely groups to
Internet banking adoption are the Low Income Group (under $40,000) and Gender.
For example, the results show that if consumers have low income (under $40,000), it
results in a 7.13% decrease in the probability of adopting Internet banking. If
108
consumers are female, the probability of adopting Internet banking increases by
6.88%. High Income Group (over $70,000) is the Fourth most likely group to bank
online with a probability of 6.37%. Furthermore, the marginal effect results show that
Old Age Group (over 51 years) and Young Age Group (18-35 years) are the fifth and
sixth most important demographic factors that influence consumers‘ decision to adopt
Internet banking respectively. For example, if consumers are in an old age group (over
51 years), it results in a 5.42% decrease in the probability of adopting Internet
banking. If consumers are in a young age group (18-35 years), it results in a 5.39%
increase in the probability of banking using the Internet.
5.7 Results Relating to Research Objective Three
Research Objective Three is to examine the impacts of the demographic
characteristics on bank customers‘ adoption of Internet banking. Logistic regression
analysis was used to test Hypotheses 9 to 15 to answer Research Objective Three.
Table 5.15 (based on the logistic regression results shown in Table 5.12 in Section 5.5)
shows the summary test results for Hypotheses 9 to 16.
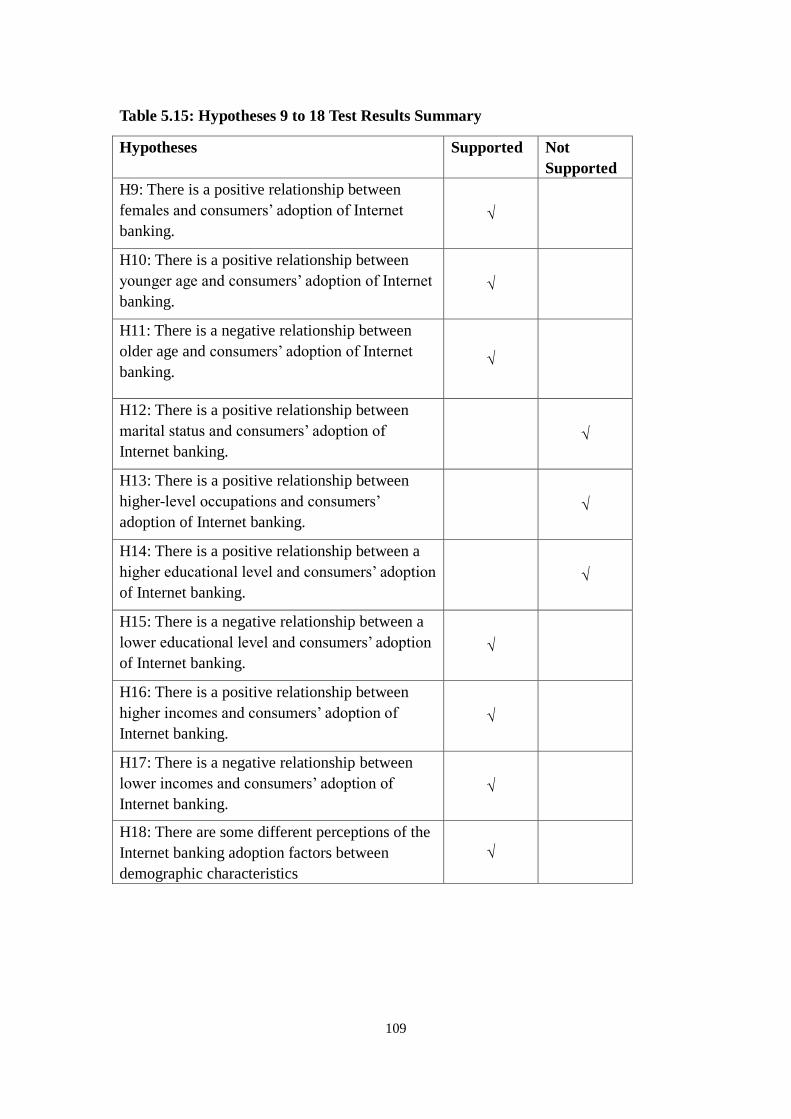
109
Table 5.15: Hypotheses 9 to 18 Test Results Summary
Hypotheses Supported Not
Supported
H9: There is a positive relationship between
females and consumers‘ adoption of Internet
banking. √
H10: There is a positive relationship between
younger age and consumers‘ adoption of Internet
banking. √
H11: There is a negative relationship between
older age and consumers‘ adoption of Internet
banking. √
H12: There is a positive relationship between
marital status and consumers‘ adoption of
Internet banking. √
H13: There is a positive relationship between
higher-level occupations and consumers‘
adoption of Internet banking. √
H14: There is a positive relationship between a
higher educational level and consumers‘ adoption
of Internet banking. √
H15: There is a negative relationship between a
lower educational level and consumers‘ adoption
of Internet banking. √
H16: There is a positive relationship between
higher incomes and consumers‘ adoption of
Internet banking. √
H17: There is a negative relationship between
lower incomes and consumers‘ adoption of
Internet banking. √
H18: There are some different perceptions of the
Internet banking adoption factors between
demographic characteristics
√

110
The test results in Table 5.15 (based on the logistic regression results shown in Table
5.12 in Section 5.5) show that the Gender coefficient is negative and significant at the
0.10 level of significance, which suggests that Females are more likely to adopt
Internet banking than Males. Hence, Hypothesis 9 is supported. In addition, the Young
Age Group coefficient (18 to 35 years) is positive and is significant at the 0.05 level
of significance, which indicates that young customers are most likely to adopt Internet
banking than the other age groups. Therefore, Hypotheses 10 is supported. The
coefficients of Old Age Group (over 51 years) and Low Qualification Group (Primary
Qualification, Secondary Qualification, Fifth form Qualification and Bursary
Qualification) are negative and significant at the 0.05 level of significance, which
indicate that Old Age Group and Low Qualification Group are less likely to adopt
Internet banking than the other age groups and the other qualification groups.
Therefore, Hypotheses 11 and 15 are supported. There is also a positive and
significant relationship between High Income Group (over $70,000) and Internet
banking adoption as the coefficient value for the High Income Group is significant at
the 0.01 level of significance, which indicate that High Income Group is more likely
to adopt Internet banking than the other income groups. Thus, Hypothesis 16 is
supported. Furthermore, the Low Income Group (under $40,000) has negative and
significant effect on Internet banking adoption, which indicates that the respondents
who have low incomes are less likely to adopt Internet banking than the other income
groups. Therefore, Hypothesis 17 is supported.
111
However, the coefficient values for the Married Group, Professional Group, and High
Qualification Group (Bachelor Degree and Postgraduate Degree) are not statistically
significant. Hence, Hypothesis 12, 13 and 14 are rejected.
In addition, the T-test and ANOVA were employed to test Hypotheses 18 to examine
whether there are any different perceptions about adopting Internet banking between
the different demographic groups. The T-test results in Table 5.16 show that Males
and Females have a different perception for Perceived Risks and Price in Internet
banking adoption. Consumers of different ages, marital status, and with different
qualifications, occupations, and annual incomes attribute different amounts of
importance to the influencing factors of Internet banking adoption: User-friendly
Website, Internet Access/Internet Familiarity, Perceived Risks, Word-of-Mouth, Price,
Convenience, and Marketing Communications. However, Self-Image is not
considered differently by consumers with different demographic characteristics (see
Table 5.17 to Table 5.21). Therefore, Hypothesis 18 is partially supported.
5.7.1 Age Relating to Internet Banking Adoption
The results (see Table 5.22) indicate that User-friendly Website is more important for
the Middle Age Group than the Old Age Group in the adoption of Internet banking.
However, the Old Age Group view Marketing Communications as more important,
compared to the Middle Age Group. In addition, the Old Age Group considers
112
Word-of-Mouth as a more important factor than the Young Age Group. In contrast, the
Young Age Group considers Price as more important, compared to the Old Age
Group.
5.7.2 Martial Status Relating to Internet Banking Adoption
The results (see Table 5.23) indicate that respondents in the Married Group and the
Other Relationships Group perceive User-friendly Website as more important than the
respondents in the Single/Never Married Group in the adoption of Internet banking.
The Married Group also considers Convenience to be more important than the
Single/Never Married Group in the adoption of Internet banking. However, The
Single/Never Married Group and Other Relationships Group consider Marketing
Communications as more important, compared to the Married Group. In addition, the
Other Relationships Group views Internet Access/Internet Familiarity as more
important than the Single/Never Married Group.
5.7.3 Qualification Relating to Internet Banking Adoption
The results (see Table 5.24) show that Convenience is more important to the High
Qualification Group than the Middle Qualification Group. Furthermore, Marketing
Communications is more important to the Low Qualification Group than the High
Qualification Group in the adoption of Internet banking.
113
5.7.4 Occupation Relating to Internet Banking Adoption
User-friendly Website and Price are perceived to be more important factors by the
Professional Group and Sales Group than the Retired Group when they make decision
to adopt Internet banking. The Professional Group also considers Convenience to be
more important compared with the Retired Group in the adoption of Internet banking.
However, the Sales Group, Retired Group and Others Group are more concerned with
Marketing Communications compared to the Professional Group when they make
decision to use Internet banking (see Table 5.25).
5.7.5 Income Relating to Internet Banking Adoption
The Middle Income Group and the High Income Group perceive User-friendly
Website, Price, and Convenience to be more important than the Low Income Group in
the adoption of Internet banking. However, the respondents in the Low Income Group
and the Middle Income view Marketing Communications as more important factors
compared to the respondents in the High Income Group in the adoption of Internet
banking (see Table 5.26).
5.8 Chapter Summary
This chapter presents the results based on the research plan and methodology
discussed in Chapter Four. The results from factor analysis formed a valid and reliable
factor structure with eight factors in the Internet banking adoption factors model. The

114
logistic regression results indicated five significant factors influenced Internet banking
adoption. The marginal effects ranked the factors influencing Internet banking
adoption from the most to the least important. Finally, ANOVA and T-tests indicated
customers with different demographic characteristics have different perceptions of the
factors that influence Internet banking adoption.
115
Chapter 6 Conclusions and Implications
6.1 Introduction
This chapter reviews the research findings presented in Chapter Five and discusses
their theoretical and managerial implications. The research limitations and directions
for future research are also discussed.
The three Research Objectives stated in this study were addressed by testing 15
hypotheses. Hypotheses 1 through 8 relate to Research Objective One. Hypotheses 9
through 15 relate to Research Objective Three. Research Objective Two was satisfied
by examining the most important factors influencing customers to adopt Internet
banking.
6.2 Conclusions Relating to Research Objective One
Research Objective 1: To identify the factors that affect bank customers‘ adoption of
Internet banking in New Zealand.
Research Objective One was satisfied as the factors affecting bank customers‘
adoption of Internet banking in New Zealand were identified. The results of the
logistic regression analysis show that the factors: User-friendly Website, Internet
Access/Internet Familiarity, Marketing Communications, Perceived Risks, and Price
116
influence customers‘ decisions to adopt Internet banking. Consequently, Hypotheses 2,
3, 4, 6 and 7 were supported, while Hypotheses 1, 5, and 8 were rejected.
The support for Hypothesis 2 confirms that User-friendly Website positively
influences customers to adopt Internet banking services. This result is consistent with
the findings of Padachi et al. (2007), Litchtenstein and Williamson (2006), Akinci et
al. (2004), and Sohail and Shanmugham (2003). For example, Padachi et al. (2007)
and Lichtenstein and Williamson (2006) find that a user-friendly bank website is an
important determinant of ease of use, which affects the adoption of Internet banking
services in Mauritius and Australia. The support for Hypothesis 3 confirms that
Internet Access/Internet Familiarity positively influences customers to adopt Internet
banking. This result is consistent with the findings of Polasik and Wisniewski (2009),
Lassar et al. (2005), and Sohail and Shanmugham (2003). For instance, Sohail and
Shanmugham (2003) find that Internet access is one of the main factors that influence
the adoption of Internet banking in Malaysia. Polasik and Wisniewski (2009) and
Lassar et al. (2005) observe that Internet familiarity is an important factor that
contributes customers to adoption of Internet banking in Poland and the U.S.
The support for Hypothesis 4 confirms that ineffective marketing communications
have a negative relationship with Internet banking adoption. This result is in
accordance with the findings of Laukkanen et al. (2009) and Lichtenstein and
Williamson (2006) as these authors regard marketing communications as an important
117
factor that influence customers’ adoption of Internet banking. In addition, the support
for Hypothesis 6 confirms there is a negative relationship between perceived risks and
customers’ adoption of Internet banking. This result is consistent with the findings of
Lee (2009), Kuisma et al. (2007), Polatoglu and Ekin (2001), Tan and Teo (2000) as
these authors identify perceived risks as having a significant negative and direct effect
on customers’ adoption of Internet banking.
Further, there is support for Hypothesis 7, proposing that a lower price paid for
Internet banking transactions is an influential factor that has a positive relationship
with Internet banking adoption. This result is consistent with the findings of Kerem
(2003), Athanassopuolos and Labroukos (1999), and Karjaluoto et al. (1999). For
example, Kerem (2003) indicates that Internet banking is lower priced and that price
incentives have been successfully used by banks to motivate consumers to use
Internet banking in Estonia.
However, the rejection of Hypothesis 1 does not support the findings of Padachi et al.
(2007), Gerrard and Cunningham (2003), and Bughin (2000) regarding the influence
of Convenience on Internet banking adoption. Similarly, the rejection of Hypothesis 5
does not support the findings of Kim and Prabhaker (2000) who determined that
Word-of-Mouth (WOM) has an effect on Internet banking adoption in the United
States. Finally, the rejection of Hypothesis 8 does not support the findings of
118
Globerson and Maggard (1991) who determined that Self-image influences Internet
banking adoption.
6.3 Conclusions Relating to Research Objective Two
Research Objective 2: To determine the most important factors that affect customers‘
adoption of Internet banking in New Zealand.
The marginal effect results show that User-friendly Website has the maximum impact
on customers‘ adoption of Internet banking. Marketing Communications and
Perceived Risks are the second and third important factors influencing customers‘
adoption of Internet banking. The fourth and fifth most important factors are Price and
Internet Access/Internet Familiarity respectively (see Table 5.14a in Chapter Five).
With regards to the demographic characteristics, the Low Qualification Group has the
maximum impact on customers‘ adoption of Internet banking, followed by the Low
Income Group. The third most important demographic characteristic impacting on
customers‘ adoption of Internet banking is the Gender Group (Females). The High
Income group is the fourth most important group, followed by the respondents in the
Old Age Group and, lastly Young Age Group (see Table 5.14b).
119
6.4 Conclusions Relating to Research Objective Three
Research Objective 3: To determine the impact that the demographic characteristics
have on Internet banking in New Zealand.
Research Objective 3 was satisfied. However, only Gender, Age, Education and
Income impact on customers‘ decisions to adopt Internet banking. The logistic
regression results reveal that the Female, Young Age, and Higher Income Groups are
positively associated with Internet banking adoption. Therefore, Hypotheses 9, 10,
and 16 are supported. These results are consistent with findings of Gao and Owolabi
(2008), Yiu et al. (2007), Kim et al. (2005); Sohail and Shanmugham (2003) and
Polatoglu and Ekin (2001). For example, Gao and Owolabi (2008) find that female
respondents are more likely to adopt Internet banking than males in Nigeria. Kim et al.
(2005) note that when compared to older consumers, younger consumers are more
likely to adopt Internet banking in the United States. Padachi et al. (2007) indicate
that higher levels of income respondents are more likely to use Internet banking
services in Mauritius. Sohail and Shanmugham (2003) and Polatoglu and Ekin (2001)
conclude that young and affluent people are more likely to use Internet banking
services in Malaysia and Turkey. In addition, the logistic regression results show that
being in the Old Age, Low Qualification and Low Income Groups negatively
influence customers‘ decisions to adopt Internet banking. These results are consistent
with and Flavián et al. (2006) and Gerrard et al.‘s (2006) findings. For instance,
120
Gerrard et al. (2006) find that less-educated people are less likely to use Internet
banking in Singapore. Flavián et al. (2006) report that older and lower income groups
are less likely to conduct their banking operations using the Internet in Chile.
Therefore, Hypotheses 11, 15, and 17 are supported.
The T-test and AVONA results show that customers with different gender, age, marital
status, qualifications, occupations and incomes, have different perceptions of the
Internet banking adoption factor: User-friendly Website, Internet Access/Internet
Familiarity, Perceived Risks, Word-of-Mouth, Price, Convenience, and Marketing
Communication. Hence, Hypotheses 18 is partially supported.
In terms of the marginal effects, the Low Qualification Group is the most likely group
to adopt Internet banking, followed by the Low Income Group, the Gender Group, the
High Income Group, the Old Age Group and the Young Age Group (see Table 5.15).
However, there are no clear relationships between the Marital Status, Occupations and
High Qualification Groups and their adoption of Internet banking. Thus, Hypotheses
12, 13 and 14 are not supported. These results are consistent with some research
findings, such as Gan et al. (2006) and Sathye (1999). Gan et al.‘s (2006) results show
that Marital Status does not have an impact on a consumer‘s decision to use electronic
banking in New Zealand. In Lee and Lee (2000) and Sathye‘s (1999) studies, the
121
authors identify that there is no statistically significant difference between any groups
in terms of occupation, education and the adoption of Internet banking in the U.S and
Australia.
6.5 Theoretical Implications
This research makes a number of contributions to the banking industry. First, this
research contributes to the limited empirical studies currently available on consumers’
adoption of Internet banking, especially in the New Zealand banking context. The
study provides a more comprehensive understanding of consumers’ adoption of
Internet banking in New Zealand by empirically identifying the factors that influence
customers to adopt Internet banking.
Secondly, this research used a logistic regression analysis to examine consumers’
adoption of Internet banking. The results of this research support logistic regression
analysis as an appropriate method to examine consumers’ choice decisions regarding
Internet banking services.
Thirdly, this research confirms that some of the factors influencing consumers’
adoption of Internet banking indentified in previous research in other countries can
also be applied to the New Zealand banking market, such as a User-friendly Website,
Marketing Communications, Perceived Risks, Price and Internet Access/Internet
122
Familiarity.
6.6 Managerial Implications
User-friendly Website
This research reveals that a User-friendly Website has the strongest influence on New
Zealand bank customers‘ adoption of Internet banking. This result is consistent with a
number of researchers that indicate a user-friendly website is an important
determinant that affects the adoption of Internet banking (Akhlaq, 2011; Padachi et al.,
2007, Litchtenstein and Williamson, 2006; Jaruwachirathankul and Fink, 2005; Akinci
et al., 2004; Sohail and Shanmugham, 2003).
A user-friendly website design, in respect to information availability and ease of use,
affect consumers‘ choices of Internet banking use (Lichtenstein and Williamson,
2006). Akhlaq (2011) conclude that unfriendly website has discouraged consumers
from using Internet banking technology. Jaruwachirathankul and Fink (2005) explain
that it is essential for banks to provide a well-designed and user-friendly website to
attract potential adopters‘ attention.
In order to enhance the adoption rate of Internet banking, banks should develop the
user-friendliness of their website by considering several factors, such as clear and
comprehensible instructions which are easy to read, prompt processing of transactions,
123
and a wide range of services. In addition, bank websites should be available 7 days
and 24 hours and banks should regularly provide accurate information and update
records on their websites. Khan (2007) reports that pages download times is a major
concern of Internet banking customers, therefore materials on a website should not
take excessive time to download and a bank‘s website should execute transactions
quickly and efficiently. Conducting a pilot test of banks website to obtain the
feedbacks of consumers is also important as it can help banks to improve the
user-friendliness of their websites. To be effective, bank management should put in
place procedures for maintaining and updating their websites by developing Internet
banking technology including ease of use, comprehensive information on the site, fast
downloading of materials, and effective communication with customers.
Marketing Communications
This research reveals that Marketing Communications also has a strong influence on
customers‘ decisions to adopt Internet banking. This result is consistent with several
researchers that found Marketing Communications effects consumers‘ adoption of
Internet banking (Laukkanen et al., 2009; Prasad and Arumbaka, 2009; Lichtenstein
and Williamson, 2006; Polatoglu and Ekin, 2001). Prasad and Armbaka (2009) show
that most non-Internet banking customers have a lack of awareness of Internet
banking services due to a lack of marketing effort on the part of banks. Therefore, a
lack of awareness suggests the need for banks to provide an aggressive marketing
124
communications targeting non adopters (Lichtenstein and Williamson, 2006).
Banks should use effective media advertising such as radio and TV advertisement,
leaflets, brochures, and web pages to introduce Internet banking services to a wider
audience and educate potential customers about how to become Internet banking users,
the range of services Internet banking provides, and the benefits of Internet banking.
To access more adopters, information about Internet banking should be also provided
by bank tellers and bank assistants at bank branches. The information should include
references to time saving, convenience, low cost and information availability. Banks
should emphasise the positive attributes of Internet banking in their marketing
campaigns. Banks can also advertise the safety of their websites and announce
publicly the efforts to maintain this safety to increase the level of customer trust for
the banks and enable Internet banking to be viewed more favorably.
Perceived Risks
This study reveals that Perceived Risks is an important factor influencing customers‘
adoption of Internet banking. Several researchers indicate that Perceived Risks plays
an important role when bank customers decide to adopt Internet banking services (Lee,
2009; Kuisma et al., 2007; Polatoglu and Ekin, 2001; Tan and Teo, 2000). Therefore,
banks need to search for risk-reducing strategies that can assist in inspiring high
confidence in potential customers.
125
In New Zealand, Security/Privacy in terms of authorized use and abuse of accounts,
and keeping customers‘ personal details private is a concern to the majority of
customers and it affects the adoption of Internet banking (Chung and Paynter, 2002).
To overcome such risk issues, bank management should take steps to manage and
minimize perceived security risks. Bank management should consider focusing on the
prevention of intrusion, fraud and identity theft. Banks can use encryption, firewall,
intrusion detection and other related security devices to properly safeguard their
Internet banking security systems. Banks should also advise customers about how best
to protect online accounts. For example, banks should advise customers never to
respond to e-mails requesting confirmation of logins and passwords, memorize their
password and refrain from writing it down, and not keep savings account details in an
open file on a hard drive. Banks should also recommend that customers install a
firewall, anti-virus and anti-spyware and software on their computers (Polasik and
Wisniewski, 2009). In addition, banks should emphasis that the online systems are
only accessible to registered customers who use the correct password and the
customers‘ information remains confidential at all times. Furthermore, banks should
develop service recovery programmes to provide a guarantee for every transaction to
increase confidence in their Internet banking services.
Price
The results of this study confirm that Price is another important factor influencing
126
consumers to adopt Internet banking, supporting the findings of Sathye (1999), Kerem
(2003) and Kajaluoto et al. (1999). Sathye (1999) argues that, in the context of
Internet banking, two kinds of price are involved: the normal cost associated with
internet activities, such as cost of computers and Internet connection, and the bank
costs and charges.
Internet banking reduces a bank‘s operating costs and improves a bank‘s
competitiveness (Rotchanakitumnual and Speece, 2003). The more customers that use
Internet banking services, the larger the potential savings (Polatoglu and Ekin, 2001).
In order to attract more customers to adopt Internet banking services, banks should
implement pricing strategies. For example, banks can charge higher fees for the
transactions at bank branches, but offer lower fees or free services for Internet
banking transactions. As a result, customers should be positively motivated to adopt
lower cost Internet banking rather than using higher priced branch services. Banks can
also reduce home loan interest rates or pay higher interest rates on deposits for online
accounts. Banks might consider encouraging the purchase of a PC through a
low-interest rate loan and offer incentives such as free internet access dial-up.
However, non-Internet banking users may see no major financial benefits in becoming
an Internet banking customers. Therefore, banks should explain the extent of financial
benefits by making comparisons of how fees associated differ between traditional
127
banking and Internet banking.
Internet Access/Internet Familiarity
Another valuable finding from this study is the importance of Internet Access/Internet
Familiarity as an antecedent of Internet banking adoption, supporting the findings of
Polasik and Wisniewski (2009); Lichtenstein and Williamson (2006); Centeno (2004);
Karjaluoto et al. (2002) and Lee and Lee (2001). Centeno (2004) identifies that the
pre-existence of PC and Internet access and literacy are a pre-requisite for Internet
banking adoption. Familiarity with the Internet environment encourages acceptance of
Internet banking by individuals who have used the Internet for a long period.
Karjaluoto et al. (2002) find one reason many non-users do not adopt Internet banking
is that they do not have access to the Internet. In order to increase the rate of Internet
banking adoption, banks should provide free access to their networks in bank
branches or public places, such as shopping centres. Banks may also be able to
collaborate with Internet service providers to offer free networks to non-Internet users.
Gerrard and Cunningham (2003) find that some customers do not adopt Internet
banking because of their lower computation proficiency and Internet skills. Karjaluoto
et al.’s (2002) find that customers with a good knowledge of computer and Internet
technologies are generally more likely to adopt Internet banking. Therefore, banks
should provide free hands-on computer and Internet training projects to educate
128
people on how to use Internet banking. In addition, banks could provide Internet
banking training using DVDs to offer Internet banking operating instructions and
illustrate the benefits of Internet banking.
Demographic Characteristics
The empirical results reveal that the Low Qualification Group has the highest impact
on customers‘ adoption of Internet banking and this result is consistent with the
findings of Yiu et al. (2007) and Gerrard et al. (2006). The Low Qualification Group
consumers are less likely to adopt Internet banking because generally they lack
knowledge of computer technology and lack computer skills when compared to
consumers in the High Qualification Group. Less-educated people may not be familiar
with the Internet and they may find Internet banking is too complex to use. Kim et al.
(2005) conclude that when education levels increase, households are more likely to
use Internet banking. Therefore, banks should provide free computer education and
training about Internet banking to bank customers. When customers gain more
knowledge and skills about computers and the Internet, they may perceive Internet
banking as more easily to use and be more likely to adopt Internet banking.
The Low Income Group is less likely to adopt Internet banking, and the High Income
Group is more likely to adopt Internet banking. These results are consistent with
Flavián et al. (2006) findings. A possible explanation for this result is that people with

129
higher incomes are more likely to possess a personal computer and pay Internet fees
compared to less-wealthy people. In addition, a high household income may mean
that a customer has more financial resources to manage, and thus a stronger need for a
channel with high level of flexibility, such as Internet banking. To enhance the rate of
Internet banking adoption, banks should provide the public with free access to Internet
banking facilities so as to motivate low income people to adopt Internet banking
services. Moreover, adding convenience by developing the valuable features of
Internet banking may be necessary to attract additional people with high incomes. For
example, developing bank web navigability could improve self-sufficiency and time
savings for high income individuals.
Gender also influences the preference for Internet banking. The empirical results in
this study show that females are more likely to use Internet banking than males. This
result is similar to findings in Gao and Owolabi (2008) and Lichtenstein and
Williamson‘s (2006) studies. Lichtenstein and Williamson (2006) note that in
Australia, female users are more likely to do Internet banking because these women
have busy lives raising children and managing households and often working part or
full time. Therefore, they need the convenience of Internet banking to manage their
accounts and finances at any time. Polatoglu and Ekin (2001) note that for consumers
with a busy lifestyle, the need for online banking are clear as a large numbers of
females are expected to use Internet banking to pay household bills and complete
130
other financial transactions at their convenience. Thus, banks should provide various
services to meet female customers‘ needs, including account management, financial
management, foreign exchange, insurance, payments, and loan services.
This study reveals that the Young Age Group is more likely to adopt Internet banking,
whereas the Old Age Group is less likely to adopt Internet banking. These results are
consistent with Flavián et al.‘ s(2006) findings. Younger customers adopt Internet
banking due to a greater convenience, lower prices, and/or time savings. In order to
encourage more young customers to adopt Internet banking, banks can offer price
incentives. For example, banks can offer lower monthly fees to students as the Young
Age Group may not have sufficient disposable incomes. Lower transaction costs for
Internet banking may encourage students to use Internet banking.
Jaruwachirathanakul and Fink (2005) find that older customers have negative attitudes
towards Internet banking as they do not fully understand the usefulness of Internet
banking. Therefore, banks should develop effective promotion strategies to emphasize
the advantages of their Internet banking services to older customers, such as
convenience, savings of time and effort, lower costs, greater control over finances,
and information availability.
131
6.7 Limitations and Avenues for Future Research
Although this study provides valuable contributions from a theoretical and practical
perspective, there are a few limitations.
First, this research was conducted in Christchurch, New Zealand. People‘s beliefs and
attitudes can be very across different regions and countries. A probability sample in a
different geographic area may reveal differences in consumers‘ attitudes towards the
adoption of Internet banking. Therefore, future researchers should use a more
geographic dispense sample to analyse consumers‘ behavioural intentions towards
Internet banking services. Future researchers can also undertake a comparative study
between two different countries, such as New Zealand and Australia.
Secondly, this study empirically examined eight factors that may influence consumers‘
adoption of Internet banking. However, there may be some other factors that can
impact on customers‘ adoption of Internet banking but were not identified in this study.
Further research is required to identify other factors that may impact on customers‘
adoption of Internet banking. This approach may be particularly important in a
different cultural setting.
Thirdly, this study focused on the customers‘ perspectives. Future research could
focus on the banks‘ perspectives. Interviews with bank management could be
conducted to discuss their strategies regarding the implementation of Internet banking.
132
6.8 Conclusion
This research illustrates a range of factors that affect bank customers‘ decision to
adopt Internet banking using an exploratory investigation. This study also identifies
some factors that are more influential than others. An understanding of these
influencing factors can assist banks in developing more effective strategies to promote
and encourage Internet banking adoption.
A User-friendly Website is identified as the most important factor influencing
consumers to adopt Internet banking. Therefore, banks must consider a superior web
system design in developing strategies for enhancing Internet banking adoption.
Marketing Communications is also an important factor that affects customers‘
adoption of Internet banking. Banks should develop effective promotional campaigns,
such as advertising, personal selling, radio, and newspaper advertising to create a
greater awareness of Internet banking and its benefits to potential Internet banking
adopters.
In summary, the greater the knowledge that bank management has about the factors
that influences customers to adopt Internet banking, the greater the ability banks have
to develop appropriate strategies to encourage more customers to adopt Internet
banking.
133
REFERENCES
Aaker, D. A., Kumar, V., Day, G.S. and Lawley, M. (2005). Marketing research: The
pacific rim edition. Milton: John Wiley & Sons Australia.
Akhlaq, M. A. (2011). Internet banking in Pakistan: finding complexities. Journal of
Internet Banking and Commerce. 16(1), pp. 1-14.
Akinci, S., Aksoy, S., and Atilgan, E. (2004). Adoption of Internet banking among
sophisticated consumer segments in an advanced developing country. The
International Journal of Bank Marketing. 22(2/3), pp.212-232.
Alba, J. W., and Hutchinson, J. W. (1987). Dimensions of consumer expertise. The
Journal of Consumer Research. 13(4), pp. 411-454.
Al-Hawari, M., and Ward, T. (2006). The effect of automated service quality on
Australian banks‘ financial performance and the mediating role of customer
satisfaction. Marketing Intelligence & Planning. 24(2), pp. 127-138.
Amemiya, T. (1981). Qualitative response model: A survey. Journal of Economic
Literature. 19, pp. 1485-1536.
American Heritage Dictionary of English Language, Third Edition. (1992). Boston:
Houghton-Mifflin.
Anderson, E. W., and Salisbury, L. C. (2003, June). The formation of market level
expectations and its covariates. Journal of Consumer Research. 30, pp. 115-124.
Anderson, W. T. (1971). Identifying the convenience oriented consumer. Journal of
Marketing Research. 8(May), pp. 179-183.
Anderson, W. T. (1972). Convenience orientation and consumption behavior. Journal
of Retailing. 48(3), pp. 49-71.
Arndt, J. (1967). Role of product-related conversations in the diffusion of a new
product. Journal of Marketing. 4(3), pp. 291-295.
Athanassopuolos, A. D., and Labroukos, N. S. (1999). Corporate customer behavior
towards financial services: empirical results from the emerging market of Greece.
International Journal of Bank Marketing. 17(6), pp. 247-285.
134
Bai, B., Law, R., and Wen, I. (2008). The impact of website quality on customer
satisfaction and purchase intentions: Evidence from Chinese online visitors.
International Journal of Hospitality Management. 27(3), pp. 391-402.
Bansal, H. S., and Voyer, P. A. (2000). Word-of-mouth processes within a service
purchase context. Journal of Service Research. 3(2), pp. 166-177.
Barton, C. (2000). Banking on the future. The New Zealand Herald. Retrieved June
15, 2009 from
http://www.nzherald.co.nz/technology/news/article.cfm?c_id=5&objectid=185860
Bauer, J. M., Berne, M., and Maitland, C. F. (2002). Internet access in the European
Union and in the United States. Telematics and Informatics. 19 (2), pp. 201-271.
Bauer, K., and Hein, S. E. (2006). The effect of heterogeneous risk on the early
adoption of Internet banking technologies. Journal of Banking & Finances. 30(6), pp.
1713-1725.
Bauer, R. A. (1967). Consumer behavior as risk taking. In Cox, D. F. (Ed.), Risk
taking and information handling in consumer behavior (pp. 23-33). Boston: Harvard
University Press.
Bayus, B. L. (1985). Word-of-mouth: the indirect effects of marketing efforts. Journal
of Advertising Research. 25(June/July), pp. 31-39.
Becker, G. S. (1965). A theory of the allocation of time. The Economic Journal.
75(299), pp. 493-517.
Ben-Akiva, M., and Lerman, S. (1995). Discrete Choice Analysis: Theory and
Application to Travel Demand. Cambridge Massachusetts: The MIT Press.
Berry, L.L., and Kantaka, D. M. (1990). Personal selling in the US banking Industry:
1983 and 1988. The Service Industries Journal. 10(1), pp. 5-24.
Berry, L.L., Seiders, K., and Grewal, D. (2002). Understanding service convenience.
Journal of Marketing. 66(3), pp. 1-17.
Bettman, J. R., and Park, C. W. (1980). Effects of prior knowledge and experience and
phase of the choice process on consumer decision processes: A protocol analysis. The
Journal of Consumer Research. 7(3), pp. 234-248.
135
Black, N. J., Lockett, A., and Ennew, C. (2001). The adoption of internet financial
services: a qualitative study. International Journal of Retail & Distribution
Management. 29(8), pp. 390-398.
Blackwell, R., D‘souza, C., Taghian, M., Miniard, P. and Engel, J. (2006). Consumer
Behaviour: An Asia Pacific Approach. South Melbourne: Thomson.
Block, C., and Roering, K. J. (1976). Essentials of consumer behavior: based on Engel,
Kollat, and Blackwell‘s consumer behavior. The Dryden Press.
Bolfing, C. P. (1989, Spring). How Do Customers Express Dissatisfaction and What
Can Service Marketers Do About It. Journal of Services Marketing. 3(2), PP. 523.
Bose, I., and Leung, A. C. M. (2008). Assessing anti-phishing preparedness: a study
of online banks in Hong Kong. Decision Support Systems. 45(4), pp. 897-912.
Broadbent, M., and Weill, P. (1993). Improving business and information strategy
alignment: Learning from the banking industry. IBM system journal. 32(1), pp.
162-179.
Brown, L.G. (1990). Convenience in services marketing. The Journal of Services
Marketing. 4(1), pp. 53-59.
Brown, T. A. (2006). Confirmatory factor analysis for applied research. New York:
The Guilford Press.
Bruce, D. (2002). Developments in the New Zealand banking industry. The Reserve
Bank of New Zealand. 65(2), pp. 26-37.
Bruyn, A. D., and Lilien, G. L. (2008). A multi-stage model of word-of-mouth
influence through viral marketing. International Journal of Research in Marketing.
25(3), pp. 151-163.
Bryman, A., and Carmer, D. (1999). Quantitative data analysis with SPSS release 8
for Windows: A guide for social scientist. London: Routledge.
Bucklin, L. P. (1966). A theory of distribution channel structure. In Stern, L. W. and
El-Ansary, A. I. Marketing Channels, 4th
Edition. (1992). Prentice-Hall: New Jersey
Bughin, J. (2001). E-push or e-pull? Laggards and first movers in European on-line
banking. Journal of Computer Mediated Communication. 7(1), pp. 1-19.
136
Burnett, J., and Moriarty, S. (1998). Introduction to marketing communication: an
integrated approach. Upper Saddle River, NJ: Prentice Hall.
Cavana, R. Y., Delahaye, B. L., and Sekaran, U. (2001). Applied business research:
qualitative and quantitative methods. Milton Queensland: John Wiley.
Chang, Y. T. (2003). Dynamics of banking technology adoption: An application to
Internet banking. Royal Economic Society Annual Conference 2003. 41. Royal
Economic Society.
Chau, P. Y. K., and Lai, V. S. K. (2003). An empirical investigation of the
determinants of user acceptance of Internet Banking. Journal of Organizational
computing and Electronic Commerce. 13(2), pp. 123-145.
Chaudhuri, A., Flamm, K. S., and Horrigan, J. (2005). An analysis of the determinants
of internet access. Telecommunications Policy. 29(9-10), pp. 731-755.
Centeno, C. (2004). Adoption of Internet services in the Acceding and Candidate
Countries, lessons from the Internet banking case. Telematics and Informatics. 21(4),
pp. 293-315.
Chen, I. J., Gupta, A., and Rom, W. (1994). A study of price and quality in service
operations. International Journal of Service Industry Management. 5(2), pp. 23-34.
Chiemeke, S. C., Evwiekpaefe, A. E., and Chete, F. O. (2006). The adoption of
Internet banking in Nigeria: an empirical investigation. Journal of Internet Banking
and Commerce. 11(3).
Chung, W., and Paynter, J. (2002). An Evaluation of Internet banking in New Zealand.
Proceedings of the 35th Annual Hawaii International Conference on System Sciences.
pp. 2410-2419.
Churchill, G. A. (1979). A paradigm for developing better measures of marketing
constructs. Journal of Marketing Research. 16(1), pp. 64-73.
Clemes, M. D., Gan, C., and Zhang, D. (2010). Customer switching behaviour in the
Chinese retail banking industry. International Journal of Bank Marketing. 28(7), pp.
519-546.
Coakes, S. J., Steed, L., and Price, J. (2008). SPSS version 15.0 for window: Analysis
without anguish. Milton, Queensland: John Wiley & Sons Australia.
137
Colgate, M., and Hedge, R. (2001). An investigation into the switching process in
retail banking services. International Journal of Bank Marketing. 19(4/5), PP.
201-213.
Cooper, D. R. and Schindler, P. S. (2006). Business research methods (9th ed.). New
York: McGraw-Hill Irwin.
Cooper, R. G. (1997). Examining some myths about new products winners. In Katz, R.
(Ed.), The Human Side of Managing Technological Innovation (pp. 55-560). Oxford:
Oxford University Press.
Copeland, M. T. (1923). Relation of consumers‘ buying habits to marketing methods.
Harvard Business Review. 1 (April), pp. 282-289.
Corbitt, B. J., Thanasankit, T., and Yi, H. (2003). Trust and e-commerce: a study of
consumer perceptions. Electronic Commerce Research and Applications. 2(3), pp.
203-215.
Cox, D. F. (1967). Risk handling in consumer behavior-an intensive study of two
cases. In Cox, D. F. (Ed.), Risk taking and information handling in consumer behavior
(pp. 34-81). Boston: Harvard University Press.
Cox, D. F., and Rich, S. U. (1967). Perceived risk and consumer decision making- the
case of telephone shopping. In Cox, D. F. (Ed.), Risk taking and information handling
in consumer behavior (pp. 487-506). Boston: Harvard University Press.
Cunningham, S. M. (1967). The major dimensions of perceived risk. In Cox, D. F.
(Ed.), Risk taking and information handling in consumer behavior (pp. 82-108).
Boston: Harvard University Press.
Cyr, D., Head, M., and Ivanov, A. (2009). Perceived interactivity leading to e-loyalty:
development of a model for cognitive-affective user responses. International Journal
of Human-Computer Studies. 67(10), pp. 850-869.
Dabholkar, P. A., and Sheng, X. J. (2008). Perceived download waiting in using web
sites: a conceptual framework with mediating and moderating effects. Journal of
Marketing Theory and Practice. 16(3), pp. 259-270.
Daniel, E. (1999). Provision of electronic banking in the UK and the Republic of
Ireland. The International Journal of Bank Marketing. 17(2), pp. 72-82.
138
Davis, F. (1989). Perceived usefulness, perceived ease of use, and user acceptance of
information technology. MIS Quarterly. 13(3), pp. 319-340.
Deutshce Bank Research (2010). Online banking and research: The state of play in
2010. E-banking snapshot 35.
Devlin, J. F. (1995). Technology and innovation in retail banking distribution.
International Journal of Bank Marketing. 13(4), pp. 19-26.
Dewberry, C. (2004). Methods for Organizational Research: Theory and practice.
Oxon: Routledge.
Dickerson, M. D., and Gentry, J. W. (1983). Characteristics of adopters and
non-adopters of home computers. Journal of Consumer Research. 10(2), pp. 225-235.
Dielman, T. E. (2001). Applied regression analysis for business and economics (3rd
ed.). Duxbury: Thomson Learning.
Dillman, D. A. (2007). Mail and internet surveys: the tailored design method. New
York: John Wiley and Sons.
Diniz, E. (1998). Web banking in USA. Journal of Internet Banking and Commerce.
3(2). Retrieved 6 August, 2009 from
http://www.arraydev.com/commerce/JIBC/9806-06.htm
Doesburg, A. (2005). Internet opens a world of opportunity. The New Zealand Herald.
Retrieved August 15, 2009 from
http://www.nzherald.co.nz/technology/news/article.cfm?c_id=5&objectid=10344456
Easingwood, C. J., and Storey, C. (1991). Success factors for new consumer financial
services. The International Journal of Bank Marketing. 9(1), pp. 3-10.
Ekelund, R. B., Mixon, F. G., and Ressler, R. W. (1995). Advertising and information:
an empirical study of search, experience, and credence good. Journal of Economic
Studies. 22(2), pp.33-43.
Elleithy, K. (2008). Innovations and advanced techniques in systems, computing
sciences and software engineering. USA: Springer.
Engel, J. F., Blackwell, R., and Miniard, P. W. (1995). Consumer behavior (8th ed.).
Fort Worth: The Dryden Press.
139
Ennew, C. T., and Binks, M. R. (1996). The impact of service quality and service
characteristics on customer retention: Small business and their banks in the UK.
British Journal of Management. 7(3), pp.219-230.
Eriksson, K., and Nilsson, D. (2007). Determinants of the continued use of
self-service technology: The case of internet banking. Technovation. 27(4), pp.
159-167.
Eriksson, K., Kerem, K., and Nilsson, D. (2005). Customer acceptance of internet
banking in Estonia. The International Journal of Bank Marketing. 23(2/3), pp.
200-216.
Fan, Q. (2005). Regulatory factors influencing internet access in Australia and China:
a comparative analysis. Telecommunications Policy. 29(2-3), pp. 191-203.
Featherman, M. S., and Pavlou, P. A. (2003). Predicting e-services adoption: a
perceived risk facets perspective. International Journal of Human-Computer Studies.
59(4), pp. 451-474.
Field, A. (2000). Discovering statistics using SPSS for windows: advanced techniques
for beginners. London: SAGE Publications Ltd.
File, K. M., and Prince, R. A. (1992). Positive word-of-mouth: customer satisfaction
and buyer behaviour. The International Journal of Bank Marketing. 10(1), pp. 25-30.
Flavián, C., Guinalíu, M., and Gurrea, R. (2006). The influence of familiarity and
usability on loyalty to online journalistic services: The role of user experience.
Journal of Retailing and Consumer Services. 13 (5), pp. 363-375.
Forsythe, S. M., and Shi, B. (2003). Consumer patronage and risk perceptions in
Internet shopping. Journal of Business Research. 56(11), PP. 867-875.
Freedman, D. A. (2005). Statistical models: theory and practice. New York:
Cambridge University Press.
Frust, K., Lang, W. W., and Nolle, D. E. (2000). Internet banking: Developments and
Prospects. Economic and Policy Analysis Working Paper 2000-9. September 2000.
Gan, C., Clemes, M., Limsombunchai, V., and Weng, A. (2006). A logit analysis of
electronic banking in New Zealand. The International Journal of Bank Marketing.
24(6), pp. 360-383.
140
GAO. (2001). Characteristics and choices of Internet users. Washington, DC: United
States General Accounting Office.
Gao, P., and Owolabi, O. (2008). Consumer adoption of internet banking in Nigeria.
International Journal of Electronic Finance. 2(3), pp. 284-299.
Garrow, L. A. (2010). Discrete choice modelling and air travel demand: theory and
applications. England: Ashgate Publishing Limited.
Garson, G. D. (2010, December 12). “logistic regression”, from Statnotes: Topics in
multivariate analysis. Retrieved from March 6, 2011 from
http://faculty.chass.ncsu.edu/garson/PA765/logistic.htm
Garson, G. D. (2011, March 3). “Factor analysis”, from Statnotes: Topics in
Multivariate Analysis. Retrieved March 6, 2011 from
http://faculty.chass.ncsu.edu/garson/PA765/factor.htm
Gerrard, P., and Cunningham, J. B. (2003). The diffusion of internet banking among
Singapore consumers. International Journal of Bank Marketing. 21(1), pp. 16-28.
Gerrard, P., Cunningham, J. B., and Devlin, J. F. (2006). Why consumers not using
internet banking: a qualitative study. Journal of Services Marketing. 20(3), pp.
160-168.
Giannakoudi, S. (1999). Internet banking : the digital voyage of banking and money
in cyberspace. Information and Communications Technology Law. 8(3), pp. 205-243.
Globerson, S., and Maggard, M. J. (1991). A conceptual model of self-service.
International Journal of Operations & Product Management. 11(4), pp.33-43.
Gounaris, S., and Koritos, C. (2008). Investigating the drivers of internet banking
adoption decision: A comparison of three alternative frameworks.The International
Journal of Bank Marketing. 26(5), pp. 282-304.
Graeff, T. R. (1996). Using promotional messages to manage the effects of brand and
self-image on brand evaluations. Journal of Consumer Marketing. 13(3), pp.4-18.
Greene, W. H. (2003). Econometric Analysis (5th ed.). New Jersey: Prentice-Hall
Greenhaum, T. L. (1998). The handbook for focus group research (2nd ed.). London:
Sage.
141
Guru, B. K., Vaithilingam, S., Ismail, N., and Prasad, R. (2000). Electronic Banking in
Malaysia: A note on evolution of services and consumer reactions. Journal of Internet
Banking and Commerce. 5(1). Retrieved June 11, 2009 from
http://www.arraydev.com/commerce/jibc/0001-07.htm
Guseman, D. S. (1981). Risk perception and risk reduction in consumer services. In
Donnelly, J. H., and George, W. R. (Eds), Marketing of Service (pp. 200-204).
Proceeding Series. Chicago, III: American Marketing Association.
Hair, J. F., Black, W. C., Babin, B. J., and Anderson, R. E. (2010). Multivariate data
analysis. (7th ed.). Upper Saddle River, NJ: Prentice Hall.
Hair, J. F., Bush, R. P., and Ortinau, D. J. (2003). Marketing research: A practical
approach for the new millennium. Boston, McGraw-Hill.
Herr, P. M., Kardes, F. R., and Kim, J. (1991). Effects of word-of-mouth and product
attribute information on persuasion: An accessibility-diagnosticity perspective.
Journal of consumer Research. 17(4), pp. 454-462.
Hernandez-Ortega, B, Jimenez-Martinez, J., and Hoyos, M. J. M. (2007). An analysis
of web navigability in Spanish internet banking. Journal of Internet Banking and
Commerce. 12(3), pp. 1-8.
Hernando, I., and Nieto, M. J. (2007). Is the internet delivery channel changing banks‘
performance? The Case of Spanish Banks. Journal of Banking and Finance. 31(4), pp.
1083-1099.
Hiller, M. (2003). The role of cultural context in multilingual website usability.
Electronic Commerce Research and Applications. 2(1), pp. 2-14.
Howard, J. (1977). Consumer behavior: application of theory. New York:
McGraw-Hill.
Howcroft, B., Hewer, P., and Durkin, M. (2003). Banker-Customer interactions in
financial services. Journal of Marketing Management. 19(9/10), pp. 1001-1020.
Hu, P. J., Chau, P. Y. K., Sheng, O. R. L., and Tam, K. Y. (1999). Examining the
technology acceptance model using physical acceptance of telemedicine technology.
Journal of Management Information System. 16(2), pp. 91-112.
Huizingh, E. K. R. E. (2000). The content and design of web sites: an empirical study.
Information & Management. 37(3), pp. 123-134.

142
Ida, T. (2009). Broadband economics: lessons from Japan. New York: Routledge.
Im, I. I., Kim, Y., and Han, H. J. (2008). The effect of perceived risk and technology
type on users‘ acceptance of technologies. Information & Management. 45(1), pp. 1-9.
Introna, L., and Whittaker, L. (2005). Power, cash and convenience: the political
space of the ATM. Working Paper. The Department of Organisation, Work and
Technology, Lancaster University. (Unpublished).
Jacoby, J., and Kaplan, L. B. (1972). The components of perceived risk. Proceedings
of the Third Annual Conference for Consumer Research, Association for Consumer
Research (pp. 382-393)
Jaruwachirathanakul, B., and Fink, D. (2005). Internet banking adoption strategies for
a developing country: the case of Thailand. Internet Research. 15(3), pp. 295-311.
Jayawardhena, C., and Foley, P. (2000). Changes in the banking sector – the case of
internet banking in the UK. Internet Research. 10(1), pp. 19-30.
Javalgi, R. G., Armaco, R. L., and Hoseini, J. C. (1989). Using the analytical
hierarchy process for bank management: analysis of consumer selection decisions.
Journal of Business Research. 19(1), pp. 33-49.
Johnson, E. J., and Russo, J. E. (1984). Product familiarity and learning new
information. The Journal of Consumer Research. 11(1), pp. 542-550.
Jolson, M. A., and Bushman, F. A. (1978). Third-party consumer information systems:
the case of the food critic. Journal of Retailing. 54(4), pp. 63-79.
Judge, G. G., Hill, R. C., Griffiths, W. E., and Lee, T. C. (1982). Introduction to the
theory and practice of econometrics. New York: John Wiley & Sons.
Jun, M., and Cai, S. (2001). The key determinants of internet banking service quality:
a content analysis. The International Journal of Bank Marketing. 19(7), pp. 276-291.
Kaiser, H. R. and Rice, J. (1974). Little jiffy, mark IV. Educational and Psychological
Measurement. 34(1), pp.111-117.
Karjaluoto, H., Mattlia, M., and Pento, T. (1999). Electronic banking in Finland:
Consumer beliefs and reactions to a new delivery channel. Journal of Financial
Service Marketing. 6(4), PP. 346-361.
143
Karjaluoto, H. Mattila, M., and Pento, T. (2002). Consumer beliefs and reactions to a
new delivery channel. Journal of Financial Services Marketing. 6(4), pp.346-361.
Kasper, H., Helsdingen, P. V., and Vries, W. D. (1999). Service marketing
management: an international perspective. New York: John Wiley & Sons.
Kerem, K. (2003). Internet banking in Estonia, Case study for the Estonian
e-readiness project. PRAXIS Center for Policy Studies, Tallin, Forthcoming.
Khan, S. (2007) . Adoption issues of internet banking in Pakistani‘s firms. Essay from
Luleå University of Technology, Master Thesis, Continuation Course, Computer and
Systems Science, Department of Business Administration and Social Science,
Division of Information Systems Sciences. 2007: 009 – ISSN: 1653-0187 – ISRN:
LTU-PB-EX--07/009—SE
Kim, B. M., Widdows, R., and Yilmazer, T. (2005). The Determinants of Consumers‘
Adoption of Internet Banking. Retrieved 20 June, 2009 from
http://www.bos.frb.org/news/conf/payments2005/yilmazer.pdf.
Kim, D. J., Ferrin, D. L., and Rao, H. R. (2008). A trust-base consumer
decision-making model in electronic commerce: the role of trust, perceived risk and
their antecedents. Decision Support Systems. 44(2), pp. 544-564.
Kim, K., and Prabhakar, B. (2000). Initial trust, perceived risk, and the adoption of
internet banking. Proceeding of the 21st International Conference on Information
Systems (pp. 537-543). Brisbane, Australia: International Conference on Information
Systems.
Kleijnen, M., Ruyter, K. D. and Andreassen, T. W. (2005). Image Congruence and the
adoption of service innovations. Journal of Service Research. 7(4), pp. 343-359.
Kogan, N., and Wallach, M. A. (1964). Risk taking. New York: Holt, Rinehart and
Winston.
Kotler, P. (1982). Marketing for nonprofit organizations (2nd ed.). Englewood Cliffs,
NJ: Prentice-Hall Inc.
Kuisma, T., Laukkanen, T., and Hiltunen, M. (2007). Mapping the reasons for
resistance to Internet banking: a means-end approach. International Journal of
Information Management. 27(2), pp. 75-85.
144
Lallmahamood, M. (2007). An examination of individual‘s perceived security and
privacy of the internet in Malaysia and the influence of this on their intention to use
E-Commerce: Using an extension of the technology acceptance model. Journal of
Internet Banking and Commerce. 12(3), pp. 1-26.
Laskey, H. A., Seaton, B., and Nicholls, J. A. F. (1992). Strategy and Structure in
Bank Advertising: An empirical Test. The International Journal of Bank Marketing.
10(3), pp. 3-7.
Lassar, W. M., Manolis, C., and Lassar, S. S. (2005). The relationship between
consumer innovativeness, personal characteristics, and online banking adoption. The
International Journal of Bank Marketing. 23(2/3), pp. 176-199.
Laukkanen, T., Sinkkonen, S., and Laukkanen, P. (2009). Communication strategies to
overcome functional and psychological resistance to Internet banking. International
Journal of Information Management. 29(2), pp. 111-118.
Lee, E. J., and Lee, J. (2001). Consumer adoption of Internet banking: need-based
and/or skill based? The Marketing Management Journal. 11(1), pp. 101-113.
Lee, E. J., Kwon, K. N., and Schumann, D. W. (2005). Segmenting the non-adopter
category in the diffusion of Internet banking. The International Journal of Bank
Marketing. 23(5), pp. 414-437.
Lee, M. C. (2009). Factors influencing the adoption of internet banking: an integration
of TAM and TPB with perceived risk and perceived benefit. Electronic Commerce
Research and Applications. 8(3), pp. 130-141.
Lewis, R. C. (1981). Marketing for full service restaurant- an analysis of demographic
and benefit segmentation, in Donnelly, J. H. and George, W, R. (1981). Marketing of
service. Processing Series. American Marketing Association.
Liao, T. F. (1994). Interpreting probability models: logit, probit, and other generalized
linear models. California: Sage Publications Inc.
Liao, Z., and Cheung, M. T. (2002). Internet-based e-banking and consumer attitudes:
an empirical study. International Journal of Information Management. 19(1), pp.
63-74.
Lichtenstein, S., and Williamson, K. (2006). Understanding consumer adoption of
internet banking: an interpretive study in the Australian banking context. Journal of
Electronic Commerce Research. 7(2), pp. 50-66.
145
Lim, N. (2003). Consumers‘ perceived risk: sources versus consequences. Electronic
Commerce Research and Applications. 2(3), pp. 216-228.
Littler, D., and Melanthiou, D. (2006). Consumer perceptions of risk and uncertainty
and the implications for behaviour towards innovative retail services: the case of
Internet banking. Journal of Retailing and Consumer Services. 13(6), pp. 431-443.
Llevwellyn, D. T. (1997). Banking in the 21st century: the transformation of an
industry. Bulletin Economic and Finance. 11(49), pp. 5-27.
Lockett, A., and Litter, D. (1997). The adoption of direct banking services. Journal of
Marketing Management. 13(8), pp.791-811.
Lopez-Nicolas, C., and Molina-Castillo, F. J. (2008). Customer knowledge
Management and E-commerce: the role of customer perceived risk. International
Journal of Information Management. 28(2), pp. 102-113.
Loudon, D. L., and Della Bitta, A. J. (1993). Consumer Behavior: Concepts and
Applications (4th ed.). McGraw-Hill, New York, NY.
Lovelock, C.H., Patterson, P. G. and Walker, R. H. (1998). Services marketing:
Australia and New Zealand. NSW: Prentice Hall.
Luhmann, N. (1988). Familiarity, confidence, trust: problems and alternatives. In:
Gambetta, D. G. (Ed.), Trust (pp. 94-107). New York: Basil Blackwell.
Lutz, R., and Reilly, P. (1973). An exploration of the effects of perceived social and
performance risk on consumer information acquisition. Advances in Consumer
Research. 1, pp. 393-405.
Luyt, B. (2006). Internet access in libraries: A comparison of press coverage between
Canada and Singapore. The International Information & Library Review. 38(4), pp.
205-214.
Maddala, G. S. (2001). Introduction to econometrics (3rd ed.). West Sussex: John
Wiley & Sons.
Mäenpää, K., Kale, S. H., Kuusela, H., and Mesiranta, N. (2008). Consumer
perceptions of Internet banking in Finland: The moderating role of familiarity. Journal
of Retailing and Consumer Services. 15(4), pp. 266-276.
146
Makki, S., Pissinou, N., and Daroux, P. (2003). Mobile and wireless Internet access.
Computer Communications. 26(7), pp. 734-746.
Mandel, N., and Johnson, E. (1999). Constructing preferences on-line: can web pages
change what you want? Working Paper. Wharton School, University of Pennsylvania.
Mattila, M., Kajaluoto, H., and Pento, T. (2003). Internet banking among mature
customers: early majority or laggards? Journal of Services Marketing. 17(5), pp.
514-528.
Mavri, M., and Ioannou, G. (2006). Consumers‘ perspectives on online banking
services. International Journal of Consumer Studies. 30(6), pp. 552-560.
McCarthy, L. J. (2000). Consumer Resistance to Internet Banking. Unpublished
Master Thesis, University of Otago, Dunedin, New Zealand.
Mendenhall, W., Reinmuth, J. E. and Beaver, R. (1993). Statistics for management
and economics (7th ed.). Belmont, CA: Duxbury Press.
Meyers, L. S., Gamst, G., and Guarino, A. J. (2006). Applied multivariate research:
design and interpretation. Thousand Oaks, California: Sage Publications Inc.
Mill, R. C. (2007). Restaurant management: Customers, operations, and employees
(3rd ed.). Upper Saddle River, NJ: Pearson Prentice Hall.
Miller, J. R., and Hay, M. J. (1981). Determinants of hunter participation: Duck
hunting in the Mississippi Flyway. American Journal of Agricultural Economics.
63(4), pp.677-684.
Mitchell, V. W. (1999). Consumer perceived risk: conceptualisations and models.
European Journal of Marketing. 33(1/2), pp. 163-195.
Miyazaki, A. D., and Fernandez, A. (2001). Consumer perceptions of privacy and
security risks for online shopping. Journal of Consumer Affairs. 35(1), pp. 27-44.
Mohr, L. A., and Bitner, M. J. (1995). The role of employee effort in satisfaction with
service transactions. Journal of Business Research. 32(3), pp. 239-252.
Mols, N. P., Bukh, P. N. D., and Nielsen, J. F. (1999). Distribution channel strategies
in Danish retail banking. International Journal of Retail & Distribution Management.
27(1), pp. 37-47.
147
Morgan, D. L. (1998). Focus groups as qualitative research. London: Sage.
Mukherjee, A., and Nath, P. (2003). A model trust in online relationship banking. The
International Journal of Bank Marketing. 21(1), pp.5-15.
Murray, K. B. (1991, January). A test of services marketing theory: consumer
information acquisition activities. Journal of marketing. 55(1), pp10-25.
Murray, K. B., and Schlacter, J. L. (1990). The impact of services versus goods on
consumers‘ assessment of perceived risk and variability. Journal of the Academy of
Marketing Science. 18(1), pp. 51-65.
Nantel, J., and Glaser, E. (2008). The impact of language and culture on perceived
website usability. Journal of Engineering and Technology Management. 25(1/2), pp.
112-122.
Neal, C., Quester, P., and Hawkins, D. (2004). Consumer behaviour: implications for
marketing strategy (4th ed.). North Ryde, NSW: McGraw-Hill.
Nielsen. (2008). Two-thirds of online kiwis now use Internet Banking. Retrieved 18
June, 2009 from http://nz.nielsen.com/news/CFM_Feb08.shtml
Norusis, M. J. (1994). SPSS 6.1 base system user’s guide: Part 2. Chicage, IL: SPSS.
Novak, T. P., Hoffman, D. L., and Yung, Y. F. (2000). Measuring the customer
experience in online environments: a structural modeling approach. Marketing
Science. 19(1), pp. 22-42.
O‘Cass, A., and Fenech, T. (2003). Web retailing adoption: exploring the nature of
internet users‘ Web retailing behaviour. Journal of Retailing and Consumer Services.
10(2), pp. 81-94.
O‘Connell, B. (1996). Australian banking on the Internet-factor or fiction? The
Australian Banker, (December), pp. 212-214
O‘Connell, B. (2002). Kiwibank: off and racing: New Zealand‘s recently established
Kiwibank is a bold move aimed at filling a perceived market void: a bank committed
to public ownership, community needs and low cost services. (On The Cutting Edge).
Journal of Banking and Financial Services. 16(3), pp.14.
Owusu-Frimpong, N. (1999). Patronage behaviour of Ghanaian bank customers. The
International Journal of Bank Marketing. 17(7), pp. 335-342.
148
Oyelaran-Oyeyinka, B., and Adeya, C. N. (2004). Internet access in Africa: empirical
evidence from Kenya and Nigeria. Telematics and Informatics. 21 (1), pp. 67-81.
Padachi, K., Rojid, S., and Seetanah, B. (2007). Analyzing the factors that influence
the adoption of internet banking in Mauritius. Paper presented at the Proceedings of
the 2007 Computer Science and IT Education Conference.
Page, C. and Luding, Y. (2003). Bank managers‘ direct marketing dilemmas-
customers‘ attitudes and purchase intention. The International Journal of Bank
Marketing. 21(2/3), pp. 147-163.
Palmer, J. W. (2002). Web site usability, design, and performance metrics. Information
Systems Research. 13(2), pp. 151-167.
Papagiannidis, S., Berry, J., and Li, F. (2006). Well beyond streaming video: Ipv6 and
the next generation television. Technological Forecasting & Social Chang. 73(5), pp.
510-523.
Park, J., and Stoel, L. (2005). Effect of brand familiarity, experience and information
on online apparel purchase. International Journal of Retail & Distribution
Management. 33(2), pp. 148-160.
Park, W., and Lessig, V. P. (1981). Familiarity and its impact on consumer decision
biases and heuristics. The Journal of Consumer Research. 8(2), pp. 223-231.
Pavlou, P. A. (2003). Consumer Acceptance of Electronic Commerce: Integrating
Trust and Risk with the Technology Acceptance Model. International Journal of
Electronic Commerce. 7(3), pp. 101-134.
Pechtl, H. (2003). Adoption of online shopping by German grocery shoppers.
International Review of Retail. Distribution & Consumer Research. 13(2), pp.
145-160.
Pindyck, R. S., and Rubinfeld, D. L. (1997). Econometric models and economic
forecasts (4th ed.). New York: McGraw-Hill.
Podder, B. (2005). Factors influencing the adoption and usage of Internet banking: A
New Zealand perspective. Published master‘s thesis, Auckland University of
Technology, Auckland, New Zealand.
Polasik, M., and Wisniewski, T. P. (2009). Empirical analysis of internet banking
adoption in Poland. The International Journal of Bank Marketing. 27(1), pp. 32-52.
149
Polatoglu, V. N., and Ekin, S. (2001). An empirical investigation of the Turkish
consumers‘ acceptance of Internet banking services. The International Journal of
Bank Marketing. 19(4/5), pp. 156-165.
Power of Self-Image Psychology. The American Salesman (1996). 41(8), pp. 3-7.
Burlington: National Rsearch Bureau.
Prasad, C., and Arumbaka, V. K. (2009). Consumer as co-creator of value: crossing
the technology hurdle. National Seminar on ―creating and delivering value for
customers‖. School of Management Studies. Cochin University of Science and
Technology.
Punj, G. N., and Staelin, R. (1983). A model of consumer information search behavior
for new automobiles. The Journal of Consumer Research. 9(4), pp. 366-380.
Ramanathan, R. (1992). Introductory econometrics with applications (2nd ed.).
London: Fort Worth.
Ramsaran, C. (2003). Online banking comes of age. Bank Systems & Technology.
40(11), pp. 2-30.
Rashid, M. A., and AI-Qirim, N. A. (2001). E-Commerce technology adoption
framework by New Zealand small to medium size enterprises. Research Letters
Information Mathematical Science. 2(1), pp. 63-70.
Rayport, J. F., and Sviokla, J. J. (1994) Managing in the marketspace. Harvard
Business Review. November-December, pp. 141-150.
Ren, F., and Kwan, Mei-Po. (2008). The impact of the Internet on human
activity–travel patterns: analysis of gender differences using multi-group structural
equation models. Journal of Transport Geography. 17(6), pp.440-450.
Rodgers, W., Negash, S., and Suk, K. (2005). The moderating effect of on-line
experience on the antecedents and consequences of on-line satisfaction. Psychology &
Marketing. 22(4), pp. 313-331.
Rogers, E. M., and Shoemaker, F. (1971). Communications of Innovations: a
cross-cultural approach (2nd ed.). New York: Free Press.
Rose, G. M., Evaristo, R., and Straub, D. (2003). Culture and consumer responses to
web download time: a four-continent study of mono and Polychromism. IEEE
Transactions on Engineering Management. 50(1), pp. 31-44.
150
Rose, P. E., and Hudgins, S. C. (2008). Bank management & Financial services (7th
ed.). New York: McGraw Hill.
Roselius, T. (1971). Consumer ranking of risk reduction methods. Journal of
Marketing. 35(1), pp. 56-61.
Rossiter, J. R., and Percy, L. (1987). Advertising and Promotion Management. New
York: McGraw Hill.
Rotchanakitmnuai, S., and Speece, M. (2003). Barriers to Internet banking adoption: a
qualitative study among corporate customers in Thailand. The International Journal
of Bank Marketing. 21(6/7), pp. 312-323.
Rothwell, R., and Gardiner, P. (1984). Design and competition in engineering. Long
Range Planning. 7(3), pp. 78-91.
Sathye, M. (1999). Adoption of internet banking by Australian consumers: an
empirical investigation. The international Journal of Bank Marketing. 17(7), pp.
324-334.
Savage, S., and Waldman, D. (2005). Broadband Internet access, awareness, and use:
Analysis of United States household data. Telecommunications Policy. 29(8), pp.
615-633.
Sayar, C., and Wolfe, S. (2007). Internet banking market performance: Turkey versus
the UK. The International journal of Bank Marketing. 25(3), pp. 122-141.
Schall, M. (2003). Best practice in the assessment of hotel-guest attitudes. Cornell
Hotel and Restaurant Administration Quarterly. 44(2), pp. 51-65.
Schiffman, L.G., and Kanuk, L. L. (1997). Consumer behaviour (6th ed.). Upper
Saddle River, NJ: Prentice Hall.
Sellar, C., Chavas, J. P., and Stoll, J. R. (1982), Specification of the logit model: The
case of valuation of nonmarket goods. Natural resources working paper services,
TA-18178. Natural resources workgoup. Department of Agricultural Economics,
Texas A & M University.
Sekaran, U. (2003). Research methods for business: A skill building approach (4th
ed.). New York: John Wiley & Sons.
151
Shapiro, J. (1999). Innovation in financial services case study: Home banking.
Massachusetts Institute of Technology, MIT IPC Working Paper 99-004, March 1999.
Sharp, D. (2002, October 26). Developing your self image. New Strait times, pp.6.
Shih, H. P. (2004). An empirical study on predicting user acceptance of e-shopping on
the Web. Information and Management. 41(3), pp. 351-368.
Sim, L. L., and Koi, S. M. (2002). Singapore‘s Internet shoppers and their impact on
traditional shopping patterns. Journal of Retailing and Consumer Services. 9(2), pp.
115-124.
Sportelli, L. (2008). Our Self-Image in 2008. Dynamic Chiropractic. 26(2), pp.29-37.
Srinivasan, S. S., Anderson, R., and Ponnavolu, K. (2002). Customer loyalty in
e-commerce: an exploration of its antecedents and consequences. Journal of Retailing,
78(1). pp, 41-50.
Stamoulis, D. S. (2000). How banks fit in an internet commerce business activities
model. Journal of Internet Banking and Commerce. 5(1). Retrieved 6 August, 2010
from
http://www.arraydev.com/commerce/JIBC/0001-03.htm
Statistics New Zealand. (2008). Internet Service Providers Survey: August 2008.
Retrieved 16 August, 2009 from
http://www.stats.govt.nz/browse_for_stats/industry_sectors/information_technology_a
nd_communications/InternetServiceProviderSurvey_HOTPMar08.aspx
Stavins, J. (2001). Effect of consumer characteristics on the use of payment
instrument. New England Economics Review. 3, pp. 19-31.
Stewart, D. W. (1981). The application and misapplication of factor analysis in
marketing research. Journal of Marketing Research. 18(1), pp. 51-62.
Straub, D., Limayem, M., and Karahanna-Evaristo, E. (1995). Measuring system
usage: implications for IS theory and testing. Management Science. 41(8), pp.
1328-1342.
Stynes, D, J., and Peterson, G. L. (1984). A review of logit models with implications
for modeling recreation choices. Journal of Leisure Research. 16(4), pp.295-310.
152
Sohail, M. S., and Shanmugham, B. (2003). E-banking and customer preferences in
Malaysia: An empirical investigation. Information Sciences. 150(3-4), pp. 207-217.
Suganthi, Balachandher and Balachandran. (2001). Internet Banking Patronage: An
Empirical Investigation of Malaysia. Journal of Internet Banking and Commerce. 6(1).
Available at: http://www.arraydev.com/commerce/JIBC/0103_01.htm
Suki, N. M. (2010). An empirical study of factors affecting the internet banking
adoption among Malaysian consumers. Journal of Internet Banking and Commerce.
15(2), pp. 2-11.
Taylor, K. (2002). Bank customers logging on. The New Zealand Herald.
Retrieved
June 15, 2009 from
http://www.nzherald.co.nz/technology/news/article.cfm?c_id=5&objectid=1291883
Tan, M., and Teo, T. (2000). Factors influencing the adoption of Internet Banking.
Journal of the Association for Information System. 1(5), pp.1-42.
Telecome dial-up. Retrieved 12 August 12, 2009
from http://www.telecom.co.nz/broadband/alternate
Telstraclear. Plans. Retrieved 12 August, 2009 from
http://www.telstraclear.co.nz/residential/inhome/internet/cable-broadband/plans.cfm
Thompson, B. (2004). Exploratory and confirmatory factor analysis: understanding
concepts and applications. Washington, DC: American Psychological Association.
Thornton, J., and White, L. (2001). Customer orientations and usage of financial
distribution channels. The Journal of Service Marketing. 15(3), pp. 168-185.
Train, K. (1993). Qualitative choice analysis: Theory, econometrics, and an
application to automobile demand (3rd ed.). Cambridge: MIT press.
Voli, P. K. (1998). The convenience orientation of services consumers: an empirical
examination. Published doctoral dissertation. Old Dominion University, Virginia,
United States of American.
Waite, K., and Harrison, T. (2004). Online banking information: what we want and
what we get. Qualitative Market Research. 7(1), pp. 67-79.
Wallis Report. (1997). The Financial System Inquiry Final Report (chairman: Mr.
Stan Wallis), AGPS, Canberra.
153
Wan, W. W. N., Luk, C. C., and Chow, C. W. C. (2005). Customers‘ adoption of
banking channels in Hong Kong. The International Journal of Bank Marketing.
23(2/3), pp. 255-272.
Wang, Y. S., Wang, Y. M., Lin, H. H., and Tang, T. I. (2003). Determinants of user
acceptance of Internet banking: An empirical study. International Journal of Service
Industry Management. 14(5), pp. 501-519.
Ward, M. R., and Lee, M. J. (2000). Internet shopping, consumer search and product
branding. Journal of Product and Brand Management. 9(1), pp. 6-20.
Weng, Y. Y. (2005). An empirical investigation of consumers’ choice of banking
channels. Unpublished master‘s thesis, Lincoln University, Lincoln, New Zealand.
Whyte, J., and William, H. (1954). The web of Word of Mouth. Fortune.
50(November), pp. 140-143.
Wigand, R. T. (1997). Electronic Commerce: Definition, Theory, and Context. The
Information Society. 13(1), pp. 1-16.
Willis, K., Dickens, R., and Tripe, D. (2006) Banking in New Zealand (4th ed).
Published by New Zealand Bankers‘ Association. Retrieved 12 July, 2009 from
http://www.nzba.org.nz/pdfs/Banking%20in%20NZ-06-final.pdf
Yang, Z., Cai, S. H., and Zhou, N. (2005). Development and validation of an
instrument to measure user perceived service quality of information presenting Web
portals. Information & Management. 42(4), pp.575-589.
Yiu, C. S., Grant, K., and Degar., D. (2007). Factors affecting the adoption of Internet
banking in Hong Kong-implications for the banking sector. International Journal of
Information Management. 27(5). PP. 330-351.
Yu, C.S., and Lo, Y. F. (2007). Factors encouraging people to adopt online banking
and discouraging adopters to use online banking services. Proceeding of Business and
Information. Tokyo, Japan: International Conference on Business and Information.
Zeithaml, V. A., and Bitner, M. J. (1996). Services marketing. New York:
McGraw-Hill.
Zeithaml, V. A. (1981). How consumer evaluation processes differ between goods and
services. In Donnelly, J. H., and George, W. R. (Eds), Marketing of Service (pp.
186-190). Proceeding Series. Chicago, III: American Marketing Association.

154
Zeithaml, V. A. (1998). Customer perceptions of price, quality and value: a means-end
model and synthesis of evidence. Journal of Marketing. 52(July), pp. 2-22.
Zhang, P., and Dran, G. M. V. (2002). User expectations and ranking of quality factors
in different web site domains. International Journal of Electronic Commerce. 6(2), pp.
9-33.
Zwass, V. (1996). Electronic Commerce: Structures and Issues. International journal
of Electronic Commerce. 1(1), pp. 3-23.
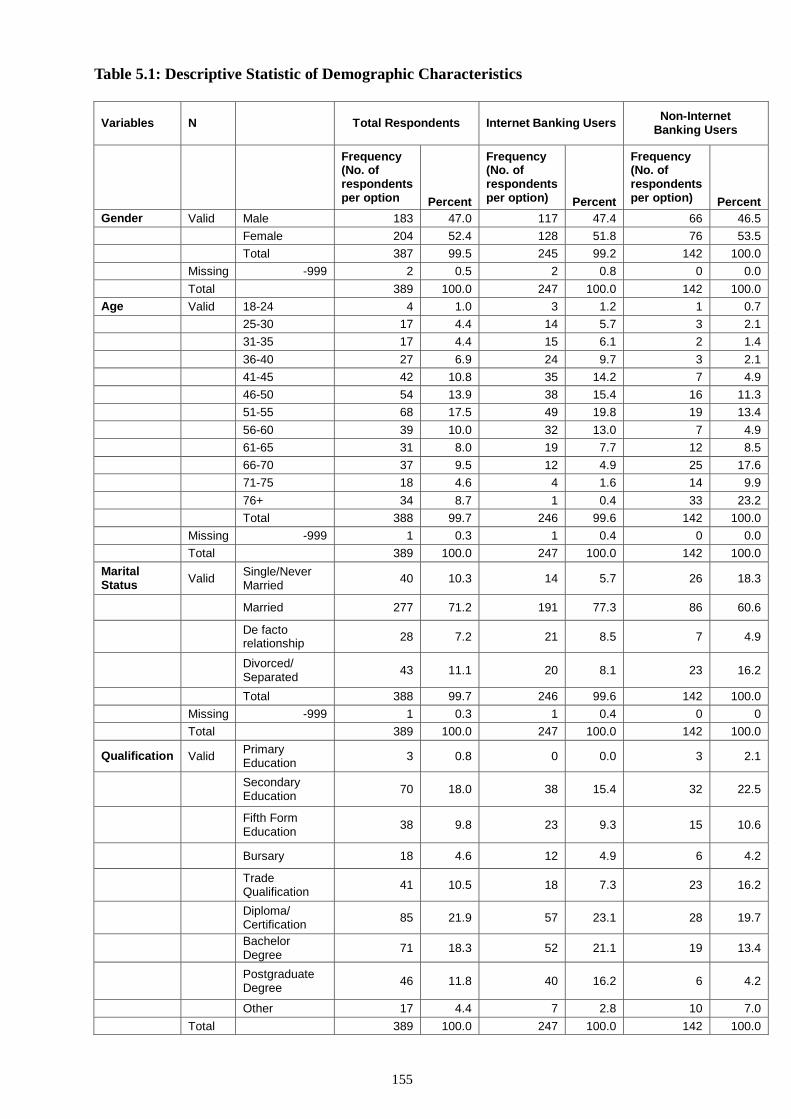
155
Table 5.1: Descriptive Statistic of Demographic Characteristics
Variables N Total Respondents Internet Banking Users Non-Internet
Banking Users
Frequency (No. of respondents per option Percent
Frequency (No. of respondents per option) Percent
Frequency (No. of respondents per option) Percent
Gender Valid Male 183 47.0 117 47.4 66 46.5
Female 204 52.4 128 51.8 76 53.5
Total 387 99.5 245 99.2 142 100.0
Missing -999 2 0.5 2 0.8 0 0.0
Total 389 100.0 247 100.0 142 100.0
Age Valid 18-24 4 1.0 3 1.2 1 0.7
25-30 17 4.4 14 5.7 3 2.1
31-35 17 4.4 15 6.1 2 1.4
36-40 27 6.9 24 9.7 3 2.1
41-45 42 10.8 35 14.2 7 4.9
46-50 54 13.9 38 15.4 16 11.3
51-55 68 17.5 49 19.8 19 13.4
56-60 39 10.0 32 13.0 7 4.9
61-65 31 8.0 19 7.7 12 8.5
66-70 37 9.5 12 4.9 25 17.6
71-75 18 4.6 4 1.6 14 9.9
76+ 34 8.7 1 0.4 33 23.2
Total 388 99.7 246 99.6 142 100.0
Missing -999 1 0.3 1 0.4 0 0.0
Total 389 100.0 247 100.0 142 100.0
Marital Status
Valid Single/Never Married
40 10.3 14 5.7 26 18.3
Married 277 71.2 191 77.3 86 60.6
De facto relationship
28 7.2 21 8.5 7 4.9
Divorced/ Separated
43 11.1 20 8.1 23 16.2
Total 388 99.7 246 99.6 142 100.0
Missing -999 1 0.3 1 0.4 0 0
Total 389 100.0 247 100.0 142 100.0
Qualification Valid Primary Education
3 0.8 0 0.0 3 2.1
Secondary Education
70 18.0 38 15.4 32 22.5
Fifth Form Education
38 9.8 23 9.3 15 10.6
Bursary 18 4.6 12 4.9 6 4.2
Trade Qualification
41 10.5 18 7.3 23 16.2
Diploma/ Certification
85 21.9 57 23.1 28 19.7
Bachelor Degree
71 18.3 52 21.1 19 13.4
Postgraduate Degree
46 11.8 40 16.2 6 4.2
Other 17 4.4 7 2.8 10 7.0
Total 389 100.0 247 100.0 142 100.0
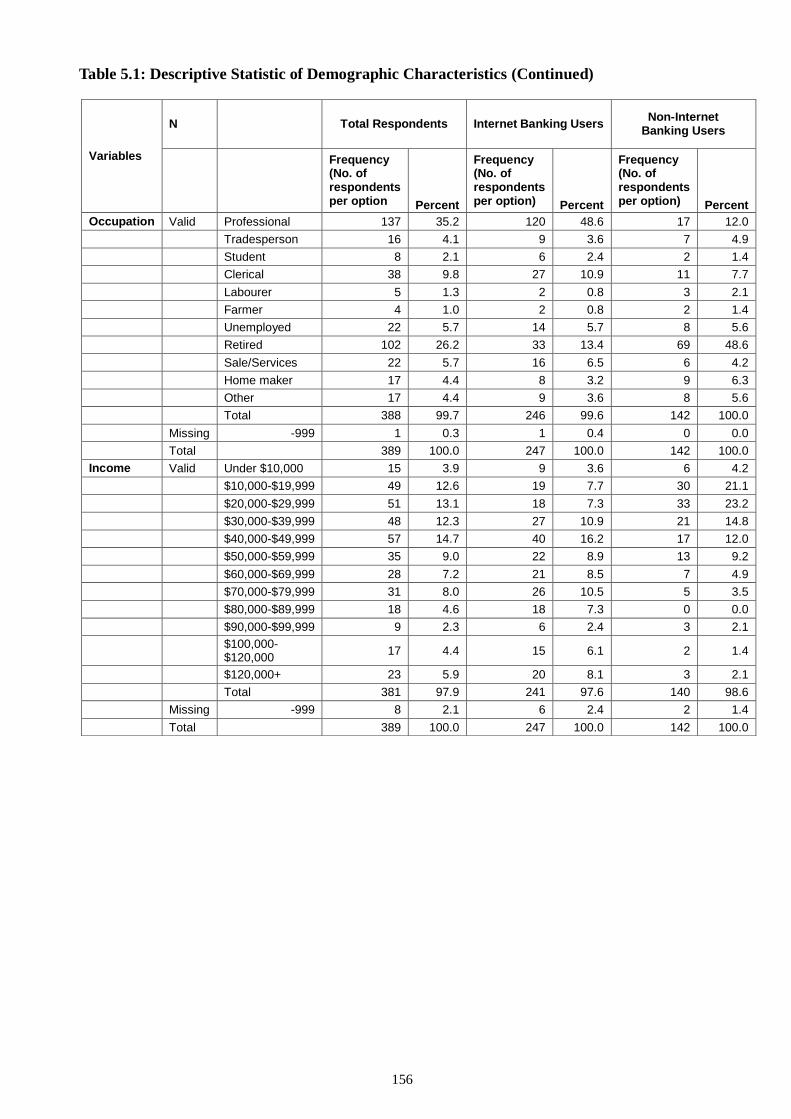
156
Table 5.1: Descriptive Statistic of Demographic Characteristics (Continued)
Variables
N Total Respondents Internet Banking Users Non-Internet
Banking Users
Frequency (No. of respondents per option Percent
Frequency (No. of respondents per option) Percent
Frequency (No. of respondents per option) Percent
Occupation Valid Professional 137 35.2 120 48.6 17 12.0
Tradesperson 16 4.1 9 3.6 7 4.9
Student 8 2.1 6 2.4 2 1.4
Clerical 38 9.8 27 10.9 11 7.7
Labourer 5 1.3 2 0.8 3 2.1
Farmer 4 1.0 2 0.8 2 1.4
Unemployed 22 5.7 14 5.7 8 5.6
Retired 102 26.2 33 13.4 69 48.6
Sale/Services 22 5.7 16 6.5 6 4.2
Home maker 17 4.4 8 3.2 9 6.3
Other 17 4.4 9 3.6 8 5.6
Total 388 99.7 246 99.6 142 100.0
Missing -999 1 0.3 1 0.4 0 0.0
Total 389 100.0 247 100.0 142 100.0
Income Valid Under $10,000 15 3.9 9 3.6 6 4.2
$10,000-$19,999 49 12.6 19 7.7 30 21.1
$20,000-$29,999 51 13.1 18 7.3 33 23.2
$30,000-$39,999 48 12.3 27 10.9 21 14.8
$40,000-$49,999 57 14.7 40 16.2 17 12.0
$50,000-$59,999 35 9.0 22 8.9 13 9.2
$60,000-$69,999 28 7.2 21 8.5 7 4.9
$70,000-$79,999 31 8.0 26 10.5 5 3.5
$80,000-$89,999 18 4.6 18 7.3 0 0.0
$90,000-$99,999 9 2.3 6 2.4 3 2.1
$100,000- $120,000
17 4.4 15 6.1 2 1.4
$120,000+ 23 5.9 20 8.1 3 2.1
Total 381 97.9 241 97.6 140 98.6
Missing -999 8 2.1 6 2.4 2 1.4
Total 389 100.0 247 100.0 142 100.0
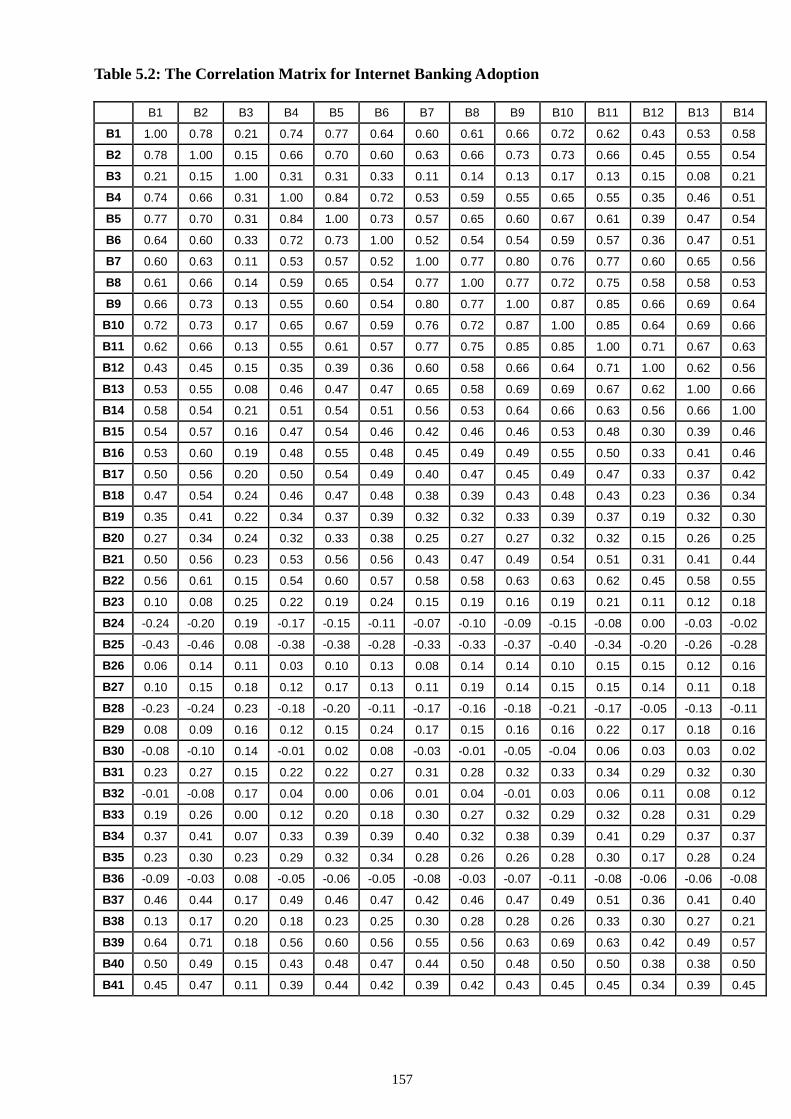
157
Table 5.2: The Correlation Matrix for Internet Banking Adoption
B1 B2 B3 B4 B5 B6 B7 B8 B9 B10 B11 B12 B13 B14
B1 1.00 0.78 0.21 0.74 0.77 0.64 0.60 0.61 0.66 0.72 0.62 0.43 0.53 0.58
B2 0.78 1.00 0.15 0.66 0.70 0.60 0.63 0.66 0.73 0.73 0.66 0.45 0.55 0.54
B3 0.21 0.15 1.00 0.31 0.31 0.33 0.11 0.14 0.13 0.17 0.13 0.15 0.08 0.21
B4 0.74 0.66 0.31 1.00 0.84 0.72 0.53 0.59 0.55 0.65 0.55 0.35 0.46 0.51
B5 0.77 0.70 0.31 0.84 1.00 0.73 0.57 0.65 0.60 0.67 0.61 0.39 0.47 0.54
B6 0.64 0.60 0.33 0.72 0.73 1.00 0.52 0.54 0.54 0.59 0.57 0.36 0.47 0.51
B7 0.60 0.63 0.11 0.53 0.57 0.52 1.00 0.77 0.80 0.76 0.77 0.60 0.65 0.56
B8 0.61 0.66 0.14 0.59 0.65 0.54 0.77 1.00 0.77 0.72 0.75 0.58 0.58 0.53
B9 0.66 0.73 0.13 0.55 0.60 0.54 0.80 0.77 1.00 0.87 0.85 0.66 0.69 0.64
B10 0.72 0.73 0.17 0.65 0.67 0.59 0.76 0.72 0.87 1.00 0.85 0.64 0.69 0.66
B11 0.62 0.66 0.13 0.55 0.61 0.57 0.77 0.75 0.85 0.85 1.00 0.71 0.67 0.63
B12 0.43 0.45 0.15 0.35 0.39 0.36 0.60 0.58 0.66 0.64 0.71 1.00 0.62 0.56
B13 0.53 0.55 0.08 0.46 0.47 0.47 0.65 0.58 0.69 0.69 0.67 0.62 1.00 0.66
B14 0.58 0.54 0.21 0.51 0.54 0.51 0.56 0.53 0.64 0.66 0.63 0.56 0.66 1.00
B15 0.54 0.57 0.16 0.47 0.54 0.46 0.42 0.46 0.46 0.53 0.48 0.30 0.39 0.46
B16 0.53 0.60 0.19 0.48 0.55 0.48 0.45 0.49 0.49 0.55 0.50 0.33 0.41 0.46
B17 0.50 0.56 0.20 0.50 0.54 0.49 0.40 0.47 0.45 0.49 0.47 0.33 0.37 0.42
B18 0.47 0.54 0.24 0.46 0.47 0.48 0.38 0.39 0.43 0.48 0.43 0.23 0.36 0.34
B19 0.35 0.41 0.22 0.34 0.37 0.39 0.32 0.32 0.33 0.39 0.37 0.19 0.32 0.30
B20 0.27 0.34 0.24 0.32 0.33 0.38 0.25 0.27 0.27 0.32 0.32 0.15 0.26 0.25
B21 0.50 0.56 0.23 0.53 0.56 0.56 0.43 0.47 0.49 0.54 0.51 0.31 0.41 0.44
B22 0.56 0.61 0.15 0.54 0.60 0.57 0.58 0.58 0.63 0.63 0.62 0.45 0.58 0.55
B23 0.10 0.08 0.25 0.22 0.19 0.24 0.15 0.19 0.16 0.19 0.21 0.11 0.12 0.18
B24 -0.24 -0.20 0.19 -0.17 -0.15 -0.11 -0.07 -0.10 -0.09 -0.15 -0.08 0.00 -0.03 -0.02
B25 -0.43 -0.46 0.08 -0.38 -0.38 -0.28 -0.33 -0.33 -0.37 -0.40 -0.34 -0.20 -0.26 -0.28
B26 0.06 0.14 0.11 0.03 0.10 0.13 0.08 0.14 0.14 0.10 0.15 0.15 0.12 0.16
B27 0.10 0.15 0.18 0.12 0.17 0.13 0.11 0.19 0.14 0.15 0.15 0.14 0.11 0.18
B28 -0.23 -0.24 0.23 -0.18 -0.20 -0.11 -0.17 -0.16 -0.18 -0.21 -0.17 -0.05 -0.13 -0.11
B29 0.08 0.09 0.16 0.12 0.15 0.24 0.17 0.15 0.16 0.16 0.22 0.17 0.18 0.16
B30 -0.08 -0.10 0.14 -0.01 0.02 0.08 -0.03 -0.01 -0.05 -0.04 0.06 0.03 0.03 0.02
B31 0.23 0.27 0.15 0.22 0.22 0.27 0.31 0.28 0.32 0.33 0.34 0.29 0.32 0.30
B32 -0.01 -0.08 0.17 0.04 0.00 0.06 0.01 0.04 -0.01 0.03 0.06 0.11 0.08 0.12
B33 0.19 0.26 0.00 0.12 0.20 0.18 0.30 0.27 0.32 0.29 0.32 0.28 0.31 0.29
B34 0.37 0.41 0.07 0.33 0.39 0.39 0.40 0.32 0.38 0.39 0.41 0.29 0.37 0.37
B35 0.23 0.30 0.23 0.29 0.32 0.34 0.28 0.26 0.26 0.28 0.30 0.17 0.28 0.24
B36 -0.09 -0.03 0.08 -0.05 -0.06 -0.05 -0.08 -0.03 -0.07 -0.11 -0.08 -0.06 -0.06 -0.08
B37 0.46 0.44 0.17 0.49 0.46 0.47 0.42 0.46 0.47 0.49 0.51 0.36 0.41 0.40
B38 0.13 0.17 0.20 0.18 0.23 0.25 0.30 0.28 0.28 0.26 0.33 0.30 0.27 0.21
B39 0.64 0.71 0.18 0.56 0.60 0.56 0.55 0.56 0.63 0.69 0.63 0.42 0.49 0.57
B40 0.50 0.49 0.15 0.43 0.48 0.47 0.44 0.50 0.48 0.50 0.50 0.38 0.38 0.50
B41 0.45 0.47 0.11 0.39 0.44 0.42 0.39 0.42 0.43 0.45 0.45 0.34 0.39 0.45
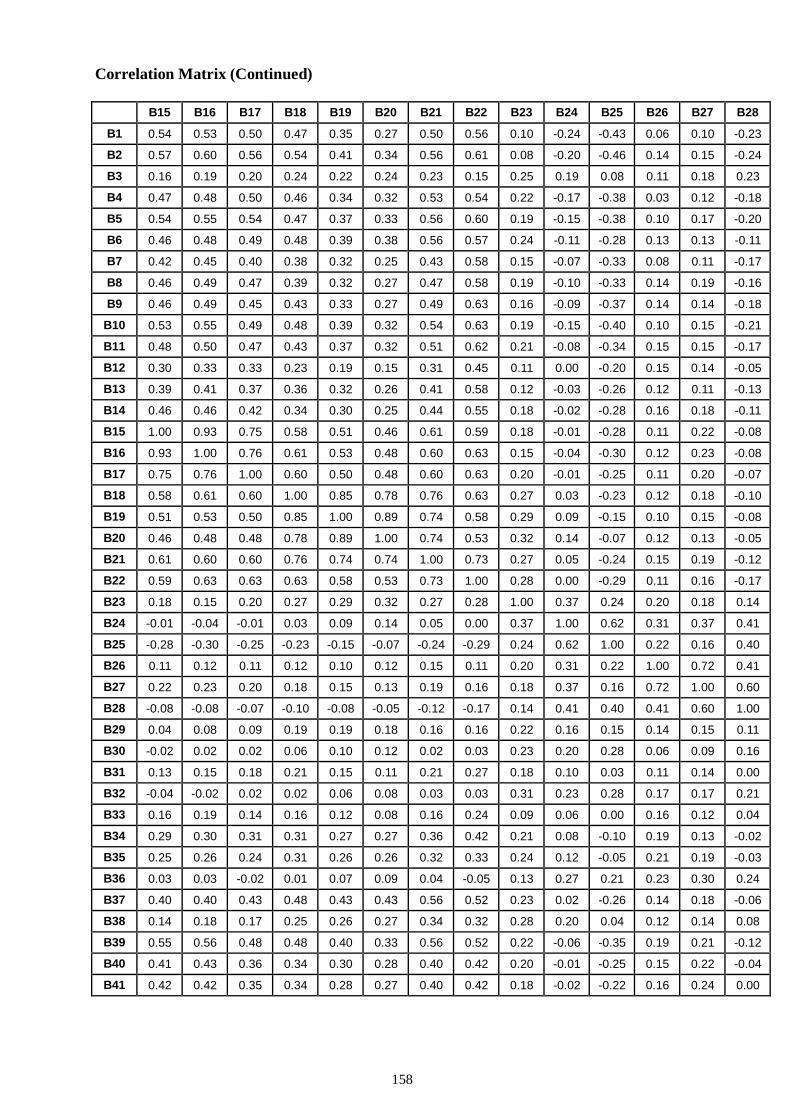
158
Correlation Matrix (Continued)
B15 B16 B17 B18 B19 B20 B21 B22 B23 B24 B25 B26 B27 B28
B1 0.54 0.53 0.50 0.47 0.35 0.27 0.50 0.56 0.10 -0.24 -0.43 0.06 0.10 -0.23
B2 0.57 0.60 0.56 0.54 0.41 0.34 0.56 0.61 0.08 -0.20 -0.46 0.14 0.15 -0.24
B3 0.16 0.19 0.20 0.24 0.22 0.24 0.23 0.15 0.25 0.19 0.08 0.11 0.18 0.23
B4 0.47 0.48 0.50 0.46 0.34 0.32 0.53 0.54 0.22 -0.17 -0.38 0.03 0.12 -0.18
B5 0.54 0.55 0.54 0.47 0.37 0.33 0.56 0.60 0.19 -0.15 -0.38 0.10 0.17 -0.20
B6 0.46 0.48 0.49 0.48 0.39 0.38 0.56 0.57 0.24 -0.11 -0.28 0.13 0.13 -0.11
B7 0.42 0.45 0.40 0.38 0.32 0.25 0.43 0.58 0.15 -0.07 -0.33 0.08 0.11 -0.17
B8 0.46 0.49 0.47 0.39 0.32 0.27 0.47 0.58 0.19 -0.10 -0.33 0.14 0.19 -0.16
B9 0.46 0.49 0.45 0.43 0.33 0.27 0.49 0.63 0.16 -0.09 -0.37 0.14 0.14 -0.18
B10 0.53 0.55 0.49 0.48 0.39 0.32 0.54 0.63 0.19 -0.15 -0.40 0.10 0.15 -0.21
B11 0.48 0.50 0.47 0.43 0.37 0.32 0.51 0.62 0.21 -0.08 -0.34 0.15 0.15 -0.17
B12 0.30 0.33 0.33 0.23 0.19 0.15 0.31 0.45 0.11 0.00 -0.20 0.15 0.14 -0.05
B13 0.39 0.41 0.37 0.36 0.32 0.26 0.41 0.58 0.12 -0.03 -0.26 0.12 0.11 -0.13
B14 0.46 0.46 0.42 0.34 0.30 0.25 0.44 0.55 0.18 -0.02 -0.28 0.16 0.18 -0.11
B15 1.00 0.93 0.75 0.58 0.51 0.46 0.61 0.59 0.18 -0.01 -0.28 0.11 0.22 -0.08
B16 0.93 1.00 0.76 0.61 0.53 0.48 0.60 0.63 0.15 -0.04 -0.30 0.12 0.23 -0.08
B17 0.75 0.76 1.00 0.60 0.50 0.48 0.60 0.63 0.20 -0.01 -0.25 0.11 0.20 -0.07
B18 0.58 0.61 0.60 1.00 0.85 0.78 0.76 0.63 0.27 0.03 -0.23 0.12 0.18 -0.10
B19 0.51 0.53 0.50 0.85 1.00 0.89 0.74 0.58 0.29 0.09 -0.15 0.10 0.15 -0.08
B20 0.46 0.48 0.48 0.78 0.89 1.00 0.74 0.53 0.32 0.14 -0.07 0.12 0.13 -0.05
B21 0.61 0.60 0.60 0.76 0.74 0.74 1.00 0.73 0.27 0.05 -0.24 0.15 0.19 -0.12
B22 0.59 0.63 0.63 0.63 0.58 0.53 0.73 1.00 0.28 0.00 -0.29 0.11 0.16 -0.17
B23 0.18 0.15 0.20 0.27 0.29 0.32 0.27 0.28 1.00 0.37 0.24 0.20 0.18 0.14
B24 -0.01 -0.04 -0.01 0.03 0.09 0.14 0.05 0.00 0.37 1.00 0.62 0.31 0.37 0.41
B25 -0.28 -0.30 -0.25 -0.23 -0.15 -0.07 -0.24 -0.29 0.24 0.62 1.00 0.22 0.16 0.40
B26 0.11 0.12 0.11 0.12 0.10 0.12 0.15 0.11 0.20 0.31 0.22 1.00 0.72 0.41
B27 0.22 0.23 0.20 0.18 0.15 0.13 0.19 0.16 0.18 0.37 0.16 0.72 1.00 0.60
B28 -0.08 -0.08 -0.07 -0.10 -0.08 -0.05 -0.12 -0.17 0.14 0.41 0.40 0.41 0.60 1.00
B29 0.04 0.08 0.09 0.19 0.19 0.18 0.16 0.16 0.22 0.16 0.15 0.14 0.15 0.11
B30 -0.02 0.02 0.02 0.06 0.10 0.12 0.02 0.03 0.23 0.20 0.28 0.06 0.09 0.16
B31 0.13 0.15 0.18 0.21 0.15 0.11 0.21 0.27 0.18 0.10 0.03 0.11 0.14 0.00
B32 -0.04 -0.02 0.02 0.02 0.06 0.08 0.03 0.03 0.31 0.23 0.28 0.17 0.17 0.21
B33 0.16 0.19 0.14 0.16 0.12 0.08 0.16 0.24 0.09 0.06 0.00 0.16 0.12 0.04
B34 0.29 0.30 0.31 0.31 0.27 0.27 0.36 0.42 0.21 0.08 -0.10 0.19 0.13 -0.02
B35 0.25 0.26 0.24 0.31 0.26 0.26 0.32 0.33 0.24 0.12 -0.05 0.21 0.19 -0.03
B36 0.03 0.03 -0.02 0.01 0.07 0.09 0.04 -0.05 0.13 0.27 0.21 0.23 0.30 0.24
B37 0.40 0.40 0.43 0.48 0.43 0.43 0.56 0.52 0.23 0.02 -0.26 0.14 0.18 -0.06
B38 0.14 0.18 0.17 0.25 0.26 0.27 0.34 0.32 0.28 0.20 0.04 0.12 0.14 0.08
B39 0.55 0.56 0.48 0.48 0.40 0.33 0.56 0.52 0.22 -0.06 -0.35 0.19 0.21 -0.12
B40 0.41 0.43 0.36 0.34 0.30 0.28 0.40 0.42 0.20 -0.01 -0.25 0.15 0.22 -0.04
B41 0.42 0.42 0.35 0.34 0.28 0.27 0.40 0.42 0.18 -0.02 -0.22 0.16 0.24 0.00
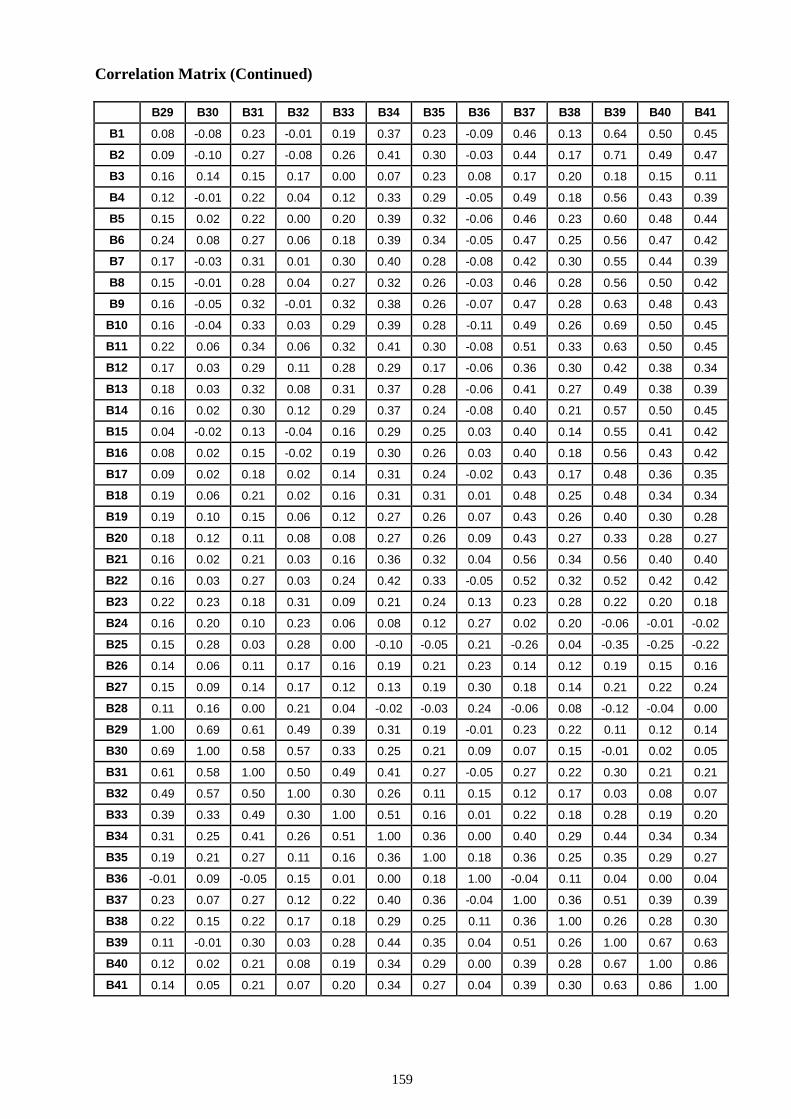
159
Correlation Matrix (Continued)
B29 B30 B31 B32 B33 B34 B35 B36 B37 B38 B39 B40 B41
B1 0.08 -0.08 0.23 -0.01 0.19 0.37 0.23 -0.09 0.46 0.13 0.64 0.50 0.45
B2 0.09 -0.10 0.27 -0.08 0.26 0.41 0.30 -0.03 0.44 0.17 0.71 0.49 0.47
B3 0.16 0.14 0.15 0.17 0.00 0.07 0.23 0.08 0.17 0.20 0.18 0.15 0.11
B4 0.12 -0.01 0.22 0.04 0.12 0.33 0.29 -0.05 0.49 0.18 0.56 0.43 0.39
B5 0.15 0.02 0.22 0.00 0.20 0.39 0.32 -0.06 0.46 0.23 0.60 0.48 0.44
B6 0.24 0.08 0.27 0.06 0.18 0.39 0.34 -0.05 0.47 0.25 0.56 0.47 0.42
B7 0.17 -0.03 0.31 0.01 0.30 0.40 0.28 -0.08 0.42 0.30 0.55 0.44 0.39
B8 0.15 -0.01 0.28 0.04 0.27 0.32 0.26 -0.03 0.46 0.28 0.56 0.50 0.42
B9 0.16 -0.05 0.32 -0.01 0.32 0.38 0.26 -0.07 0.47 0.28 0.63 0.48 0.43
B10 0.16 -0.04 0.33 0.03 0.29 0.39 0.28 -0.11 0.49 0.26 0.69 0.50 0.45
B11 0.22 0.06 0.34 0.06 0.32 0.41 0.30 -0.08 0.51 0.33 0.63 0.50 0.45
B12 0.17 0.03 0.29 0.11 0.28 0.29 0.17 -0.06 0.36 0.30 0.42 0.38 0.34
B13 0.18 0.03 0.32 0.08 0.31 0.37 0.28 -0.06 0.41 0.27 0.49 0.38 0.39
B14 0.16 0.02 0.30 0.12 0.29 0.37 0.24 -0.08 0.40 0.21 0.57 0.50 0.45
B15 0.04 -0.02 0.13 -0.04 0.16 0.29 0.25 0.03 0.40 0.14 0.55 0.41 0.42
B16 0.08 0.02 0.15 -0.02 0.19 0.30 0.26 0.03 0.40 0.18 0.56 0.43 0.42
B17 0.09 0.02 0.18 0.02 0.14 0.31 0.24 -0.02 0.43 0.17 0.48 0.36 0.35
B18 0.19 0.06 0.21 0.02 0.16 0.31 0.31 0.01 0.48 0.25 0.48 0.34 0.34
B19 0.19 0.10 0.15 0.06 0.12 0.27 0.26 0.07 0.43 0.26 0.40 0.30 0.28
B20 0.18 0.12 0.11 0.08 0.08 0.27 0.26 0.09 0.43 0.27 0.33 0.28 0.27
B21 0.16 0.02 0.21 0.03 0.16 0.36 0.32 0.04 0.56 0.34 0.56 0.40 0.40
B22 0.16 0.03 0.27 0.03 0.24 0.42 0.33 -0.05 0.52 0.32 0.52 0.42 0.42
B23 0.22 0.23 0.18 0.31 0.09 0.21 0.24 0.13 0.23 0.28 0.22 0.20 0.18
B24 0.16 0.20 0.10 0.23 0.06 0.08 0.12 0.27 0.02 0.20 -0.06 -0.01 -0.02
B25 0.15 0.28 0.03 0.28 0.00 -0.10 -0.05 0.21 -0.26 0.04 -0.35 -0.25 -0.22
B26 0.14 0.06 0.11 0.17 0.16 0.19 0.21 0.23 0.14 0.12 0.19 0.15 0.16
B27 0.15 0.09 0.14 0.17 0.12 0.13 0.19 0.30 0.18 0.14 0.21 0.22 0.24
B28 0.11 0.16 0.00 0.21 0.04 -0.02 -0.03 0.24 -0.06 0.08 -0.12 -0.04 0.00
B29 1.00 0.69 0.61 0.49 0.39 0.31 0.19 -0.01 0.23 0.22 0.11 0.12 0.14
B30 0.69 1.00 0.58 0.57 0.33 0.25 0.21 0.09 0.07 0.15 -0.01 0.02 0.05
B31 0.61 0.58 1.00 0.50 0.49 0.41 0.27 -0.05 0.27 0.22 0.30 0.21 0.21
B32 0.49 0.57 0.50 1.00 0.30 0.26 0.11 0.15 0.12 0.17 0.03 0.08 0.07
B33 0.39 0.33 0.49 0.30 1.00 0.51 0.16 0.01 0.22 0.18 0.28 0.19 0.20
B34 0.31 0.25 0.41 0.26 0.51 1.00 0.36 0.00 0.40 0.29 0.44 0.34 0.34
B35 0.19 0.21 0.27 0.11 0.16 0.36 1.00 0.18 0.36 0.25 0.35 0.29 0.27
B36 -0.01 0.09 -0.05 0.15 0.01 0.00 0.18 1.00 -0.04 0.11 0.04 0.00 0.04
B37 0.23 0.07 0.27 0.12 0.22 0.40 0.36 -0.04 1.00 0.36 0.51 0.39 0.39
B38 0.22 0.15 0.22 0.17 0.18 0.29 0.25 0.11 0.36 1.00 0.26 0.28 0.30
B39 0.11 -0.01 0.30 0.03 0.28 0.44 0.35 0.04 0.51 0.26 1.00 0.67 0.63
B40 0.12 0.02 0.21 0.08 0.19 0.34 0.29 0.00 0.39 0.28 0.67 1.00 0.86
B41 0.14 0.05 0.21 0.07 0.20 0.34 0.27 0.04 0.39 0.30 0.63 0.86 1.00
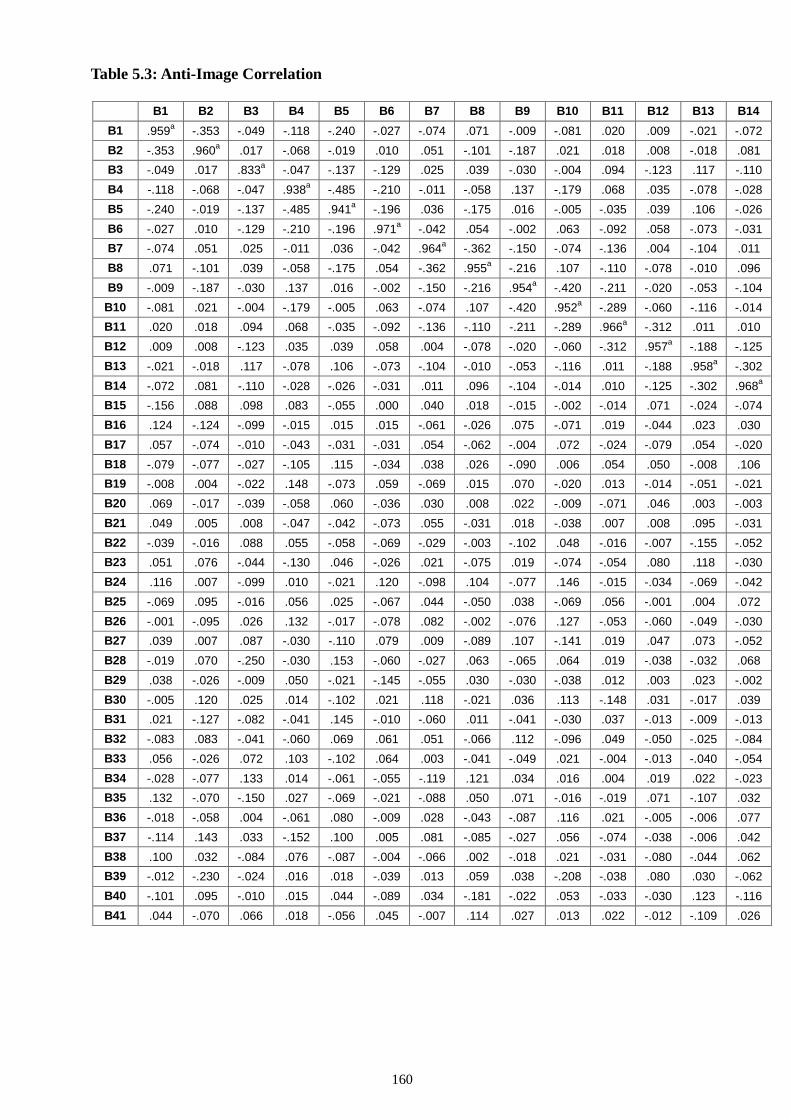
160
Table 5.3: Anti-Image Correlation
B1 B2 B3 B4 B5 B6 B7 B8 B9 B10 B11 B12 B13 B14
B1 .959a -.353 -.049 -.118 -.240 -.027 -.074 .071 -.009 -.081 .020 .009 -.021 -.072
B2 -.353 .960a .017 -.068 -.019 .010 .051 -.101 -.187 .021 .018 .008 -.018 .081
B3 -.049 .017 .833a -.047 -.137 -.129 .025 .039 -.030 -.004 .094 -.123 .117 -.110
B4 -.118 -.068 -.047 .938a -.485 -.210 -.011 -.058 .137 -.179 .068 .035 -.078 -.028
B5 -.240 -.019 -.137 -.485 .941a -.196 .036 -.175 .016 -.005 -.035 .039 .106 -.026
B6 -.027 .010 -.129 -.210 -.196 .971a -.042 .054 -.002 .063 -.092 .058 -.073 -.031
B7 -.074 .051 .025 -.011 .036 -.042 .964a -.362 -.150 -.074 -.136 .004 -.104 .011
B8 .071 -.101 .039 -.058 -.175 .054 -.362 .955a -.216 .107 -.110 -.078 -.010 .096
B9 -.009 -.187 -.030 .137 .016 -.002 -.150 -.216 .954a -.420 -.211 -.020 -.053 -.104
B10 -.081 .021 -.004 -.179 -.005 .063 -.074 .107 -.420 .952a -.289 -.060 -.116 -.014
B11 .020 .018 .094 .068 -.035 -.092 -.136 -.110 -.211 -.289 .966a -.312 .011 .010
B12 .009 .008 -.123 .035 .039 .058 .004 -.078 -.020 -.060 -.312 .957a -.188 -.125
B13 -.021 -.018 .117 -.078 .106 -.073 -.104 -.010 -.053 -.116 .011 -.188 .958a -.302
B14 -.072 .081 -.110 -.028 -.026 -.031 .011 .096 -.104 -.014 .010 -.125 -.302 .968a
B15 -.156 .088 .098 .083 -.055 .000 .040 .018 -.015 -.002 -.014 .071 -.024 -.074
B16 .124 -.124 -.099 -.015 .015 .015 -.061 -.026 .075 -.071 .019 -.044 .023 .030
B17 .057 -.074 -.010 -.043 -.031 -.031 .054 -.062 -.004 .072 -.024 -.079 .054 -.020
B18 -.079 -.077 -.027 -.105 .115 -.034 .038 .026 -.090 .006 .054 .050 -.008 .106
B19 -.008 .004 -.022 .148 -.073 .059 -.069 .015 .070 -.020 .013 -.014 -.051 -.021
B20 .069 -.017 -.039 -.058 .060 -.036 .030 .008 .022 -.009 -.071 .046 .003 -.003
B21 .049 .005 .008 -.047 -.042 -.073 .055 -.031 .018 -.038 .007 .008 .095 -.031
B22 -.039 -.016 .088 .055 -.058 -.069 -.029 -.003 -.102 .048 -.016 -.007 -.155 -.052
B23 .051 .076 -.044 -.130 .046 -.026 .021 -.075 .019 -.074 -.054 .080 .118 -.030
B24 .116 .007 -.099 .010 -.021 .120 -.098 .104 -.077 .146 -.015 -.034 -.069 -.042
B25 -.069 .095 -.016 .056 .025 -.067 .044 -.050 .038 -.069 .056 -.001 .004 .072
B26 -.001 -.095 .026 .132 -.017 -.078 .082 -.002 -.076 .127 -.053 -.060 -.049 -.030
B27 .039 .007 .087 -.030 -.110 .079 .009 -.089 .107 -.141 .019 .047 .073 -.052
B28 -.019 .070 -.250 -.030 .153 -.060 -.027 .063 -.065 .064 .019 -.038 -.032 .068
B29 .038 -.026 -.009 .050 -.021 -.145 -.055 .030 -.030 -.038 .012 .003 .023 -.002
B30 -.005 .120 .025 .014 -.102 .021 .118 -.021 .036 .113 -.148 .031 -.017 .039
B31 .021 -.127 -.082 -.041 .145 -.010 -.060 .011 -.041 -.030 .037 -.013 -.009 -.013
B32 -.083 .083 -.041 -.060 .069 .061 .051 -.066 .112 -.096 .049 -.050 -.025 -.084
B33 .056 -.026 .072 .103 -.102 .064 .003 -.041 -.049 .021 -.004 -.013 -.040 -.054
B34 -.028 -.077 .133 .014 -.061 -.055 -.119 .121 .034 .016 .004 .019 .022 -.023
B35 .132 -.070 -.150 .027 -.069 -.021 -.088 .050 .071 -.016 -.019 .071 -.107 .032
B36 -.018 -.058 .004 -.061 .080 -.009 .028 -.043 -.087 .116 .021 -.005 -.006 .077
B37 -.114 .143 .033 -.152 .100 .005 .081 -.085 -.027 .056 -.074 -.038 -.006 .042
B38 .100 .032 -.084 .076 -.087 -.004 -.066 .002 -.018 .021 -.031 -.080 -.044 .062
B39 -.012 -.230 -.024 .016 .018 -.039 .013 .059 .038 -.208 -.038 .080 .030 -.062
B40 -.101 .095 -.010 .015 .044 -.089 .034 -.181 -.022 .053 -.033 -.030 .123 -.116
B41 .044 -.070 .066 .018 -.056 .045 -.007 .114 .027 .013 .022 -.012 -.109 .026
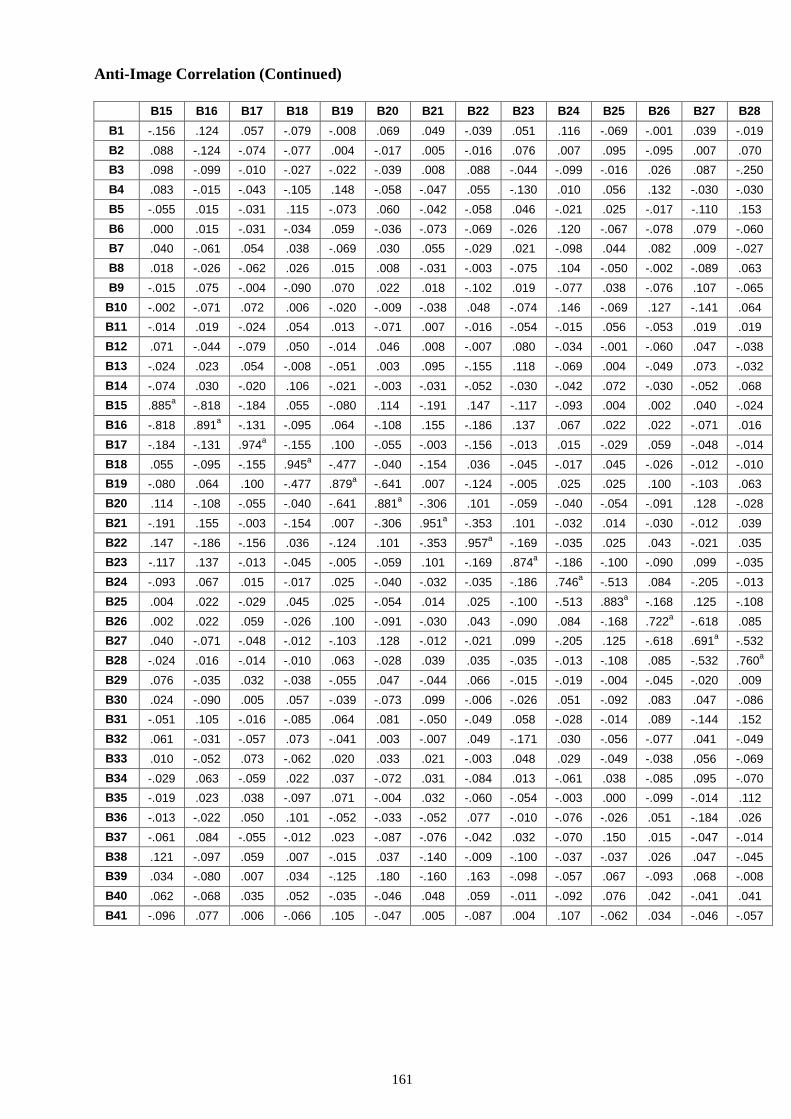
161
Anti-Image Correlation (Continued)
B15 B16 B17 B18 B19 B20 B21 B22 B23 B24 B25 B26 B27 B28
B1 -.156 .124 .057 -.079 -.008 .069 .049 -.039 .051 .116 -.069 -.001 .039 -.019
B2 .088 -.124 -.074 -.077 .004 -.017 .005 -.016 .076 .007 .095 -.095 .007 .070
B3 .098 -.099 -.010 -.027 -.022 -.039 .008 .088 -.044 -.099 -.016 .026 .087 -.250
B4 .083 -.015 -.043 -.105 .148 -.058 -.047 .055 -.130 .010 .056 .132 -.030 -.030
B5 -.055 .015 -.031 .115 -.073 .060 -.042 -.058 .046 -.021 .025 -.017 -.110 .153
B6 .000 .015 -.031 -.034 .059 -.036 -.073 -.069 -.026 .120 -.067 -.078 .079 -.060
B7 .040 -.061 .054 .038 -.069 .030 .055 -.029 .021 -.098 .044 .082 .009 -.027
B8 .018 -.026 -.062 .026 .015 .008 -.031 -.003 -.075 .104 -.050 -.002 -.089 .063
B9 -.015 .075 -.004 -.090 .070 .022 .018 -.102 .019 -.077 .038 -.076 .107 -.065
B10 -.002 -.071 .072 .006 -.020 -.009 -.038 .048 -.074 .146 -.069 .127 -.141 .064
B11 -.014 .019 -.024 .054 .013 -.071 .007 -.016 -.054 -.015 .056 -.053 .019 .019
B12 .071 -.044 -.079 .050 -.014 .046 .008 -.007 .080 -.034 -.001 -.060 .047 -.038
B13 -.024 .023 .054 -.008 -.051 .003 .095 -.155 .118 -.069 .004 -.049 .073 -.032
B14 -.074 .030 -.020 .106 -.021 -.003 -.031 -.052 -.030 -.042 .072 -.030 -.052 .068
B15 .885a -.818 -.184 .055 -.080 .114 -.191 .147 -.117 -.093 .004 .002 .040 -.024
B16 -.818 .891a -.131 -.095 .064 -.108 .155 -.186 .137 .067 .022 .022 -.071 .016
B17 -.184 -.131 .974a -.155 .100 -.055 -.003 -.156 -.013 .015 -.029 .059 -.048 -.014
B18 .055 -.095 -.155 .945a -.477 -.040 -.154 .036 -.045 -.017 .045 -.026 -.012 -.010
B19 -.080 .064 .100 -.477 .879a -.641 .007 -.124 -.005 .025 .025 .100 -.103 .063
B20 .114 -.108 -.055 -.040 -.641 .881a -.306 .101 -.059 -.040 -.054 -.091 .128 -.028
B21 -.191 .155 -.003 -.154 .007 -.306 .951a -.353 .101 -.032 .014 -.030 -.012 .039
B22 .147 -.186 -.156 .036 -.124 .101 -.353 .957a -.169 -.035 .025 .043 -.021 .035
B23 -.117 .137 -.013 -.045 -.005 -.059 .101 -.169 .874a -.186 -.100 -.090 .099 -.035
B24 -.093 .067 .015 -.017 .025 -.040 -.032 -.035 -.186 .746a -.513 .084 -.205 -.013
B25 .004 .022 -.029 .045 .025 -.054 .014 .025 -.100 -.513 .883a -.168 .125 -.108
B26 .002 .022 .059 -.026 .100 -.091 -.030 .043 -.090 .084 -.168 .722a -.618 .085
B27 .040 -.071 -.048 -.012 -.103 .128 -.012 -.021 .099 -.205 .125 -.618 .691a -.532
B28 -.024 .016 -.014 -.010 .063 -.028 .039 .035 -.035 -.013 -.108 .085 -.532 .760a
B29 .076 -.035 .032 -.038 -.055 .047 -.044 .066 -.015 -.019 -.004 -.045 -.020 .009
B30 .024 -.090 .005 .057 -.039 -.073 .099 -.006 -.026 .051 -.092 .083 .047 -.086
B31 -.051 .105 -.016 -.085 .064 .081 -.050 -.049 .058 -.028 -.014 .089 -.144 .152
B32 .061 -.031 -.057 .073 -.041 .003 -.007 .049 -.171 .030 -.056 -.077 .041 -.049
B33 .010 -.052 .073 -.062 .020 .033 .021 -.003 .048 .029 -.049 -.038 .056 -.069
B34 -.029 .063 -.059 .022 .037 -.072 .031 -.084 .013 -.061 .038 -.085 .095 -.070
B35 -.019 .023 .038 -.097 .071 -.004 .032 -.060 -.054 -.003 .000 -.099 -.014 .112
B36 -.013 -.022 .050 .101 -.052 -.033 -.052 .077 -.010 -.076 -.026 .051 -.184 .026
B37 -.061 .084 -.055 -.012 .023 -.087 -.076 -.042 .032 -.070 .150 .015 -.047 -.014
B38 .121 -.097 .059 .007 -.015 .037 -.140 -.009 -.100 -.037 -.037 .026 .047 -.045
B39 .034 -.080 .007 .034 -.125 .180 -.160 .163 -.098 -.057 .067 -.093 .068 -.008
B40 .062 -.068 .035 .052 -.035 -.046 .048 .059 -.011 -.092 .076 .042 -.041 .041
B41 -.096 .077 .006 -.066 .105 -.047 .005 -.087 .004 .107 -.062 .034 -.046 -.057
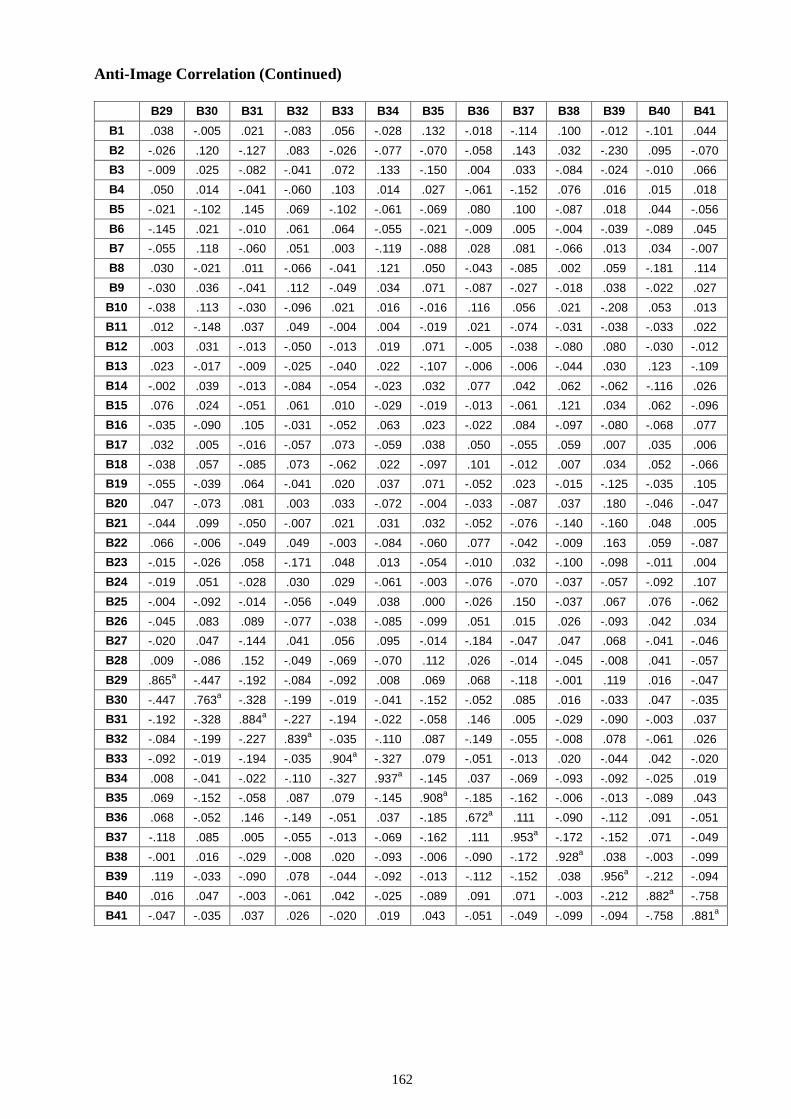
162
Anti-Image Correlation (Continued)
B29 B30 B31 B32 B33 B34 B35 B36 B37 B38 B39 B40 B41
B1 .038 -.005 .021 -.083 .056 -.028 .132 -.018 -.114 .100 -.012 -.101 .044
B2 -.026 .120 -.127 .083 -.026 -.077 -.070 -.058 .143 .032 -.230 .095 -.070
B3 -.009 .025 -.082 -.041 .072 .133 -.150 .004 .033 -.084 -.024 -.010 .066
B4 .050 .014 -.041 -.060 .103 .014 .027 -.061 -.152 .076 .016 .015 .018
B5 -.021 -.102 .145 .069 -.102 -.061 -.069 .080 .100 -.087 .018 .044 -.056
B6 -.145 .021 -.010 .061 .064 -.055 -.021 -.009 .005 -.004 -.039 -.089 .045
B7 -.055 .118 -.060 .051 .003 -.119 -.088 .028 .081 -.066 .013 .034 -.007
B8 .030 -.021 .011 -.066 -.041 .121 .050 -.043 -.085 .002 .059 -.181 .114
B9 -.030 .036 -.041 .112 -.049 .034 .071 -.087 -.027 -.018 .038 -.022 .027
B10 -.038 .113 -.030 -.096 .021 .016 -.016 .116 .056 .021 -.208 .053 .013
B11 .012 -.148 .037 .049 -.004 .004 -.019 .021 -.074 -.031 -.038 -.033 .022
B12 .003 .031 -.013 -.050 -.013 .019 .071 -.005 -.038 -.080 .080 -.030 -.012
B13 .023 -.017 -.009 -.025 -.040 .022 -.107 -.006 -.006 -.044 .030 .123 -.109
B14 -.002 .039 -.013 -.084 -.054 -.023 .032 .077 .042 .062 -.062 -.116 .026
B15 .076 .024 -.051 .061 .010 -.029 -.019 -.013 -.061 .121 .034 .062 -.096
B16 -.035 -.090 .105 -.031 -.052 .063 .023 -.022 .084 -.097 -.080 -.068 .077
B17 .032 .005 -.016 -.057 .073 -.059 .038 .050 -.055 .059 .007 .035 .006
B18 -.038 .057 -.085 .073 -.062 .022 -.097 .101 -.012 .007 .034 .052 -.066
B19 -.055 -.039 .064 -.041 .020 .037 .071 -.052 .023 -.015 -.125 -.035 .105
B20 .047 -.073 .081 .003 .033 -.072 -.004 -.033 -.087 .037 .180 -.046 -.047
B21 -.044 .099 -.050 -.007 .021 .031 .032 -.052 -.076 -.140 -.160 .048 .005
B22 .066 -.006 -.049 .049 -.003 -.084 -.060 .077 -.042 -.009 .163 .059 -.087
B23 -.015 -.026 .058 -.171 .048 .013 -.054 -.010 .032 -.100 -.098 -.011 .004
B24 -.019 .051 -.028 .030 .029 -.061 -.003 -.076 -.070 -.037 -.057 -.092 .107
B25 -.004 -.092 -.014 -.056 -.049 .038 .000 -.026 .150 -.037 .067 .076 -.062
B26 -.045 .083 .089 -.077 -.038 -.085 -.099 .051 .015 .026 -.093 .042 .034
B27 -.020 .047 -.144 .041 .056 .095 -.014 -.184 -.047 .047 .068 -.041 -.046
B28 .009 -.086 .152 -.049 -.069 -.070 .112 .026 -.014 -.045 -.008 .041 -.057
B29 .865a -.447 -.192 -.084 -.092 .008 .069 .068 -.118 -.001 .119 .016 -.047
B30 -.447 .763a -.328 -.199 -.019 -.041 -.152 -.052 .085 .016 -.033 .047 -.035
B31 -.192 -.328 .884a -.227 -.194 -.022 -.058 .146 .005 -.029 -.090 -.003 .037
B32 -.084 -.199 -.227 .839a -.035 -.110 .087 -.149 -.055 -.008 .078 -.061 .026
B33 -.092 -.019 -.194 -.035 .904a -.327 .079 -.051 -.013 .020 -.044 .042 -.020
B34 .008 -.041 -.022 -.110 -.327 .937a -.145 .037 -.069 -.093 -.092 -.025 .019
B35 .069 -.152 -.058 .087 .079 -.145 .908a -.185 -.162 -.006 -.013 -.089 .043
B36 .068 -.052 .146 -.149 -.051 .037 -.185 .672a .111 -.090 -.112 .091 -.051
B37 -.118 .085 .005 -.055 -.013 -.069 -.162 .111 .953a -.172 -.152 .071 -.049
B38 -.001 .016 -.029 -.008 .020 -.093 -.006 -.090 -.172 .928a .038 -.003 -.099
B39 .119 -.033 -.090 .078 -.044 -.092 -.013 -.112 -.152 .038 .956a -.212 -.094
B40 .016 .047 -.003 -.061 .042 -.025 -.089 .091 .071 -.003 -.212 .882a -.758
B41 -.047 -.035 .037 .026 -.020 .019 .043 -.051 -.049 -.099 -.094 -.758 .881a
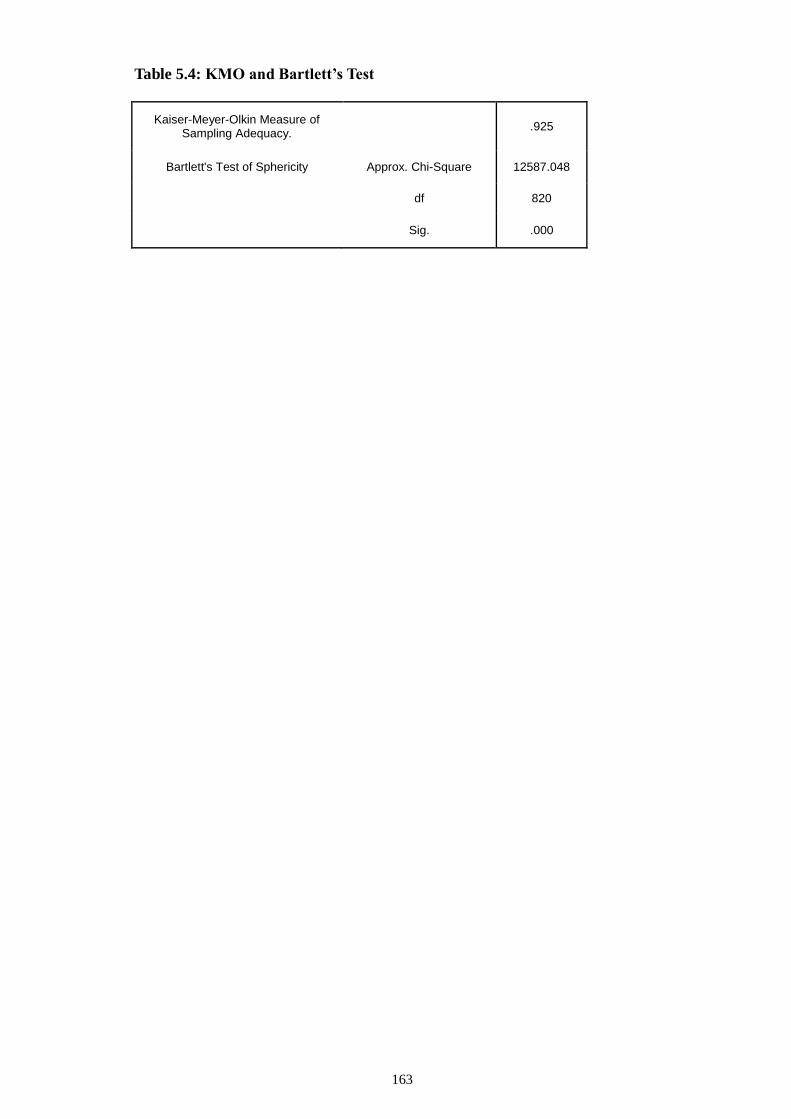
163
Table 5.4: KMO and Bartlett’s Test
Kaiser-Meyer-Olkin Measure of Sampling Adequacy.
.925
Bartlett's Test of Sphericity Approx. Chi-Square 12587.048
df 820
Sig. .000
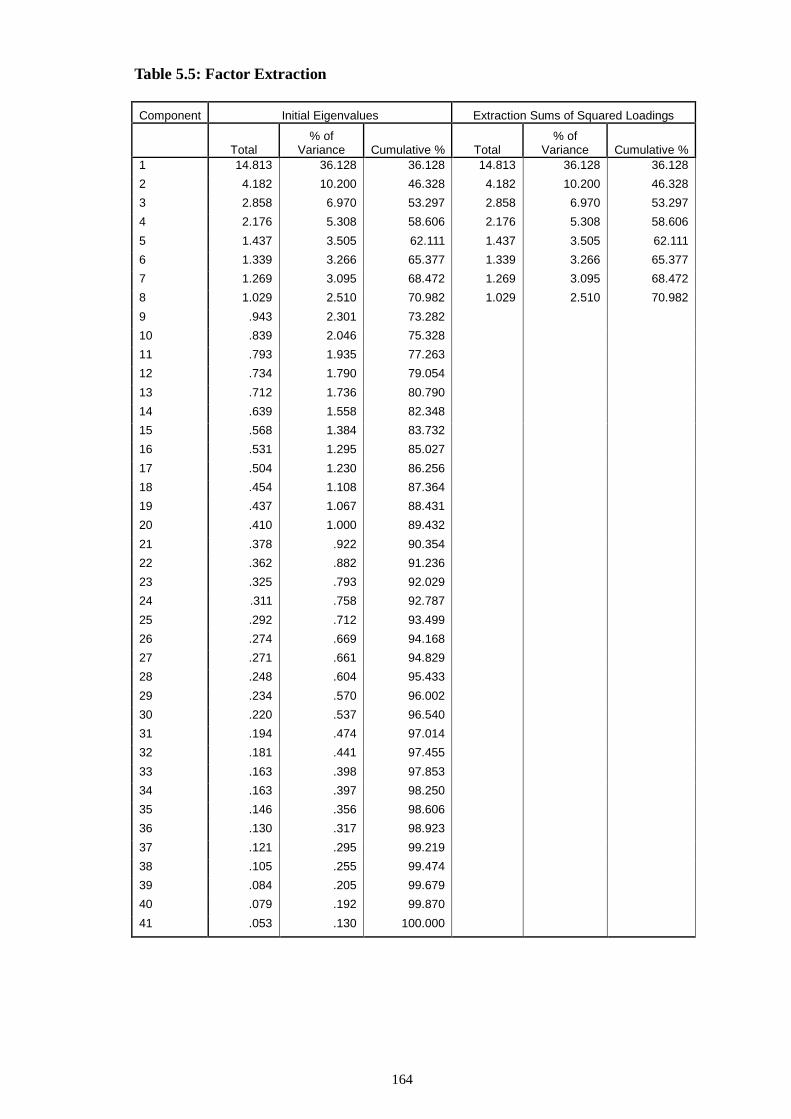
164
Table 5.5: Factor Extraction
Component Initial Eigenvalues Extraction Sums of Squared Loadings
Total
% of Variance Cumulative % Total
% of Variance Cumulative %
1 14.813 36.128 36.128 14.813 36.128 36.128
2 4.182 10.200 46.328 4.182 10.200 46.328
3 2.858 6.970 53.297 2.858 6.970 53.297
4 2.176 5.308 58.606 2.176 5.308 58.606
5 1.437 3.505 62.111 1.437 3.505 62.111
6 1.339 3.266 65.377 1.339 3.266 65.377
7 1.269 3.095 68.472 1.269 3.095 68.472
8 1.029 2.510 70.982 1.029 2.510 70.982
9 .943 2.301 73.282
10 .839 2.046 75.328
11 .793 1.935 77.263
12 .734 1.790 79.054
13 .712 1.736 80.790
14 .639 1.558 82.348
15 .568 1.384 83.732
16 .531 1.295 85.027
17 .504 1.230 86.256
18 .454 1.108 87.364
19 .437 1.067 88.431
20 .410 1.000 89.432
21 .378 .922 90.354
22 .362 .882 91.236
23 .325 .793 92.029
24 .311 .758 92.787
25 .292 .712 93.499
26 .274 .669 94.168
27 .271 .661 94.829
28 .248 .604 95.433
29 .234 .570 96.002
30 .220 .537 96.540
31 .194 .474 97.014
32 .181 .441 97.455
33 .163 .398 97.853
34 .163 .397 98.250
35 .146 .356 98.606
36 .130 .317 98.923
37 .121 .295 99.219
38 .105 .255 99.474
39 .084 .205 99.679
40 .079 .192 99.870
41 .053 .130 100.000
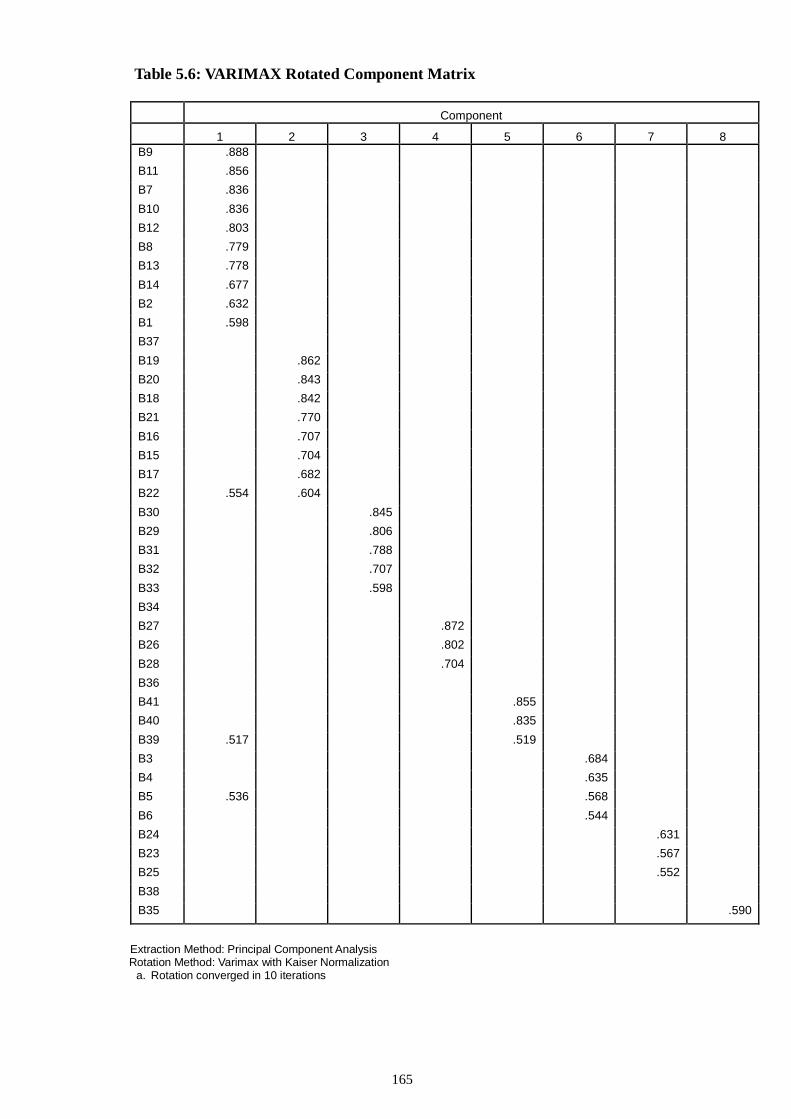
165
Table 5.6: VARIMAX Rotated Component Matrix
Component
1 2 3 4 5 6 7 8
B9 .888
B11 .856
B7 .836
B10 .836
B12 .803
B8 .779
B13 .778
B14 .677
B2 .632
B1 .598
B37
B19 .862
B20 .843
B18 .842
B21 .770
B16 .707
B15 .704
B17 .682
B22 .554 .604
B30 .845
B29 .806
B31 .788
B32 .707
B33 .598
B34
B27 .872
B26 .802
B28 .704
B36
B41 .855
B40 .835
B39 .517 .519
B3 .684
B4 .635
B5 .536 .568
B6 .544
B24 .631
B23 .567
B25 .552
B38
B35 .590
Extraction Method: Principal Component Analysis Rotation Method: Varimax with Kaiser Normalization
a. Rotation converged in 10 iterations
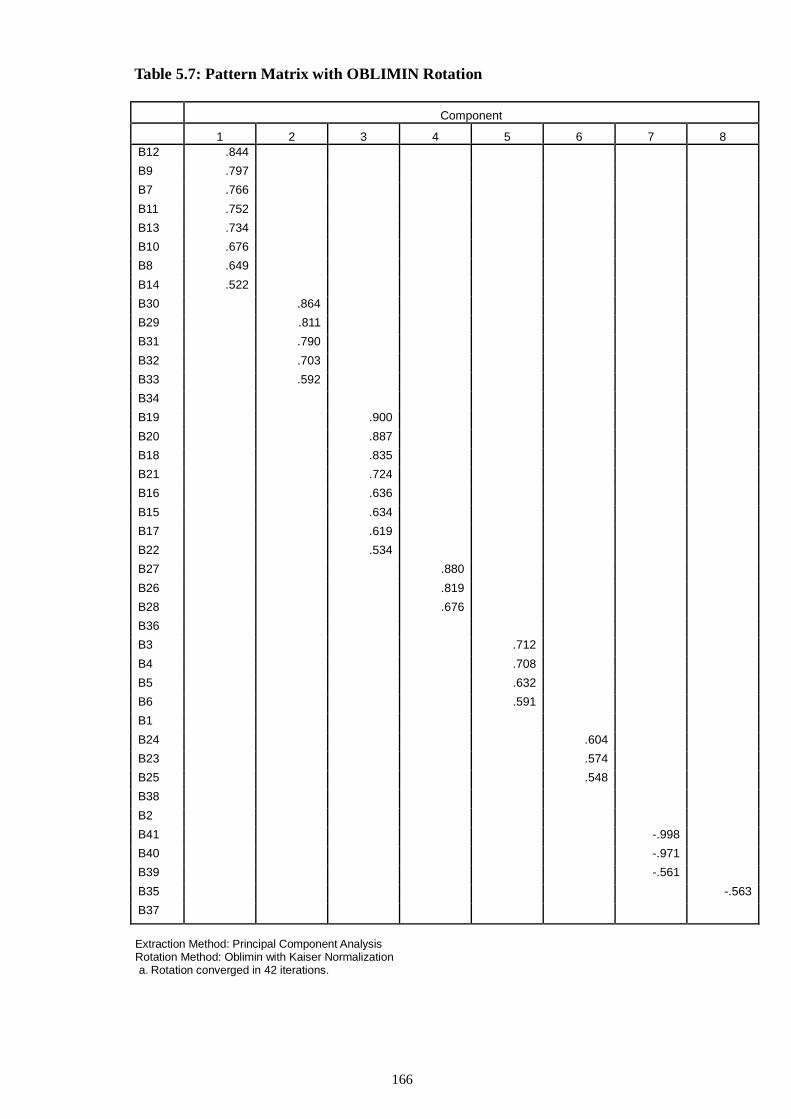
166
Table 5.7: Pattern Matrix with OBLIMIN Rotation
Component
1 2 3 4 5 6 7 8
B12 .844
B9 .797
B7 .766
B11 .752
B13 .734
B10 .676
B8 .649
B14 .522
B30 .864
B29 .811
B31 .790
B32 .703
B33 .592
B34
B19 .900
B20 .887
B18 .835
B21 .724
B16 .636
B15 .634
B17 .619
B22 .534
B27 .880
B26 .819
B28 .676
B36
B3 .712
B4 .708
B5 .632
B6 .591
B1
B24 .604
B23 .574
B25 .548
B38
B2
B41 -.998
B40 -.971
B39 -.561
B35 -.563
B37
Extraction Method: Principal Component Analysis Rotation Method: Oblimin with Kaiser Normalization
a. Rotation converged in 42 iterations.
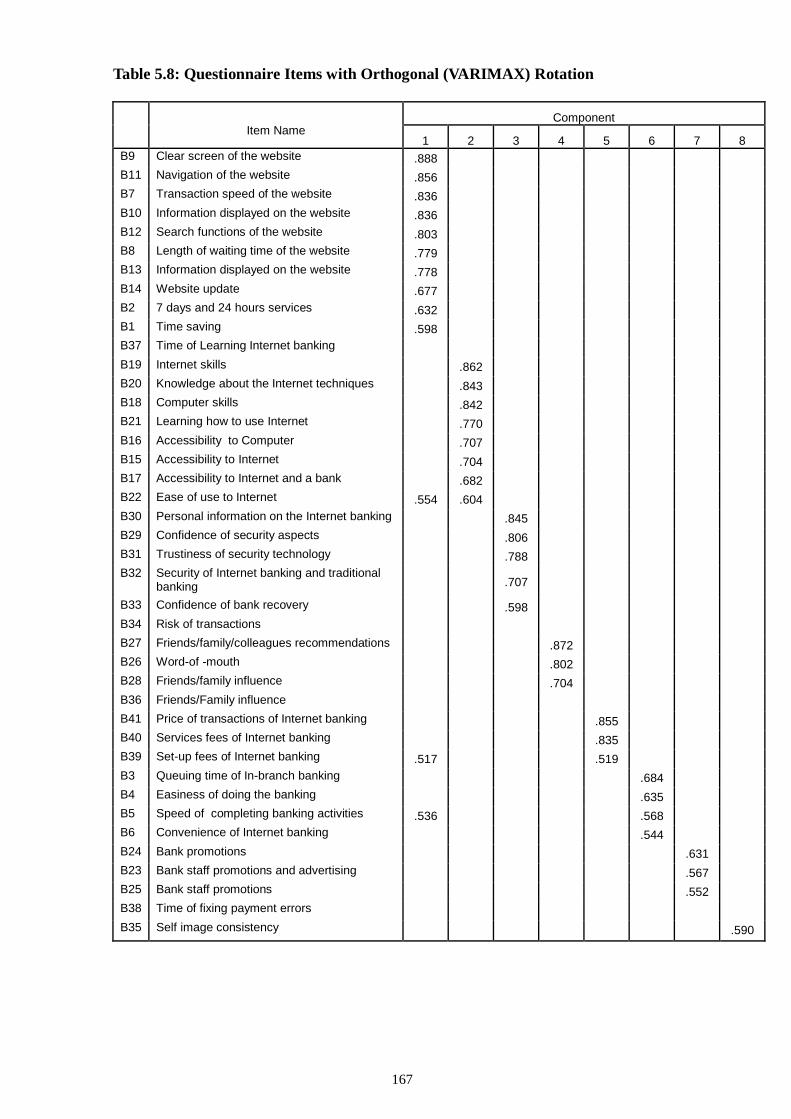
167
Table 5.8: Questionnaire Items with Orthogonal (VARIMAX) Rotation
Item Name
Component
1 2 3 4 5 6 7 8
B9 Clear screen of the website .888
B11 Navigation of the website .856
B7 Transaction speed of the website .836
B10 Information displayed on the website .836
B12 Search functions of the website .803
B8 Length of waiting time of the website .779
B13 Information displayed on the website .778
B14 Website update .677
B2 7 days and 24 hours services .632
B1 Time saving .598
B37 Time of Learning Internet banking
B19 Internet skills .862
B20 Knowledge about the Internet techniques .843
B18 Computer skills .842
B21 Learning how to use Internet .770
B16 Accessibility to Computer .707
B15 Accessibility to Internet .704
B17 Accessibility to Internet and a bank .682
B22 Ease of use to Internet .554 .604
B30 Personal information on the Internet banking .845
B29 Confidence of security aspects .806
B31 Trustiness of security technology .788
B32 Security of Internet banking and traditional banking .707
B33 Confidence of bank recovery .598
B34 Risk of transactions
B27 Friends/family/colleagues recommendations .872
B26 Word-of -mouth .802
B28 Friends/family influence .704
B36 Friends/Family influence
B41 Price of transactions of Internet banking .855
B40 Services fees of Internet banking .835
B39 Set-up fees of Internet banking .517 .519
B3 Queuing time of In-branch banking .684
B4 Easiness of doing the banking .635
B5 Speed of completing banking activities .536 .568
B6 Convenience of Internet banking .544
B24 Bank promotions .631
B23 Bank staff promotions and advertising .567
B25 Bank staff promotions .552
B38 Time of fixing payment errors
B35 Self image consistency .590
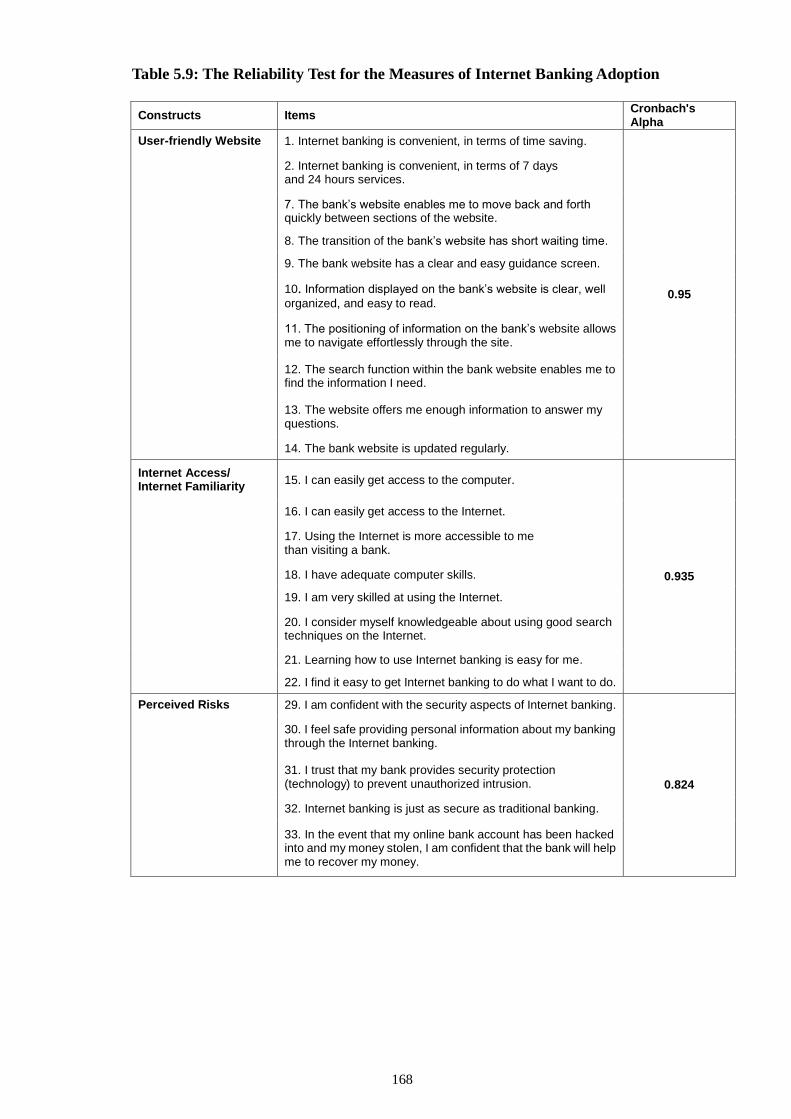
168
Table 5.9: The Reliability Test for the Measures of Internet Banking Adoption
Constructs Items Cronbach's Alpha
User-friendly Website 1. Internet banking is convenient, in terms of time saving.
0.95
2. Internet banking is convenient, in terms of 7 days and 24 hours services.
7. The bank’s website enables me to move back and forth quickly between sections of the website.
8. The transition of the bank’s website has short waiting time.
9. The bank website has a clear and easy guidance screen.
10. Information displayed on the bank’s website is clear, well
organized, and easy to read.
11. The positioning of information on the bank’s website allows me to navigate effortlessly through the site.
12. The search function within the bank website enables me to find the information I need.
13. The website offers me enough information to answer my questions.
14. The bank website is updated regularly.
Internet Access/ Internet Familiarity
15. I can easily get access to the computer.
0.935
16. I can easily get access to the Internet.
17. Using the Internet is more accessible to me than visiting a bank.
18. I have adequate computer skills.
19. I am very skilled at using the Internet.
20. I consider myself knowledgeable about using good search techniques on the Internet.
21. Learning how to use Internet banking is easy for me.
22. I find it easy to get Internet banking to do what I want to do.
Perceived Risks 29. I am confident with the security aspects of Internet banking.
0.824
30. I feel safe providing personal information about my banking through the Internet banking.
31. I trust that my bank provides security protection (technology) to prevent unauthorized intrusion.
32. Internet banking is just as secure as traditional banking.
33. In the event that my online bank account has been hacked into and my money stolen, I am confident that the bank will help me to recover my money.
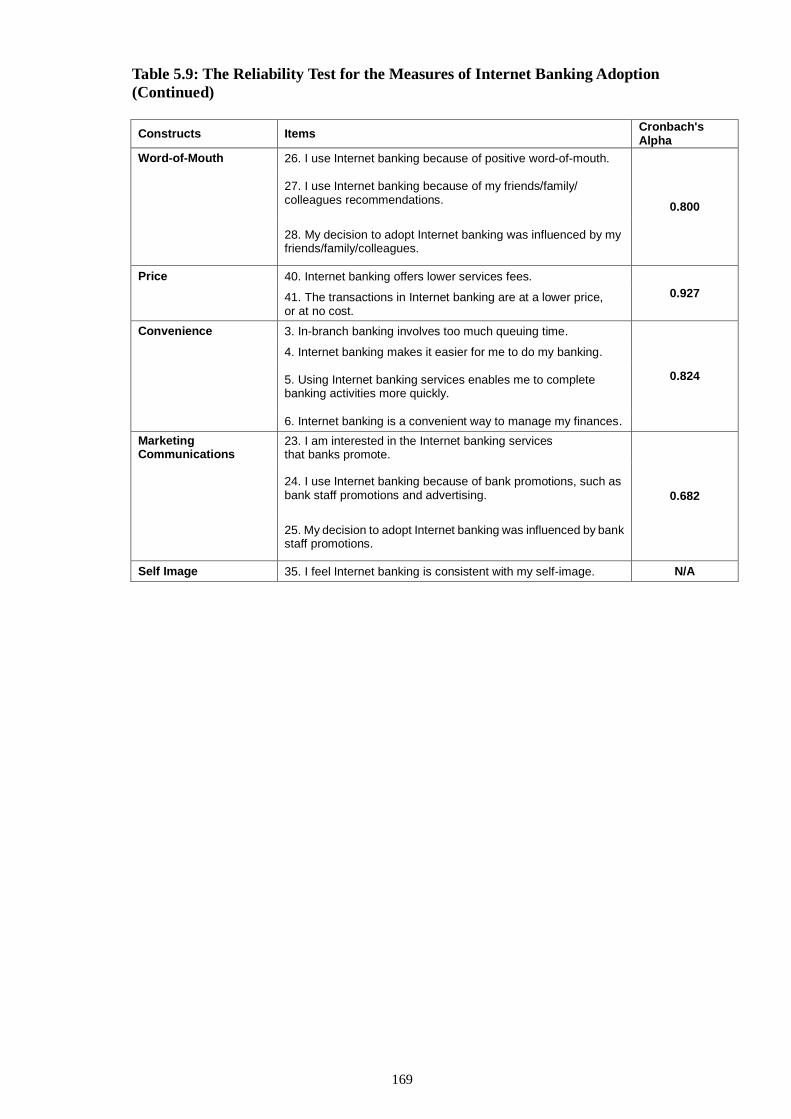
169
Table 5.9: The Reliability Test for the Measures of Internet Banking Adoption
(Continued)
Constructs Items Cronbach's Alpha
Word-of-Mouth 26. I use Internet banking because of positive word-of-mouth.
0.800
27. I use Internet banking because of my friends/family/ colleagues recommendations.
28. My decision to adopt Internet banking was influenced by my friends/family/colleagues.
Price 40. Internet banking offers lower services fees.
0.927
41. The transactions in Internet banking are at a lower price, or at no cost.
Convenience 3. In-branch banking involves too much queuing time.
0.824
4. Internet banking makes it easier for me to do my banking.
5. Using Internet banking services enables me to complete banking activities more quickly.
6. Internet banking is a convenient way to manage my finances.
Marketing Communications
23. I am interested in the Internet banking services that banks promote.
0.682
24. I use Internet banking because of bank promotions, such as bank staff promotions and advertising.
25. My decision to adopt Internet banking was influenced by bank staff promotions.
Self Image 35. I feel Internet banking is consistent with my self-image. N/A
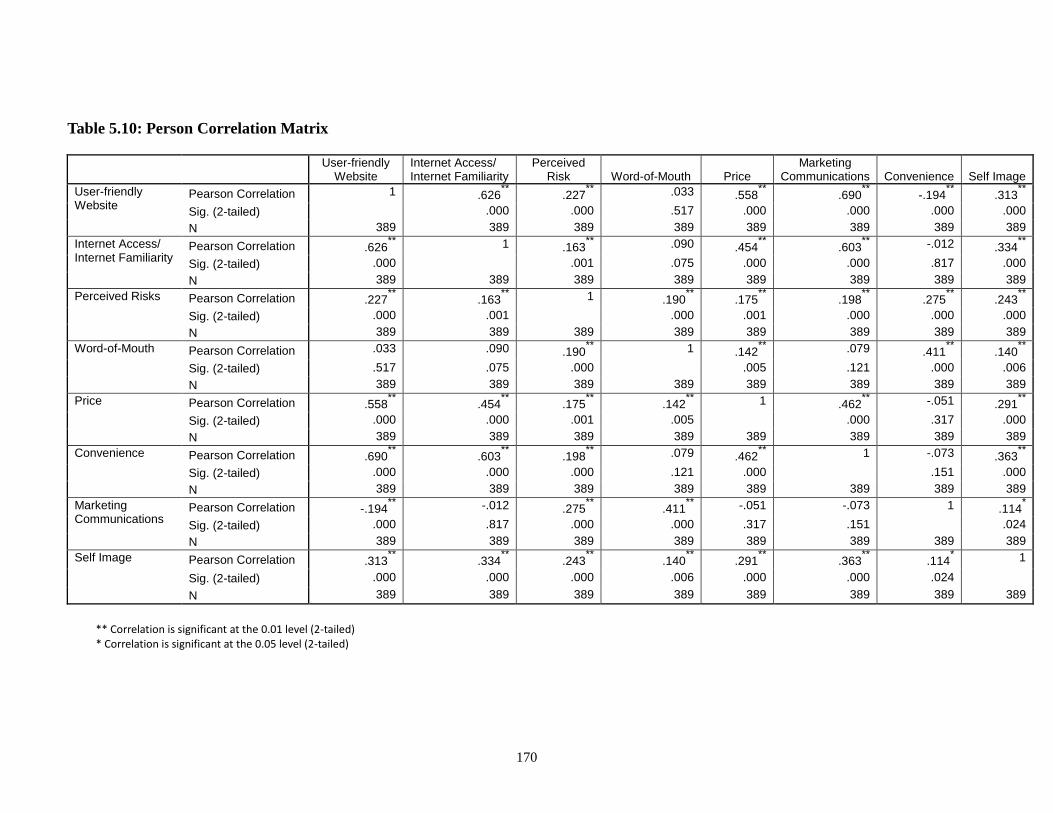
170
Table 5.10: Person Correlation Matrix
User-friendly
Website Internet Access/ Internet Familiarity
Perceived Risk Word-of-Mouth Price
Marketing Communications Convenience Self Image
User-friendly Website
Pearson Correlation 1 .626**
.227**
.033 .558**
.690**
-.194**
.313**
Sig. (2-tailed) .000 .000 .517 .000 .000 .000 .000
N 389 389 389 389 389 389 389 389
Internet Access/ Internet Familiarity
Pearson Correlation .626**
1 .163**
.090 .454**
.603**
-.012 .334**
Sig. (2-tailed) .000 .001 .075 .000 .000 .817 .000
N 389 389 389 389 389 389 389 389
Perceived Risks Pearson Correlation .227**
.163**
1 .190**
.175**
.198**
.275**
.243**
Sig. (2-tailed) .000 .001 .000 .001 .000 .000 .000
N 389 389 389 389 389 389 389 389
Word-of-Mouth Pearson Correlation .033 .090 .190**
1 .142**
.079 .411**
.140**
Sig. (2-tailed) .517 .075 .000 .005 .121 .000 .006
N 389 389 389 389 389 389 389 389
Price Pearson Correlation .558**
.454**
.175**
.142**
1 .462**
-.051 .291**
Sig. (2-tailed) .000 .000 .001 .005 .000 .317 .000
N 389 389 389 389 389 389 389 389
Convenience Pearson Correlation .690**
.603**
.198**
.079 .462**
1 -.073 .363**
Sig. (2-tailed) .000 .000 .000 .121 .000 .151 .000
N 389 389 389 389 389 389 389 389
Marketing Communications
Pearson Correlation -.194**
-.012 .275**
.411**
-.051 -.073 1 .114*
Sig. (2-tailed) .000 .817 .000 .000 .317 .151 .024
N 389 389 389 389 389 389 389 389
Self Image Pearson Correlation .313**
.334**
.243**
.140**
.291**
.363**
.114* 1
Sig. (2-tailed) .000 .000 .000 .006 .000 .000 .024
N 389 389 389 389 389 389 389 389
** Correlation is significant at the 0.01 level (2-tailed) * Correlation is significant at the 0.05 level (2-tailed)
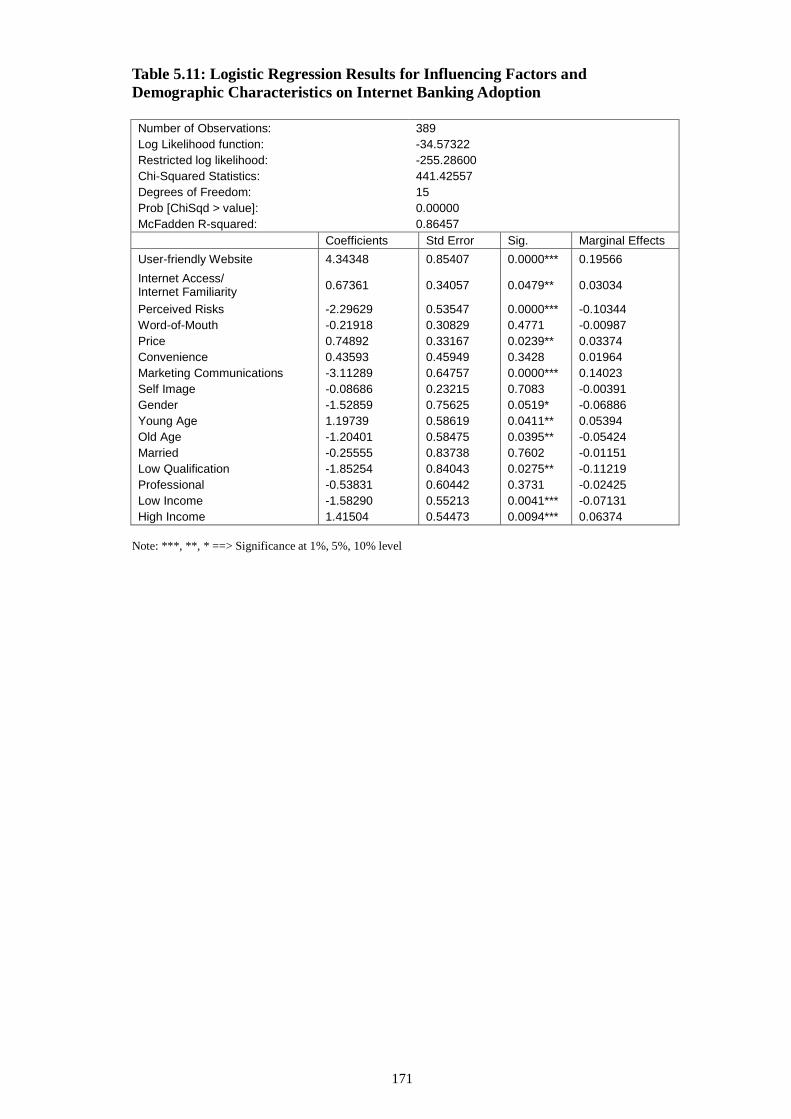
171
Table 5.11: Logistic Regression Results for Influencing Factors and
Demographic Characteristics on Internet Banking Adoption
Number of Observations: 389
Log Likelihood function: -34.57322
Restricted log likelihood: -255.28600
Chi-Squared Statistics: 441.42557
Degrees of Freedom: 15
Prob [ChiSqd > value]: 0.00000
McFadden R-squared: 0.86457
Coefficients Std Error Sig. Marginal Effects
User-friendly Website 4.34348 0.85407 0.0000*** 0.19566
Internet Access/ Internet Familiarity
0.67361 0.34057 0.0479** 0.03034
Perceived Risks -2.29629 0.53547 0.0000*** -0.10344
Word-of-Mouth -0.21918 0.30829 0.4771 -0.00987
Price 0.74892 0.33167 0.0239** 0.03374
Convenience 0.43593 0.45949 0.3428 0.01964
Marketing Communications -3.11289 0.64757 0.0000*** 0.14023
Self Image -0.08686 0.23215 0.7083 -0.00391
Gender -1.52859 0.75625 0.0519* -0.06886
Young Age 1.19739 0.58619 0.0411** 0.05394
Old Age -1.20401 0.58475 0.0395** -0.05424
Married -0.25555 0.83738 0.7602 -0.01151
Low Qualification -1.85254 0.84043 0.0275** -0.11219
Professional -0.53831 0.60442 0.3731 -0.02425
Low Income -1.58290 0.55213 0.0041*** -0.07131
High Income 1.41504 0.54473 0.0094*** 0.06374
Note: ***, **, * ==> Significance at 1%, 5%, 10% level
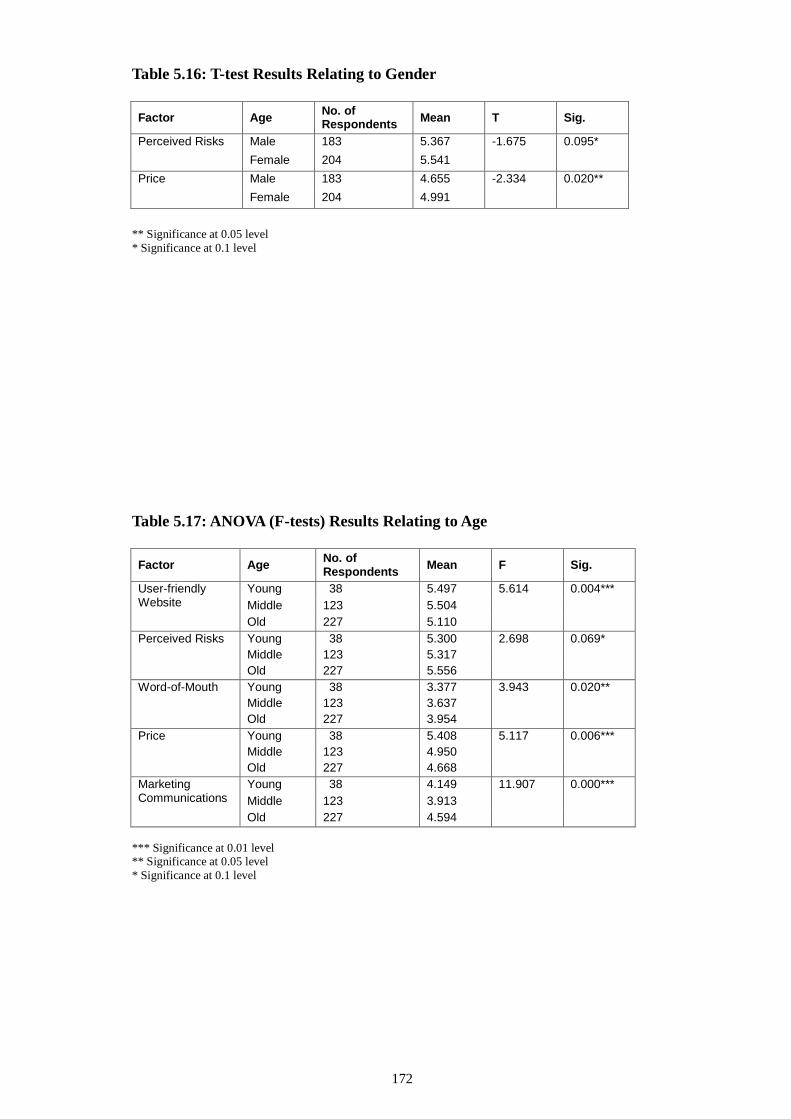
172
Table 5.16: T-test Results Relating to Gender
Factor Age No. of Respondents
Mean T Sig.
Perceived Risks Male 183 5.367 -1.675 0.095*
Female 204 5.541
Price Male 183 4.655 -2.334 0.020**
Female 204 4.991
** Significance at 0.05 level
* Significance at 0.1 level
Table 5.17: ANOVA (F-tests) Results Relating to Age
Factor Age No. of Respondents
Mean F Sig.
User-friendly Website
Young 38 5.497 5.614 0.004***
Middle 123 5.504
Old 227 5.110
Perceived Risks Young 38 5.300 2.698 0.069*
Middle 123 5.317
Old 227 5.556
Word-of-Mouth Young 38 3.377 3.943 0.020**
Middle 123 3.637
Old 227 3.954
Price Young 38 5.408 5.117 0.006***
Middle 123 4.950
Old 227 4.668
Marketing Communications
Young 38 4.149 11.907 0.000***
Middle 123 3.913
Old 227 4.594
*** Significance at 0.01 level ** Significance at 0.05 level
* Significance at 0.1 level
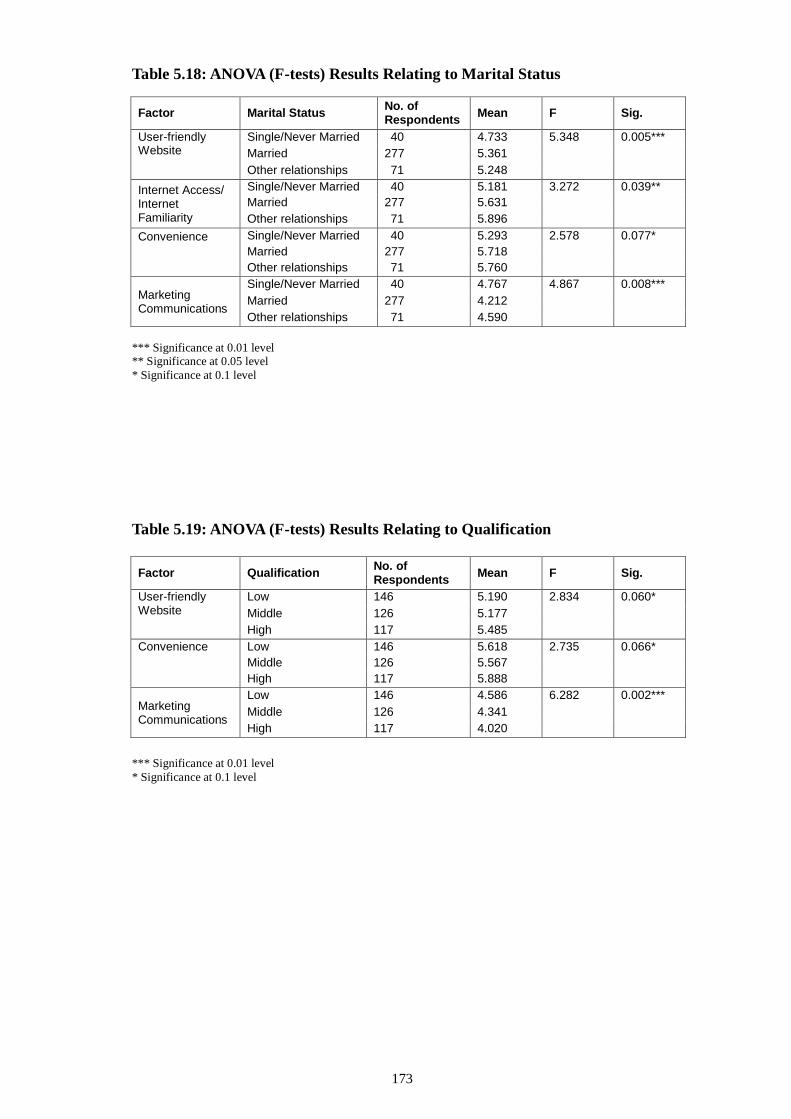
173
Table 5.18: ANOVA (F-tests) Results Relating to Marital Status
Factor Marital Status No. of Respondents
Mean F Sig.
User-friendly Website
Single/Never Married 40 4.733 5.348 0.005***
Married 277 5.361
Other relationships 71 5.248
Internet Access/ Internet Familiarity
Single/Never Married 40 5.181 3.272 0.039**
Married 277 5.631
Other relationships 71 5.896
Convenience Single/Never Married 40 5.293 2.578 0.077*
Married 277 5.718
Other relationships 71 5.760
Marketing Communications
Single/Never Married 40 4.767 4.867 0.008***
Married 277 4.212
Other relationships 71 4.590
*** Significance at 0.01 level ** Significance at 0.05 level
* Significance at 0.1 level
Table 5.19: ANOVA (F-tests) Results Relating to Qualification
Factor Qualification No. of Respondents
Mean F Sig.
User-friendly Website
Low 146 5.190 2.834 0.060*
Middle 126 5.177
High 117 5.485
Convenience Low 146 5.618 2.735 0.066*
Middle 126 5.567
High 117 5.888
Marketing Communications
Low 146 4.586 6.282 0.002***
Middle 126 4.341
High 117 4.020
*** Significance at 0.01 level
* Significance at 0.1 level
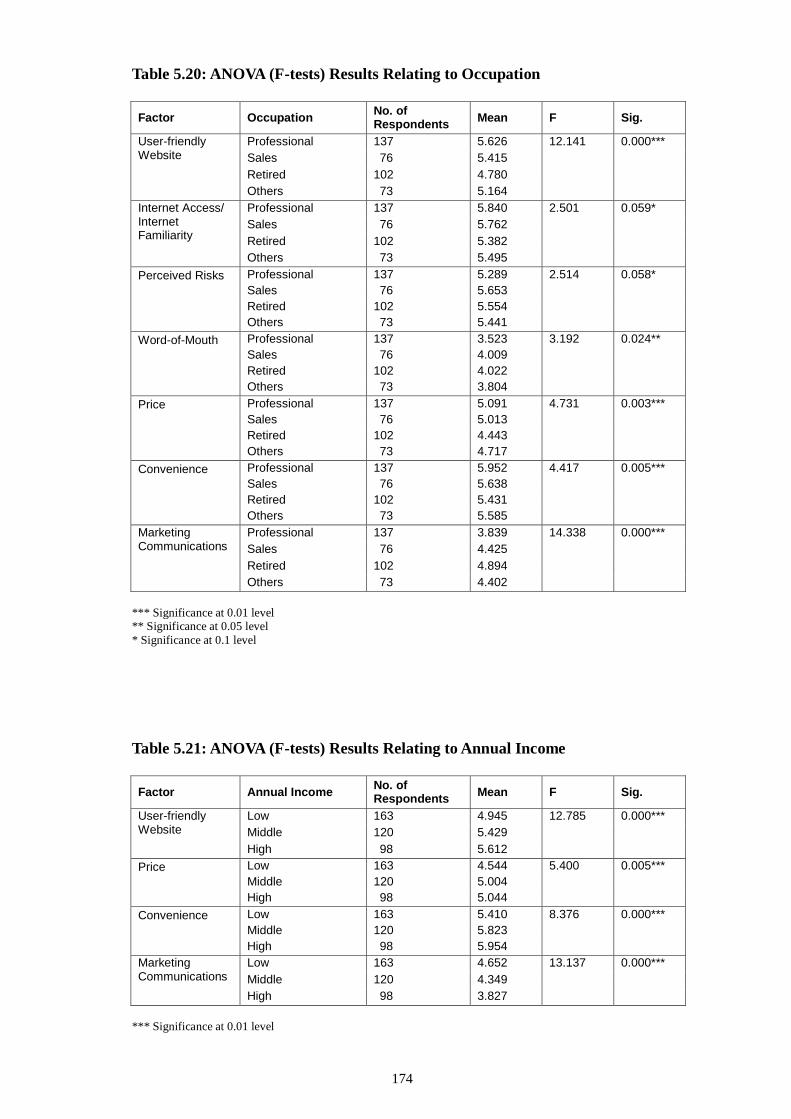
174
Table 5.20: ANOVA (F-tests) Results Relating to Occupation
Factor Occupation No. of Respondents
Mean F Sig.
User-friendly Website
Professional 137 5.626 12.141 0.000***
Sales 76 5.415
Retired 102 4.780
Others 73 5.164
Internet Access/ Internet Familiarity
Professional 137 5.840 2.501 0.059*
Sales 76 5.762
Retired 102 5.382
Others 73 5.495
Perceived Risks Professional 137 5.289 2.514 0.058*
Sales 76 5.653
Retired 102 5.554
Others 73 5.441
Word-of-Mouth Professional 137 3.523 3.192 0.024**
Sales 76 4.009
Retired 102 4.022
Others 73 3.804
Price Professional 137 5.091 4.731 0.003***
Sales 76 5.013
Retired 102 4.443
Others 73 4.717
Convenience Professional 137 5.952 4.417 0.005***
Sales 76 5.638
Retired 102 5.431
Others 73 5.585
Marketing Communications
Professional 137 3.839 14.338 0.000***
Sales 76 4.425
Retired 102 4.894
Others 73 4.402
*** Significance at 0.01 level ** Significance at 0.05 level
* Significance at 0.1 level
Table 5.21: ANOVA (F-tests) Results Relating to Annual Income
Factor Annual Income No. of Respondents
Mean F Sig.
User-friendly Website
Low 163 4.945 12.785 0.000***
Middle 120 5.429
High 98 5.612
Price Low 163 4.544 5.400 0.005***
Middle 120 5.004
High 98 5.044
Convenience Low 163 5.410 8.376 0.000***
Middle 120 5.823
High 98 5.954
Marketing Communications
Low 163 4.652 13.137 0.000***
Middle 120 4.349
High 98 3.827
*** Significance at 0.01 level
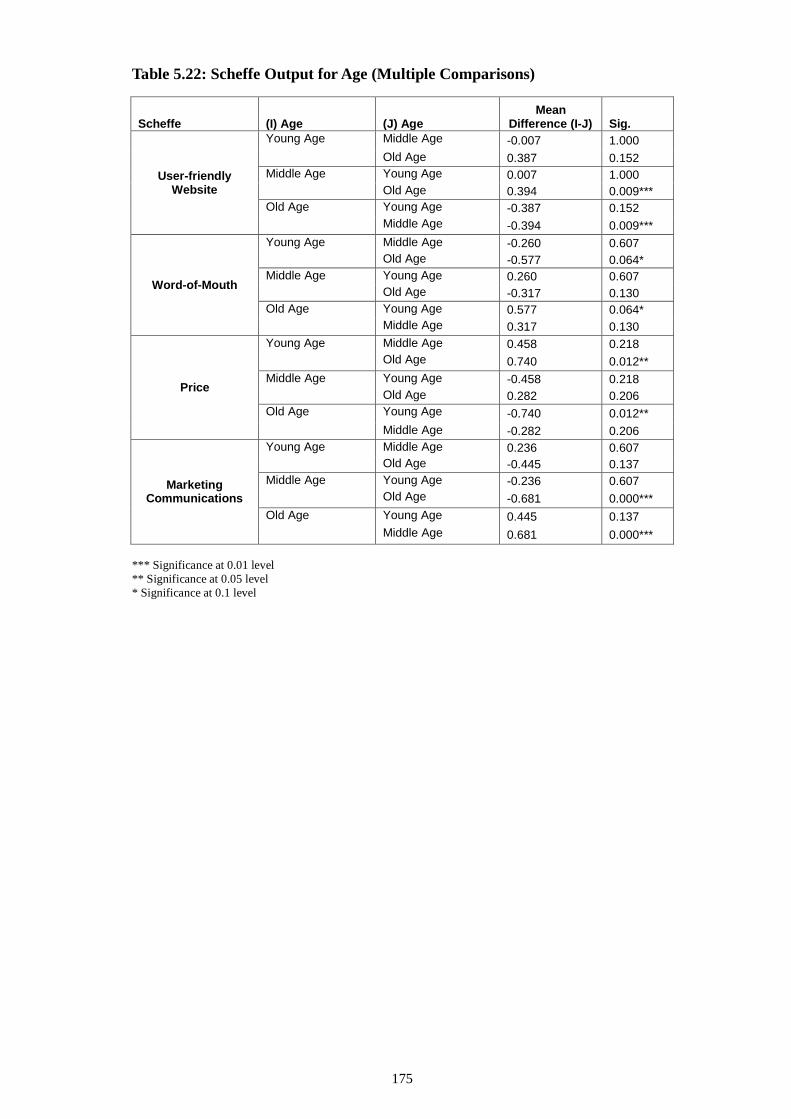
175
Table 5.22: Scheffe Output for Age (Multiple Comparisons)
Scheffe (I) Age (J) Age Mean
Difference (I-J) Sig.
User-friendly Website
Young Age Middle Age -0.007 1.000
Old Age 0.387 0.152
Middle Age Young Age 0.007 1.000
Old Age 0.394 0.009***
Old Age Young Age -0.387 0.152
Middle Age -0.394 0.009***
Word-of-Mouth
Young Age Middle Age -0.260 0.607
Old Age -0.577 0.064*
Middle Age Young Age 0.260 0.607
Old Age -0.317 0.130
Old Age Young Age 0.577 0.064*
Middle Age 0.317 0.130
Price
Young Age Middle Age 0.458 0.218
Old Age 0.740 0.012**
Middle Age Young Age -0.458 0.218
Old Age 0.282 0.206
Old Age Young Age -0.740 0.012**
Middle Age -0.282 0.206
Marketing Communications
Young Age Middle Age 0.236 0.607
Old Age -0.445 0.137
Middle Age Young Age -0.236 0.607
Old Age -0.681 0.000***
Old Age Young Age 0.445 0.137
Middle Age 0.681 0.000***
*** Significance at 0.01 level
** Significance at 0.05 level
* Significance at 0.1 level
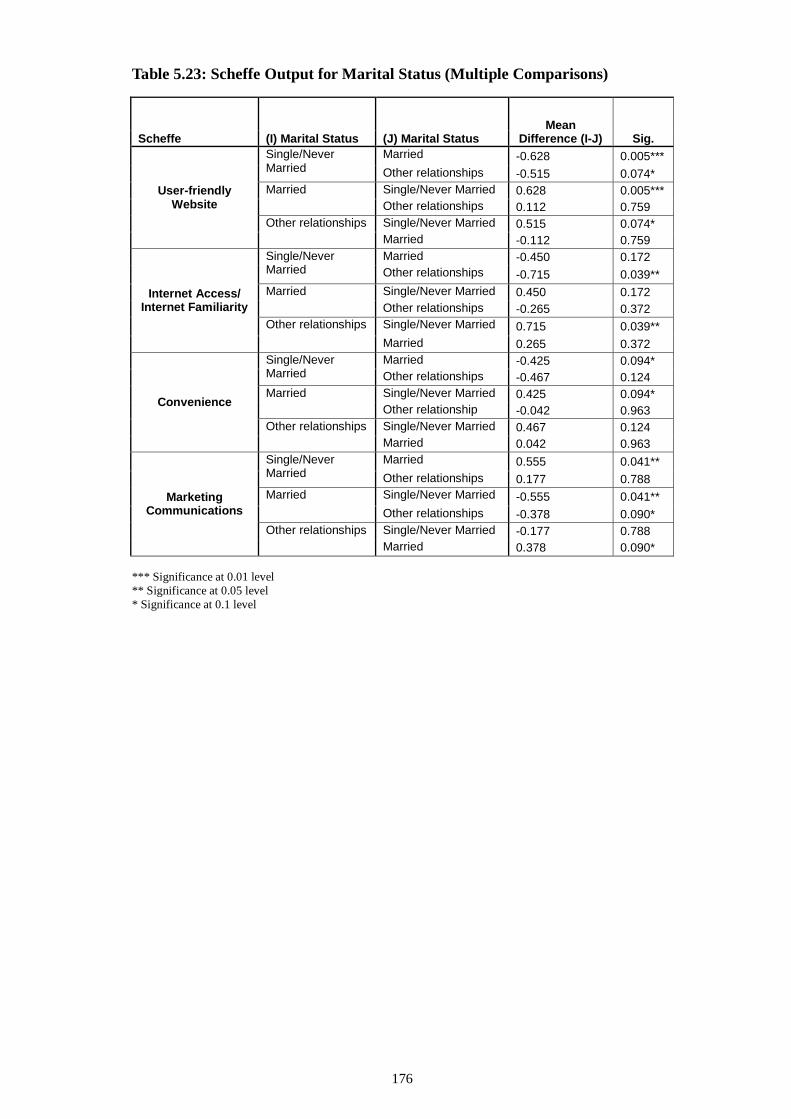
176
Table 5.23: Scheffe Output for Marital Status (Multiple Comparisons)
Scheffe (I) Marital Status (J) Marital Status Mean
Difference (I-J) Sig.
User-friendly Website
Single/Never Married
Married -0.628 0.005***
Other relationships -0.515 0.074*
Married Single/Never Married 0.628 0.005***
Other relationships 0.112 0.759
Other relationships Single/Never Married 0.515 0.074*
Married -0.112 0.759
Internet Access/ Internet Familiarity
Single/Never Married
Married -0.450 0.172
Other relationships -0.715 0.039**
Married Single/Never Married 0.450 0.172
Other relationships -0.265 0.372
Other relationships Single/Never Married 0.715 0.039**
Married 0.265 0.372
Convenience
Single/Never Married
Married -0.425 0.094*
Other relationships -0.467 0.124
Married Single/Never Married 0.425 0.094*
Other relationship -0.042 0.963
Other relationships Single/Never Married 0.467 0.124
Married 0.042 0.963
Marketing Communications
Single/Never Married
Married 0.555 0.041**
Other relationships 0.177 0.788
Married Single/Never Married -0.555 0.041**
Other relationships -0.378 0.090*
Other relationships Single/Never Married -0.177 0.788
Married 0.378 0.090*
*** Significance at 0.01 level
** Significance at 0.05 level
* Significance at 0.1 level
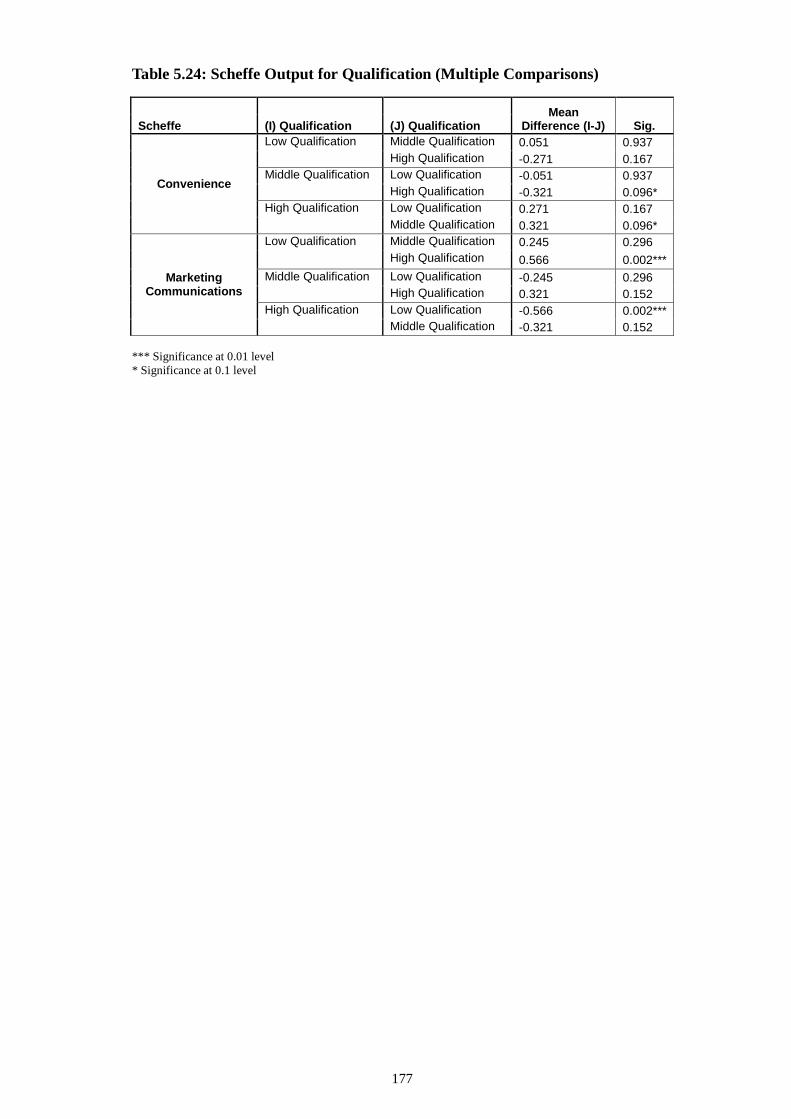
177
Table 5.24: Scheffe Output for Qualification (Multiple Comparisons)
Scheffe (I) Qualification (J) Qualification Mean
Difference (I-J) Sig.
Convenience
Low Qualification Middle Qualification 0.051 0.937
High Qualification -0.271 0.167
Middle Qualification Low Qualification -0.051 0.937
High Qualification -0.321 0.096*
High Qualification Low Qualification 0.271 0.167
Middle Qualification 0.321 0.096*
Marketing Communications
Low Qualification Middle Qualification 0.245 0.296
High Qualification 0.566 0.002***
Middle Qualification Low Qualification -0.245 0.296
High Qualification 0.321 0.152
High Qualification Low Qualification -0.566 0.002***
Middle Qualification -0.321 0.152
*** Significance at 0.01 level
* Significance at 0.1 level
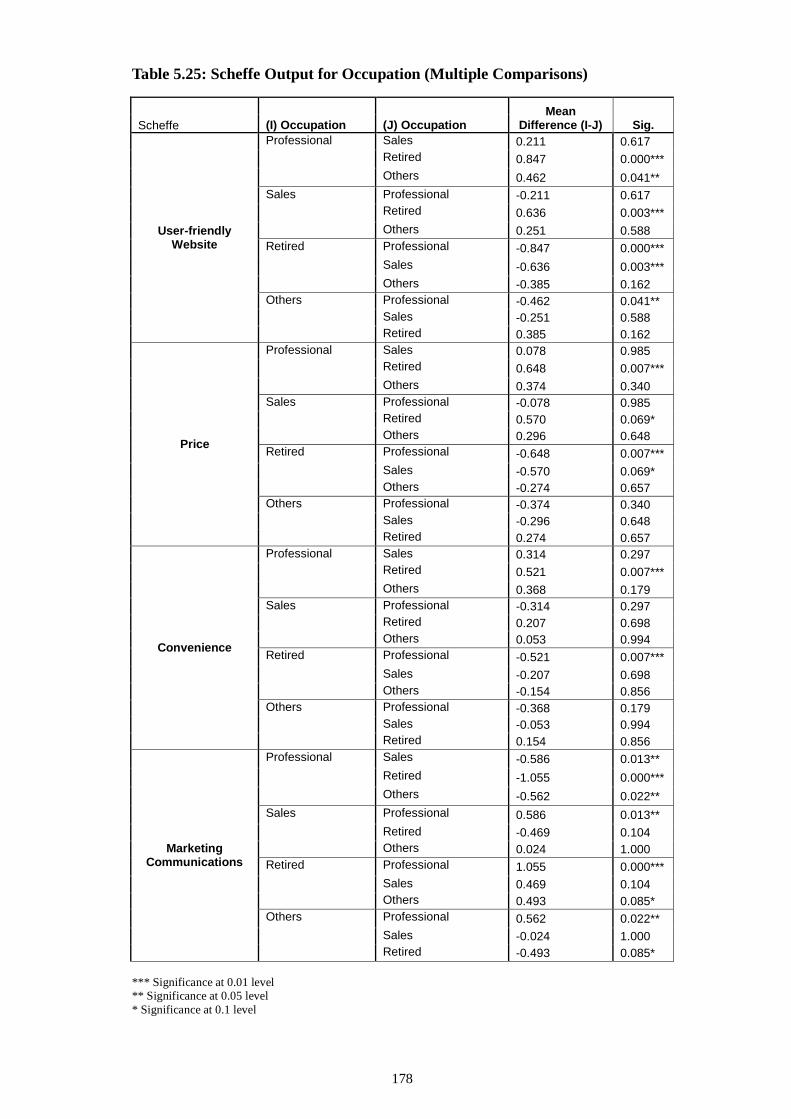
178
Table 5.25: Scheffe Output for Occupation (Multiple Comparisons)
Scheffe (I) Occupation (J) Occupation Mean
Difference (I-J) Sig.
User-friendly Website
Professional Sales 0.211 0.617
Retired 0.847 0.000***
Others 0.462 0.041**
Sales Professional -0.211 0.617
Retired 0.636 0.003***
Others 0.251 0.588
Retired Professional -0.847 0.000***
Sales -0.636 0.003***
Others -0.385 0.162
Others Professional -0.462 0.041**
Sales -0.251 0.588
Retired 0.385 0.162
Price
Professional Sales 0.078 0.985
Retired 0.648 0.007***
Others 0.374 0.340
Sales Professional -0.078 0.985
Retired 0.570 0.069*
Others 0.296 0.648
Retired Professional -0.648 0.007***
Sales -0.570 0.069*
Others -0.274 0.657
Others Professional -0.374 0.340
Sales -0.296 0.648
Retired 0.274 0.657
Convenience
Professional Sales 0.314 0.297
Retired 0.521 0.007***
Others 0.368 0.179
Sales Professional -0.314 0.297
Retired 0.207 0.698
Others 0.053 0.994
Retired Professional -0.521 0.007***
Sales -0.207 0.698
Others -0.154 0.856
Others Professional -0.368 0.179
Sales -0.053 0.994
Retired 0.154 0.856
Marketing Communications
Professional Sales -0.586 0.013**
Retired -1.055 0.000***
Others -0.562 0.022**
Sales Professional 0.586 0.013**
Retired -0.469 0.104
Others 0.024 1.000
Retired Professional 1.055 0.000***
Sales 0.469 0.104
Others 0.493 0.085*
Others Professional 0.562 0.022**
Sales -0.024 1.000
Retired -0.493 0.085*
*** Significance at 0.01 level ** Significance at 0.05 level
* Significance at 0.1 level
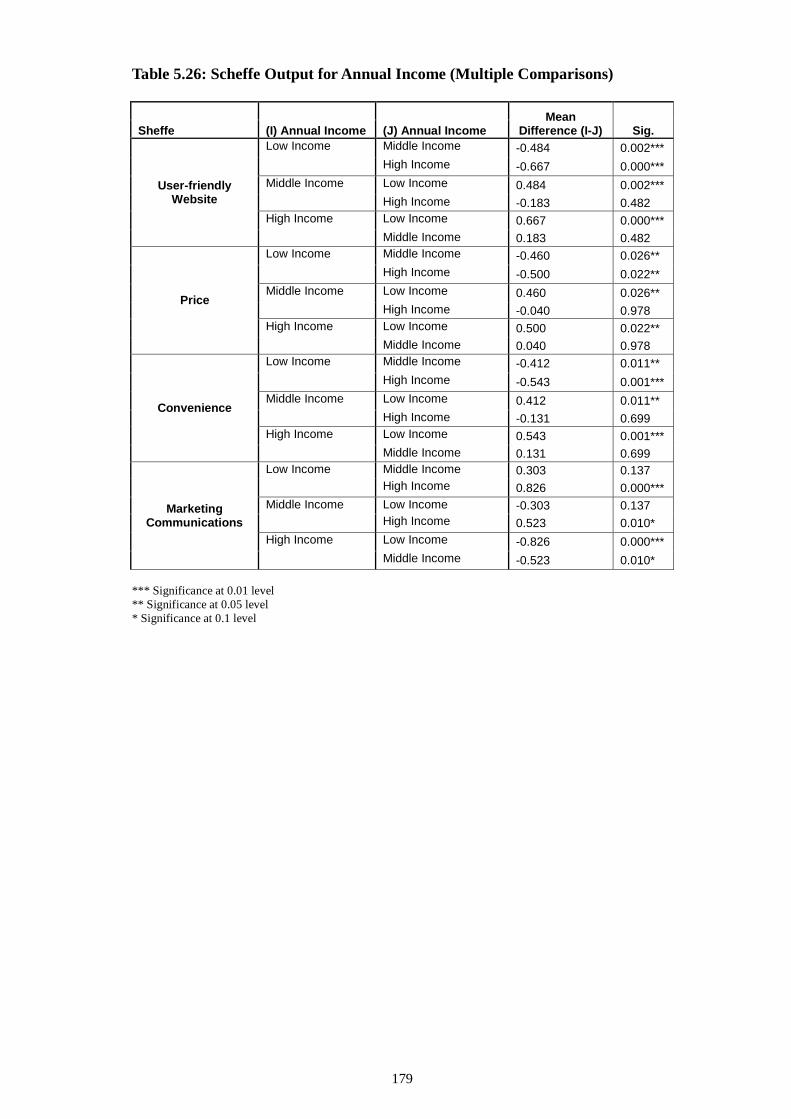
179
Table 5.26: Scheffe Output for Annual Income (Multiple Comparisons)
Sheffe (I) Annual Income (J) Annual Income Mean
Difference (I-J) Sig.
User-friendly Website
Low Income Middle Income -0.484 0.002***
High Income -0.667 0.000***
Middle Income Low Income 0.484 0.002***
High Income -0.183 0.482
High Income Low Income 0.667 0.000***
Middle Income 0.183 0.482
Price
Low Income Middle Income -0.460 0.026**
High Income -0.500 0.022**
Middle Income Low Income 0.460 0.026**
High Income -0.040 0.978
High Income Low Income 0.500 0.022**
Middle Income 0.040 0.978
Convenience
Low Income Middle Income -0.412 0.011**
High Income -0.543 0.001***
Middle Income Low Income 0.412 0.011**
High Income -0.131 0.699
High Income Low Income 0.543 0.001***
Middle Income 0.131 0.699
Marketing Communications
Low Income Middle Income 0.303 0.137
High Income 0.826 0.000***
Middle Income Low Income -0.303 0.137
High Income 0.523 0.010*
High Income Low Income -0.826 0.000***
Middle Income -0.523 0.010*
*** Significance at 0.01 level
** Significance at 0.05 level
* Significance at 0.1 level

180
Appendix: 1: Cover Letter
Faculty of Commerce
T 64 3 325 2811 F 64 3 325 3847
PO Box 84, Lincoln University Lincoln 7647, Christchurch
New Zealand www.lincoln.ac.nz
26 August 2010
Dear Sir/Madam
You are invited to participate in a survey that constitutes to part of my Master of Commerce and
Management thesis at Lincoln University. The purpose of the thesis research is to identify the factors
that consumers use when they decide to adopt or not adopt Internet banking services.
You have been randomly selected to participate in this research. While participation is voluntary, your
participation is important as the success of this research depends upon receiving a thoughtful response
from you. If you are 18 years or above, I would be extremely grateful if you would complete the
attached questionnaire and return it in the enclosed pre-paid envelope by 31 October 2010. This
survey will take approximately 10-15 minutes to complete.
Complete anonymity is assured in this survey. No questions are asked which would identify you as an
individual and the identification number on the questionnaire is used for posting purposes and data
analysis only. All responses will be aggregated for analysis using the identification number only, and
no personal details will be reported in the thesis or any future publications. This research is
completely voluntary and returning a completed questionnaire implies consent to participate in this
survey.
If you have any questions about this survey, please contact me on 021 675 796 or by email at
This project has been approved by Lincoln University Human Ethics Committee. Thank you for your
kind co-operation and assistance.
Yours Sincerely
Vivian J H Du
Master Student of Faculty Commerce
Lincoln University
Research Supervisors:
Mr. Michael D. Clemes Dr. Christopher Gan
Senior Lecture Senior Lecture
Commerce Division Commerce Division
Lincoln University Lincoln University
Ph: (03) 325 2811 ext 8292 Ph: (03) 325 2811 ext 8155
Email: [email protected] Email: [email protected]
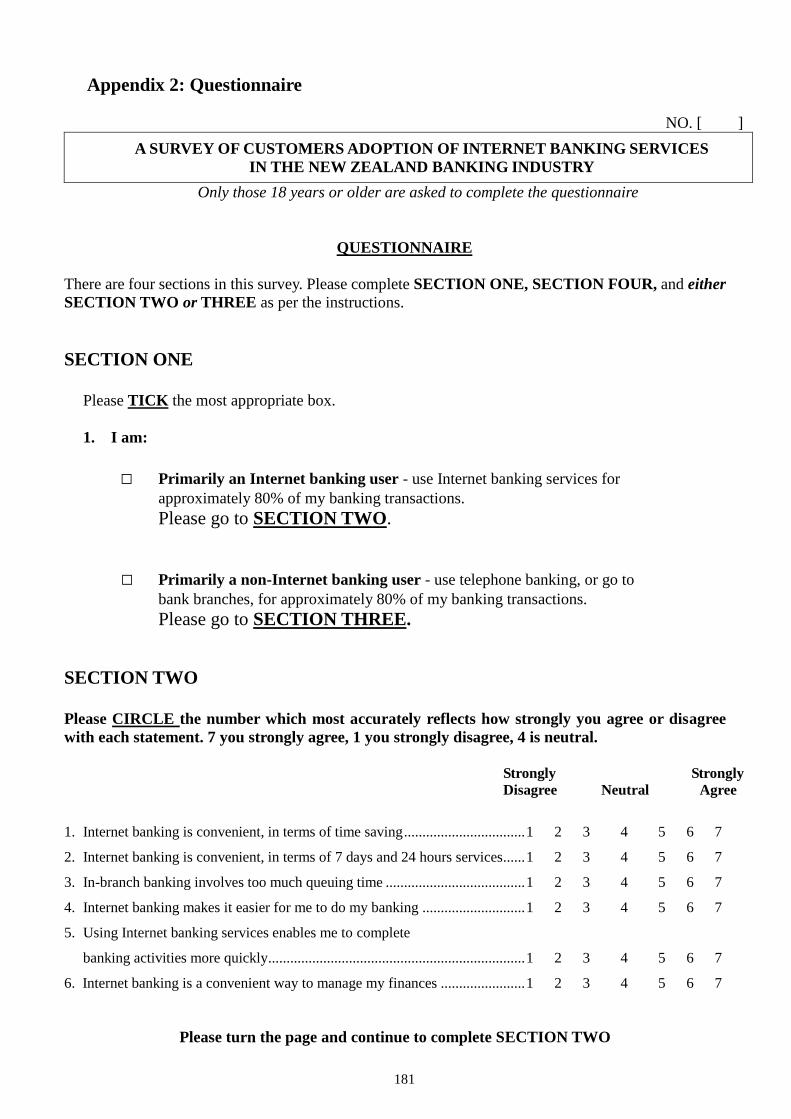
181
Appendix 2: Questionnaire
NO. [ ]
A SURVEY OF CUSTOMERS ADOPTION OF INTERNET BANKING SERVICES
IN THE NEW ZEALAND BANKING INDUSTRY
Only those 18 years or older are asked to complete the questionnaire
QUESTIONNAIRE
There are four sections in this survey. Please complete SECTION ONE, SECTION FOUR, and either
SECTION TWO or THREE as per the instructions.
SECTION ONE
Please TICK the most appropriate box.
1. I am:
□ Primarily an Internet banking user - use Internet banking services for
approximately 80% of my banking transactions.
Please go to SECTION TWO.
□ Primarily a non-Internet banking user - use telephone banking, or go to
bank branches, for approximately 80% of my banking transactions.
Please go to SECTION THREE.
SECTION TWO
Please CIRCLE the number which most accurately reflects how strongly you agree or disagree
with each statement. 7 you strongly agree, 1 you strongly disagree, 4 is neutral.
Strongly Strongly
Disagree Neutral Agree
1. Internet banking is convenient, in terms of time saving ................................. 1 2 3 4 5 6 7
2. Internet banking is convenient, in terms of 7 days and 24 hours services ...... 1 2 3 4 5 6 7
3. In-branch banking involves too much queuing time ...................................... 1 2 3 4 5 6 7
4. Internet banking makes it easier for me to do my banking ............................ 1 2 3 4 5 6 7
5. Using Internet banking services enables me to complete
banking activities more quickly...................................................................... 1 2 3 4 5 6 7
6. Internet banking is a convenient way to manage my finances ....................... 1 2 3 4 5 6 7
Please turn the page and continue to complete SECTION TWO
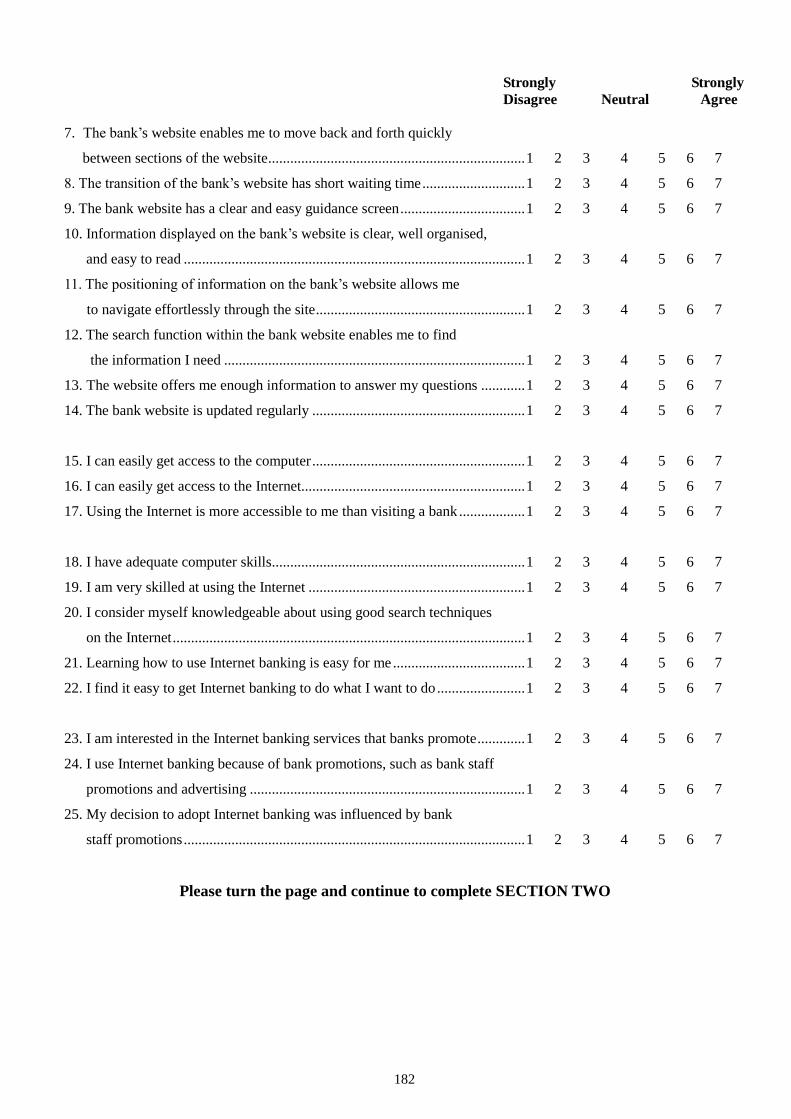
182
Strongly Strongly
Disagree Neutral Agree
7. The bank’s website enables me to move back and forth quickly
between sections of the website ...................................................................... 1 2 3 4 5 6 7
8. The transition of the bank’s website has short waiting time ............................ 1 2 3 4 5 6 7
9. The bank website has a clear and easy guidance screen .................................. 1 2 3 4 5 6 7
10. Information displayed on the bank’s website is clear, well organised,
and easy to read ............................................................................................. 1 2 3 4 5 6 7
11. The positioning of information on the bank’s website allows me
to navigate effortlessly through the site ......................................................... 1 2 3 4 5 6 7
12. The search function within the bank website enables me to find
the information I need .................................................................................. 1 2 3 4 5 6 7
13. The website offers me enough information to answer my questions ............ 1 2 3 4 5 6 7
14. The bank website is updated regularly .......................................................... 1 2 3 4 5 6 7
15. I can easily get access to the computer .......................................................... 1 2 3 4 5 6 7
16. I can easily get access to the Internet............................................................. 1 2 3 4 5 6 7
17. Using the Internet is more accessible to me than visiting a bank .................. 1 2 3 4 5 6 7
18. I have adequate computer skills ..................................................................... 1 2 3 4 5 6 7
19. I am very skilled at using the Internet ........................................................... 1 2 3 4 5 6 7
20. I consider myself knowledgeable about using good search techniques
on the Internet ................................................................................................ 1 2 3 4 5 6 7
21. Learning how to use Internet banking is easy for me .................................... 1 2 3 4 5 6 7
22. I find it easy to get Internet banking to do what I want to do ........................ 1 2 3 4 5 6 7
23. I am interested in the Internet banking services that banks promote ............. 1 2 3 4 5 6 7
24. I use Internet banking because of bank promotions, such as bank staff
promotions and advertising ........................................................................... 1 2 3 4 5 6 7
25. My decision to adopt Internet banking was influenced by bank
staff promotions ............................................................................................. 1 2 3 4 5 6 7
Please turn the page and continue to complete SECTION TWO

183
Strongly Strongly
Disagree Neutral Agree
26. I use Internet banking because of positive word-of-mouth ........................... 1 2 3 4 5 6 7
27. I use Internet banking because of my friends/family/colleagues
recommendations ........................................................................................... 1 2 3 4 5 6 7
28. My decision to adopt Internet banking was influenced by my friends/
family/colleagues ........................................................................................... 1 2 3 4 5 6 7
29. I am confident with the security aspects of Internet banking ........................ 1 2 3 4 5 6 7
30. I feel safe providing personal information about my banking through
the Internet banking ....................................................................................... 1 2 3 4 5 6 7
31. I trust that my bank provides security protection (technology)
to prevent unauthorized intrusion ................................................................. 1 2 3 4 5 6 7
32. Internet banking is just as secure as traditional banking ............................... 1 2 3 4 5 6 7
33. In the event that my online bank account has been hacked into and my
money stolen, I am confident that the bank will help me to recover
my money ..................................................................................................... 1 2 3 4 5 6 7
34. There is a low risk that a transaction of transferring money or
standing order may not be processed using Internet banking ........................ 1 2 3 4 5 6 7
35. I feel Internet banking is consistent with my self-image ............................... 1 2 3 4 5 6 7
36. I believe my friends/family will disapprove if I do not use
Internet banking ............................................................................................. 1 2 3 4 5 6 7
37. Learning Internet banking does not involve too much time .......................... 1 2 3 4 5 6 7
38. It does not take me a lot of time to fix payment errors when
carrying out my banking transactions over the Internet ................................ 1 2 3 4 5 6 7
39. Internet banking is not expensive to set-up ................................................... 1 2 3 4 5 6 7
40. Internet banking offers lower services fees ................................................... 1 2 3 4 5 6 7
41. The transactions in Internet banking are at a lower price, or at no cost... ..... 1 2 3 4 5 6 7
Please go to page 6 and complete SECTION FOUR
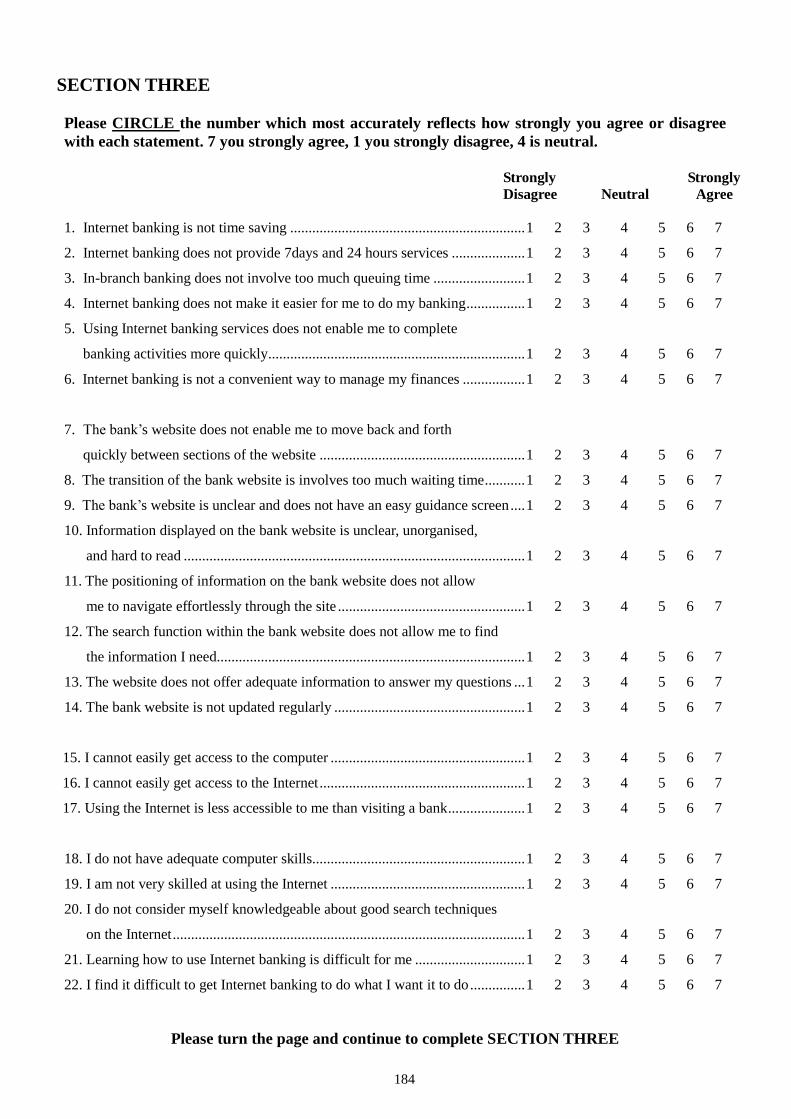
184
SECTION THREE
Please CIRCLE the number which most accurately reflects how strongly you agree or disagree
with each statement. 7 you strongly agree, 1 you strongly disagree, 4 is neutral.
Strongly Strongly
Disagree Neutral Agree
1. Internet banking is not time saving ................................................................ 1 2 3 4 5 6 7
2. Internet banking does not provide 7days and 24 hours services .................... 1 2 3 4 5 6 7
3. In-branch banking does not involve too much queuing time ......................... 1 2 3 4 5 6 7
4. Internet banking does not make it easier for me to do my banking ................ 1 2 3 4 5 6 7
5. Using Internet banking services does not enable me to complete
banking activities more quickly...................................................................... 1 2 3 4 5 6 7
6. Internet banking is not a convenient way to manage my finances ................. 1 2 3 4 5 6 7
7. The bank’s website does not enable me to move back and forth
quickly between sections of the website ........................................................ 1 2 3 4 5 6 7
8. The transition of the bank website is involves too much waiting time ........... 1 2 3 4 5 6 7
9. The bank’s website is unclear and does not have an easy guidance screen .... 1 2 3 4 5 6 7
10. Information displayed on the bank website is unclear, unorganised,
and hard to read ............................................................................................. 1 2 3 4 5 6 7
11. The positioning of information on the bank website does not allow
me to navigate effortlessly through the site ................................................... 1 2 3 4 5 6 7
12. The search function within the bank website does not allow me to find
the information I need.................................................................................... 1 2 3 4 5 6 7
13. The website does not offer adequate information to answer my questions ... 1 2 3 4 5 6 7
14. The bank website is not updated regularly .................................................... 1 2 3 4 5 6 7
15. I cannot easily get access to the computer ..................................................... 1 2 3 4 5 6 7
16. I cannot easily get access to the Internet ........................................................ 1 2 3 4 5 6 7
17. Using the Internet is less accessible to me than visiting a bank ..................... 1 2 3 4 5 6 7
18. I do not have adequate computer skills.......................................................... 1 2 3 4 5 6 7
19. I am not very skilled at using the Internet ..................................................... 1 2 3 4 5 6 7
20. I do not consider myself knowledgeable about good search techniques
on the Internet ................................................................................................ 1 2 3 4 5 6 7
21. Learning how to use Internet banking is difficult for me .............................. 1 2 3 4 5 6 7
22. I find it difficult to get Internet banking to do what I want it to do ............... 1 2 3 4 5 6 7
Please turn the page and continue to complete SECTION THREE

185
Strongly Strongly
Disagree Neutral Agree
23. I am not interested in the Internet banking services that banks promote ....... 1 2 3 4 5 6 7
24. I do not use Internet banking because I am not aware of any bank
promotions, such as bank staff promotions and/or advertising...................... 1 2 3 4 5 6 7
25. Bank staff promotions do not influence my decision to adopt
Internet banking ............................................................................................. 1 2 3 4 5 6 7
26. I do not use Internet banking because of negative word-of-mouth ............... 1 2 3 4 5 6 7
27. I do not use Internet banking because my friends/family/colleagues
do not recommend Internet banking to me .................................................... 1 2 3 4 5 6 7
28. My friends/family/colleagues do not try to persuade me to use
Internet banking ............................................................................................. 1 2 3 4 5 6 7
29. I am not confident with the security aspects of Internet banking .......... ....... 1 2 3 4 5 6 7
30. I do not feel safe providing personal privacy information through
Internet banking ..................................................................................... ....... 1 2 3 4 5 6 7
31. I do not trust that the bank provides security protection (the technology)
to prevent unauthorized intrusion .......................................................... ....... 1 2 3 4 5 6 7
32. Internet banking is not as secure as traditional banking ................................ 1 2 3 4 5 6 7
33. In the event that my online bank account has been hacked into
and my money stolen, I am not confident that the bank will help
me to recover my money ............................................................................... 1 2 3 4 5 6 7
34. There is a high risk that a transaction of transferring money,
or standing order, may not be processed using the Internet banking ............. 1 2 3 4 5 6 7
35. I feel Internet banking is not consistent with my self-image ......................... 1 2 3 4 5 6 7
36. I believe my friends/family will disapprove if I use Internet banking ........... 1 2 3 4 5 6 7
37. Learning Internet banking involves too much time ....................................... 1 2 3 4 5 6 7
38. It will take me a lot of time to fix payment errors when carrying out
my banking transactions over the Internet ..................................................... 1 2 3 4 5 6 7
39. Internet banking is expensive to set-up ......................................................... 1 2 3 4 5 6 7
40. Internet banking has higher services fees. ..................................................... 1 2 3 4 5 6 7
41. The transactions in Internet banking are expensive. ..................................... 1 2 3 4 5 6 7
Please go to page 6 and complete SECTION FOUR
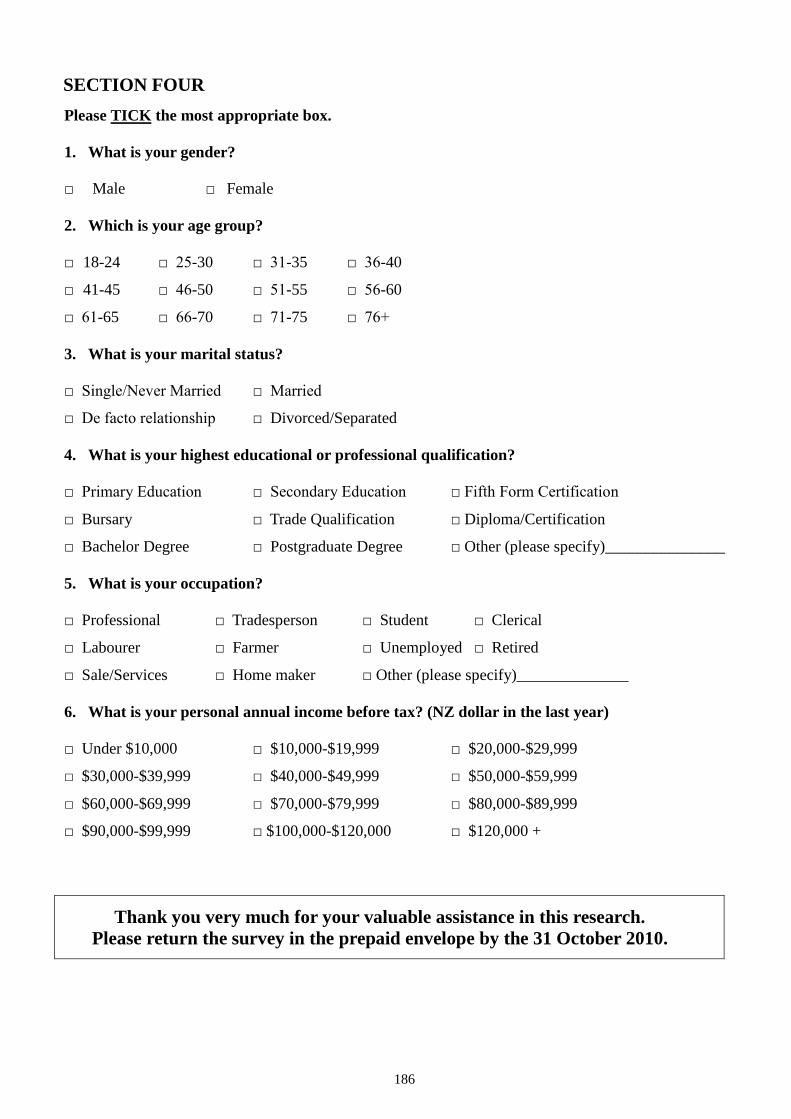
186
SECTION FOUR
Please TICK the most appropriate box.
1. What is your gender?
□ Male □ Female
2. Which is your age group?
□ 18-24 □ 25-30 □ 31-35 □ 36-40
□ 41-45 □ 46-50 □ 51-55 □ 56-60
□ 61-65 □ 66-70 □ 71-75 □ 76+
3. What is your marital status?
□ Single/Never Married □ Married
□ De facto relationship □ Divorced/Separated
4. What is your highest educational or professional qualification?
□ Primary Education □ Secondary Education □ Fifth Form Certification
□ Bursary □ Trade Qualification □ Diploma/Certification
□ Bachelor Degree □ Postgraduate Degree □ Other (please specify)_______________
5. What is your occupation?
□ Professional □ Tradesperson □ Student □ Clerical
□ Labourer □ Farmer □ Unemployed □ Retired
□ Sale/Services □ Home maker □ Other (please specify)______________
6. What is your personal annual income before tax? (NZ dollar in the last year)
□ Under $10,000 □ $10,000-$19,999 □ $20,000-$29,999
□ $30,000-$39,999 □ $40,000-$49,999 □ $50,000-$59,999
□ $60,000-$69,999 □ $70,000-$79,999 □ $80,000-$89,999
□ $90,000-$99,999 □ $100,000-$120,000 □ $120,000 +
Thank you very much for your valuable assistance in this research.
Please return the survey in the prepaid envelope by the 31 October 2010.