Embed Size (px)
Citation preview

LINE Q1 2017 Earnings Results April 26, 2017
LINE Corporation

Disclaimer This presentation contains forward-looking statements with respect to the current plans, estimates, strategies and beliefs of LINE Corporation (the “Company”). Forward-looking statements include, but are not limited to, those statements using words such as “anticipate,” “believe,” “continues,” “expect,” “estimate,” “intend,” “project” and similar expressions and future or conditional verbs such as “will,” “would,” “should,” “could,” “might,” “can,” “may,” or similar expressions generally intended to identify forward-looking statements. These forward-looking statements are based on information currently available to the Company, speak only as of the date hereof and are based on the Company’s current plans and expectations and are subject to a number of known and unknown uncertainties and risks, many of which are beyond the Company’s control. As a consequence, current plans, anticipated actions and future financial position and results of operations may differ significantly from those expressed in any forward-looking statements in the presentation. You are cautioned not to unduly rely on such forward-looking statements when evaluating the information presented and the Company does not intend to update any of these forward-looking statements. Risks and uncertainties that might affect the Company include, but are not limited to: 1. its ability to attract and retain users and increase the level of engagement of its users; 2. its ability to improve user monetization; 3. its ability to successfully enter new markets and manage its business expansion; 4. its ability to compete in the global social network services market; 5. its ability to develop or acquire new products and services, improve its existing products and services and increase
the value of its products and services in a timely and cost-effective manner; 6. its ability to maintain good relationships with platform partners and attract new platform partners; 7. its ability to attract advertisers to the LINE platform and increase the amount that advertisers spend with LINE; 8. its expectations regarding its user growth rate and the usage of its mobile applications; 9. its ability to increase revenues and its revenue growth rate; 10. its ability to timely and effectively scale and adapt its existing technology and network infrastructure; 11. its ability to successfully acquire and integrate companies and assets; 12. its future business development, results of operations and financial condition; 13. the regulatory environment in which it operates; 14. fluctuations in currency exchange rates and changes in the proportion of its revenues and expenses denominated in
foreign currencies; and 15. changes in business or macroeconomic conditions.

Smart Portal
MAU of LINE NEWS and LINE TODAY reached 150 million LINE Pay registered accounts surpassed 10 million. Transaction volume in
Japan and Taiwan continue to grow Launched business communication tool LINE WORKS
3
Executive Summary (Q1 2017)
Ads
Communication and Content
Paying Users (PU) for stickers increased through successful campaigns resulting in record sales in Communications
Existing games demonstrated stable revenue through marketing and collaboration with major IPs
AI Platform
Performance Ads revenue driven by increase in mix of video ads on Timeline and introduction of NEWS tab
Announced new initiative, cloud AI platform “Clova”
Monthly Active Users | Four Key Countries YoY 12.6%↑ DAU/MAU%: 72%
54 55 57 58 61 62 64 66 68
70 76
81 87
91 95 98 101 103
123 130
138 145
152 157
162 167 171
Q1'15 Q2'15 Q3'15 Q4'15 Q1'16 Q2'16 Q3'16 Q4'16 Q1'17
Japan Taiwan, Thailand, Indonesia
(mn)
4

32.3 33.5 33.9 35.9
37.5 38.9
Q4'15 Q1'16 Q2'16 Q3'16 Q4'16 Q1'17
Ads Communication Content Others
7% 6% 7%
10%
24% 23% 22%
20%
36% 35% 34%
30%
33% 35% 37% 40%
(bn yen)
73%
27%
Japan Rest of world
5
11%
19%
29%
42%
Revenues
By Business By Geography
*as of Q1 2017
10%
21%
27%
43%

10.7
11.9 12.6
14.5
15.7 16.6
Q4'15 Q1'16 Q2'16 Q3'16 Q4'16 Q1'17
Portal Ads Messenger Ads Performance Ads
LINE Ads
23%
75%
22%
71%
19%
66%
3%
7% 15%
17%
57%
25%
6
(bn yen)
Q2'16 Q3'16 Q4'16 Q1'17
7,992 9,933 11,166 12,273
Ads Revenue YoY 39.4%↑ / QoQ 5.2%↑
LINE Ads Revenue YoY 49.6%↑/ QoQ 6.2%↑
Q4'15 Q1'16 Q2'16 Q3'16 Q4'16 Q1'17
419 456 480 521 549 567
17%
57%
26%
LAP Impressions (mn)
# of Global Paid Official Account
Ads Official Account, LINE@, Sponsored Sticker, LINE Point ads, Timeline/LINE NEWS ads, etc.
* LAP: LINE Ads Platform
16%
54%
30%

Communication Revenue YoY 5.0%↑ / QoQ 15.7%↑
7.7 7.7 7.4 7.3 7.0
8.1
Q4'15 Q1'16 Q2'16 Q3'16 Q4'16 Q1'17
7
Average Daily Stickers Sent (mn) times)
Communication Stickers, Theme, LINE Out (Call), etc.
Q4'15 Q1'16 Q2'16 Q3'16 Q4'16 Q1'17
388 389 397 384 407 441
(bn yen)

Q4'15 Q1'16 Q2'16 Q3'16 Q4'16 Q1'17
MAU (mn) 31.9 30.8 28.9 27.5 26.5 26.3
PU ratio 5.2% 5.2% 4.9% 5.1% 5.0% 5.2%
11.6 11.9 11.4
10.8 10.8 10.4
Q4'15 Q1'16 Q2'16 Q3'16 Q4'16 Q1'17
Content Revenue YoY 12.0%↓ / QoQ 3.0%↓
8
(bn yen)
Content LINE GAME, LINE PLAY, LINE Manga, LINE Fortune, LINE MUSIC, etc.
LINE GAME KPI

9
2.3 2.0
2.5
3.4
4.0 3.9
Q4'15 Q1'16 Q2'16 Q3'16 Q4'16 Q1'17
Others LINE FRIENDS, LINE Part-time Job, LINE Pay, LINE Mobile, etc.
(bn yen)
# of LINE Friends Stores
Q2'16 Q3'16 Q4'16 Q1'17
19 23 26 27
Others Revenue YoY 89.5%↑ / QoQ 3.8%↓
(open in 5 countries)

Jan. Feb. Mar.
19
42 46 46 59
27
50 60
91
39
69
96 106
150
Q1'16 Q2'16 Q3'16 Q4'16 Q1'17
Japan Taiwan, Thailand, Indonesia
(mn)
Smart Portal | NEWS Tab Introduction
20
LINE NEWS & LINE TODAY MAU LINE NEWS Impressions – Japan Only
10
MoM 74%↑
Feb. 23rd Addition of NEWS tab
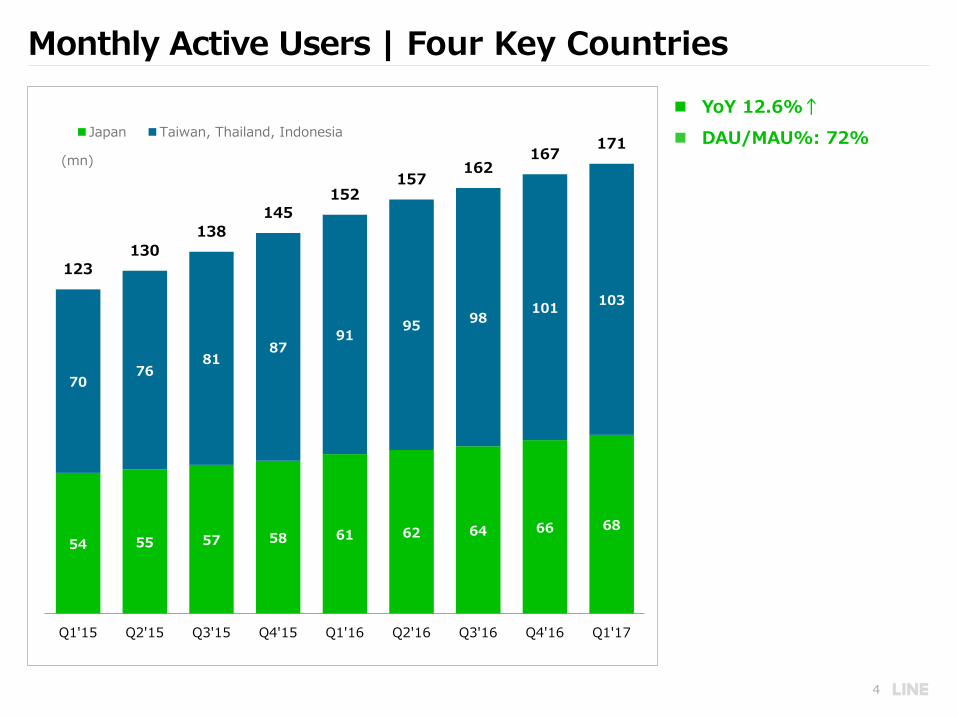
Smart Portal | Video Services
11
B612
Camera Apps
SNOW LINE LIVE LINE TV
Video

Q1'16 Q2'16 Q3'16 Q4'16 Q1'17
12
Q1'16 Q2'16 Q3'16 Q4'16 Q1'17
Smart Portal | Content Services
YoY 55%↑ YoY 357%↑
LINE Manga Gross Revenue LINE Music Gross Revenue

(mn yen) Q1'16 Q4'16 Q1'17 Growth
Y/Y Q/Q
Revenues and other operating income 34,116 38,145 39,246 15.0% 2.9%
Revenues 33,456 37,465 38,916 16.3% 3.9%
LINE Ads 9,302 13,098 13,913 49.6% 6.2%
Portal Ads 2,571 2,633 2,644 2.8% 0.4%
Communication 7,686 6,973 8,067 5.0% 15.7%
Content 11,865 10,760 10,441 -12.0% -3.0%
Others 2,032 4,002 3,851 89.5% -3.8%
Other operating income 660 680 330 -49.9% -51.4%
Operating expenses 28,778 36,542 35,221 22.4% -3.6%
Operating income 5,338 1,603 4,025 -24.6% 151.1%
Margin(%) 15.6% 4.2% 10.3% -5.4pt 6.1pt
Pre-tax income 4,143 2,724 3,566 -13.9% 30.9%
Tax 2,737 1,086 1,931 -29.4% 77.8%
Net income from continuing operations 1,406 1,639 1,635 16.3% -0.2%
Discontinued operations income -1,640 -219 -3 n/a n/a
Net income -234 1,419 1,632 n/a 15.0%
14
Earnings Summary (Q1 2017)

Operating Expenses
(mn yen) Q1‘16 Q4'16 Q1'17 Growth
Y/Y Q/Q
Operating expenses 28,778 36,542 35,221 22.4% -3.6%
Payment processing and licensing 7,750 7,346 7,684 -0.9% 4.6%
Employee compensation 9,393 10,555 9,718 3.5% -7.9%
Marketing 2,307 4,280 4,026 74.5% -5.9%
Infrastructure and communication 1,782 2,113 2,142 20.2% 1.4%
Authentication and other service 2,897 4,673 4,953 71.0% 6.0%
Depreciation and amortization 968 1,441 1,476 52.5% 2.5%
Other operating expenses 3,681 6,134 5,222 41.9% -14.9%
15
*Other operating expenses include LINE Friends COGS and office related expenses

7.1 6.9 7.3 7.4 8.4
9.0
2.9 2.5
2.5 2.4
2.2 0.7
10.0 9.4
9.7 9.8 10.6
9.7
Q4'15 Q1'16 Q2'16 Q3'16 Q4'16 Q1'17
Salary + Others SBC
2.0
1.3 1.5
2.2
3.1
2.4
1.2
1.0 1.0
0.6
1.1
1.6 3.1
2.3 2.4
2.8
4.3 4.0
Q4'15 Q1'16 Q2'16 Q3'16 Q4'16 Q1'17
Japan Rest of world
(bn yen) (bn yen)
16
Employee Compensation and Marketing
Employee Compensation
Marketing

0.8
5.3
3.8
4.9
1.6
4.0
4.2
2.4%
15.6%
21.0%
13.6%
4.2%
10.3%
0.0%
5.0%
10.0%
15.0%
20.0%
25.0%
30.0%
35.0%
0
0
0
0
0
0
0
0
0
0
Q4'15 Q1'16 Q2'16 Q3'16 Q4'16 Q1'17
OP Income One-time other OP Income Margin (%)
8.0
(0.3) (0.2) (0.3)
2.8
1.4 1.6
3.4
-0.9% -0.7%
8.1%
7.8%
3.7% 4.2%
-2.0%
0.0%
2.0%
4.0%
6.0%
8.0%
10.0%
12.0%
0
0
0
0
0
0
0
0
0
0
Q4'15 Q1'16 Q2'16 Q3'16 Q4'16 Q1'17
Net income One-time other OP Income Margin (%)
(bn yen)
3.1
17
-0.8%
11.3%
(bn yen)
Operating & Net Income
Operating Income (Margin) Net Income (Margin)
Margin (excl. one-time other OP income) Margin (excl. one-time other OP income)