Embed Size (px)
Citation preview
Linkage of Viral Sequences among HIV-Infected Village Residentsin Botswana: Estimation of Linkage Rates in the Presence of
Missing Data
(Article begins on next page)
The Harvard community has made this article openly available.Please share how this access benefits you. Your story matters.
Citation Carnegie, Nicole Bohme, Rui Wang, Vladimir Novitsky, andVictor De Gruttola. 2014. “Linkage of Viral Sequences amongHIV-Infected Village Residents in Botswana: Estimation ofLinkage Rates in the Presence of Missing Data.” PLoSComputational Biology 10 (1): e1003430.doi:10.1371/journal.pcbi.1003430.http://dx.doi.org/10.1371/journal.pcbi.1003430.
Published Version doi:10.1371/journal.pcbi.1003430
Accessed February 19, 2015 3:08:02 PM EST
Citable Link http://nrs.harvard.edu/urn-3:HUL.InstRepos:11879487
Terms of Use This article was downloaded from Harvard University's DASHrepository, and is made available under the terms and conditionsapplicable to Other Posted Material, as set forth athttp://nrs.harvard.edu/urn-3:HUL.InstRepos:dash.current.terms-of-use#LAA
Linkage of Viral Sequences among HIV-Infected VillageResidents in Botswana: Estimation of Linkage Rates inthe Presence of Missing DataNicole Bohme Carnegie1*, Rui Wang1,2, Vladimir Novitsky3, Victor De Gruttola1
1 Department of Biostatistics, Harvard School of Public Health, Boston, Massachusetts, United States of America, 2 Division of Sleep Medicine, Brigham and Women’s
Hospital, Boston, Massachusetts, United States of America, 3 Department of Immunology and Infectious Diseases, Harvard School of Public Health, Boston, Massachusetts,
United States of America
Abstract
Linkage analysis is useful in investigating disease transmission dynamics and the effect of interventions on them, but estimatesof probabilities of linkage between infected people from observed data can be biased downward when missingness isinformative. We investigate variation in the rates at which subjects’ viral genotypes link across groups defined by viral load(low/high) and antiretroviral treatment (ART) status using blood samples from household surveys in the Northeast sector ofMochudi, Botswana. The probability of obtaining a sequence from a sample varies with viral load; samples with low viral loadare harder to amplify. Pairwise genetic distances were estimated from aligned nucleotide sequences of HIV-1C env gp120. It isfirst shown that the probability that randomly selected sequences are linked can be estimated consistently from observeddata. This is then used to develop estimates of the probability that a sequence from one group links to at least one sequencefrom another group under the assumption of independence across pairs. Furthermore, a resampling approach is developedthat accounts for the presence of correlation across pairs, with diagnostics for assessing the reliability of the method.Sequences were obtained for 65% of subjects with high viral load (HVL, n = 117), 54% of subjects with low viral load but not onART (LVL, n = 180), and 45% of subjects on ART (ART, n = 126). The probability of linkage between two individuals is highest ifboth have HVL, and lowest if one has LVL and the other has LVL or is on ART. Linkage across groups is high for HVL and lowerfor LVL and ART. Adjustment for missing data increases the group-wise linkage rates by 40–100%, and changes the relativerates between groups. Bias in inferences regarding HIV viral linkage that arise from differential ability to genotype samples canbe reduced by appropriate methods for accommodating missing data.
Citation: Carnegie NB, Wang R, Novitsky V, De Gruttola V (2014) Linkage of Viral Sequences among HIV-Infected Village Residents in Botswana: Estimation ofLinkage Rates in the Presence of Missing Data. PLoS Comput Biol 10(1): e1003430. doi:10.1371/journal.pcbi.1003430
Editor: Christophe Fraser, Imperial College London, United Kingdom
Received June 5, 2013; Accepted November 25, 2013; Published January 9, 2014
Copyright: � 2014 Carnegie et al. This is an open-access article distributed under the terms of the Creative Commons Attribution License, which permitsunrestricted use, distribution, and reproduction in any medium, provided the original author and source are credited.
Funding: This work is supported by NIH (nih.gov) grants R01AI24643, R01AI51164 and R01AI083036. The funders had no role in study design, data collection andanalysis, decision to publish, or preparation of the manuscript.
Competing Interests: The authors have declared that no competing interests exist.
* E-mail: [email protected]
Introduction
Interest has been growing in the use of viral linkage analysis to
investigate disease transmission dynamics and the effect of
interventions on them [1–8]. To optimize interventions intended
to control the HIV epidemic, it will be useful to identify host
characteristics (e.g. disease status and demographics) that are
associated with high rates of clustered or genetically-linked
infections. Many studies attempt to make inferences about linkage
patterns in a larger population than that represented by the set of
observed viral genetic sequences without considering the effect of
sampling or missing data (see, e.g. [5,9]). However, estimates of
probabilities of linkage that ignore the impact of missing data
(henceforth referred to as unadjusted estimators) can be biased
downward. In order to estimate the amount of linkage in
communities or compare rates of linkage across groups we must
properly account for the presence of missing data.
The work presented here arose from a desire to compare
linkage rates between demographic groups found via a house-
hold survey from the Mochudi study, an HIV prevention
program for Mochudi, Botswana (R01 AI083036; PI: M. Essex;
www.aids.harvard.edu/news/spotlight/archives/v6i3_mochudi_project.html).
Young males were found to be severely underrepresented,
making inferences about linkage involving this group unreliable.
As information regarding the size of this subpopulation is
available, it is possible to leverage it to improve inferences. This
household survey is part of a pilot project leading to a large
community-randomized trial, also in Botswana, of a combina-
tion HIV prevention intervention, the Botswana Combination
Prevention Project (BCPP; U01 GH000447; PIs: M. Essex & V.
De Gruttola) [10,11]. One of the goals of the BCPP study is to
leverage viral linkage to understand the patterns of mixing
across communities and the relative contributions of within-
community and outside-community sources to new infections.
This paper develops estimators for linkage probabilities under
the assumption that unobserved sequences are missing at random
conditional on observed information. We consider analyses in
which linkage is defined by a threshold on the pairwise distance
between viral sequences. The choice of the threshold is an
important scientific question in the analysis of viral genetic data,
but the methods developed here apply regardless of the particular
value of the threshold chosen, or can be applied to range of
PLOS Computational Biology | www.ploscompbiol.org 1 January 2014 | Volume 10 | Issue 1 | e1003430
thresholds of interest. We first show that the probability that
randomly selected sequences are linked can be estimated
unbiasedly from observed data. We then derive an estimate of
conditional probabilities of linkage between groups given the
existence of a link, and consider estimation of group-level
probabilities of linkage. We first develop estimators under the
assumption that indicators of linkage are independent across pairs
of individuals who may be linked – an assumption that could be
appropriate in situations with either a very sparse graph or sparse
sampling in the population. We then develop a bootstrap
resampling approach that is approximately correct under general
assumptions about the structure of correlations of linkage
indicators across pairs. Finally, we propose a diagnostic approach
for assessing the reliability of the method.
We apply the methods developed to analyses of viral sequences
from the northeast sector of the village of Mochudi in Botswana,
the site of a pilot study intended to determine the feasibility of
testing for HIV infection in a household setting and linking
infected subjects to care. Our investigation focuses on assessment
of whether rates at which subjects’ HIV genotypes link with others
depends on ART treatment status and viral load levels (low/high)
among the untreated. Such clustering reflects underlying HIV
transmission dynamics; a tendency for subjects with high viral load
to link more frequently with others might suggest an increased role
of subjects with elevated levels of viral replication in HIV
transmission. This is also consistent with high viremia in early
infection; the contribution of those with elevated viral load to
onward spread is difficult to assess in samples of prevalent cases
due to the fact that a subject’s category varies over time. With high
prevalence, however, it is unlikely that a high proportion of
subjects in the sample are newly infected; nonetheless, this
approach will be particularly useful in the analysis of data from
the BCPP, which will identify incident cases and permit
comparison of their linkage rates with the groups discussed here.
Methods
Consider a population of hosts partitioned into u~1, � � � ,Gdisjoint groups, each of size Nu. Groups might be defined by
demographic characteristics, risk behavior, disease stage, etc. To
make our estimates of linkage probability identifiable, we must
make a standard assumption that missingness is random
conditional on group membership, so the group definitions should
include all characteristics relevant to the probability of observation
of a sequence from a given host. Suppose that the probability that
a sequence from group u is in our sample, pu, is known. In each
group, we thus observe viral sequences for a subset of hosts of size
nu~puNu. Let Nuv~Nu:Nv (or Nu(Nu{1)=2 if u~v) be the
number of pairs of sequences between groups u and v. Two
sequences (representing two individual hosts) are considered to be
linked if the genetic distance between them is less than some
threshold value. Let Xkj be an indicator for a link between
sequences k and j.
Probability of linkage between two individualsOur first goal is to estimate the probability of linkage between viral
sequences from two individuals selected at random from their
respective groups, puv. Under the assumption of missingness at
random (MAR) conditional on group membership, the nu hosts for
whom viral sequences are available represent a random sample of the
total population of their group, and by extension the observed linkage
indicators Xkj are a random sample of the linkage indicators for the full
population. Thus, the Law of Large Numbers tells us that the sample
average, ppuv~P
j[u
Pk[v Xkj
:I (k observed):I (j observed)=nuv,
converges to the population mean, puv.
As a result, under the assumption of MAR conditional on group,
it is possible to obtain an unbiased estimate of the probability that a
pair of sequences are linked without adjustment for missing data.
Conditional probability of linkageOne quantity of interest in the analysis of a community
randomized trial such as the BCPP is the relative probability that a
new infection arises from contact with an infected person from
within a community versus from outside the community.
Therefore we may wish to estimate the conditional probability,
huv, that a pair of sequences (i,j) are from groups (u,v), given that
(i,j) are linked. If missingness is completely at random (uncondi-
tional on group), then we can use the observed proportions of links
in each group pair (u,v),
Pk[u
Pj[v
XkjPn
k~1
Pjwk
Xkj
, with n~PG
u~1 nu, to
estimate the conditional probabilities. If missingness is MAR
conditional on group, as we assume, this estimate requires
adjustment for the differing missingness rates between groups. In
a population of size N , there are N(N{1)=2 total possible pairs.
The probability of linkage for a randomly selected pair is given by
Xu
Xv§u
Nuv
N(N{1)=2puv:
The probability that a randomly selected pair is from groups (u,v)and is linked is
Nuv
N(N{1)=2puv:
Thus, the conditional probability we desire is
huv~Pr pair from groups (u,v)Dpair is linkedð Þ
~NuvpuvP
m
Pn§m Nmnpmn
:
We substitute ppuv into these formulas to obtain a plug-in estimator
hhuv of huv. Note that this derivation does not require an assumption
Author Summary
The analysis of viral genomes has great potential forinvestigating transmission of disease, including the iden-tification of risk factors and transmission clusters, and canthereby aid in targeting interventions. To make use ofgenetic data in this way, it is necessary to make inferencesabout population-level patterns of viral linkage. As withany rigorous statistical inference from sampled data to apopulation, it is important to consider the effect of thesampling strategy and the occurrence of missing data onthe final inferences made. In this paper we highlight theeffects of missing data on the resulting estimates ofpopulation level linkage rates and develop methods foradjusting for the presence of missing data. As an example,we consider comparing the rates of linkage of HIVsequences from subjects with high viral load, low viralload, or on antiretroviral treatment, and show thatcomparative inferences are compromised when adjust-ment is not made for missing sequences and bias ininferences can be reduced with proper adjustment.
Viral Linkage with Missing Data
PLOS Computational Biology | www.ploscompbiol.org 2 January 2014 | Volume 10 | Issue 1 | e1003430
of independence, so we can consistently estimate the conditional
probability of linkage regardless of the underlying correlations of
linkage indicators across pairs.
Estimation of linkage rates between groupsBased on the results above, we now focus on estimation of the
probability that a randomly selected sequence from group u links
with at least one sequence from group v (excluding itself if v~u),
cuv. In this case the unadjusted estimate of the probability of
linkage between groups will be an underestimate of the true rate:
any sequence that does not link with any other in the observed
data may in fact link with sequence(s) from the community that
were not observed. Thus, the proportion of observed sequences in
group u that do not link with any sequence in group v will be
higher than the proportion in the population.
For the purposes of exposition, we begin with an assumption of
independence among linkage estimators, but we extend to a case
with individual-by-group random effects driving the correlations
among indicators. This flexible model accounts for correlations
due to individual factors – biology, behavior, network position – as
well as differential interactions of individuals with different groups.
Plug-in estimation under independence. We begin by
assuming that indicators Xkj of linkage between a sequence in u
with any sequence in v are mutually independent. We wish to
estimate
cuv~1{Pr(a sequence from u does not link with any in v),
which is 1{(1{puv)Nv under independence. We obtain a plug-in
estimator by substituting the estimate ppuv for the true puv,
ccuv~1{(1{ppuv)Nv . The expected value of this quanitity is not
available in closed form, but in general will not be equal to cuv.
The variance of ccuv, is similarly difficult to write in closed form, but
we do know that Var ccuvð Þ~E (1{ppuv)2Nv� �
{ E (1{ppuv)Nv� �� �2
.
Both values can easily be evaluated numerically.
These results can easily be extended to estimation of the
probability that a sequence from group u or a set of groups A links
with at least one sequence in a set of groups B (B can intersect u or
A, with adjustments to group sizes to exclude self-ties). In the first
case, the estimator is ccuB~1{Pv[B (1{ppuv)Nv , with expected
value equal to one minus the product of the expected values of
1{ccuv for v[B and variance Var ccuBð Þ~Pv[B E (1{ppuv)2Nv� �
{Pv[B E (1{ppuv)Nv� �� �2
. We estimate linkage between sets of
groups cAB by a weighted average of cuB for u[A, with the weights
given by the size of group u in the population, Nu. Thus,
ccAB~
Pu[A
Nu:ccuBP
u[ANu
, and the expected value and variance are the
appropriate weighted sums of the expected value and variance of
the ccuB.
Relaxing independence assumptions: Bootstrap bias
estimation. We consider bootstrap estimation of the bias in the
unadjusted estimate in order to accommodate deviations from
independence among pairs. The development begins by assuming
independence and then relaxes this assumption. The expected
percent of sampled sequences in group u that cluster with at least one
observed sequence in group v is EP
j[v Xkj:I j observedð Þ§1
h i~1{Pr
Pj[v Xkj
:I j observedð Þ~0� �
~1{(1{puv)nv , where nv
is the number sampled out of a population of size Nv and Xkj is an
indicator for linkage between sequences k and j. For a sampling
probability of pv, we expect nv~pvNv. Note that the unadjusted
estimate of the probability of no clustering, (1{puv)nv , differs from
the truth, (1{puv)Nv by a ratio of (1{puv)Nv
(1{puv)pvNv ~(1{puv)(1{pv)Nv . An
alternative to direct calculation of the MLE is to estimate this ratio
and use it as an adjustment factor to correct the unadjusted estimator.
We can estimate this ratio given the observed data in one of two
ways. The first involves taking a subsample with probability
(2{1=pv) from the observed sample to obtain a sample of
approximately (2pv{1) percent of the full population and taking
the ratio of the rates of non-linkage in the observed sample and the
subsample as the adjustment factor (this gives an exponent of
(pv{(2pv{1))Nv~(1{pv)Nv). This method is denoted interval
subsampling because the sampling proportions for the population,
observed sample, and bootstrap subsample are at equal intervals.
It limits the sizes of samples for which adjustment can be made; a
subsample of appropriate size is impossible for pvƒ0:5, and in
practice the bound is higher, as an arbitrarily small subsample will
be likely to miss all observed links.
An alternative approach takes a subsample with probability pv
from the observed sample, and uses the ratio of rates as described
above raised to a power of 1=pv to get an estimate of
(1{pv)(1{pv)Nv . This approach, denoted proportionate subsampling,
extends the range of sample sizes for which the bootstrap is
practical.Exchangeable correlation. Suppose all linkage indicators
Xkj for sequence k in group u with sequences in group v are
distributed as exchangeable Bernoulli random variables with
probability p~puv and correlation r~ruv. Defining f~ffiffiffirp
, we
can express Ykj~1{Xkj~(1{Wkj)ZkjzWkjRk, where the Zkj
and Rk are iid Bern(1{p) and the Wkj are iid Bern(f) [12]. We
find the probability that none of the Xkj~1 by taking the
expectation of Pnv
j~1 Ykj . For simplicity, we suppress the subscript
k in what follows. In the product Pnv
j~1 Yj~ Pnv
j~1
1{Xj~Pnv
j~1 (1{Wj)ZjzWjR� �
, all terms subscripted by j are
raised to a power of at most 1 in any element. Since the Wj , Zj
and R are all mutually independent random variables, the
resulting expectation is merely the product of their expectations.
Thus we can simplify the expression by replacing Wj and Zj with
their respective expected values, f and 1{p, to obtain
E Pnv
j~1 Ykj
h i~E (1{f)(1{p)zfRð Þn½ �. Thus,
E Pnv
j~1Ykj
~Xnv
i~0
nv
i
!(1{f)nv{i(1{p)nv{ifiE Ri
� �
~Xnv
i~0
nv
i
!(1{f)nv{i(1{p)nv{ifi(1{p)I(iw0)
~(1{p)nvXnv
i~0
nv
i
!(1{f)nv{i f
1{p
� �i
(1{p)I(iw0)
~(1{p)nv (1{p)Xnv
i~0
nv
i
!(1{f)nv{i f
1{p
� �i
zp(1{f)nv
!
~(1{p)nv (1{p) 1zfp
1{p
� �nv
zp(1{f)nv
� �
For the values of p, r and nv that we are likely to encounter,
p(1{f)nv&0. This means that using the methods described for the
independence case, we are trying to estimate
Viral Linkage with Missing Data
PLOS Computational Biology | www.ploscompbiol.org 3 January 2014 | Volume 10 | Issue 1 | e1003430
(1{p)nv (1{p) 1z fp1{p
� �nv� �
(1{p)pnv (1{p) 1z fp1{p
� �pnv� �
~(1{p)(1{p)nv 1zfp
1{p
� �(1{p)nv
by (interval subsampling)
(1{p)pnv (1{p) 1z fp1{p
� �pnv� �
(1{p)(2p{1)nv (1{p) 1z fp1{p
� �(2p{1)nv� �
~(1{p)(1{p)nv 1zfp
1{p
� �(1{p)nv
,
or (proportionate subsampling)
(1{p)pnv (1{p) 1z fp1{p
� �pnv� �
(1{p)p2nv (1{p) 1z fp1{p
� �p2nv� �
0BBB@
1CCCA
1=p
~(1{p)(1{p)nv 1zfp
1{p
� �(1{p)nv
,
and hence the bootstrap bias correction will be approximately
unbiased for nv sufficiently large under either interval or
proportionate subsampling.
A note on estimating ruv: we are assuming that
Cor Xkj,Xkl
� �~ruv Vj=l, with k in group u and j, l in group v
(Note that u may equal v if we are interested in within-group
linkage). Under this assumption, the expected number of linked
pairs between groups u and v in which k is a participant remains the
same as in the independence case. Supposing we have a population
of size Nv and the probability that a pair is linked is puv, then
EP
j=k,j[v Xkj
h i~(Nv{1)puv, just as if the Xkj were uncorrelated
(note that we are excluding Xkk as we do not include self-links). The
variance, on the other hand, is affected by the correlation.
VarP
j=k Xkj
h i~P
j=k,j[v
Pl=k,l[v Cov Xkj,Xkl
� �. In the inde-
pendence case, this is merely s20~(Nv{1)puv(1{puv), but in the
exchangeable case we have s2ruv
~(Nv{1)puv(1{puv):
(1z(Nv{2)ruv). Given ppuv, we can thus estimate ruv by
rruv~ss2
ruv{ss2
0
(Nv{2)ss20
, where ss20~(Nv{1)ppuv(1{ppuv) and ss2
ruvis the
empirical variance of the number of links by sequence. Note that for
fixed puv, ruv is invariant in Nv, so we can estimate the correlation in
the population using the correlation in the sample.
Random effects. We can relax the assumption that correla-
tion varies only by group pairing to permit each sequence to have
its own baseline correlation with each group (a version of the
classic random effects model), by allowing f to vary with k and j.Suppose k is a member of group u and j, l are members of group v,
and let fk½v� be a baseline propensity of sequence k to link with
sequences in group v. Then the correlation between Xkj and Xkl is
rkjl~ fk½v�fj½u�� �
fk½v�fl½u�� �
rather than ruv~f2uv. This gives us (after
replacing singleton independent random variables with their
expected values, as in the development for exchangeability)
Pnv
j~1 Ykj~Pnv
j~1 (1{fk½v�fj½u�)(1{p)zfk½v�fj½u�R, and
E Pnv
j~1Ykj
~
(1{p)nv (1{p) Pnv
j~11zfk½v�fj½u�
p
1{p
� �zp P
nv
j~1(1{fk½v�fj½u�)
� �
We still expect pPnvj~1 (1{fk½v�fj½u�)&0 for the sample sizes of
interest, so the bootstrap bias correction will be approximately
correct as long as
Pnv
j~11zfk½v�fj½u�
p
1{p
� �= P
pnv
l~11zfk½v�fl½u�
p
1{p
� �
is well approximated by one of the bootstrapped quantities
Ppnv
l~11zfk½v�fl½u�
p
1{p
� �= P
p(2{1=p)nv
m~11zfk½v�fm½u�
p
1{p
� �
(interval subsampling)or
Ppnv
l~11zfk½v�fl½u�
p
1{p
� �= P
p2nv
m~11zfk½v�fm½u�
p
1{p
� �" #(1=p)
(proportionate subsampling):
If we assume that the fk½v�*iid f (f) for some distribution f , and
let _ffkj~1zfk½v�fj½u�p
1{p, then, for any set of sequences A, we have
E Pj[A
_ffkj
~ P
j[AE _ffkj
h i~m
Aj j_ffk
,
so E Pnvj~1
_ffkj=Ppnvl~1
_ffkl
h i~E Pnv
j~pnv_ffkj
h i~m(1{p)nv
_ffk. If we use
the interval subsampling method described above, then we have
E Ppnv
l~1
_ffkl= Pp(2{1=p)nv
m~1
_ffkm
~E P
pn
l~p(2{1=p)nv
_ffkl
~m(1{p)nv
_ffk,
so the bootstrap adjustment is correct in expectation. If, on the
other hand, we have a smaller sample and want to use the
proportionate subsampling approach, we have
E Ppnv
l~1
_ffkl= Pp2nv
m~1
_ffkm
( )(1=p)24
35~E P
pn
l~p2nv
_ffkl
!(1=p)24
35
~E _ff(1=p)
km
h ip(1{p)nv:
By Jensen’s Inequality, E _ff(1=p)
kl
h i§E _ffkl
h i(1=p)
, indicating that the
bootstrap method in this case will under-correct, on average.
Results
As mentioned in the introduction, we apply the methods
described above to viral sequences from a household survey in
Mochudi, Botswana. HIV-1 subtype C sequences used in this
study represent the initial genotyping effort within the Mochudi
Viral Linkage with Missing Data
PLOS Computational Biology | www.ploscompbiol.org 4 January 2014 | Volume 10 | Issue 1 | e1003430
Prevention Project. Briefly, viral sequences were obtained by
nucleic acid extraction from dry blood spots collected during a
household survey in Mochudi and two rounds of PCR
amplification of HIV-1 env gp120 V1C5 region with primers
ED3/ED14 and ED5/ED12 [13] followed by direct sequencing
of amplified products as described previously [14]. Sequence
contigs were assembled by SeqScape v.2.7 (Applied Biosystems),
and generated viral sequences were aligned by Muscle [15,16].
To prevent and control for contamination, QA/QC procedures
were applied routinely during all experimental steps. We
generated sequences of the env gp120 region from 423 subjects
from the first year of the survey (GenBank accession numbers
KF374112, KF374117-KF374123, KF374125-KF374132,
KF374134-KF374138, KF374141, KF374142, KF374144,
KF374147-KF374151, KF374153, KF374156, KF374157,
KF374159-KF374161, KF374163-KF374171, KF374174,
KF374175, KF374177-KF374181, KF374183, KF374184,
KF374186-KF374196, KF374198-KF374217, KF374219-
KF374221, KF374223, KF374224, KF374227, KF374230,
KF374231, KF374233, KF374234, KF374237-KF374239,
KF374241-KF374246, KF374248-KF374250, KF374252,
KF374253, KF374255-KF374265, KF374267-KF374271,
KF374273, KF374275-KF374280, KF374282-KF374284,
KF374287, KF374289, KF374291-KF374307, KF374309-
KF374313, KF374315, KF374318-KF374323, KF374325-
KF374327, KF374329-KF374332, KF374335, KF374337,
KF374339, KF374341-KF374343, KF374345, KF374347,
KF374349-KF374354, KF374356-KF374373, KF374376,
KF374377, KF374379, KF374380, KF374382-KF374384,
KF374387-KF374389, KF374391, KF374392, KF374394,
KF374396-KF374402, KF374404, KF374405, KF374407-
KF374413, KF374415, KF374417-KF374420, KF374424-
KF374426, KF374428-KF374432, KF374434, KF374436-
KF374446, KF374448, KF374449, KF374451-KF374454,
KF374457-KF374459, KF374462-KF374467, KF374470,
KF374471, KF374474-KF374481, KF374484-KF374490,
KF374492, KF374494-KF374496, KF374498-KF374502,
KF374504-KF374513, KF374518, KF374520-KF374523,
KF374525, KF374526, KF374528, KF374531-KF374533,
KF374535-KF374540, KF374542, KF374543, KF374546-
KF374550, KF374553-KF374555, KF374558, KF374560-
KF374565, KF374569-KF374573, KF374575, KF374576,
KF374579-KF374581, KF374585, KF374587-KF374598,
KF374601, KF374604, KF374606-KF374613, KF374617-
KF374620, KF374622, KF374623, KF374626-KF374631,
KF374633, KF374634, KF374636, KF374638-KF374640,
KF374642, KF374645-KF374652, KF374654-KF374656,
KF374658, KF374660, KF374661, KF374663-KF374665,
KF374668-KF374678.).
Interest lies in assessing the impact of viral load levels on rates of
linkage, but the probability of being able to sequence a sample
depends on viral load, given that low VL samples are more
difficult to amplify. From the household survey, we retrieved 791
subjects with data on viral load and treatment status, which we
divide into three categories: high viral load (HVL, .50 K copies/
mL), on antiretroviral treatment (ART), and low viral load (LVL,
#50 K copies/mL, no ART). We subdivide those with viral load
less than 50,000 copies/mL by treatment status because the
processes that lead to the lower viral load are likely different for
these two groups. At the time of analysis, viral sequences were
available for 65% of HVL subjects, 54% of LVL subjects and only
45% of those on ART. The size of the groups also varies, with 23,
42, and 35 percent of the sample being HVL, LVL and ART,
respectively.
Phylogenetic tree simulationAs a first step in validating the performance of the approach, we
perform a simulation study applying our methods to data
simulated from an evolutionary model. To implement the
simulation, we used SeqGen v1.3.2 [17]. We obtained the tree
required as input to the program by fitting a maximum likelihood
tree to the 423 observed sequences from Mochudi, and
parameterized the evolutionary model by fitting the general
time-reversible model with gamma distributed rate heterogeneity
to those sequences and using the estimated parameters (both using
MEGA version 5 [18]). Each node maintained the group
assignment it had in the Mochudi data.
The simulation proceeds as follows:
1. Simulate a set of viral genetic sequences over the tree.
2. Calculate the pairwise distances between sequences using the
dna.dist function in the R [19] package ape [20].
3. Record the true group-wise clustering rates cuv for the
population of sequences for a particular threshold.
4. Sample from the observed sequences with probability (0.7, 0.6,
0.8) for the (HVL, LVL, ART) groups.
5. Estimate the adjusted (ccuv) and unadjusted group-wise
clustering rates for that threshold.
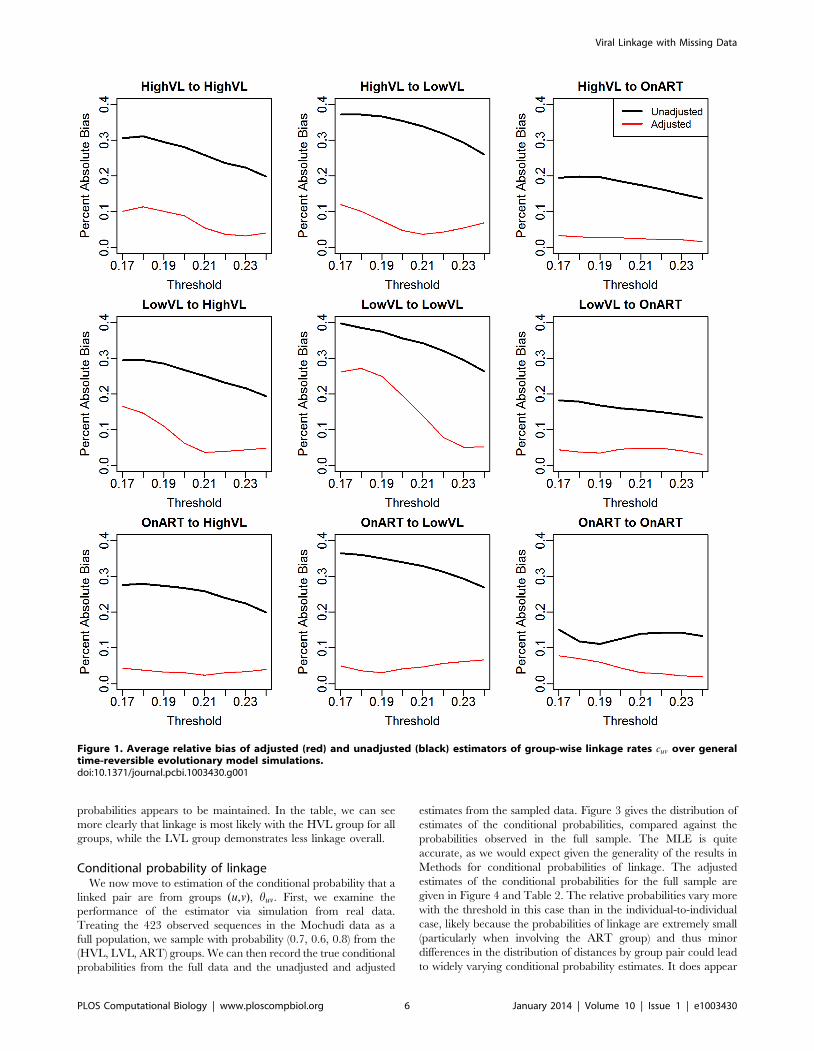
The threshold ranged from 0.17 to 0.24, which corresponds
roughly to the 0.04th to 0.41st percentiles of the distance
distribution. The expected number of links per sequence ranged
from 0.04 to 0.79. We simulated 100 sets of sequences, and for
each set, we simulated 100 different observed data sets for each
threshold, for a total of 10,000 simulations per threshold. Figure 1
plots the mean relative bias (Destimate{truthD=truth) of the
unadjusted and adjusted estimators across the range of thresholds.
The unadjusted estimator has uniformly higher bias than the
adjusted, and the differences in the degree of bias is often large;
averaged across subpopulations (weighting by their size) and
thresholds, the relative bias of 25.7% in the unadjusted analyses is
reduced to 6.5% in adjusted analyses. For higher thresholds, the
adjustment reduces the bias to under 5% in the majority of cases
and to under 10% in all. For the lower thresholds (where linkage
rates are lower), the bias in unadjusted analyses is generally greater
than for higher thresholds-exceeding 35% in some cases. By
contrast the bias in the adjusted analyses is below 10% in the
majority of cases and below 20% in all but one. The worst
performance for the adjusted analyses (low thresholds for LVL to
LVL) still shows a considerable reduction in bias.
Mochudi data analysisIn the analysis of the Mochudi household survey data, we
consider three groups: HVL, LVL and ART. We observe
sequences for nu~(117,180,126) out of Nu~(179,332,280)individuals in each group, yielding pu~(0:654,0:542,0:450). We
use p-distance as our distance measure: the proportion of
compared sites at which two sequences differ. Viral linkage in
this analysis is defined by a p-distance below a specified value. We
present the results in two ways: first, using a range of thresholds
from 0.085 to 0.12 (corresponding to the 0.03rd to 0.54th
percentiles), and second, focusing on a threshold of 0.1 for more
detailed consideration. This latter threshold yields an overall rate
of linkage of 18% within the observed sample.
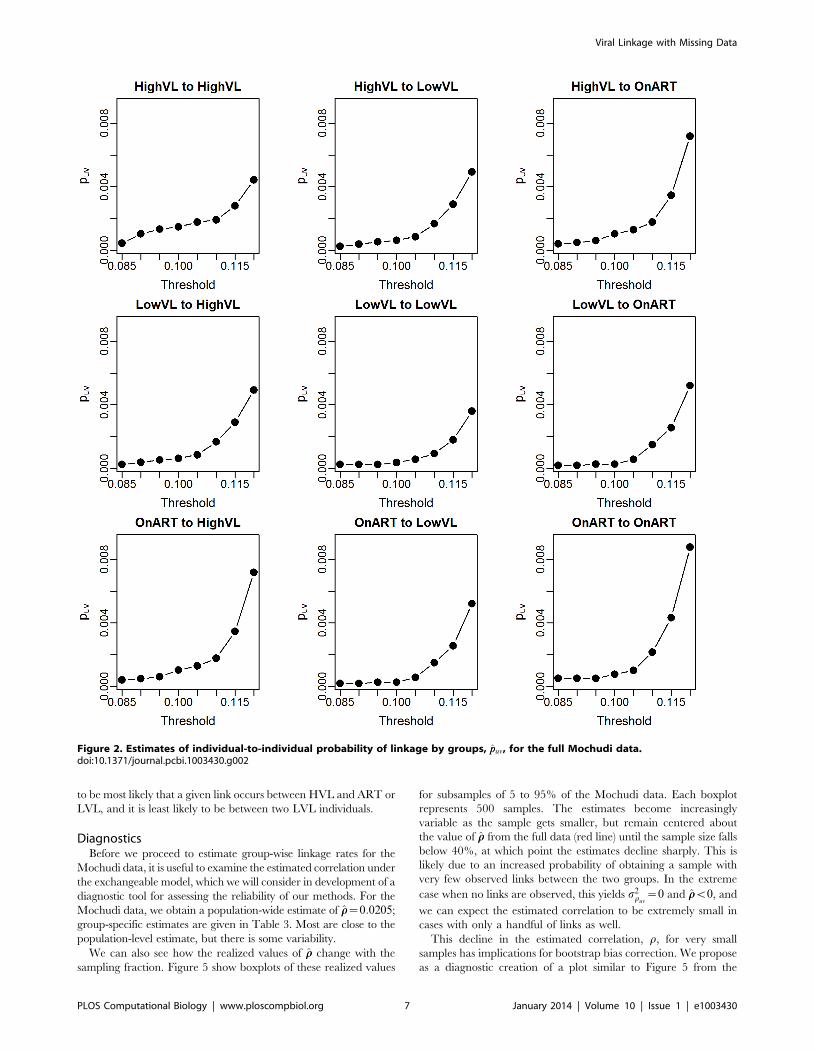
Using the results for the probability of linkage between
individuals, we find the ppuv given in Figure 2 and Table 1. As
one would expect, the overall probability of linkage increases with
the more generous thresholds, but the pattern of relative
Viral Linkage with Missing Data
PLOS Computational Biology | www.ploscompbiol.org 5 January 2014 | Volume 10 | Issue 1 | e1003430
probabilities appears to be maintained. In the table, we can see
more clearly that linkage is most likely with the HVL group for all
groups, while the LVL group demonstrates less linkage overall.
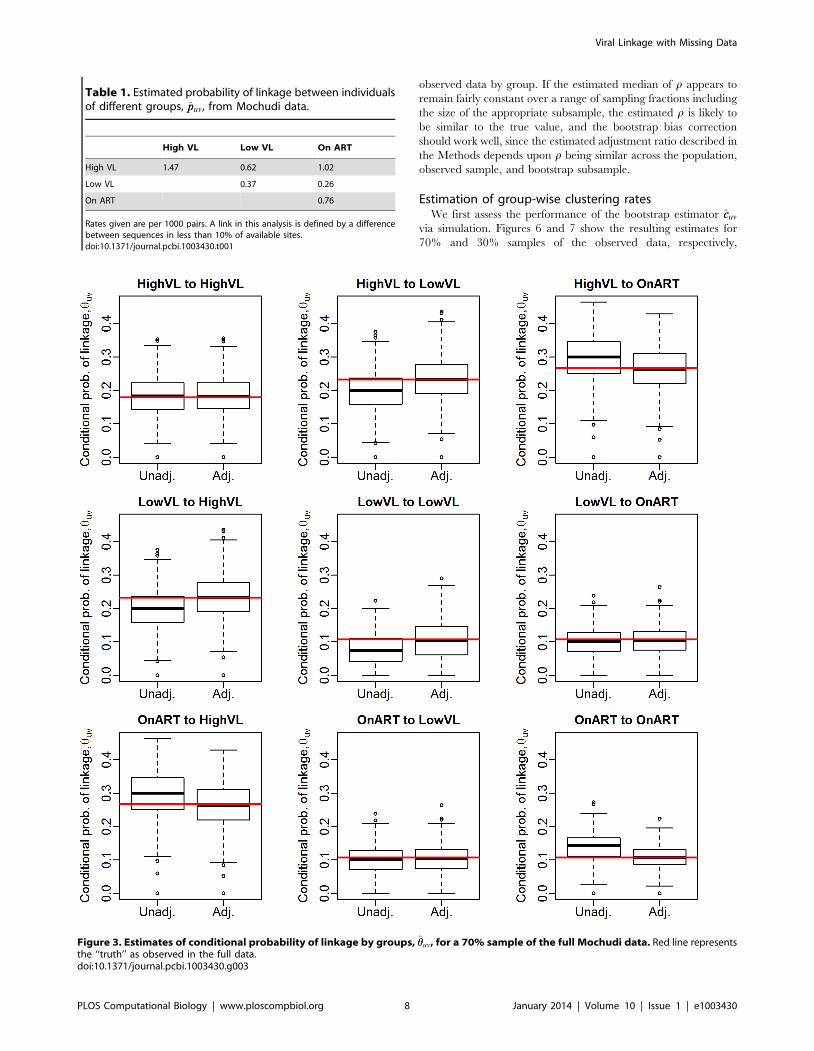
Conditional probability of linkageWe now move to estimation of the conditional probability that a
linked pair are from groups (u,v), huv. First, we examine the
performance of the estimator via simulation from real data.
Treating the 423 observed sequences in the Mochudi data as a
full population, we sample with probability (0.7, 0.6, 0.8) from the
(HVL, LVL, ART) groups. We can then record the true conditional
probabilities from the full data and the unadjusted and adjusted
estimates from the sampled data. Figure 3 gives the distribution of
estimates of the conditional probabilities, compared against the
probabilities observed in the full sample. The MLE is quite
accurate, as we would expect given the generality of the results in
Methods for conditional probabilities of linkage. The adjusted
estimates of the conditional probabilities for the full sample are
given in Figure 4 and Table 2. The relative probabilities vary more
with the threshold in this case than in the individual-to-individual
case, likely because the probabilities of linkage are extremely small
(particularly when involving the ART group) and thus minor
differences in the distribution of distances by group pair could lead
to widely varying conditional probability estimates. It does appear
Figure 1. Average relative bias of adjusted (red) and unadjusted (black) estimators of group-wise linkage rates cuv over generaltime-reversible evolutionary model simulations.doi:10.1371/journal.pcbi.1003430.g001
Viral Linkage with Missing Data
PLOS Computational Biology | www.ploscompbiol.org 6 January 2014 | Volume 10 | Issue 1 | e1003430
to be most likely that a given link occurs between HVL and ART or
LVL, and it is least likely to be between two LVL individuals.
DiagnosticsBefore we proceed to estimate group-wise linkage rates for the
Mochudi data, it is useful to examine the estimated correlation under
the exchangeable model, which we will consider in development of a
diagnostic tool for assessing the reliability of our methods. For the
Mochudi data, we obtain a population-wide estimate of rr~0:0205;
group-specific estimates are given in Table 3. Most are close to the
population-level estimate, but there is some variability.
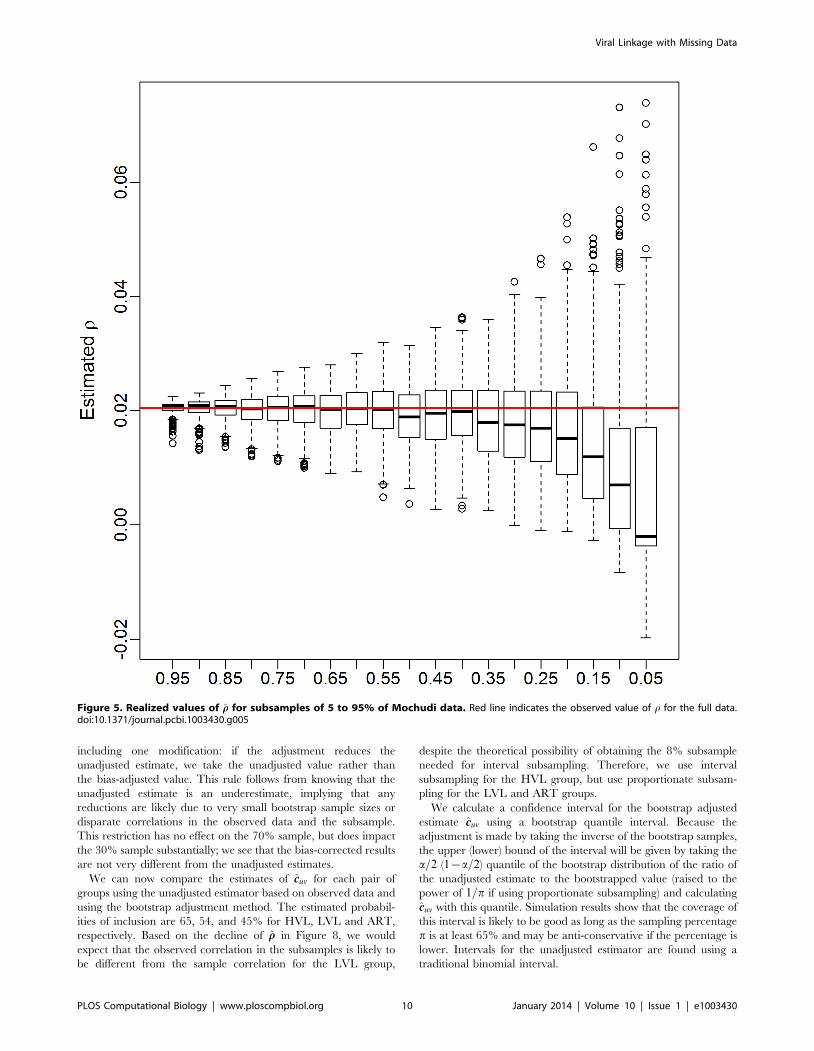
We can also see how the realized values of rr change with the
sampling fraction. Figure 5 show boxplots of these realized values
for subsamples of 5 to 95% of the Mochudi data. Each boxplot
represents 500 samples. The estimates become increasingly
variable as the sample gets smaller, but remain centered about
the value of rr from the full data (red line) until the sample size falls
below 40%, at which point the estimates decline sharply. This is
likely due to an increased probability of obtaining a sample with
very few observed links between the two groups. In the extreme
case when no links are observed, this yields s2ruv
~0 and rrv0, and
we can expect the estimated correlation to be extremely small in
cases with only a handful of links as well.
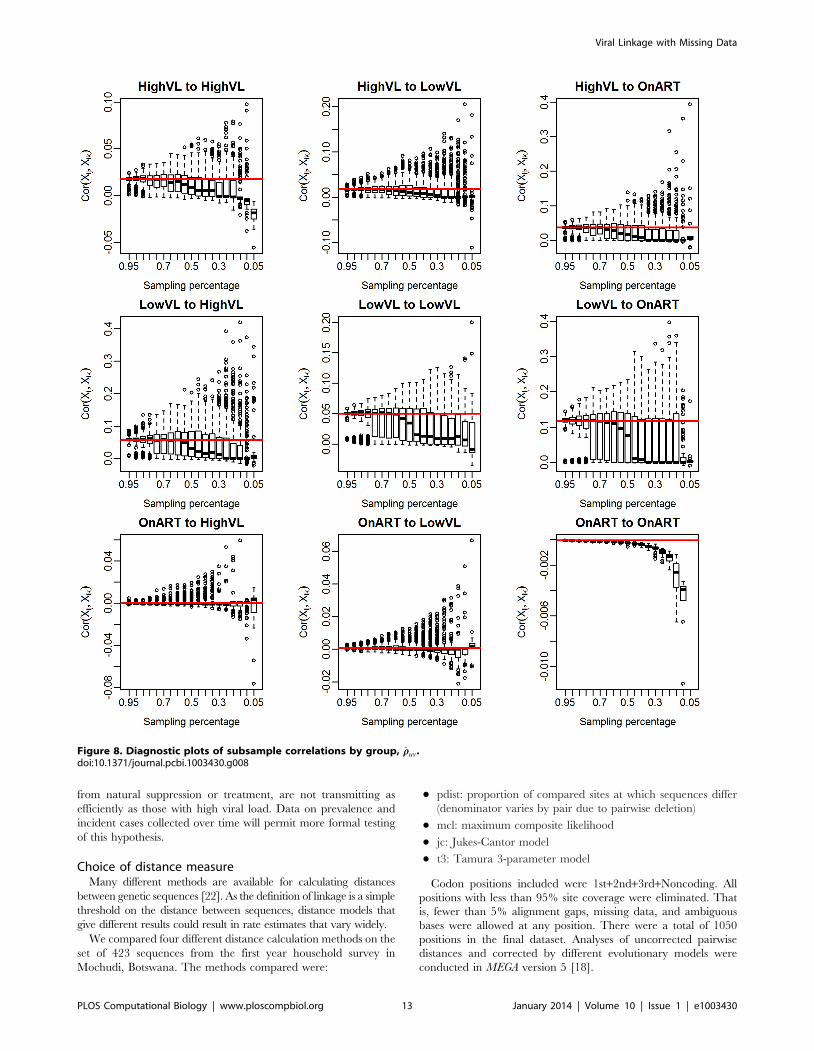
This decline in the estimated correlation, r, for very small
samples has implications for bootstrap bias correction. We propose
as a diagnostic creation of a plot similar to Figure 5 from the
Figure 2. Estimates of individual-to-individual probability of linkage by groups, ppuv, for the full Mochudi data.doi:10.1371/journal.pcbi.1003430.g002
Viral Linkage with Missing Data
PLOS Computational Biology | www.ploscompbiol.org 7 January 2014 | Volume 10 | Issue 1 | e1003430
observed data by group. If the estimated median of r appears to
remain fairly constant over a range of sampling fractions including
the size of the appropriate subsample, the estimated r is likely to
be similar to the true value, and the bootstrap bias correction
should work well, since the estimated adjustment ratio described in
the Methods depends upon r being similar across the population,
observed sample, and bootstrap subsample.
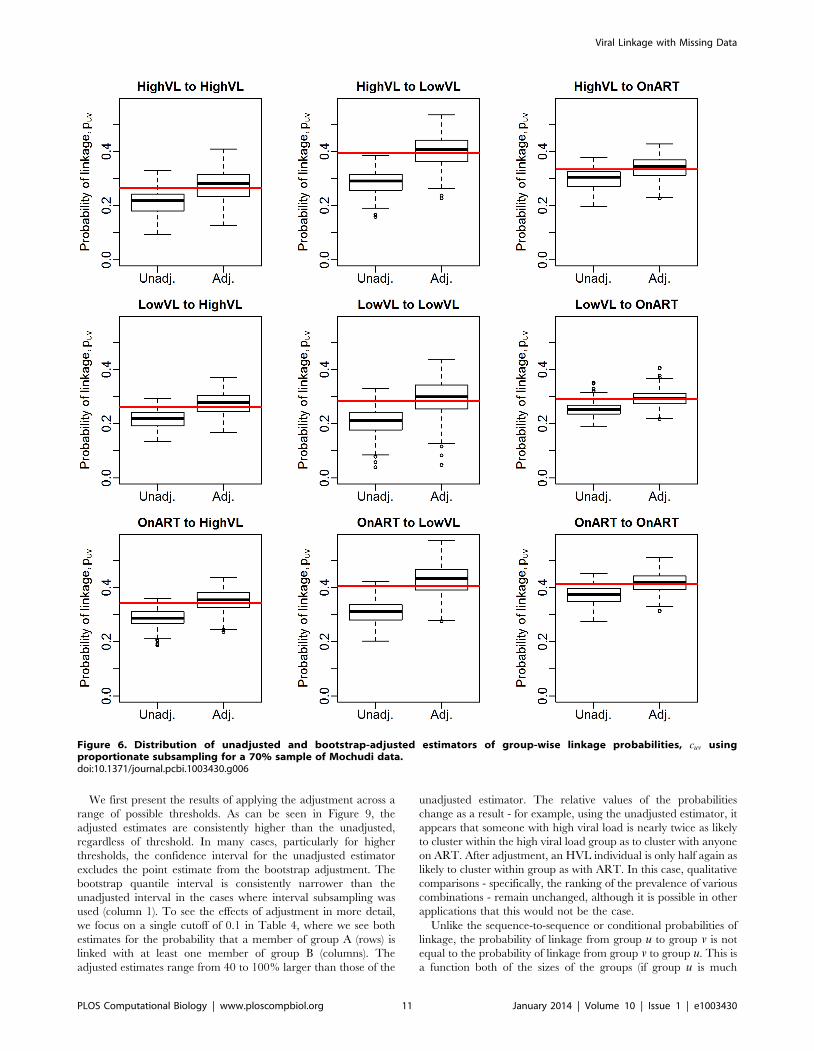
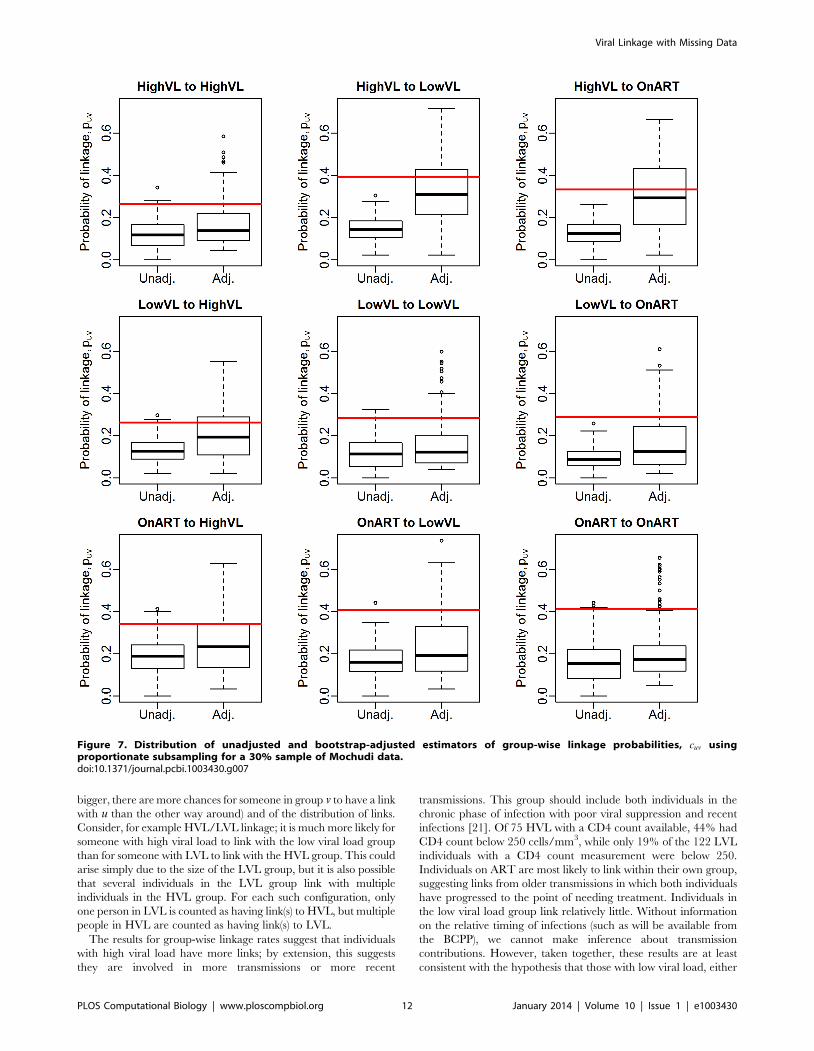
Estimation of group-wise clustering ratesWe first assess the performance of the bootstrap estimator ccuv
via simulation. Figures 6 and 7 show the resulting estimates for
70% and 30% samples of the observed data, respectively,
Table 1. Estimated probability of linkage between individualsof different groups, ppuv, from Mochudi data.
High VL Low VL On ART
High VL 1.47 0.62 1.02
Low VL 0.37 0.26
On ART 0.76
Rates given are per 1000 pairs. A link in this analysis is defined by a differencebetween sequences in less than 10% of available sites.doi:10.1371/journal.pcbi.1003430.t001
Figure 3. Estimates of conditional probability of linkage by groups, hhuv, for a 70% sample of the full Mochudi data. Red line representsthe ‘‘truth’’ as observed in the full data.doi:10.1371/journal.pcbi.1003430.g003
Viral Linkage with Missing Data
PLOS Computational Biology | www.ploscompbiol.org 8 January 2014 | Volume 10 | Issue 1 | e1003430
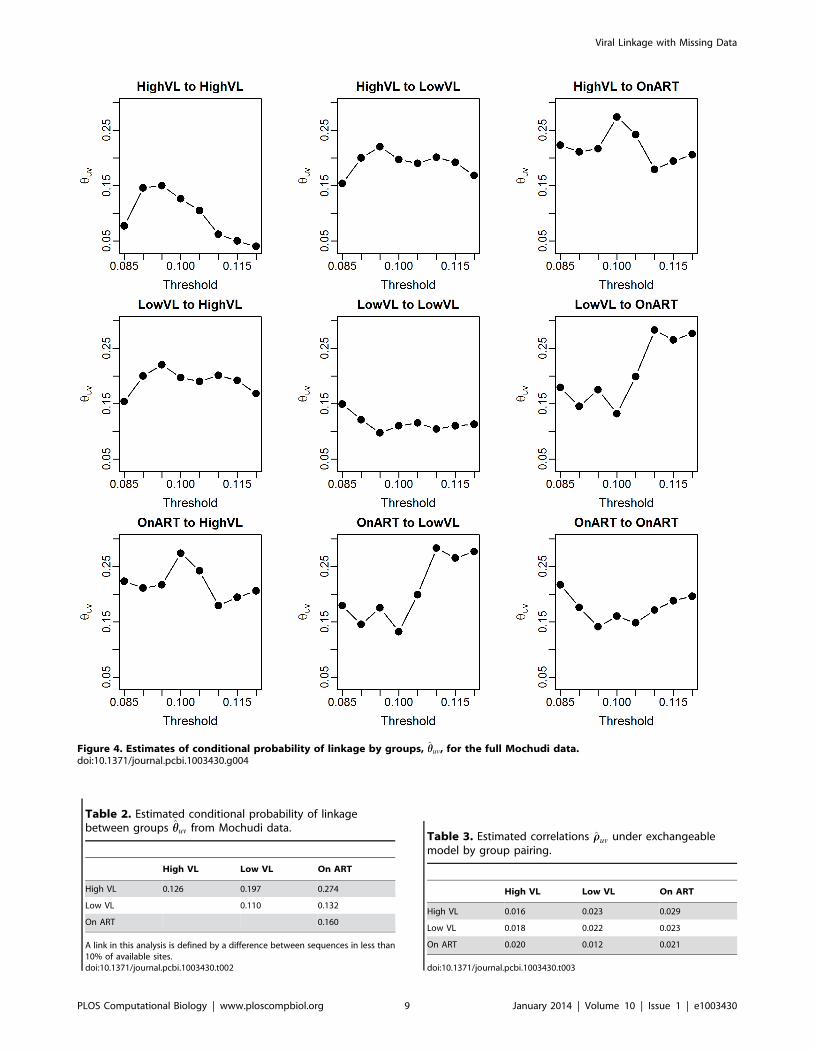
Figure 4. Estimates of conditional probability of linkage by groups, hhuv, for the full Mochudi data.doi:10.1371/journal.pcbi.1003430.g004
Table 3. Estimated correlations rruv under exchangeablemodel by group pairing.
High VL Low VL On ART
High VL 0.016 0.023 0.029
Low VL 0.018 0.022 0.023
On ART 0.020 0.012 0.021
doi:10.1371/journal.pcbi.1003430.t003
Table 2. Estimated conditional probability of linkagebetween groups hhuv from Mochudi data.
High VL Low VL On ART
High VL 0.126 0.197 0.274
Low VL 0.110 0.132
On ART 0.160
A link in this analysis is defined by a difference between sequences in less than10% of available sites.doi:10.1371/journal.pcbi.1003430.t002
Viral Linkage with Missing Data
PLOS Computational Biology | www.ploscompbiol.org 9 January 2014 | Volume 10 | Issue 1 | e1003430
including one modification: if the adjustment reduces the
unadjusted estimate, we take the unadjusted value rather than
the bias-adjusted value. This rule follows from knowing that the
unadjusted estimate is an underestimate, implying that any
reductions are likely due to very small bootstrap sample sizes or
disparate correlations in the observed data and the subsample.
This restriction has no effect on the 70% sample, but does impact
the 30% sample substantially; we see that the bias-corrected results
are not very different from the unadjusted estimates.
We can now compare the estimates of ccuv for each pair of
groups using the unadjusted estimator based on observed data and
using the bootstrap adjustment method. The estimated probabil-
ities of inclusion are 65, 54, and 45% for HVL, LVL and ART,
respectively. Based on the decline of rr in Figure 8, we would
expect that the observed correlation in the subsamples is likely to
be different from the sample correlation for the LVL group,
despite the theoretical possibility of obtaining the 8% subsample
needed for interval subsampling. Therefore, we use interval
subsampling for the HVL group, but use proportionate subsam-
pling for the LVL and ART groups.
We calculate a confidence interval for the bootstrap adjusted
estimate ccuv using a bootstrap quantile interval. Because the
adjustment is made by taking the inverse of the bootstrap samples,
the upper (lower) bound of the interval will be given by taking the
a=2 (1{a=2) quantile of the bootstrap distribution of the ratio of
the unadjusted estimate to the bootstrapped value (raised to the
power of 1=p if using proportionate subsampling) and calculating
ccuv with this quantile. Simulation results show that the coverage of
this interval is likely to be good as long as the sampling percentage
p is at least 65% and may be anti-conservative if the percentage is
lower. Intervals for the unadjusted estimator are found using a
traditional binomial interval.
Figure 5. Realized values of rr for subsamples of 5 to 95% of Mochudi data. Red line indicates the observed value of r for the full data.doi:10.1371/journal.pcbi.1003430.g005
Viral Linkage with Missing Data
PLOS Computational Biology | www.ploscompbiol.org 10 January 2014 | Volume 10 | Issue 1 | e1003430
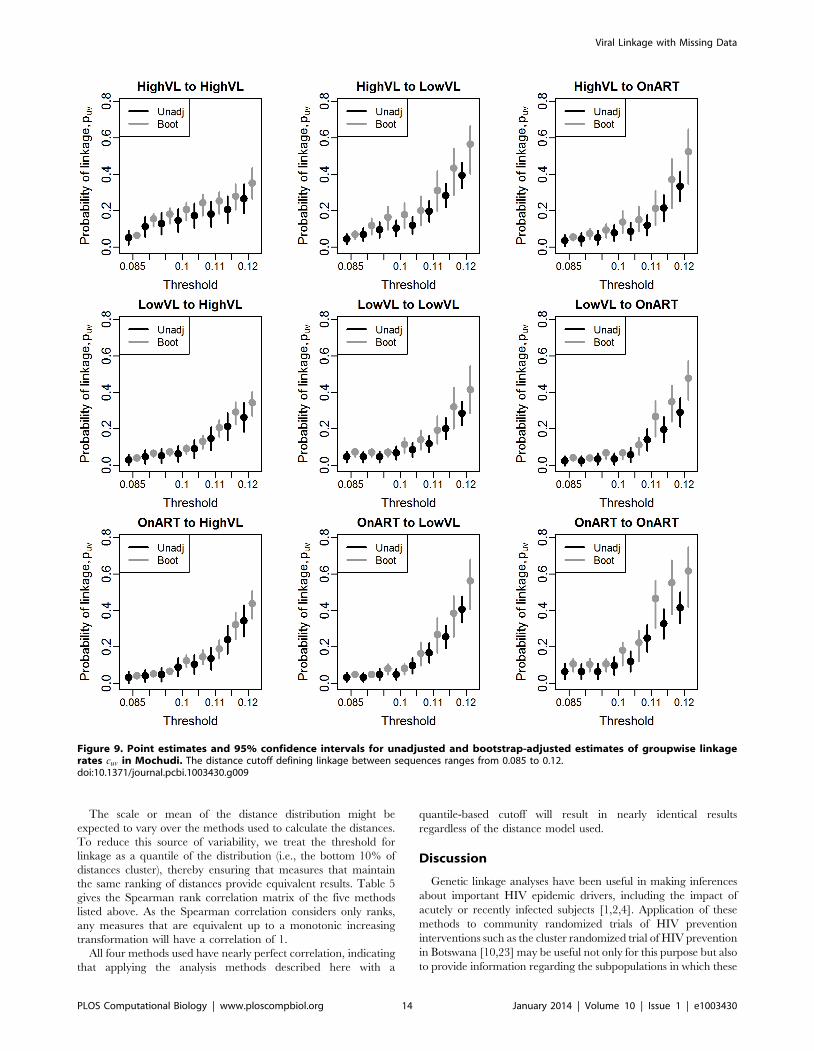
We first present the results of applying the adjustment across a
range of possible thresholds. As can be seen in Figure 9, the
adjusted estimates are consistently higher than the unadjusted,
regardless of threshold. In many cases, particularly for higher
thresholds, the confidence interval for the unadjusted estimator
excludes the point estimate from the bootstrap adjustment. The
bootstrap quantile interval is consistently narrower than the
unadjusted interval in the cases where interval subsampling was
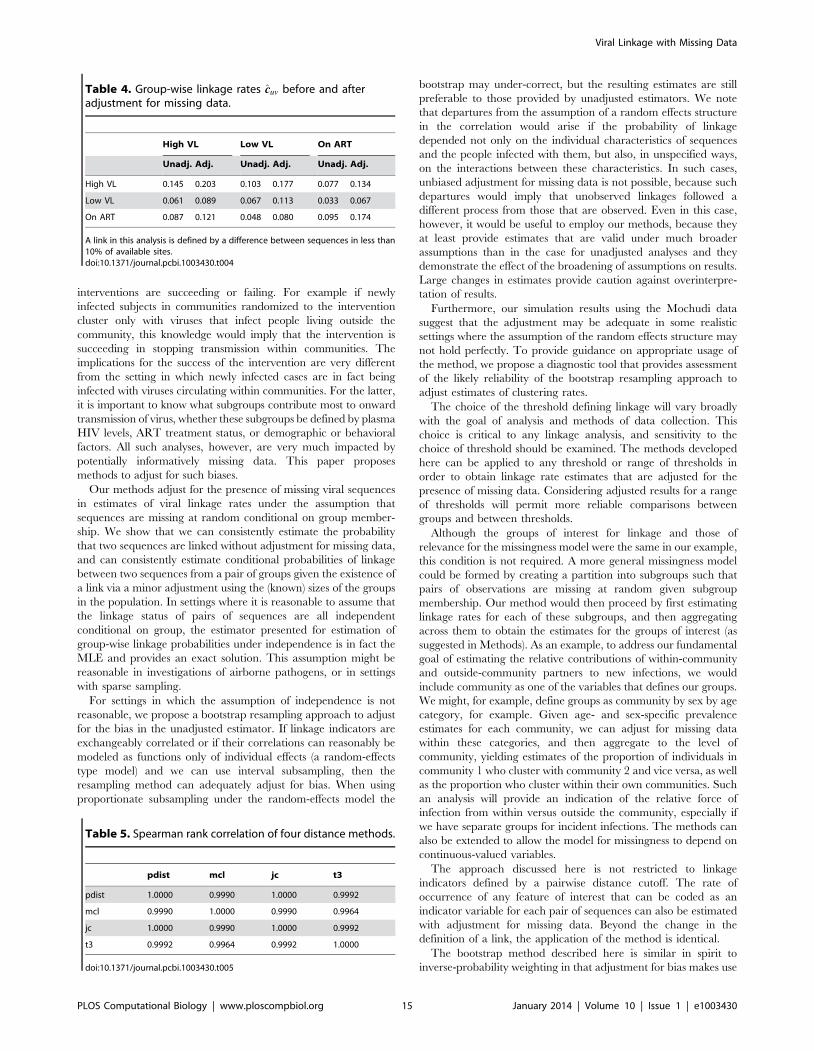
used (column 1). To see the effects of adjustment in more detail,
we focus on a single cutoff of 0.1 in Table 4, where we see both
estimates for the probability that a member of group A (rows) is
linked with at least one member of group B (columns). The
adjusted estimates range from 40 to 100% larger than those of the
unadjusted estimator. The relative values of the probabilities
change as a result - for example, using the unadjusted estimator, it
appears that someone with high viral load is nearly twice as likely
to cluster within the high viral load group as to cluster with anyone
on ART. After adjustment, an HVL individual is only half again as
likely to cluster within group as with ART. In this case, qualitative
comparisons - specifically, the ranking of the prevalence of various
combinations - remain unchanged, although it is possible in other
applications that this would not be the case.
Unlike the sequence-to-sequence or conditional probabilities of
linkage, the probability of linkage from group u to group v is not
equal to the probability of linkage from group v to group u. This is
a function both of the sizes of the groups (if group u is much
Figure 6. Distribution of unadjusted and bootstrap-adjusted estimators of group-wise linkage probabilities, cuv usingproportionate subsampling for a 70% sample of Mochudi data.doi:10.1371/journal.pcbi.1003430.g006
Viral Linkage with Missing Data
PLOS Computational Biology | www.ploscompbiol.org 11 January 2014 | Volume 10 | Issue 1 | e1003430
bigger, there are more chances for someone in group v to have a link
with u than the other way around) and of the distribution of links.
Consider, for example HVL/LVL linkage; it is much more likely for
someone with high viral load to link with the low viral load group
than for someone with LVL to link with the HVL group. This could
arise simply due to the size of the LVL group, but it is also possible
that several individuals in the LVL group link with multiple
individuals in the HVL group. For each such configuration, only
one person in LVL is counted as having link(s) to HVL, but multiple
people in HVL are counted as having link(s) to LVL.
The results for group-wise linkage rates suggest that individuals
with high viral load have more links; by extension, this suggests
they are involved in more transmissions or more recent
transmissions. This group should include both individuals in the
chronic phase of infection with poor viral suppression and recent
infections [21]. Of 75 HVL with a CD4 count available, 44% had
CD4 count below 250 cells/mm3, while only 19% of the 122 LVL
individuals with a CD4 count measurement were below 250.
Individuals on ART are most likely to link within their own group,
suggesting links from older transmissions in which both individuals
have progressed to the point of needing treatment. Individuals in
the low viral load group link relatively little. Without information
on the relative timing of infections (such as will be available from
the BCPP), we cannot make inference about transmission
contributions. However, taken together, these results are at least
consistent with the hypothesis that those with low viral load, either
Figure 7. Distribution of unadjusted and bootstrap-adjusted estimators of group-wise linkage probabilities, cuv usingproportionate subsampling for a 30% sample of Mochudi data.doi:10.1371/journal.pcbi.1003430.g007
Viral Linkage with Missing Data
PLOS Computational Biology | www.ploscompbiol.org 12 January 2014 | Volume 10 | Issue 1 | e1003430
from natural suppression or treatment, are not transmitting as
efficiently as those with high viral load. Data on prevalence and
incident cases collected over time will permit more formal testing
of this hypothesis.
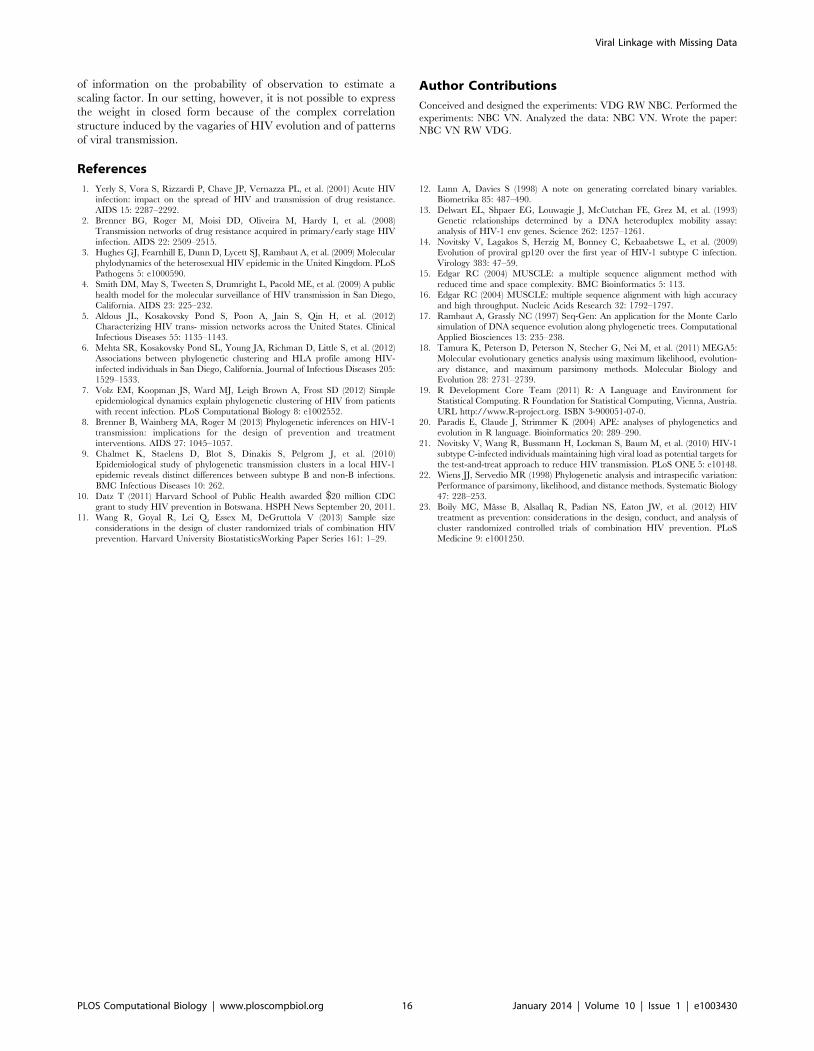
Choice of distance measureMany different methods are available for calculating distances
between genetic sequences [22]. As the definition of linkage is a simple
threshold on the distance between sequences, distance models that
give different results could result in rate estimates that vary widely.
We compared four different distance calculation methods on the
set of 423 sequences from the first year household survey in
Mochudi, Botswana. The methods compared were:
N pdist: proportion of compared sites at which sequences differ
(denominator varies by pair due to pairwise deletion)
N mcl: maximum composite likelihood
N jc: Jukes-Cantor model
N t3: Tamura 3-parameter model
Codon positions included were 1st+2nd+3rd+Noncoding. All
positions with less than 95% site coverage were eliminated. That
is, fewer than 5% alignment gaps, missing data, and ambiguous
bases were allowed at any position. There were a total of 1050
positions in the final dataset. Analyses of uncorrected pairwise
distances and corrected by different evolutionary models were
conducted in MEGA version 5 [18].
Figure 8. Diagnostic plots of subsample correlations by group, rruv.doi:10.1371/journal.pcbi.1003430.g008
Viral Linkage with Missing Data
PLOS Computational Biology | www.ploscompbiol.org 13 January 2014 | Volume 10 | Issue 1 | e1003430
The scale or mean of the distance distribution might be
expected to vary over the methods used to calculate the distances.
To reduce this source of variability, we treat the threshold for
linkage as a quantile of the distribution (i.e., the bottom 10% of
distances cluster), thereby ensuring that measures that maintain
the same ranking of distances provide equivalent results. Table 5
gives the Spearman rank correlation matrix of the five methods
listed above. As the Spearman correlation considers only ranks,
any measures that are equivalent up to a monotonic increasing
transformation will have a correlation of 1.
All four methods used have nearly perfect correlation, indicating
that applying the analysis methods described here with a
quantile-based cutoff will result in nearly identical results
regardless of the distance model used.
Discussion
Genetic linkage analyses have been useful in making inferences
about important HIV epidemic drivers, including the impact of
acutely or recently infected subjects [1,2,4]. Application of these
methods to community randomized trials of HIV prevention
interventions such as the cluster randomized trial of HIV prevention
in Botswana [10,23] may be useful not only for this purpose but also
to provide information regarding the subpopulations in which these
Figure 9. Point estimates and 95% confidence intervals for unadjusted and bootstrap-adjusted estimates of groupwise linkagerates cuv in Mochudi. The distance cutoff defining linkage between sequences ranges from 0.085 to 0.12.doi:10.1371/journal.pcbi.1003430.g009
Viral Linkage with Missing Data
PLOS Computational Biology | www.ploscompbiol.org 14 January 2014 | Volume 10 | Issue 1 | e1003430
interventions are succeeding or failing. For example if newly
infected subjects in communities randomized to the intervention
cluster only with viruses that infect people living outside the
community, this knowledge would imply that the intervention is
succeeding in stopping transmission within communities. The
implications for the success of the intervention are very different
from the setting in which newly infected cases are in fact being
infected with viruses circulating within communities. For the latter,
it is important to know what subgroups contribute most to onward
transmission of virus, whether these subgroups be defined by plasma
HIV levels, ART treatment status, or demographic or behavioral
factors. All such analyses, however, are very much impacted by
potentially informatively missing data. This paper proposes
methods to adjust for such biases.
Our methods adjust for the presence of missing viral sequences
in estimates of viral linkage rates under the assumption that
sequences are missing at random conditional on group member-
ship. We show that we can consistently estimate the probability
that two sequences are linked without adjustment for missing data,
and can consistently estimate conditional probabilities of linkage
between two sequences from a pair of groups given the existence of
a link via a minor adjustment using the (known) sizes of the groups
in the population. In settings where it is reasonable to assume that
the linkage status of pairs of sequences are all independent
conditional on group, the estimator presented for estimation of
group-wise linkage probabilities under independence is in fact the
MLE and provides an exact solution. This assumption might be
reasonable in investigations of airborne pathogens, or in settings
with sparse sampling.
For settings in which the assumption of independence is not
reasonable, we propose a bootstrap resampling approach to adjust
for the bias in the unadjusted estimator. If linkage indicators are
exchangeably correlated or if their correlations can reasonably be
modeled as functions only of individual effects (a random-effects
type model) and we can use interval subsampling, then the
resampling method can adequately adjust for bias. When using
proportionate subsampling under the random-effects model the
bootstrap may under-correct, but the resulting estimates are still
preferable to those provided by unadjusted estimators. We note
that departures from the assumption of a random effects structure
in the correlation would arise if the probability of linkage
depended not only on the individual characteristics of sequences
and the people infected with them, but also, in unspecified ways,
on the interactions between these characteristics. In such cases,
unbiased adjustment for missing data is not possible, because such
departures would imply that unobserved linkages followed a
different process from those that are observed. Even in this case,
however, it would be useful to employ our methods, because they
at least provide estimates that are valid under much broader
assumptions than in the case for unadjusted analyses and they
demonstrate the effect of the broadening of assumptions on results.
Large changes in estimates provide caution against overinterpre-
tation of results.
Furthermore, our simulation results using the Mochudi data
suggest that the adjustment may be adequate in some realistic
settings where the assumption of the random effects structure may
not hold perfectly. To provide guidance on appropriate usage of
the method, we propose a diagnostic tool that provides assessment
of the likely reliability of the bootstrap resampling approach to
adjust estimates of clustering rates.
The choice of the threshold defining linkage will vary broadly
with the goal of analysis and methods of data collection. This
choice is critical to any linkage analysis, and sensitivity to the
choice of threshold should be examined. The methods developed
here can be applied to any threshold or range of thresholds in
order to obtain linkage rate estimates that are adjusted for the
presence of missing data. Considering adjusted results for a range
of thresholds will permit more reliable comparisons between
groups and between thresholds.
Although the groups of interest for linkage and those of
relevance for the missingness model were the same in our example,
this condition is not required. A more general missingness model
could be formed by creating a partition into subgroups such that
pairs of observations are missing at random given subgroup
membership. Our method would then proceed by first estimating
linkage rates for each of these subgroups, and then aggregating
across them to obtain the estimates for the groups of interest (as
suggested in Methods). As an example, to address our fundamental
goal of estimating the relative contributions of within-community
and outside-community partners to new infections, we would
include community as one of the variables that defines our groups.
We might, for example, define groups as community by sex by age
category, for example. Given age- and sex-specific prevalence
estimates for each community, we can adjust for missing data
within these categories, and then aggregate to the level of
community, yielding estimates of the proportion of individuals in
community 1 who cluster with community 2 and vice versa, as well
as the proportion who cluster within their own communities. Such
an analysis will provide an indication of the relative force of
infection from within versus outside the community, especially if
we have separate groups for incident infections. The methods can
also be extended to allow the model for missingness to depend on
continuous-valued variables.
The approach discussed here is not restricted to linkage
indicators defined by a pairwise distance cutoff. The rate of
occurrence of any feature of interest that can be coded as an
indicator variable for each pair of sequences can also be estimated
with adjustment for missing data. Beyond the change in the
definition of a link, the application of the method is identical.
The bootstrap method described here is similar in spirit to
inverse-probability weighting in that adjustment for bias makes use
Table 4. Group-wise linkage rates ccuv before and afteradjustment for missing data.
High VL Low VL On ART
Unadj. Adj. Unadj. Adj. Unadj. Adj.
High VL 0.145 0.203 0.103 0.177 0.077 0.134
Low VL 0.061 0.089 0.067 0.113 0.033 0.067
On ART 0.087 0.121 0.048 0.080 0.095 0.174
A link in this analysis is defined by a difference between sequences in less than10% of available sites.doi:10.1371/journal.pcbi.1003430.t004
Table 5. Spearman rank correlation of four distance methods.
pdist mcl jc t3
pdist 1.0000 0.9990 1.0000 0.9992
mcl 0.9990 1.0000 0.9990 0.9964
jc 1.0000 0.9990 1.0000 0.9992
t3 0.9992 0.9964 0.9992 1.0000
doi:10.1371/journal.pcbi.1003430.t005
Viral Linkage with Missing Data
PLOS Computational Biology | www.ploscompbiol.org 15 January 2014 | Volume 10 | Issue 1 | e1003430
of information on the probability of observation to estimate a
scaling factor. In our setting, however, it is not possible to express
the weight in closed form because of the complex correlation
structure induced by the vagaries of HIV evolution and of patterns
of viral transmission.
Author Contributions
Conceived and designed the experiments: VDG RW NBC. Performed the
experiments: NBC VN. Analyzed the data: NBC VN. Wrote the paper:
NBC VN RW VDG.
References
1. Yerly S, Vora S, Rizzardi P, Chave JP, Vernazza PL, et al. (2001) Acute HIVinfection: impact on the spread of HIV and transmission of drug resistance.
AIDS 15: 2287–2292.2. Brenner BG, Roger M, Moisi DD, Oliveira M, Hardy I, et al. (2008)
Transmission networks of drug resistance acquired in primary/early stage HIV
infection. AIDS 22: 2509–2515.3. Hughes GJ, Fearnhill E, Dunn D, Lycett SJ, Rambaut A, et al. (2009) Molecular
phylodynamics of the heterosexual HIV epidemic in the United Kingdom. PLoSPathogens 5: e1000590.
4. Smith DM, May S, Tweeten S, Drumright L, Pacold ME, et al. (2009) A public
health model for the molecular surveillance of HIV transmission in San Diego,California. AIDS 23: 225–232.
5. Aldous JL, Kosakovsky Pond S, Poon A, Jain S, Qin H, et al. (2012)Characterizing HIV trans- mission networks across the United States. Clinical
Infectious Diseases 55: 1135–1143.6. Mehta SR, Kosakovsky Pond SL, Young JA, Richman D, Little S, et al. (2012)
Associations between phylogenetic clustering and HLA profile among HIV-
infected individuals in San Diego, California. Journal of Infectious Diseases 205:1529–1533.
7. Volz EM, Koopman JS, Ward MJ, Leigh Brown A, Frost SD (2012) Simpleepidemiological dynamics explain phylogenetic clustering of HIV from patients
with recent infection. PLoS Computational Biology 8: e1002552.
8. Brenner B, Wainberg MA, Roger M (2013) Phylogenetic inferences on HIV-1transmission: implications for the design of prevention and treatment
interventions. AIDS 27: 1045–1057.9. Chalmet K, Staelens D, Blot S, Dinakis S, Pelgrom J, et al. (2010)
Epidemiological study of phylogenetic transmission clusters in a local HIV-1epidemic reveals distinct differences between subtype B and non-B infections.
BMC Infectious Diseases 10: 262.
10. Datz T (2011) Harvard School of Public Health awarded $20 million CDCgrant to study HIV prevention in Botswana. HSPH News September 20, 2011.
11. Wang R, Goyal R, Lei Q, Essex M, DeGruttola V (2013) Sample sizeconsiderations in the design of cluster randomized trials of combination HIV
prevention. Harvard University BiostatisticsWorking Paper Series 161: 1–29.
12. Lunn A, Davies S (1998) A note on generating correlated binary variables.Biometrika 85: 487–490.
13. Delwart EL, Shpaer EG, Louwagie J, McCutchan FE, Grez M, et al. (1993)Genetic relationships determined by a DNA heteroduplex mobility assay:
analysis of HIV-1 env genes. Science 262: 1257–1261.
14. Novitsky V, Lagakos S, Herzig M, Bonney C, Kebaabetswe L, et al. (2009)Evolution of proviral gp120 over the first year of HIV-1 subtype C infection.
Virology 383: 47–59.15. Edgar RC (2004) MUSCLE: a multiple sequence alignment method with
reduced time and space complexity. BMC Bioinformatics 5: 113.
16. Edgar RC (2004) MUSCLE: multiple sequence alignment with high accuracyand high throughput. Nucleic Acids Research 32: 1792–1797.
17. Rambaut A, Grassly NC (1997) Seq-Gen: An application for the Monte Carlosimulation of DNA sequence evolution along phylogenetic trees. Computational
Applied Biosciences 13: 235–238.18. Tamura K, Peterson D, Peterson N, Stecher G, Nei M, et al. (2011) MEGA5:
Molecular evolutionary genetics analysis using maximum likelihood, evolution-
ary distance, and maximum parsimony methods. Molecular Biology andEvolution 28: 2731–2739.
19. R Development Core Team (2011) R: A Language and Environment forStatistical Computing. R Foundation for Statistical Computing, Vienna, Austria.
URL http://www.R-project.org. ISBN 3-900051-07-0.
20. Paradis E, Claude J, Strimmer K (2004) APE: analyses of phylogenetics andevolution in R language. Bioinformatics 20: 289–290.
21. Novitsky V, Wang R, Bussmann H, Lockman S, Baum M, et al. (2010) HIV-1subtype C-infected individuals maintaining high viral load as potential targets for
the test-and-treat approach to reduce HIV transmission. PLoS ONE 5: e10148.22. Wiens JJ, Servedio MR (1998) Phylogenetic analysis and intraspecific variation:
Performance of parsimony, likelihood, and distance methods. Systematic Biology
47: 228–253.23. Boily MC, Masse B, Alsallaq R, Padian NS, Eaton JW, et al. (2012) HIV
treatment as prevention: considerations in the design, conduct, and analysis ofcluster randomized controlled trials of combination HIV prevention. PLoS
Medicine 9: e1001250.
Viral Linkage with Missing Data
PLOS Computational Biology | www.ploscompbiol.org 16 January 2014 | Volume 10 | Issue 1 | e1003430