Embed Size (px)
Citation preview
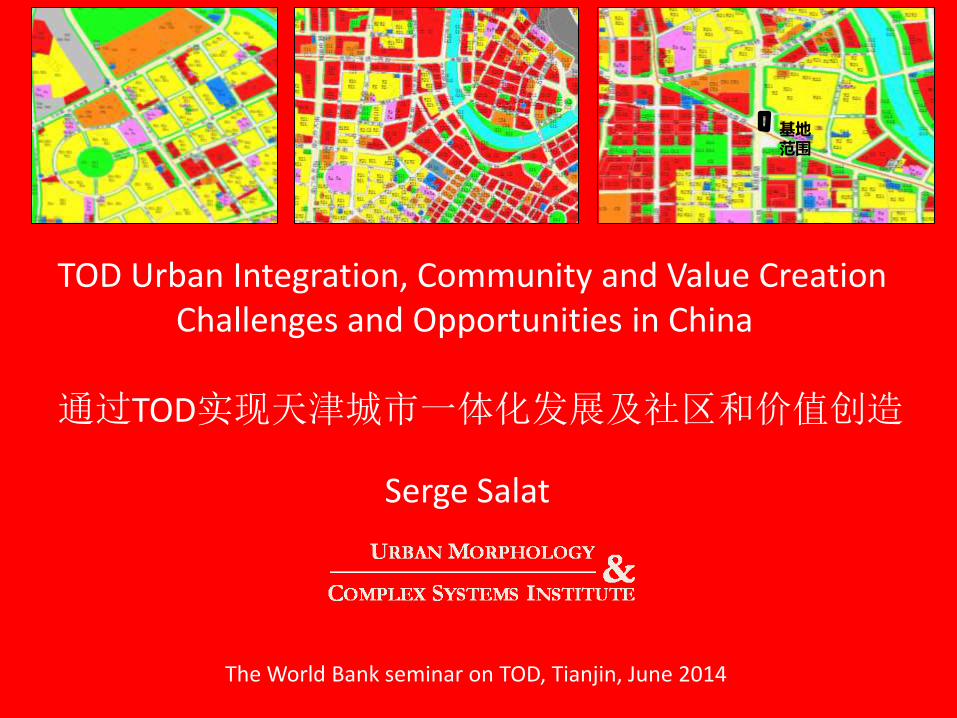
TOD Urban Integration, Community and Value Creation Challenges and Opportunities in China 通过TOD实现天津城市一体化发展及社区和价值创造
Serge Salat
基地范围
The World Bank seminar on TOD, Tianjin, June 2014
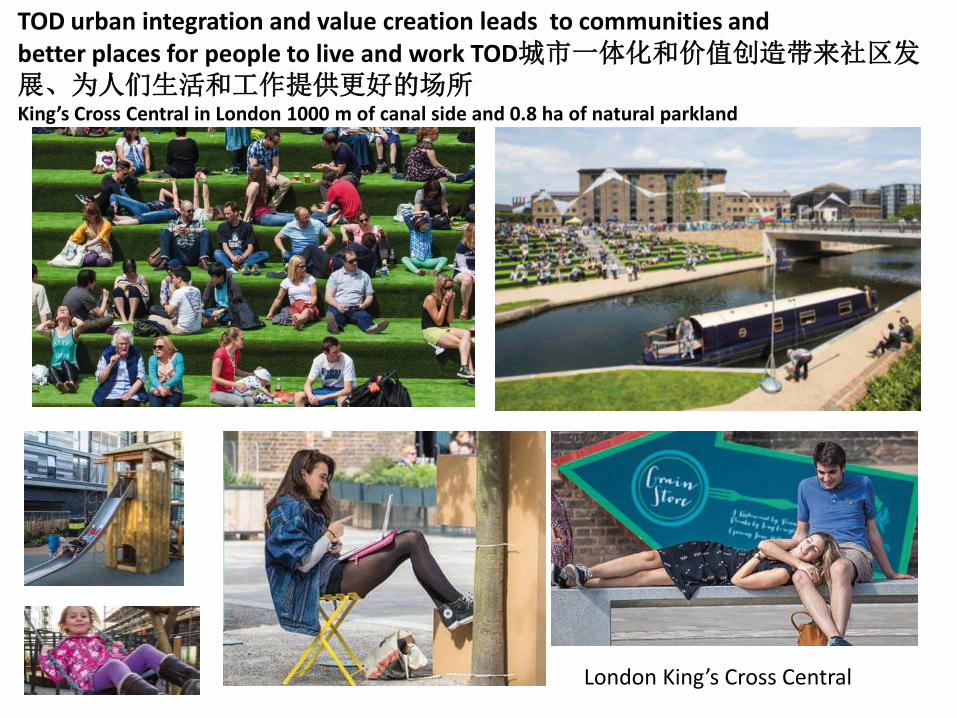
TOD urban integration and value creation leads to communities and better places for people to live and work TOD城市一体化和价值创造带来社区发展、为人们生活和工作提供更好的场所 King’s Cross Central in London 1000 m of canal side and 0.8 ha of natural parkland
London King’s Cross Central
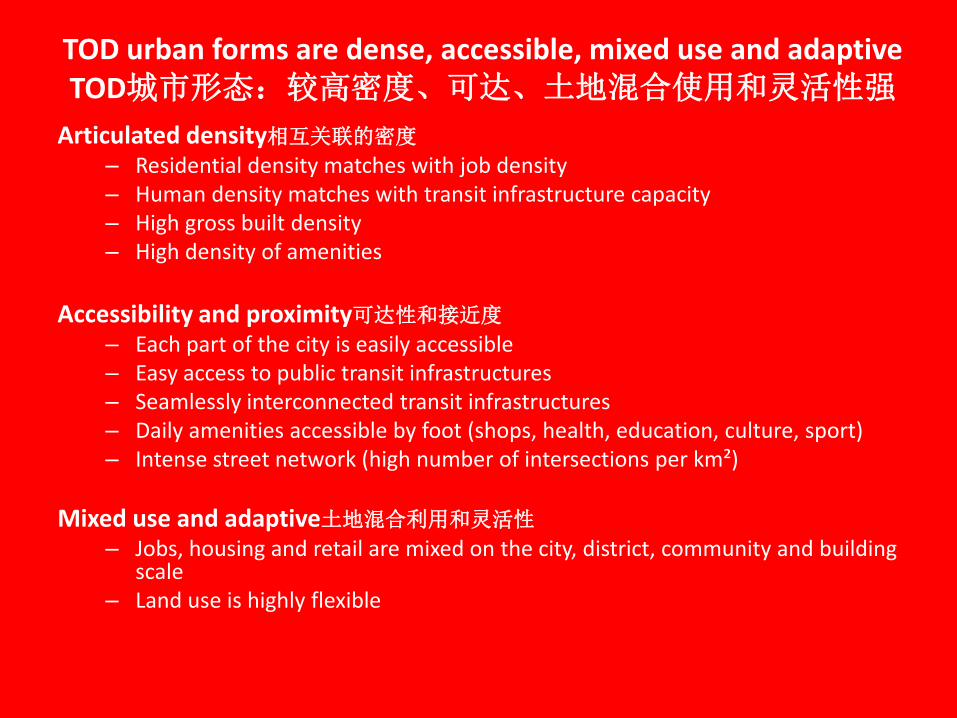
TOD urban forms are dense, accessible, mixed use and adaptive TOD城市形态:较高密度、可达、土地混合使用和灵活性强
Articulated density相互关联的密度
– Residential density matches with job density – Human density matches with transit infrastructure capacity – High gross built density – High density of amenities
Accessibility and proximity可达性和接近度
– Each part of the city is easily accessible – Easy access to public transit infrastructures – Seamlessly interconnected transit infrastructures – Daily amenities accessible by foot (shops, health, education, culture, sport) – Intense street network (high number of intersections per km²)
Mixed use and adaptive土地混合利用和灵活性
– Jobs, housing and retail are mixed on the city, district, community and building scale
– Land use is highly flexible
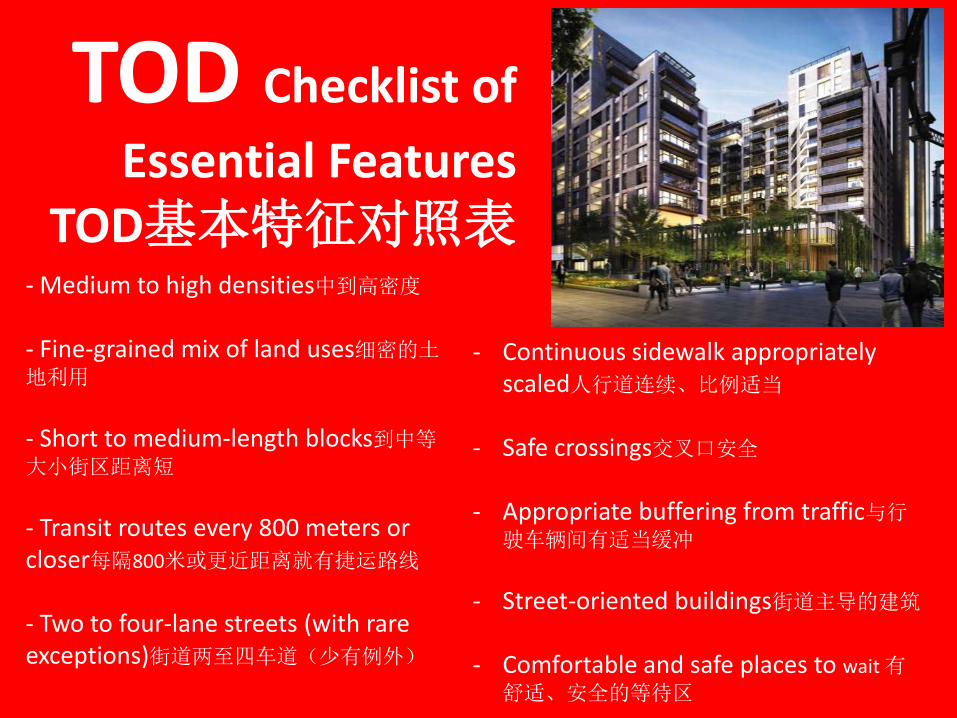
TOD Checklist of
Essential Features TOD基本特征对照表
- Medium to high densities中到高密度
- Fine-grained mix of land uses细密的土
地利用
- Short to medium-length blocks到中等
大小街区距离短
- Transit routes every 800 meters or closer每隔800米或更近距离就有捷运路线
- Two to four-lane streets (with rare exceptions)街道两至四车道(少有例外)
- Continuous sidewalk appropriately scaled人行道连续、比例适当
- Safe crossings交叉口安全
- Appropriate buffering from traffic与行
驶车辆间有适当缓冲
- Street-oriented buildings街道主导的建筑
- Comfortable and safe places to wait 有
舒适、安全的等待区
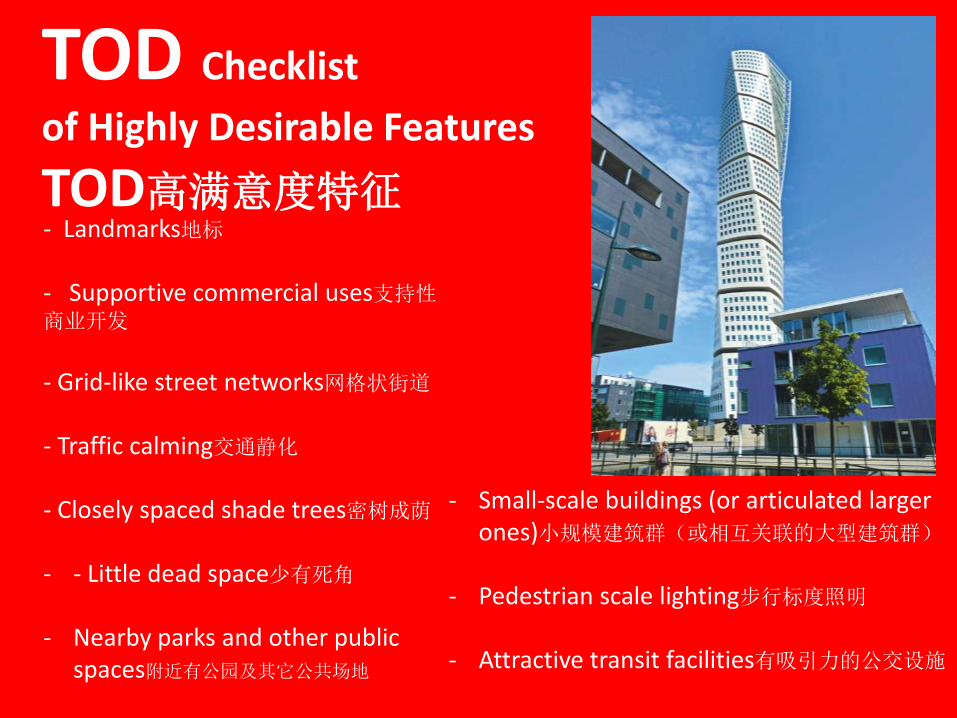
TOD Checklist
of Highly Desirable Features
TOD高满意度特征 - Landmarks地标
- Supportive commercial uses支持性
商业开发
- Grid-like street networks网格状街道
- Traffic calming交通静化
- Closely spaced shade trees密树成荫
- - Little dead space少有死角
- Nearby parks and other public
spaces附近有公园及其它公共场地
- Small-scale buildings (or articulated larger ones)小规模建筑群(或相互关联的大型建筑群)
- Pedestrian scale lighting步行标度照明
- Attractive transit facilities有吸引力的公交设施
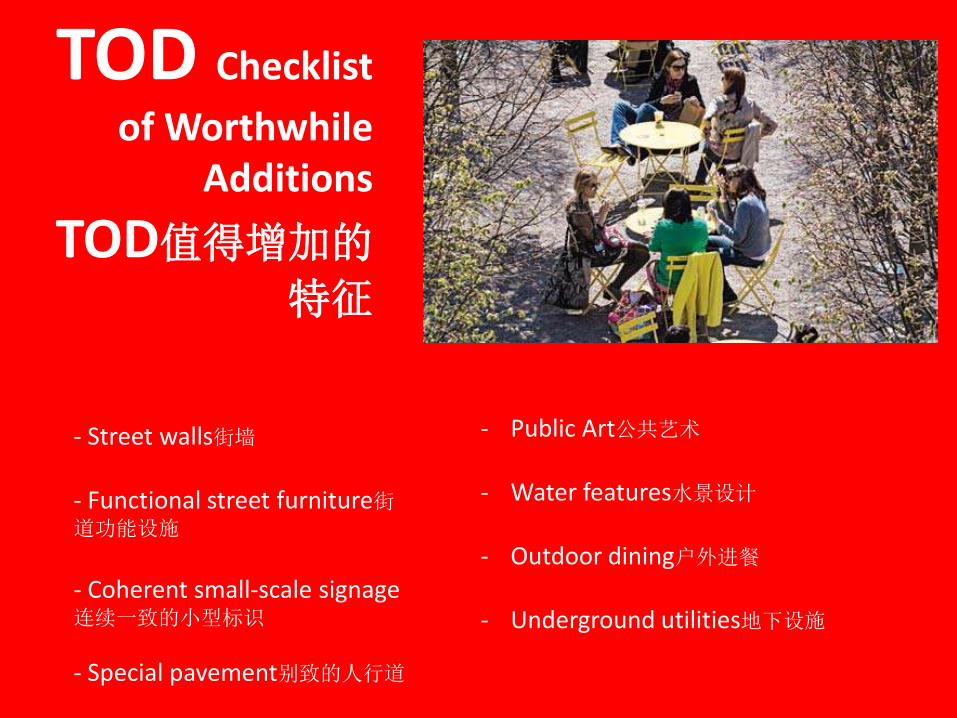
TOD Checklist
of Worthwhile Additions
TOD值得增加的
特征
- Street walls街墙
- Functional street furniture街道功能设施
- Coherent small-scale signage连续一致的小型标识
- Special pavement别致的人行道
- Public Art公共艺术
- Water features水景设计
- Outdoor dining户外进餐
- Underground utilities地下设施
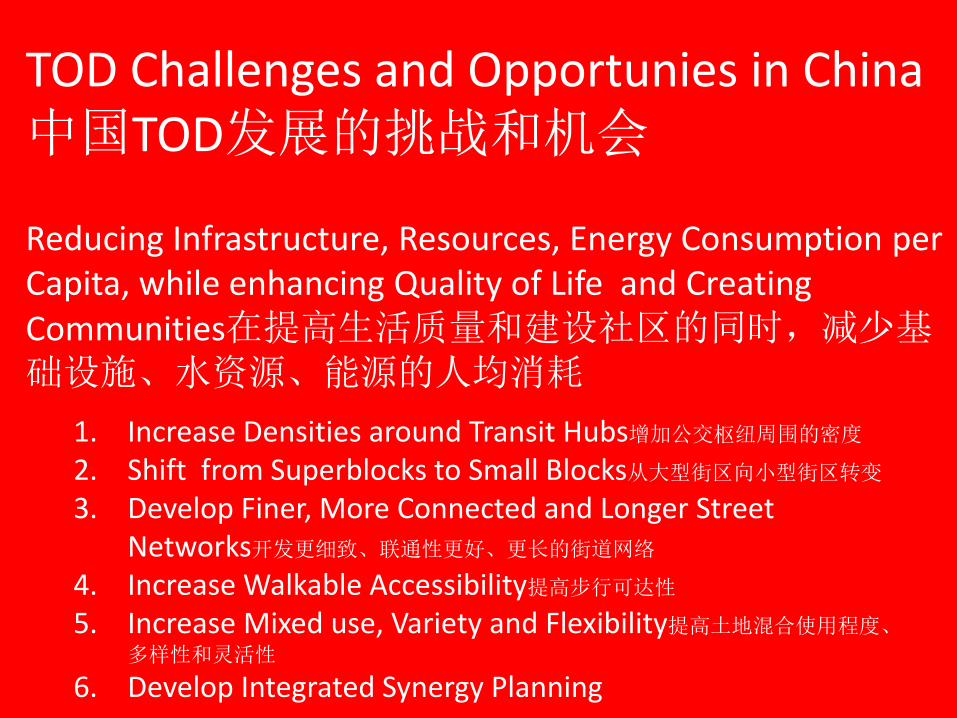
TOD Challenges and Opportunies in China中国TOD发展的挑战和机会 Reducing Infrastructure, Resources, Energy Consumption per Capita, while enhancing Quality of Life and Creating Communities在提高生活质量和建设社区的同时,减少基础设施、水资源、能源的人均消耗
1. Increase Densities around Transit Hubs增加公交枢纽周围的密度
2. Shift from Superblocks to Small Blocks从大型街区向小型街区转变
3. Develop Finer, More Connected and Longer Street Networks开发更细致、联通性更好、更长的街道网络
4. Increase Walkable Accessibility提高步行可达性
5. Increase Mixed use, Variety and Flexibility提高土地混合使用程度、
多样性和灵活性
6. Develop Integrated Synergy Planning
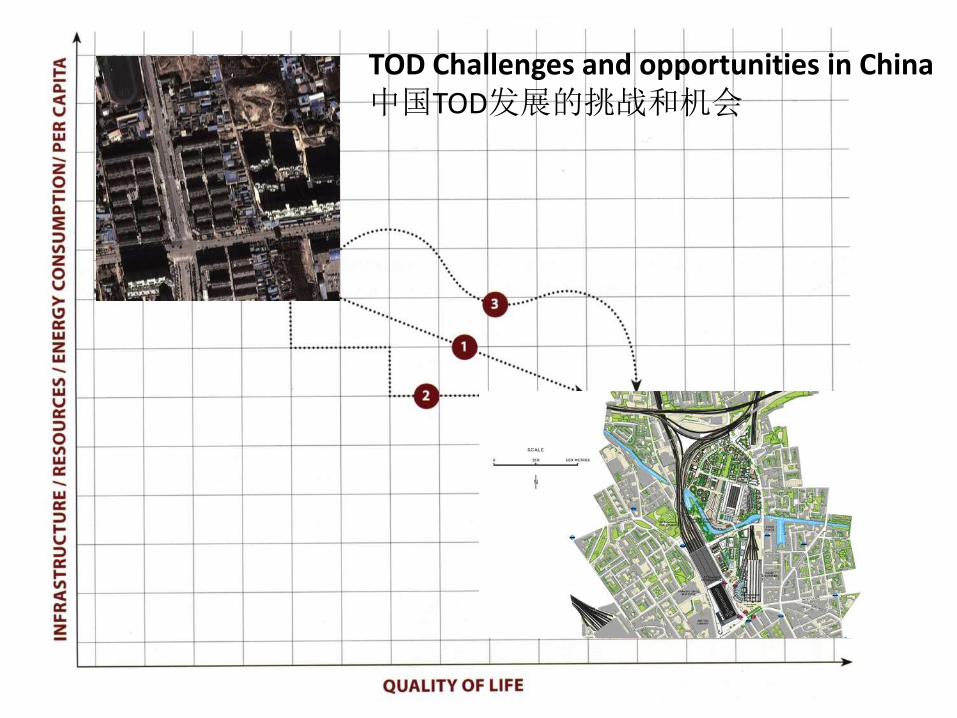
TOD Challenges and opportunities in China 中国TOD发展的挑战和机会
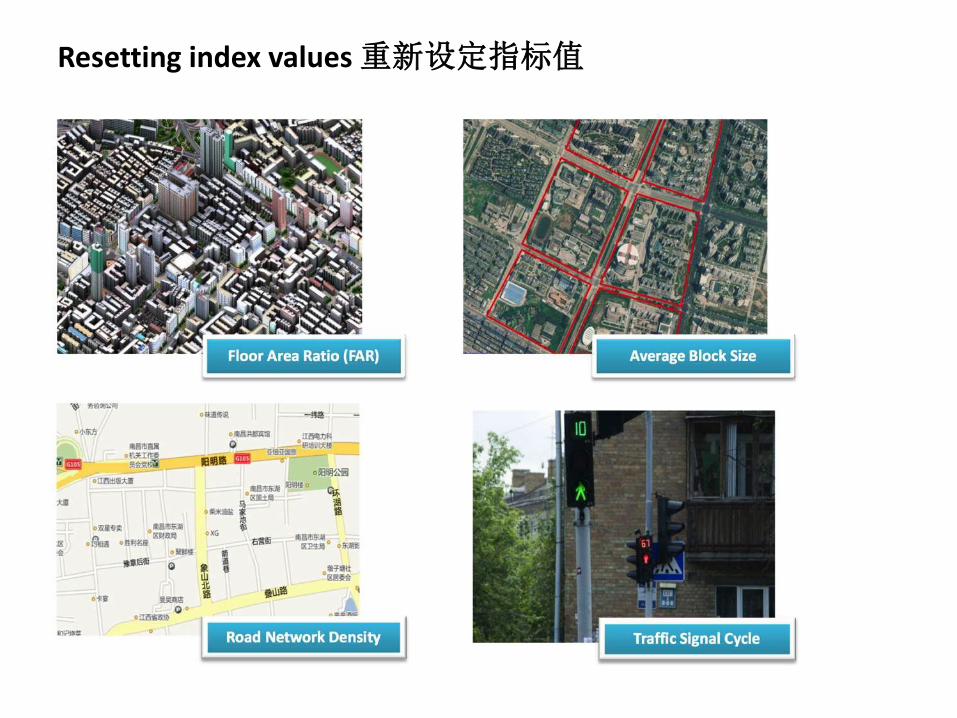
Resetting index values 重新设定指标值
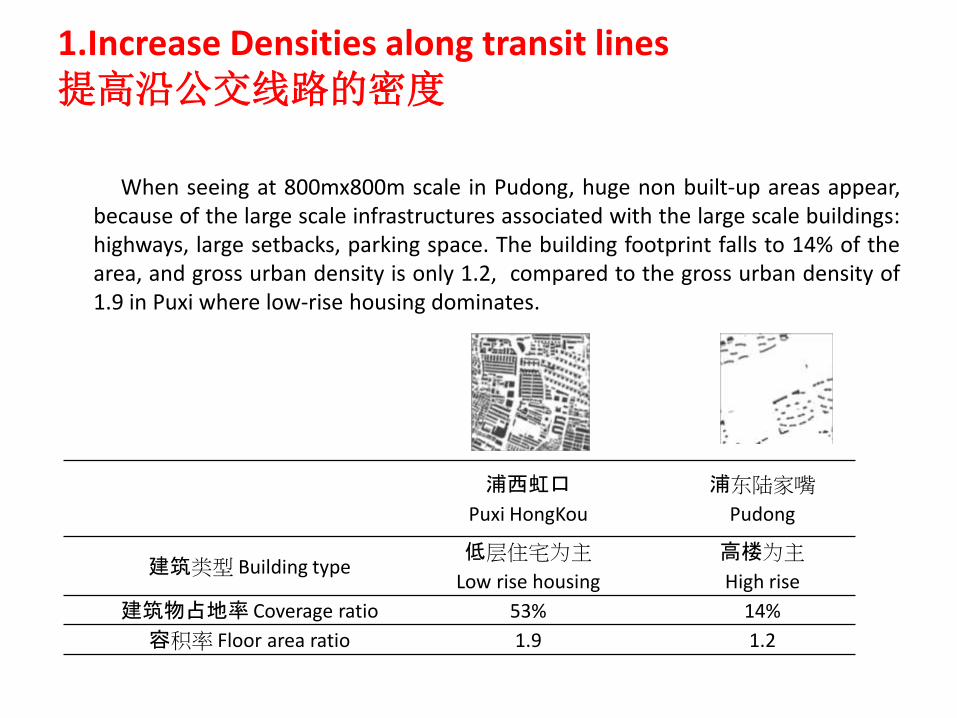
1.Increase Densities along transit lines 提高沿公交线路的密度 When seeing at 800mx800m scale in Pudong, huge non built-up areas appear,
because of the large scale infrastructures associated with the large scale buildings: highways, large setbacks, parking space. The building footprint falls to 14% of the area, and gross urban density is only 1.2, compared to the gross urban density of 1.9 in Puxi where low-rise housing dominates.
浦西虹口
Puxi HongKou
浦东陆家嘴
Pudong
建筑类型 Building type 低层住宅为主
Low rise housing
高楼为主
High rise
建筑物占地率 Coverage ratio 53% 14%
容积率 Floor area ratio 1.9 1.2
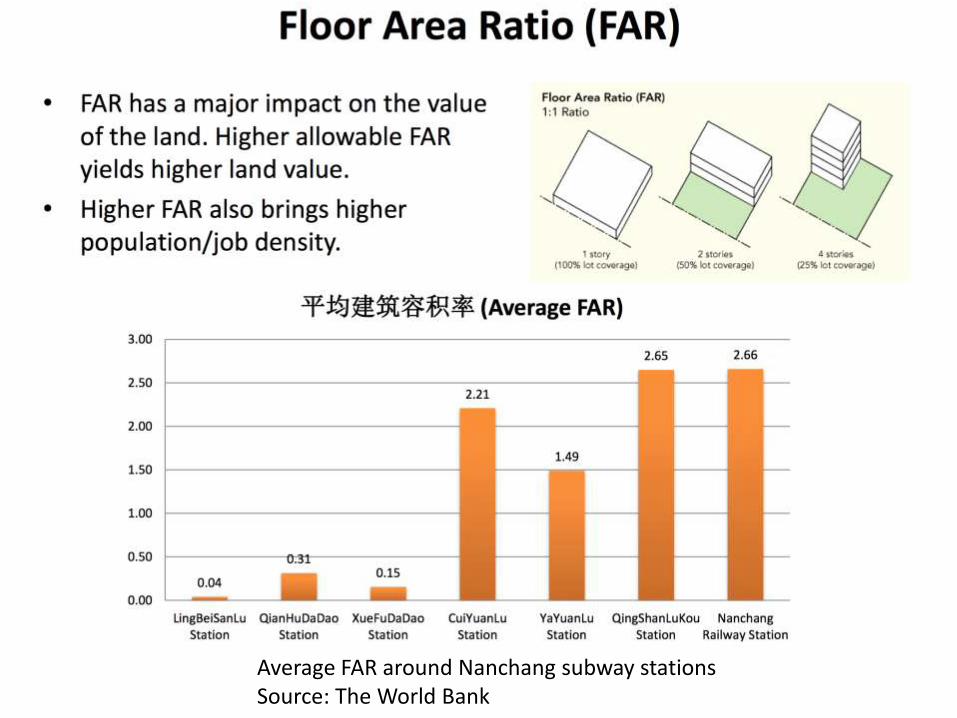
Average FAR around Nanchang subway stations Source: The World Bank
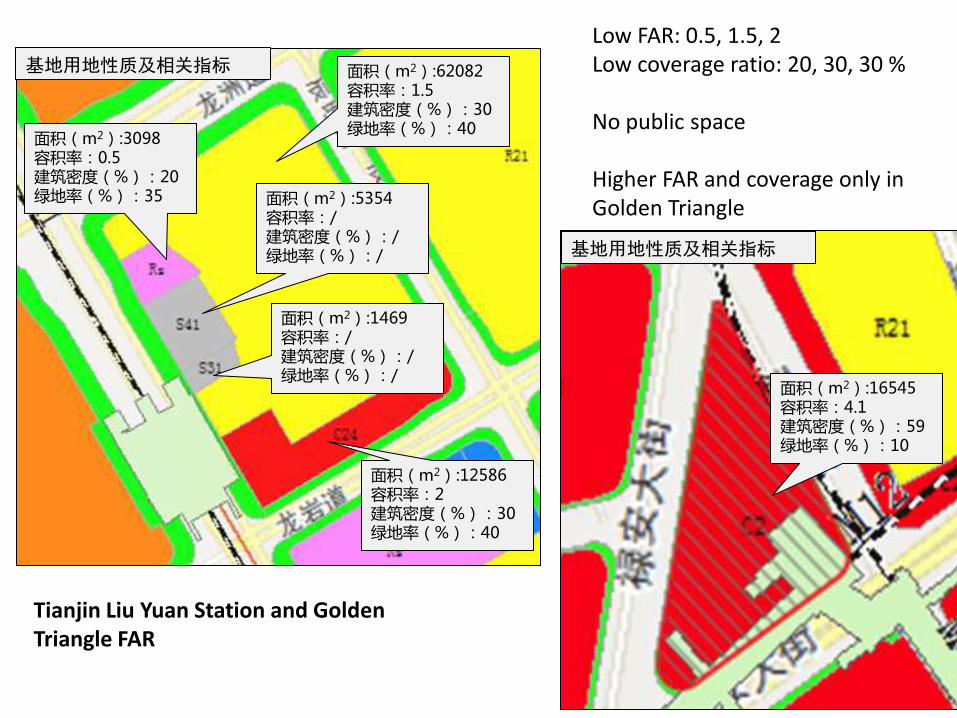
面积(m2):3098 容积率:0.5 建筑密度(%):20 绿地率(%):35
面积(m2):62082 容积率:1.5 建筑密度(%):30 绿地率(%):40
面积(m2):5354 容积率:/ 建筑密度(%):/ 绿地率(%):/
面积(m2):1469 容积率:/ 建筑密度(%):/ 绿地率(%):/
面积(m2):12586 容积率:2 建筑密度(%):30 绿地率(%):40
基地用地性质及相关指标
Low FAR: 0.5, 1.5, 2 Low coverage ratio: 20, 30, 30 % No public space Higher FAR and coverage only in Golden Triangle
面积(m2):16545 容积率:4.1 建筑密度(%):59 绿地率(%):10
基地用地性质及相关指标
Tianjin Liu Yuan Station and Golden Triangle FAR
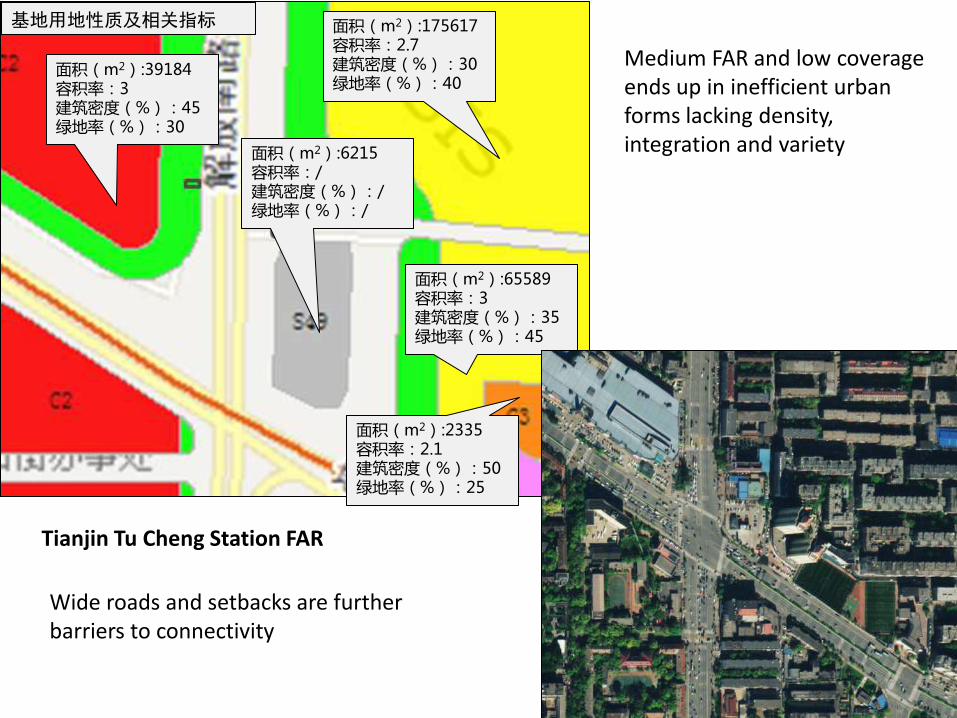
面积(m2):39184 容积率:3 建筑密度(%):45 绿地率(%):30
面积(m2):175617 容积率:2.7 建筑密度(%):30 绿地率(%):40
面积(m2):6215 容积率:/ 建筑密度(%):/ 绿地率(%):/
面积(m2):65589 容积率:3 建筑密度(%):35 绿地率(%):45
面积(m2):2335 容积率:2.1 建筑密度(%):50 绿地率(%):25
基地用地性质及相关指标
Medium FAR and low coverage ends up in inefficient urban forms lacking density, integration and variety
Wide roads and setbacks are further barriers to connectivity
Tianjin Tu Cheng Station FAR
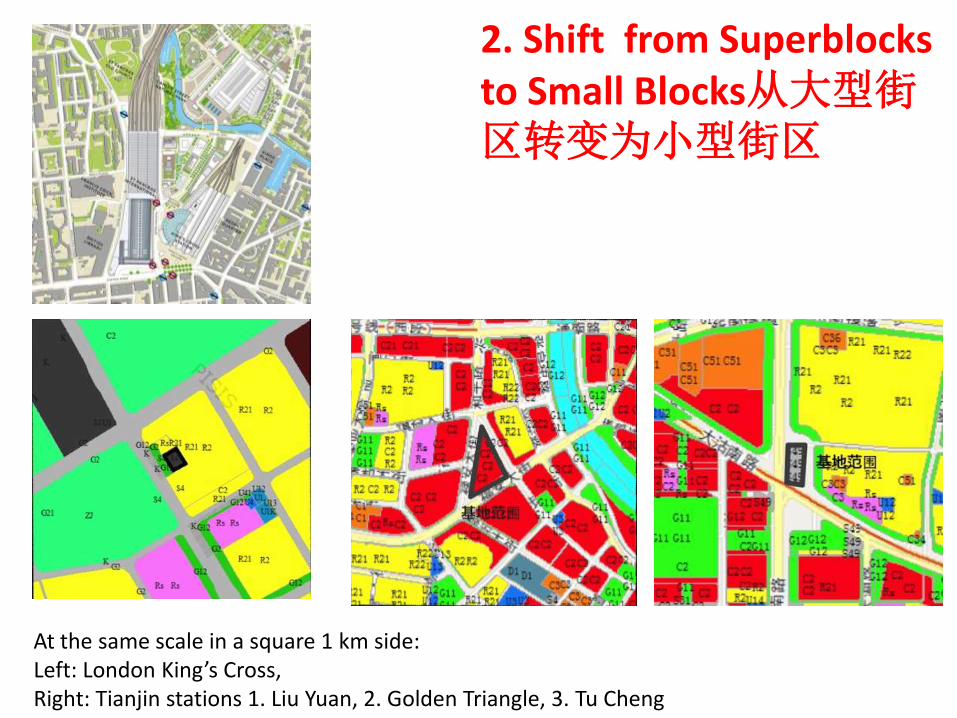
2. Shift from Superblocks to Small Blocks从大型街区转变为小型街区
At the same scale in a square 1 km side: Left: London King’s Cross, Right: Tianjin stations 1. Liu Yuan, 2. Golden Triangle, 3. Tu Cheng
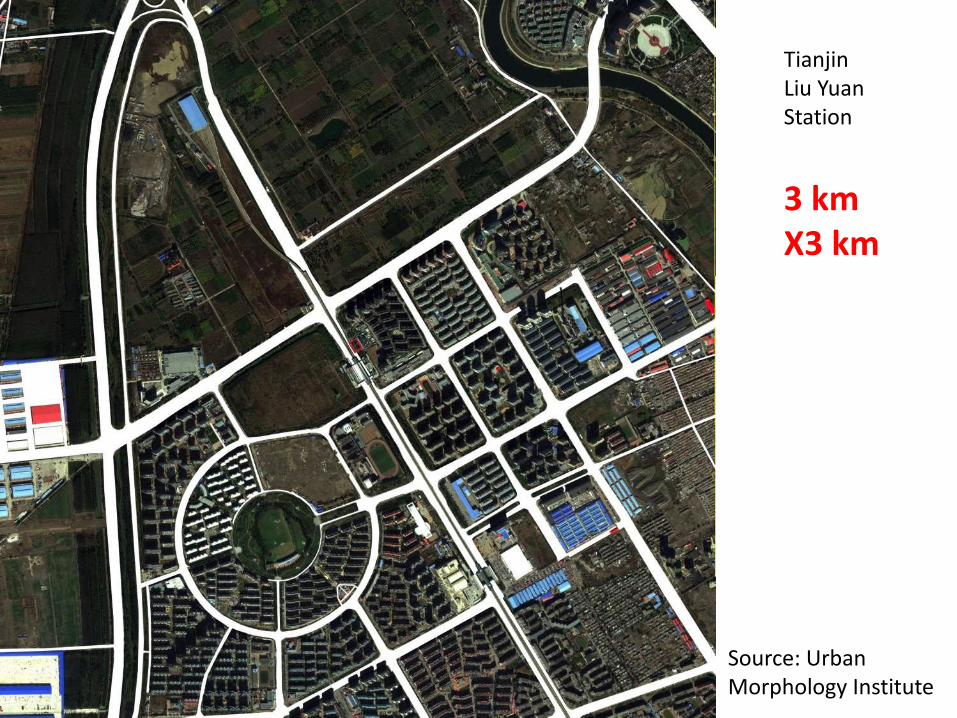
Tianjin Liu Yuan Station
3 km X3 km
Source: Urban Morphology Institute
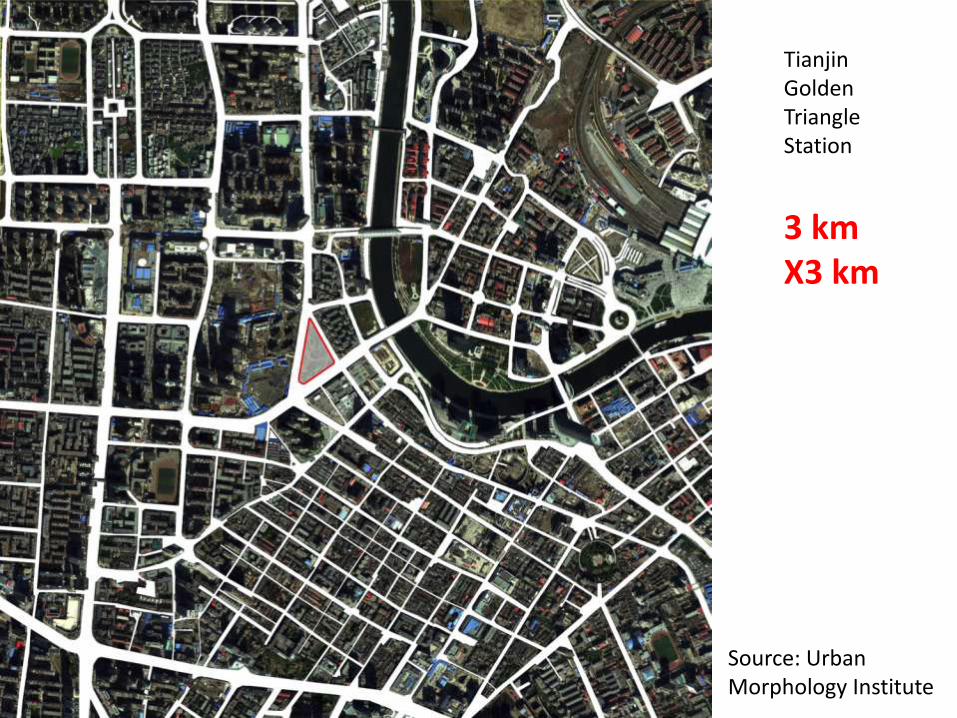
Tianjin Golden Triangle Station
3 km X3 km
Source: Urban Morphology Institute
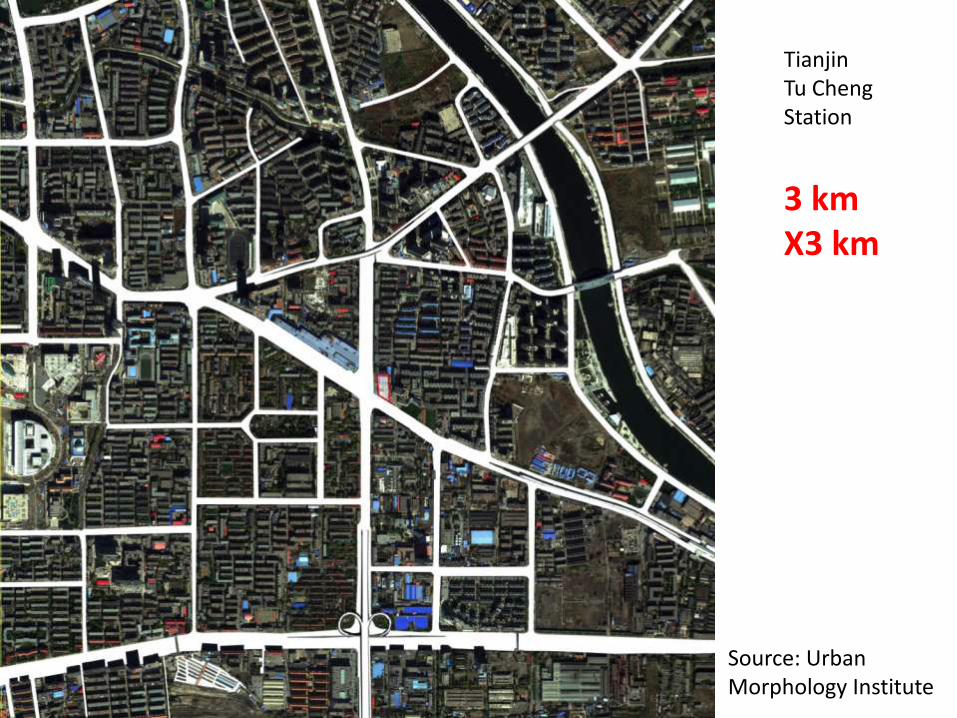
Tianjin Tu Cheng Station
3 km X3 km
Source: Urban Morphology Institute
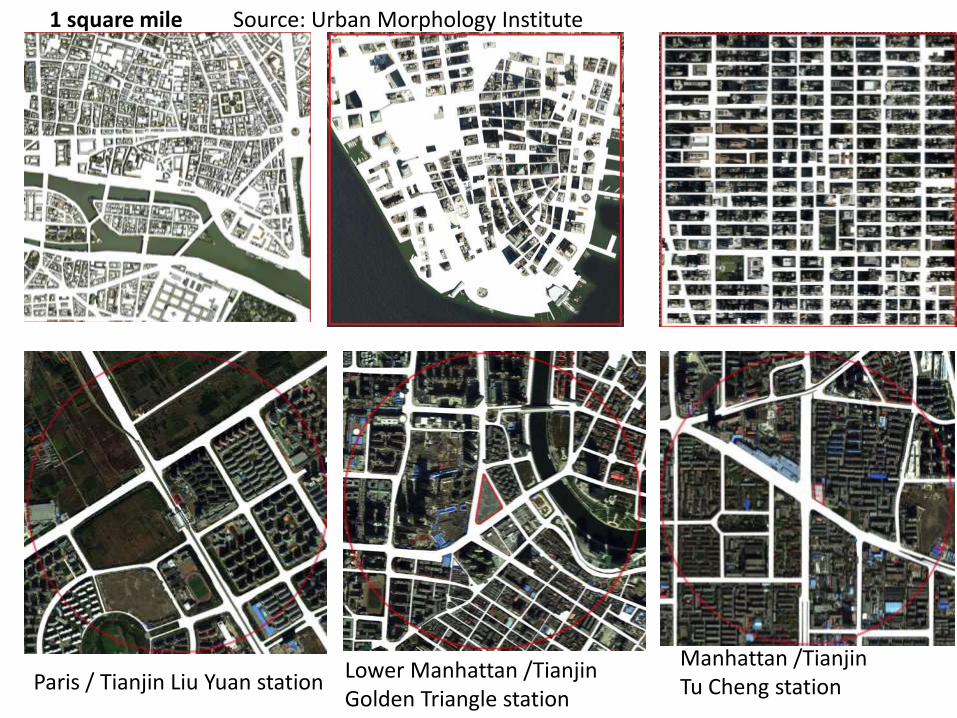
1 square mile
Paris / Tianjin Liu Yuan station Lower Manhattan /Tianjin Golden Triangle station
Manhattan /Tianjin Tu Cheng station
Source: Urban Morphology Institute
800 m x 800 m
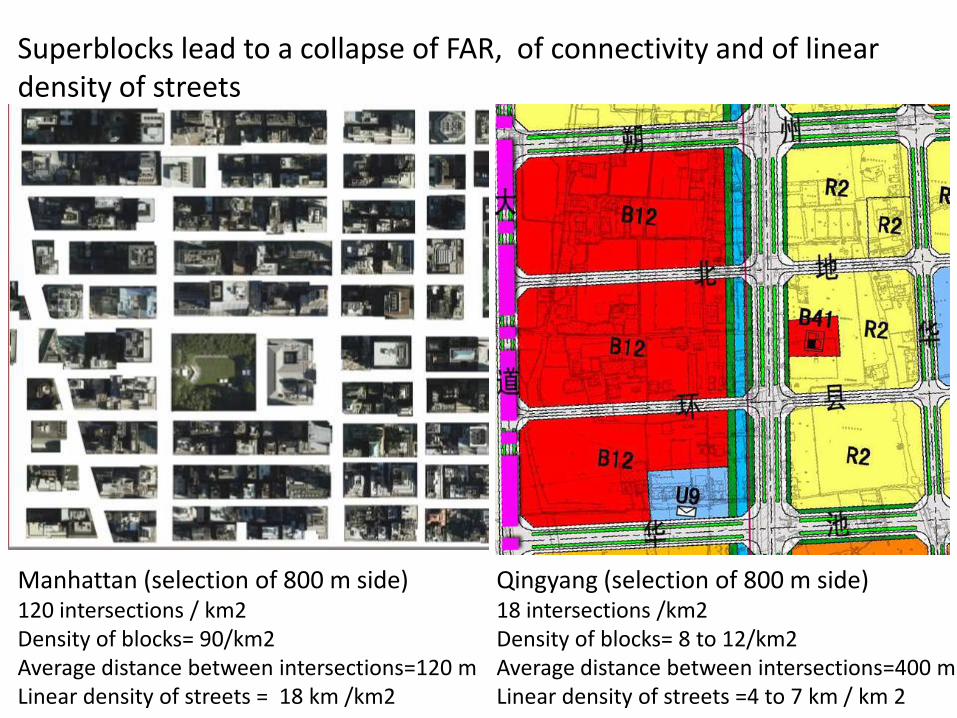
Manhattan (selection of 800 m side) 120 intersections / km2 Density of blocks= 90/km2 Average distance between intersections=120 m Linear density of streets = 18 km /km2
Qingyang (selection of 800 m side) 18 intersections /km2 Density of blocks= 8 to 12/km2 Average distance between intersections=400 m Linear density of streets =4 to 7 km / km 2
Superblocks lead to a collapse of FAR, of connectivity and of linear density of streets
基地范围
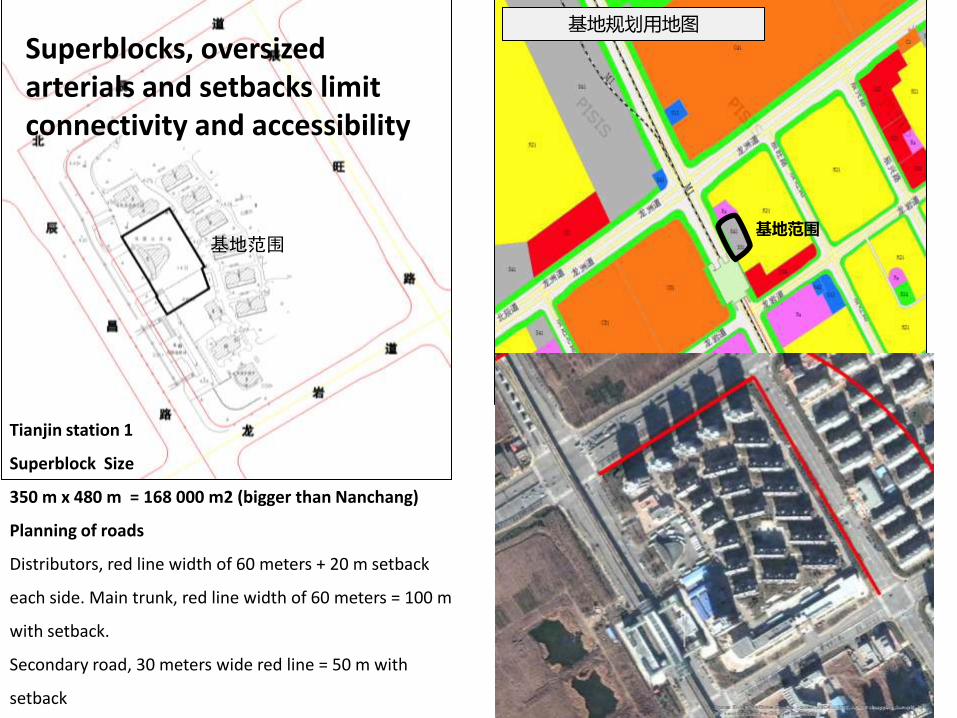
Tianjin station 1
Superblock Size
350 m x 480 m = 168 000 m2 (bigger than Nanchang)
Planning of roads
Distributors, red line width of 60 meters + 20 m setback
each side. Main trunk, red line width of 60 meters = 100 m
with setback.
Secondary road, 30 meters wide red line = 50 m with
setback
基地范围
基地规划用地图
Superblocks, oversized arterials and setbacks limit connectivity and accessibility
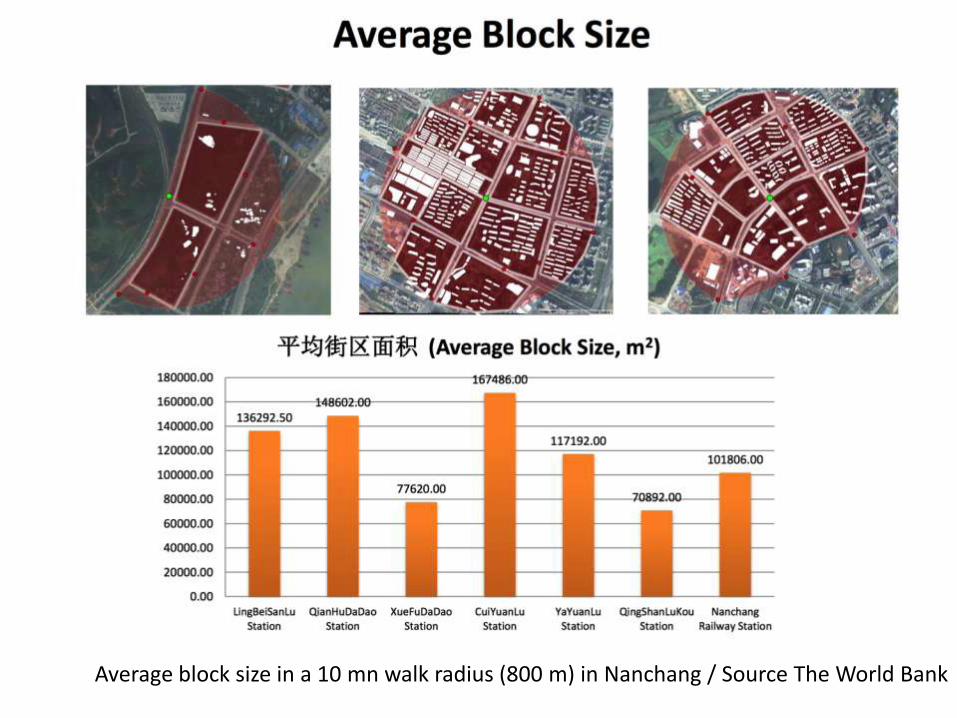
Average block size in a 10 mn walk radius (800 m) in Nanchang / Source The World Bank
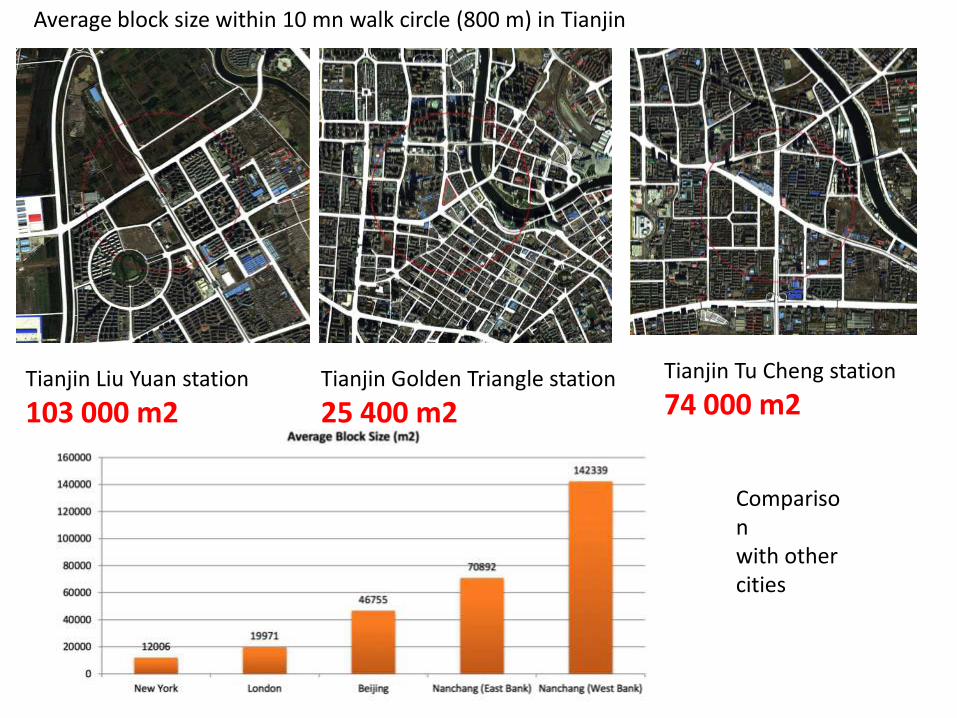
Comparison with other cities
Tianjin Liu Yuan station
103 000 m2
Tianjin Golden Triangle station
25 400 m2
Tianjin Tu Cheng station
74 000 m2
Average block size within 10 mn walk circle (800 m) in Tianjin
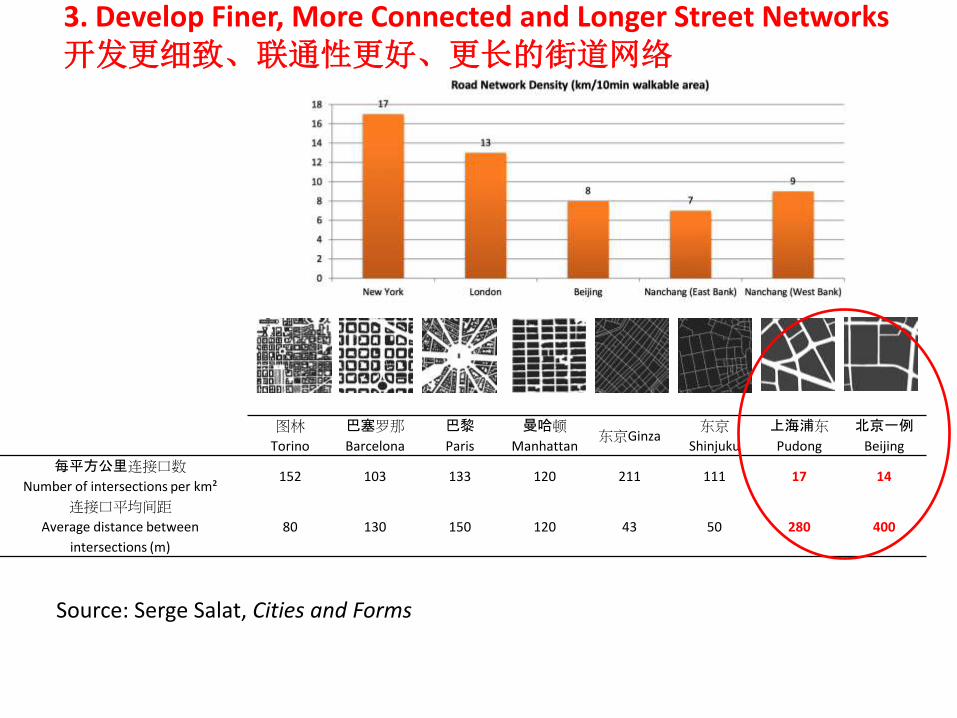
3. Develop Finer, More Connected and Longer Street Networks开发更细致、联通性更好、更长的街道网络
图林
Torino
巴塞罗那
Barcelona
巴黎
Paris
曼哈顿
Manhattan 东京Ginza
东京
Shinjuku
上海浦东
Pudong
北京一例
Beijing
每平方公里连接口数
Number of intersections per km² 152 103 133 120 211 111 17 14
连接口平均间距
Average distance between
intersections (m)
80 130 150 120 43 50 280 400
Source: Serge Salat, Cities and Forms
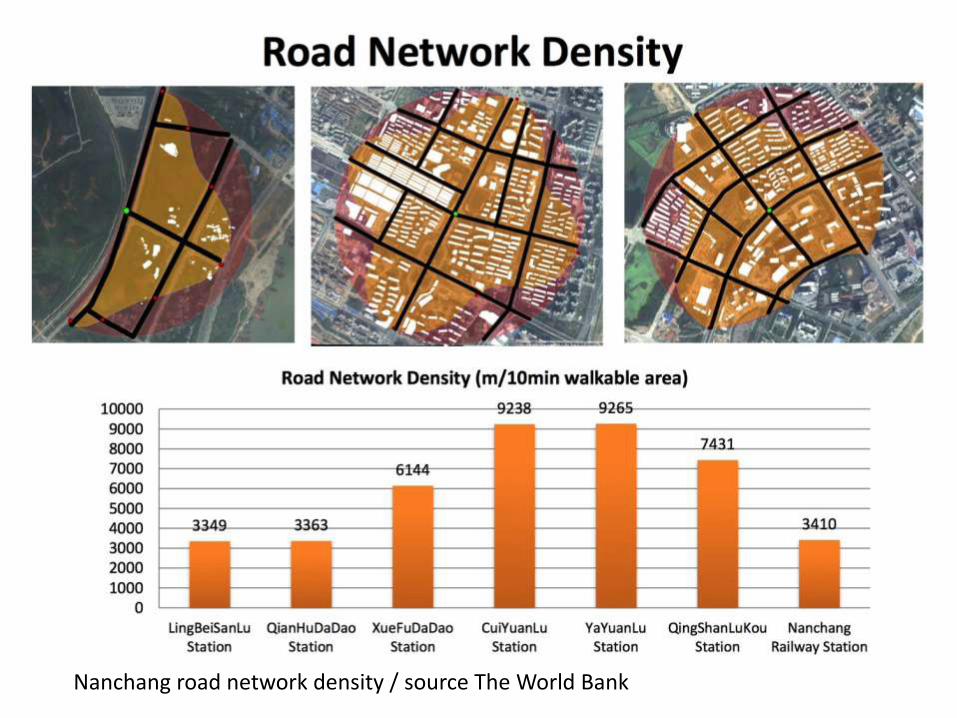
Nanchang road network density / source The World Bank
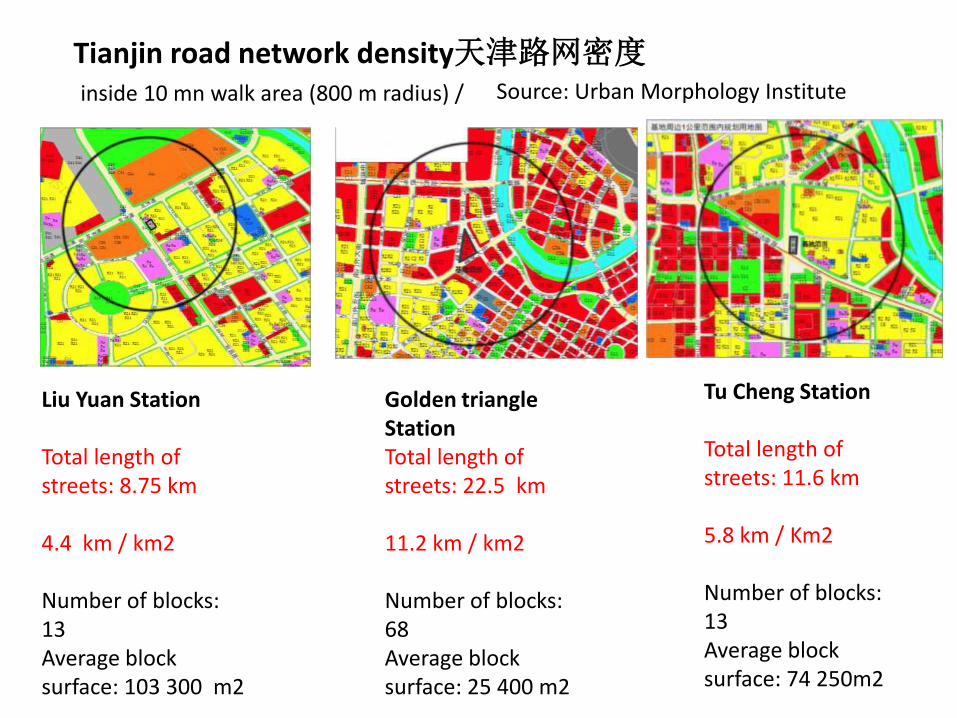
Tianjin road network density天津路网密度 inside 10 mn walk area (800 m radius) /
Liu Yuan Station Total length of streets: 8.75 km 4.4 km / km2 Number of blocks: 13 Average block surface: 103 300 m2
Golden triangle Station Total length of streets: 22.5 km 11.2 km / km2 Number of blocks: 68 Average block surface: 25 400 m2
Tu Cheng Station Total length of streets: 11.6 km 5.8 km / Km2 Number of blocks: 13 Average block surface: 74 250m2
Source: Urban Morphology Institute
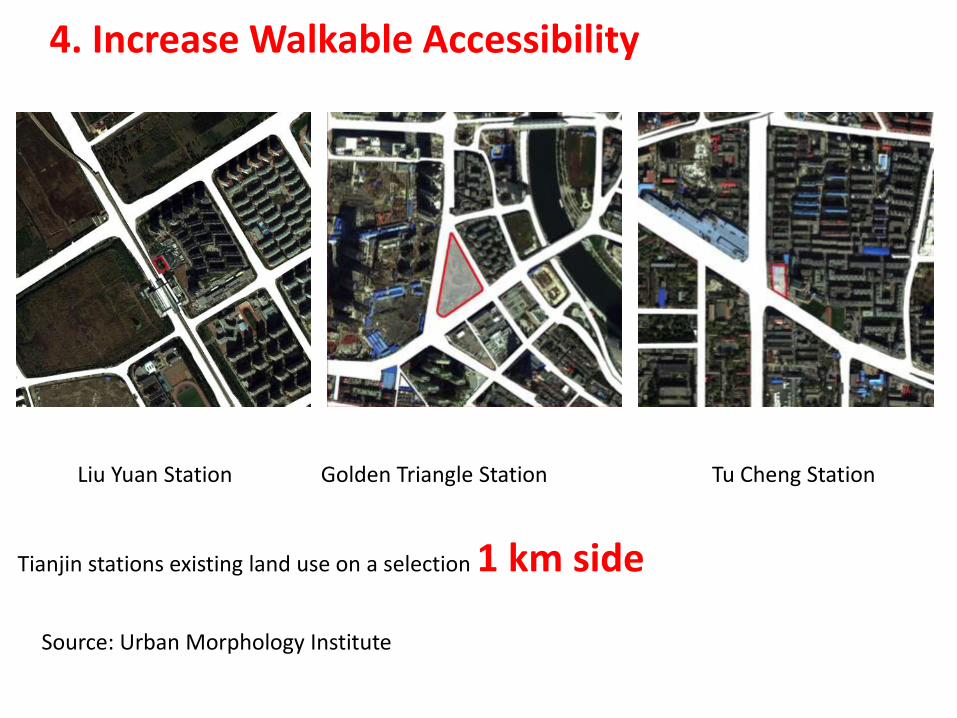
Tianjin stations existing land use on a selection 1 km side
4. Increase Walkable Accessibility
Golden Triangle Station Liu Yuan Station Tu Cheng Station
Source: Urban Morphology Institute
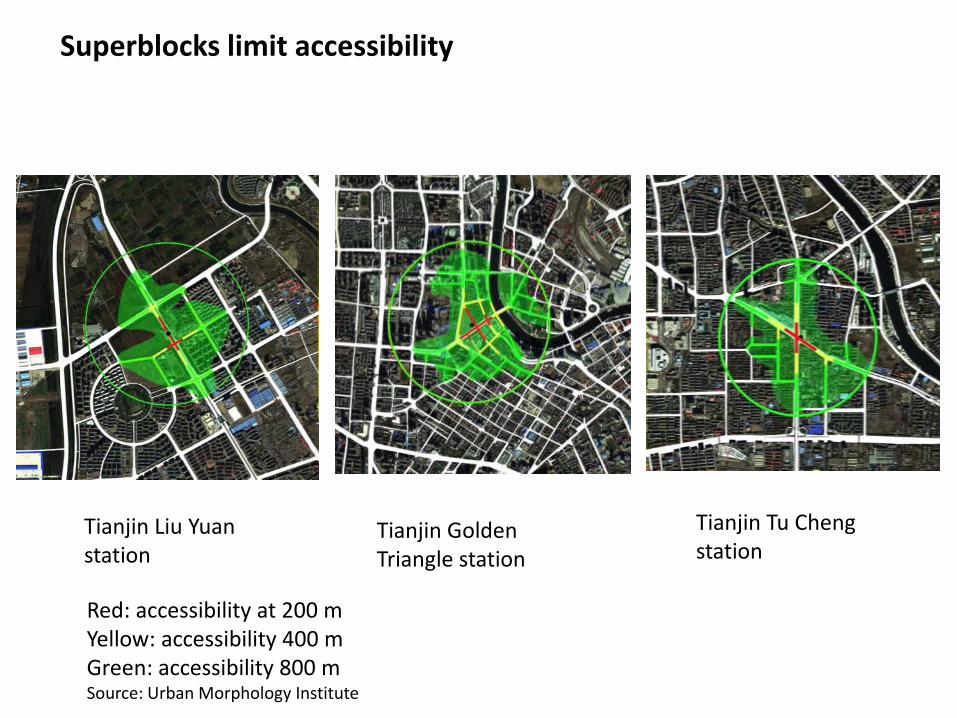
Superblocks limit accessibility
Red: accessibility at 200 m Yellow: accessibility 400 m Green: accessibility 800 m Source: Urban Morphology Institute
Tianjin Liu Yuan station
Tianjin Golden Triangle station
Tianjin Tu Cheng station
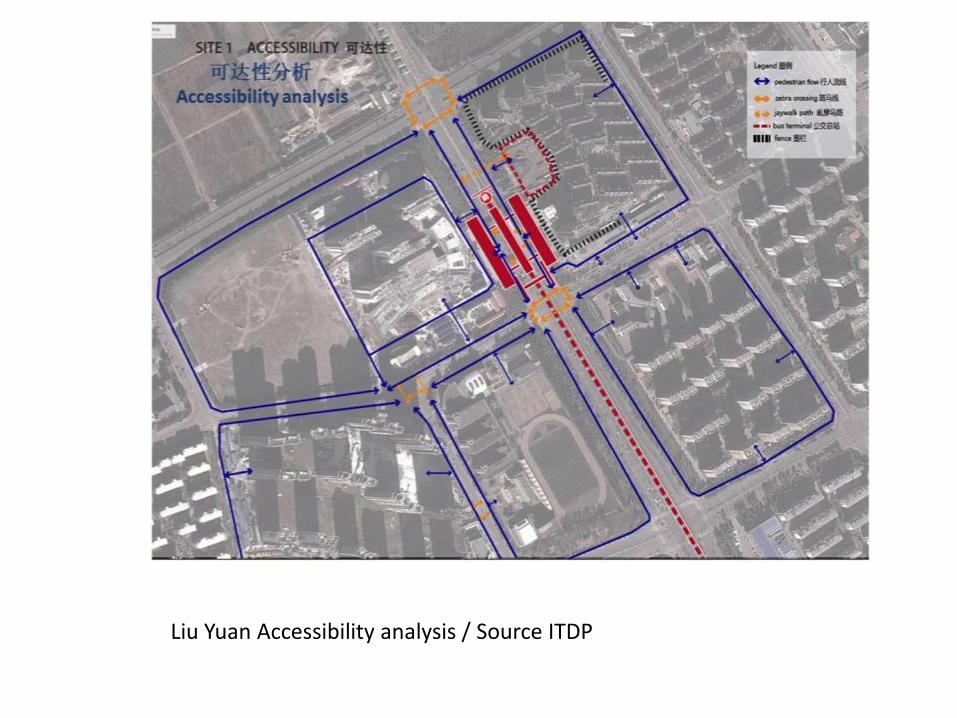
Liu Yuan Accessibility analysis / Source ITDP
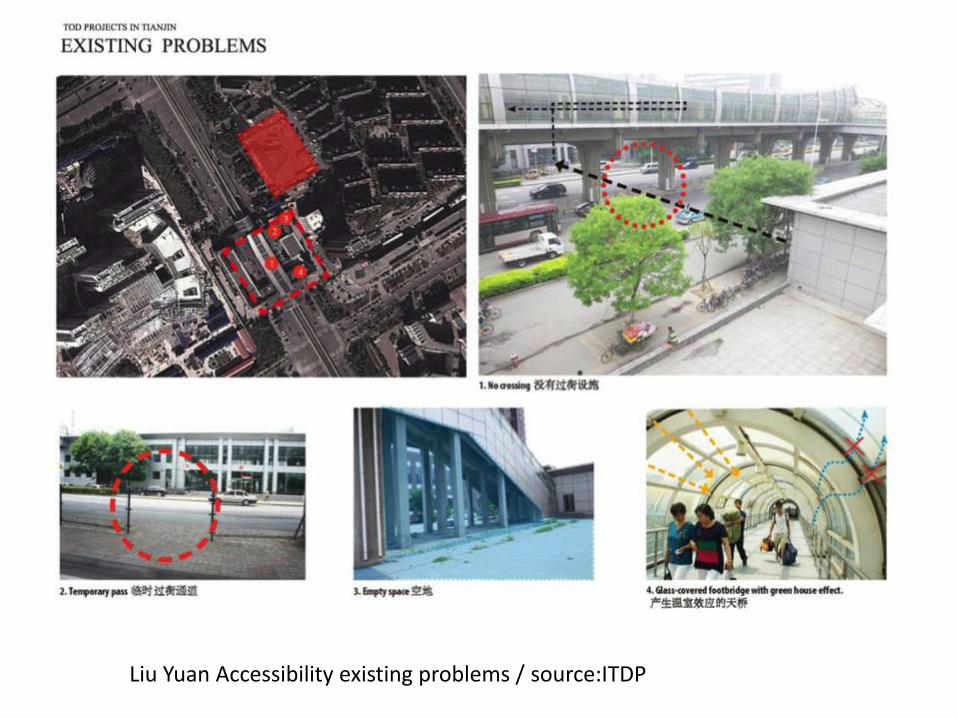
Liu Yuan Accessibility existing problems / source:ITDP
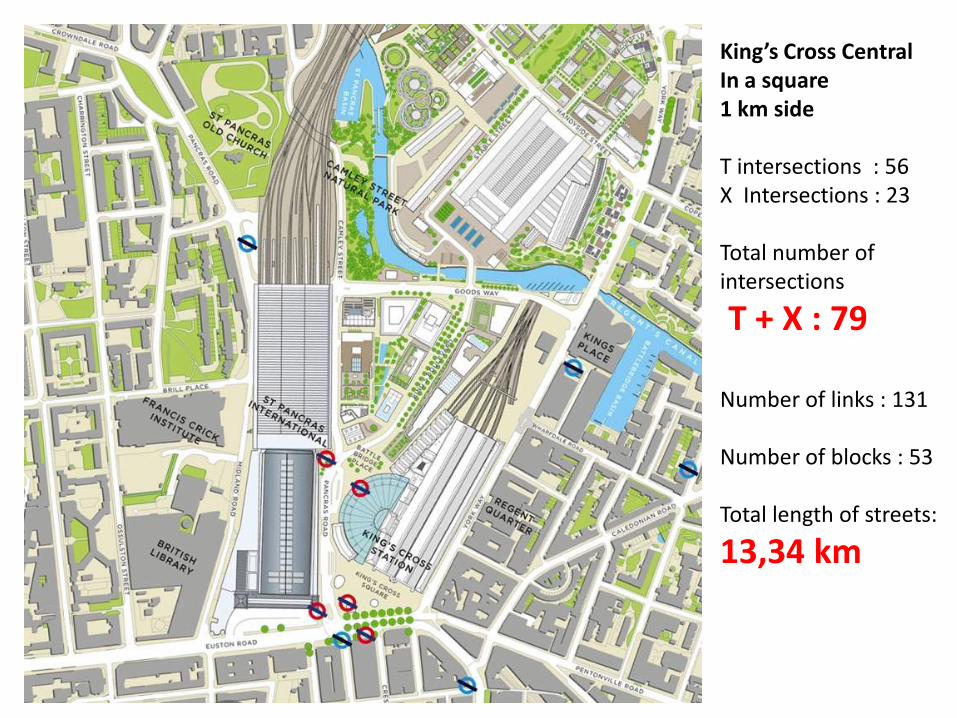
King’s Cross Central In a square 1 km side T intersections : 56 X Intersections : 23 Total number of intersections
T + X : 79 Number of links : 131 Number of blocks : 53 Total length of streets:
13,34 km
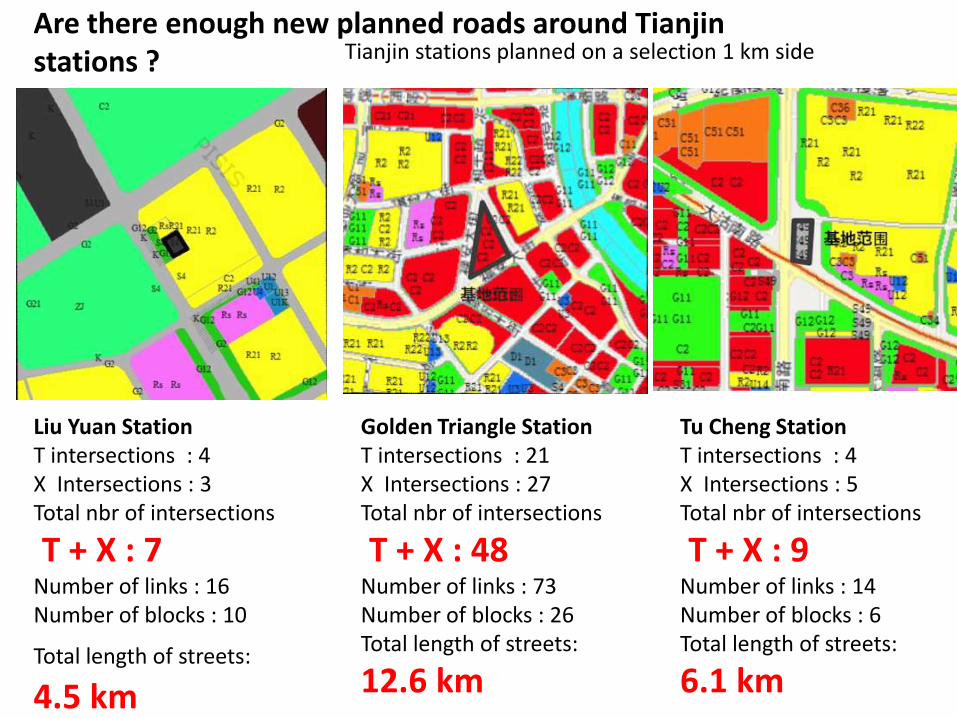
Tianjin stations planned on a selection 1 km side Are there enough new planned roads around Tianjin stations ?
Liu Yuan Station T intersections : 4 X Intersections : 3 Total nbr of intersections
T + X : 7 Number of links : 16 Number of blocks : 10
Total length of streets: 4.5 km
Golden Triangle Station T intersections : 21 X Intersections : 27 Total nbr of intersections
T + X : 48 Number of links : 73 Number of blocks : 26 Total length of streets:
12.6 km
Tu Cheng Station T intersections : 4 X Intersections : 5 Total nbr of intersections
T + X : 9 Number of links : 14 Number of blocks : 6 Total length of streets:
6.1 km
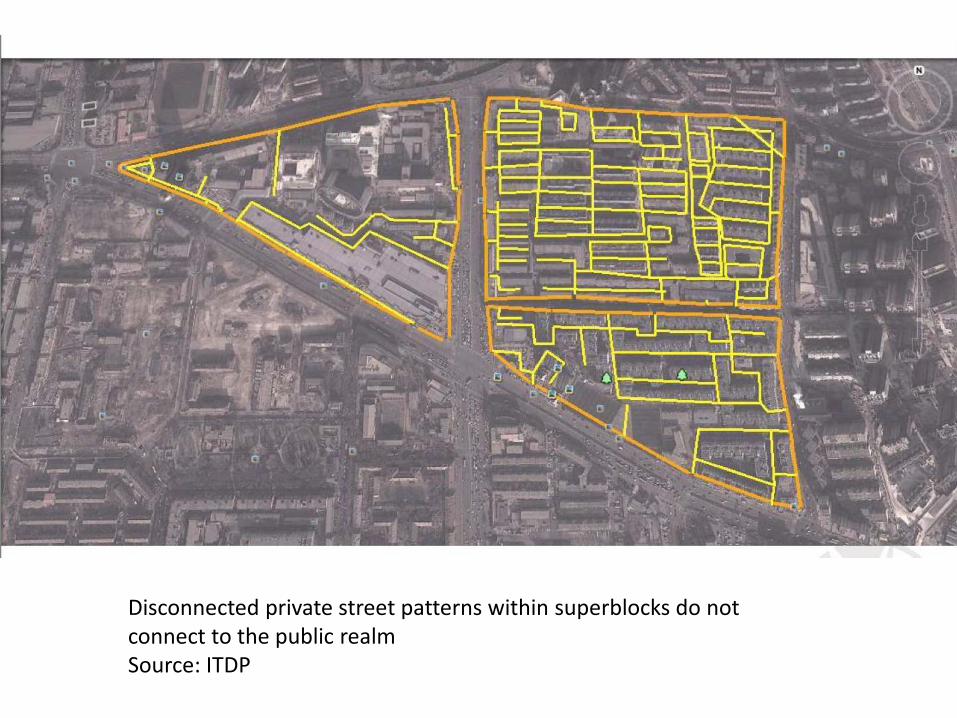
Disconnected private street patterns within superblocks do not connect to the public realm Source: ITDP
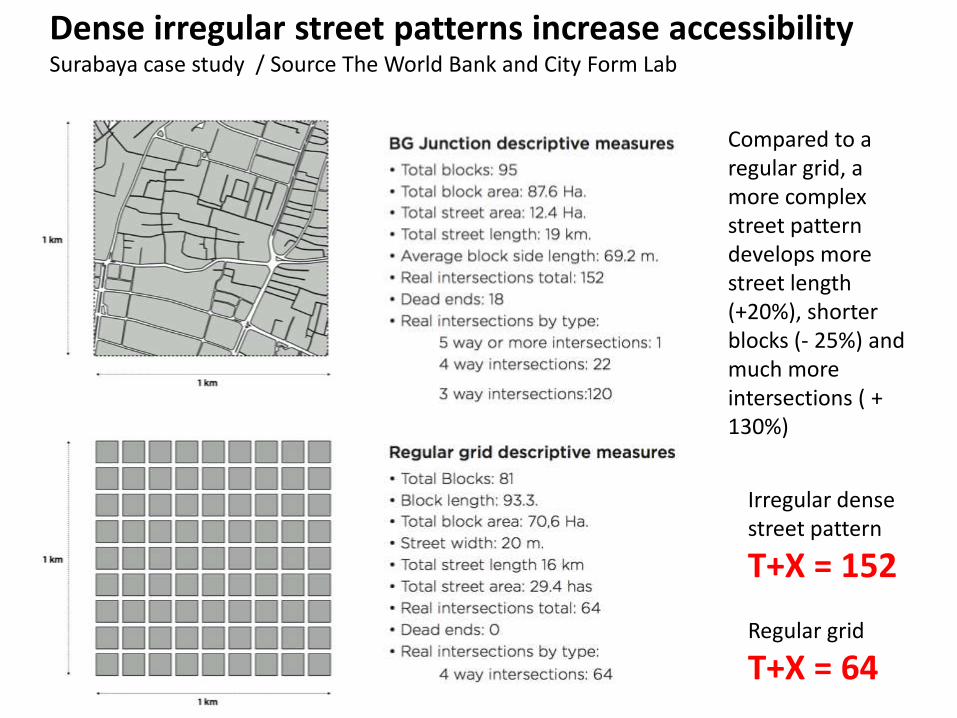
Dense irregular street patterns increase accessibility Surabaya case study / Source The World Bank and City Form Lab
Compared to a regular grid, a more complex street pattern develops more street length (+20%), shorter blocks (- 25%) and much more intersections ( + 130%)
Irregular dense street pattern
T+X = 152 Regular grid
T+X = 64
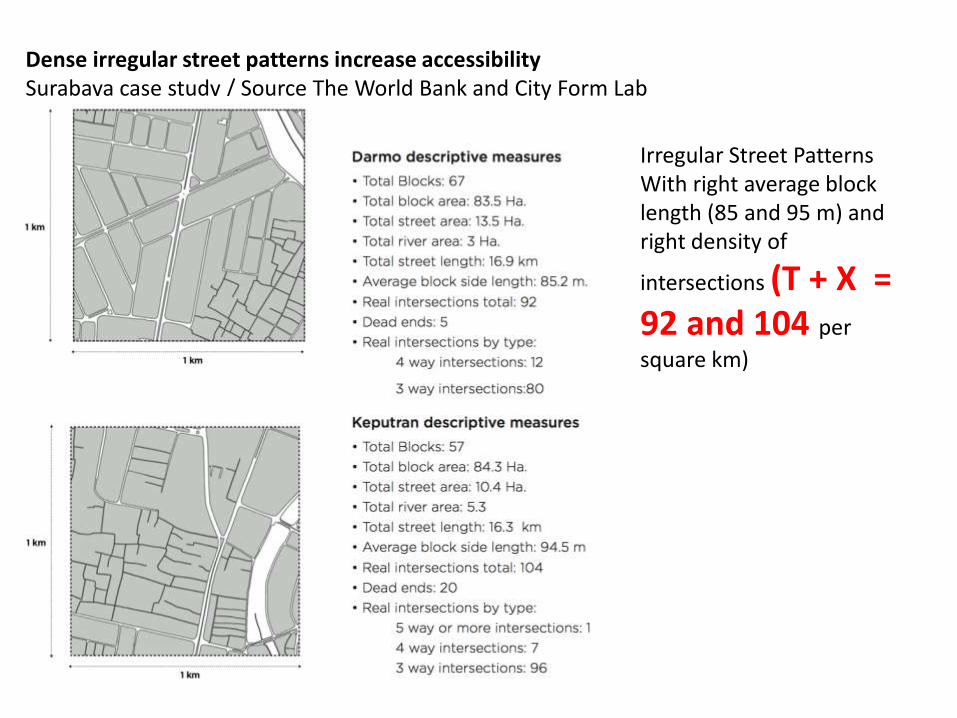
Dense irregular street patterns increase accessibility Surabaya case study / Source The World Bank and City Form Lab
Irregular Street Patterns With right average block length (85 and 95 m) and right density of
intersections (T + X = 92 and 104 per
square km)
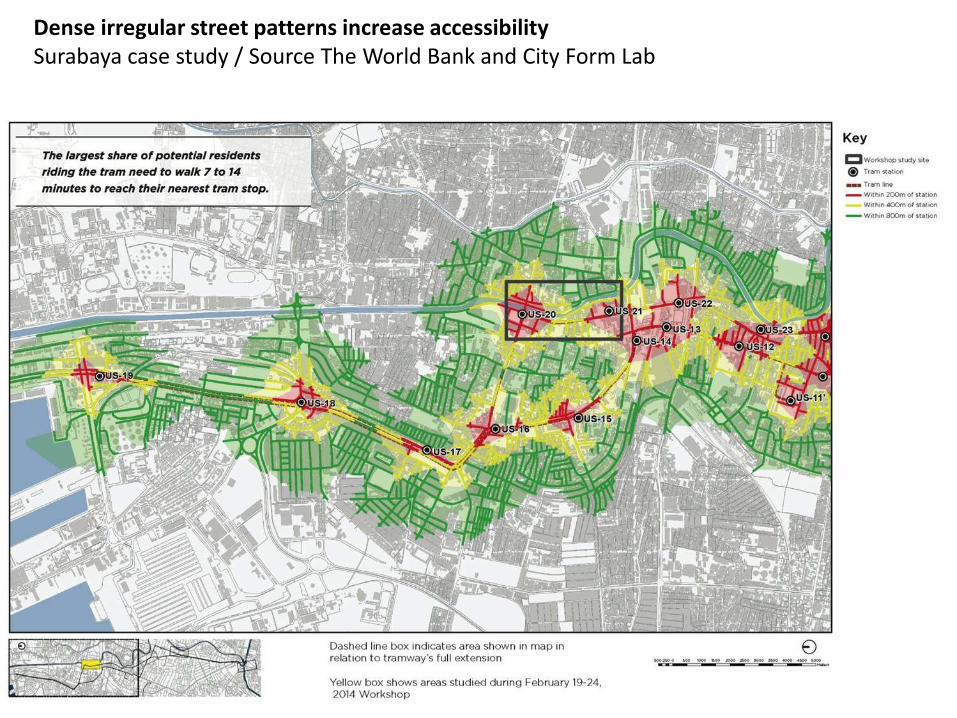
Dense irregular street patterns increase accessibility Surabaya case study / Source The World Bank and City Form Lab
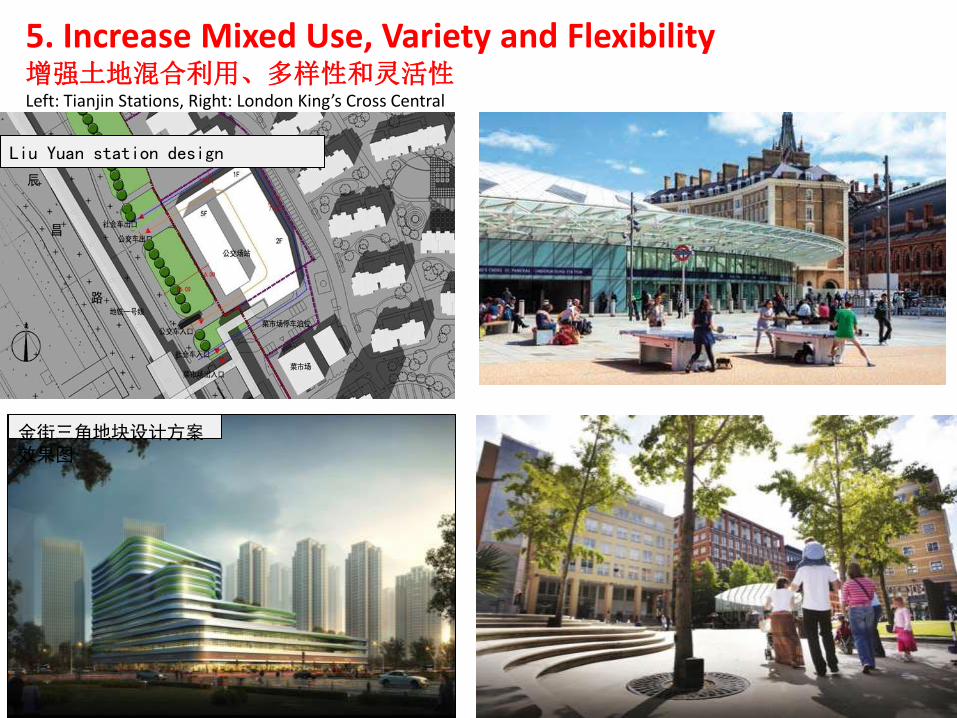
Liu Yuan station design
金街三角地块设计方案效果图
5. Increase Mixed Use, Variety and Flexibility 增强土地混合利用、多样性和灵活性 Left: Tianjin Stations, Right: London King’s Cross Central
6.Develop Integrated Synergized Energy Planning
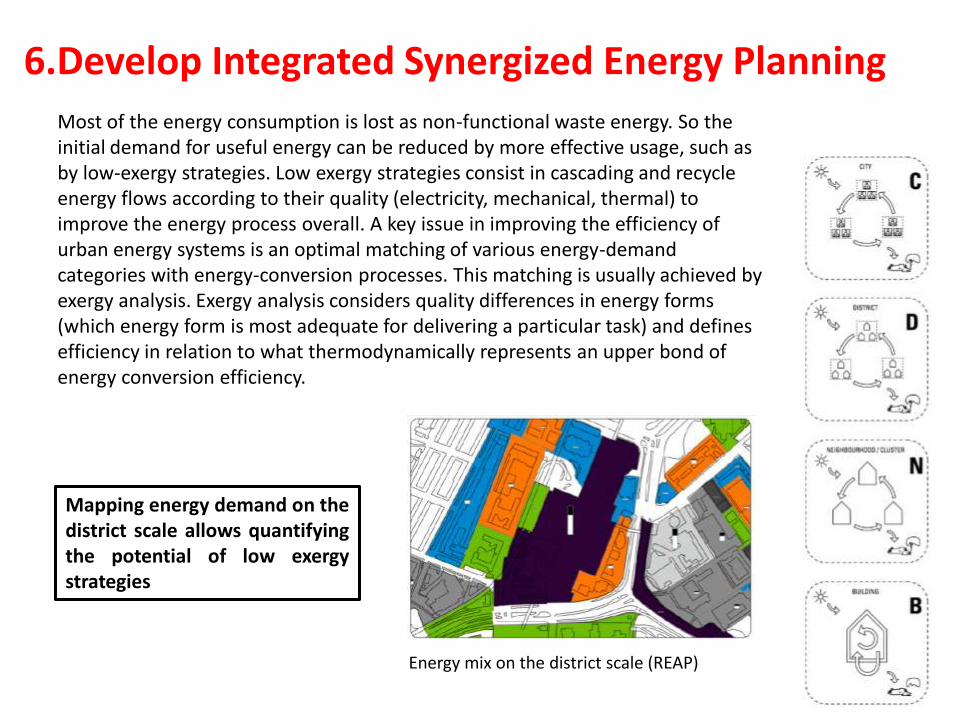
Most of the energy consumption is lost as non-functional waste energy. So the initial demand for useful energy can be reduced by more effective usage, such as by low-exergy strategies. Low exergy strategies consist in cascading and recycle energy flows according to their quality (electricity, mechanical, thermal) to improve the energy process overall. A key issue in improving the efficiency of urban energy systems is an optimal matching of various energy-demand categories with energy-conversion processes. This matching is usually achieved by exergy analysis. Exergy analysis considers quality differences in energy forms (which energy form is most adequate for delivering a particular task) and defines efficiency in relation to what thermodynamically represents an upper bond of energy conversion efficiency.
Energy mix on the district scale (REAP)
Mapping energy demand on the district scale allows quantifying the potential of low exergy strategies
6.Develop Integrated Synergized Energy Planning
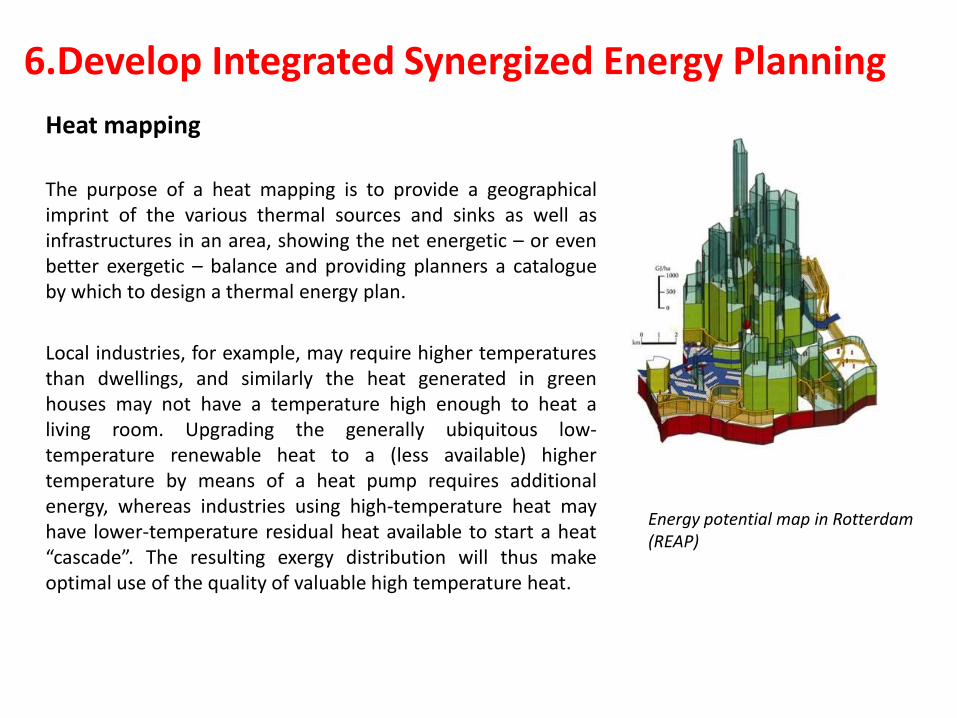
Heat mapping
The purpose of a heat mapping is to provide a geographical imprint of the various thermal sources and sinks as well as infrastructures in an area, showing the net energetic – or even better exergetic – balance and providing planners a catalogue by which to design a thermal energy plan.
Local industries, for example, may require higher temperatures than dwellings, and similarly the heat generated in green houses may not have a temperature high enough to heat a living room. Upgrading the generally ubiquitous low-temperature renewable heat to a (less available) higher temperature by means of a heat pump requires additional energy, whereas industries using high-temperature heat may have lower-temperature residual heat available to start a heat “cascade”. The resulting exergy distribution will thus make optimal use of the quality of valuable high temperature heat.
Energy potential map in Rotterdam (REAP)
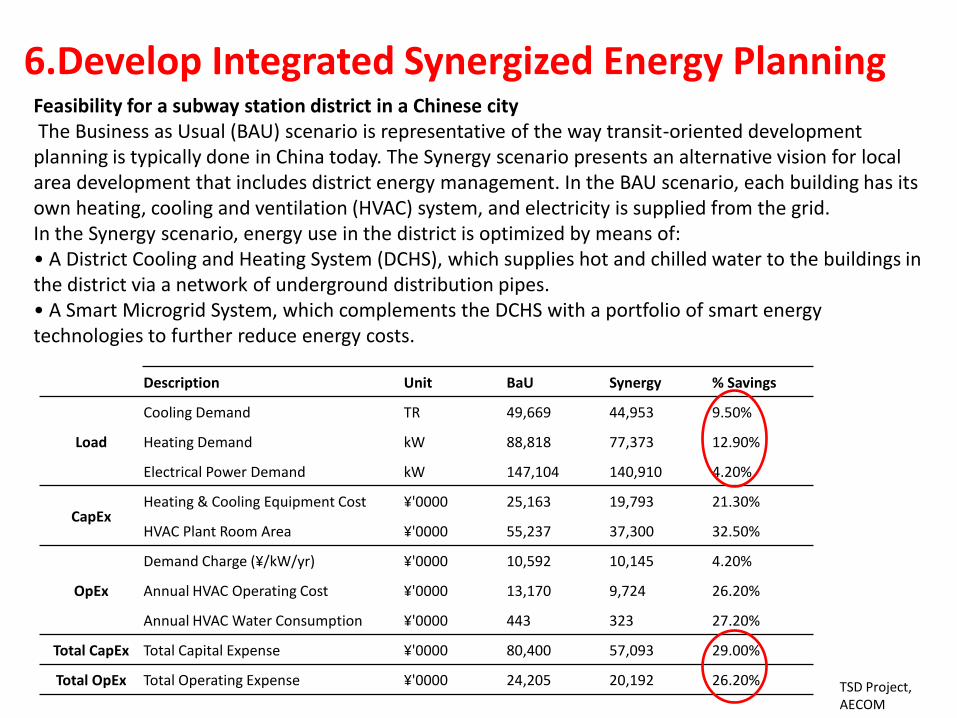
6.Develop Integrated Synergized Energy Planning Feasibility for a subway station district in a Chinese city The Business as Usual (BAU) scenario is representative of the way transit-oriented development planning is typically done in China today. The Synergy scenario presents an alternative vision for local area development that includes district energy management. In the BAU scenario, each building has its own heating, cooling and ventilation (HVAC) system, and electricity is supplied from the grid. In the Synergy scenario, energy use in the district is optimized by means of: • A District Cooling and Heating System (DCHS), which supplies hot and chilled water to the buildings in the district via a network of underground distribution pipes. • A Smart Microgrid System, which complements the DCHS with a portfolio of smart energy technologies to further reduce energy costs.
Description Unit BaU Synergy % Savings
Load
Cooling Demand TR 49,669 44,953 9.50%
Heating Demand kW 88,818 77,373 12.90%
Electrical Power Demand kW 147,104 140,910 4.20%
CapEx Heating & Cooling Equipment Cost ¥'0000 25,163 19,793 21.30%
HVAC Plant Room Area ¥'0000 55,237 37,300 32.50%
OpEx
Demand Charge (¥/kW/yr) ¥'0000 10,592 10,145 4.20%
Annual HVAC Operating Cost ¥'0000 13,170 9,724 26.20%
Annual HVAC Water Consumption ¥'0000 443 323 27.20%
Total CapEx Total Capital Expense ¥'0000 80,400 57,093 29.00%
Total OpEx Total Operating Expense ¥'0000 24,205 20,192 26.20% TSD Project, AECOM
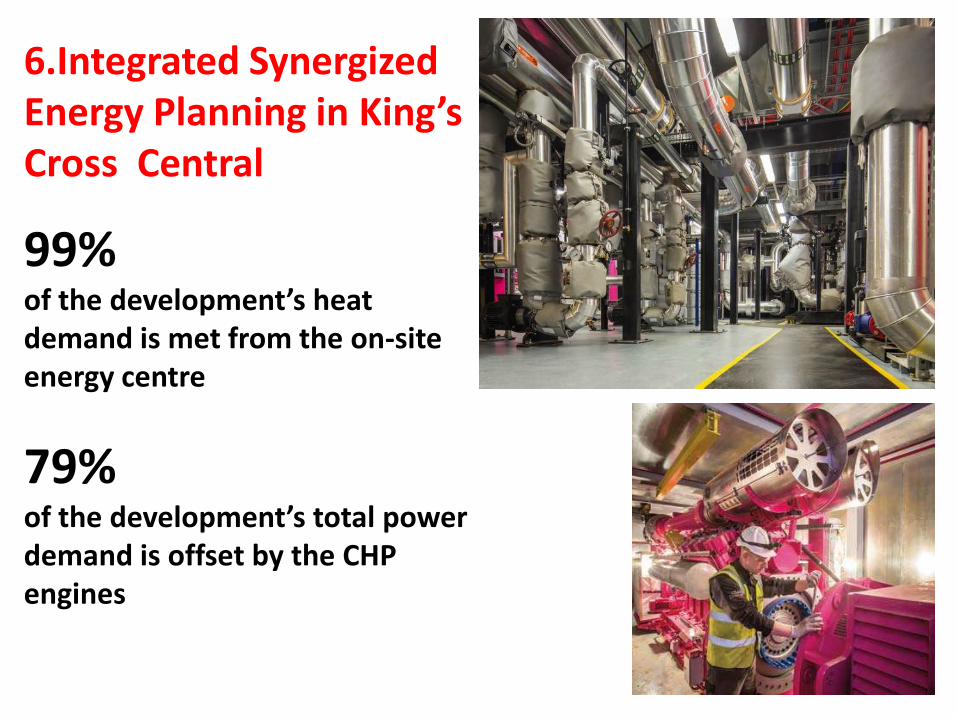
6.Integrated Synergized Energy Planning in King’s Cross Central
99% of the development’s heat demand is met from the on-site energy centre
79% of the development’s total power demand is offset by the CHP engines
基地范围
Thank you for your attention
感謝諸位的時間
The World Bank seminar on TOD, Tianjin, June 2014

![NeurIPS 2019 Yuan Liu, Zehong Shen, Zhixuan Lin, Sida Peng ... · [2] Zhenhua Wang, et al. Affine subspace representation for feature description. In ECCV,2014. [3] Tsun-Yi Yang,](https://img.pdfslide.tips/doc/110x75/5f487887584d1133366c3fe9/neurips-2019-yuan-liu-zehong-shen-zhixuan-lin-sida-peng-2-zhenhua-wang.jpg)