Embed Size (px)
Citation preview

T R I A L C O U R T B U D G E T A D V I S O R Y C O M M I T T E E
M A T E R I A L S F O R A U G U S T 5 , 2 0 2 1V I R T U A L M E E T I N G
Meeting Contents
Agenda …………………………………………………………………………………………………... 1
Minutes
Draft Minutes from the May 6, 2021 Meeting ……………………………..……………………… 4
Draft Minutes from the May 24, 2021 Action by Email Between Meeting…………….…… 8
Discussion and Possible Action Items
Item 1 – $60 Million One-Time COVID-Driven Caseload Backlog Funding (Action Required) ... 9
Attachment 1A – $60 Million COVID-Driven Caseload Backlog Funding …………..…… 12
Item 2 – $140 Million Pretrial Funding (Action Required) ....……………………………………….. 14
Attachment 2A – One-Time Allocation for Non-Pretrial Pilot Program Courts ……..…… 16
Attachment 2B – Ongoing Pretrial Release Allocations for All Courts ……………..…… 18
Attachment 2C – Recommended 2021-22 Pretrial Release Allocations……………..…… 20
Item 3 – $4.45 Million AB 1058 Reimbursement Authority Increase (Action Required) …........... 22
Attachment 3A1 – Child Support Commissioner Additional Funding Allocation – Option 1…............................................................................................... 28
Attachment 3A2 – Child Support Commissioner Additional Funding Allocation – Option 2…............................................................................................... 29
Attachment 3B1 – Family Law Facilitator Additional Funding Allocation – Option 1 30
Attachment 3B2 – Family Law Facilitator Additional Funding Allocation – Option 2….............................................................................................. 31
Item 4 – Annual Funding Methodology Subcommittee Work Plan Update (Action Required) …. 32
Attachment 4A – FMS Work Plan, Updated on July 16, 2020……………………………. 33
Attachment 4B – FMS Work Plan, Proposed Recommendations as of August 5, 2021………………………………………………………………………………. 34

Information Only Items (No Action Required)
Info 2 – Trial Court Executive Summary Display ………………………………...………………….. 35
Attachment 2A – 2021-22 Allocation Summary for Alameda (large court) .................. 37
Attachment 2B – 2021-22 Allocation Summary for Monterey (medium court) ............ 38
Attachment 2C – 2021-22 Allocation Summary for Yuba (small court) ........................ 39
Info 3 – Trial Court Trust Fund Funds Held on Behalf Expenditure Reporting .………………….. 40
Attachment 3A – Summary of Recommended Process, Criteria, and Required Information for Trial Court Trust Fund Fund Balance Held on Behalf of the Courts.................................................................................................
42
Attachment 3B – Funds Held on Behalf of the Court Project Completion Reporting................................................................................................ 46

T R I A L C O U R T B U D G E T A D V I S O R Y C O M M I T T E E
N O T I C E A N D A G E N D A O F O P E N M E E T I N G
Open to the Public (Cal. Rules of Court, rule 10.75(c)(1) and (e)(1)) THIS MEETING IS BEING CONDUCTED BY ELECTRONIC MEANS
THIS MEETING IS BEING RECORDED
Date: August 5, 2021 Time: 9:00 a.m. to 12:00 p.m.
Public Call-in Number: https://jcc.granicus.com/player/event/1351
Meeting materials will be posted on the advisory body web page on the California Courts website at least three business days before the meeting.
Members of the public seeking to make an audio recording of the meeting must submit a written request at least two business days before the meeting. Requests can be e-mailed to [email protected].
Agenda items are numbered for identification purposes only and will not necessarily be considered in the indicated order.
I . O P E N M E E T I N G ( C A L . R U L E S O F C O U R T , R U L E 1 0 . 7 5 ( C ) ( 1 ) )
Call to Order and Roll Call
Approval of Minutes Approve minutes of the May 6, 2021 Trial Court Budget Advisory Committee (TCBAC) virtual meeting and the May 24, 2021 action by email between meetings.
I I . P U B L I C C O M M E N T ( C A L . R U L E S O F C O U R T , R U L E 1 0 . 7 5 ( K ) ( 1 ) )
This meeting will be conducted by electronic means with a listen only conference line available for the public. As such, the public may submit comments for this meeting only in writing. In accordance with California Rules of Court, rule 10.75(k)(1), written comments pertaining to any agenda item of a regularly noticed open meeting can be submitted up to one complete business day before the meeting. For this specific meeting, comments should be e-mailed to [email protected]. Only written comments received by 9:00 a.m. on August 4, 2021 will be provided to advisory body members prior to the start of the meeting.
www.courts.ca.gov/tcbac.htm [email protected]
Request for ADA accommodations should be made at least three business days before the meeting and directed to:
Page 1 of 48

M e e t i n g N o t i c e a n d A g e n d a A u g u s t 5 , 2 0 2 1
2 | P a g e T r i a l C o u r t B u d g e t A d v i s o r y C o m m i t t e e
I I I . D I S C U S S I O N A N D P O S S I B L E A C T I O N I T E M ( I T E M S 1 - 4 )
Item 1
$60 Million One-Time COVID-Driven Caseload Backlog Funding (Action Required) Consideration of the 2021-22 one-time allocations to address backlogs and workload delays resulting from the COVID-19 pandemic. Presenter(s)/Facilitator(s): Ms. Oksana Tuk, Senior Analyst, Judicial Council Budget
Services Ms. Leah Rose-Goodwin, Manager, Judicial Council Business
Management Services
Item 2
$140 Million Pretrial Funding (Action Required) Consideration of the 2021-22 one-time and ongoing allocations to courts to contract with probation departments or other county departments for the provision of pretrial monitoring and services. Presenter(s)/Facilitator(s): Ms. Deirdre Benedict, Supervising Analyst, Judicial Council
Criminal Justice Services
Item 3
$4.45 Million AB 1058 Reimbursement Authority Increase (Action Required) Consideration of a recommendation for utilizing increased reimbursement authority to cover the increased contract amount with the Department of Child Support Services to support the AB 1058 Child Support Commissioner and Family Law Facilitator Program. Presenter(s)/Facilitator(s): Mr. Don Will, Deputy Director, Judicial Council Center for
Families, Children & the Courts Ms. Anna Maves, Supervising Attorney, Judicial Council
Center for Families, Children & the Courts
Item 4
Annual Funding Methodology Subcommittee (FMS) Work Plan Update (Action Required) Consideration of an FMS recommendation to update items on the annual work plan. Presenter(s)/Facilitator(s): Mr. Catrayel Wood, Senior Analyst, Judicial Council Budget
Services
I V . I N F O R M A T I O N O N L Y I T E M S ( N O A C T I O N R E Q U I R E D )
Info 1
2021 Budget Act Discussion of the funding provided for trial courts in the 2021 Budget Act.
Presenter(s)/Facilitator(s): Ms. Fran Mueller, Deputy Director, Judicial Council Budget Services
Page 2 of 48
M e e t i n g N o t i c e a n d A g e n d a A u g u s t 5 , 2 0 2 1
3 | P a g e T r i a l C o u r t B u d g e t A d v i s o r y C o m m i t t e e
Info 2
Trial Court Executive Summary Display Review of the 2021-22 allocation summary for distribution to all 58 trial courts. Presenter(s)/Facilitator(s): Ms. Oksana Tuk, Senior Analyst, Judicial Council Budget
Services
Info 3
Trial Court Trust Fund Funds Held on Behalf Expenditure Reporting Quarterly report to the TCBAC on how funds were expended for projects and planned expenditures that are complete.
Presenter(s)/Facilitator(s): Mr. Catrayel Wood, Senior Analyst, Judicial Council Budget Services
V . A D J O U R N M E N T
Adjourn
Page 3 of 48

T R I A L C O U R T B U D G E T A D V I S O R Y C O M M I T T E E
M I N U T E S O F O P E N M E E T I N G
May 6, 2021 12:00 p.m. – 2:00 p.m.
http://jcc.granicus.com/player/event/1262?
Advisory Body Members Present:
Judges: Hon. Jonathan B. Conklin (Chair), Hon. Daniel J. Buckley, Hon. Kimberly Gaab, Hon. Joyce D. Hinrichs, Hon. Patricia L. Kelly, Hon. Charles Margines, Hon. Deborah A. Ryan, and Hon. B. Scott Thomsen.
Executive Officers: Ms. Rebecca Fleming (Vice Chair), Ms. Kim Bartleson, Ms. Sherri Carter, Ms. Nancy Eberhardt, Mr. Chad Finke, Mr. Chris Ruhl, Mr. Neal Taniguchi, Mr. Brian Taylor, Ms. Kim Turner, and Mr. David Yamasaki.
Advisory Body Members Absent:
Hon. Mark A. Cope, Hon. Jill C. Fannin, Mr. Shawn Landry, and Mr. Michael D. Planet.
Others Present: Mr. John Wordlaw, Ms. Fran Mueller, Mr. Zlatko Theodorovic, Ms. Brandy Olivera, Ms. Oksana Tuk, Mr. Catrayel Wood, and Hon. D. Zeke Ziedler.
O P E N M E E T I N G
Call to Order and Roll Call
The chair welcomed the members, called the meeting to order at 12:02 p.m., and took roll call.
Approval of Minutes The advisory body reviewed and approved minutes of the April 22, 2021 Trial Court Budget Advisory Committee (TCBAC) virtual meeting.
D I S C U S S I O N A N D A C T I O N I T E M S ( I T E M S 1 - 4 )
Item 1 - 2021-22 Court-Appointed Dependency Counsel Allocations (Action Required)
Consideration of the 2021-22 allocations from the Trial Court Trust Fund (TCTF) for court-appointed dependency counsel.
www.courts.ca.gov/tcbac.htm
Page 4 of 48

M e e t i n g M i n u t e s │ M a r c h 9 , 2 0 2 1
2 | P a g e T r i a l C o u r t B u d g e t A d v i s o r y C o m m i t t e e
Presenter(s)/Facilitator(s): Ms. Audrey Fancy, Principal Managing Attorney, Judicial Council Center for Families, Children & the Courts
Ms. Vida Terry, Senior Analyst, Judicial Council Center for Families, Children & the Courts
Action: TCBAC unanimously voted to approve the 2021-22 allocations for Court-Appointed Dependency Counsel funding in the amount of $156.7 million for consideration by the Judicial Council at its July 8-9, 2021 business meeting as outlined in the material attachment 1A.
Item 2 - Allocations from the TCTF and Trial Court Allocations for 2021-22 (Action Required)
Consideration of recommendations of the Revenue and Expenditure (R&E) Subcommittee regarding allocations from the TCTF for 2021-22, and consideration of 2021-22 trial court allocations, including the Workload Formula, from the TCTF, State Court Facilities Construction Fund (formerly the Immediate and Critical Needs Account pending trailer bill language), and General Fund.
Presenter(s)/Facilitator(s): Ms. Oksana Tuk, Senior Analyst, Judicial Council Budget Services
Action: TCBAC unanimously voted to approve the Funding Methodology Subcommittee allocation methodologies and R&E Subcommittee recommendations for the allocations below, with the assumption that the funding proposed in the 2021-22 Governor’s Budget will remain in the final 2021 Budget Act:
• Base, discretionary, and non-discretionary programs from the TCTF in the amount of $2.378 billion, including:
o State Court Facilities Construction Fund allocation in the amount of $50.0 million for support for operation of the trial courts; and
o General Fund allocation in the amount of $68.8 million for employee benefits.
• A Workload Allocation of $2.215 billion based on methodologies approved by the Judicial Council.
Item 3 - 2021-22 Self-Help Funding Three-Year Allocation Update (Action Required)
Allocation update of the three-year average census data from the California Department of Finance, Demographic Research Unit, and Population estimates for Cities and Counties and the State.
Presenter(s)/Facilitator(s): Ms. Bonnie Hough, Principal Manager, Attorney, Center for Families, Children & the Courts
Mr. Nick Armstrong, Senior Research Analyst, Judicial Council Business Management Services
Action: TCBAC unanimously voted to approve the continued use of the $34,000 base with the remainder of the funds allocated by population, and inclusion of the three-year population average updated every three years to be used for the allocation of self-help funding, for consideration by the Judicial Council at its July 8-9, 2021 business meeting.
Page 5 of 48

M e e t i n g M i n u t e s │ M a r c h 9 , 2 0 2 1
3 | P a g e T r i a l C o u r t B u d g e t A d v i s o r y C o m m i t t e e
Item 4 - 2021-22 AB 1058 Family Law Facilitator and Child Support Commissioner Allocation Methodologies (Action Required)
Consideration of a recommendation from the Family and Juvenile Law Advisory Committee on an updated methodology for facilitator allocations, and continued methodology for commissioner allocations with a 2021-22 biennial reallocation, as required by Assembly Bill 1058 (Stats. 1996, ch. 957). The funds are provided through a cooperative agreement between the California Department of Child Support Services and the Judicial Council.
Presenter(s)/Facilitator(s): Mr. Don Will, Deputy Director, Judicial Council Center for Families, Children & the Courts
Ms. Anna Maves, Supervising Attorney, Judicial Council Center for Families, Children & the Courts
Action: TCBAC unanimously voted to approve the following recommendations from the Family and Juvenile Law Advisory Committee, which excludes #5 to defer making recommendations 1 and 3 until 2022-23 if AB 1058 funding is not restored to 2018-19 levels in the 2021 Budget Act, for consideration by the Judicial Council:
1. Approve a new funding methodology for the AB 1058 Family Law Facilitator program base funding that allocates a $34,000 baseline level of funding for each court and distributes the remainder of funding by total population as described below and set forth in Attachment 4A. The methodology ensures that funding changes are capped at 5 percent and smaller courts can continue to operate their programs.
2. Restore the overall AB 1058 program funding to 2018–19 levels, if reflected in the 2021 Budget Act.
3. Approve the committee’s recommended base allocation for the Child Support Commissioner program for 2021–22 and 2022–23 as described below and set forth in Attachment 4C, maintaining the current funding methodology approved by the Judicial Council in 2019 with updated workload data.
4. Approve the committee’s recommendation for 2021–22 AB 1058 program funding for the courts comprised of the base funding allocations derived from recommendations 1 and 3, and federal draw down funding using the methodology adopted by the Judicial Council in January 2019.
6. Direct the FJLAC to defer making a recommendation for AB 1058 funding a minimum service level for smaller courts until 2023–24.
7. Direct the FJLAC to review the implementation of the AB 1058 funding methodology, including its impact on the performance of the program as federally mandated, prior to 2023–24.
I N F O R M A T I O N O N L Y I T E M S ( I T E M S 1 - 3 )
Info 1 - 2021-22 Budget Update
Update on the budget for 2021-22.
Page 6 of 48

M e e t i n g M i n u t e s │ M a r c h 9 , 2 0 2 1
4 | P a g e T r i a l C o u r t B u d g e t A d v i s o r y C o m m i t t e e
Presenter(s)/Facilitator(s): Ms. Fran Mueller, Deputy Director, Judicial Council Budget Services
Action: No action taken.
Info 2 - Allocations from the State Trial Court Improvement and Modernization Fund (IMF) for 2021-22
Status update on the IMF revenues and allocations for 2021-22.
Presenter(s)/Facilitator(s): Mr. Zlatko Theodorovic, Deputy Director, Judicial Council Budget Services
Action: No action taken.
Info 3 - $50 Million One-Time COVID-19 Funding and Redistribution Update
Update on the most recent expenditure reporting information as well as the allocation redistribution to occur this fiscal year.
Presenter(s)/Facilitator(s): Ms. Brandy Olivera, Manager, Judicial Council Budget Services
Action: No action taken.
Info 4 - TCTF Funds Held on Behalf Expenditure Reporting
Quarterly report to the TCBAC on how funds were expended for projects and planned expenditures that are complete; nothing to report this quarter.
Presenter(s)/Facilitator(s): Mr. Catrayel Wood, Senior Analyst, Judicial Council Budget Services
Action: No action taken.
A D J O U R N M E N T
There being no further business, the meeting was adjourned at 1:10 p.m.
Approved by the advisory body on enter date.
Page 7 of 48

T R I A L C O U R T B U D G E T A D V I S O R Y C O M M I T T E E
M I N U T E S O F O P E N M E E T I N G
May 24, 2021 11:00 a.m.
Action by E-mail Between Meetings
Advisory Body Members Present:
Judges: Hon. Jonathan B. Conklin (Chair), Hon. Daniel J. Buckley, Hon. Mark A. Cope, Hon. Jill C. Fannin, Hon. Kimberly A. Gaab, Hon. Joyce D. Hinrichs, Patricia L. Kelly, Hon. Charles Margines, Hon. Deborah H. Ryan, and Hon. B. Scott Thomsen.
Executive Officers: Ms. Rebecca Fleming (Vice Chair), Ms. Kim Bartleson, Ms. Sherri R. Carter, Ms. Nancy Eberhardt, Mr. Chad Finke, Mr. Shawn Landry, Mr. Chris Ruhl, Mr. Neal Taniguchi, Mr. Brian Taylor, Ms. Kim Turner, and Mr. David H. Yamasaki.
Advisory Body Members Absent:
Ms. Rebecca Fleming (Vice Chair) and Mr. Brian Taylor.
Others Present: Ms. Brandy Olivera
O P E N M E E T I N G
Vote Voting was opened at 11:03 a.m.
D I S C U S S I O N A N D A C T I O N I T E M S ( I T E M 1 )
Item 1
Consideration of recommendations from the Revenue and Expenditure Subcommittee for the 2021-22 allocations from the State Trial Court Improvement and Modernization Fund for Judicial Branch Budget Committee consideration and then Judicial Council consideration at its July 8-9, 2021 business meeting.
Action: The Trial Court Budget Advisory Committee voted unanimously to approve the recommendation.
A D J O U R N M E N T
Voting closed at 5:00 p.m.
Approved by the advisory body on enter date.
www.courts.ca.gov/tcbac.htm [email protected]
Page 8 of 48

JUDICIAL COUNCIL OF CALIFORNIA BUDGET SERVICES
Report to the Trial Court Budget Advisory Committee
(Action Item)
Title: $60 Million One-Time COVID-Driven Caseload Backlog Funding
Date: August 5, 2021
Contact: Ms. Oksana Tuk, Senior Analyst, Judicial Council Budget Services 916-643-8027 | [email protected]
Issue Consider options for allocating the $60 million one-time COVID-driven caseload backlog funding included in the 2021 Budget Act for Judicial Branch Budget Committee consideration at its August 13, 2021 meeting and for Judicial Council consideration at its October 1, 2021 business meeting. Background Prior Year $50 Million One-Time COVID-19 Backlog Funding
The 2020 Budget Act included $50 million in one-time funding to assist courts in addressing the backlog of filings that have accumulated due to court closures in response to the COVID-19 pandemic. These funds were eligible for expenditure only for the 2020-21 fiscal year.
The first $25 million was approved for allocation to the trial courts at the July 24, 2020 Judicial Council meeting, on a pro rata basis1. At its January 22, 2021 business meeting, the Judicial Council approved an allocation methodology for distribution of the second $25 million that was data driven, allocating funds proportionally based on each court’s share of total statewide backlog. The backlog was measured using a weighted count of dispositions in the pre-pandemic period compared to a pandemic period2. The net change in average dispositions from these two points of time were used to identify those courts eligible for funding, and proxies based on statewide averages were used where necessary.
One court, Sierra, did not receive funding as part of the data-driven methodology. In addition, six courts returned funds that were not needed for a redistribution that occurred at the end of the 2020-21 fiscal year3.
1 Judicial Council report (July 24, 2020) https://jcc.legistar.com/View.ashx?M=F&ID=8651228&GUID=27A3B6D8-9783-4865-8C5A-F6697EB58734 Judicial Council minutes (July 24, 2020) https://jcc.legistar.com/View.ashx?M=M&ID=711582&GUID=90001AF2-7CEE-4F0F-906B-29A03ED9CB43 2 Judicial Council report (January 22, 2021), https://jcc.legistar.com/View.ashx?M=F&ID=9054988&GUID=54812C82-983E-4812-848C-2F4FD9F6F97A; Judicial Council minutes (January 22, 2021), https://jcc.legistar.com/View.ashx?M=M&ID=803674&GUID=B66B9C94-CE8A-41B1-8F5F-1BC9A3B278E1. 3 Includes Mariposa, Modoc, Mono, Napa, Plumas, and Trinity Superior Courts.
Page 9 of 48

JUDICIAL COUNCIL OF CALIFORNIA BUDGET SERVICES
Report to the Trial Court Budget Advisory Committee
Current Year $60 Million One-Time COVID-Driven Caseload Backlog Funding
The 2021 Budget Act includes $60 million in one-time General Fund for the trial courts to specifically address backlogs and workload delays resulting from the COVID-19 pandemic, with the funding available for expenditure through the 2022-23 fiscal year.
Case data was provided to the Administration and Legislature during budget negotiations to demonstrate the backlog and was the basis for this funding augmentation; that data is used here and is court-specific for allocation purposes.
Data Updates
For allocation of the $60 million one-time funding, the data elements used towards last year’s methodology have been upgraded to include filings data by casetype to determine the clearance rate. In addition, the data compares clearance rates from March to August 2019 (pre-pandemic) to those of March 2020 to March 2021 which captures all pandemic impact, and applies pre-pandemic clearance rates to pandemic sums of filings less dispositions to identify the casetypes in which a backlog exists.
These identified areas of backlog for each court are then included in the methodology to determine the proportional allocation of funding. For those courts unable to report complete disposition and filings data for the time period noted, proxies were applied to those courts for each time period to establish those courts’ backlog for the purpose of allocating funds. Case data collection by the branch will continue and updated data will be evaluated to determine progress made by the trial courts in addressing the workload backlogs related to the pandemic.
The outcome in applying available data through March 2021 to the allocation methodology is outlined in Attachment A. Quarterly Reporting
At its January 22, 2021 business meeting, the Judicial Council approved quarterly reporting by the trial courts on the progress in reducing the COVID-19 related backlog4. The first quarterly report was provided to the council as an informational item at its July 9, 2021 business meeting5. The report includes progress in reducing COVID-19 backlog from March 2020 to March 2021. Quarterly informational reporting on COVID-19 backlog progress will continue. Methodology Considerations
4 Judicial Council report (January 22, 2021) https://jcc.legistar.com/View.ashx?M=F&ID=9054988&GUID=54812C82-983E-4812-848C-2F4FD9F6F97A 5 Judicial Council report (July 9, 2021), https://jcc.legistar.com/View.ashx?M=F&ID=9499529&GUID=91D6ED5D-CF6F-42AA-9788-E2D6D8C7AF3F.
Page 10 of 48

JUDICIAL COUNCIL OF CALIFORNIA BUDGET SERVICES
Report to the Trial Court Budget Advisory Committee
The 2021-22 Budget narrative states that the $60 million in one-time funding is for the trial courts to specifically address backlogs and workload delays resulting from the pandemic. Two options were considered using court specific backlog data:
A. Split the allocation and allocate $30 million in October 2021 based on data available through March 2021 and allocate the second $30 million in January 2022 based on the most recent data available at the time (both after council approval). Given that courts are continuing to make progress in addressing the backlog, this option would allocate funding in two phases utilizing the most current backlog data available at the time of distribution; or
B. Allocate the full $60 million in October 2021 (and after council approval) based on data available through March 2021.
Recommendation The Chair of the Trial Court Budget Advisory Committee recommends allocation of $30 million in October 2021 based on data available through March 2021 and allocation of the second $30 million in January 2022 based on the most recent data available at the time for Judicial Branch Budget Committee consideration at its August 13, 2021 meeting and for Judicial Council consideration at its October 1, 2021 business meeting. Attachments Attachment A: $60 Million COVID-Driven Caseload Backlog Funding
Page 11 of 48

Attachment A
$60 Million COVID-Driven Caseload Backlog Funding¹August 2021
Filings DispositionsAverage Monthly
Filings
Average Monthly
Dispositions
Overall Clearance
RateFilings Dispositions
AverageMonthly
Filings
AverageMonthly
Dispositions
ClearanceRate
A B C D E(D / C)
F G H I J(I / H)
K L M
Alameda* 131,197 115,480 21,866 19,247 88.0% 171,868 144,596 13,221 11,123 84.1% 2,272,032 $1,057,842 $528,921Alpine 613 594 102 99 96.9% 1,022 1,010 79 78 98.8% 2,290 1,066 533 Amador 4,057 3,032 676 505 74.7% 6,178 5,134 475 395 83.1% 74,735 34,796 17,398 Butte 17,607 15,413 2,935 2,569 87.5% 26,337 24,048 2,026 1,850 91.3% 529,612 246,584 123,292 Calaveras 2,981 2,573 497 429 86.3% 4,550 4,315 350 332 94.8% 70,171 32,671 16,336 Colusa* 3,946 2,514 658 419 63.7% 3,529 4,077 271 314 115.5% 70,470 32,811 16,405 Contra Costa 65,993 57,514 10,999 9,586 87.2% 81,492 82,571 6,269 6,352 101.3% 1,304,290 607,268 303,634 Del Norte 4,006 7,721 668 1,287 192.7% 5,487 10,046 422 773 183.1% 275,086 128,078 64,039 El Dorado 10,584 6,754 1,764 1,126 63.8% 20,545 13,696 1,580 1,054 66.7% 189,982 88,454 44,227 Fresno 90,354 85,144 15,059 14,191 94.2% 110,652 115,630 8,512 8,895 104.5% 4,249,514 1,978,544 989,272 Glenn* 3,272 2,578 545 430 78.8% 3,273 1,459 252 112 44.6% 158,135 73,627 36,813 Humboldt* 14,159 11,612 2,360 1,935 82.0% 18,931 16,088 1,456 1,238 85.0% 587,683 273,621 136,811 Imperial 27,017 25,065 4,503 4,178 92.8% 31,205 32,547 2,400 2,504 104.3% 972,580 452,826 226,413 Inyo 5,301 4,805 884 801 90.6% 9,647 7,895 742 607 81.8% 142,181 66,198 33,099 Kern 93,207 82,100 15,535 13,683 88.1% 138,038 117,546 10,618 9,042 85.2% 4,061,563 1,891,035 945,517 Kings 14,978 12,113 2,496 2,019 80.9% 26,324 18,934 2,025 1,456 71.9% 1,536,600 715,430 357,715 Lake 6,381 6,406 1,064 1,068 100.4% 9,047 6,702 696 516 74.1% 1,227,273 571,410 285,705 Lassen* 3,910 3,356 652 559 85.8% 7,800 6,593 600 507 84.5% 455,049 211,868 105,934 Los Angeles 881,592 784,324 146,932 130,721 89.0% 1,252,994 929,775 96,384 71,521 74.2% 32,241,900 15,011,602 7,505,801 Madera 19,626 14,253 3,271 2,376 72.6% 22,438 20,708 1,726 1,593 92.3% 1,698,754 790,928 395,464 Marin 22,539 23,185 3,757 3,864 102.9% 31,178 25,542 2,398 1,965 81.9% 1,093,269 509,018 254,509 Mariposa* 2,246 1,759 374 293 78.3% 3,075 2,394 237 184 77.9% 78,445 36,523 18,262 Mendocino 11,379 9,957 1,897 1,660 87.5% 13,098 18,991 1,008 1,461 145.0% 210,006 97,777 48,889 Merced* 29,207 23,169 4,868 3,861 79.3% 40,743 36,775 3,134 2,829 90.3% 1,029,325 479,247 239,623 Modoc 1,080 1,036 180 173 95.9% 2,354 2,060 181 158 87.5% 217,343 101,193 50,597 Mono 4,283 3,954 714 659 92.3% 8,081 7,439 622 572 92.1% 92,048 42,857 21,429 Monterey 32,537 29,722 5,423 4,954 91.3% 56,393 49,888 4,338 3,838 88.5% 535,045 249,113 124,557 Napa* 9,898 10,113 1,650 1,685 102.2% 10,945 9,722 842 748 88.8% 431,047 200,692 100,346 Nevada 8,484 7,099 1,414 1,183 83.7% 13,187 12,724 1,014 979 96.5% 416,297 193,825 96,912 Orange* 241,671 221,600 40,279 36,933 91.7% 213,387 291,423 16,414 22,417 136.6% 8,098,597 3,770,650 1,885,325 Placer* 25,361 15,580 4,227 2,597 61.4% 34,430 21,149 2,648 1,627 61.4% 651,442 303,307 151,653 Plumas* 2,226 1,592 371 265 71.5% 3,153 3,386 243 260 107.4% 51,682 24,063 12,031 Riverside* 179,440 164,595 29,907 27,433 91.7% 279,972 201,846 21,536 15,527 72.1% 7,000,753 3,259,501 1,629,751 Sacramento 150,492 67,824 25,082 11,304 45.1% 186,286 75,996 14,330 5,846 40.8% 5,931,305 2,761,574 1,380,787 San Benito 4,738 3,228 790 538 68.1% 5,099 4,041 392 311 79.3% 124,092 57,777 28,888 San Bernardino* 162,852 161,242 27,142 26,874 99.0% 276,856 243,991 21,297 18,769 88.1% 12,630,254 5,880,558 2,940,279 San Diego 245,204 175,838 40,867 29,306 71.7% 292,943 205,270 22,534 15,790 70.1% 6,832,170 3,181,011 1,590,505 San Francisco* 54,575 57,156 9,096 9,526 104.7% 56,952 30,727 4,381 2,364 54.0% 1,828,604 851,385 425,692 San Joaquin* 71,219 48,567 11,870 8,095 68.2% 110,631 64,904 8,510 4,993 58.7% 1,146,534 533,818 266,909 San Luis Obispo 25,175 23,852 4,196 3,975 94.7% 36,102 30,249 2,777 2,327 83.8% 1,522,064 708,662 354,331 San Mateo 76,796 70,463 12,799 11,744 91.8% 92,043 83,012 7,080 6,386 90.2% 2,935,370 1,366,688 683,344 Santa Barbara 38,337 36,045 6,390 6,008 94.0% 50,230 40,416 3,864 3,109 80.5% 1,485,667 691,716 345,858 Santa Clara* 115,309 85,508 19,218 14,251 74.2% 84,343 96,938 6,488 7,457 114.9% 2,997,247 1,395,497 697,749
$30mAllocation
$60mAllocationCourt
March to August 2019 (Pre Pandemic) March 2020 to March 2021 (All Pandemic) All Pandemic Backlog
(weighted minutes)
(thru
Page 12 of 48

Attachment A
$60 Million COVID-Driven Caseload Backlog Funding¹August 2021
Filings DispositionsAverage Monthly
Filings
Average Monthly
Dispositions
Overall Clearance
RateFilings Dispositions
AverageMonthly
Filings
AverageMonthly
Dispositions
ClearanceRate
A B C D E(D / C)
F G H I J(I / H)
K L M
$30mAllocation
$60mAllocationCourt
March to August 2019 (Pre Pandemic) March 2020 to March 2021 (All Pandemic) All Pandemic Backlog
(weighted minutes)
(thru
Santa Cruz 22,943 18,932 3,824 3,155 82.5% 30,663 27,336 2,359 2,103 89.1% 935,843 435,722 217,861 Shasta 21,503 19,735 3,584 3,289 91.8% 36,362 32,930 2,797 2,533 90.6% 961,048 447,457 223,729 Sierra* 311 288 52 48 92.6% 491 460 38 35 93.7% 20,064 9,342 4,671 Siskiyou 7,475 5,791 1,246 965 77.5% 9,182 6,218 706 478 67.7% 284,600 132,508 66,254 Solano 36,253 31,296 6,042 5,216 86.3% 62,603 49,036 4,816 3,772 78.3% 1,778,422 828,021 414,010 Sonoma 32,635 44,631 5,439 7,439 136.8% 51,840 73,810 3,988 5,678 142.4% 2,715,869 1,264,490 632,245 Stanislaus 39,340 32,565 6,557 5,428 82.8% 59,409 45,519 4,570 3,501 76.6% 3,734,267 1,738,648 869,324 Sutter* 10,178 8,624 1,696 1,437 84.7% 14,701 13,307 1,131 1,024 90.5% 412,581 192,095 96,048 Tehama 8,241 6,977 1,374 1,163 84.7% 11,615 10,013 893 770 86.2% 587,481 273,527 136,763 Trinity 1,678 1,515 280 253 90.3% 2,533 2,517 195 194 99.4% 297,252 138,398 69,199 Tulare 37,359 34,037 6,227 5,673 91.1% 59,709 52,266 4,593 4,020 87.5% 2,507,612 1,167,526 583,763 Tuolumne* 5,021 4,731 837 789 94.2% 6,279 6,002 483 462 95.6% 576,310 268,326 134,163 Ventura 80,195 80,900 13,366 13,483 100.9% 103,760 91,211 7,982 7,016 87.9% 3,523,832 1,640,672 820,336 Yolo 17,328 15,711 2,888 2,619 90.7% 21,255 17,750 1,635 1,365 83.5% 551,154 256,614 128,307 Yuba 5,520 4,390 920 732 79.5% 9,591 6,663 738 513 69.5% 523,082 243,543 121,772
3,241,809 2,796,557 540,302 466,093 86.3% 4,332,830 3,557,292 333,295 273,638 82.1% 128,867,922 $60,000,000 $30,000,000- -
¹ Includes Certification, Child Support, Civil - Limited, Civil - Unlimited, Conservatorship/Guardianship, Dissolution, Domestic Violence, Estates/Trusts, Felony, Infractions, Juvenile Delinquency, Juvenile Dependency, Mental Health, Misdemeanor - Non Traffic, Misdemeanor - Traffic, Other Family Petition, Parentage, Small Claims, and Unlawful Detainer.
Excludes Asbestos, Complex, and Employment Development Department (Sacramento Only) as data is not available for all periods; less than a 1 percent impact.
Floor courtsCluster 1 courts
*Proxy applied to some data.
Page 13 of 48

JUDICIAL COUNCIL OF CALIFORNIA BUDGET SERVICES
Report to the Trial Court Budget Advisory Committee
Page 1 of 2
(Action Item)
Title: $140 Million Pretrial Funding
Date: August 5, 2021
Contact: Deirdre Benedict, Supervising Analyst, Judicial Council, Criminal Justice Services, [email protected], 415-865-7543
Issue The 2021-22 Budget provides funding of $140 million in 2021-22, and $70 million in ongoing funding to the Judicial Council for distribution to the courts for the implementation and operation of ongoing court programs and practices that promote the safe, efficient, fair, and timely pretrial release of individuals booked into jail. Each court may retain up to 30 percent of the funding for costs associated with pretrial release programs and practices. Courts are required to contract for pretrial services with their county’s probation department or any county department or agency other than those that have primary responsibility for making arrests or prosecuting criminal offenses,1 and provide those departments with the remainder of the funds. The current annual budget available to the courts for the Pretrial Release Program is $137.9 million.2 Judicial Council Criminal Justice Services (CJS) staff present the 2021-22 allocations of the Pretrial Release funding for Judicial Branch Budget Committee consideration at its August 13, 2021 meeting and for Judicial Council consideration at its October 1, 2021 business meeting. Background Senate Bill (SB) 129 (Stats. 2021, ch. 69), which amended the Budget Act of 2021, provides funding for “the implementation and operation of ongoing court programs and practices that promote the safe, efficient, fair, and timely pretrial release of individuals booked into jail.” (SB 129, sec. 4, item 0250-101-0001, provision 9.) SB 129 appropriates funding of $140 million in 2021-22, and $70 million in ongoing funding to the Judicial Council for distribution to the courts for these purposes.
1 SB 129 specifically provides that the Superior Court of California, County of Santa Clara, may contract with the Office of Pretrial Services in that county, and that the Superior Court of California, County of San Francisco, may contract with the Sheriff’s Office and the existing not-for-profit entity that is performing pretrial services in the city and county for pretrial assessment and supervision services. 2 SB 129 authorizes the Judicial Council to retain up to 5 percent of the amounts available to the courts for costs associated with implementing, supporting, and evaluating pretrial programs in courts.
Page 14 of 48
JUDICIAL COUNCIL OF CALIFORNIA BUDGET SERVICES
Report to the Trial Court Budget Advisory Committee
Page 2 of 2
Funding Methodology SB 129 specifies two formulas for the Judicial Council to use in distributing pretrial release program funding. One-Time Pretrial Release Funding for Non-Pretrial Pilot Program Courts Half of the budget year funding ($70 million) is to be distributed to the 41 courts that did not receive Pretrial Pilot Program funding (provided in the Budget Act of 2019), with funding allocated to the courts based on each county’s relative proportion of the state population 18 to 25 years of age. The funds are available for encumbrance or expenditure for three fiscal years, until June 30, 2024. The breakdown for these one-time funds is reflected in Attachment A. Ongoing Pretrial Release Funding for All Courts The Judicial Council is required to distribute the remaining $70 million in budget year funding to all courts based on each county’s relative proportion of the state population 18 to 25 years of age. These funds must be encumbered or expended by June 30, 2022. It is anticipated that allocation of the ongoing $70 million in pretrial release program funding for all the superior courts will be based on the same formula in future years. The breakdown for these ongoing funds is reflected in Attachment B. Funding Floor A minimum funding floor of $200,000 is recommended for both funding formulas. This recommendation is based on analysis of planned budgets vs. actual spending by small courts3 participating in the Pretrial Pilot Program in 2019-20 and 2020-21. It is also equivalent to the floor used in the funding methodology for California Community Corrections Performance Incentives Act of 2009 (SB 678)4. This floor will ensure that both small and small/medium courts have the resources necessary to comply with the legislation. Recommendation Approve the 2021-22 Pretrial Release allocations for recommendation to the Judicial Branch Budget Advisory Committee at its August 13, 2021, meeting for consideration by the Judicial Council at its October 1, 2021, business meeting, as outlined in Attachment C.
Attachments Attachment A: One-Time Allocation for Non-Pretrial Pilot Program Courts Attachment B: Ongoing Pretrial Release Allocations for All Courts Attachment C: Recommended 2021-22 Pretrial Release Allocations
3 The court-size category is based on the authorized number of judicial positions (AJP) within a county: small (2–5 AJP), small-medium (6–15 AJP), medium (16–47 AJP), and large (48+ AJP). 4 Stats. 2009, ch. 608, www.courts.ca.gov/documents/sb678.pdf.
Page 15 of 48

Attachment 2A: Funding Formula for One-Time Allocation for Non-Pretrial Pilot Program Courts
Non-Pilot Courts
Total 18-24 yr.1 olds2
% of total population of 18-24 yr. olds inNon-Pilot Courts % of $68.95M
Alpine N/A3 N/A $200,000.00 Amador N/A N/A $200,000.00 Butte 32,869 1.578% $1,040,835.47 Colusa N/A N/A $200,000.00 Contra Costa 93,870 4.507% $2,972,503.73 Del Norte N/A N/A $200,000.00 El Dorado 13,613 0.654% $431,071.62 Fresno 99,540 4.779% $3,152,050.93 Glenn N/A N/A $200,000.00 Humboldt 17,340 0.833% $549,091.45 Imperial 18,273 0.877% $578,635.99 Inyo N/A N/A $200,000.00 Kern 91,753 4.406% $2,905,466.44 Lake N/A N/A $200,000.00 Lassen N/A N/A $200,000.00 Madera 15,053 0.723% $476,670.91 Marin 16,907 0.812% $535,380.00 Mariposa N/A N/A $200,000.00 Mendocino 6,517 0.313% $206,368.46 Merced 30,535 1.466% $966,926.61 Mono N/A N/A $200,000.00 Monterey 43,873 2.107% $1,389,290.04 Orange 295,112 14.170% $9,345,067.86 Placer 28,784 1.382% $911,479.14 Plumas N/A N/A $200,000.00 Riverside 237,421 11.400% $7,518,214.63 San Benito N/A N/A $200,000.00 San Bernardino 226,843 10.892% $7,183,249.84 San Diego 346,764 16.650% $10,980,689.06 San Francisco 62,085 2.981% $1,965,994.39 San Luis Obispo 43,132 2.071% $1,365,825.40 Santa Clara 164,130 7.881% $5,197,369.09 Santa Cruz 40,841 1.961% $1,293,278.20
1 The legislation specifies 18-25 year olds, however census data is only available for 18-24 year olds. 2Source: https://data.census.gov/cedsci/table?q=age%20by%20county&g=0400000US06.050000&tid=ACSST5Y2019.S0101&hidePreview=true&tp=true
3For courts that indicate “N/A”, a minimal funding floor of $200,000 has been imposed to ensure adequate funding to meet the mandate. Page 16 of 48

Attachment A: Funding Formula for One-Time Allocation for Non-Pretrial Pilot Program Courts
Non-Pilot Courts Total 18-24 yr. olds4
% of total population of 18-24 yr. olds in Non-Pilot Courts % of $68.95M
Siskiyou N/A N/A $200,000.00 Solano 39,291 1.887% $1,244,195.63 Stanislaus 51,945 2.494% $1,644,899.39 Sutter 8,424 0.404% $266,755.85 Tehama N/A N/A $200,000.00 Trinity N/A N/A $200,000.00 Yolo 43,740 2.100% $1,385,078.44
Total 2,082,664 $ 68,950,000.00
4Source: https://data.census.gov/cedsci/table?q=age%20by%20county&g=0400000US06.050000&tid=ACSST5Y2019.S0101&hidePreview=true&tp=true
Page 17 of 48

Attachment 2B: Funding Formulas for Ongoing Pretrial Release Allocations
All Courts Total 18-24
yr. olds1 % of total population of
all CA 18-24 yr. olds % of $68.95M Alameda 140,065 3.767% $2,424,168.67 Alpine N/A2 N/A $200,000.00 Amador N/A N/A $200,000.00 Butte 32,869 0.884% $568,878.73 Calaveras N/A N/A $200,000.00 Colusa N/A N/A $200,000.00 Contra Costa 93,870 2.525% $1,624,650.79 Del Norte N/A N/A $200,000.00 El Dorado 13,613 N/A $235,606.38 Fresno 99,540 2.677% $1,722,784.06 Glenn N/A N/A $200,000.00 Humboldt 17,340 0.466% $300,111.27 Imperial 18,273 0.491% $316,259.12 Inyo N/A N/A $200,000.00 Kern 91,753 2.468% $1,588,010.91 Kings 16,736 0.450% $289,657.57 Lake N/A N/A $200,000.00 Lassen N/A N/A $200,000.00 Los Angeles 979,915 26.356% $16,959,834.67 Madera 15,053 0.405% $260,529.12 Marin 16,907 0.455% $292,617.14 Mariposa N/A N/A $200,000.00 Mendocino N/A N/A $200,000.00 Merced 30,535 0.821% $528,483.14 Modoc N/A N/A $200,000.00 Mono N/A N/A $200,000.00 Monterey 43,873 1.180% $759,329.97 Napa 12,199 N/A $211,133.64 Nevada N/A N/A $200,000.00 Orange 295,112 7.937% $5,107,637.63 Placer 28,784 0.774% $498,177.78 Plumas N/A N/A $200,000.00 Riverside 237,421 6.386% $4,109,153.25 Sacramento 132,797 3.572% $2,298,378.09 San Benito N/A N/A $200,000.00
1 Source: https://data.census.gov/cedsci/table?q=age%20by%20county&g=0400000US06.050000&tid=ACSST5Y2019.S0101&hidePreview=true&tp=true
2 For courts that indicate “N/A”, a minimal funding floor of $200,000 has been imposed in ensure adequate funding to meet the mandate.
Page 18 of 48
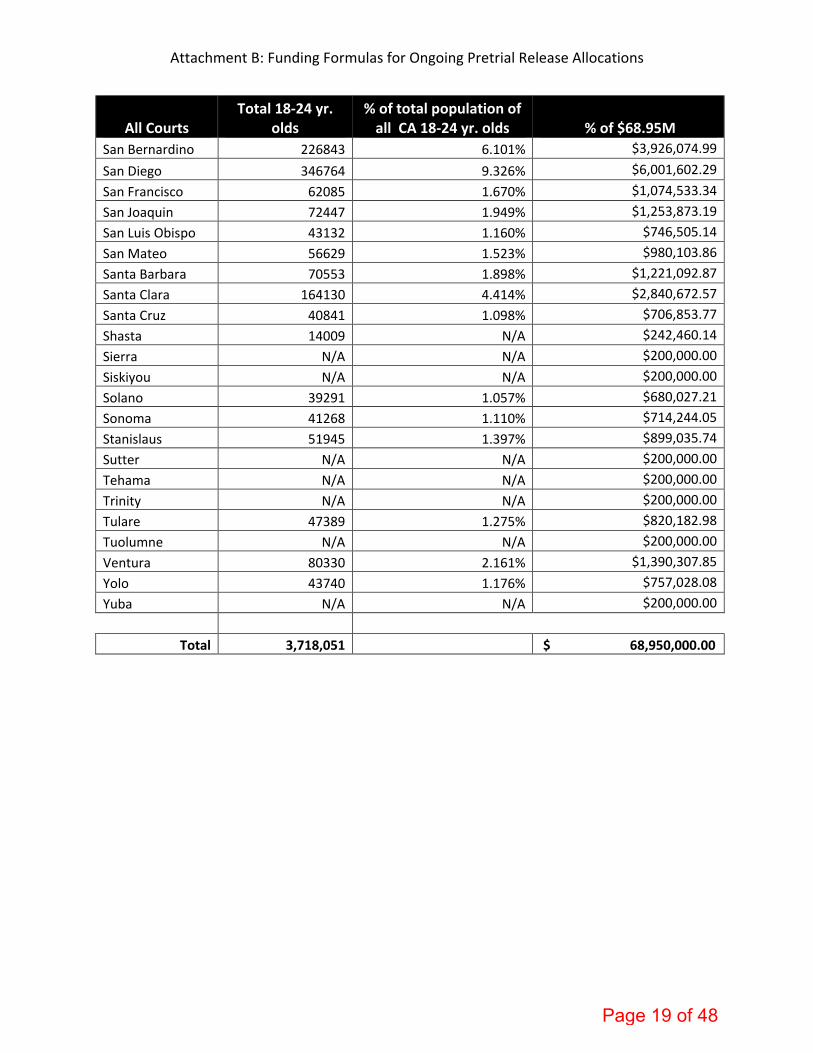
Attachment B: Funding Formulas for Ongoing Pretrial Release Allocations
All Courts Total 18-24 yr.
olds % of total population of
all CA 18-24 yr. olds % of $68.95M San Bernardino 226843 6.101% $3,926,074.99 San Diego 346764 9.326% $6,001,602.29 San Francisco 62085 1.670% $1,074,533.34 San Joaquin 72447 1.949% $1,253,873.19 San Luis Obispo 43132 1.160% $746,505.14 San Mateo 56629 1.523% $980,103.86 Santa Barbara 70553 1.898% $1,221,092.87 Santa Clara 164130 4.414% $2,840,672.57 Santa Cruz 40841 1.098% $706,853.77 Shasta 14009 N/A $242,460.14 Sierra N/A N/A $200,000.00 Siskiyou N/A N/A $200,000.00 Solano 39291 1.057% $680,027.21 Sonoma 41268 1.110% $714,244.05 Stanislaus 51945 1.397% $899,035.74 Sutter N/A N/A $200,000.00 Tehama N/A N/A $200,000.00 Trinity N/A N/A $200,000.00 Tulare 47389 1.275% $820,182.98 Tuolumne N/A N/A $200,000.00 Ventura 80330 2.161% $1,390,307.85 Yolo 43740 1.176% $757,028.08 Yuba N/A N/A $200,000.00
Total 3,718,051 $ 68,950,000.00
Page 19 of 48

Attachment 2C: Total Allocations for Pretrial Release Funding by Court
All Courts One-Time Allocation Ongoing Allocation Total Allocation
Alameda $2,424,168.67 $2,424,168.67 Alpine $200,000.00 $200,000.00 $400,000.00 Amador $200,000.00 $200,000.00 $400,000.00 Butte $1,040,835.47 $568,878.73 $1,609,714.20 Calaveras $200,000.00 $200,000.00 Colusa $200,000.00 $200,000.00 $400,000.00 Contra Costa $2,972,503.73 $1,624,650.79 $4,597,154.52 Del Norte $200,000.00 $200,000.00 $400,000.00 El Dorado $431,071.62 $235,606.38 $666,678.00 Fresno $3,152,050.93 $1,722,784.06 $4,874,834.99 Glenn $200,000.00 $200,000.00 $400,000.00 Humboldt $549,091.45 $300,111.27 $849,202.72 Imperial $578,635.99 $316,259.12 $894,895.11 Inyo $200,000.00 $200,000.00 $400,000.00 Kern $2,905,466.44 $1,588,010.91 $4,493,477.35 Kings $289,657.57 $289,657.57 Lake $200,000.00 $200,000.00 $400,000.00 Lassen $200,000.00 $200,000.00 $400,000.00 Los Angeles $16,959,834.67 $16,959,834.67 Madera $476,670.91 $260,529.12 $737,200.03 Marin $535,380.00 $292,617.14 $827,997.14 Mariposa $200,000.00 $200,000.00 $400,000.00 Mendocino $206,368.46 $200,000.00 $406,368.46 Merced $966,926.61 $528,483.14 $1,495,409.75 Modoc $200,000.00 $200,000.00 Mono $200,000.00 $200,000.00 $400,000.00 Monterey $1,389,290.04 $759,329.97 $2,148,620.01 Napa $211,133.64 $211,133.64 Nevada $200,000.00 $200,000.00 Orange $9,345,067.86 $5,107,637.63 $14,452,705.49 Placer $911,479.14 $498,177.78 $1,409,656.92 Plumas $200,000.00 $200,000.00 $400,000.00 Riverside $7,518,214.63 $4,109,153.25 $11,627,367.88 Sacramento $2,298,378.09 $2,298,378.09 San Benito $200,000.00 $200,000.00 $400,000.00 San Bernardino $7,183,249.84 $3,926,074.99 $11,109,324.83 San Diego $10,980,689.06 $6,001,602.29 $16,982,291.35 San Francisco $1,965,994.39 $1,074,533.34 $3,040,527.73 San Joaquin $1,253,873.19 $1,253,873.19
Page 20 of 48

Attachment C: Total Allocations for Pretrial Release Funding by Court
All Courts One-Time Allocation Ongoing Allocation Total Allocation
San Luis Obispo $1,365,825.40 $746,505.14 $2,112,330.54 San Mateo $980,103.86 $980,103.86 Santa Barbara $1,221,092.87 $1,221,092.87 Santa Clara $5,197,369.09 $2,840,672.57 $8,038,041.66 Santa Cruz $1,293,278.20 $706,853.77 $2,000,131.97 Shasta $443,611.43 $242,460.14 $686,071.57 Sierra $200,000.00 $200,000.00 Siskiyou $200,000.00 $200,000.00 $400,000.00 Solano $1,244,195.63 $680,027.21 $1,924,222.84 Sonoma $714,244.05 $714,244.05 Stanislaus $1,644,899.39 $899,035.74 $2,543,935.13 Sutter $266,755.85 $200,000.00 $466,755.85 Tehama $200,000.00 $200,000.00 $400,000.00 Trinity $200,000.00 $200,000.00 $400,000.00 Tulare $820,182.98 $820,182.98 Tuolumne $200,000.00 $200,000.00 Ventura $1,390,307.85 $1,390,307.85 Yolo $1,385,078.44 $757,028.08 $2,142,106.52 Yuba $200,000.00 $200,000.00 Total: $137,900,000.00
Page 21 of 48

JUDICIAL COUNCIL OF CALIFORNIA BUDGET SERVICES
Report to the Trial Court Budget Advisory Committee
(Action Item)
Title: Child Support: $4.45 Million AB 1058 Reimbursement Authority Increase
Date: 8/5/2021
Contact: Anna L. Maves, AB 1058 Program Manager, Center for Families Children and the Courts, 916-263-8624, [email protected]
Issue
Consider recommendations for the allocation of an additional and ongoing $4.45 million in base funding for the AB 1058 Child Support Commissioner (CSC) and Family Law Facilitator (FLF) program based on current funding methodologies and approve a technical adjustment to 2021-22 CSC base allocations.
Background
The Judicial Council is required to annually allocate non-trial court funding to the AB 1058 program and has done so since 1997.1 A cooperative agreement between the California Department of Child Support Services (DCSS) and the Judicial Council provides the funds for this program and requires the council to annually approve the funding allocation. Two-thirds of the funds are federal, and one-third comes from the state General Fund (non-trial court funding). Any funds left unspent at the end of the fiscal year revert to the state General Fund and cannot be used in subsequent years.
In 2015, the AB 1058 Funding Allocation Joint Subcommittee was formed to review the historical AB 1058 program funding methodology. On January 16, 2019, the Judicial Council approved a new workload-based funding methodology for the CSC program and maintained the historical FLF funding methodology until 2021–22 as recommended by the subcommittee.2
1 Assembly Bill 1058 added article 4 to chapter 2 of part 2 of division 9 of the Family Code, which at section 4252(b)(6) requires the Judicial Council to “[e]stablish procedures for the distribution of funding to the courts for child support commissioners, family law facilitators pursuant to [Family Code] Division 14 (commencing with Section 10000), and related allowable costs.” 2 More details can be found in the Judicial Council report for the January 2019 meeting: Judicial Council of Cal., Advisory Com. Rep., Child Support: AB 1058 Child Support Commissioner and Family Law Facilitator Program Funding Allocation (Nov. 21, 2018), https://jcc.legistar.com/View.ashx?M=F&ID=6953308&GUID=A6F15A78-08B6-42DA-8826-19A6AF0B7CB1.
Page 22 of 48

JUDICIAL COUNCIL OF CALIFORNIA
BUDGET SERVICES Report to the Trial Court Budget Advisory Committee
On July 9, 2021, the Judicial Council approved a new population-based methodology for the FLF program and maintained the workload-based methodology with updated workload data for the CSC program.3
Child Support Commissioner Additional Funds Allocation
Except for a onetime funding reduction in 2020-21, the base funding allocation for the CSC program has been $31.62 million since 2008-09, representing 75 percent of total AB 1058 program base funds.4 The Judicial Council’s cooperative agreement with the DCSS for fiscal year 2021–22 designates $3.34 million in additional funds for the CSC program (75 percent of the $4.45 million) resulting in a new base funding allocation of $34.96 million.
There are two models for consideration to allocate the additional $3.34 million for the CSC program. Both are based on the current workload-methodology approved by the Judicial Council on January 16, 2019. The CSC methodology uses the same workload and cost structures as the Workload Formula used to distribute trial court funds. The methodology maintains current funding levels for smaller courts and caps any increases or decreases to funding at five percent in order to distribute available funds without administering any severe decreases to funding that would impact a court’s ability to continue operating their CSC program.5
CSC Option 1 Option 1 uses the current CSC methodology to prorate the additional funds to all courts based on their percent of funding need. In order to address the needs of courts with the highest need, it does not limit increases to five percent. See Attachment A1.
CSC Option 2 Option 2 also uses the current CSC methodology but only prorates funds to courts whose current allocation is less than the funding need determined by the methodology. In order to address the needs of courts with the highest need, it does not limit increases to five percent. See Attachment A2.
3 More details can be found in the Judicial Council report for the July 2021 meeting: Judicial Council of Cal., Advisory Com. Rep., Child Support: Updating Workload Data for the AB 1058 Child Support Commissioner Funding Methodology, Adopting a Family Law Facilitator Program Funding Methodology, and Adopting 2021–22 AB 1058 Program Funding Allocations (May 14, 2021), https://jcc.legistar.com/View.ashx?M=F&ID=9508521&GUID=BC737E96-AFD8-4E22-A046-AE9E16A5C422. 4 Historically, AB 1058 program funds have been allocated to the courts as follows: 75 percent to the CSC program and 25 percent to the FLF program. 5 More details can be found in the Judicial Council report for the January 2019 meeting: Judicial Council of Cal., Advisory Com. Rep., Child Support: AB 1058 Child Support Commissioner and Family Law Facilitator Program Funding Allocation (Nov. 21, 2018), https://jcc.legistar.com/View.ashx?M=F&ID=6953308&GUID=A6F15A78-08B6-42DA-8826-19A6AF0B7CB1.
Page 23 of 48

JUDICIAL COUNCIL OF CALIFORNIA
BUDGET SERVICES Report to the Trial Court Budget Advisory Committee
CSC Model Comparison
Figure 1. Comparison of CSC Funding Methodology Need, CSC Current Allocation, CSC Option 1 and CSC Option 2 by Cluster
*Need is the allocation determined by the CSC methodology prorated to available funds.
Figure 2. Comparison of Percent Increase to Base Funds for CSC Option 1 and CSC Option 2 by Cluster
$0
$5,000,000
$10,000,000
$15,000,000
$20,000,000
$25,000,000
Cluster 1 Cluster 2 Cluster 3 Cluster 4
CSC Need* Current FY 21-22 Funding CSC Option 1 CSC Option 2
0.0%2.0%4.0%6.0%8.0%
10.0%12.0%14.0%16.0%
Cluster 1 Cluster 2 Cluster 3 Cluster 4
CSC Option 1 CSC Option 2
Page 24 of 48

JUDICIAL COUNCIL OF CALIFORNIA
BUDGET SERVICES Report to the Trial Court Budget Advisory Committee
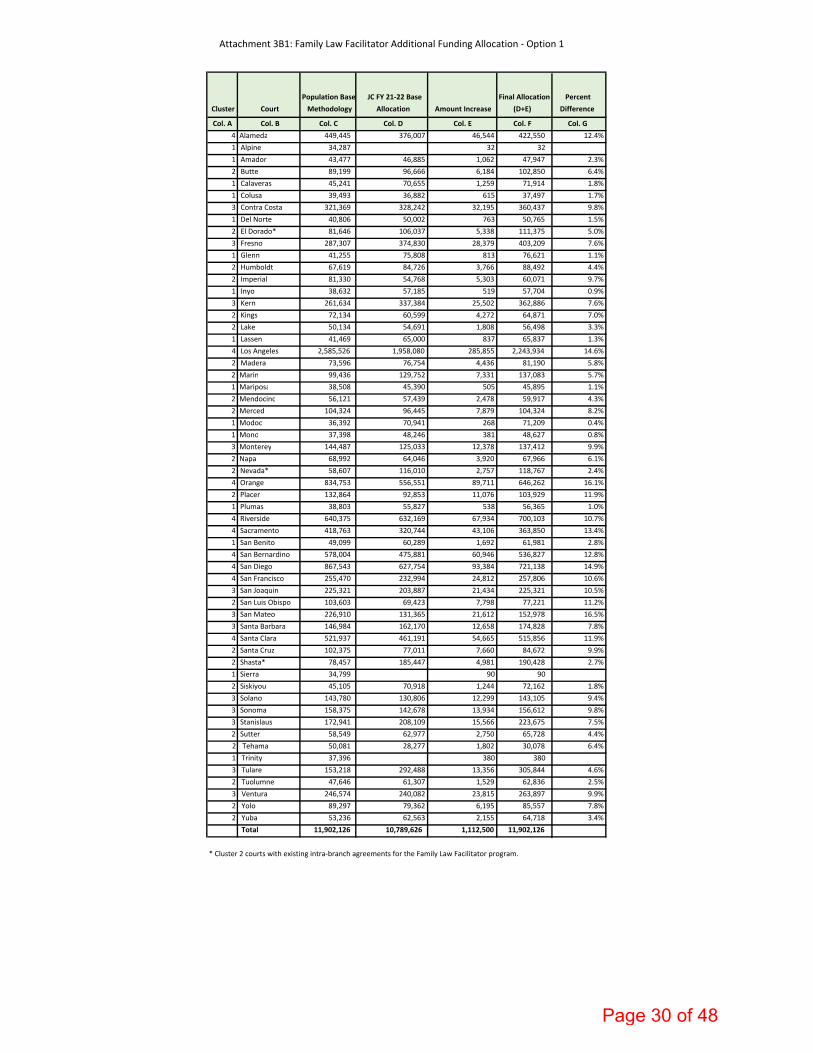
Family Law Facilitator Additional Funds Allocation
Except for a onetime funding reduction in 2020–21, the base funding allocation for the FLF program has been $10.79 million since 2008-09, representing 25 percent of total AB 1058 program base funds. The Judicial Council’s cooperative agreement with the DCSS for fiscal year 2021–22 designates $1.11 million in additional funds (25 percent of the $4.45 million) resulting in a new base funding allocation of $11.90 million.
Like the CSC program, there are two models for consideration to allocate the additional $1.11 million for the FLF program, both of which are based on the current population-based methodology approved by the Judicial Council on July 9, 2021. The FLF funding methodology allocates a base amount of $34,000 to all courts and then allocates the remainder of funds by county population. Mirroring the CSC methodology, the FLF methodology has the same protections for smaller courts and implements a five percent cap on funding changes.6
FLF Option 1 Option 1 follows the current FLF methodology to prorate the additional funds to all courts based on their percent of statewide population. In order to address the needs of courts with the highest need, it does not limit increases to five percent. See Attachment B1.
FLF Option 2 Option 2 is also based on the current FLF methodology but only prorates additional funds to courts whose current allocation is less than the allocation determined by the methodology. In order to address the needs of courts with the highest need, it does not limit increases to five percent. See Attachment B2.
6 More details can be found in the Judicial Council report for the July 2021 meeting: Judicial Council of Cal., Advisory Com. Rep., Child Support: Updating Workload Data for the AB 1058 Child Support Commissioner Funding Methodology, Adopting a Family Law Facilitator Program Funding Methodology, and Adopting 2021–22 AB 1058 Program Funding Allocations (May 14, 2021), https://jcc.legistar.com/View.ashx?M=F&ID=9508521&GUID=BC737E96-AFD8-4E22-A046-AE9E16A5C422.
Page 25 of 48

JUDICIAL COUNCIL OF CALIFORNIA
BUDGET SERVICES Report to the Trial Court Budget Advisory Committee
FLF Model Comparison
Figure 4. Comparison of FLF Funding Methodology Need, FLF Current Allocation, FLF Option 1 and FLF Option 2 by Cluster
*Need is the allocation determined by the FLF funding methodology prorated to available funds.
Figure 5. Comparison of Percent Increase to Base Funds for FLF Option 1 and FLF Option 2 by Cluster
$0
$2,000,000
$4,000,000
$6,000,000
$8,000,000
Cluster 1 Cluster 2 Cluster 3 Cluster 4
FLF Need* Current FY 21-22 Funding FLF Option 1 FLF Option 2
0.0%2.0%4.0%6.0%8.0%
10.0%12.0%14.0%16.0%
Cluster 1 Cluster 2 Cluster 3 Cluster 4
FLF Option 1 FLF Option 2
Page 26 of 48

JUDICIAL COUNCIL OF CALIFORNIA
BUDGET SERVICES Report to the Trial Court Budget Advisory Committee
Recommendations
1. Allocate additional funding to the CSC program for 2021–22, and a technical adjustment to a small number of courts’ base allocation approved by the Judicial Council on July 9, 2021, as set forth in Attachment A1. This allocation distributes 75 percent of the $4.45 million to the CSC program. The additional funds are prorated to need as determined by the current workload-based funding methodology approved by the Judicial Council on January 16, 2019.
2. Allocate additional funding to the FLF program for 2021–22 as set forth in Attachment B1. This allocation distributes 25 percent of the $4.45 million to the FLF program. The additional funds are prorated to need as determined by the current population-based funding methodology approved by the Judicial Council on July 9, 2021.
Attachments
Attachment A1: Child Support Commissioner Additional Funding Allocation – Option 1 Attachment A2: Child Support Commissioner Additional Funding Allocation – Option 2 Attachment B1: Family Law Facilitator Additional Funding Allocation – Option 1 Attachment B2: Family Law Facilitator Additional Funding Allocation – Option 2
Page 27 of 48
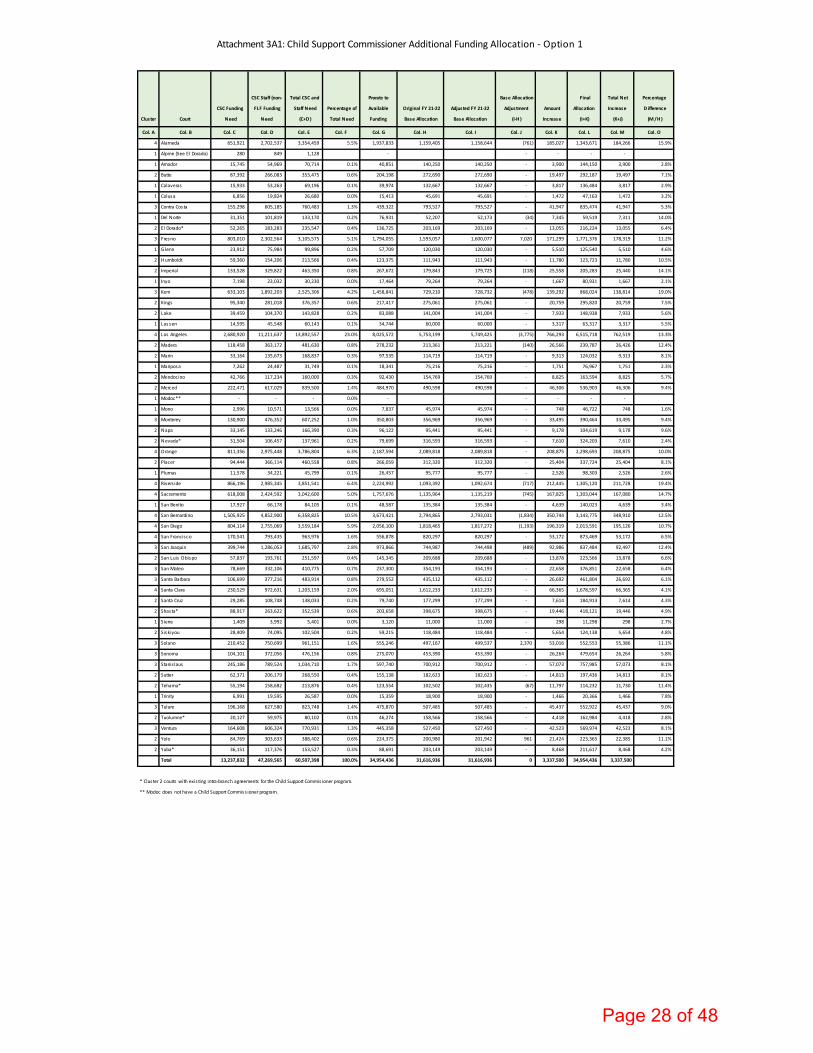
Attachment 3A1: Child Support Commissioner Additional Funding Allocation ‐ Option 1
Cluster Court
CSC Funding
Need
CSC Staff (non‐
FLF Funding
Need
Total CSC and
Staff Need
(C+D)
Percentage of
Total Need
Prorate to
Available
Funding
Original FY 21‐22
Base Allocation
Adjusted FY 21‐22
Base Allocation
Base Allocation
Adjustment
(I‐H)
Amount
Increase
Final
Allocation
(I+K)
Total Net
Increase
(K+J)
Percentage
Difference
(M/H)
Col. A Col. B Col. C Col. D Col. E Col. F Col. G Col. H Col. I Col. J Col. K Col. L Col. M Col. O
4 Alameda 651,921 2,702,537 3,354,459 5.5% 1,937,833 1,159,405 1,158,644 (761) 185,027 1,343,671 184,266 15.9%
1 Alpine (See El Dorado) 280 849 1,128 ‐ ‐ ‐ ‐ ‐
1 Amador 15,745 54,969 70,714 0.1% 40,851 140,250 140,250 ‐ 3,900 144,150 3,900 2.8%
2 Butte 87,392 266,083 353,475 0.6% 204,198 272,690 272,690 ‐ 19,497 292,187 19,497 7.1%
1 Calaveras 15,933 53,263 69,196 0.1% 39,974 132,667 132,667 ‐ 3,817 136,484 3,817 2.9%
1 Colusa 6,856 19,824 26,680 0.0% 15,413 45,691 45,691 ‐ 1,472 47,163 1,472 3.2%
3 Contra Costa 155,298 605,185 760,483 1.3% 439,322 793,527 793,527 ‐ 41,947 835,474 41,947 5.3%
1 Del Norte 31,351 101,819 133,170 0.2% 76,931 52,207 52,173 (34) 7,345 59,519 7,311 14.0%
2 El Dorado* 52,265 183,283 235,547 0.4% 136,725 203,169 203,169 ‐ 13,055 216,224 13,055 6.4%
3 Fresno 803,010 2,302,564 3,105,575 5.1% 1,794,055 1,593,057 1,600,077 7,020 171,299 1,771,376 178,319 11.2%
1 Glenn 23,912 75,984 99,896 0.2% 57,709 120,030 120,030 ‐ 5,510 125,540 5,510 4.6%
2 Humboldt 59,360 154,206 213,566 0.4% 123,375 111,943 111,943 ‐ 11,780 123,723 11,780 10.5%
2 Imperial 133,528 329,822 463,350 0.8% 267,672 179,843 179,725 (118) 25,558 205,283 25,440 14.1%
1 Inyo 7,198 23,032 30,230 0.0% 17,464 79,264 79,264 ‐ 1,667 80,931 1,667 2.1%
3 Kern 633,103 1,892,203 2,525,306 4.2% 1,458,841 729,210 728,732 (478) 139,292 868,024 138,814 19.0%
2 Kings 95,340 281,018 376,357 0.6% 217,417 275,061 275,061 ‐ 20,759 295,820 20,759 7.5%
2 Lake 39,459 104,370 143,828 0.2% 83,088 141,004 141,004 ‐ 7,933 148,938 7,933 5.6%
1 Lassen 14,595 45,548 60,143 0.1% 34,744 60,000 60,000 ‐ 3,317 63,317 3,317 5.5%
4 Los Angeles 2,680,920 11,211,637 13,892,557 23.0% 8,025,572 5,753,199 5,749,425 (3,775) 766,293 6,515,718 762,519 13.3%
2 Madera 118,458 363,172 481,630 0.8% 278,232 213,361 213,221 (140) 26,566 239,787 26,426 12.4%
2 Marin 33,164 135,673 168,837 0.3% 97,535 114,719 114,719 ‐ 9,313 124,032 9,313 8.1%
1 Mariposa 7,262 24,487 31,749 0.1% 18,341 75,216 75,216 ‐ 1,751 76,967 1,751 2.3%
2 Mendocino 42,766 117,234 160,000 0.3% 92,430 154,769 154,769 ‐ 8,825 163,594 8,825 5.7%
2 Merced 222,471 617,029 839,500 1.4% 484,970 490,598 490,598 ‐ 46,306 536,903 46,306 9.4%
1 Modoc** ‐ ‐ ‐ 0.0% ‐ ‐ ‐ ‐ ‐
1 Mono 2,996 10,571 13,566 0.0% 7,837 45,974 45,974 ‐ 748 46,722 748 1.6%
3 Monterey 130,900 476,352 607,252 1.0% 350,803 356,969 356,969 ‐ 33,495 390,464 33,495 9.4%
2 Napa 33,145 133,246 166,390 0.3% 96,122 95,441 95,441 ‐ 9,178 104,619 9,178 9.6%
2 Nevada* 31,504 106,457 137,961 0.2% 79,699 316,593 316,593 ‐ 7,610 324,203 7,610 2.4%
4 Orange 811,356 2,975,448 3,786,804 6.3% 2,187,594 2,089,818 2,089,818 ‐ 208,875 2,298,693 208,875 10.0%
2 Placer 94,444 366,114 460,558 0.8% 266,059 312,320 312,320 ‐ 25,404 337,724 25,404 8.1%
1 Plumas 11,578 34,221 45,799 0.1% 26,457 95,777 95,777 ‐ 2,526 98,303 2,526 2.6%
4 Rivers ide 866,196 2,985,345 3,851,541 6.4% 2,224,992 1,093,392 1,092,674 (717) 212,445 1,305,120 211,728 19.4%
4 Sacramento 618,008 2,424,592 3,042,600 5.0% 1,757,676 1,135,964 1,135,219 (745) 167,825 1,303,044 167,080 14.7%
1 San Benito 17,927 66,178 84,105 0.1% 48,587 135,384 135,384 ‐ 4,639 140,023 4,639 3.4%
4 San Bernardino 1,505,925 4,852,900 6,358,825 10.5% 3,673,421 2,794,865 2,793,031 (1,834) 350,744 3,143,775 348,910 12.5%
4 San Diego 804,114 2,755,069 3,559,184 5.9% 2,056,100 1,818,465 1,817,272 (1,193) 196,319 2,013,591 195,126 10.7%
4 San Francisco 170,541 793,435 963,976 1.6% 556,878 820,297 820,297 ‐ 53,172 873,469 53,172 6.5%
3 San Joaquin 399,744 1,286,053 1,685,797 2.8% 973,866 744,987 744,498 (489) 92,986 837,484 92,497 12.4%
2 San Luis Obispo 57,837 193,761 251,597 0.4% 145,345 209,688 209,688 ‐ 13,878 223,566 13,878 6.6%
3 San Mateo 78,669 332,106 410,775 0.7% 237,300 354,193 354,193 ‐ 22,658 376,851 22,658 6.4%
3 Santa Barbara 106,699 377,216 483,914 0.8% 279,552 435,112 435,112 ‐ 26,692 461,804 26,692 6.1%
4 Santa Clara 230,529 972,631 1,203,159 2.0% 695,051 1,612,233 1,612,233 ‐ 66,365 1,678,597 66,365 4.1%
2 Santa Cruz 29,285 108,748 138,033 0.2% 79,740 177,299 177,299 ‐ 7,614 184,913 7,614 4.3%
2 Shasta* 88,917 263,622 352,539 0.6% 203,658 398,675 398,675 ‐ 19,446 418,121 19,446 4.9%
1 Sierra 1,409 3,992 5,401 0.0% 3,120 11,000 11,000 ‐ 298 11,298 298 2.7%
2 Siskiyou 28,409 74,095 102,504 0.2% 59,215 118,484 118,484 ‐ 5,654 124,138 5,654 4.8%
3 Solano 210,452 750,699 961,151 1.6% 555,246 497,167 499,537 2,370 53,016 552,553 55,386 11.1%
3 Sonoma 104,101 372,056 476,156 0.8% 275,070 453,390 453,390 ‐ 26,264 479,654 26,264 5.8%
3 Stanis laus 245,186 789,524 1,034,710 1.7% 597,740 700,912 700,912 ‐ 57,073 757,985 57,073 8.1%
2 Sutter 62,371 206,179 268,550 0.4% 155,138 182,623 182,623 ‐ 14,813 197,436 14,813 8.1%
2 Tehama* 55,194 158,682 213,876 0.4% 123,554 102,502 102,435 (67) 11,797 114,232 11,730 11.4%
1 Trinity 6,991 19,595 26,587 0.0% 15,359 18,900 18,900 ‐ 1,466 20,366 1,466 7.8%
3 Tulare 196,168 627,580 823,748 1.4% 475,870 507,485 507,485 ‐ 45,437 552,922 45,437 9.0%
2 Tuolumne* 20,127 59,975 80,102 0.1% 46,274 158,566 158,566 ‐ 4,418 162,984 4,418 2.8%
3 Ventura 164,608 606,324 770,931 1.3% 445,358 527,450 527,450 ‐ 42,523 569,974 42,523 8.1%
2 Yolo 84,769 303,633 388,402 0.6% 224,375 200,980 201,942 961 21,424 223,365 22,385 11.1%
2 Yuba* 36,151 117,376 153,527 0.3% 88,691 203,149 203,149 ‐ 8,468 211,617 8,468 4.2%
Total 13,237,832 47,269,565 60,507,398 100.0% 34,954,436 31,616,936 31,616,936 0 3,337,500 34,954,436 3,337,500
* Cluster 2 courts with exis ting intra‐branch agreements for the Child Support Commis ioner program.
** Modoc does not have a Child Support Commiss ioner program.
Page 28 of 48
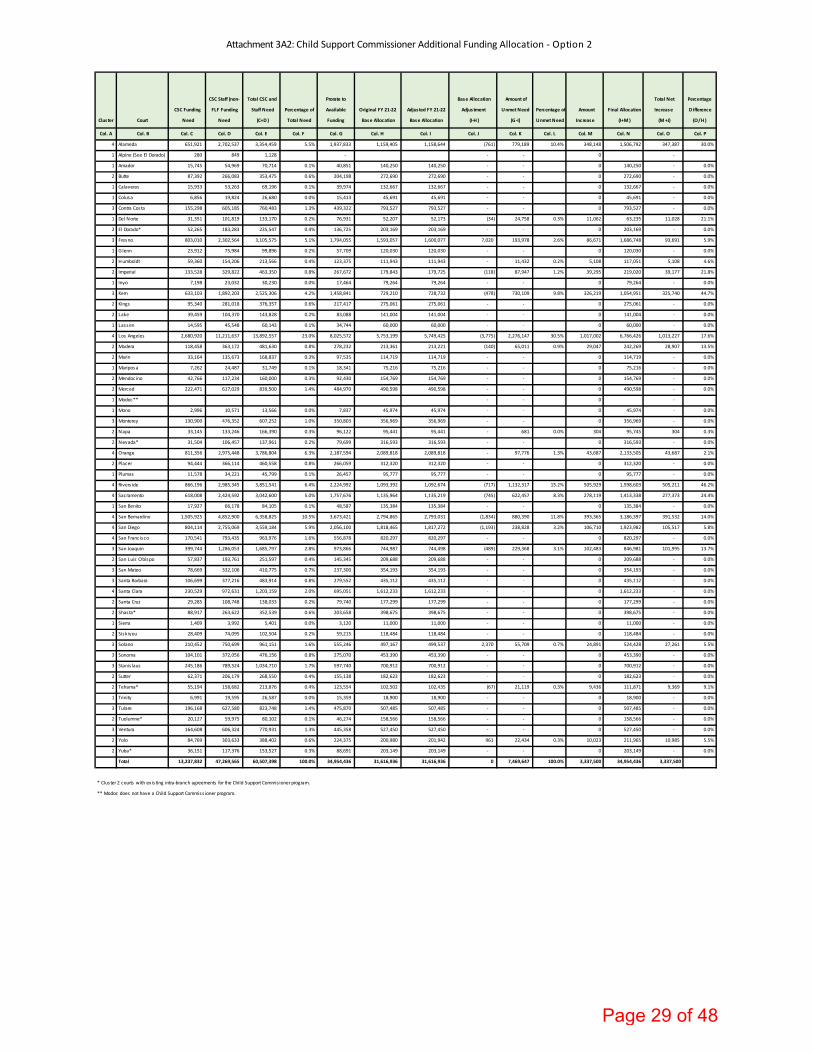
Attachment 3A2: Child Support Commissioner Additional Funding Allocation ‐ Option 2
Cluster Court
CSC Funding
Need
CSC Staff (non‐
FLF Funding
Need
Total CSC and
Staff Need
(C+D)
Percentage of
Total Need
Prorate to
Available
Funding
Original FY 21‐22
Base Allocation
Adjusted FY 21‐22
Base Allocation
Base Allocation
Adjustment
(I‐H)
Amount of
Unmet Need
(G ‐I)
Percentage of
Unmet Need
Amount
Increase
Final Allocation
(I+M)
Total Net
Increase
(M+J)
Percentage
Difference
(O/H)
Col. A Col. B Col. C Col. D Col. E Col. F Col. G Col. H Col. I Col. J Col. K Col. L Col. M Col. N Col. O Col. P
4 Alameda 651,921 2,702,537 3,354,459 5.5% 1,937,833 1,159,405 1,158,644 (761) 779,189 10.4% 348,148 1,506,792 347,387 30.0%
1 Alpine (See El Dorado) 280 849 1,128 ‐ ‐ ‐ 0 ‐
1 Amador 15,745 54,969 70,714 0.1% 40,851 140,250 140,250 ‐ ‐ 0 140,250 ‐ 0.0%
2 Butte 87,392 266,083 353,475 0.6% 204,198 272,690 272,690 ‐ ‐ 0 272,690 ‐ 0.0%
1 Calaveras 15,933 53,263 69,196 0.1% 39,974 132,667 132,667 ‐ ‐ 0 132,667 ‐ 0.0%
1 Colusa 6,856 19,824 26,680 0.0% 15,413 45,691 45,691 ‐ ‐ 0 45,691 ‐ 0.0%
3 Contra Costa 155,298 605,185 760,483 1.3% 439,322 793,527 793,527 ‐ ‐ 0 793,527 ‐ 0.0%
1 Del Norte 31,351 101,819 133,170 0.2% 76,931 52,207 52,173 (34) 24,758 0.3% 11,062 63,235 11,028 21.1%
2 El Dorado* 52,265 183,283 235,547 0.4% 136,725 203,169 203,169 ‐ ‐ 0 203,169 ‐ 0.0%
3 Fresno 803,010 2,302,564 3,105,575 5.1% 1,794,055 1,593,057 1,600,077 7,020 193,978 2.6% 86,671 1,686,748 93,691 5.9%
1 Glenn 23,912 75,984 99,896 0.2% 57,709 120,030 120,030 ‐ ‐ 0 120,030 ‐ 0.0%
2 Humboldt 59,360 154,206 213,566 0.4% 123,375 111,943 111,943 ‐ 11,432 0.2% 5,108 117,051 5,108 4.6%
2 Imperial 133,528 329,822 463,350 0.8% 267,672 179,843 179,725 (118) 87,947 1.2% 39,295 219,020 39,177 21.8%
1 Inyo 7,198 23,032 30,230 0.0% 17,464 79,264 79,264 ‐ ‐ 0 79,264 ‐ 0.0%
3 Kern 633,103 1,892,203 2,525,306 4.2% 1,458,841 729,210 728,732 (478) 730,109 9.8% 326,219 1,054,951 325,740 44.7%
2 Kings 95,340 281,018 376,357 0.6% 217,417 275,061 275,061 ‐ ‐ 0 275,061 ‐ 0.0%
2 Lake 39,459 104,370 143,828 0.2% 83,088 141,004 141,004 ‐ ‐ 0 141,004 ‐ 0.0%
1 Lassen 14,595 45,548 60,143 0.1% 34,744 60,000 60,000 ‐ ‐ 0 60,000 ‐ 0.0%
4 Los Angeles 2,680,920 11,211,637 13,892,557 23.0% 8,025,572 5,753,199 5,749,425 (3,775) 2,276,147 30.5% 1,017,002 6,766,426 1,013,227 17.6%
2 Madera 118,458 363,172 481,630 0.8% 278,232 213,361 213,221 (140) 65,011 0.9% 29,047 242,269 28,907 13.5%
2 Marin 33,164 135,673 168,837 0.3% 97,535 114,719 114,719 ‐ ‐ 0 114,719 ‐ 0.0%
1 Mariposa 7,262 24,487 31,749 0.1% 18,341 75,216 75,216 ‐ ‐ 0 75,216 ‐ 0.0%
2 Mendocino 42,766 117,234 160,000 0.3% 92,430 154,769 154,769 ‐ ‐ 0 154,769 ‐ 0.0%
2 Merced 222,471 617,029 839,500 1.4% 484,970 490,598 490,598 ‐ ‐ 0 490,598 ‐ 0.0%
1 Modoc** ‐ ‐ 0 ‐
1 Mono 2,996 10,571 13,566 0.0% 7,837 45,974 45,974 ‐ ‐ 0 45,974 ‐ 0.0%
3 Monterey 130,900 476,352 607,252 1.0% 350,803 356,969 356,969 ‐ ‐ 0 356,969 ‐ 0.0%
2 Napa 33,145 133,246 166,390 0.3% 96,122 95,441 95,441 ‐ 681 0.0% 304 95,745 304 0.3%
2 Nevada* 31,504 106,457 137,961 0.2% 79,699 316,593 316,593 ‐ ‐ 0 316,593 ‐ 0.0%
4 Orange 811,356 2,975,448 3,786,804 6.3% 2,187,594 2,089,818 2,089,818 ‐ 97,776 1.3% 43,687 2,133,505 43,687 2.1%
2 Placer 94,444 366,114 460,558 0.8% 266,059 312,320 312,320 ‐ ‐ 0 312,320 ‐ 0.0%
1 Plumas 11,578 34,221 45,799 0.1% 26,457 95,777 95,777 ‐ ‐ 0 95,777 ‐ 0.0%
4 Rivers ide 866,196 2,985,345 3,851,541 6.4% 2,224,992 1,093,392 1,092,674 (717) 1,132,317 15.2% 505,929 1,598,603 505,211 46.2%
4 Sacramento 618,008 2,424,592 3,042,600 5.0% 1,757,676 1,135,964 1,135,219 (745) 622,457 8.3% 278,119 1,413,338 277,373 24.4%
1 San Benito 17,927 66,178 84,105 0.1% 48,587 135,384 135,384 ‐ ‐ 0 135,384 ‐ 0.0%
4 San Bernardino 1,505,925 4,852,900 6,358,825 10.5% 3,673,421 2,794,865 2,793,031 (1,834) 880,390 11.8% 393,365 3,186,397 391,532 14.0%
4 San Diego 804,114 2,755,069 3,559,184 5.9% 2,056,100 1,818,465 1,817,272 (1,193) 238,828 3.2% 106,710 1,923,982 105,517 5.8%
4 San Francisco 170,541 793,435 963,976 1.6% 556,878 820,297 820,297 ‐ ‐ 0 820,297 ‐ 0.0%
3 San Joaquin 399,744 1,286,053 1,685,797 2.8% 973,866 744,987 744,498 (489) 229,368 3.1% 102,483 846,981 101,995 13.7%
2 San Luis Obispo 57,837 193,761 251,597 0.4% 145,345 209,688 209,688 ‐ ‐ 0 209,688 ‐ 0.0%
3 San Mateo 78,669 332,106 410,775 0.7% 237,300 354,193 354,193 ‐ ‐ 0 354,193 ‐ 0.0%
3 Santa Barbara 106,699 377,216 483,914 0.8% 279,552 435,112 435,112 ‐ ‐ 0 435,112 ‐ 0.0%
4 Santa Clara 230,529 972,631 1,203,159 2.0% 695,051 1,612,233 1,612,233 ‐ ‐ 0 1,612,233 ‐ 0.0%
2 Santa Cruz 29,285 108,748 138,033 0.2% 79,740 177,299 177,299 ‐ ‐ 0 177,299 ‐ 0.0%
2 Shasta* 88,917 263,622 352,539 0.6% 203,658 398,675 398,675 ‐ ‐ 0 398,675 ‐ 0.0%
1 Sierra 1,409 3,992 5,401 0.0% 3,120 11,000 11,000 ‐ ‐ 0 11,000 ‐ 0.0%
2 Siskiyou 28,409 74,095 102,504 0.2% 59,215 118,484 118,484 ‐ ‐ 0 118,484 ‐ 0.0%
3 Solano 210,452 750,699 961,151 1.6% 555,246 497,167 499,537 2,370 55,709 0.7% 24,891 524,428 27,261 5.5%
3 Sonoma 104,101 372,056 476,156 0.8% 275,070 453,390 453,390 ‐ ‐ 0 453,390 ‐ 0.0%
3 Stanis laus 245,186 789,524 1,034,710 1.7% 597,740 700,912 700,912 ‐ ‐ 0 700,912 ‐ 0.0%
2 Sutter 62,371 206,179 268,550 0.4% 155,138 182,623 182,623 ‐ ‐ 0 182,623 ‐ 0.0%
2 Tehama* 55,194 158,682 213,876 0.4% 123,554 102,502 102,435 (67) 21,119 0.3% 9,436 111,871 9,369 9.1%
1 Trinity 6,991 19,595 26,587 0.0% 15,359 18,900 18,900 ‐ ‐ 0 18,900 ‐ 0.0%
3 Tulare 196,168 627,580 823,748 1.4% 475,870 507,485 507,485 ‐ ‐ 0 507,485 ‐ 0.0%
2 Tuolumne* 20,127 59,975 80,102 0.1% 46,274 158,566 158,566 ‐ ‐ 0 158,566 ‐ 0.0%
3 Ventura 164,608 606,324 770,931 1.3% 445,358 527,450 527,450 ‐ ‐ 0 527,450 ‐ 0.0%
2 Yolo 84,769 303,633 388,402 0.6% 224,375 200,980 201,942 961 22,434 0.3% 10,023 211,965 10,985 5.5%
2 Yuba* 36,151 117,376 153,527 0.3% 88,691 203,149 203,149 ‐ ‐ 0 203,149 ‐ 0.0%
Total 13,237,832 47,269,565 60,507,398 100.0% 34,954,436 31,616,936 31,616,936 0 7,469,647 100.0% 3,337,500 34,954,436 3,337,500
* Cluster 2 courts with exis ting intra‐branch agreements for the Child Support Commis ioner program.
** Modoc does not have a Child Support Commiss ioner program.
Page 29 of 48
Attachment 3B1: Family Law Facilitator Additional Funding Allocation ‐ Option 1
Cluster Court
Population Base
Methodology
JC FY 21‐22 Base
Allocation Amount Increase
Final Allocation
(D+E)
Percent
Difference
Col. A Col. B Col. C Col. D Col. E Col. F Col. G
4 Alameda 449,445 376,007 46,544 422,550 12.4%
1 Alpine 34,287 32 32
1 Amador 43,477 46,885 1,062 47,947 2.3%
2 Butte 89,199 96,666 6,184 102,850 6.4%
1 Calaveras 45,241 70,655 1,259 71,914 1.8%
1 Colusa 39,493 36,882 615 37,497 1.7%
3 Contra Costa 321,369 328,242 32,195 360,437 9.8%
1 Del Norte 40,806 50,002 763 50,765 1.5%
2 E l Dorado* 81,646 106,037 5,338 111,375 5.0%
3 Fresno 287,307 374,830 28,379 403,209 7.6%
1 Glenn 41,255 75,808 813 76,621 1.1%
2 Humboldt 67,619 84,726 3,766 88,492 4.4%
2 Imperial 81,330 54,768 5,303 60,071 9.7%
1 Inyo 38,632 57,185 519 57,704 0.9%
3 Kern 261,634 337,384 25,502 362,886 7.6%
2 Kings 72,134 60,599 4,272 64,871 7.0%
2 Lake 50,134 54,691 1,808 56,498 3.3%
1 Lassen 41,469 65,000 837 65,837 1.3%
4 Los Angeles 2,585,526 1,958,080 285,855 2,243,934 14.6%
2 Madera 73,596 76,754 4,436 81,190 5.8%
2 Marin 99,436 129,752 7,331 137,083 5.7%
1 Mariposa 38,508 45,390 505 45,895 1.1%
2 Mendocino 56,121 57,439 2,478 59,917 4.3%
2 Merced 104,324 96,445 7,879 104,324 8.2%
1 Modoc 36,392 70,941 268 71,209 0.4%
1 Mono 37,398 48,246 381 48,627 0.8%
3 Monterey 144,487 125,033 12,378 137,412 9.9%
2 Napa 68,992 64,046 3,920 67,966 6.1%
2 Nevada* 58,607 116,010 2,757 118,767 2.4%
4 Orange 834,753 556,551 89,711 646,262 16.1%
2 Placer 132,864 92,853 11,076 103,929 11.9%
1 Plumas 38,803 55,827 538 56,365 1.0%
4 Riverside 640,375 632,169 67,934 700,103 10.7%
4 Sacramento 418,763 320,744 43,106 363,850 13.4%
1 San Benito 49,099 60,289 1,692 61,981 2.8%
4 San Bernardino 578,004 475,881 60,946 536,827 12.8%
4 San Diego 867,543 627,754 93,384 721,138 14.9%
4 San Francisco 255,470 232,994 24,812 257,806 10.6%
3 San Joaquin 225,321 203,887 21,434 225,321 10.5%
2 San Luis Obispo 103,603 69,423 7,798 77,221 11.2%
3 San Mateo 226,910 131,365 21,612 152,978 16.5%
3 Santa Barbara 146,984 162,170 12,658 174,828 7.8%
4 Santa Clara 521,937 461,191 54,665 515,856 11.9%
2 Santa Cruz 102,375 77,011 7,660 84,672 9.9%
2 Shasta* 78,457 185,447 4,981 190,428 2.7%
1 Sierra 34,799 90 90
2 Siskiyou 45,105 70,918 1,244 72,162 1.8%
3 Solano 143,780 130,806 12,299 143,105 9.4%
3 Sonoma 158,375 142,678 13,934 156,612 9.8%
3 Stanislaus 172,941 208,109 15,566 223,675 7.5%
2 Sutter 58,549 62,977 2,750 65,728 4.4%
2 Tehama 50,081 28,277 1,802 30,078 6.4%
1 Trinity 37,396 380 380
3 Tulare 153,218 292,488 13,356 305,844 4.6%
2 Tuolumne 47,646 61,307 1,529 62,836 2.5%
3 Ventura 246,574 240,082 23,815 263,897 9.9%
2 Yolo 89,297 79,362 6,195 85,557 7.8%
2 Yuba 53,236 62,563 2,155 64,718 3.4%
Total 11,902,126 10,789,626 1,112,500 11,902,126
* Cluster 2 courts with existing intra‐branch agreements for the Family Law Facilitator program.
Page 30 of 48

Attachment 3B2: Family Law Facilitator Additional Funding Allocation ‐ Option 2
Cluster Court
Population Based
Methodology
JC FY 21‐22 Base
Allocation
Amount of
Unmet Need
Percentage of
Unment Need Amount Increase
Final Allocation
(D+G)
Percent
Difference
Col. A Col. B Col. C Col. D Col. E Col. F Col. G Col. H Col. I
4 Alameda 449,445 376,007 73,439 3.9% 43,763 419,770 11.6%
1 Alpine 34,287
1 Amador 43,477 46,885 ‐ 0 46,885 0.0%
2 Butte 89,199 96,666 ‐ 0 96,666 0.0%
1 Calaveras 45,241 70,655 ‐ 0 70,655 0.0%
1 Colusa 39,493 36,882 2,611 0.1% 1,556 38,438 4.2%
3 Contra Costa 321,369 328,242 ‐ 0 328,242 0.0%
1 Del Norte 40,806 50,002 ‐ 0 50,002 0.0%
2 El Dorado* 81,646 106,037 ‐ 0 106,037 0.0%
3 Fresno 287,307 374,830 ‐ 0 374,830 0.0%
1 Glenn 41,255 75,808 ‐ 0 75,808 0.0%
2 Humboldt 67,619 84,726 ‐ 0 84,726 0.0%
2 Imperial 81,330 54,768 26,562 1.4% 15,828 70,597 28.9%
1 Inyo 38,632 57,185 ‐ 0 57,185 0.0%
3 Kern 261,634 337,384 ‐ 0 337,384 0.0%
2 Kings 72,134 60,599 11,535 0.6% 6,874 67,473 11.3%
2 Lake 50,134 54,691 ‐ 0 54,691 0.0%
1 Lassen 41,469 65,000 ‐ 0 65,000 0.0%
4 Los Angeles 2,585,526 1,958,080 627,447 33.6% 373,907 2,331,986 19.1%
2 Madera 73,596 76,754 ‐ 0 76,754 0.0%
2 Marin 99,436 129,752 ‐ 0 129,752 0.0%
1 Mariposa 38,508 45,390 ‐ 0 45,390 0.0%
2 Mendocino 56,121 57,439 ‐ 0 57,439 0.0%
2 Merced 104,324 96,445 7,879 0.4% 4,695 101,140 4.9%
1 Modoc 36,392 70,941 ‐ 0 70,941 0.0%
1 Mono 37,398 48,246 ‐ 0 48,246 0.0%
3 Monterey 144,487 125,033 19,454 1.0% 11,593 136,626 9.3%
2 Napa 68,992 64,046 4,946 0.3% 2,947 66,993 4.6%
2 Nevada* 58,607 116,010 ‐ 0 116,010 0.0%
4 Orange 834,753 556,551 278,202 14.9% 165,785 722,336 29.8%
2 Placer 132,864 92,853 40,011 2.1% 23,843 116,696 25.7%
1 Plumas 38,803 55,827 ‐ 0 55,827 0.0%
4 Riverside 640,375 632,169 8,206 0.4% 4,890 637,059 0.8%
4 Sacramento 418,763 320,744 98,019 5.3% 58,411 379,155 18.2%
1 San Benito 49,099 60,289 ‐ 0 60,289 0.0%
4 San Bernardino 578,004 475,881 102,123 5.5% 60,857 536,738 12.8%
4 San Diego 867,543 627,754 239,789 12.8% 142,895 770,648 22.8%
4 San Francisco 255,470 232,994 22,476 1.2% 13,394 246,388 5.7%
3 San Joaquin 225,321 203,887 21,434 1.1% 12,773 216,660 6.3%
2 San Luis Obispo 103,603 69,423 34,181 1.8% 20,369 89,792 29.3%
3 San Mateo 226,910 131,365 95,545 5.1% 56,937 188,302 43.3%
3 Santa Barbara 146,984 162,170 ‐ 0 162,170 0.0%
4 Santa Clara 521,937 461,191 60,746 3.3% 36,200 497,391 7.8%
2 Santa Cruz 102,375 77,011 25,364 1.4% 15,115 92,126 19.6%
2 Shasta* 78,457 185,447 ‐ 0 185,447 0.0%
1 Sierra 34,799
2 Siskiyou 45,105 70,918 ‐ 0 70,918 0.0%
3 Solano 143,780 130,806 12,974 0.7% 7,731 138,538 5.9%
3 Sonoma 158,375 142,678 15,697 0.8% 9,354 152,032 6.6%
3 Stanislaus 172,941 208,109 ‐ 0 208,109 0.0%
2 Sutter 58,549 62,977 ‐ 0 62,977 0.0%
2 Tehama 50,081 28,277 21,804 1.2% 12,994 41,270 46.0%
1 Trinity 37,396
3 Tulare 153,218 292,488 ‐ 0 292,488 0.0%
2 Tuolumne 47,646 61,307 ‐ 0 61,307 0.0%
3 Ventura 246,574 240,082 6,492 0.3% 3,868 243,951 1.6%
2 Yolo 89,297 79,362 9,935 0.5% 5,920 85,282 7.5%
2 Yuba 53,236 62,563 ‐ 0 62,563 0.0%
Total 11,902,126 10,789,626 1,866,869 100.0% 1,112,500 11,902,126
* Cluster 2 courts with existing intra‐branch agreements for the Family Law Facilitator program.
Page 31 of 48
JUDICIAL COUNCIL OF CALIFORNIA BUDGET SERVICES
Report to the Trial Court Budget Advisory Committee
(Action Item)
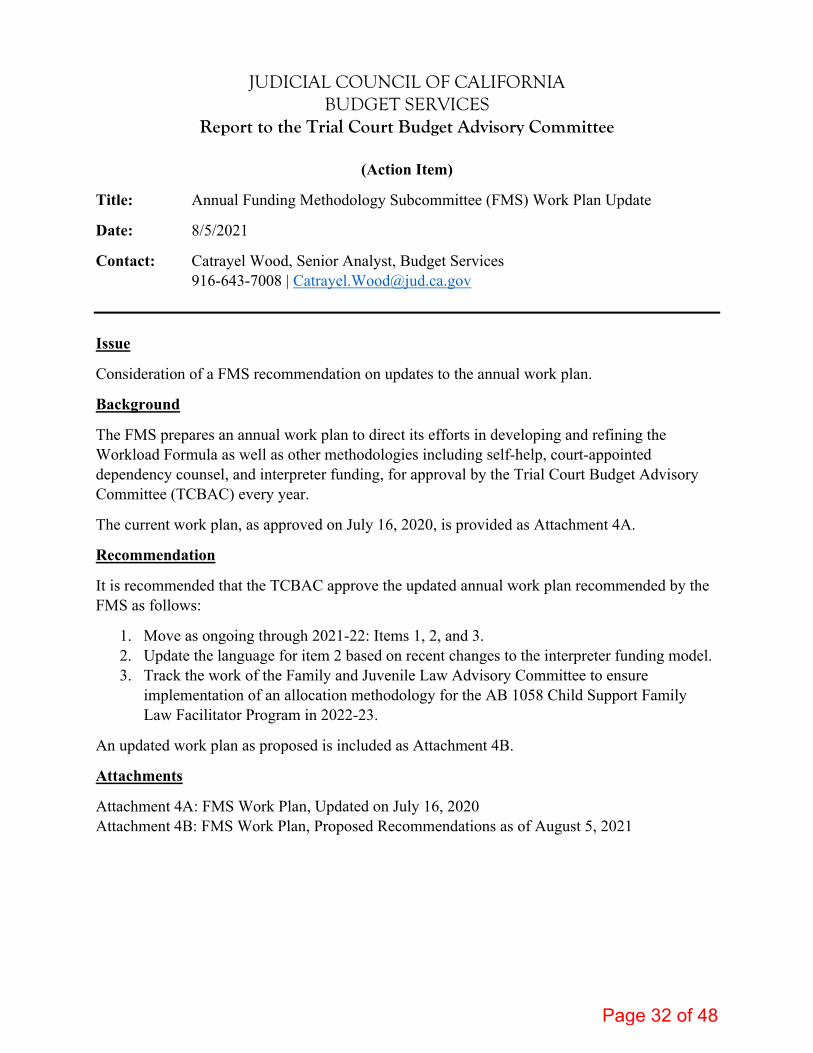
Title: Annual Funding Methodology Subcommittee (FMS) Work Plan Update
Date: 8/5/2021
Contact: Catrayel Wood, Senior Analyst, Budget Services 916-643-7008 | [email protected]
Issue
Consideration of a FMS recommendation on updates to the annual work plan.
Background
The FMS prepares an annual work plan to direct its efforts in developing and refining the Workload Formula as well as other methodologies including self-help, court-appointed dependency counsel, and interpreter funding, for approval by the Trial Court Budget Advisory Committee (TCBAC) every year.
The current work plan, as approved on July 16, 2020, is provided as Attachment 4A.
Recommendation
It is recommended that the TCBAC approve the updated annual work plan recommended by the FMS as follows:
1. Move as ongoing through 2021-22: Items 1, 2, and 3.2. Update the language for item 2 based on recent changes to the interpreter funding model.3. Track the work of the Family and Juvenile Law Advisory Committee to ensure
implementation of an allocation methodology for the AB 1058 Child Support FamilyLaw Facilitator Program in 2022-23.
An updated work plan as proposed is included as Attachment 4B.
Attachments
Attachment 4A: FMS Work Plan, Updated on July 16, 2020 Attachment 4B: FMS Work Plan, Proposed Recommendations as of August 5, 2021
Page 32 of 48

FUNDING METHODOLOGY SUBCOMMITTEE WORK PLAN As Approved by the Trial Court Budget Advisory Committee on July 16, 2020
Charge of the Funding Methodology Subcommittee Focus on the ongoing review and refinement of the Workload Formula, develop a methodology
for allocations from the Trial Court Trust Fund Court Interpreter Program (0150037) in the event of a funding shortfall, and consider funding allocation methodologies for other
non-discretionary dollars as necessary.
2020-21
1. Identify and evaluate the impact of Judicial Council-provided services versus those that arefunded by local trial court operations funds.
2. Develop a methodology for reimbursement of expenditures for the Court Interpreter Programin the event of a funding shortfall.
3. Initiate an ad hoc subcommittee to reevaluate the cluster system and floor funding.
Ongoing Through 2021-22
4. Track the work of the Family and Juvenile Law Advisory Committee to ensureimplementation of an allocation methodology for the AB 1058 Child Support Family LawFacilitator Program in 2022-23.
Annual Updates
5. Review the base funding floor amounts annually, if requested by the applicable courts, forpresentation to the TCBAC no later than December, to determine whether an inflationaryadjustment is needed.
Attachment 4A
Page 33 of 48

FUNDING METHODOLOGY SUBCOMMITTEE WORK PLAN Proposed Recommendations as of August 5, 2021
Charge of the Funding Methodology Subcommittee Focus on the ongoing review and refinement of the Workload Formula, develop a methodology
for allocations from the Trial Court Trust Fund Court Interpreter Program (0150037) in the event of a funding shortfall, and consider funding allocation methodologies for other
non-discretionary dollars as necessary.
Ongoing Through 2021-22
1. Identify and evaluate the impact of Judicial Council-provided services versus those that arefunded by local trial court operations funds.
2. Develop an ongoing, workload-based methodology for allocation of Court InterpreterProgram funding effective in 2022-23.
3. Initiate an ad hoc subcommittee to reevaluate the cluster system and floor funding.
4. Track the work of the Family and Juvenile Law Advisory Committee to ensureimplementation of an allocation methodology for the AB 1058 Child Support Family LawFacilitator Program in 2022-23.
Annual Updates
5. Review the base funding floor amounts annually, if requested by the applicable courts, forpresentation to the TCBAC no later than December, to determine whether an inflationaryadjustment is needed.
Attachment 4B
Page 34 of 48

JUDICIAL COUNCIL OF CALIFORNIA BUDGET SERVICES
Report to the Trial Court Budget Advisory Committee
(Information Only)
Title: Trial Court Executive Summary Display
Date: 8/5/2021
Contact: Oksana Tuk, Senior Analyst, Judicial Council Budget Services 916-643-8027 | [email protected]
Issue
Provide the updated single-court executive summary display for 2021-22 trial court allocations, including the Workload Formula.
Background
At its July 25, 2019 meeting, the Trial Court Budget Advisory Committee (TCBAC) approved a single-court executive summary display for each court that includes current allocation highlights, comparisons to prior year, and relevant statewide perspectives for reference.
The allocation information is updated each fiscal year based on funding changes included in the final budget and Judicial Council approved allocations. For 2021-22, the display includes, but is not limited to, each court’s share of $167.8 million in restoration funding, $72.7 million in new funding to address inflationary cost increases, $60 million in one-time funding for COVID-related caseload backlogs, as well as funding for pretrial services and court-appointed dependency counsel. The summary documents are preliminary until all allocations are approved by the council. The TCBAC allocation recommendations for the $60 million for COVID backlog and the pretrial funding, included in agenda Item 1 and Item 2, will be considered by the Judicial Branch Budget Committee at its August 13, 2021 meeting and the Judicial Council at its October 1, 2021 business meeting.
For illustrative purposes, three examples of the executive summary are provided and represent a large court (Alameda, Attachment A), a medium court (Monterey, Attachment B), and a small court (Yuba, Attachment C).
Allocation details for each court are available in the 2021-22 Trial Court Trust Fund and trial court allocations approved by the Judicial Council at its July 9, 2021 business meeting.1
1 Report to the Judicial Council: Trial Court Budget: Allocations from the Trial Court Trust Fund and Trial Court Allocations for Fiscal Year 2021-22 (Attachments B and C)
Page 35 of 48

JUDICIAL COUNCIL OF CALIFORNIA
BUDGET SERVICES Report to the Trial Court Budget Advisory Committee
Attachments
Attachment A: 2021-22 Allocation Summary for Alameda (large court) Attachment B: 2021-22 Allocation Summary for Monterey (medium court) Attachment C: 2021-22 Allocation Summary for Yuba (small court)
Page 36 of 48

Superior Court of California, County of Alameda 2021-22 Allocation Summary*
August 2021
Court Perspective Statewide Perspective
Prior Year 2020-21
Current Year 2021-22
Prior Year 2020-21
Current Year 2021-22
Workload Formula $88,487,371 $91,263,264 $2,626,768,921 $2,754,156,851
Workload Formula Allocation 74,075,309 82,853,797 1,950,625,393 2,215,166,791 Share of $168m Reduction/Restoration (6,685,811) 6,685,811 (167,831,000) 167,831,000 Share of $72.2m CPI Funding --- 2,740,781 --- 72,173,000 Workload Formula Local Revenues 3,912,553 2,934,872 104,343,805 93,416,548 Funding Floor Adjustment (2,946) 4,556 0 0
Percent of Workload Formula Funded 84% 91% 74% 80% Other Allocations 15,924,767 TBD 441,123,660 TBD
Total Allocation* $90,023,700 $TBD $2,388,749,053 $TBD
CIP Cpi MOE RAS SJO TCTF Court
Interpreters Program
Consumer price index
Maintenance of Effort
Resource Assessment
Study
Subordinate Judicial Officer
Trial Court Trust Fund
*Not inclusive of all allocations such as restricted funding, reimbursements, and local revenues.
Additional Court Information
2021-22 Workload Allocation Highlights 2021-22 Other Allocation Highlights
Self-Help $1,009,970 $60m COVID-Driven Backlog $TBD Benefit Cost Change Funding 527,836 Court Interpreters Program 5,371,012 Current Year Benefit Adjustment TBD Non-Sheriff Security Base 3,317,864 2% Automation Replacement 424,792 Subordinate Judicial Officers 2,233,064 Criminal Justice Realignment 181,356 Telephonic Appearances 0 Auto. Recordkeeping/Micrographics (2020-21) 93,225 TCTF Reduction for SJO Conversions 0
Court-Appointed Dependency Counsel
Court Statewide
2020-21 $3,422,591 $156,600,000
+ 100,000 Reserve $156,700,000 Total
2021-22 $3,348,652 $166,600,000 + 100,000 Reserve
$166,700,000 Total
Federal Title IV-E Reimbursement
2021-22
$30,000,000
Pretrial Funding
Court Statewide
2019-20 $14,359,400 $67,899,682 One-time
Funding is for pilot projects to implement, operate, or evaluate programs in at least 10 courts related to pretrial decision-making.
2021-22 $TBD $TBD One-time
+ TBD + TBD Ongoing$TBD $TBD Total
Funding is for courts to contract with probation departments or other county departments for the provision of pretrial monitoring and services.
Reserve Cap 3%
Page 37 of 48
Info 2 Attachment 2A

Superior Court of California, County of Monterey 2021-22 Allocation Summary*
August 2021
Court Perspective Statewide Perspective
Prior Year 2020-21
Current Year 2021-22
Prior Year 2020-21
Current Year 2021-22
Workload Formula $26,713,867 $27,857,633 $2,626,768,921 $2,754,156,851
Workload Formula Allocation 20,188,513 23,012,580 1,950,625,393 2,215,166,791 Share of $168m Reduction/Restoration (1,751,272) 1,751,272 (167,831,000) 167,831,000 Share of $72.2m CPI Funding --- 746,974 --- 72,173,000 Workload Formula Local Revenues 1,240,004 1,140,343 104,343,805 93,416,548 Funding Floor Adjustment (803) 1,266 0 0
Percent of Workload Formula Funded 76% 83% 74% 80% Other Allocations 4,175,195 TBD 441,123,660 TBD
Total Allocation* $30,889,062 $TBD $2,388,749,053 $TBD
CIP Cpi MOE RAS SJO TCTF Court
Interpreters Program
Consumer price index
Maintenance of Effort
Resource Assessment
Study
Subordinate Judicial Officer
Trial Court Trust Fund
*Not inclusive of all allocations such as restricted funding, reimbursements, and local revenues.
Additional Court Information
2021-22 Workload Allocation Highlights 2021-22 Other Allocation Highlights
Self-Help $293,559 $60m COVID-Driven Backlog $TBD Benefit Cost Change Funding 413,524 Court Interpreters Program 5,371,012 Current Year Benefit Adjustment TBD Non-Sheriff Security Base 908,310 2% Automation Replacement 183,464 Subordinate Judicial Officers 345,025 Criminal Justice Realignment 44,540 Telephonic Appearances 0 Auto. Recordkeeping/Micrographics (2020-21) 21,708 TCTF Reduction for SJO Conversions 0
Court-Appointed Dependency Counsel
Court Statewide
2020-21 $797,204 $156,600,000
+ 100,000 Reserve $156,700,000 Total
2021-22 $738,059 $166,600,000 + 100,000 Reserve
$166,700,000 Total
Federal Title IV-E Reimbursement
2021-22
$30,000,000
Pretrial Funding
Court Statewide
2019-20 $0 $67,899,682 One-time
Funding is for pilot projects to implement, operate, or evaluate programs in at least 10 courts related to pretrial decision-making.
2021-22 $TBD $TBD One-time
+ TBD + TBD Ongoing$TBD $TBD Total
Funding is for courts to contract with probation departments or other county departments for the provision of pretrial monitoring and services.
Reserve Cap 3%
Page 38 of 48
Info 2 Attachment 2B
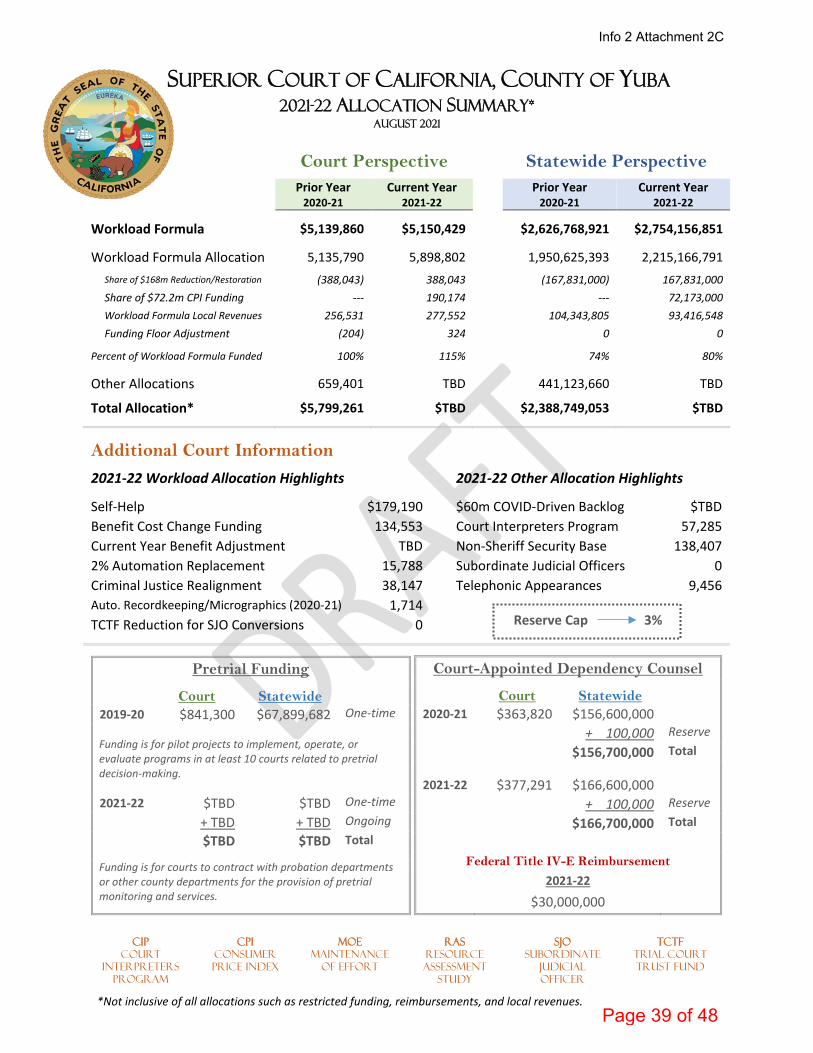
Superior Court of California, County of Yuba 2021-22 Allocation Summary*
August 2021
Court Perspective Statewide Perspective
Prior Year 2020-21
Current Year 2021-22
Prior Year 2020-21
Current Year 2021-22
Workload Formula $5,139,860 $5,150,429 $2,626,768,921 $2,754,156,851
Workload Formula Allocation 5,135,790 5,898,802 1,950,625,393 2,215,166,791 Share of $168m Reduction/Restoration (388,043) 388,043 (167,831,000) 167,831,000 Share of $72.2m CPI Funding --- 190,174 --- 72,173,000 Workload Formula Local Revenues 256,531 277,552 104,343,805 93,416,548 Funding Floor Adjustment (204) 324 0 0
Percent of Workload Formula Funded 100% 115% 74% 80% Other Allocations 659,401 TBD 441,123,660 TBD
Total Allocation* $5,799,261 $TBD $2,388,749,053 $TBD
CIP Cpi MOE RAS SJO TCTF Court
Interpreters Program
Consumer price index
Maintenance of Effort
Resource Assessment
Study
Subordinate Judicial Officer
Trial Court Trust Fund
*Not inclusive of all allocations such as restricted funding, reimbursements, and local revenues.
Additional Court Information
2021-22 Workload Allocation Highlights 2021-22 Other Allocation Highlights
Self-Help $179,190 $60m COVID-Driven Backlog $TBD Benefit Cost Change Funding 134,553 Court Interpreters Program 57,285 Current Year Benefit Adjustment TBD Non-Sheriff Security Base 138,407 2% Automation Replacement 15,788 Subordinate Judicial Officers 0 Criminal Justice Realignment 38,147 Telephonic Appearances 9,456 Auto. Recordkeeping/Micrographics (2020-21) 1,714 TCTF Reduction for SJO Conversions 0
Court-Appointed Dependency Counsel
Court Statewide
2020-21 $363,820 $156,600,000
+ 100,000 Reserve $156,700,000 Total
2021-22 $377,291 $166,600,000 + 100,000 Reserve
$166,700,000 Total
Federal Title IV-E Reimbursement
2021-22
$30,000,000
Pretrial Funding
Court Statewide
2019-20 $841,300 $67,899,682 One-time
Funding is for pilot projects to implement, operate, or evaluate programs in at least 10 courts related to pretrial decision-making.
2021-22 $TBD $TBD One-time
+ TBD + TBD Ongoing$TBD $TBD Total
Funding is for courts to contract with probation departments or other county departments for the provision of pretrial monitoring and services.
Reserve Cap 3%
Page 39 of 48
Info 2 Attachment 2C

JUDICIAL COUNCIL OF CALIFORNIA BUDGET SERVICES
Report to the Trial Court Budget Advisory Committee
(Information Only)
Title: Trial Court Trust Fund (TCTF) Funds Held on Behalf Expenditure Reporting
Date: 8/5/2021
Contact: Catrayel Wood, Senior Analyst, Judicial Council Budget Services 916-643-7008 | [email protected]
Issue
Upon completion of TCTF Funds Held on Behalf (FHOB) projects or planned expenditures, courts are required to report to the Trial Court Budget Advisory Committee (TCBAC) within 90 days on the project or planned expenditure and how the funds were expended.
Background
Government Code section 68502.5(c)(2)(A) requires the Judicial Council, when setting the allocations for trial courts, to set a preliminary allocation in July of each fiscal year. In January of each fiscal year, after review of available trial court reserves as of June 30 of the prior fiscal year, the Judicial Council is required to finalize allocations and each court's final allocation is offset by the amount of reserves that exceed the amount authorized to be carried over pursuant to Government Code section 77203(b). Under this section, a trial court may, beginning June 30, 2014 and concluding June 30, 2019, carryover unexpended funds in an amount not to exceed 1 percent of the court’s operating budget from the prior fiscal year. Effective June 30, 2020, the carryover amount increased to 3 percent.
At its business meeting on July 29, 2014, the Judicial Council, approved an annual process beginning in 2015-16 for courts to provide preliminary and final computations of the portion of their ending fund balance that is subject to the 1 percent cap.
At its business meeting on April 15, 2016, the Judicial Council adopted a process, criteria, and procedures for trial courts to request that TCTF-reduced allocations related to the 1 percent fund balance cap be retained in the TCTF as restricted fund balance for the benefit of those courts that make the request. The FHOB process is intended only for expenditures that cannot be funded by a court’s annual budget or three-year encumbrance term and that require multiyear savings to implement. The process also requires reporting on the use of the funds.
The Judicial Council adopted revisions to the policy, including streamlining the submission schedule, making a change to the recipient of the request, and providing language corrections to better align with court year-end closing, trial court allocation offsets, and requests to amend previously reviewed requests at its business meeting on January 17, 2020 (see Attachment A).
Judicial Council Budget Services staff submitted its initial expenditure report to the TCBAC at
Page 40 of 48

JUDICIAL COUNCIL OF CALIFORNIA BUDGET SERVICES
Report to the Trial Court Budget Advisory Committee
its July 25, 2019 meeting and established quarterly reporting on the status of FHOB projects or planned expenditures from those courts that indicate completion. Report of Status In July 2021, Budget Services staff requested a status on projects or planned expenditures from those courts that indicated completion through July 22, 2021:
Court Council
Approval Date
Project or Planned
Expenditure
Completion Date
Approved FHOB
Expended FHOB
Unspent FHOB
Returning to TCTF
Alameda 11/13/20 Tenant improvement projects
05/28/21 $483,830 $482,095 $1,735
Mendocino 09/24/19 Case Management System 07/01/21 $777,000 $777,000 $0
Solano 11/13/20 Audio and visual systems 05/31/21 $358,767 $358,767 $0
$1,619,597 $1,617,862 $1,735 Attachments Attachment A: Summary of Recommended Process, Criteria, and Required Information
for Trial Court Trust Fund Fund Balance Held on Behalf of the Courts Attachment B: Funds Held on Behalf of the Court Project Completion Reporting
Page 41 of 48

of Recommended Process, Criteria, and Required Information for 1 SummaryTrial Court Trust Fund Fund Balance Held on Behalf of the Courts
Recommended Process for Trial Court Trust Fund Fund Balance Held on Behalf of the Courts
1. Trial Court Trust Fund fund balance will be held on behalf of trial courts only forexpenditures or projects that cannot be funded by a court’s annual budget or three-yearencumbrance term and that require multiyear savings to implement.a. Categories or activities include, but are not limited to:
i) Projects that extend beyond the original planned three-year term process such asexpenses related to the delayed opening of new facilities or delayed deployment ofnew information systems;
ii) Technology improvements or infrastructure such as installing a local data center, datacenter equipment replacement, case management system deployment, converting to aVoIP telephone system, desktop computer replacement, and replacement of backupemergency power systems;
iii) Facilities maintenance and repair allowed under rule 10.810 of the California Rules ofCourt such as flooring replacement and renovation as well as professional facilitiesmaintenance equipment;
iv) Court efficiencies projects such as online and smart forms for court users and RFIDsystems for tracking case files; and
v) Other court infrastructure projects such as vehicle replacement and copy machinereplacement.
2. The submission, review, and approval process is as follows:a. All requests will be submitted to the Judicial Council for consideration.b. Requests will be submitted to the director of Budget Services by the court’s presiding
judge or court executive officer.c. Budget Services staff will review the request, ask the court to provide any missing or
incomplete information, draft a preliminary report, share the preliminary report with thecourt for its comments, revise as necessary, and issue the report to the Fiscal PlanningSubcommittee of the Trial Court Budget Advisory Committee (TCBAC); thesubcommittee will meet to review the request, hear any presentation of the courtrepresentative, and ask questions of the representative if one participates on behalf of thecourt; and Budget Services office staff will issue a final report on behalf of thesubcommittee for the council.
d. The final report to the subcommittee and the Judicial Council will be provided to therequesting court before the report is made publicly available on the California Courtswebsite.
e. The court may send a representative to the subcommittee and Judicial Council meetingsto present its request and respond to questions.
IInfo 3 3Attachment 3A
Page 42 of 48

3. To be considered at a scheduled Judicial Council business meeting, requests must besubmitted to the director of Budget Services at least 40 business days (approximatelyeight weeks) before that business meeting.
4. The Judicial Council may consider including appropriate terms and conditions that courtsmust accept for the council to approve designating TCTF fund balance on the court’s behalf.a. Failure to comply with the terms and conditions would result in the immediate change in
the designation of the related TCTF fund balance from restricted to unrestricted and nolonger held on behalf of the court unless the council specifies an alternative action.
5. Approved requests that courts subsequently determine need to be revised to reflect a change(1) in the amounts by year to be distributed to the court for the planned annual expendituresand/or encumbrances, (2) in the total amount of the planned expenditures, or (3) of more than10 percent of the total request among the categories of expense will need to be amended andresubmitted following the submission, review, and approval process discussed in 1–3 above.a. Denied revised requests will result in the immediate change in the designation of the
related TCTF fund balance from restricted to unrestricted and no longer held on behalf ofthe court unless the council specifies an alternative action.
6. Approved requests that courts subsequently determine have a change in purpose will need tobe amended and resubmitted following the submission, review, and approval processdiscussed in 1–3 above, along with a request that the TCTF funds held on behalf of the courtfor the previously approved request continue to be held on behalf of the court for this newpurpose.a. Denied new requests tied to previously approved requests will result in the immediate
change in the designation of the related TCTF fund balance from restricted to unrestrictedand no longer held on behalf of the court unless the council specifies an alternativeaction.
7. On completion of the project or planned expenditure, courts are required to report to the TrialCourt Budget Advisory Committee within 90 days on the project or planned expenditure andhow the funds were expended.
8. As part of the courts’ audits in the scope of the normal audit cycle, a review of any funds thatwere held on behalf of the courts will be made to confirm that they were used for their statedapproved purpose.
Page 43 of 48

Recommended Criteria for Eligibility for TCTF Fund Balance Held on Behalf of the Courts TCTF fund balance will be held on behalf of the trial courts only for expenditures or projects that cannot be funded by the court’s annual budget or three-year encumbrance term and that require multiyear savings to implement.
Recommended Information Required to Be Provided by Trial Courts for TCTF Fund Balance Held on Behalf of the Courts Below is the information required to be provided by trial courts on the Application for TCTF Funds Held on Behalf of the Court:
SECTION I General Information • Superior court• Date of submission• Person authorizing the request• Contact person and contact information• Time period covered by the request (includes contribution and expenditure)• Requested amount• A description providing a brief summary of the request
SECTION II Amended Request Changes • Sections and answers amended• A summary of changes to request
SECTION III Trial Court Operations and Access to Justice • An explanation as to why the request does not fit within the court’s annual operational
budget process and the three-year encumbrance term• A description of how the request will enhance the efficiency and/or effectiveness of court
operations, and/or increase the availability of court services and programs• If a cost efficiency, cost comparison (table template provided)• A description of the consequences to the court’s operations if the court request is not
approved• A description of the consequences to the public and access to justice if the court request is
not approved• The alternatives that the court has identified if the request is not approved, and the reason
why holding funding in the TCTF is the preferred alternative
Page 44 of 48
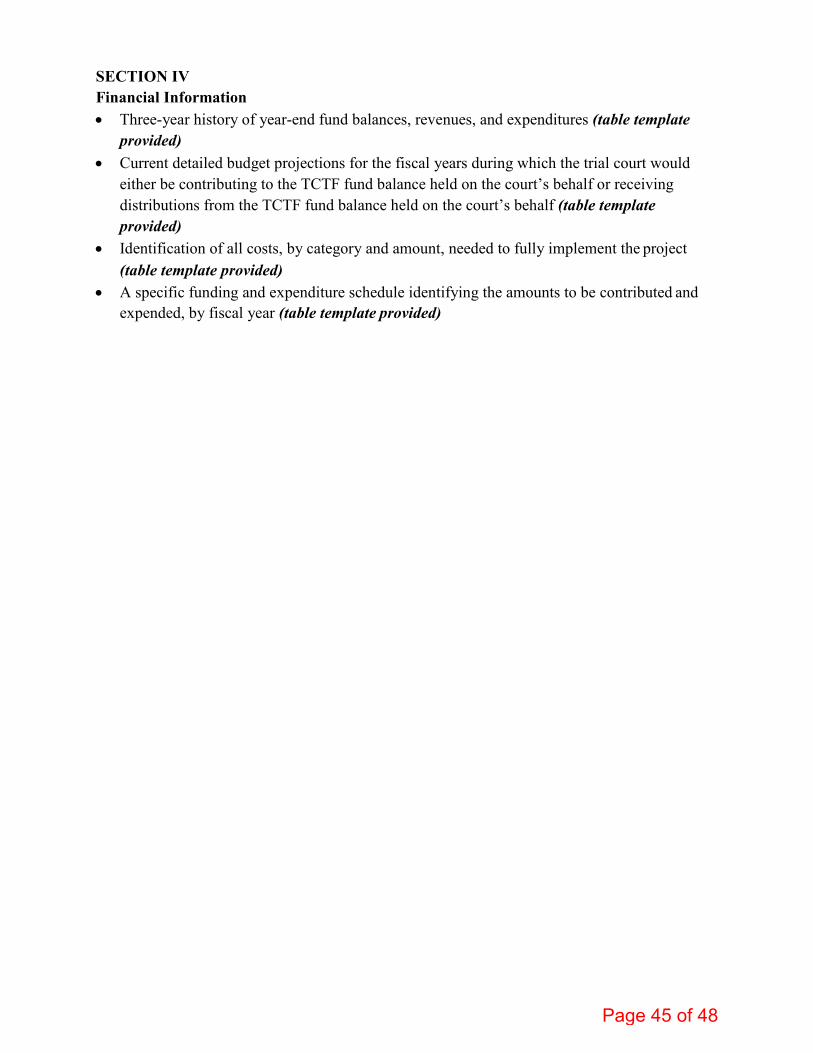
SECTION IV Financial Information • Three-year history of year-end fund balances, revenues, and expenditures (table template
provided)• Current detailed budget projections for the fiscal years during which the trial court would
either be contributing to the TCTF fund balance held on the court’s behalf or receivingdistributions from the TCTF fund balance held on the court’s behalf (table templateprovided)
• Identification of all costs, by category and amount, needed to fully implement the project(table template provided)
• A specific funding and expenditure schedule identifying the amounts to be contributed andexpended, by fiscal year (table template provided)
Page 45 of 48

Page 46 of 48
Info 3 Attachment 3B

Page 1 of 2
FUNDS HELD ON BEHALF OF THE COURT PROJECT COMPLETION REPORTING
REQUEST NUMBER: 23-2018-1
SECTION I: GENERAL INFORMATION SUPERIOR COURT: Mendocino
JC APPROVED DATE: 9/24/2019
JC APPROVED AMOUNT: $777,000
REASON PROVIDED ON APPLICATION:
The court plans to replace its sub-standard case management system (CMS) with a new CMS that includes functionality that will enable e-filing and will facilitate the court’s transition to paperless files and business processes that use modern workflow technology. In order for this to occur, the court must first upgrade and stabilize its network and Wi-Fi capabilities, including replacement of some routing and switching equipment and implementation of greater external bandwidth. The court must also upgrade hardware at each user desktop to ensure adequate responsiveness and speed for data transmission.
Accordingly the request for the Judicial Council to hold funds on behalf of the court will be for these three discrete projects: 1) analyze, upgrade and stabilize network and Wi-Fi technology, including stress testing and load balancing; 2) replace hardware devices to optimize performance for each court user; and 3) purchase and install a newCalifornia-certified CMS with e-filing capabilities, workflow functionality and fully developed interfaces to externaljustice partners.SECTION II: PROJECT STATUS OF COMPLETION (TO BE COMPLETED BY COURT)
PROJECT COMPLETE
Per Judicial Council policy, “On completion of the project or planned expenditure, courts are required to report to the Trial Court Budget Advisory Committee within 90 days on the project or planned expenditure and how the funds were expended.”
PLEASE PROVIDE A DESCRIPTION OF HOW THE FUNDS WERE EXPENDED:
All funds were expended on completion of Odyssey case management system. Funds were used to pay Tyler Technologies for the new system.
TOTAL COST OF PROJECT OR PLANNED EXPENDITURE: $777,000
COMPLETION DATE OF PROJECT: 7/1/2021
PROJECT NOT COMPLETED
PLEASE PROVIDE A PROGRESS REPORT:
ESTIMATED DATE OF COMPLETION: Click here to enter a date.
CONTACT PERSON AND CONTACT INFO: Kim Turner, [email protected]
PERSON AUTHORIZING REQUEST (Presiding Judge or Court Executive Officer): Kim Turner, CEO
Page 47 of 48

Page 1 of 1
FUNDS HELD ON BEHALF OF THE COURT PROJECT COMPLETION REPORTING
REQUEST NUMBER: 48-2019-1
SECTION I: GENERAL INFORMATION SUPERIOR COURT: Solano
JC APPROVED DATE: 11/13/2020
JC APPROVED AMOUNT: $358,767
REASON PROVIDED ON APPLICATION:
The Court is in need of replacing audio and visual systems in almost all courtrooms in three courthouses – the Hall of Justice, Law and Justice Center and Vallejo Courthouse. The court needs to bring many systems up to current JC A/V standards. The total number of courtrooms needing replacement is 23. The court’s current systems are outdated and do not function for a modern courtroom setting. Many of the systems are over 25 years old. The inadequacy of the equipment became very apparent with the COVID-19 pandemic and the need to switch very quickly to remote operations. Many courtroom A/V systems were not compatible with modern technology, which limited the court’s ability to quickly shift to virtual court proceedings. The court hired a consultant from the Judicial Council’s MSA list for a full evaluation of an A/V replacement. The consultant’s evaluation was used to obtain bids and is available if needed for this request.
.
SECTION II: PROJECT STATUS OF COMPLETION (TO BE COMPLETED BY COURT)
PROJECT COMPLETE
Per Judicial Council policy, “On completion of the project or planned expenditure, courts are required to report to the Trial Court Budget Advisory Committee within 90 days on the project or planned expenditure and how the funds were expended.”
PLEASE PROVIDE A DESCRIPTION OF HOW THE FUNDS WERE EXPENDED: AV Audiovisual Systems in nine (9) courtrooms.
TOTAL COST OF PROJECT OR PLANNED EXPENDITURE: $358,767
COMPLETION DATE OF PROJECT: 5/31/2021
PROJECT NOT COMPLETED
PLEASE PROVIDE A PROGRESS REPORT:
ESTIMATED DATE OF COMPLETION: Click here to enter a date.
CONTACT PERSON AND CONTACT INFO: Agnes shappy, Chief Financial Officer [email protected]
PERSON AUTHORIZING REQUEST (Presiding Judge or Court Executive Officer):
BRIAN TAYLOR, COURT EXECUTIVE OFFICER
Page 48 of 48