Embed Size (px)
Citation preview

Machine Learning & AIin Transport and Logistics
Frank Salliau & Sven Verstrepen
Logistics Meets InnovationVlerick Brussels – Nov. 15th 2017

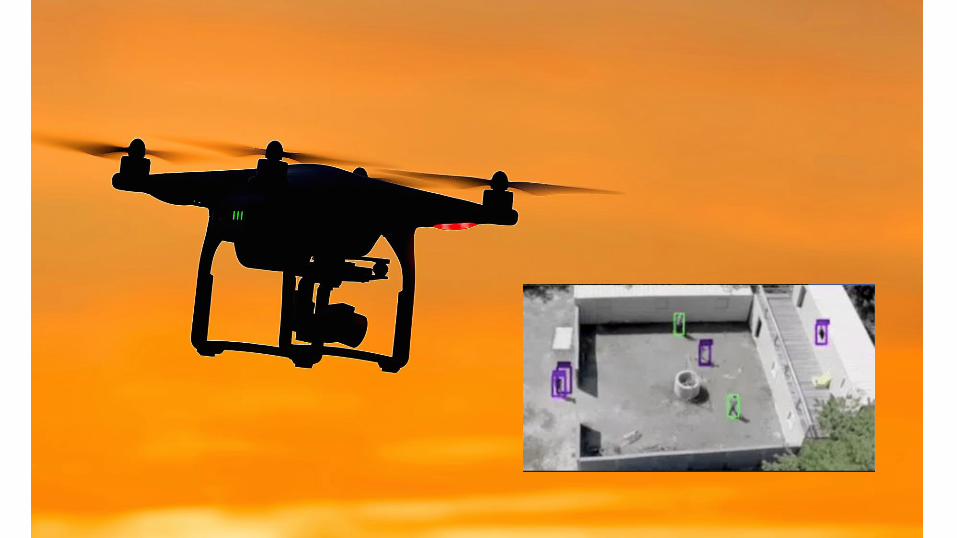
Sci-fi in 2002


Reality in 2017

Sci-fi in 1984
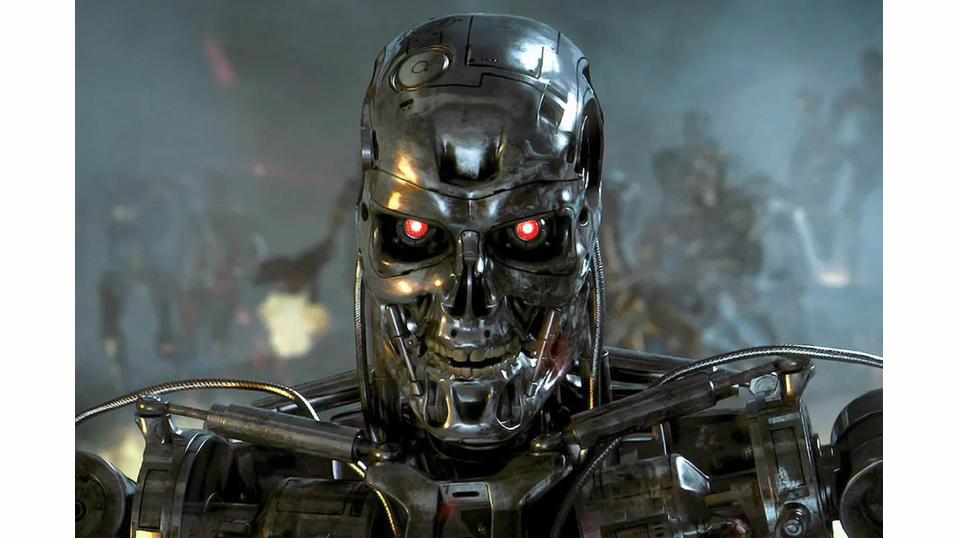

Reality in 2017


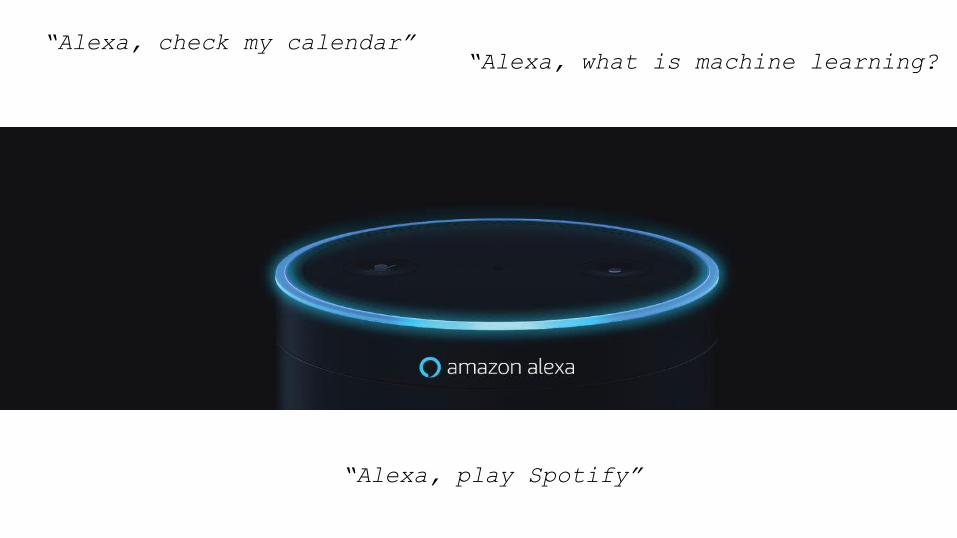
“Alexa, check my calendar”“Alexa, what is machine learning?
“Alexa, play Spotify”


What is it all about?

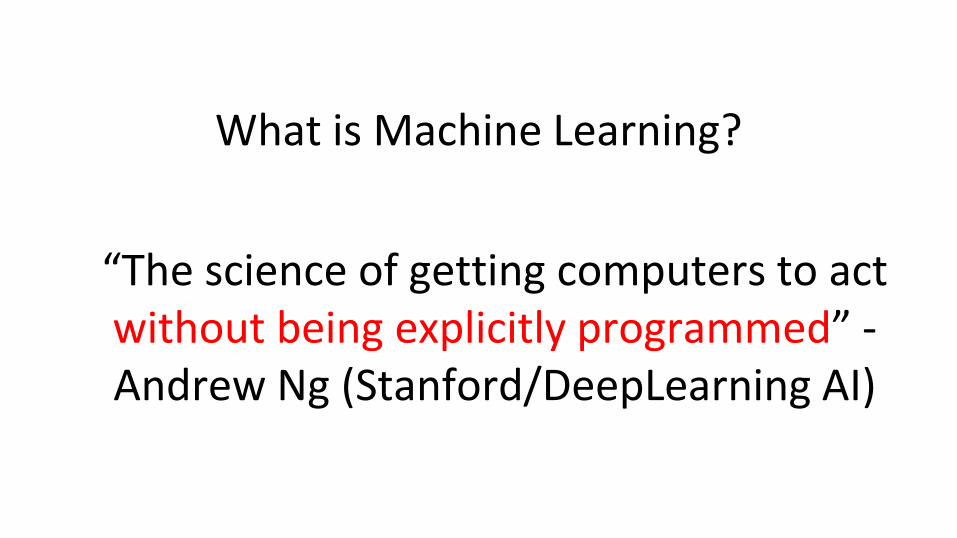
What is Machine Learning?
“The science of getting computers to act without being explicitly programmed” -Andrew Ng (Stanford/DeepLearning AI)
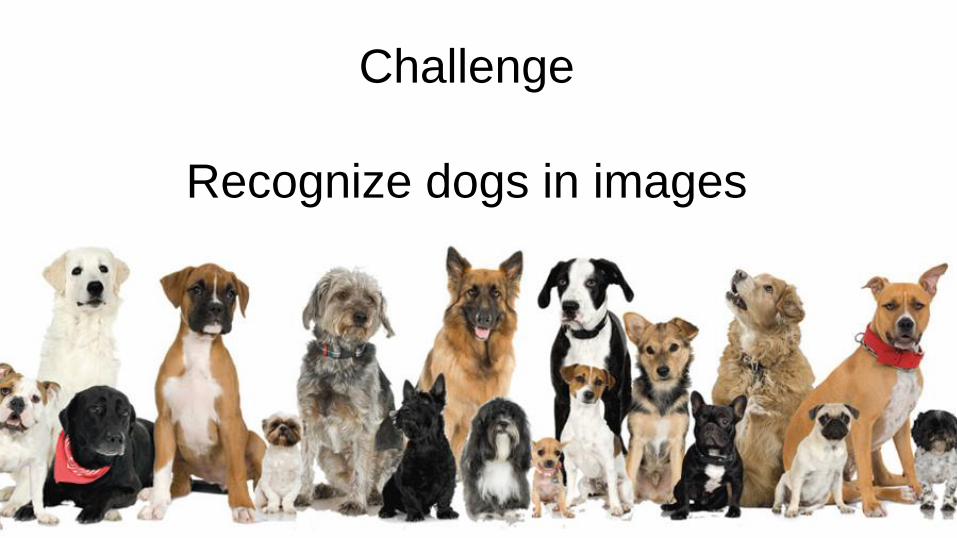
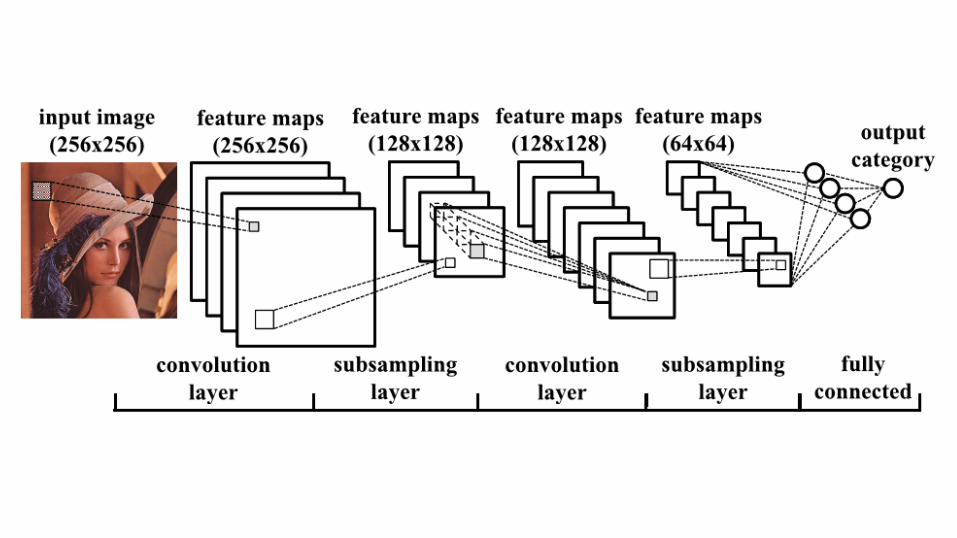
Challenge
Recognize dogs in images
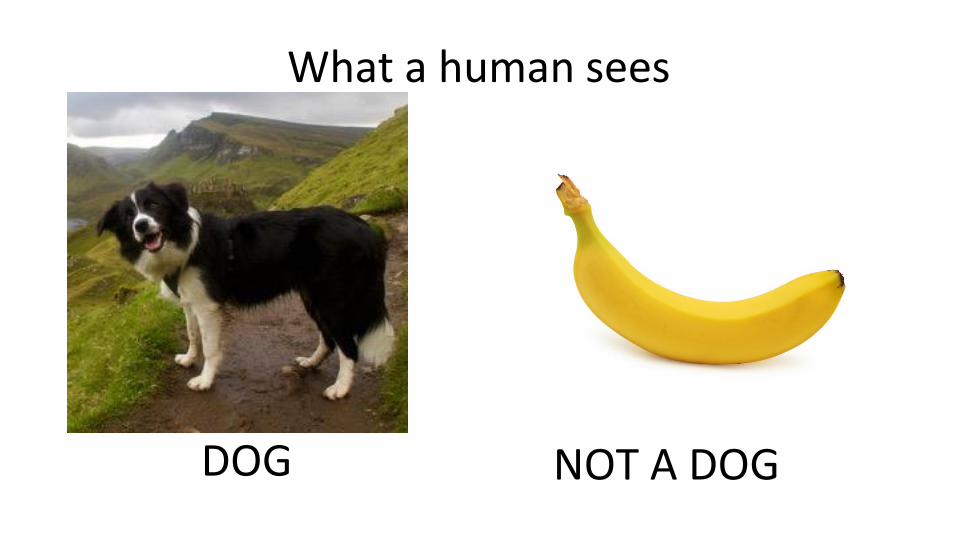
What a human sees
DOG NOT A DOG
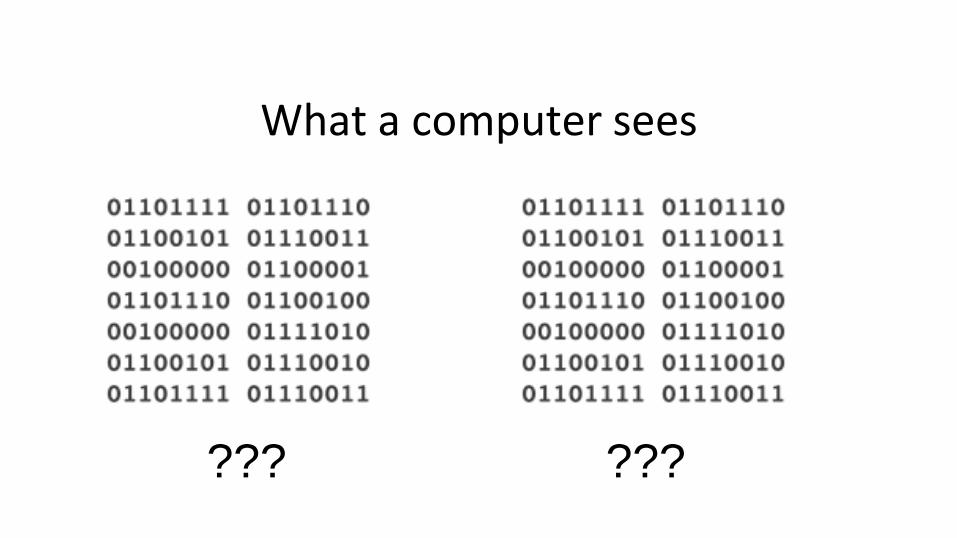
What a computer sees
??? ???
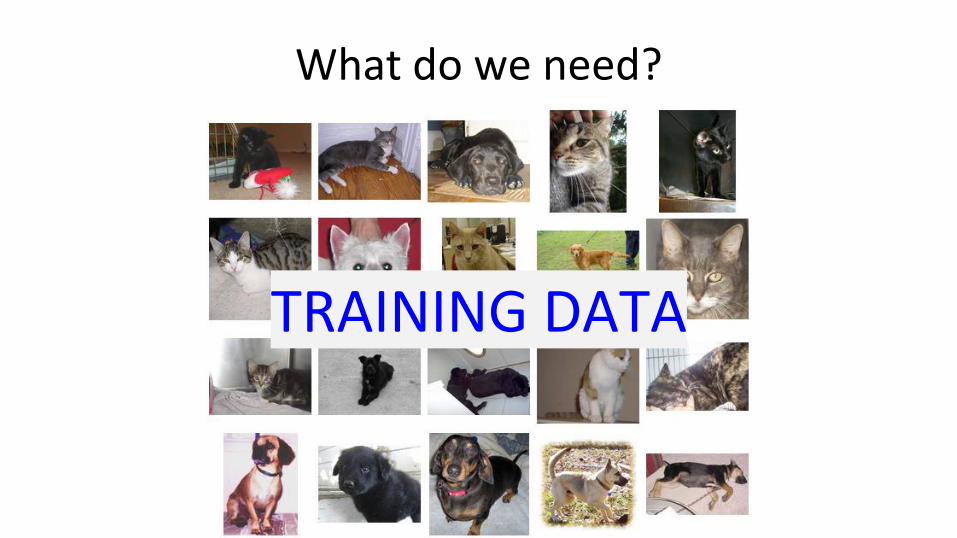
What do we need?
TRAINING DATA

Labeled training set (dog/not dog)> 1000 images
Untrained Neural Network
Training phase
DOG (1)
NOT DOG (0)
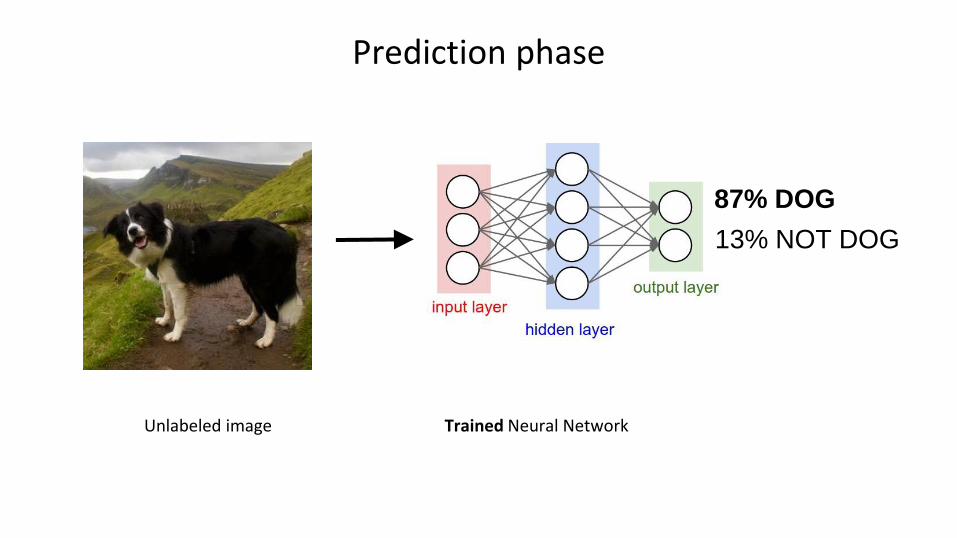
Unlabeled image Trained Neural Network
Prediction phase
87% DOG
13% NOT DOG

Why is this booming now?


What are the drivers?

(BIG) DATA

Byte
Byte : one grain of rice
Credits: David Wellman, http://www.slideshare.net/dwellman/what-is-big-data-24401517

Kilobyte
Byte : one grain of rice
Kilobyte : cup of rice

Megabyte
Byte : one grain of rice
Kilobyte : cup of rice
Megabyte : 8 bags of rice

Gigabyte
Byte : one grain of rice
Kilobyte : cup of rice
Megabyte : 8 bags of rice
Gigabyte : 3 Semi trucks

Terabyte
Byte : one grain of rice
Kilobyte : cup of rice
Megabyte : 8 bags of rice
Gigabyte : 3 Semi trucks
Terabyte : 2 Container Ships
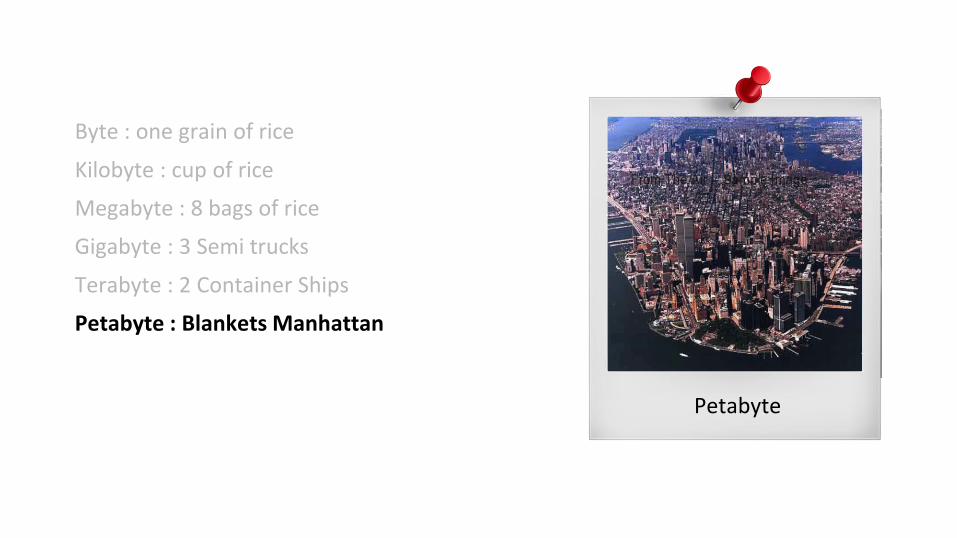
Petabyte
Byte : one grain of rice
Kilobyte : cup of rice
Megabyte : 8 bags of rice
Gigabyte : 3 Semi trucks
Terabyte : 2 Container Ships
Petabyte : Blankets Manhattan

One Byte Exabyte
Byte : one grain of rice
Kilobyte : cup of rice
Megabyte : 8 bags of rice
Gigabyte : 3 Semi trucks
Terabyte : 2 Container Ships
Petabyte : Blankets Manhattan
Exabyte : Blankets west coast states
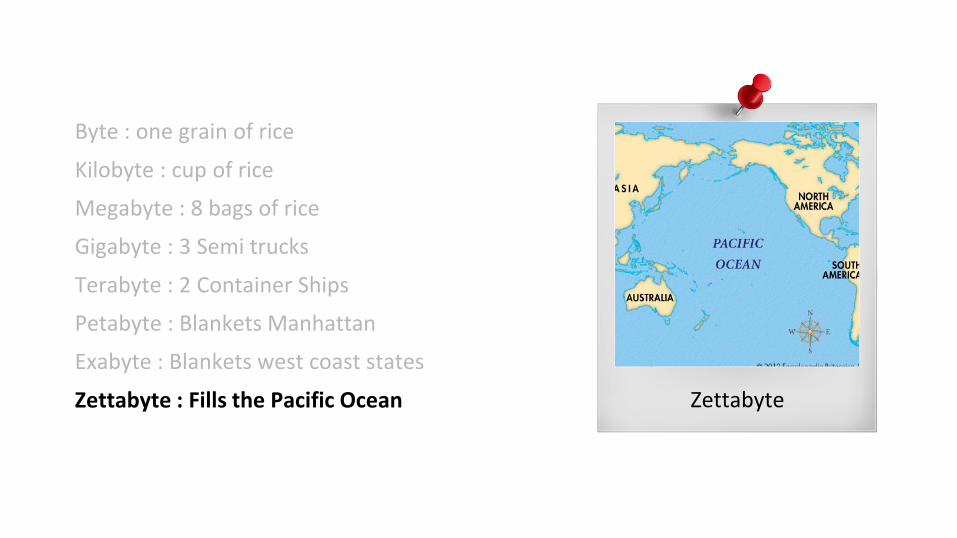
Byte : one grain of rice
Kilobyte : cup of rice
Megabyte : 8 bags of rice
Gigabyte : 3 Semi trucks
Terabyte : 2 Container Ships
Petabyte : Blankets Manhattan
Exabyte : Blankets west coast states
Zettabyte : Fills the Pacific Ocean Zettabyte
Byte : one grain of rice
Kilobyte : cup of rice
Megabyte : 8 bags of rice
Gigabyte : 3 Semi trucks
Terabyte : 2 Container Ships
Petabyte : Blankets Manhattan
Exabyte : Blankets west coast states
Zettabyte : Fills the Pacific Ocean
Yottabyte : A EARTH SIZE RICE BALL!
Yottabyte

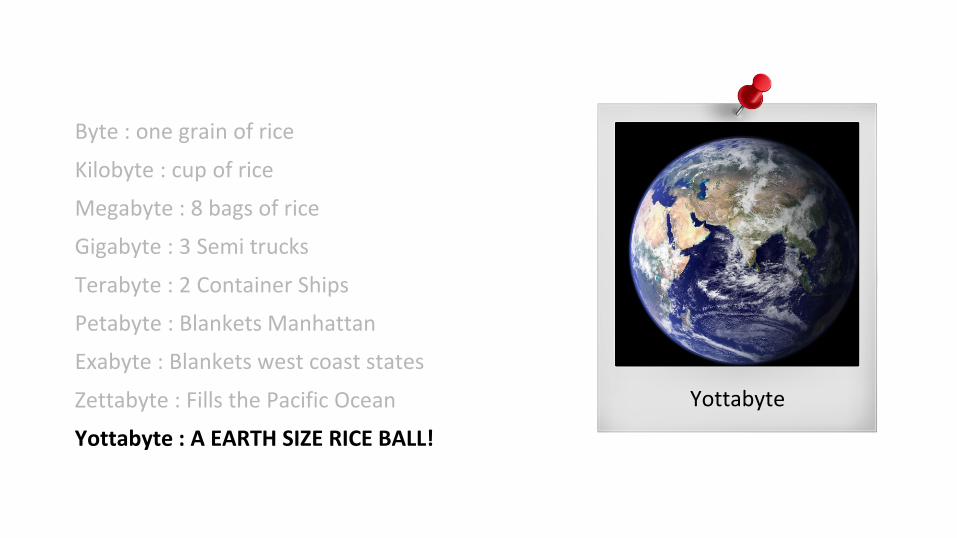
Byte : one grain of rice
Kilobyte : cup of rice
Megabyte : 8 bags of rice
Gigabyte : 3 Semi trucks
Terabyte : 2 Container Ships
Petabyte : Blankets Manhattan
Exabyte : Blankets west coast states
Zettabyte : Fills the Pacific Ocean
Yottabyte : A EARTH SIZE RICE BALL!
Hobbyist
Desktop
Internet
Big Data
The Future
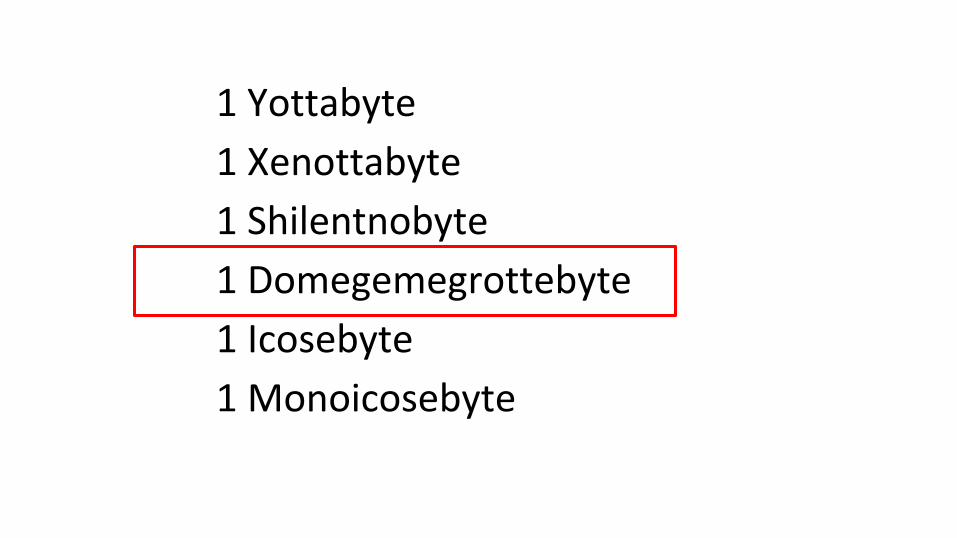
1 Yottabyte
1 Xenottabyte
1 Shilentnobyte
1 Domegemegrottebyte
1 Icosebyte
1 Monoicosebyte

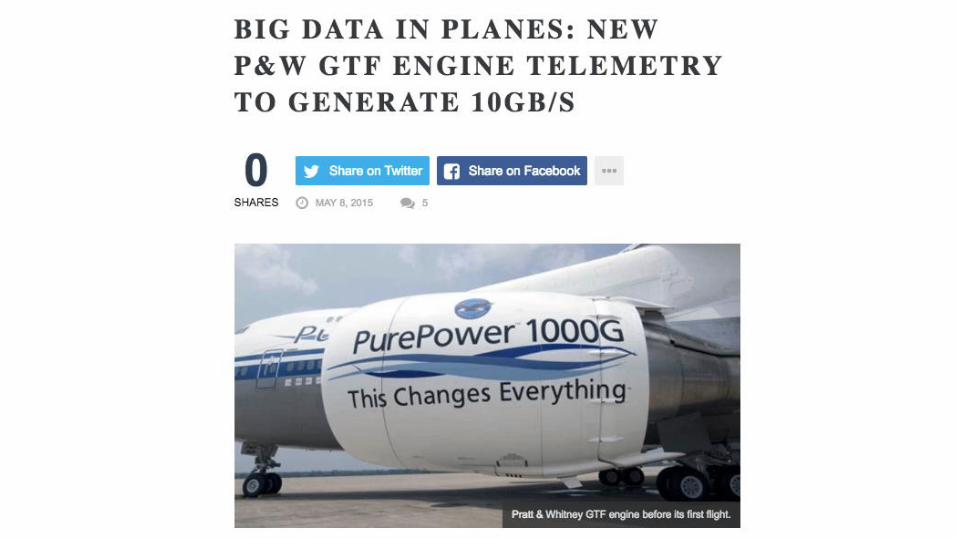
Where does all this data come from?

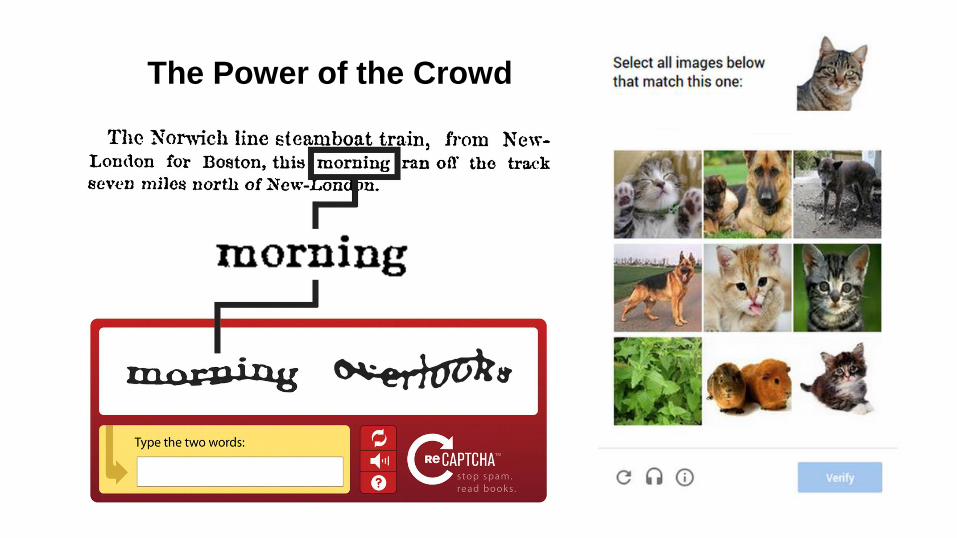
The Power of the Crowd


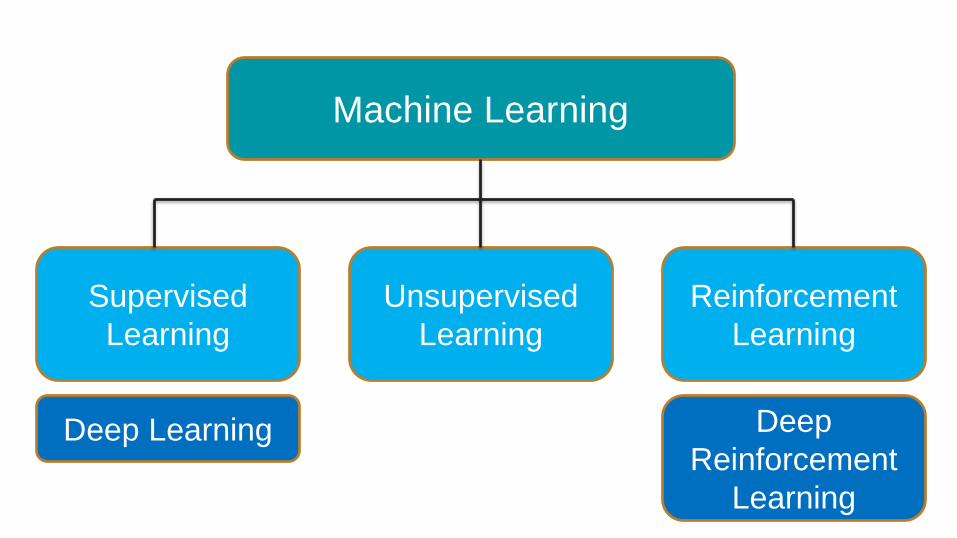
Machine Learning
Supervised
Learning
Unsupervised
Learning
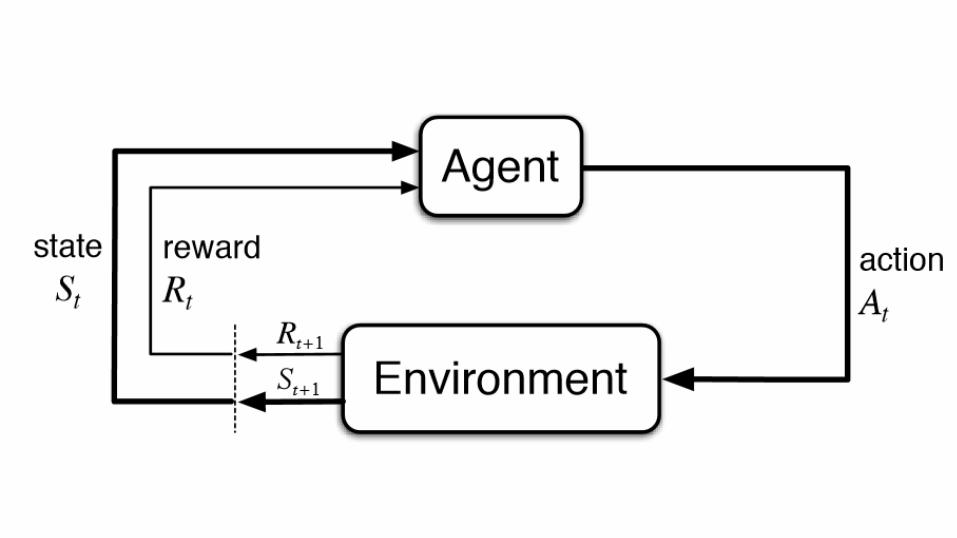
Reinforcement
Learning
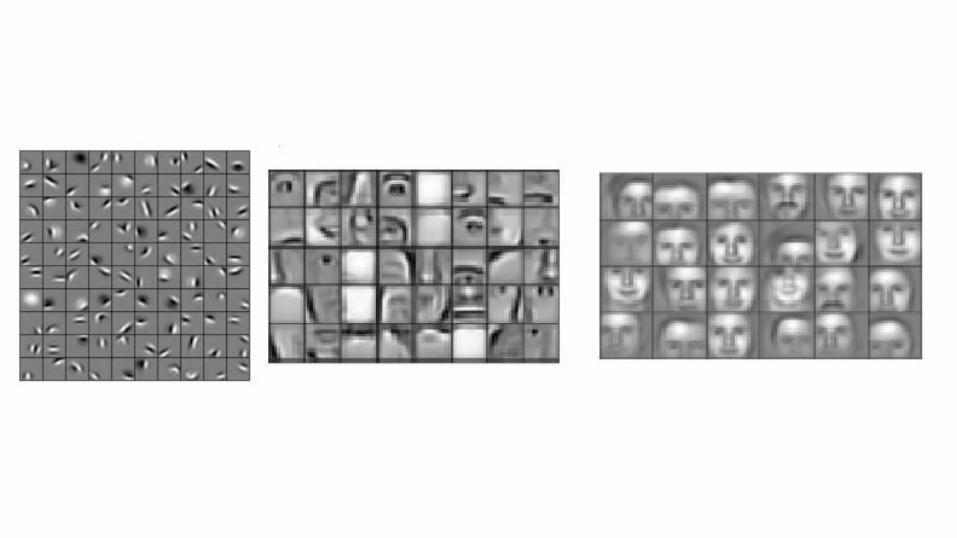
Deep Learning Deep
Reinforcement
Learning

Supervised Learning

Regression
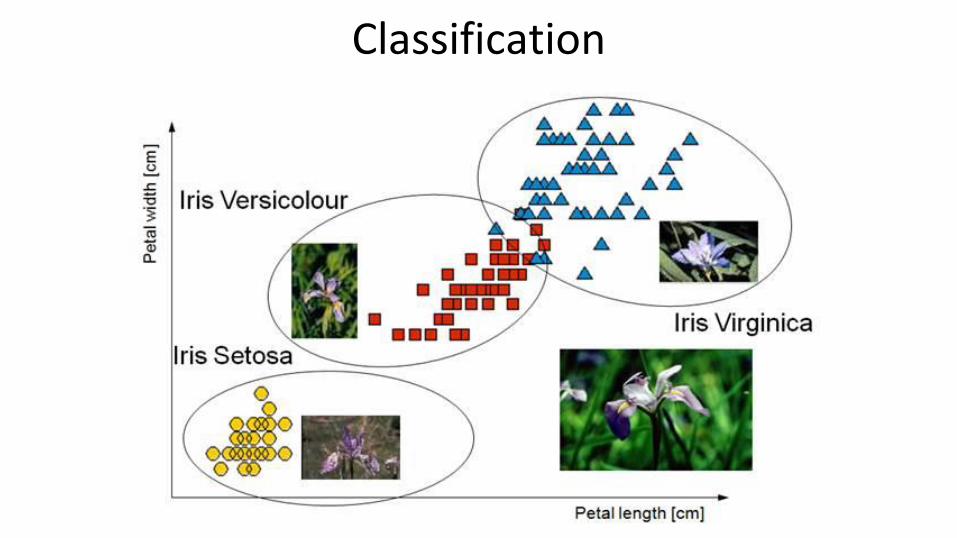
Classification

Deep Learning
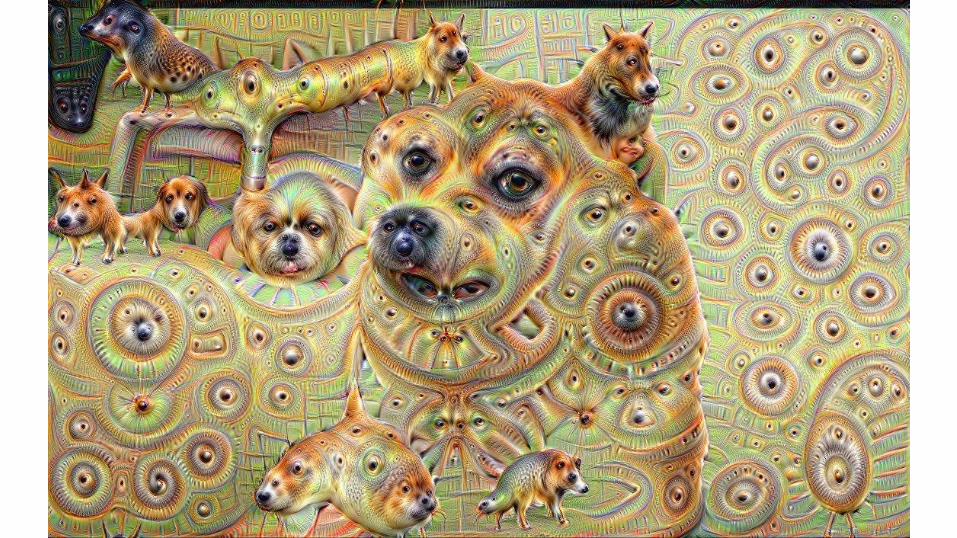
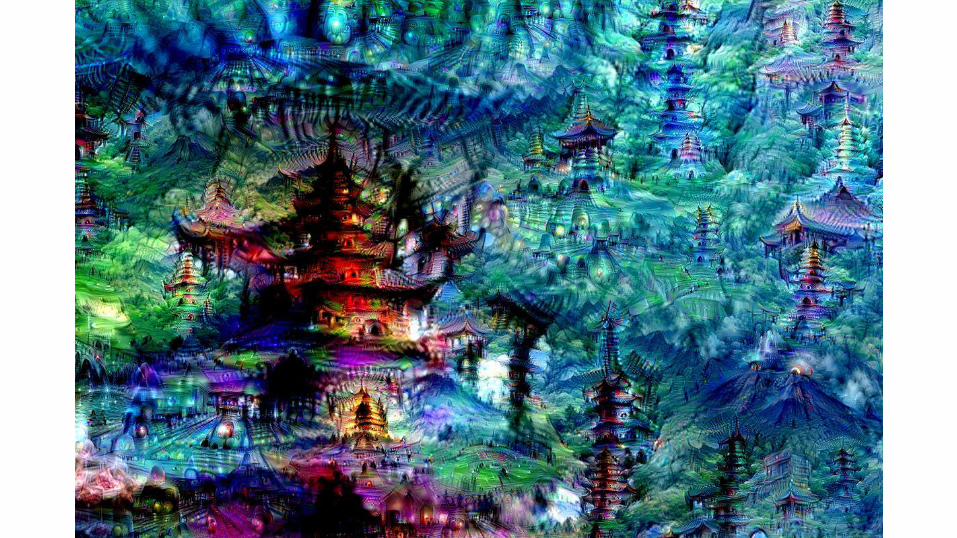
Google Deep Dream(sometimes nightmare)

Unsupervised Learning


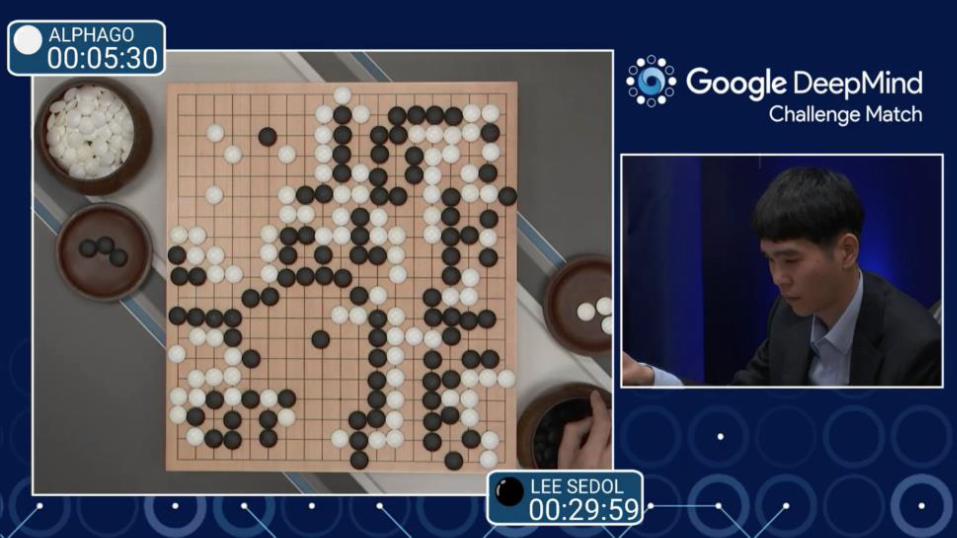
Reinforcement Learning


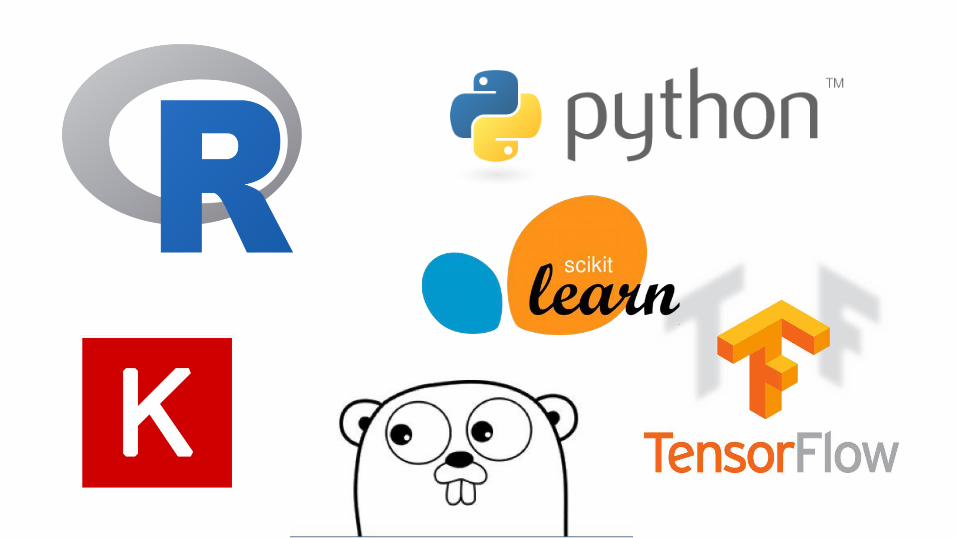
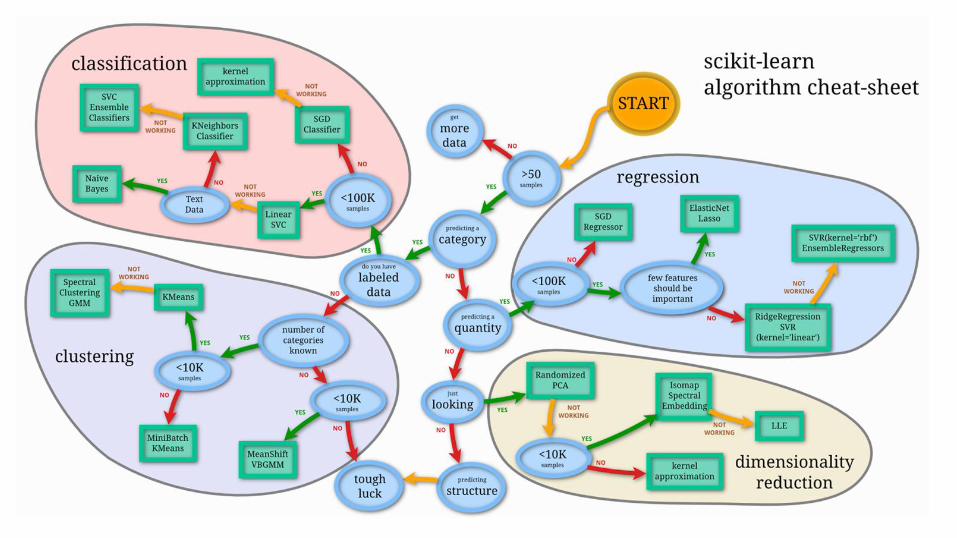
Getting Started

CRISP Methodology
Exploratory
Iterative


Quality of data: Garbage In Garbage Out

Multi-disciplinary team


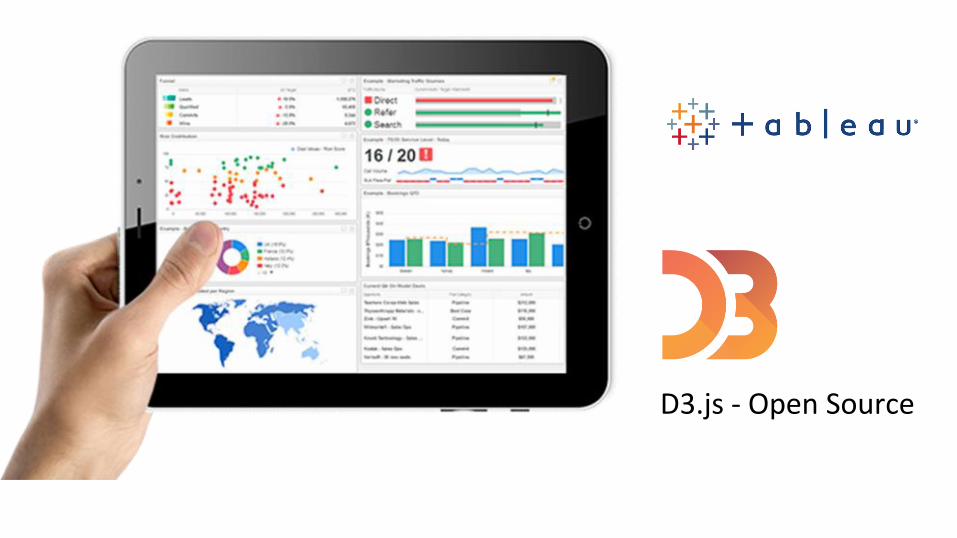
D3.js - Open Source

Examples in Transport & Logistics

IBM Watson

Ahlers Supply Network Innovation & Analytics (ASNIA)
Using ML to identify horizontal collaboration synergies between multiple shipper networks

Transmetrics: replacing budgets with prediction
Transmetrics big data cargo platform – a rigorous approach deriving benefits from current and future data
Traditional tactical management relies on budgets Transmetrics: predictive tactical management
Budgeting process: “Flying on paper maps, experience and gut feeling”
Transmetrics: “High precision flying assisted by data and AI”
Data uptake cleansing andenrichment
Demand forecastmodelling
AI optimization
ExecutionControlling
1 2 3 4

Data quality improvement – status of data after AUTOMATED / AI processing
• Ambiguity in interpretation of orders and pieces records
• Missing size information at order and piece level
• Mix of measurement units (ldm, m3, kilos, pallets)
• Missing or unreliable capacity information for linehauls
• Other issues (e.g. senders with multiple name spellings)
Preliminary data quality assessment after AUTOMATED / AI processing
Good to very good
• Clear and correct identification of all shipments and pieces (including ignoring of non-piece lines)
• For each piece calculated full set of measurements (height, width, length, weight, volume) – which enables 3D loading factors!
• Complete set of measurements: loading meters, surface/pallets (m2), volume (m3)
• Built AI algorithm to estimate missing capacity information
• Grouped senders by AI; among others found a customer with 330+ different accounts/names
Original situation Achieved situation
Challenging

Methodology / Behind the scenes
1. Preprocess data
• cleanse and disaggregate pieces/volume/weight
• Remove unnecessary rows
• Ensure one row=one piece
4. Predict missing linehaul capacity
• use historical data to predict capacities
• 95% accuracy
2. Estimate volume
• Predict missingvolume data
3. Estimate dimensions
• Mine text fields,
• Apply industry standards and business rules
3D Loading Factor estimation
• Loading meters (m)
• Loading area, pallets (m2)
• Volume (m3)
• Expected 90% accuracy after calibration
Approaches used
• Combinatorial optimization
• Quadratic optimization
• Gradient boosting trees and other regressions
• Natural language processing
• Named identity disambiguation
• Expert input / business rules

3D loading visualization
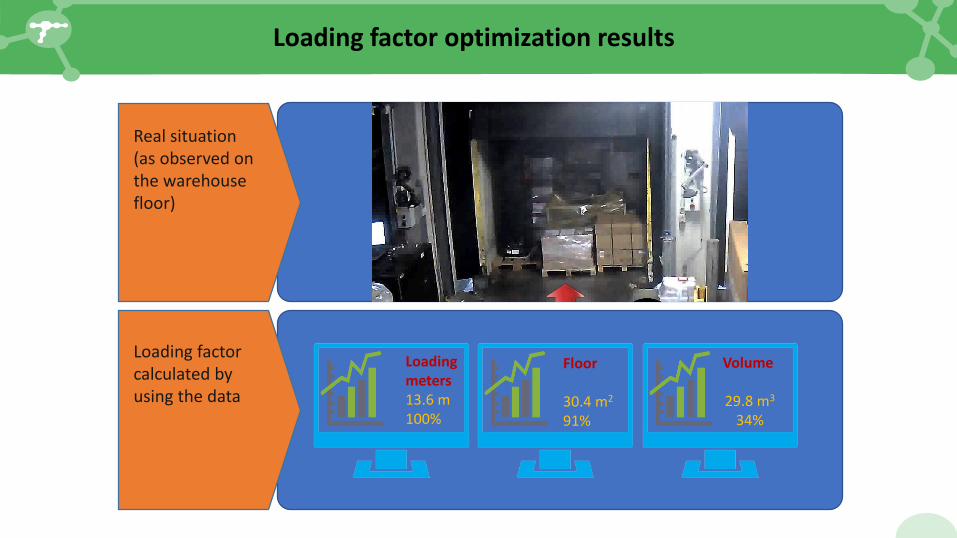
Loading factor optimization results
Real situation (as observed on the warehouse floor)
Loading factor calculated by using the data
Loading meters 13.6 m100%
Volume
29.8 m3
34%
Floor
30.4 m2
91%

Sven Verstrepen
http://www.linkedin.com/in/svenverstrepen
Head of Supply Network Innovation & Analytics

Frank SalliauIndependent Data Scientist & Machine Learning Expert
http://www.mentat-it.be
https://be.linkedin.com/in/franksalliau