Embed Size (px)
Citation preview
www.dbsvickers.com
ed: SGC / sa: WMT
New urbanization trend: Evolution of KL South •
KL south migration gaining traction, driven by MRT connectivity, strong population growth, and larger supply of affordable homes
• Kajang-Semenyih growth corridor the most promising hotspot within Greater KL given availability of cheap land bank and ready infrastructure
• KL-SG High Speed Rail - the wildcard to shift city center towards KL South
• Top beneficiaries: MKH (high-conviction Buy), Eco World (Initiate coverage), SP Setia (Upgrade to Buy)
Huge price disparity driving KL south migration. Escalating land prices within Greater KL have reduced the supply of affordable landed properties, which remain in demand. The MRT connectivity at Kajang (ready by 2017) and the ready infrastructure with several highways have made Kajang/Semenyih the natural choice for developers to expand township developments. This is supported by the availability of large tracts of land and these districts recording the among the strongest population growth in Selangor. The close proximity to KLCC and Putrajaya federal administrative centre will ensure KL South continues to thrive.
Follow the infrastructure. The terminal station of the proposed KL-SG High Speed Rail (HSR) link at Bandar Malaysia could accelerate migration to KL south given the more integrated public transport system by then. The MRT Line 2 which has been approved by the cabinet could link southward to Putrajaya, which would drive more development in Kajang/Semenyih.
Top pick: MKH. Its large exposure to affordable housing and landed residential projects in its stronghold Kajang-Semenyih growth corridor (490 acres), coupled with its low land cost at prime locations, will make MKH the largest beneficiary of the KL south migration.
ESESESES
KLCIKLCIKLCIKLCI : : : : 1,872.971,872.971,872.971,872.97
Analyst QUAH He Wei, CFA +603 2604 3966 [email protected]
STOCKS
Source: AllianceDBS
Increasing property sales and prices
100
120
140
160
180
200
220
0
20
40
60
80
100
120
140
160
2000
2001
2002
2003
2004
2005
2006
2007
2008
2009
2010
2011
2012
2013
Yr 2000=100Yr 2000=100Yr 2000=100Yr 2000=100RMbnRMbnRMbnRMbn
Value of property transaction house price index
Source: AllianceDBS, NAPIC
DBS Group Research . Equity DBS Group Research . Equity DBS Group Research . Equity DBS Group Research . Equity 21 Jul 2014
Malaysia Industry Focus
Property Refer to important disclosures at the end of this report
Price Price Price Price Mkt CapMkt CapMkt CapMkt Cap Target PriceTarget PriceTarget PriceTarget Price Performance (%)Performance (%)Performance (%)Performance (%)
RMRMRMRM US$mUS$mUS$mUS$m RMRMRMRM 3 mth3 mth3 mth3 mth 12 mth12 mth12 mth12 mth RatingRatingRatingRating
UEM Sunrise Bhd 2.10 2,863 2.20 (11.8) (30.9) HOLD SP Setia 3.52 2,788 4.10 20.6 5.4 BUY Sunway Bhd 3.18 1,722 3.70 2.6 (4.2) BUY Eastern & Oriental Bhd
2.99 1,039 3.80 19.6 51.0 BUY MKH Berhad 4.01 528 5.85 22.1 123.0 BUY Eco World 5.08 404 6.00 (1.0) 605.6 BUY Wing Tai Malaysia Bhd
2.15 218 2.25 (9.7) (16.3) HOLD Hunza Properties 2.00 143 2.20 0.0 2.0 HOLD
Industry Focus
Property
Page 2
QUAH He Wei, CFA +603 2604 3966
Table of Contents
Why KL South migration? 3 Map of improved public transport connectivity 6 Catalyst from major infrastructure projects 7 Malaysia property market remains healthy 9 Investment strategy 12 Risks 13 Peer comparison 14 Stock Profiles 17
MKH (High-conviction Buy) 18
SP Setia (upgrade to Buy) 20
Eco World (coverage initiation) 22
MICA (P) 043/10/2009MICA (P) 043/10/2009MICA (P) 043/10/2009MICA (P) 043/10/2009
Industry Focus
Property
Page 3
Why KL South migration?
Escalating land prices within Greater KL have reduced the
supply of affordable landed properties, for which there is still
strong demand. The connectivity of MRT into Kajang (ready by
2017) and the ready infrastructure with several highways, have
made Kajang/Semenyih the natural choice for developers to
expand township developments, with the availability of large
tracts of land bank and the area recording one of the strongest
population growth in Selangor (26% of total transactions).
Greater KL/Klang Valley remains the core of the government’s
economic transformation program – the government wants to
grow the Greater KL population to 10m by 2020 from an
estimated 7m currently. This means the Greater KL population
has to grow by 5.2% p.a. on average, much higher than the
national average of ~1.4%. If the goal materializes, this would
translate into stronger demand for housing of 80k units p.a. in
Greater KL alone vis-à-vis 78k units completed for the whole
country in 2013.
Greater KL – economic growth driver
Population
(m)
Density
(ppl/sq km) Urbanisation
Selangor 5.46 674 91.4%
KL 1.67 6,891 100%
Putrajaya 0.07 1,478 100%
Malaysia 28.3 86 71%
Source: AllianceDBS, Department of Statistics
Greater KL prices much higher than national average
-
100
200
300
400
500
600
700
800
900
2006 2007 2008 2009 2010 2011 2012 2013
RM'000RM'000RM'000RM'000
KL Putrajaya Selangor Msia
Source: AllianceDBS, NAPIC
Housing demand in Greater KL is likely to remain healthy going
forward, but buyers will be picky because of steep pricing, no
thanks to a slew of cost-push factors including inflationary
pressure, subsidy rationalisation, and implementation of
minimum wages. Faced with the risk of margin compression,
property developers will naturally look to landbank in areas
where land cost is relatively low, and there is ready
infrastructure and a growing population.
The construction of the MRT Sg. Buloh-Kajang line has drawn
interest to the Kajang/Semenyih growth corridor which is
located within the Hulu Langat district, Selangor, because of
the availability of vast land bank there. The 51-km MRT line will
have 31 stations including 16 with park-and-ride facilities and
four interchange stations. The line will link Sungai Buloh in the
northwest and Kajang in the southeast.
Indeed, the much-needed catalyst – three MRT stations within
Kajang - has driven several public-listed property developers to
grab land in the area. Other major developers such as SP Setia,
Mah Sing, UEM Sunrise, Eco World, and Tropicana, have also
jumped on the bandwagon as the areas gains recognition as
strategic townships at a relatively comfortable distance from KL
city center, that offer affordable housing and ready
infrastructure:
i) Education hub: there are several education institutions in
the vicinity, including New Era University College, Universiti
Kebangsaan Malaysia, Universiti Putra Malaysia,
Nottingham University campus, Universiti Tenaga Malaysia,
the German Malaysia Institute, and the Australia
International School;
ii) Easy access with the opening of several highways that link
Kajang/Semenyih to other major townships within Klang
Valley. These include the Kajang SILK Highway and
Persiaran Kajang-Semenyih. Other links to the area are
Lebuhraya Utara Selatan, Lebuhraya Cheras-Kajang and
Lebuhraya Klang Selatan; and
iii) Strong population growth driven by urban migration.
According to Department of Statistics data, Kajang’s
population was close to 800,000 in 2010, or 15% of
Selangor’s population of 5.4m. The local town council
(MPKj) expects Kajang’s population to exceed 1m by 2013.
Industry Focus
Property
Page 4
Public-listed developers rushing to buy land in Semenyih/Kajang
Da teDa teDa teDa te Buye r Buye r Buye r Buye r Loca tionLoca tionLoca tionLoca tion RMmRMmRMmRMm RMpsfRMpsfRMpsfRMpsf Rema rksRema rksRema rksRema rks
02-Jul-14 Eco World Semenyih 492.7 225.3 10.5 near Bandar Rinching
25-Apr-14 Eco World Semenyih 1,073.1 950.0 20.3 near Bandar Rinching
21-May-12 Mah Sing Bangi 412.0 333.3 18.6 3.2km away from UKM
01-Mar-12 Knusford Semenyih 13.3 14.2 24.5 near Taman Kajang Perdana and Taman Jelok Impian
03-Oct-11 SP Setia Semenyih 673.3 381.3 13.0 13km south of Kajang in Rinching
08-Sep-11 Ireka Corp Kajang 20.6 22.4 25.0 within Bukit Angkat Industrial Zoning
05-Sep-11 Tropicana Corp Semenyih 198.5 228.0 26.4 Kajang Hills
06-Dec-10 UEM Sunrise Bangi 463.5 268.5 13.3 near Bandar Seri Putra
Siz e Siz e Siz e Siz e
(a c re )(a c re )(a c re )(a c re )
Source: AllianceDBS, Companies
Land prices in KL Northern areas such as Sg. Buloh, Petaling
Jaya and Kota Damansara have long been valued at a premium
to KL Southern areas. But the MRT line will change the
dynamics, it will revitalise the Kajang/Semenyih corridor. In
fact, land prices in Kajang/Semenyih have almost tripled
compared to 3-4 years ago, albeit coming from a low base.
Huge disparity in land price between North and South of KL for parcels near MRT stations
AreaAreaAreaArea
Es t. land Es t. land Es t. land Es t. land
pricepricepriceprice
Es t. Es t. Es t. Es t.
property property property property
ASPASPASPASP Deve loperDeve loperDeve loperDeve loper
RMps fRMps fRMps fRMps f RMps fRMps fRMps fRMps f
Sg. Buloh 200-300 600-700
Kota Damansara 200-300 600-700 Meda Inc
1300-1800 1450 Guoco Land
Dataran Sunway 350-450 1000-1200 Tropicana
Kajang city 80-100 350-450 MKH
Mah Sing,
Selangor Dredging
Pusat Bandar
Damansara
Source: AllianceDBS, Various
We compare Kajang (in Hulu Langat district) and Sg. Buloh (in
Petaling district) because these two areas have similar
demographics and public transport connectivity. Kajang and
Sg. Buloh are among the most populous districts in Selangor,
and the existing KTM railway runs through both areas.
Similarly, the terminal stations of the MRT line which will be
ready by 2017 will be located at Sg. Buloh and Kajang.
However, there is a stark contrast in property prices between
the two areas, in favour of the northern region. We believe the
completion of the MRT Sg Buloh-Kajang Line will reduce the
disparity as property buyers will likely decide mainly on price
then.
Also, property affordability is increasingly an issue for the
general public with prices surging in recent years and demand
outpacing new supply of houses by a large margin, particularly
for low-to-medium cost units.
Population in Selangor
Dis trict in Se langorDis trict in Se langorDis trict in Se langorDis trict in Se langor
Gombak 668,694
Klang 842,146
Kuala Langat 220,214
Kuala Selangor 205,257
Petaling 1,765,495
Sabak Bernam 103,709
Sepang 207,354
Hulu Langat 1,138,198
Ulu Selangor 194,387
Source: AllianceDBS, Department of Statistics
Industry Focus
Property
Page 5
Hulu Langat property prices catching up with Petaling
100
120
140
160
180
200
220
2000
2001
2002
2003
2004
2005
2006
2007
2008
2009
2010
2011
2012
2013
2000=1002000=1002000=1002000=100
Selangor Petaling Hulu Langat
Source: AllianceDBS, NAPIC
Wide disparity for terraced house price
200,000
250,000
300,000
350,000
400,000
450,000
500,000
550,000
600,000
650,000
700,000
1Q11
2Q11
3Q11
4Q11
1Q12
2Q12
3Q12
4Q12
1Q13
2Q13
3Q13
4Q13
1Q14
RM/unit RM/unit RM/unit RM/unit
Petaling Hulu Langat KL
Source: AllianceDBS, NAPIC
Hulu Langat terraced house price growth outperform
-5%
0%
5%
10%
15%
20%
25%
30%
1Q11
2Q11
3Q11
4Q11
1Q12
2Q12
3Q12
4Q12
1Q13
2Q13
3Q13
4Q13
1Q14
Petaling Hulu Langat KL
Source: AllianceDBS, NAPIC
We noticed Hulu Langat district terrace house prices have
consistently outperformed those in KL and Petaling district,
which is most likely due to the huge price disparity. Based on
National Property Information Center (NAPIC) 1Q14 data,
average price of terrace houses in KL and Petaling district are
121% and 65% higher than those in Hulu Langat. Therefore,
we believe the huge price difference is expected to drive more
property buying interest to Kajang/Semenyih growth corridor
where lifestyle gated-and-guarded developments have been
mushrooming due to the strong demand.
Indeed, since the announcement of the MRT Sg. Buloh-Kajang
Line, demand for landed properties in Kajang/Semenyih has
been rising. Property sales have been resilient, driven by the
strong population growth in the second most populous district
in Selangor. The KL South migration is imminent; major
developers in Kajang/Semenyih rushing to buy land there
reinforces our view that this will be one of the best hotspots in
the years to come, possibly more visible when the MRT stations
are completed by 2017.
Hulu Langat properties sell like hot cake
La unchLa unchLa unchLa unch Pro je c tPro je c tPro je c tPro je c t De ve lope rDe ve lope rDe ve lope rDe ve lope r
Ta ke Ta ke Ta ke Ta ke
upupupup TypeTypeTypeType
Pric e / Pric e / Pric e / Pric e /
uni tuni tuni tuni t
Sep13 Southville City Mah Sing >90% high rise >280k
Oct13 Setia Eco Hill SP Setia >90% landed >450k
Nov13 Diamond City Country Garden-Mayland>80% landed >900k
Feb14 Tropicana Heights Tropicana >90% landed >740k
Apr14 Saville Kajang MKH >80% high rise >290k
May14 Eco Majestic Eco World >80% landed >590k
Source: AllianceDBS, various
Developers are still launching high-priced products and fewer
affordable projects, as land prices within Klang Valley have
risen sharply that it is no longer feasible to launch affordable
housing. The MRT network reaching out to Kajang has also
reshaped public perception on residential projects in
Kajang/Semenyih; they were previously associated with long
travel distance from KL city center.
The availability of landed properties in Kajang/Semenyih at
lower prices than in other established townships such as
Petaling Jaya and Kota Damansara and good public transport
connectivity, appeal most to the general public. An additional
advantage is the close proximity to Putrajaya federal
administrative center, which has contributed to robust property
sales in the area. Upgraders from Cheras, Putrajaya and
Cyberjaya also naturally look at Kajang/Semenyih when it
comes to buying gated and guarded residential projects with
lifestyle amenities.
Industry Focus
Property
Page 6
Ripe for KL south migration with improved infrastructure
Source: Ho Chin Soon Research, AllianceDBS
Industry Focus
Property
Page 7
More catalyst from major infrastructure projects
MRT Line 2 gets green light from federal government. MRT Line 2 gets green light from federal government. MRT Line 2 gets green light from federal government. MRT Line 2 gets green light from federal government. This line
will link Sg. Buloh and Putrajaya in the South. We expect the
contracts to be awarded by 2H15. Although the alignment has
yet to be finalised, proposals to extend the line to areas like
Serdang and Putrajaya could help to drive KL South migration.
The combined coverage of MRT Line 1 and 2 will create a huge
catchment area to further spur property development in the area.
Malaysia’s most modern public transport mode will enable the
residents to reach major destinations within Greater KL with
relative ease. The appeal of better quality of life at relatively
lower price in the Kajang/Semenyih growth corridor will
transform the property landscape there.
Transit-oriented developments (TODs) are also positioned to take
off strongly with the extension of MRT connectivity to KL South.
The convenience of TODs has not been fully appreciated by the
public vis-à-vis property buyers in Singapore and Hong Kong, as
this single largest infrastructure project is a first for Malaysia.
High High High High SSSSpeed peed peed peed RRRRailailailail. The ambitious High-Speed Rail (HSR) project due
for completion by 2020 would reduce the journey from
Singapore to Kuala Lumpur to just 90-minutes, from up to 4.5
hours currently. The location of the terminal in Singapore has yet
to be finalised, but it has been reported Bandar Malaysia would
house the terminal station in Malaysia.
There are plans for the 330km line to make stops in Negri
Sembilan, Malacca and Johor, which could extend the journey
time to 2 hours, but this is still preliminary. We understand the
Malaysian government is conducting technical surveys, socio-
economic analyses on the proposed stations, and the proposed
alignment, among others. The HSR service is expected to boost
travel between the two countries and result in significant
economic gains for both.
The decision to place the Malaysian terminal at Bandar Malaysia
in Sungai Besi, at the current site of the Royal Malaysian Air Force
base, is a welcome surprise for KL South migration, as there
could be spillover effects on the Malaysian property sector.
The positive impact of an integrated HSR and MRT Line 1 and 2
in the future is likely to benefit Kajang/Semenyih the most, since
it is coming from a relatively lower base than more established
townships in Greater KL.
Industry Focus
Property
Page 8
Developers with exposure to KL South
Deve loperDeve loperDeve loperDeve loper ProjectProjectProjectProject LandLandLandLand
% of % of % of % of
land land land land
bankbankbankbank LocationLocationLocationLocation GDVGDVGDVGDV
% of % of % of % of
tota l tota l tota l tota l
GDVGDVGDVGDV
% of % of % of % of
RNAVRNAVRNAVRNAV RemarksRemarksRemarksRemarks
(acre)(acre)(acre)(acre) (RMm)(RMm)(RMm)(RMm) (RMm)(RMm)(RMm)(RMm)
MKH Various 491 44%
Kajang/Semenyih, Cheras,
Seri Kembangan 5,087 69% 46%
Various projects including Kajang 2,
Pelangi Semenyih, Hillpark Homes
Tropicana Tropicana Heights 199 10% Kajang 1,456 2% n.a. township development
SHL Bandar Sg. Long 328 55% Sg. Long n.a. n.a. 50% Include 160-acre golf course@Sg. Long
SP Setia Setia EcoHill 1,447 30% Bandar Rinching, Semenyih 7,360 11% 6% township development
Eco World EcoMajestic 1,566 32% Bandar Rinching, Semenyih 14,640 31% 14% township development
Hua Yang
One South,
Mines South 22 3% Seri Kembangan 1,035 n.a. n.a. mixed development
UEM Sunrise
Serene Heights,
Sinaran Hills 513.6 7% Bangi, Kajang 3,270 4% 2% residential projects
Mah Sing Southville City 428 15% Bangi 8,300 32% n.a. township development
Source: AllianceDBS, Various, Companies
Our ground checks revealed that property projects within
Kajang/Semenyih have been doing exceptionally well. The
presence of established developers such as SP Setia, MKH,
Tropicana, Eco World and Mah Sing, supports our optimistic
outlook for property developments in an area that had been
overlooked by property buyers previously because of perceived
haphazard planning, lack of quality products, and weaker
infrastructure.
Gated and guarded landed properties are the main attractions
for genuine buyers/upgraders because of relatively more
attractive pricing. This type of products are increasingly beyond
the affordability of young working adults in other prime areas
of Greater KL, as developers price in rising construction costs
and land prices.
The Kajang/Semenyih/Bangi areas provide golden opportunity
for developers to tap into the strong demand for landed
properties, because of the availability of large tracts of land
bank in the area. This is virtually the last area within Greater KL
that is still available at reasonable prices, yet offer strong
growth prospects as the improving infrastructure and facilities
would enhance its appeal.
Kajang/Semenyih will be the next hotspot going forward. For
property developers, the resilient demand for landed properties
will create a more stable market vis-à-vis high-end condo
projects which are heavily dictated by market sentiment.
Typical bread-and-butter terrace houses have been selling well
over the years as supply and demand are driven by sector
fundamentals.
We understand that MKH, one of the oldest names in Kajang/Semenyih, has never employed the developers’ interest bearing scheme (DIBS) incentive to sell their products, even during the down cycle when many developers in town introduced that to address slowing sales. This is strong testament to the booming yet resilient property sales in the growth corridor, the dynamics greatly enhanced by the MRT connectivity.
Industry Focus
Property
Page 9
Malaysian property market remains healthy
Despite the relatively weaker property sentiment due to
tightening measures, property prices remain at record highs as
supply continue to lag demand. Property demand in Malaysia is
supported by favourable demographics - young and growing
population (and labour force), increasing urbanisation, and
shrinking household size. The Malaysian economy is expected to
grow by 5.3% in 2014 (vs 4.7% in 2013), while unemployment
rate is healthy at 3%.
Relatively healthy economic indicators
0%
5%
10%
15%
20%
25%
30%
35%
40%
45%
-10%
-5%
0%
5%
10%
15%
20%
2008 2009 2010 2011 2012 2013
GDP growth (LHS) GNI growth (LHS) Savings % (RHS)
Source: AllianceDBS, BNM
Lower impaired loan ratio despite rising household debt
0.0
0.5
1.0
1.5
2.0
2.5
3.0
3.5
0
500
1,000
1,500
2,000
2009 2010 2011 2012 2013
%%%%RMbnRMbnRMbnRMbn
HH debt (LHS)
HH financial asset (LHS)
impaired loan ratio of HH sector (RHS)
Source: AllianceDBS, BNM
There are concerns rising household debt could pose a serious
threat to the economy, but more stringent lending guidelines
adopted by financial institutions could help to ease the pressure.
Household debt also grew at a slower pace of 11.7% in 2013,
compared to 13.5% in 2012. We believe the risk of a property
bubble is well contained by strong fundamentals in Malaysia’s
economy and a robust banking system. Overall household
financial health is stable as indicated by 45% household gearing
and a gross national savings-to-gross national income ratio of
31%.
Healthy gross domestic savings
0%
10%
20%
30%
40%
50%
60%
Indonesia Singapore Thailand Malaysia Philippines
Source: AllianceDBS, World Bank
Meanwhile, non-performing loans for residential property
mortgage have been improving over the years. The gross
residential mortgage loan NPL ratio has improved from 3.5% in
2010 to 1.5% recently. We understand banks have been more
cautious with loan approvals, as some property buyers have been
facing difficulty in getting mortgage loans. Nevertheless, loan
applications and approvals have started to pick up in recent
months.
Mortgage NPLs trending down
0%
1%
2%
3%
4%
5%
6%
7%
8%
9%
10%
(4)
(2)
0
2
4
6
8
10
12
14
16
Dec-04 Mar-06 Jun-07 Sep-08 Dec-09 Mar-11 Jun-12 Sep-13
RMbnRMbnRMbnRMbn
Gross NPL Chg NPL Mortgage NPL%
Source: AllianceDBS, BNM
Industry Focus
Property
Page 10
Affordability supported by cheap financing
-
1
2
3
4
5
6
7
8
-
100
200
300
400
500
600
700
2000
2001
2002
2003
2004
2005
2006
2007
2008
2009
2010
2011
2012
2013
(x)(x)(x)(x)RM'000RM'000RM'000RM'000
affordable house price (LHS) affordability ratio (RHS)
Source: AllianceDBS, BNM
Despite the rapid increase in property prices in recent years,
affordability remains healthy thanks to the low financing rates
and rising household income. We note that 87% of the value of
residential property transactions in 2013 were priced below
RM500,000, and Malaysia still has the lowest house price-to-
income ratio in the region.
Malaysia’s house priceMalaysia’s house priceMalaysia’s house priceMalaysia’s house price----totototo----income still lowest in the regionincome still lowest in the regionincome still lowest in the regionincome still lowest in the region
Source: URA, Singstat, Demographia, Bank of Thailand, BNM
The recent interest rate hike of 25 basis points is unlikely to cause
a major slowdown in the property market. A 25 basis point
increase in the base lending rate would lift a 30-year RM500k
mortgage loan instalment payment by RM74/month, an increase
of only 3% over the current monthly instalment of ~RM2,445.
Nevertheless, sentiment may be affected temporarily after rates
are adjusted by commercial banks.
The rate hike was due to BNM concern over the risk of broader
economic and financial imbalances that could undermine the
growth prospects of the Malaysian economy. Should there be
more interest rate hike in tandem with the growing economy, it
is unlikely to adversely affect property sales growth judging by
historical trend though consumer sentiment may be affected.
We believe property prices are likely to remain steady at current
levels, after the steep appreciation over the past few years. The
supply deficit will continue to support prices as the young labour
force (60% below 40 years old) will be seeking residential
properties. Newly completions have ranged from 65k-80k units
p.a. in recent years, while Malaysia household formation has
exceeded 100k p.a., underpinning strong demand for properties.
Demand is further supported by easy access to credit.
Property prices reaching all-time high
100
120
140
160
180
200
220
240
1Q00
4Q00
3Q01
2Q02
1Q03
4Q03
3Q04
2Q05
1Q06
4Q06
3Q07
2Q08
1Q09
4Q09
3Q10
2Q11
1Q12
4Q12
3Q13
2000=1002000=1002000=1002000=100
All Terraced High-rise Detached Semi-D
Source: AllianceDBS, NAPIC
Healthy inventory levels
KLKLKLKL Se langorSe langorSe langorSe langor JohorJohorJohorJohor PenangPenangPenangPenang OthersOthersOthersOthers Ma lays iaMa lays iaMa lays iaMa lays ia
Existing Stock 424,324 1,358,054 705,929 377,942 1,852,285 4,718,534
% of Msia 9% 29% 15% 8% 39% 100%
Completions 1,281 19,003 12,402 12,583 32,996 78,265
% of stock 0% 1% 2% 3% 2% 2%
Incoming supply 52,714 149,644 118,191 64,482 311,526 696,557
% of stock 12% 11% 17% 17% 17% 15%
total unsold 8,567 11,935 15,385 2,259 27,429 65,575
Unsold/stock 2.0% 0.9% 2.2% 0.6% 1.5% 1.4%
Source: AllianceDBS, NAPIC
Industry Focus
Property
Page 11
Rising construction cost
80
90
100
110
120
130
140
150
160
170
180
2000
2001
2002
2003
2004
2005
2006
2007
2008
2009
2010
2011
1Q12
2Q12
3Q12
4Q12
1Q13
2Q13
3Q13
4Q13
1Q14
Source: AllianceDBS, Langdon Seah
Cost-push factors such as rising construction cost and the
implementation of 6% Goods & Services Tax (GST) effective
Apr15 will continue to create upward pressure on selling prices.
New tenders for construction contracts have been seeing higher
quotations, partly due to intense competition for raw materials
and labour with the rollout of mega infrastructure projects in
Malaysia. We understand property developers have started to
factor in GST in selling prices for new projects.
The sticky prices could translate into softer demand for certain
properties, but demand for landed properties is likely to remain
resilient although there will be limited supply of affordable units
in view of the escalating land prices within Greater KL. The
scarcity of large tracts of land bank in prime areas has also
resulted in developers opting to build high-rise projects to
optimize yields (gross development profit/acre).
Other challenges include the increasing compliance cost. These
include bumi discount/quota (5-15%/30-60% depending on
location and land status), low-medium cost housing quota (30-
50% depending on land size), and government reserve/public
area, which have led to cross-subsidy of products. We
understand developers incur ~RM100k losses/unit for each low-
cost house built because the RM42k cap implemented by the
government has stayed despite rising construction costs.
Industry Focus
Property
Page 12
Investment strategy
Despite generally weaker sentiment in the property market,
property sales in Kajang/Semenyih growth corridor has been
outperforming those in more established townships within
Greater KL. We like the mass-market township developments
in Kajang/Semenyih, for which demand will remain resilient
with the improvements to overall infrastructure as well as
public transport connectivity.
MKH and Eco World will be among the largest beneficiaries of
the booming Kajang/Semenyih growth corridor, as the
potential GDV from their land bank account for 69% and
31%, respectively, of their overall GDV in the pipeline.
Promising sales at their projects will underpin long-term
earnings visibility.
The undisputed advantage of cheaper land cost - to supply
landed properties - in the area will ensure property and land
prices converge rapidly towards average prices in KL. This
could create a multi-year re-rating for both MKH and Eco
World which enjoy strong branding.
TopTopTopTop/High conviction/High conviction/High conviction/High conviction pick: MKHpick: MKHpick: MKHpick: MKH. The company will be the
largest beneficiary of the upcoming MRT connectivity given its
high exposure to the booming Kajang/Semenyih growth
corridor. MKH is a rare gem that offers both deep value and
strong earnings growth
MKH has an unrivalled competitive advantage in
Kajang/Semenyih property development because of their low
land cost of RM10psf (vs peers’ >RM20psf). Affordable homes
- MKH’s stronghold - remains the key theme for the property
sector. Their large tract of prime property land bank in
Kajang/Semenyih (490 acres) makes them the prime
beneficiary of rising land prices there. Scarcity of land within
Kajang also provides a distinct advantage for MKH’s future
launches, which are expected to see strong demand and fetch
premium pricing.
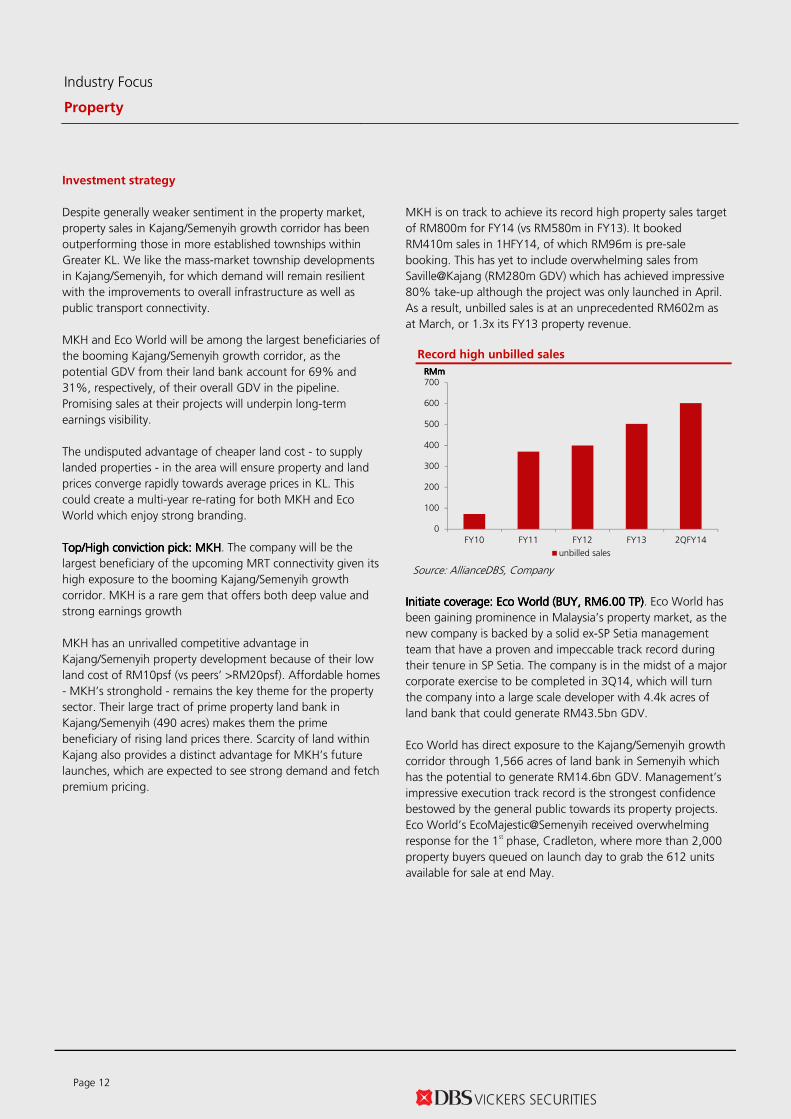
MKH is on track to achieve its record high property sales target
of RM800m for FY14 (vs RM580m in FY13). It booked
RM410m sales in 1HFY14, of which RM96m is pre-sale
booking. This has yet to include overwhelming sales from
Saville@Kajang (RM280m GDV) which has achieved impressive
80% take-up although the project was only launched in April.
As a result, unbilled sales is at an unprecedented RM602m as
at March, or 1.3x its FY13 property revenue.
Record high unbilled sales
0
100
200
300
400
500
600
700
FY10 FY11 FY12 FY13 2QFY14
RMmRMmRMmRMm
unbilled sales
Source: AllianceDBS, Company
Initiate coverageInitiate coverageInitiate coverageInitiate coverage:::: Eco World Eco World Eco World Eco World ((((BUY, RM6.BUY, RM6.BUY, RM6.BUY, RM6.00000 TP)0 TP)0 TP)0 TP). Eco World has
been gaining prominence in Malaysia’s property market, as the
new company is backed by a solid ex-SP Setia management
team that have a proven and impeccable track record during
their tenure in SP Setia. The company is in the midst of a major
corporate exercise to be completed in 3Q14, which will turn
the company into a large scale developer with 4.4k acres of
land bank that could generate RM43.5bn GDV.
Eco World has direct exposure to the Kajang/Semenyih growth
corridor through 1,566 acres of land bank in Semenyih which
has the potential to generate RM14.6bn GDV. Management’s
impressive execution track record is the strongest confidence
bestowed by the general public towards its property projects.
Eco World’s EcoMajestic@Semenyih received overwhelming
response for the 1st phase, Cradleton, where more than 2,000
property buyers queued on launch day to grab the 612 units
available for sale at end May.
Industry Focus
Property
Page 13
Eco World may bring forward subsequent phases of
EcoMajestic in view of strong demand for its landed products,
despite the premium pricing starting at RM586k/unit for a
terrace house. Property sales should gain momentum as more
of its eco-themed projects are introduced to the market.
The company is on track to achieve its RM5bn sales target over
FY14-15 given its presence in Malaysia’s property hotspots in
the Klang Valley, Iskandar Malaysia, and Penang. We project
the company will achieve 3-year earnings CAGR of 102% over
FY13-16F
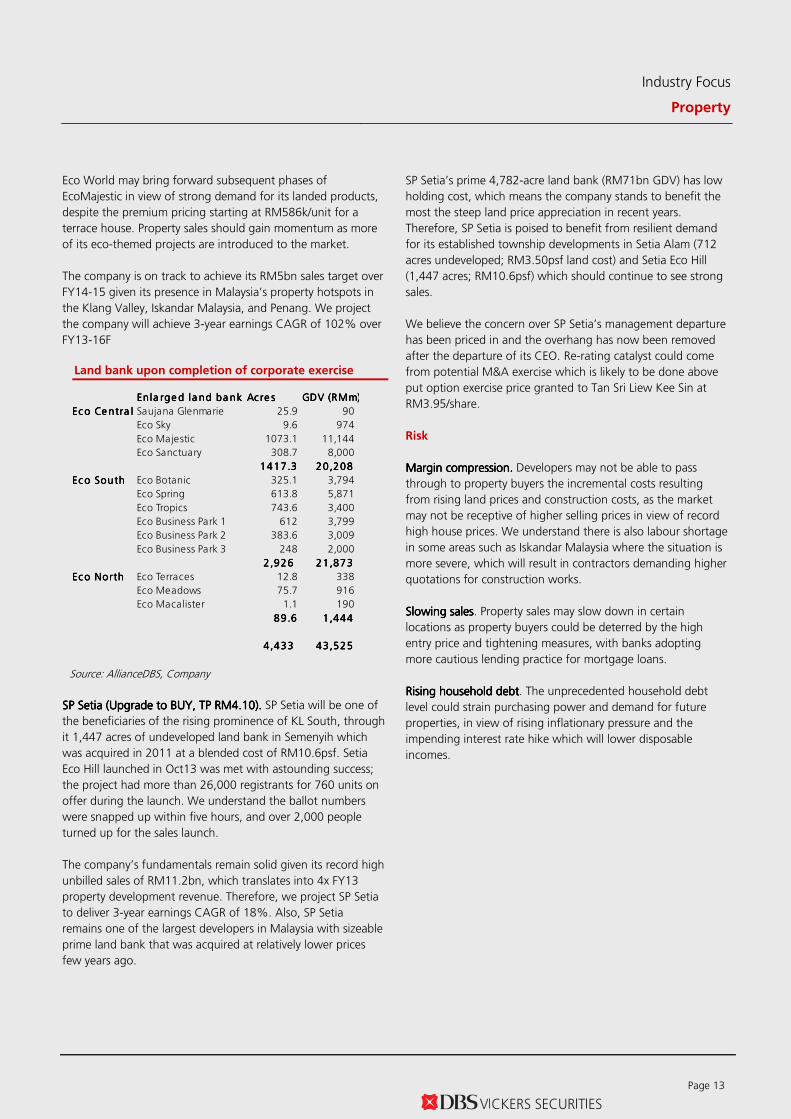
Land bank upon completion of corporate exercise
Source: AllianceDBS, Company
SP SetiaSP SetiaSP SetiaSP Setia (Upgrade(Upgrade(Upgrade(Upgrade to Bto Bto Bto BUY,UY,UY,UY, TP TP TP TP RM4.10RM4.10RM4.10RM4.10).).).). SP Setia will be one of
the beneficiaries of the rising prominence of KL South, through
it 1,447 acres of undeveloped land bank in Semenyih which
was acquired in 2011 at a blended cost of RM10.6psf. Setia
Eco Hill launched in Oct13 was met with astounding success;
the project had more than 26,000 registrants for 760 units on
offer during the launch. We understand the ballot numbers
were snapped up within five hours, and over 2,000 people
turned up for the sales launch.
The company’s fundamentals remain solid given its record high
unbilled sales of RM11.2bn, which translates into 4x FY13
property development revenue. Therefore, we project SP Setia
to deliver 3-year earnings CAGR of 18%. Also, SP Setia
remains one of the largest developers in Malaysia with sizeable
prime land bank that was acquired at relatively lower prices
few years ago.
SP Setia’s prime 4,782-acre land bank (RM71bn GDV) has low
holding cost, which means the company stands to benefit the
most the steep land price appreciation in recent years.
Therefore, SP Setia is poised to benefit from resilient demand
for its established township developments in Setia Alam (712
acres undeveloped; RM3.50psf land cost) and Setia Eco Hill
(1,447 acres; RM10.6psf) which should continue to see strong
sales.
We believe the concern over SP Setia’s management departure
has been priced in and the overhang has now been removed
after the departure of its CEO. Re-rating catalyst could come
from potential M&A exercise which is likely to be done above
put option exercise price granted to Tan Sri Liew Kee Sin at
RM3.95/share.
Risk
Margin compression.Margin compression.Margin compression.Margin compression. Developers may not be able to pass
through to property buyers the incremental costs resulting
from rising land prices and construction costs, as the market
may not be receptive of higher selling prices in view of record
high house prices. We understand there is also labour shortage
in some areas such as Iskandar Malaysia where the situation is
more severe, which will result in contractors demanding higher
quotations for construction works.
Slowing salesSlowing salesSlowing salesSlowing sales. Property sales may slow down in certain
locations as property buyers could be deterred by the high
entry price and tightening measures, with banks adopting
more cautious lending practice for mortgage loans.
Rising householRising householRising householRising household debtd debtd debtd debt. The unprecedented household debt
level could strain purchasing power and demand for future
properties, in view of rising inflationary pressure and the
impending interest rate hike which will lower disposable
incomes.
Enla rge d la nd ba nkEnla rge d la nd ba nkEnla rge d la nd ba nkEnla rge d la nd ba nk Ac re sAc re sAc re sAc re s GDV (RMm)GDV (RMm)GDV (RMm)GDV (RMm)
Eco Ce ntra lEco Ce ntra lEco Ce ntra lEco Ce ntra l Saujana Glenmarie 25.9 90
Eco Sky 9.6 974
Eco Majestic 1073.1 11,144
Eco Sanctuary 308.7 8,000
1417.31417.31417.31417.3 20,20820,20820,20820,208
Eco SouthEco SouthEco SouthEco South Eco Botanic 325.1 3,794
Eco Spring 613.8 5,871
Eco Tropics 743.6 3,400
Eco Business Park 1 612 3,799
Eco Business Park 2 383.6 3,009
Eco Business Park 3 248 2,000
2 ,9262,9262,9262,926 21,87321,87321,87321,873
Eco NorthEco NorthEco NorthEco North Eco Terraces 12.8 338
Eco Meadows 75.7 916
Eco Macalister 1.1 190
89.689.689.689.6 1,4441,4441,4441,444
4 ,4334,4334,4334,433 43,52543,52543,52543,525
Industry Focus
Property
Page 14
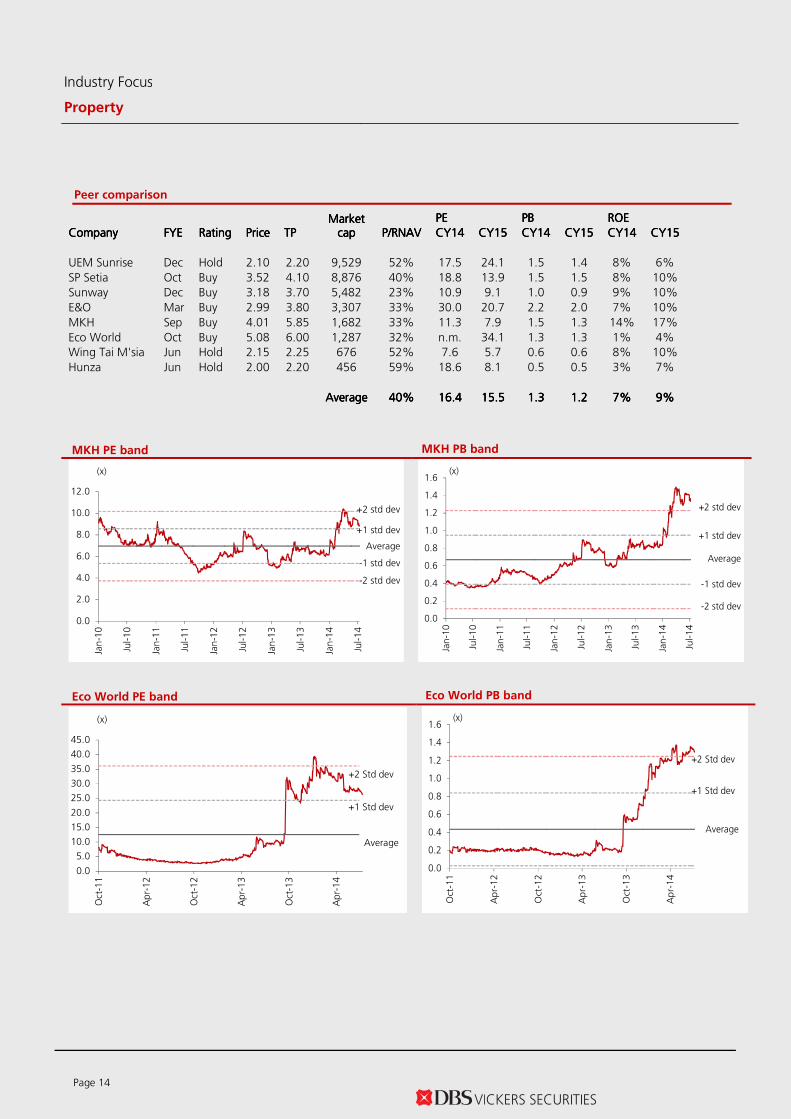
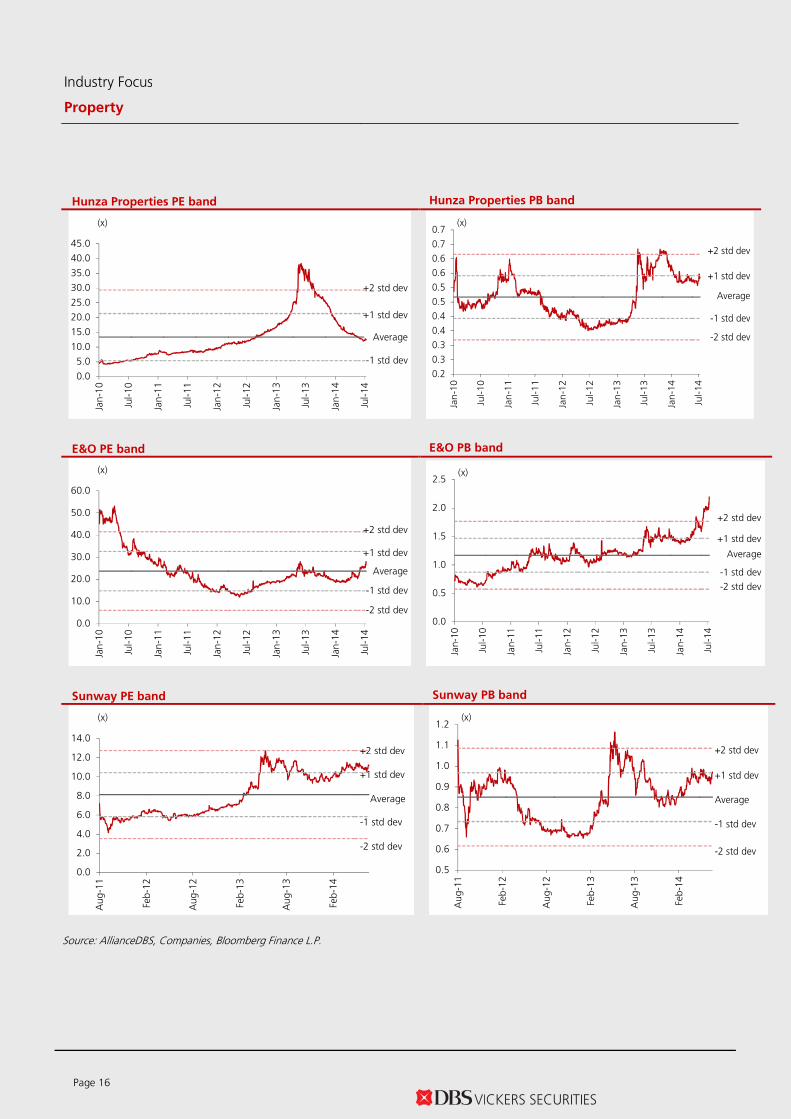
Peer comparison
MMMMarket arket arket arket capcapcapcap
PEPEPEPE
PBPBPBPB
ROEROEROEROE CompanyCompanyCompanyCompany FYEFYEFYEFYE RatingRatingRatingRating PricePricePricePrice TPTPTPTP P/RNAVP/RNAVP/RNAVP/RNAV CY14CY14CY14CY14 CY15CY15CY15CY15 CY14CY14CY14CY14 CY15CY15CY15CY15 CY14CY14CY14CY14 CY15CY15CY15CY15
UEM Sunrise Dec Hold 2.10 2.20 9,529 52% 17.5 24.1 1.5 1.4 8% 6%
SP Setia Oct Buy 3.52 4.10 8,876 40% 18.8 13.9 1.5 1.5 8% 10%
Sunway Dec Buy 3.18 3.70 5,482 23% 10.9 9.1 1.0 0.9 9% 10%
E&O Mar Buy 2.99 3.80 3,307 33% 30.0 20.7 2.2 2.0 7% 10%
MKH Sep Buy 4.01 5.85 1,682 33% 11.3 7.9 1.5 1.3 14% 17%
Eco World Oct Buy 5.08 6.00 1,287 32% n.m. 34.1 1.3 1.3 1% 4%
Wing Tai M'sia Jun Hold 2.15 2.25 676 52% 7.6 5.7 0.6 0.6 8% 10%
Hunza Jun Hold 2.00 2.20 456 59% 18.6 8.1 0.5 0.5 3% 7%
AverageAverageAverageAverage 40%40%40%40% 16.416.416.416.4 15151515.5.5.5.5 1.31.31.31.3 1.21.21.21.2 7%7%7%7% 9%9%9%9%
MKH PE band MKH PB band
Average
+1 std dev
+2 std dev
-1 std dev
-2 std dev
0.0
2.0
4.0
6.0
8.0
10.0
12.0
Jan-10
Jul-10
Jan-11
Jul-11
Jan-12
Jul-12
Jan-13
Jul-13
Jan-14
Jul-14
(x)
Average
+1 std dev
+2 std dev
-1 std dev
-2 std dev
0.0
0.2
0.4
0.6
0.8
1.0
1.2
1.4
1.6
Jan-10
Jul-10
Jan-11
Jul-11
Jan-12
Jul-12
Jan-13
Jul-13
Jan-14
Jul-14
(x)
Eco World PE band Eco World PB band
0.0
5.0
10.0
15.0
20.0
25.0
30.0
35.0
40.0
45.0
Oct-11
Apr-12
Oct-12
Apr-13
Oct-13
Apr-14
(x)
Average
+1 Std dev
+2 Std dev
0.0
0.2
0.4
0.6
0.8
1.0
1.2
1.4
1.6
Oct-11
Apr-12
Oct-12
Apr-13
Oct-13
Apr-14
(x)
+1 Std dev
+2 Std dev
Average
Industry Focus
Property
Page 15
SP Setia PE band SP Setia PB band
Average
+1 std dev
+2 std dev
-1 std dev
-2 std dev
10.0
12.0
14.0
16.0
18.0
20.0
22.0
Jan-10
Jul-10
Jan-11
Jul-11
Jan-12
Jul-12
Jan-13
Jul-13
Jan-14
Jul-14
(x)
Average
+1 std dev
+2 std dev
-1 std dev
-2 std dev
1.0
1.2
1.4
1.6
1.8
2.0
2.2
Jan-10
Jul-10
Jan-11
Jul-11
Jan-12
Jul-12
Jan-13
Jul-13
Jan-14
Jul-14
(x)
UEM Sunrise PE band UEM Sunrise PB band
Average
+1 std dev
+2 std dev
-1 std dev
-2 std dev10.0
15.0
20.0
25.0
30.0
35.0
40.0
45.0
Jan-10
Jul-10
Jan-11
Jul-11
Jan-12
Jul-12
Jan-13
Jul-13
Jan-14
Jul-14
(x)
Average
+1 std dev
+2 std dev
-1 std dev
-2 std dev1.0
1.5
2.0
2.5
3.0
3.5
Jan-10
Jul-10
Jan-11
Jul-11
Jan-12
Jul-12
Jan-13
Jul-13
Jan-14
Jul-14
(x)
Wing Tai Malaysia PE band Wing Tai Malaysia PB band
Average
+1 std dev
+2 std dev
-1 std dev
-2 std dev
0.0
2.0
4.0
6.0
8.0
10.0
12.0
Jan-10
Jul-10
Jan-11
Jul-11
Jan-12
Jul-12
Jan-13
Jul-13
Jan-14
Jul-14
(x)
Average
+1 std dev
+2 std dev
-1 std dev
-2 std dev
0.3
0.4
0.5
0.6
0.7
0.8
0.9
Jan-10
Jul-10
Jan-11
Jul-11
Jan-12
Jul-12
Jan-13
Jul-13
Jan-14
Jul-14
(x)
Industry Focus
Property
Page 16
Hunza Properties PE band Hunza Properties PB band
Average
+1 std dev
+2 std dev
-1 std dev
0.0
5.0
10.0
15.0
20.0
25.0
30.0
35.0
40.0
45.0
Jan-10
Jul-10
Jan-11
Jul-11
Jan-12
Jul-12
Jan-13
Jul-13
Jan-14
Jul-14
(x)
Average
+1 std dev
+2 std dev
-1 std dev
-2 std dev
0.2
0.3
0.3
0.4
0.4
0.5
0.5
0.6
0.6
0.7
0.7
Jan-10
Jul-10
Jan-11
Jul-11
Jan-12
Jul-12
Jan-13
Jul-13
Jan-14
Jul-14
(x)
E&O PE band E&O PB band
Average
+1 std dev
+2 std dev
-1 std dev
-2 std dev
0.0
10.0
20.0
30.0
40.0
50.0
60.0
Jan-10
Jul-10
Jan-11
Jul-11
Jan-12
Jul-12
Jan-13
Jul-13
Jan-14
Jul-14
(x)
Average
+1 std dev
+2 std dev
-1 std dev
-2 std dev
0.0
0.5
1.0
1.5
2.0
2.5
Jan-10
Jul-10
Jan-11
Jul-11
Jan-12
Jul-12
Jan-13
Jul-13
Jan-14
Jul-14
(x)
Sunway PE band Sunway PB band
0.0
2.0
4.0
6.0
8.0
10.0
12.0
14.0
Aug-11
Feb-12
Aug-12
Feb-13
Aug-13
Feb-14
(x)
+2 std dev
+1 std dev
-1 std dev
-2 std dev
Average
0.5
0.6
0.7
0.8
0.9
1.0
1.1
1.2
Aug-11
Feb-12
Aug-12
Feb-13
Aug-13
Feb-14
(x)
+2 std dev
+1 std dev
-1 std dev
-2 std dev
Average
Source: AllianceDBS, Companies, Bloomberg Finance L.P.

Industry Focus
Property
Page 17
Stock ProfilesStock ProfilesStock ProfilesStock Profiles
Page 18
www.dbsvickers.com
ed: SGC / sa: WMT
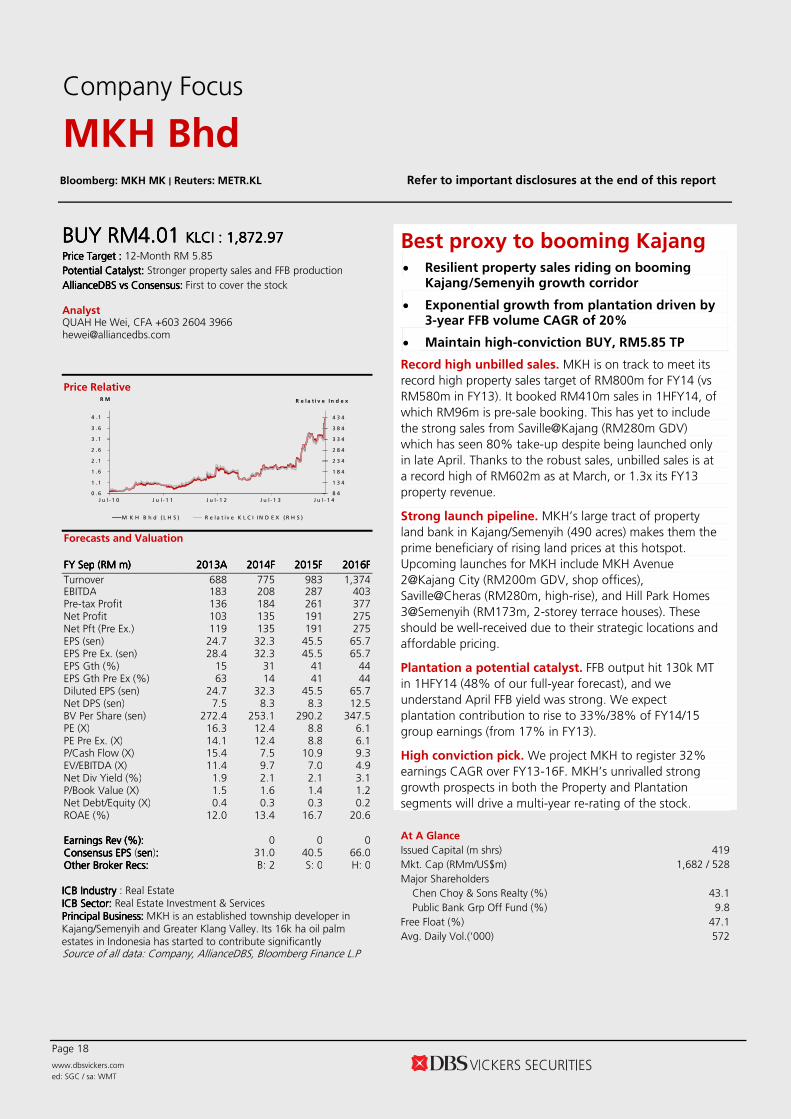
Bloomberg: MKH MK | Reuters: METR.KL Refer to important disclosures at the end of this report
BUYBUYBUYBUY RMRMRMRM4.014.014.014.01 KLCIKLCIKLCIKLCI : : : : 1,872.971,872.971,872.971,872.97 Price Target :Price Target :Price Target :Price Target : 12-Month RM 5.85
Potential Catalyst: Potential Catalyst: Potential Catalyst: Potential Catalyst: Stronger property sales and FFB production
AllianceDBSAllianceDBSAllianceDBSAllianceDBS vs Consensus:vs Consensus:vs Consensus:vs Consensus: First to cover the stock Analyst QUAH He Wei, CFA +603 2604 3966 [email protected]
Price Relative
8 4
1 3 4
1 8 4
2 3 4
2 8 4
3 3 4
3 8 4
4 3 4
0 .6
1 .1
1 .6
2 .1
2 .6
3 .1
3 .6
4 .1
J u l - 1 0 J u l - 1 1 J u l - 1 2 J u l - 1 3 J u l - 1 4
R e la t i v e In d e xR M
M K H B h d ( L H S ) R e la t i v e K L C I IN D E X ( R H S ) Forecasts and Valuation
FY FY FY FY SepSepSepSep ((((RMRMRMRM m) m) m) m) 2013201320132013AAAA 2014201420142014FFFF 2015201520152015FFFF 2016201620162016FFFF
Turnover 688 775 983 1,374 EBITDA 183 208 287 403 Pre-tax Profit 136 184 261 377 Net Profit 103 135 191 275 Net Pft (Pre Ex.) 119 135 191 275 EPS (sen) 24.7 32.3 45.5 65.7 EPS Pre Ex. (sen) 28.4 32.3 45.5 65.7 EPS Gth (%) 15 31 41 44 EPS Gth Pre Ex (%) 63 14 41 44 Diluted EPS (sen) 24.7 32.3 45.5 65.7 Net DPS (sen) 7.5 8.3 8.3 12.5 BV Per Share (sen) 272.4 253.1 290.2 347.5 PE (X) 16.3 12.4 8.8 6.1 PE Pre Ex. (X) 14.1 12.4 8.8 6.1 P/Cash Flow (X) 15.4 7.5 10.9 9.3 EV/EBITDA (X) 11.4 9.7 7.0 4.9 Net Div Yield (%) 1.9 2.1 2.1 3.1 P/Book Value (X) 1.5 1.6 1.4 1.2 Net Debt/Equity (X) 0.4 0.3 0.3 0.2 ROAE (%) 12.0 13.4 16.7 20.6 Earnings Rev (%):Earnings Rev (%):Earnings Rev (%):Earnings Rev (%): 0 0 0 Consensus EPS Consensus EPS Consensus EPS Consensus EPS (sensensensen):::: 31.0 40.5 66.0 Other Broker Recs:Other Broker Recs:Other Broker Recs:Other Broker Recs: B: 2 S: 0 H: 0 ICB IndustryICB IndustryICB IndustryICB Industry : Real Estate ICB Sector: ICB Sector: ICB Sector: ICB Sector: Real Estate Investment & Services Principal Business:Principal Business:Principal Business:Principal Business: MKH is an established township developer in Kajang/Semenyih and Greater Klang Valley. Its 16k ha oil palm estates in Indonesia has started to contribute significantly Source of all data: Company, AllianceDBS, Bloomberg Finance L.P
At A Glance Issued Capital (m shrs) 419 Mkt. Cap (RMm/US$m) 1,682 / 528 Major Shareholders Chen Choy & Sons Realty (%) 43.1 Public Bank Grp Off Fund (%) 9.8 Free Float (%) 47.1 Avg. Daily Vol.(‘000) 572
Company Focus
MKH Bhd
Best proxy to booming Kajang • Resilient property sales riding on booming
Kajang/Semenyih growth corridor
• Exponential growth from plantation driven by 3-year FFB volume CAGR of 20%
• Maintain high-conviction BUY, RM5.85 TP
Record high unbilled sales. MKH is on track to meet its
record high property sales target of RM800m for FY14 (vs
RM580m in FY13). It booked RM410m sales in 1HFY14, of
which RM96m is pre-sale booking. This has yet to include
the strong sales from Saville@Kajang (RM280m GDV)
which has seen 80% take-up despite being launched only
in late April. Thanks to the robust sales, unbilled sales is at
a record high of RM602m as at March, or 1.3x its FY13
property revenue.
Strong launch pipeline. MKH’s large tract of property
land bank in Kajang/Semenyih (490 acres) makes them the
prime beneficiary of rising land prices at this hotspot.
Upcoming launches for MKH include MKH Avenue
2@Kajang City (RM200m GDV, shop offices),
Saville@Cheras (RM280m, high-rise), and Hill Park Homes
3@Semenyih (RM173m, 2-storey terrace houses). These
should be well-received due to their strategic locations and
affordable pricing.
Plantation a potential catalyst. FFB output hit 130k MT
in 1HFY14 (48% of our full-year forecast), and we
understand April FFB yield was strong. We expect
plantation contribution to rise to 33%/38% of FY14/15
group earnings (from 17% in FY13).
High conviction pick. We project MKH to register 32%
earnings CAGR over FY13-16F. MKH’s unrivalled strong
growth prospects in both the Property and Plantation
segments will drive a multi-year re-rating of the stock.
Company Focus
MKH Bhd
Page 19
Income Statement (RM m) Balance Sheet (RM m)
FY FY FY FY SepSepSepSep 2013201320132013AAAA 2014201420142014FFFF 2015201520152015FFFF 2016201620162016FFFF FY FY FY FY SepSepSepSep 2013201320132013AAAA 2014201420142014FFFF 2015201520152015FFFF 2016201620162016FFFF Turnover 688 775 983 1,374 Net Fixed Assets 163 243 323 403 Cost of Goods Sold (441) (416) (536) (801) Invts in Associates & JVs 28 31 34 37 Gross ProfitGross ProfitGross ProfitGross Profit 247247247247 359359359359 447447447447 572572572572 Invt & Devt Properties 264 264 264 264 Other Opng (Exp)/Inc (90) (154) (163) (173) Other LT Assets 713 763 784 806 Operating ProfitOperating ProfitOperating ProfitOperating Profit 158158158158 205205205205 284284284284 400400400400 Cash & ST Invts 123 191 208 252 Other Non Opg (Exp)/Inc 0 0 0 0 Dev Props held for sale 280 203 262 392 Associates & JV Inc 11 3 3 3 Inventory 41 61 77 108 Net Interest (Exp)/Inc (17) (23) (26) (26) Debtors 113 134 170 238 Exceptional Gain/(Loss) (16) 0 0 0 Other Current Assets 561 526 637 865 PrePrePrePre----tax Profittax Profittax Profittax Profit 136136136136 184184184184 261261261261 377377377377 Total AssetsTotal AssetsTotal AssetsTotal Assets 1,8511,8511,8511,851 2,0162,0162,0162,016 2,2502,2502,2502,250 2,6272,6272,6272,627 Tax (29) (46) (65) (94) Minority Interest (3) (3) (5) (8) ST Debt 107 107 107 107 Preference Dividend 0 0 0 0 Other Current Liab 182 199 252 353 Net ProfitNet ProfitNet ProfitNet Profit 103103103103 135135135135 191191191191 275275275275 LT Debt 40 77 96 125 Net Profit before Except. 119 135 191 275 Other LT Liabilities 152 152 152 152 EBITDA 183 208 287 403 Shareholder’s Equity 951 1,061 1,216 1,457 Minority Interests 3 6 11 19 Sales Gth (%) 26.2 12.5 26.9 39.7 Total Cap. & Liab.Total Cap. & Liab.Total Cap. & Liab.Total Cap. & Liab. 1,8511,8511,8511,851 2,0162,0162,0162,016 2,2502,2502,2502,250 2,6272,6272,6272,627 EBITDA Gth (%) 59.8 13.8 38.1 40.4 Opg Profit Gth (%) 69.7 30.1 38.6 40.8 Non-Cash Wkg. Capital 339 250 289 388 Net Profit Gth (%) 38.5 30.9 40.8 44.5 Net Cash/(Debt) (399) (331) (313) (270) Effective Tax Rate (%) 21.3 25.0 25.0 25.0 Cash Flow Statement (RM m) Rates & Ratio
FY FY FY FY SepSepSepSep 2013201320132013AAAA 2014201420142014FFFF 2015201520152015FFFF 2016201620162016FFFF FY FY FY FY SepSepSepSep 2013201320132013AAAA 2014201420142014FFFF 2015201520152015FFFF 2016201620162016FFFF Pre-Tax Profit 136 184 261 377 Gross Margins (%) 36.0 46.3 45.5 41.7 Dep. & Amort. 14 0 0 0 Opg Profit Margin (%) 22.9 26.4 28.9 29.1 Tax Paid (36) (9) (46) (65) Net Profit Margin (%) 15.0 17.5 19.4 20.0 Assoc. & JV Inc/(loss) (11) (3) (3) (3) ROAE (%) 12.0 13.4 16.7 20.6 Chg in Wkg.Cap. (6) 52 (58) (128) ROA (%) 6.2 7.0 8.9 11.3 Other Operating CF 13 0 0 0 ROCE (%) 8.4 9.1 11.7 14.8 Net Operating CFNet Operating CFNet Operating CFNet Operating CF 109109109109 224224224224 154154154154 181181181181 Div Payout Ratio (%) 25.3 25.8 18.3 19.0 Capital Exp.(net) (174) (80) (80) (80) Net Interest Cover (x) 9.2 8.7 10.9 15.3 Other Invts.(net) (24) (50) (21) (22) Asset Turnover (x) 0.4 0.4 0.5 0.6 Invts in Assoc. & JV 0 0 0 0 Debtors Turn (avg days) 54.9 58.1 56.5 54.2 Div from Assoc & JV 34 0 0 0 Creditors Turn (avg days) 137.6 167.2 153.5 137.7 Other Investing CF 0 0 0 0 Current Ratio (x) 2.1 1.9 1.9 1.9 Net Investing CFNet Investing CFNet Investing CFNet Investing CF (164)(164)(164)(164) (130)(130)(130)(130) (101)(101)(101)(101) (102)(102)(102)(102) Quick Ratio (x) 0.7 0.8 0.8 0.8 Div Paid (13) (26) (35) (35) Net Debt/Equity (X) 0.4 0.3 0.3 0.2 Chg in Gross Debt 49 0 0 0 Net Debt/Equity ex MI (X) 0.4 0.3 0.3 0.2 Capital Issues 52 0 0 0 Capex to Debt (%) 33.4 15.3 15.3 15.3 Other Financing CF 0 0 0 0 Z-Score (X) 0.0 0.0 0.0 0.0 Net Financing CFNet Financing CFNet Financing CFNet Financing CF 88888888 (26)(26)(26)(26) (35)(35)(35)(35) (35)(35)(35)(35) N. Cash/(Debt)PS (sen) (114.2) (79.0) (74.8) (64.3) Currency Adjustments (20) 0 0 0 Opg CFPS (sen) 27.6 41.1 50.5 73.6 Chg in Cash 13 68 18 44 Free CFPS (sen) (15.5) 34.4 17.6 24.0 Quarterly / Interim Income Statement (RM m) Segmental Breakdown / Key Assumptions
FY FY FY FY SepSepSepSep 3Q3Q3Q3Q2013201320132013 4Q4Q4Q4Q2013201320132013 1Q1Q1Q1Q2014201420142014 2Q2Q2Q2Q2014201420142014 FY FY FY FY SepSepSepSep 2013201320132013AAAA 2014201420142014FFFF 2015201520152015FFFF 2016201620162016FFFF Turnover 185 218 182 188 Revenues (RM m) Cost of Goods Sold (115) (142) (118) (113) Property development & 476 489 610 964 GGGGross Profitross Profitross Profitross Profit 70707070 76767676 64646464 76767676 Hotel & property investment 32 34 36 38 Other Oper. (Exp)/Inc (22) (16) (16) (24) Trading 67 72 78 85 Operating ProfitOperating ProfitOperating ProfitOperating Profit 48484848 60606060 49494949 52525252 Manufacturing 9 9 10 10 Other Non Opg (Exp)/Inc 0 0 0 0 Plantation 101 170 249 277 Associates & JV Inc 0 1 1 1 TotalTotalTotalTotal 688688688688 775775775775 983983983983 1,3741,3741,3741,374 Net Interest (Exp)/Inc (6) (2) (5) (7) EBIT (RM m) Exceptional Gain/(Loss) 2 (33) (20) 29 Property development & 115 118 153 239 PrePrePrePre----tax tax tax tax ProfitProfitProfitProfit 44444444 27272727 25252525 75757575 Hotel & property investment 15 15 16 17 Tax (12) (2) (6) (19) Trading 4 5 5 6 Minority Interest 0 0 (2) (5) Manufacturing 0 0 0 0 Net ProfitNet ProfitNet ProfitNet Profit 32323232 24242424 17171717 51515151 Plantation 29 67 109 138 Net profit bef Except. 30 57 37 21 TotalTotalTotalTotal 163163163163 205205205205 284284284284 400400400400 EBITDA 48 61 50 53 EBIT Margins (%) Property development & 24.2 24.1 25.1 24.7 Sales Gth (%) 35.1 17.5 (16.2) 3.1 Hotel & property investment 46.9 45.0 45.0 45.0 EBITDA Gth (%) 88.8 27.3 (18.6) 6.4 Trading 6.7 7.0 7.0 7.0 Opg Profit Gth (%) 91.6 25.4 (19.4) 6.3 Manufacturing (2.3) 1.0 1.5 1.8 Net Profit Gth (%) 155.0 (25.2) (30.8) 203.1 Plantation 28.3 39.2 43.8 49.9 Gross Margins (%) 37.8 35.0 35.3 40.2 TotalTotalTotalTotal 23.723.723.723.7 26.426.426.426.4 28.928.928.928.9 29.129.129.129.1 Opg Profit Margins (%) 26.0 27.7 26.7 27.5 Key Assumptions Net Profit Margins (%) 17.4 11.1 9.2 26.9 CPO ASP (RM/MT) 2,525.5 2,545.1 2,617.9 FFB production (MT) 271,681. 340,780. 382,445. property sales (RMm) 580.8 728.6 896.6 1,058.0 Source: Company, AllianceDBS