Embed Size (px)
Citation preview

På uppdrag av Naturvårdsverket
SMED Rapport Nr 120 2013
Mapping of emissions
from reporting point sources
and
Estimation of emission factors
from reporting waste water treatment plants
Louise Sörme, Veronica Eklund, Johanna Mietala, SCB
Katarina Hansson, Anna Palm Cousins, Mats Ek, Tina Skårman, IVL

1
Publicering: www.smed.se
Utgivare: Sveriges Meteorologiska och Hydrologiska Institut
Adress: 601 76 Norrköping
Startår: 2006
ISSN: 1653-8102
SMED utgör en förkortning för Svenska MiljöEmissionsData, som är ett samarbete mellan IVL, SCB, SLU och
SMHI. Samarbetet inom SMED inleddes 2001 med syftet att långsiktigt samla och utveckla den svenska
kompetensen inom emissionsstatistik kopplat till åtgärdsarbete inom olika områden, bland annat som ett svar på
Naturvårdsverkets behov av expertstöd för Sveriges internationella rapportering avseende utsläpp till luft och
vatten, avfall samt farliga ämnen. Målsättningen med SMED-samarbetet är främst att utveckla och driva
nationella emissionsdatabaser, och att tillhandahålla olika tjänster relaterade till dessa för nationella, regionala
och lokala myndigheter, luft- och vattenvårdsförbund, näringsliv m fl. Mer information finns på SMEDs hemsida
www.smed.se.

2
Preface
This project has been performed by SMED (Swedish Environmental Emission Data) on commission
by Swedish Environmental Protection Agency. SMED is a co-operation between Swedish Environ-
mental Institute (IVL), Statistics Sweden (SCB), Swedish University of Agricultural Sciences (SLU)
and Swedish Meteorological and Hydrological Institute (SMHI). This particular project was carried
out in collaboration between Statistics Sweden and Swedish Environmental Institute (IVL).
A large gratitude goes to Kajsa Boll, Gothenburg University, Sweden for valuable input to the project.
We are also grateful to Dr Rajesh Seth at the University of Windsor, Canada for providing the model
and for valuable support. Also, a large gratitude goes to Anders Finnson, The Swedish Water and
Wastewater Association and Cajsa Wahlberg (Stockholm Water) for valuable contributions in a work-
shop during the project. Finally, a large gratitude goes to PhD Niklas Ricklund, Swedish Environ-
mental Protection Agency, who financed the project, contributed during a workshop as well as con-
tributed with improvements to the text in the report.

3
Innehåll
PREFACE 2
INNEHÅLL 3
SUMMARY 5
SAMMANFATTNING 8
BACKGROUND 11
Purpose and goal 13
SUBPROJECT 1. MAPPING OF EMISSIONS FROM REPORTING POINT SOURCES 14
Introduction and background 14
Methods 15
Results and discussion 15
Pollutant release data per pollutant, receiving media and E-PRTR-activity 15
Methods for reporting pollutant release data 19
Discussion 25
SUBPROJECT 2. ESTIMATION OF EMISSION FACTORS FROM REPORTING WASTE
WATER TREATMENT PLANTS 27
Background and introduction 27
Methods 28
Data from previous measurements and national environmental monitoring 28
Modelling 28
Results and Discussion 31
Previous measurements 31
Modelling 33
Comparison between the two methods 37
Recommendations emission factors 38
REFERENCES 40
APPENDIX 1 PARAMETER LIST 42
APPENDIX 2 SECTORS 47
APPENDIX 3. RESULTS - GREENHOUSE GASES 52
APPENDIX 4. RESULTS - OTHER GASES 54
APPENDIX 5. RESULTS - METALS 56

4
APPENDIX 6. RESULTS - INORGANIC SUBSTANCES 61
APPENDIX 7. RESULTS - CHLORINATED ORGANIC SUBSTANCES 66
APPENDIX 8. RESULTS - OTHER ORGANIC SUBSTANCES 71
APPENDIX 9. WWTPS IN MONITORING PROGRAM 76
APPENDIX 10. RESULTS – RATIO (WATER/SLUDGE) FROM MEASUREMENTS 77
APPENDIX 11 DATA USED FOR MODELLING AND RESULTS 84
5
Summary
According to EC Regulation 166/2006 the operator is responsible for the quality of the information
they report. The competent authority is responsible, however, to assess whether the reported infor-
mation is complete, consistent and credible. Sweden has reported data to the E-PRTR (European Pol-
lutant Release and Transfer Register) since the year 2007. However, there has been no general survey
of the reporting point sources with respect to which substances that are reported by the companies in a
particular industry, neither which method that has been used to report the emissions.
Earlier work has shown that only a few organic compounds were reported from very few waste water
treatment plants (WWTP) in SMP, e.g. DEHP, alkylphenols, nonylphenol and PAHs. Earlier studies
had also shown that there seems to be a huge under-reporting of the emissions of organic substances.
For alkylphenols and APEs, DEHP, nonylphenol, octylphenol and PAH it is estimated that, the
amounts reported for Sweden should increase by 204, 202, 2288, 823 and 300% respectively if all
WWTPs reported. It is also difficult to measure substances in the effluent (outgoing water from
WWTP) and therefore there is a need to find other ways, such as use of emission factors to estimate
releases to water. An aid to calculate the emissions could provide a more complete reporting from
WWTP in the future.
The project had two sub-projects:
The purpose of the first sub-project was to map the data reported for 2011 to the E-PRTR (re-
leases to water and air and as off-site transfers to WWTP), for all reported E-PRTR pollutants
and all industry sectors in Sweden. With mapping is here meant to sort, organize and group
the emissions data and methodology for the development of emission data for facilities in the
same industry sector
The purpose of the second sub-project was to develop emission factors for estimating emis-
sions to water from municipal WWTP, for 18 substances / substance groups1. These emission
factors could be used by WWTP in the reporting of emissions data in the emission declara-
tions in the annual environmental report which in turn are used to the E-PRTR reporting.
In the first subproject, emission data from the Swedish Portal for Environmental Reporting (SMP)
were studied regarding releases year 2011 for receiving media: air, water and off-site transfers of pol-
lutants to WWTP from PRTR classified facilities. For the receiving media air, totally 666 facilities
reported emissions year 2011. The corresponding numbers for releases to water and as off-site trans-
fers to waste water were 331 respectively 157.
The mapping of emissions from reporting point sources was performed for each receiving media. Data
was compiled for each pollutant and E-PRTR activity. For each E-PRTR activity and pollutant, emis-
sion data was presented as a percentage of the total number of PRTR classified facilities reporting
emissions to the receiving media. The results were presented as percentage below and above the
threshold values to E-PRTR. Further, a compilation of determination methods used for reporting re-
lease data to SMP were performed. The methods used were divided into measured (M), calculated (C)
1 nonylphenol and nonylphenol ethoxylates, octylphenol and octylphenol ethoxylate, polybrominated dinfenylethers(PBDEs)
phthalate (DEHP), tetrachlorethylene (per), tetrachloromethane (carbon tetrachloride) Trichlorobenzenes, 1,2-Dichloroethane,
Trichloroethylene (tri) dichloromethane, trichloromethane (chloroform), PAH (total 4) anthracene, flouranten, benzo (g, h, i)
perylene, chloroalkanes (C10-13), hexachlorobutadiene (HCBD), isodrin.

6
and estimated (E) and compiled for each receiving media and pollutant. For the organic substances, it
was further investigated if the use of release determination methods could be presented per receiving
media, pollutant and E-PRTR activity.
The result showed that generally, for all the receiving media and pollutants, there was higher percent-
age of reported releases below the thresholds values to E-PRTR compared to releases above the
thresholds. The results from this project indicated that the thresholds to E-PRTR, in many cases, may
be too high. Emissions of all pollutants are not expected to occur from all sectors. There was however
some examples of sectors missing expected release data, for instance, releases of CH4 and N2O to air
from sector 7 (Intensive livestock production and aquaculture). Out of all the facilities within sector 7
only one reported emissions of N2O below the E-PRTR threshold and none above. None of them re-
port any values neither below nor above the E-PRTR threshold for CH4. Organic substances as a group
was rarely reported except for release of dioxins and PAH to air, AOX to water and phenols and
TOC/CODCr to water and as off-site transfer to waste water. If reported, the emissions generally were
below the thresholds to E-PRTR.
The use of determination methods (C, M, E) for reporting releases to air, water and as off-site transfer
to waste water varied with different pollutants and receiving media. For many of the pollutants, lack of
data made it difficult to compare and map the methods to report the releases. Generally, measurement
methods were more frequently used and the estimation methods were used less often.
In the second subproject two different methods were used to try to develop emission factors; previous
measurements and modelling. By using previous measurements of the substances in the effluent from
WWTP and in sewage sludge a factor could be estimated. Data were retrieved from a report (Petters-
son and Wahlberg, 2010) and from national environmental monitoring. For the modelling, a Sewage
Treatment Plant (STP) model that calculates how a substance is distributed between air, water, sewage
sludge and biodegradation was used. The model selected for this purpose is called STP-EX and was
developed by Seth et al. (2008). The model includes the octanol-water partition coefficient (Kow),
which is a measure of how a substance / group of substances are distributed between water and fat.
The more hydrophobic the substances are, the more they bind to particles, such as the sewage sludge.
The approach is to use the distribution between the different media and the known amount of sewage
sludge produced in the WWTP and then estimate the amount (or concentration) of the substance in the
effluent.
Looking at the entire dataset from previous measurements, 110 of totally 132 reported data on release
to water were below the detection limit for the analyses. The corresponding numbers for sludge were
39 of 164. A ratio (total amount of chemical in water/total amount chemical in sludge) was calculated
for the substances and WWTPs when both the sludge and effluent water data were available. Due to a
large number of values below the detection limit, ratios could only be developed for 4-tert-octylphenol
and 4-nonylphenol. The ratios for 4-tert-ocylphenol varied between 0.06 and 0.52 for the different
WWTPs, with an average of 0.11. The ratios for 4-nonylphenol, branched varied between 0.02 and 23
with an average value of 4.4.The ratios vary between the different WWTP, which may depend on both
the normal variance due to different load, size and technical properties of the WWTPs.
The results from the modelling showed that the predicted chemical distribution differs between chemi-
cals as well as between the different WWTPs, but the general pattern is that hydrophobic compounds,
will mainly end up in the sludge and VOCs will mainly biodegrade or evaporate. Other compounds of
intermediate hydrophobicity and reactivity, such as e.g. fluoranthene, will partly biodegrade and partly

7
end up in the sludge. Most substances included in the study had a ratio of 0,1 or less which means that
only a minor part will end up in the effluent. A ratio above 1 implies that on an annual basis, larger
amounts of chemical are predicted to be released with effluent water than with sludge. An emission
factor (total amount of chemical in water/total amount chemical in sludge) of about one or above was
estimated for tetrachlorethylene, tetrachloromethane, trichlorobenzene, 1,2-dichloroethane, trichloro-
ethylene, dichloromethane and trichloromethane. The results showed that the ratios for individual
substances differ between the included WWTPs, by up to a factor of 30 (for trichloroethylene. The
water/sludge ratio differs not only between chemicals and different WWTPs, but may also vary
between years. TSS (Total Suspended Solids) in the effluent water and the volume of incoming water
(influences the hydraulic retention time and thus biodegradation) and its properties were parameters
that had a high influence on the factor for the included substances. These two factors are prabably also
an explanation for the large variations in factors calculated by measurements.
Both methods (measurements and modelling) illustrate a large variation between different WWTPs,
and an inappropriateness of using one common substance specific ratio for emission calculations. This
leads to the recommendation that WWTP specific ratios should be derived that can be used to estimate
emissions with outgoing water from sewage sludge data. There are relatively few WWTPs that have to
report to E-PRTR and for those WWTP’s modelling is the preferred method, since it proved to be
difficult to measure most substances in the low concentration that is needed. It is also important to pay
attention to changing conditions between years in the WWTP, as they influence the fate of the chemi-
cals. To evaluate the applicability of the suggested model assessment methodology for Swedish
WWTPs it is desirable to conduct empirical monitoring studies in selected WWTPs and for selected
substances to investigate how well the model agrees with measurements. Even though the model has
shown good results compared to measured data in earlier studies, it has not been evaluated for Swed-
ish conditions, which in some cases deviate, for example due to the common practice of chemical
precipitation, biological nitrogen removal and sludge digestion, that are actually not included in the
model. Therefore, a reliable empirical ratio requires regular monitoring in sludge and water (to cover
variations in water flow and TSS-content) as well as sampling and analytical methods that are sensi-
tive enough for detection both in water and sludge.
The results from the STP(Sewage Treatment Plant) model also indicated that there were only a few
substances that are close to or above the emission threshold for reporting; DEHP, nonylphenols, octyl-
phenols, PBDE, PAH and chloroalkanes. This is important information for the WWTPs. In a previous
study, 17 substances were identified to be of potential concern, largely based on concentrations below
the detection limits. This study limited the number of substances or groups to six.

8
Sammanfattning
Enligt EG-förordningen 166/2006 är verksamhetsutövaren ansvarig för kvaliteten på den information
som de rapporterar. Den behöriga myndigheten är dock ansvarig för att bedöma om den rapporterade
informationen är fullständig, konsekvent och trovärdig. Sverige har rapporterat data till det E-PRTR
(European Pollutant Release and Transfer Register) sedan år 2007. Däremot har det inte funnits någon
allmän kartläggning av de rapporterande punktkällorna avseende vilka ämnen som redovisas av före-
tagen inom en viss bransch eller vilken metod som har använts för att redovisa utsläppen.
Tidigare arbete har visat att endast ett fåtal organiska föreningar rapporterades från ett fåtal renings-
verk (ARV) i SMP, t.ex. DEHP, alkylfenoler, nonylfenol och PAH. Tidigare studier har också visat att
det verkar finnas en stor underrapportering av utsläpp av organiska ämnen.
För alkylfenoler och alkylfenoletoxylater, DEHP, nonylfenol, oktylfenol och PAH uppskattas det att
de värden som redovisas för Sverige ska öka med 204, 202, 2288, 823 och 300% respektive om alla
reningsverk rapporterade sina utsläpp. Det är också svårt att mäta ämnen i avloppsvattnet och därför
finns det ett behov av att hitta andra sätt, till exempel användning av emissionsfaktorer för att uppskat-
ta utsläpp till vatten. Ett hjälpmedel för att beräkna utsläppen skulle kunna ge en mer komplett rappor-
tering från reningsverk i framtiden.
Projektet hade två delprojekt:
Syftet med det första delprojektet var att kartlägga rapporterade data för 2011 (utsläpp till vat-
ten och luft och som transport till reningsverk) till E-PRTR, alla rapporterade E-PRTR ämnen
och alla branscher. Med att kartlägga menas här att sortera, organisera och gruppera utsläpps-
data och metodik för framtagning av utsläppsdata för verksamhetsutövare inom samma
bransch
Syftet med det andra delprojektet var att utveckla emissionsfaktorer för att uppskatta utsläpp
till vatten för E-PRTR från kommunala reningsverk för 18 ämnen / ämnesgrupper2. Dessa
emissionsfaktorer skulle kunna användas av reningsverk vid rapporteringen av utsläppsdata i
emissionsdeklarationerna som i sin tur används för att rapportera till E-PRTR.
I det första delprojektet studerades utsläppsdata från Svenska miljörapporteringsportalen (SMP) gäl-
lande utsläppsåret 2011 för följande mottagare: luft, vatten och borttransport av föroreningar i av-
loppsvatten. En sammanställning av utsläppsdata gjordes för PRTR-klassade anläggningar. För motta-
garkod luft, rapporterade totalt 666 anläggningar utsläpp år 2011. Motsvarande siffror för utsläpp till
vatten och som borttransport av föroreningar i avloppsvatten var 331 respektive 157.
Kartläggningen av utsläppen från rapportering punktkällor utfördes för varje mottagarkod, förorening
och PRTR-kod. För varje PRTR kod och förorening presenteras utsläppsdata som en procentsats av
det totala antalet PRTR klassade anläggningar inom respektive mottagarkod. Resultaten presenterades
som procent under (<tv) och över (> tv) tröskelvärdena till E-PRTR. Vidare genomfördes också en
sammanställning av de metoder som används för framtagning av utsläppsdata från rapporterande
punktkällor. Metoderna delades upp i uppmätta (M), beräknade (C) och uppskattade (E) och samman-
2 nonylfenol and nonylfenoletoxilat, oktylfenol and oktylfenoletoxilat, polybromerade dinfenyletrar(PBDEs) dietylhexylftalat
(DEHP), tetrakloretylen (per), tetraklorometan (koltetraklorid), triklorbensen, 1,2-dikloroetan, trikloretylen (tri) diklormetan,
triklrmetan (kloroform), PAH (summa 4) antracen, flouranten, benzo (g, h, i) perylen, kloroalkaner (C10-13), hexaklorobutadien
(HCBD), isodrin.

9
ställdes för varje mottagarkod och föroreningar. För organiska ämnen undersöktes även om en
branschspecifik uppdelning av de använda metoderna kunde genomföras.
Generellt, för alla tre mottagande media och föroreningar, är andelen av de rapporterade utsläppen
under tröskelvärdena till E-PTRT högre jämfört med utsläppen över tröskelvärdena. Resultaten från
föreliggande projekt indikerar att i vissa fall kan tröskelvärden till E-PRTR vara för högt satta. Utsläpp
av alla föroreningar förväntas inte ske från samtliga E-PRTR sektorer. Det finns dock exempel på
sektorer för vilka förväntade utsläppsdata saknas. Ett exempel är utsläpp av CH4 och N2O till luft från
sektor 7 (Intensiv animalieproduktion och intensivt vattenbruk). Av alla anläggningar inom sektor 7
rapporterar endast en anläggning utsläpp av N2O under tröskelvärdet till E-PRTR och ingen av an-
läggningarna rapporterar några utsläpp av CH4. Med undantag för utsläpp av dioxiner och PAH till
luft, AOX till vatten och fenoler och TOC/CODCr till vatten och som borttransport av föroreningar i
avloppsvatten rapporteras organiska ämnen endast från ett fåtal verksamhetsutövare. Om data rappor-
teras, är utsläppen i allmänhet under tröskelvärdena till E-PRTR.
Användningen av bestämningsmetoder för rapportering av utsläpp till luft, vatten och som borttrans-
port av föroreningar i avloppsvatten (C, M, E) varierar med olika föroreningar och mottagande media.
För många av de föroreningarna gör brist på data det svårt att jämföra och kartlägga utsläppen. Gene-
rellt är mätmetoder vanligare och uppskattningsmetoder används mer sällan.
I det andra delprojektet användes två olika metoder för att försöka utveckla emissionsfaktorer; tidigare
mätningar och modellering. Genom att använda tidigare mätningar av ämnen i avloppsvatten från
reningsverk och i avloppsslam kunde en faktor uppskattas. Data hämtades från en rapport och från
nationella miljöövervakningen. För modelleringen användes en reningsverksmodell (STP) som beräk-
nar hur ett ämne fördelar sig mellan luft, vatten, avloppsslam och biologisk nedbrytning. Modellen
som har använts kallas STP-EX och har utvecklats av Seth et al. (2008). Modellen inkluderar oktanol-
vatten fördelningskoefficienten (Kow), vilket är ett mått på hur en substans/grupp ämnen fördelas
mellan vatten och fett. Ju mer hydrofoba substanser är, desto mer de binder till partiklar, såsom av-
loppsslam. Metoden använder fördelningen mellan de olika medierna och den kända mängden av-
loppsslam som produceras i reningsverket och uppskattar sedan mängden (eller koncentrationen) av
ämnet i utgående vatten från reningsverk.
Av 132 mätningar var 110 av totalt 132 under detektionsgränsen för analyserna. Motsvarande siffror
för slam var 39 av 164. En faktor (total mängd kemikalie i vatten/total mängd kemikalie i slam) beräk-
nades för de olika kemikalierna vid respektive reningsverk när det fanns tillgänglig data På grund av
ett stort antal värden under detektionsgränsen, kunde faktorer endast utvecklas för 4-tert-oktylfenol
och 4-nonylfenol. Faktorerna för 4-tert-ocylphenol varierade mellan 0,06 och 0,52 för de olika re-
ningsverken, med ett genomsnitt på 0,11. Faktorerna för 4-nonylfenol, grenad varierade mellan 0,02
och 23 med ett medelvärde av 4.4. Att faktorerna varierar mellan olika avloppsreningsverk kan bero på
både normala variansen på grund av olika belastning, storlek och tekniska egenskaper hos olika re-
ningsverk.
Resultaten från modelleringen visade att den förutspådda kemiska fördelningen skiljer sig åt mellan
kemikalier samt mellan olika reningsverk, men det allmänna mönstret är att hydrofoba föreningar,
främst kommer att hamna i slammet och VOC kommer främst brytas ned eller avdunsta. Andra före-
ningar av mellanliggande hydrofobicitet och reaktivitet, som t.ex. fluoranten, kommer delvis brytas
ned och delvis att hamna i slammet. De flesta ämnen som ingår i studien hade ett förhållande på 0,1
eller lägre, vilket innebär att endast en mindre del kommer att hamna i utgående avloppsvatten. En

10
kvot över 1 innebär på årsbasis, att större mängder av kemikalier förutspås att hamna i utgående av-
loppsvatten än med slam. En emissionsfaktor (total mängd kemikalie i vatten/total mängd kemikalie i
slam) på ca ett eller högre uppskattades för tetrakloreten, tetraklormetan, triklorbensen, 1,2-dikloretan,
trikloretylen, diklormetan och triklormetan. Resultaten visade att förhållandena för enskilda ämnen
skiljer sig åt mellan de ingående reningsverk, med upp till en faktor 30 (för trikloretylen). Vatten/slam
förhållandet skiljer sig inte bara mellan kemikalier och olika reningsverk, det kan också variera mellan
åren. TSS (Torr Suspenderad Substans) i utgående avloppsvatten och volymen av inkommande vatten
(påverkar den hydrauliska retentionstiden och därmed den biologiska nedbrytningen) med dess egen-
skaper var parametrar som hade en hög påverkan på faktorn för de studerade ämnena. Dessa två fakto-
rer är troligen också en förklaring till de stora variationerna i faktorer beräknade från mätningar.
Båda metoderna (mätningar och modellering) illustrerar en stor variation mellan olika reningsverk,
vilket innebär att det är olämpligt att använda en gemensam ämnesspecifik kvot för utsläppsberäk-
ningar. Detta leder till rekommendationen att utveckla reningsverksspecifika kvoter som kan användas
för att uppskatta utsläppen med utgående vatten från data i avloppsslam. Det är relativt få reningsverk
som måste rapportera till E-PRTR och för dem är modellering att föredra, eftersom det visade sig vara
svårt att mäta de flesta ämnen i så låg koncentration som behövs. Det är också viktigt att uppmärk-
samma förändrade villkor mellan åren i reningsverken, eftersom det påverkar var kemikalierna ham-
nar. För att utvärdera den föreslagna modellen för svenska reningsverk är det önskvärt att genomföra
empiriska studier i utvalda reningsverk och för utvalda substanser för att undersöka hur väl modellen
överensstämmer med mätningar. Trots att modellen har visat goda resultat jämfört med mätdata från
tidigare studier har det inte utvärderats för svenska förhållanden, som i vissa fall avviker, till exempel
på grund av den praxis för kemisk fällning, biologisk kväverening och slamrötning, som inte ingår i
modellen.
Resultaten från STP-modellen visade också att det endast är ett fåtal ämnen som är nära eller över
utsläppströskeln för rapportering; DEHP, nonylfenoler, oktylfenoler PBDE, PAH och kloralkaner.
Detta är viktig information för reningsverk. I en tidigare studie har 17 ämnen identifierades vara av
intresse, till stor del baserad på koncentrationer under detektionsgränserna. Denna studie har begränsat
antal ämnen eller grupper till sex.

11
Background
Sweden has reported data to the E-PRTR since the year 2007. However, there has been no general
survey of the reporting point sources with respect to the reasonableness of which substances that are
reported by the companies in a particular industry. In the development project "Diffuse emissions to
air and water” (Hansson et al., 2012) the emissions of cadmium and nitrogen to water was compiled
and divided by industry. In the study, however, no general survey of the industry-specific emissions
was performed. According to EC Regulation 166/2006 the operator is responsible for the quality of the
information they report. The competent authority is however responsible to assess whether the re-
ported information is complete, consistent and credible.
Many substances are relatively new in emissions reporting to E-PRTR, which can lead to difficulties
for operators to make the plausibility of the substances that may be relevant to report. The OECD runs
currently a joint project between the Task Force on Exposure Assessment and Task Force on Pollut-
ants Release and Transfer Registers. The project aims to compile information regarding the wastewa-
ter treatment plant (WWTP) from the member countries regarding methods, tools and models used in
exposure assessment and emissions estimation. The work is led by Canada and to date a preliminary
report is present, but not official.
During 2012 the degree thesis "Analysis of the Swedish release substances” was conducted (in Swed-
ish)3, with the attempt to make a total estimate per substance. All companies in a given industry sector
was included, regardless of whether they report to the E-PRTR or not. The study shows that the sup-
porting data to make statistical estimates to a total estimate of the selected substance groups per indus-
try sector were often not possible, because it was often too few companies which reported releases per
substance. It was therefore not possible to establish whether there was a general statistical relationship
between the emissions of the different companies. Although for release of carbon dioxide, nitrogen
and nickel to air a statistical relation between the emissions was shown.
An opportunity to assess the quality as a first step is to identify emissions from companies in the same
industry and compare if they report the same substances and uses the same methods. By using this
approach the project would then be able to provide answers to questions such as:
which industry sectors report coherently?
What substances seem to be relevant to report for different industries?
What methods are used in different industry sectors or for specific substances?
The results of such a survey could be presented on the Swedish PRTR site and on the Swedish Portal
for Environmental Reporting (SMP). It could act as a support for companies that are reporting emis-
sions to E-PRTR. Over time, this survey could lead to better reporting by presenting the results on the
Swedish PRTR site. Companies may also be more satisfied if they get the support to know what sub-
stances they probably should report, by getting information on how other companies in the same in-
dustry have reported.
Hansson et al. (2012) found that only a few organic compounds were reported from waste water treat-
ment plants (WWTP) in SMP, e.g. DEHP, alkylphenols, nonylphenol and PAHs. Research presented
3 Berglund D., (2012): ”Analys av svenska utsläppsämnen – en skattning av branschers utsläpp”. Degree project, KTH Royal
Institute of Technology, Sweden.

12
in the report shows that there seems to be a huge under-reporting of the emissions of organic sub-
stances. Another report (Pettersson and Wahlberg, 2010) noted that several substances could fall
above the threshold when it comes to emissions to water, this project used the findings in this report to
select substances to include. Above threshold means that the WWTP has to have to report the emis-
sions to SMP here are most heavy metals and a number of organic substances. Another 13 substances
had a high detection limit, so that it was not possible to determine if they are present above threshold
values or not.
By compiling the pollutants reported in 2010 by some WWTP and relate the emitted amounts to the
size of the WWTP it was possible to estimate total emissions from all 15 major WWTP, even for those
that not reported any values (Ek, 2011). This compilation showed that there is a probable underreport-
ing. For alkylphenols and APEs, DEHP, nonylphenol, octylphenol and PAH it is estimated that, the
amounts reported for Sweden should increase by 204, 202, 2288, 823 and 300% respectively.
Prior to the start of the E-PRTR reporting in the SMP, some WWTP got together and discussed how
the reporting issue should be handled (Finnson, personal contact, 2012). The project included several
large WWTPs in Sweden, for example Stockholm Water, Sydvästra Stockholmsregionens va-
verksaktiebolag (SYVAB), VAFAB and a few others. It was then stated that it is very difficult to
measure some organic substances in the effluent (outgoing water from WWTP) due to low concentra-
tions. The results may also vary between different laboratories. According to Lindblom (personal con-
tact, 2012) this project did not result in any estimation support to estimate emissions of organic sub-
stances to water. It was decided to focus on measuring content in the sewage sludge, because the
greatest amount of organic substances ends up there since many of these substances dissolve poorly in
water.
In summary, different studies indicate that there are probably emissions of organic substances from
WWTP that should be reported to a much greater extent than is actually reported today. It is difficult
to measure substances in the effluent and therefore there is a need to find other ways, such as use of
emission factors to estimate releases to water. An aid to calculate the emissions could provide a more
complete reporting from WWTP in the future.
At the PRTR meetings, EU and OECD member states have addressed a need for the development of
guidance documents, in order to improve the quality of the reported data. Results from this study could
possibly be used in the EU, to address what substances that are relevant for what sectors and methods
used (sub-project 1) and to improve the reporting of WWTPs (sub-project 2).

13
Purpose and goal The project has two sub-projects:
The purpose of the first sub-project was to map the data reported for 2011 (releases to water
and air and as off-site transfers to WWTP) to the E-PRTR, for all reported E-PRTR pollutants
and all industry sectors in Sweden. With mapping is here meant to sort, organize and group
the emissions data and methodology for the development of emission data for facilities in the
same industry sector
The purpose of the second sub-project was to develop emission factors for estimating emis-
sions to water from municipal WWTP, for 18 substances / substance groups4. These emission
factors can be used by WWTP in the reporting of emissions data in the emission declarations
in the annual environmental report which in turn are used to the E-PRTR reporting.
4 nonylphenol and nonylphenol ethoxylates, octylphenol and octylphenol ethoxylate, polybrominated dinfenylethers(PBDEs)
phthalate (DEHP), tetrachlorethylene (per), tetrachloromethane (carbon tetrachloride) Trichlorobenzenes, 1,2-Dichloroethane,
Trichloroethylene (tri) dichloromethane, trichloromethane (chloroform), PAH (total 4) anthracene, flouranten, benzo (g, h, i)
perylene, chloroalkanes (C10-13), hexachlorobutadiene (HCBD), isodrin.

14
Subproject 1. Mapping of emissions from reporting point sources
Introduction and background E-PRTR covers releases to air, water, land, and off-site transfers of pollutants through the wastewater
and off-site transfers of waste for 65 different activities specified in Annex I to the EC Regulation. The
activities are grouped into 9 different sectors (see Table 1).
Table 1. Sectors according to Annex I to the EC Regulation (EU, 2006).
Sector number Sector name
1 Energy sector
2 Production and processing of metals
3 Mineral industry
4 Chemical industry
5 Waste and waste water management
6 Paper and wood production and processing
7 Intensive livestock production and aquaculture
8 Animal and vegetable products from the food and beverage sector
9 Other activities
For each pollutant given in Annex II to the EC Regulation and waste a threshold is set and if the appli-
cable threshold is exceeded the amount of the pollutant must be reported per facility. The threshold
values for discharges to water also apply to off-site transfers of pollutants in waste water to be puri-
fied. All the pollutants listed in the Annex II of the Protocol and EC Regulation are not likely to be
released or transferred by all 65 activities. Whether or not a pollutant is released or transferred, in
levels above the threshold values for the pollutant, depends on the specific characteristics of the facil-
ity (EU, 2006). The pollutants listed in the Annex II, and the corresponding pollutants codes and
thresholds values both according to EU and the Swedish regulation on environmental reports (NFS
2006:9) are presented in Appendix 1 to this report. In Appendix 1 it can be seen that for some pollut-
ants Sweden has set a lower thresholds compared to EU. Also, pesticides that no longer are in use in
Sweden due to regulations are not subject to reporting requirements.
Sweden has reported data on releases of pollutants to air, water and off-site transfers of pollutants to
WWTP and of waste according to E-PRTR since the first reporting year to EU in 2007. However, this
project does not include off-site transfers of waste. Appendix 2 to this report lists the 65 different ac-
tivities for the 9 different sectors.
The release and transfer data on pollutants reported to SMP by each facility can be based on three
different principal determination methods (EU, 2006):
1. Measurements (M) using standardised or accepted methods; often, additional calculations are
needed to convert the results of measurements into annual emission data.
2. Calculations (C) using nationally or internationally agreed estimation methods and emission
factors, which are representative for the industrial sectors.
3. Estimations (E) not-standardised derived from best assumptions or expert guesses.

15
Methods Emission data set regarding the releases of the year 2011 for receiving media: air, water and off-site
transfers of pollutants to WWTP were used in this study (copy of SMP, 2012-09-12). Only total emis-
sions from PRTR-classified facilities were included in the compilation. For the receiving media air,
totally 666 facilities reported emissions in year 2011. The corresponding numbers for releases to water
and as off-site transfers to waste water were 331 respectively 157.
The data set was not quality checked in this project. This may mean that some of the facilities may be
wrongly classified and thus slightly influence the results. However, for the activity 5f: Urban WWTP,
an exception was made and the classification of facilities was checked. Four facilities were wrongly
classified in the dataset and thus removed. Another one (Borås WWTP) was missing in the 2011 year
reporting, which means that only 14 of totally 15 large WWTPs were included in the compilation.
The mapping of emissions from reporting point sources was performed for each receiving media. Data
was compiled for each pollutant and E-PRTR activity. The list of all E-PRTR activities is shown in
Appendix 2. Further, it is also indicated in the table whether or not a release or off-site transfers to
WWTP of any pollutant is reported in the data set used in this project. For each E-PRTR activity and
pollutant, emission data was presented as a percentage of the total number of PRTR classified facilities
reporting emissions to the receiving media. The results were presented as percentage below (<t v) and
above (> t v) the threshold for releases to E-PRTR.
In order to compile the information regarding methods used in the reporting of releases of pollutants to
SMP, the same data set was studied. The methods were divided into measured (M), calculated (C) and
estimated (E) and were compiled for each receiving media and pollutant. The summery was only per-
formed for the entire data set and not divided per E-PRTR activity. However, for the organic sub-
stances, it was further investigated if the use of release determination methods could be presented per
receiving media, pollutant and E-PRTR activity.
Results and discussion Pollutant release data per pollutant, receiving media and E-PRTR-activity
GENERAL
Below, release data regarding the 2011 year releases of pollutant to air, water and as off-site transfer to
waste water and E-PRTR activity is presented in text. The results are further presented in tables in
Appendix 3-8. For the further description of the E-PRTR activities and sectors used below, see Ap-
pendix 2 and Table 1.
For some of the pollutants, e.g. total nitrogen (N-tot) the data may be reported to SMP as emission of
N-tot or as NH4-N or NO2+NO3-N. If N-tot data is not available, than the NH4-N or NO2+NO3-N val-
ues are recalculated using standardised factors and reported as total nitrogen (N-tot) to E-PRTR. The
same is valid for total phosphorus (P-tot) that may be reported as P-tot or PO4-P. The parameter TOC
(total organic carbon) may be reported to SMP as TOC or as CODCr (CODCr data are multiplied by a
factor 1/3). In this study, all the alternative parameters have been included in the presentation of re-
lease data.
Out of the 157 facilities that reports off-site transfers to waste water, 58 facilities had not reported
emissions to a water recipient. This is particularly relevant for the E-PRTR activity 4.a.ii (Chemical

16
installations for the production on an industrial scale of basic organic chemicals, such as: Oxygen-
containing hydrocarbons) where 14 facilities reported off-site transfers and only 1 reported emissions
to a water recipient. This is also relevant for the whole sector 8 (Animal and vegetable products from
the food and beverage sector) where in total 41 facilities reported off-site transfers to waste water, but
only 11 facilities reported emissions to a water recipient.
GREENHOUSE GASES
In this group following pollutants are included: methane (CH4), carbon dioxide (CO2), hydro-
fluorocarbons (HFC), nitrous oxide (N2O), perfluorocarbons (PFC) and sulphur hexafluorid (SF6).
Air
Emissions to air of greenhouse gasses are reported from all sectors. CO2 is the most commonly re-
ported gas and 113 out of 666 facilities (17%) report emissions of CO2 below the E-PRTR threshold
values and 95 out of 666 facilities (14%) report emissions of CO2 above the E-PRTR threshold values
(see Appendix 3). The rest of the facilities (69%) do not report any emissions of CO2, below or above
the threshold value.
Other climate gasses frequently reported by the different facilities are N2O, CH4 and HFC. Between
2.4-7.2% of the facilities reported values for these climate gasses that were below E-PRTR threshold
values and 1.6 – 5.9% of the facilities reported emissions that were above E-PRTR threshold (see
Appendix 3).
Out of the 666 facilities, 227 fall under sector 7 (Intensive livestock production and aquaculture). Two
of the main emissions from agriculture are CH4 and N2O. Nitrous oxide is emitted when nitrogen is
added to the soil through the use of fertilizers. Domestic livestock produce CH4 as part of their normal
digestive process and when animals' manure is stored or managed in lagoons or holding tanks both
CH4 and N2O is produced. But out of all the facilities within sector 7, only one report emissions of
N2O below the E-PRTR threshold and none above. None of them report any values neither below nor
above the E-PRTR threshold for CH4 (see Appendix 3).
OTHER GASES
This group include following pollutants: carbon monoxide (CO), ammonia (NH3), non-methane vola-
tile organic compounds (NMVOC), nitrogen oxides (NOx/NO2), sulphur oxides (SOx/SO2), hydro-
chlorofluorocarbons (HCFCs), chlorofluorocarbons (CFCs), chlorine and inorganic compounds (HCl),
fluorine and inorganic compounds (HF) and hydrogen cyanide (HCN).
Air
Emissions to air from “other gases” (than climate gasses) are reported by all sectors and have a higher
proportion of facilities reporting values both below and above E-PRTR threshold than for climate
gasses (see Appendix 4).
The most commonly reported gasses within this group are NH3, NMVOC, NOX and SO2 and the per-
centage of facilities reporting values below E-PRTR threshold range between 16 - 39%. The percent-
age of facilities reporting values above the E-PRTR threshold for these gasses, is lower and ranging
from 2.4% for SO2 up to 17% for NH3 (see Appendix 4). Why the rest of the facilities do not report
any emissions below or above the threshold value is unclear.

17
Facilities within sector 7 only report emission for NH3. Sector 7 is also the one sector which has the
highest percentage of facilities reporting values below and above the E-PRTR threshold. The most
commonly reported gas is NH3 and by sector 7.
METALS
In this group following metals and their compounds are included: arsenic (As), cadmium (Cd), chro-
mium (Cd), copper (Cu), mercury (Hg), nickel (Ni) lead (Pb) and zinc (Zn).
Air
According to EU (EU, 2006) emissions of metals are expected for sector 1-4 and sector 6, while emis-
sions are only partly expected for sector 5, 8 and 9 and not at all from sector 7.
The reporting of emissions of metals to air is limited for all sectors and the majority of the reported
emissions are below the current threshold for each pollutant (see Appendix 5). Sector 2, 3 and 6 have a
higher proportion of facilities reporting values both below and above E-PRTR threshold for metals
compared to sector 1 and 4. It should be noted that none of the facilities within the energy sector, E-
PRTR classified as large combustion plants (1.c) and refineries (1.a), exceeds any of the E-PRTR
thresholds for metals. Only one facility in sector 3 and 4 respectively exceed the given E-PRTR
thresholds. Depending on the metal, 3-14% of the reported emissions to air are below the E-PRTR
threshold values and 1-4% above the E-PRTR threshold values (see Appendix 5).
Overall, it can be seen in Appendix 5 that not many facilities reports emissions above the E-PRTR
thresholds for metals.
Water
Generally, emissions of all or some specific metals are reported from sectors 1 to 6 (see Appendix 5).
Sector 7 and 8 are not reporting any emission to water, which also is expected due to the type of activ-
ity (EU, 2006). From sector 9, only the release of chromium and zinc are reported.
Depending on the metal, 21-43% of the reported emissions to water are below the E-PRTR threshold
values and 4-19% above the E-PRTR threshold values (see Appendix 5).
Off-site transfers
The content of metals in the release to water reported as off-site transfers, concerns all sectors with the
exception of sector 8 where only a marginal amount of the reporting of off-site transfers concerns
metals (Appendix 5).
Depending on the metal, 25-41 % of the facilities report a value below the E-PRTR threshold value
and 1-4% a value above.
INORGANIC SUBSTANCES
In the group “inorganic substances” the following substances are included: particulate matter (PM10),
ammonia (NH4-N), nitrate and nitrite as nitrogen (NO2+NO3-N), total nitrogen (N-tot), total phospho-
rus (P-tot), phosphate as phosphorus (PO4-P), chlorides (Cl-tot) and fluorides (F-tot).

18
Air
According to EU (EU, 2006) emissions of PM10 are expected for all sectors i.e. 1-9. In Appendix 6 it
can be seen that sector 2, 3 and 6 have a higher proportion of facilities reporting values both below and
above E-PRTR threshold for PM10 compared to the other sectors. Summarized for all sectors, 4% of
the reported emissions of PM10 are below the E-PRTR threshold values and 3% above the E-PRTR
threshold values (see Appendix 6).
Overall, it can be seen in Appendix 6 that not many facilities reports emissions above the E-PRTR
thresholds.
Water
Generally, emissions of inorganic substances directly to water are reported from most of the sectors
(see Appendix 6). N-tot, P-tot and the related substances, are reported most frequently, especially from
sector 1-2 and sectors 4-9, which also is expected due to the type of the activity (EU, 2006). Looking
at the entire dataset, 49% of N-tot emissions are below and 14% above the threshold values to E-
PRTR, the rest does not report N-tot. The corresponding numbers for P-tot are 56 respectively 7%.
The remaining substances, chlorides (Cl-tot), cyanides (CN-tot) and fluorides (F-tot) are only reported
from a few subsectors, mostly from sector 5 and 2.
Off-site transfers
There is no general conclusion for the reporting of off-site transfers concerning inorganic substances.
Although a great part of the facilities in sector 5 and 8 reports N-tot and P-tot as off-site transfer.
Out of the reports 57% of the N-tot reporting and 53% of the P-tot has a value below the threshold
value and 3% respective 8% a value above (see Appendix 6).
CHLORINATED ORGANIC SUBSTANCES
In this group the following pollutants are included: 1,2-dichloroethane (DCE), dichloromethane
(DCM), hexachlorobenzene (HCB), dioxins + furans (PCDD + PCDF), tetrachloroethylene (PER),
trichloromethane, halogenated organic compounds (AOX), polychlorinated biphenyls (PCBs), tetra-
chloromethane (TCM), trichlorobenzenes (TCBs), trichloroethylene (TRI), trichloromethane and vinyl
chloride (VCM).
Air
The releases of chlorinated organic substances to air are only reported from a few facilities (see Ap-
pendix 7). PCDD and PCDF are the most frequently reported substances within the substance group.
Summarized for all sectors, 10% of the reported emissions of PCDD and PCDF are below the E-PRTR
threshold values and 2.1% above the E-PRTR threshold values (see Appendix 7), while 0.2-0.6% of
the reported values are below the thresholds and 0-0.8% are above the thresholds for the other pollut-
ants. The release of PCDD and PCDF to air is most frequently reported from metal-, cement-, waste
and pulp and paper industry, which also is expected due to the type of the activity (EU, 2006).
Overall, it can be seen in Appendix 7 that not many facilities reports emissions above the E-PRTR
thresholds for chlorinated organic substances.

19
Water
The release of chlorinated organic substances to water is only reported from a few facilities (see Ap-
pendix 7). From sector 2-3 and 7-9 no emission at all are reported, which also is expected due to the
type of the activity (EU, 2006). Of the reported substances, releases of AOX are reported most fre-
quent, e.g. from sector 7.
Off-site transfers
Chlorinated organic substances have only been reported from three sectors (5, 6 and 9). The off-site
transfers concerns AOX and PCB, whereof one report of AOX is above the E-PRTR threshold value.
No general conclusion is therefore viable.
OTHER ORGANIC SUBSTANCES
In this group the following pollutants are included: Benzene, naphtalene, di-(2-ethyl hexyl) phthalate
(DEHP), polycyclic aromatic hydrocarbons (PAHs), nonylphenol and nonylphenol ethoxylates
(NP/NPEs), Ethyl benzene, phenols, toluene, tributyltin, total organic carbon (TOC), chemical oxygen
demand (CODCr), xylenes, octylphenols and fluoranthene (PAH-FA).
Air
The releases of “other organic substances” to air are reported only from a few facilities (see Appendix
8). PAH is the most frequently reported substance within this group. Summarized for all sectors: 3%
of the reported emissions of PAH are below the E-PRTR threshold values and 0% above the E-PRTR
threshold values (see Appendix 8). About 0.2% of the reported values are below the thresholds and 0%
is above the thresholds for the other pollutants. PAH is most frequently reported from metal- and pulp
and paper industry (see Appendix 8). According to EU (2006), the release of PAH is expected from
the metal industry, but not from the pulp and paper industry.
Overall, it can be seen in Appendix 8 that no facilities reports emissions above the E-PRTR thresholds
for other organic substances.
Water
Except for releases of TOC (as total C or CODCr) to water, emissions of “other organic substances” are
only reported sporadically, see Appendix 8. 15% of all facilities are reporting emissions of TOC below
and 16% above the threshold values to E-PRTR
Phenols are another group that is reported more frequently that the other organic substances, mostly
from sector 1, 4 and 5, which also is expected due to the type of the activity (EU, 2006).
Off-site transfers
“Other organic substances” are in general not reported as off-site transfers (Appendix 8). Although the
reporting of TOC and/or CODCr is noteworthy in a majority of the sectors (not 1, 3 and 6-7) where
25% for TOC and 22% for CODCr reports a value below the E-PRTR threshold value and 11% respec-
tive 2% reports a value above. Given that both TOC and CODCr are a total calculation of emissions of
organic substances they are expected to differ from the rest in the category “other organic substances”.
Methods for reporting pollutant release data
The methods used to report the pollutant release data are divided into measured (M), calculated (C)
and estimated (E).

20
GREENHOUSE GASES
In Figure 1, methods used for reporting releases of greenhouse gases to air are presented. The methods
used vary between each gas. Also, the number of reported releases for the specific gases varies too.
The SF6:s are by all reported as measured and the PFS:s are by all reported by means of calculation.
However for these two pollutants there are only 2 respectively 1 single value reported 2011. For the
rest of the gases a combination of different methods is used, but with an emphasis on measured and
calculated. Only a few facilities use estimation as a tool to report the release of greenhouse gases.
Figure 1. Methods for reporting release data of greenhouse gases to air. For each compound, number of
chosen methods: calculated (C), measured (M) or estimated (E) for the PRTR classified facilities (both
below and above the threshold values to E-PRTR) is presented.
OTHER GASES
The methods used for reporting release data of other gases than climate gases are shown in the Figure
2. For most gases a combination of methods is used, but with an emphasis on measured. The exception
is HCN, which is only reported by means of calculations. The method least used is estimation.
Figure 2. Methods for reporting release data of other gases to air. For each compound, number of chosen
methods: calculated (C), measured (M) or estimated (E) for the PRTR classified facilities (both below and
above the threshold values to E-PRTR) is presented.
METALS
In Figure 3 a-c methods for reporting release data of metals to air, water and off-site transfers are pre-
sented. The pattern is similar for all the eight metals. Between 45-60% of all releases of metals to air

21
are reported using calculation methods. Another 30-50% is reported by using measurement methods
and only approximately 2-10% is estimated.
Approximately 90% of the release data of metals directly to water are reported by using the measure-
ment methods and another 10% by calculation methods. Only a few facilities report metal emission to
water using estimation methods. The releases of metals reported as off-site transfers are reported using
measurement methods (approximately 95%). The rest of the data are reported as calculations and only
a few facilities report releasing using estimations.
Figure 3 a-c. Methods for reporting release data of metals to a) air, b) water and c) off-site transfers to
waste water. For each compound, number of chosen methods: calculated (C), measured (M) or estimated
(E) for the PRTR classified facilities (both below and above the threshold values to E-PRTR) is presented.

22
INORGANIC SUBSTANCES
The methods used for reporting releases of chlorinated organic substances to air, water and as off-site
transfers are presented in Figure 4 a-c. A majority (approximately 50%) of the reported emissions to
air of the parameter particular matter (PM10) has reported the data using measurement methods. Al-
though the other half of the reports are split between calculated and estimated data collection methods.
Concerning emissions to water the single most common method for collecting data on inorganic sub-
stances is measured data. Approximately 10-20% of the data is calculated and likewise 10-20% is
estimated, with the exception for PO4-P and CN-tot, where no estimated data occurs. When it comes
to off-site transfers no data is estimated and approximately 5-15% is calculated, with the exception of
NO2+NO3-N, PO4-P and F-tot, where only measured data occurs. The great majority of the reports are
stated to be measured data.
Figure 4 a-c. Methods for reporting release data of inorganic substances to a) air, b) water and c) off-site
transfers to waste water. For each compound, number of chosen methods: calculated (C), measured (M)

23
or estimated (E) for the PRTR classified facilities (both below and above the threshold values to E-PRTR)
is presented.
CHLORINATED ORGANIC SUBSTANCES
The methods used for reporting releases of chlorinated organic substances to air, water and as off-site
transfers are presented in Figure 5a-c.
The number of pollutants released to the different media differs. Largest number of pollutants in this
group is reported as emissions to water, but only two (PCB and AOX) as off-site transfers. Further, the
number of data reported for the different pollutants and media differs too. Except for releases of diox-
ins to air and AOX to water, the total number of data reported for the specific pollutants is low, which
means that it is difficult to compare the methods and discuss the results. However, the releases of chlo-
rinated organic substances to water and as off-site transfers are generally reported by using measure-
ment methods. The releases to air are reported by using all three types of methods.

24
Figure 5 a-c. Methods for reporting release data of chlorinated organic substances to a) air, b) water and
c) off-site transfers to waste water. For each compound, number of chosen methods: calculated (C), meas-
ured (M) or estimated (E) for the PRTR classified facilities (both below and above the threshold values to
E-PRTR) is presented.
OTHER ORGANIC SUBSTANCES
The methods used for reporting releases of other organic substances to air, water and as off-site trans-
fers are presented in Figure 6 a-c.
The releases of PAH to air, which also is the parameter reported from largest number of facilities to
this media, the calculation methods are used to approximately 90%. For the other three pollutants,
there is only a few reported data, which makes it difficult to draw any general conclusions on the
methods used. The number of pollutants reported as releases to water and as off-site transfer to waste
water is higher. The releases of pollutants that are reported from a larger number of facilities are gen-
erally reported by using the measurement methods (e.g. TOC, CODCr and phenols).

25
Figure 6 a-c. Methods for reporting release data of other organic substances to a) air, b) water and c) off-
site transfers to waste water. For each compound, number of chosen methods: calculated (C), measured
(M) or estimated (E) for the PRTR classified facilities (both below and above the threshold values to E-
PRTR) is presented.
RELEASE DETERMINATION METHODS FOR ORGANIC SUBSTANCES AND E-PRTR ACTIVITIES
For the organic substances, it was further investigated if the use of release determination methods
could be presented per receiving media, pollutant and PRTR code. As shown in Figure 5 a-c and Fig-
ure 6 a-c, only a few organic substances are reported from a larger number of PRTR classified facili-
ties. These are e.g. releases of dioxins and PAH to air, AOX to water and phenols and TOC/CODCr to
water and as off-site transfer. The rest of the pollutants are only reported from a few facilities, which
means that the sector specific mapping of the release determination methods used for reporting these
organic substances is not applicable.
As an example of the E-PRTR activity specific mapping of methods, releases of dioxin and furans to
air are presented in Figure 7. Releases of dioxins and furans were reported from totally 83 facilities, of
which 5 using estimation methods, 38 using measurement methods and another 40 by using the calcu-
lation methods (Figure 5). In between sector 6(a) Production of pulp, 24 of totally 28 data were re-
ported using calculation methods. For the rest of the sectors measurement methods were more fre-
quently used.
Figure 7. Methods for reporting release data of dioxins and furans to air per sector, calculated (C), meas-
ured (M) and estimated (E).
Discussion
Generally, for all the receiving media and pollutants, there is higher percentage of reported releases
below the thresholds values to E-PRTR compared to releases above the thresholds. For some pollut-
ants (se Appendix 1), the thresholds in accordance to E-PRTR and the Swedish regulation on envi-
ronmental reports NFS 2006:9 differs, giving lower thresholds in accordance to the Swedish regula-
tion. The results from this project indicate that the thresholds to E-PRTR, in some cases, may be too
high since many emissions are below the thresholds. This could imply that the thresholds should be
revised.
Emissions of all pollutants are not expected to occur from all sectors. Whether or not a pollutant is
released or transferred, in levels above the threshold values for the pollutant, depends on the specific

26
characteristics of the facility. There is however some examples of sectors missing expected release
data. For instance, in-between sector 7, two of the main emissions from agriculture to air is CH4 and
N2O. However, out of all the facilities within sector 7 only one of them report emissions of N2O below
the E-PRTR threshold and none of them report any values neither below nor above the E-PRTR
threshold for CH4 or above the threshold for N2O.
Except for releases of dioxins and PAH to air, AOX to water and phenols and TOC/CODCr to water
and as off-site transfer to waste water, the organic substances as a group are rarely reported. If re-
ported, the emissions generally are below the thresholds to E-PRTR.
The use of determination methods for reporting releases to air, water and as off-site transfer to waste
water vary with different pollutants and receiving media. For many of the pollutants, lack of data
makes it difficult to compare and map the releases.
Generally, measurement methods are more frequently used and the estimation methods are used less
often. However, the releases to air compared to water and as off-site transfer to waste water, seem to
be more often reported with calculation methods. This is most prominent for the metals, for which
calculation methods stands for approximately 50-60% of all data reported, while the corresponding
share for water and off-site transfers to waste water are approximately 10 respectively 5%.

27
Subproject 2. Estimation of emission factors from reporting waste water treatment plants
Background and introduction By using emission factors it could be possible to estimate whether the municipal WWTP are subject to
reporting requirements under E-PRTR or not. Furthermore, emission factors could also act as a sup-
port for the estimation of emissions data. Emission factors would make Sweden's reporting more com-
plete for discharges from WWTP.
Reporting requirements on chemical releases to effluent water from municipal wastewater treatment
plants (WWTPs) may be difficult to fulfil for several reasons. One of these is connected to challenges
in monitoring substances in water because of their physical-chemical properties. For example, hydro-
phobic chemicals with high Kow-values are likely to mainly partition into the sludge phase. Some
releases to water will still occur, but at each point in time the concentration of such substances in the
water will be very low, and may thus be difficult to measure. A natural consequence of their hydro-
phobic nature is that the higher the fraction of suspended solids in the effluent (outgoing water from
WWTP), the more chemical will be released. A second challenge concerns the volatile substances,
VOCs. Again, their tendency to volatilise from natural waters will reduce their presence in the water
phase. A high air-water partition coefficient, Kaw, results in a low potential for partitioning to water.
Even if chemicals may be difficult to measure in outgoing water from WWTPs, the total annual re-
leases may still amount to substantial volumes which may be of concern, especially for persistent sub-
stances. One way of estimating the release of chemicals from wastewater treatment plants is by calcu-
lating the fractions released via different pathways, e.g. via air (volatilisation), sludge or water by
using an environmental fate model parameterised to wastewater treatment plants, where crucial proc-
esses are considered. If properly evaluated or even validated, such models can then be used for quick
assessments of chemical releases via wastewater treatment plants. In such cases, they can provide a
cost-effective and less time consuming alternative to actual measurements. Models have been used to
assess the fate of compounds in M-WWTPs for more than 15 years. For example, the STP model
(Clark et al. 1995), which is a forerunner to the model applied in this project, has been used by Envi-
ronment Canada and the US Environmental protection agency (US EPA).
In the analysis, the following substances were included; nonylphenol and nonylphenol ethoxylates,
octylphenol and octylphenol ethoxylate, polybrominated dinfenylethers (PBDEs), di-(2-ethylhexyl)-
phthalate (DEHP), tetrachlorethylene (per), tetrachloromethane (carbon tetrachloride), trichloroben-
zenes, 1,2-dichloroethane, trichloroethylene (tri), dichloromethane, trichloromethane (chloroform),
PAH (total 4), anthracene, flouranten, benzo (g,h,i) perylene, chloroalkanes (C10-13), hexachlorobu-
tadiene (HCBD) and isodrin. The selection of substances was based on results from Pettersson and
Wahlberg, 2010 (Annex G). These substances have an amount above or close to the reporting thresh-
old for emission to water. However, metals, flourides, chlorides and cyanides were not included be-
cause they are present in relatively large amounts and / or are easier to measure. For these substances
no support with emission factors is needed.

28
Methods Data from previous measurements and national environmental monitoring
Data on both the content in the effluent and in sewage sludge was used if available in data from envi-
ronmental monitoring programme of sludge and effluent water and in the report by Pettersson and
Wahlberg (2010).
In the monitoring programme 2010, nine WWTP of different size and load were included (Haglund
and Olofsson, 2011). In Appendix 9 information about the WWTP included in national monitoring
programme is presented. The sampling of effluent water was performed during a week per year. A
flow-proportional sample was taken each day during a week, and the samples were thereafter pooled
to a weekly sample. Sludge was sampled approximately one hour after dewatering. Of the substances
analysed both in sewage sludge and water, only 4-nonylphenol branched and 4-t-octylphenol were of
interest in this project. Trichlorobenzenes, HCB, PBDE), DEHP and SCCP were other substances
from the monitoring programme that were included in this project, but there were no data on concen-
tration in effluent (Haglund and Olofsson, 2011; screening database, ivl.se).The other data set that was
used in this project was based on measurements from two WWTP in Stockholm.
Information on the total amounts of effluent and sewage sludge was retrieved from environmental
reports from Stockholm Water (Stockholm Water, 2008, 2009) and for the other WWTPs from SMP
(SMP, 2013). Data of the content of the substance in the effluent was compared with data on content
of a certain chemical in sewage sludge from the same year and M-WWTP.
For each substance, the total amount in sludge and water were obtained using data on the content of
the substances in effluent water and sludge.
Water: amount in water (kg/L) * total amounts of effluent (L) = total amount of chemical (kg).
Sewage sludge: amount in sewage sludge (kg/kg TS) * total amount of sewage sludge (kg TS) = total
amount of chemical (kg).
To enable the use of measured data in water and sewage sludge to estimate releases to water, results
from the measurments were used to calculate ratios (RW/S) between water and sludge according to:
RW/S, meas =Mw, meas/Ms, meas
Where Mw, meas is the measured annual release (kg) with water effluent and Ms,meas (kg) the measured
annual release with sewage sludge.
Modelling
Model description
For this exercise the model STP-EX (Seth et al. 2008) has been used. It is aimed to be a relatively
simple, transparent and robust model that can be used to predict chemical fate in WWTPs and is a
further development of the model by Clark et al. (1995). The STP-EX model is fugacity based, mean-
ing that the model uses the compounds tendency to escape from one media to another (fugacity = ‘es-
caping tendency’, with units of Pascal) as a basis for mass balance calculations (Mackay, 2001). Input
data required are physical-chemical properties such as molecular weight, Kow, vapour pressure and
water solubility. The concept of fugacity is only applicable to organic chemicals – for inorganic

29
substances (e.g. metals) other approaches are necessary. In contrast to its predecessor, the STP-EX
model also has an ability to handle ionizing chemicals.
The degradation half-lives for the compounds in different treatment steps are also required as model
input. Although these can vary between different kinds of sludge, Seth et al. (2008) suggested that the
half-life in water be used. This can then be used to estimate half-lives in the different treatment steps
in the WWTP, see Appendix 11.
Figure 8. STP-EX model interface and input data required.
Apart from physical-chemical properties, the STP-EX model also requires input data on the composi-
tion and characteristics of influent water and the different steps in the water treatment process. Data on
water inflow (volume/time), BOD (Biological Oxygen Demand), TSS (suspended solids), pH, tem-
perature and concentration of the chemical in the incoming water are required. The process data re-
quirements depend on the treatment method (Figure 8). The treatment options offered by the model are
primary, secondary (activated sludge), primary + secondary or lagoons. The last option is not relevant
for Sweden. For most Swedish WWTPs, the properties for “primary”, “aeration tank” and “secondary
settler” describe the crucial treatment processes.
The STP-EX model is one of the modelling tools included in the on-going project “Removal/emission
predictions of wastewater treatment for exposure assessment and PRTR – summary and compilation
of responses from OECD 2012 survey”, aimed to compile knowledge and common practice regarding
30
methods to estimate releases from WWTPs . The previous version by Clark et al. (1995) was the third
most commonly used modelling tool among the OECD countries participating in the above mentioned
project. Wang et al. (2007) used the STP model from 1995 to predict outgoing amounts of PAHs,
which were shown to agree within about 10% with measured releases from a Canadian WWTP. Seth
et al. (2008) compared modelled and measured removal efficiencies of e.g. PAHs, volatile organics,
phenols and phthalates using the STP-EX model. The model/measured agreement was generally
within 2-22% (somewhat larger for pesticides). The largest difference between measured and modelled
values was explained by uncertainty in the half-life time of this compound.
Chemicals
The group of chemicals selected for the modelling exercise are all organic compounds, but cover a
range of different physical-chemical properties, and therefore behave differently in the WWTP. The
chemicals included and their properties are listed in Appendix 11. They can be divided into volatile
organic substances (VOCs), polybrominated diphenyl ethers (PBDEs), polycyclic aromatic hydrocar-
bons (PAHs), nonylphenol and nonylphenol ethoxylates (NP and NPE), octylphenol and octylphenol
ethoxylates (OP and OPE), chloroalkanes (C10-13) and a few additional substances.
Physical-chemical properties needed to run the model are not always easily accessible. Or rather, it is
quite easy to find values, but harder to determine their accuracy. The values used are either experimen-
tal or model estimated. Modelled values are calculated from similar compounds for which the knowl-
edge is better. Commercial products of chloroalkanes (or chlorinated paraffins) are complex mixtures
of a large number of different homologues and isomers. Therefore, they are classified by the length of
their carbon skeleton into short- (C10-C13) medium (C14-C17) and long chain (C18-C30) chloroal-
kanes. The determination of these mixtures has been difficult in the past, and still is, even if some
problems have been overcome in the last few years. Reliable data on environmental occurrence as well
as properties are therefore hard to find, and since they occur as mixtures, individual substances are
hard to separate. Instead, the properties of each subgroup are usually reported based on the average
chlorine content. In this project, data on chloroalkanes (C10-13) were taken from ECHA (2008). An-
other group of compounds that have a variation in their properties are NPEs and OPEs. For OPEs the
properties used are the only ones presented in EPIWEB 4.1 (US Environmental protection agency).
For NPEs, representative values were harder to find and therefore they were not included at this stage
in the modelling. Physical-chemical properties of PBDEs were taken from Palm et al. (2004), and
remaining physico-chemical properties were collected from the “PhysProp Database” (SRC, 2013).
None of the included chemicals are expected to ionize to an extent that would affect the results sub-
stantially, thus pKa-values were not considered.
Degradation half-lives in water were collected from EPIWEB 4.1 (US Environmental protection
agency).
Model runs
Initially, we set out to define typical characteristics for a national Swedish “standard WWTP”. Select-
ing representative values, however, proved to be a challenging task, due to varying characteristics of
the different wastewater treatment plants. Therefore, information about several different treatment
plants was collected instead.
Ideally, the modelled WWTPs should represent different sizes and have a variety in WWTP-
properties. It is also beneficial if previous measurements of the relevant compounds have been per-
formed in the WWTPs of interest. Process data needed for the model were collected from four

31
WWTPs included in the national monitoring program 2010 (Haglund and Olofsson, 2011);
Henriksdal, Ryaverket, Ellinge and Gässlösa.
Not all WWTPs were able to give site specific values for all input parameters. In these cases the input
values were estimated from other process data, for example, air flow in the aeration tank can be esti-
mated from knowledge about the aeration pump. The composition and volume of incoming and outgo-
ing water might differ between years for each of the included WWTPs. Information about the varia-
tions between years was therefore collected to enable model runs for more than one year. The model
was then run for different scenarios where the properties of the waste water treatment were kept con-
stant, but with different properties in inflow and outflow from the WWTP.
To enable the use of monitoring data in sludge to estimate releases to water, results from the model
runs were used to calculate ratios between water RW/S and sludge according to:
RW/S, mod =Mwater/Msludge
Where Mwater is the predicted annual release (kg) with water effluent and Msludge (kg) the predicted
annual release with sewage sludge. The incoming concentration is irrelevant for the water/sludge ratio
and was set to 1 g/m3 for all included compounds.
Results and Discussion Previous measurements
The calculated water to sludge ratios RW/S, are presented in Appendix 10. The ratios obtained for indi-
vidual substances vary between the different WWTP, which may be due to normal variability as a
result of different load, size and technical properties of the WWTP as well as the difficulties to detect
the substances, especially in effluent water. In the modelling part of the project, it was found that TSS
and the volume of influent water were the parameters that have largest influence on the ratios. Low
concentrations of the selected substances in the matrices and the type of analysis methods used may
also influence the results. High detection limits for the analysis may result in unrealistically high esti-
mated outflow of chemicals in effluent or in sludge if the detection limit is used in the calculations.
This was observed to be a large source of uncertainty in the calculated ratios.
Looking at the entire dataset, 110 of totally 132 water data (83%) were below the method detection
limits. The corresponding number for sludge was 39 of 164 (24%) (Pettersson and Wahlberg, 2010;
Haglund and Olofsson, 2011).
As an example of the results, water/sludge ratios for 4-tert-octylphenol and 4-nonylphenol are pre-
sented in Figure 8 and Figure 9. The red bars correspond to ratios calculated using the method detec-
tion limit (sludge, effluent or both). Ratios for Henriksdal and Bromma (2007, 2008) are based on data
from Pettersson and Wahlberg, (2010) and the rest from the national monitoring programme (Haglund
and Olofsson, 2011).
The water to sludge ratios for 4-tert-ocylphenol varied between 0.06 and 0.52 for the different
WWTPs, with an average ratio of 0.11. The detection limit value for this substance is relatively low,
which may contribute to the relatively small differences in the ratios obtained. The observed variabil-
ity may also be a result of the differences in load, size and processes in the different WWTPs.

32
Figure 8. Water/sludge ratios for 4-tert octylphenol and different WWTPs. Red bars corresponds to con-
centrations below the detection limit for water, sludge or both.
The water to sludge ratios for 4-nonylphenol branched, varied between 0.02 and 23 averaging at 4.4.
The larger variance compared to the 4-tert-octylphenol may be a result of larger variance in the ana-
lytical results, such as higher concentration in effluent water (e.g. Borlänge WWTP) or low concentra-
tion in sludge (e.g. Bergkvara and Bollebygd WWTP) compared with other WWTPs from the moni-
toring programme. It may also be a result of variability in the estimated annual water flows and sludge
production
Figure 9. Water/sludge ratios for 4-nonylphenol branched and different WWTPs. Red bars corresponds
to concentrations below the detection limit for water, sludge or both.

33
Modelling
The results from the model runs are presented in Figure 11a-d. The predicted chemical distribution
differs between chemicals as well as between the different WWTPs, but the general pattern is that
hydrophobic compounds will mainly end up in the sludge and VOCs will mainly biodegrade or
evaporate, which is logical. Other compounds of intermediate hydrophobicity and reactivity, such as
e.g. fluoranthene, will partly biodegrade and partly end up in the sludge.
Figure 11a-d. Percentage distribution of the chemicals in the different M-WWTPs. a) = Henriksdal, b) =
Ryaverket, C = Gässlösa and d) = Ellinge.

34
Model predicted water to sludge ratios for the four WWTPs are presented in Figure
12. The ratios and underlying amounts are also included in the appendix. A ratio >1
implies that on an annual basis, larger amounts of chemicals are predicted to be
released with effluent water than with sludge. As evident from the figure, the ratios
for individual substances differ between the included WWTPs, by up to a factor of
30 (for trichloroethylene). VOCs are more likely to be found in effluent water than
in sludge, yet they are rarely detected in effluent water. A previous study
conducted by IVL (Lilja et al., 2010) indicated that when detected, the
concentrations of VOCs were well below toxic levels, and it was proposed that
these need not be prioritised for further effluent monitoring. If desired, an
alternative approach can be applied for VOCs, by estimating outgoing amounts
based on incoming concentrations (i.e. by deriving an model calculated OUT/IN
ratio), which may be easier to measure.
Figure 12. The partitioning ratio between water and sludge in the modeled WWTPs.
Note the logarithmic scale on the y-axis.
While the modelled results of hydrophobic compounds vary strongly as a result of
changes in the TSS-levels in the outflow, the results for more volatile substances
are mainly affected by variations in the annual water inflow, both in terms of vol-
ume and composition. The water/sludge ratios RW/S differ not only between chemi-
cals and different WWTPs, but may also vary between years. This is exemplified in
Figure 13 where the variability in RW/S due to changes in TSS-levels in the effluent
is illustrated for BDE 209 in Henriksdal. TSS-levels in the effluent can vary sub-
stantially between years. In 2011, the TSS concentration in outgoing water at Hen-
riksdal increased from an average of 2 mg/L to 7 mg/L. Gässlösa had a similar
change of TSS in the outflow, with an increase from 6 to 12 mg/L between 2008
and 2010 (even higher in the following two years, with a TSS of up to 15-16
mg/L). The opposite trend is displayed for Ryaverket, with a decrease of TSS in the
outflow from 12.5 to 4.5 mg/L, while only a small variation was observed at El-
linge WWTP.

35
Figure 13. Effect of changes in suspended solid content (1-15 mg/L) in effluent water
on the predicted water/sludge ratio of BDE-209 in Henriksdal.
If the modelling results are representative for the prevailing conditions at the time
of sludge sampling in the studies by Pettersson and Wahlberg ( 2010) and Haglund
and Olofsson (2011), the annual emissions to water would be approximatly as
shown in Figure 14. The figure also illustrates how these results compare to the
reporting limits (EU, 2006). It should be noted that many of the included
compounds are to be reported in groups (e.g. PAHs, PBDEs, NP+NPE, OP+OPE).
Figure 14. Predicted annual emissions to water of target substances, as estimated from
the model predicted water/sludge ratio, measured concentrations in sludge (Pettersson
and Wahlberg. 2010, Haglund and Olofsson, 2011) and reported annual amount
sludge produced (Environmental reports) The black dots indicate the threshold for
reporting requirements. Missing substances indicate that data on concentrations in
sludge are missing. Data are from 2010 if nothing else is specified.

36
Discussion
In performing the model assessment, certain input parameters have proven to be
more critical than others, depending on the physical-chemical characteristics of the
substance. The fate of hydrophobic compounds, such as PBDEs, is mainly gov-
erned by the particle content in the water (in every step), the particle removal effi-
ciency, particle content in the effluent water, and the sludge recycling fraction.
For less hydrophobic compounds, e.g. VOCs, other factors control the WWTP fate.
This group will biodegrade to a larger extent, but because of their high volatility
they may also evaporate in the aeration step. Therefore, values related to the over-
all residence time in the WWTP, such as water flow, degradation half-lives, surface
area and air flow are crucial parameters.
Altogether, the current study shows that water/sludge ratios predicted by the STP-
EX model vary as a result of process specific parameters, which may differ be-
tween WWTPs and may also vary between years. Therefore it is not feasible to
assign a single ratio per substance for application in all reporting WWTPs. Instead,
WWTP specific ratios should be derived that can be used to estimate emissions
with outgoing water from sludge data. If sludge data are missing, outgoing amounts
may be estimated from the incoming concentrations and incoming water volumes.
It is also important to pay attention to changing conditions in the WWTP, as high-
lighted above, as they might influence the fate of the chemicals.
Finally, to evaluate the applicability of the suggested methodology for Swedish
WWTPs it is desirable to conduct empirical monitoring studies in selected WWTPs
and for selected substances to investigate how well the model agrees with meas-
urements. Even though the model have shown good results compared to measured
data in earlier studies, it has not been evaluated for Swedish conditions, which in
some cases deviate, for example due to the common practice of nitrogen removal
and sludge digestion.

37
Comparison between the two methods
The two methods tested in this project to derive emission factors (or water to
sludge ratios, Rw/s) are compared in Figure 15. Empirically derived ratios are pre-
sented as based on data above the detection limit only (green bars) or as partly or
entirely based on detection limits (red bars). The empirically derived ratios using
detection limits are a factor of 1.5 to 6200 higher than the model predicted ratios,
whereas for the values derived using data above detection limits, the agreement is
within a factor of 0.7-300. Best agreement was obtained for nonylphenol, 4-tert-
octylphenol and DEHP. The large error bars, spanning over up to a factor of 700,
clearly illustrate the large variability and/or uncertainty in the data. The variability
is lower for model predicted ratios (factor of 3-30), where it is mainly due to dif-
ferences in treatment conditions between the different WWTPs. The variability in
the empirical ratios (factor of 3-700) is partly due to the fact that detection limits
where used in the derivation, but is also likely a result of the difficulty in obtaining
representative samples to use for deriving a water to sludge ratio. As illustrated in
figure 12, ratios will vary depending on the conditions in the WWTP. Therefore, a
reliable empirical ratio requires regular monitoring in sludge and water (to cover
variations in water flow and TSS-content) as well as sampling and analytical meth-
ods that are sensitive enough for detection both in water and sludge.
Figure 15. Comparison of emission factors (water/sludge ratios) derived with the two
methods. Green bars represent empirically derived ratios based on data above the
detection limits, red bars represent empirically derived ratios partly or entirely based
on the detection limits.

38
Recommendations emission factors The background of the project was that very few WWTPs report emissions of or-
ganic substances to water. Other studies have shown that the emissions may be
above the thresholds for reporting to emission declarations and E-PRTR. Many of
these often hydrophobic substances are difficult to measure in water due to the low
concentrations. However, on an annual basis the total amounts released may still be
substantial. Thus it was desirable to find alternative methods to estimate the emis-
sions released via WWTPs to water. One idea was to use data on sludge concentra-
tions and estimate releases via water based on the annual releases with sludge and a
likely distribution between water and sludge.
Two methods were tested:
i) To derive water/sludge ratios by using existing data from previous meas-
urements from national environmental monitoring (Haglund and Olofsson,
2011) and a report (Pettersson and Wahlberg, 2010) and
ii) To derive ratios based on physical-chemical properties and knowledge
about the treatment process by using a fugacity based WWTP fate model.
The model selected for this purpose is called STP-EX and was developed
by Seth et al. (2008)
The first approach gave reliable results for two substances; 4-tert octylphenol and
4-nonylphenol, branched. For the other substances the concentrations were below
the detection limit for either water or sewage sludge, which made the ratios very
uncertain. There were however, examples of monitoring data above the detection
limits also for nonylphenol, nonylphenol ethoxylates, octylphenol ethoxylates,
DEHP and fluoranthene, but these were few. Large variations were observed be-
tween the WWTPs also for the chemicals where a ratio could be calculated. 4-tert
octylphenol had a variation between 0.006 and 0.15 (Figure 8). 4-nonylphenol,
branched had a variation between 0.43 and 23 (Figure 9). It is not known if the
variation is due to differences in TSS or due to other factors.
The second method enabled calculation of water/sludge ratios for all substances but
nonylphenol ethoxylates, but the water/sludge ratios predicted by the STP-EX
model vary as a result of process specific parameters, which may differ between
WWTPs and may also vary between years. The TSS levels in the effluent and the
water volume are important parameters that affect the ratio. Therefore, it is not
feasible to assign a universal ratio per substance for application in all reporting
WWTPs.
Both methods illustrate a large variation between different WWTPs, and an inap-
propriateness of using one common substance specific ratio for emission calcula-
tions. Instead, WWTP specific ratios should be derived that can be used to estimate
emissions with outgoing water from sludge data. If sludge data are missing, outgo-
ing amounts may be estimated from the incoming concentrations and incoming

39
water volumes, using for example the STP-EX model or an equivalent assessment
tool. It is also important to pay attention to changing conditions between years in
the WWTP, as they influence the fate of the chemicals.
To evaluate the applicability of the suggested model assessment methodology for
Swedish WWTPs it is desirable to conduct empirical monitoring studies in selected
WWTPs and for selected substances to investigate how well the model agrees with
measurements. This is already planned for, for some substances, in a degree project
by Kajsa Boll at Gothenburg University, which will be conducted at IVL during the
spring 2013. Even though the model has shown good results compared to measured
data in earlier studies, it has not yet been evaluated for Swedish conditions, which
in some cases deviate, for example due to the common practice of nitrogen removal
and sludge digestion.
The results from the STP-EX model indicates that there are only a few substances
that are close to or above the emission threshold for reporting; DEHP, nonylphe-
nols, octylphenols, PBDE, PAH and chloroalkanes. This is important information
for the WWTPs. In a previous study (Pettersson and Wahlberg, 2010), 17 sub-
stances were identified to be of potential concern, largely based on concentrations
below the detection limits. This study limited the number of potentially problem-
atic substances to six.
40
References
Clark et al. 1995. Fugacity analysis and model of organic chemical fate in a sewage
treatment plant. Environ. Sci. Technol. 1995, 29, 1488-1494.
ECHA. 2008. Member State Committee - Support Document for Identification of
Alkanes, C10-13, Chloro as a Substance of Very High Concern- Adopted on 8
October 2008
Europaparlamentets och rådets förordning (EG) nr 166/2006. Om upprättande av
ett europeiskt register över utsläpp och överföringar av föroreningar och om änd-
ring av rådets direktiv 91/689/EEG och 96/61/EG
EU (2006): “Vägledning vid implementering av det europeiska registret över ut-
släpp och överföringar av föroreningar”. Europeiska kommissionen.
Hedlund P. och Olofsson U., (2011): Miljöövervakning av utgående vatten och
slam från svenska avloppsreningsverk. Resultat från år 2010 och sammanställning
av slamresultat för åren 2004-2010”. Umeå universitet
Lilja, K., Remberger, M., Kaj, L., Allard, A-S., Andersson, H., Brorström-Lundén,
E. 2010. Chemical and biological monitoring of sewage effluent water.
Mackay D 2001. Multimedia Environmental Models: The Fugacity Approach. New
York: Lewis Publishers.
Palm A., Breivik K., Brorström-Lundén E. 2004. Transport and fate of polybromi-
nated diphenyl ethers in the Baltic and Arctic regions. Tema Nord 2004:554.
SRC. 2013. Interactive PhysProp Database Demo. Available at
http://www.srcinc.com/what-we-do/databaseforms.aspx?id=386
Pettersson, M. And Wahlberg, C. 2010. Övervakning av prioriterade ämnen i vat-
ten och slam från avloppsreningsverk i Stockholm. (Monitoring of priority sub-
stances in water and sewage sludge from waste water treatment plants in Stock-
holm) Report 2010-02. Svenskt Vatten Utveckling. In Swedish with summary in
English. Available at www.svensktvatten.se
Seth et al. 2008. Continued development of a mass balance model of chemical fate
in a sewage treatment plant. Water research 42 (2008) 595-604.
Stockholm Water, 2008. Miljörapport 2007. In Swedish. (Environmental report,
available on demand from Stockholm Water)
41
Stockholm Water, 2009. Miljörapport 2008. In Swedish. (Environmental report,
available on demand from Stockholm Water)
USEPA, 2011. Estimation Programs Interface Suite™ for Microsoft® Windows.
EPIWEB 4.1. United States Environmental Protection Agency, Washington, DC,
USA.

42
Appendix 1 Parameter list
E-PRTR parameters according to Annex II to Regulation 166/2006 (EU, 2006). Substance codes are given for the parameters included in sub-project
1 in this study. Further, thresholds values for releases to air and water in accordance to E-PRTR and the Swedish regulation on environmental reports
NFS 2006:9 are also presented (“–“ is not subject to reporting requirements”).
Thresholds for releases to air (kg/year):
Thresholds for releases to water (kg/year):
E-PRTR pollutant no
Substance code
CAS-no Pollutant NFS 2006:9 E-PRTR NFS 2006:9 E-PRTR
1 CH4 74-82-8 Methane (CH4) 100 000 100 000 - -
2 CO 630-08-0 Carbon monoxide (CO) 500 000 500 000 - -
3 CO2 124-38-9 Carbon dioxide (CO2) 100 000 000 100 000 000 - -
4 HFCS
Hydro-fluorocarbons (HFCs) 100 100 - -
5 N2O 10024-97-2 Nitrous oxide (N2O) 10 000 10 000 - -
6 NH3 7664-41-7 Ammonia (NH3) 1000 10 000 - -
7 NMVOC
Non-methane volatile organic compounds (NMVOC) 5000 100 000 - -
8 NOX
Nitrogen oxides (NOx/NO2) 10 000 100 000 - -
9 PFCS
Perfluorocarbons (PFCs) 100 100 - -
10 SF6 2551-62-4 Sulphur hexafluoride (SF6) 50 50 - -
11 SOX
Sulphur oxides (SOx/SO2) 150 000 150 000 - -
12 N-tot
Total nitrogen - - 6000 50000
13 P-tot
Total phosphorus - - 100 5000
14 HCFCS
Hydrochlorofluorocarbons(HCFCs) 1 1 - -
15 CFCS
Chlorofluorocarbons (CFCs) 1 1 - -

43
Thresholds for releases to air (kg/year):
Thresholds for releases to water (kg/year):
E-PRTR pollutant no
Substance code
CAS-no Pollutant NFS 2006:9 E-PRTR NFS 2006:9 E-PRTR
16
Halons 1 1 - -
17 AS
Arsenic and compounds (as As) 1 20 1 5
18 CD
Cadmium and compounds (as Cd) 0.1 10 1 5
19 CR
Chromium and compounds (as Cr) 10 100 20 50
20 CU
Copper and compounds (as Cu) 10 100 20 50
21 HG
Mercury and compounds (as Hg) 0.1 10 0.1 1
22 NI
Nickel and compounds (as Ni) 10 50 20 20
23 PB
Lead and compounds (as Pb) 5 200 5 20
24 ZN
Zinc and compounds (as Zn) 100 200 20 100
25 15972-60-8 Alachlor - - - 1
26 309-00-2 Aldrin - 1 - 1
27 1912-24-9 Atrazine - - - 1
28 57-74-9 Chlordane - 1 - 1
29 143-50-0 Chlordecone - 1 - 1
30 470-90-6 Chlorfenvinphos - - - 1
31 85535-84-8 Chloro-alkanes, C10-C13 1 - 1 1
32 2921-88-2 Chlorpyrifos - - - 1
33 50-29-3 DDT - 1 - 1
34 DCE 107-06-2 1,2-dichloroethane (DCE) 1 1000 1 10
35 DCM 27639 Dichloromethane (DCM) 1000 1000 10 10

44
Thresholds for releases to air (kg/year):
Thresholds for releases to water (kg/year):
E-PRTR pollutant no
Substance code
CAS-no Pollutant NFS 2006:9 E-PRTR NFS 2006:9 E-PRTR
36 60-57-1 Dieldrin - 1 - 1
37 330-54-1 Diuron - - - 1
38 115-29-7 Endosulphan - - - 1
39 72-20-8 Endrin - 1 - 1
40 AOX
Halogenated organic compounds (as AOX) - - 1000 1000
41 76-44-8 Heptachlor - 1 - 1
42 HCB 118-74-1 Hexachlorobenzene (HCB) - 10 - 1
43 HCBD 87-68-3 Hexachlorobutadiene (HCBD) 1 - 1 1
44 HCH 608-73-1 1,2,3,4,5,6-hexachlorocyclohexane (HCH) - 10 - 1
45 58-89-9 Lindane - 1 - 1
46 2385-85-5 Mirex - 1 - 1
47 PCDD+PCDF
PCDD + PCDF (dioxins + furans) (as Teq) 0.000001 0.0001 0.0001 0.0001
48 608-93-5 Pentachlorobenzene - 1 - 1
49 87-86-5 Pentachlorophenol (PCP) - 10 - 1
50 PCB 1336-36-3 Polychlorinated biphenyls (PCBs) - 0.1 - 0.1
51 122-34-9 Simazine - - - 1
52 PER 127-18-4 Tetrachloroethylene (PER) 1 2000 1 10
53 TCM 56-23-5 Tetrachloromethane (TCM) 100 100 1 1
54 TCB 12002-48-1 Trichlorobenzenes (TCBs) (all isomers) 1 10 1 1
55 TCE 71-55-6 1,1,1-trichloroethane 100 100 - -

45
Thresholds for releases to air (kg/year):
Thresholds for releases to water (kg/year):
E-PRTR pollutant no
Substance code
CAS-no Pollutant NFS 2006:9 E-PRTR NFS 2006:9 E-PRTR
56 79-34-5 1,1,2,2-tetrachloroethane 50 50 - -
57 TRI 28861 Trichloroethylene 1 2000 1 10
58 TRICHLOROMETHANE
67-66-3 Trichloromethane 1 500 1 10
59 8001-35-2 Toxaphene - 1 - 1
60 VCM 27398 Vinyl chloride 1000 1000 10 10
61 ANTHRACENE 120-12-7 Anthracene 50 50 1 1
62 BENZENE 71-43-2 Benzene 100 1000 100 (as BTEX) 200 (as BTEX)
63 PBDE
Brominated diphenylethers (PBDE) 1 - 1 1
64 NONYLPHENOL
Nonylphenol and Nonylphenol ethoxylates (NP/NPEs) - - 1 1
65 ETHYLBENZENE 100-41-4 Ethyl benzene 100 - 100 (as BTEX) 200 (as BTEX)
66 ETHYLENE OXIDE
75-21-8 Ethylene oxide - 1000 - 10
67 34123-59-6 Isoproturon - - - 1
68 NAPHTHALENE 91-20-3 Naphthalene 100 100 10 10
69 ORGANOTIN COMPOUNDS
Organotin compounds(as total Sn) - - 50 50
70 DEHP 117-81-7 Di-(2-ethyl hexyl) phthalate (DEHP) 1 10 1 1
71 PHENOLS 108-95-2 Phenols (as total C) 1 - 1 20
72 PAH
Polycyclic aromatic hydrocarbons (PAHs) 50 50 5 5
73 TOLUEN 108-88-3 Toluene 100 - 100 (as BTEX) 200 (as BTEX)

46
Thresholds for releases to air (kg/year):
Thresholds for releases to water (kg/year):
E-PRTR pollutant no
Substance code
CAS-no Pollutant NFS 2006:9 E-PRTR NFS 2006:9 E-PRTR
74 TRIBUTYLTIN
Tributyltin and compounds - - - 1
75
Triphenyltin and compounds 1 - 0.1 1
76 TOC
Total organic carbon (TOC) (as total C or COD/3) - - 50000 50000
77 1582-09-8 Trifluralin - - - 1
78 XYLENES 1330-20-7 Xylenes 100 - 100 (as BTEX) 200 (as BTEX)
79 CL-tot
Chlorides (as total Cl) - - 2000000 2000000
80 HCl
Chlorine and inorganic compounds (as HCl) 10000 10000 - -
81 1332-21-4 Asbestos 1 1 1 1
82 CN-tot
Cyanides (as total CN) - - 50 50
83 F-tot
Fluorides (as total F) - - 2000 2000
84
Fluorine and inorganic compounds (as HF) 5000 5000 - -
85 74-90-8 Hydrogen cyanide (HCN) 200 200 - -
86 PM10
Particulate matter (PM10) 50000 50000 - -
87 1806-26-4 Octylphenols and Octylphenol ethoxylates 1 - 1 1
88 PAH-FA 206-44-0 Fluoranthene - - 1 1
89 465-73-6 Isodrin - - 1 1
90 36355-01-8 Hexabromobiphenyl 0.1 0.1 0.1 0.1
91 191-24-2 Benzo(g,h,i)perylene - - 1 1

47
Appendix 2 Sectors
Annex I activities according to Regulation 166/2006 (EU, 2006). The “x” represents if there is any emission data reported for respective media, air,
water or off-site transfers in the data set used in this project.
Air Water Off-site transfers to waste water
E-PRTR activity Description
1 Energy sector
x x
1.(a) Mineral oil and gas refineries
1.(b) Installations for gasification and liquefaction
x x x 1.(c) Thermal power stations and other combustion installations
1.(d) Coke ovens
1.(e) Coal rolling mills
1.(f) Installations for the manufacture of coal products and solid smokeless fuel
2 Production and processing of metals
x x
2.(a) Metal ore (including sulphide ore) roasting or sintering installations
x x x 2.(b) Installations for the production of pig iron or steel (primary or secondary melting) including continuous casting
x
2.(c) Installations for the processing of ferrous metals
x x
2.(c).(i) Installations for the processing of ferrous metals - Hot-rolling mills
2.(c).(ii) Installations for the processing of ferrous metals - Smitheries with hammers
x x
2.(c).(iii) Installations for the processing of ferrous metals - Application of protective fused metal coats
x
x 2.(d) Ferrous metal foundries
2.(e) Installations:
x x
2.(e).(i) Installations for the production of non-ferrous crude metals from ore, concentrates or secondary raw materials by metallurgical, chemical or electrolytic processes

48
Air Water Off-site transfers to waste water
E-PRTR activity Description
x x x 2.(e).(ii) Installations for the smelting, including the alloying, of non-ferrous metals, including recovered products (refin-ing, foundry casting, etc.)
x x x 2.(f) Installations for surface treatment of metals and plastic materials using an electrolytic or chemical process
3 Mineral industry
3.(a) Underground mining and related operations
x x
3.(b) Opencast mining and quarrying
x
3.(c) Installations for the production of:
3.(c).(i) Installations for the production of: Cement clinker in rotary kilns
3.(c).(ii) Installations for the production of: Lime in rotary kilns
3.(c).(iii) Installations for the production of: Cement clinker or lime in other furnaces
3.(d) Installations for the production of asbestos and the manufacture of asbestos-based products
x x x 3.(e) Installations for the manufacture of glass, including glass fibre
x x
3.(f) Installations for melting mineral substances, including the production of mineral fibres
x x
3.(g) Installations for the manufacture of ceramic products by firing, in particular roofing tiles, bricks, refractory bricks, tiles, stoneware or porcelain
4 Chemical industry
x x x 4.(a) Chemical installations for the production on an industrial scale of basic organic chemicals, such as:
x x x 4.(a).(i) Chemical installations for the production on an industrial scale of basic organic chemicals, such as: Simple hy-drocarbons (linear or cyclic, saturated or unsaturated, aliphatic or aromatic)
x x x 4.(a).(ii) Chemical installations for the production on an industrial scale of basic organic chemicals, such as: Oxygen-containing hydrocarbons
4.(a).(iii) - Sulphurous hydrocarbons
x x x 4.(a).(iv) Chemical installations for the production on an industrial scale of basic organic chemicals, such as: Nitrogenous hydrocarbons
4.(a).(v) - Phosphorus-containing hydrocarbons

49
Air Water Off-site transfers to waste water
E-PRTR activity Description
4.(a).(vi) - Halogenic hydrocarbons
4.(a).(vii) - Organometallic compounds
x x x 4.(a).(viii) Chemical installations for the production on an industrial scale of basic organic chemicals, such as: Basic plastic materials (polymers, synthetic fibres and cellulose-based fibres)
4.(a).(ix) - Synthetic rubbers
4.(a).(x) - Dyes and pigments
4.(a).(xi) - Surface-active agents and surfactants
4.(b) Chemical installations for the production on an industrial scale of basic inorganic chemicals, such as:
x x x 4.(b).(i) Chemical installations for the production on an industrial scale of basic inorganic chemicals, such as: Gases
4.(b).(ii) Chemical installations for the production on an industrial scale of basic inorganic chemicals, such as: Acids
x
4.(b).(iii) Chemical installations for the production on an industrial scale of basic inorganic chemicals, such as: Bases
x x x 4.(b).(iv) Chemical installations for the production on an industrial scale of basic inorganic chemicals, such as: Salts
x x
4.(b).(v) Chemical installations for the production on an industrial scale of basic inorganic chemicals, such as: Non-metals, metal oxides or other inorganic compounds
x x
4.(c) Chemical installations for the production on an industrial scale of phosphorous-, nitrogen- or potassium-based fertilisers (simple or compound fertilisers)
4.(d) Chemical installations for the production on an industrial scale of basic plant health products and of biocides
x x x 4.(e) Installations using a chemical or biological process for the production on an industrial scale of basic pharmaceu-tical products
x
x 4.(f) Installations for the production on an industrial scale of explosives and pyrotechnic products
5 Waste and waste water management
x x x 5.(a) Installations for the recovery or disposal of hazardous waste
x x
5.(b) Installations for the incineration of non-hazardous waste in the scope of Directive 2000/76/EC of the European Parliament and of the Council of 4 December 2000 on the incineration of waste
x x 5.(c) Installations for the disposal of non-hazardous waste

50
Air Water Off-site transfers to waste water
E-PRTR activity Description
x x x 5.(d) Landfills (see note in Guidance Document)
x x x 5.(e) Installations for the disposal or recycling of animal carcasses and animal waste
x x
5.(f) Urban waste-water treatment plants
5.(g)
Independently operated industrial waste-water treatment plants which serve one or more activities of this annex
6 Paper and wood production and processing
x x
6.(a) Industrial plants for the production of pulp from timber or similar fibrous materials
x x x 6.(b) Industrial plants for the production of paper and board and other primary wood products
6.(c) Industrial plants for the preservation of wood and wood products with chemicals
7 Intensive livestock production and aquaculture
x
7.(a) Installations for the intensive rearing of poultry or pigs
x x
7.(a).(i) Installations for the intensive rearing of poultry or pigs - With 40 000 places for poultry
x x x 7.(a).(ii) Installations for the intensive rearing of poultry or pigs - With 2 000 places for production pigs (over 30kg)
x x
7.(a).(iii) Installations for the intensive rearing of poultry or pigs - With 750 places for sows
7.(b) Intensive aquaculture
8 Animal and vegetable products from the food and beverage sector
x x x 8.(a) Slaughterhouses
x x x 8.(b) Treatment and processing intended for the production of food and beverage products
x
x 8.(b).(i) Treatment and processing intended for the production of food and beverage products from: Animal raw materi-als (other than milk)
x x x 8.(b).(ii) Treatment and processing intended for the production of food and beverage products from: Vegetable raw materials
x x x 8.(c) Treatment and processing of milk

51
Air Water Off-site transfers to waste water
E-PRTR activity Description
9 Other activities
x
x 9.(a) Plants for the pre-treatment (operations such as washing, bleaching, mercerisation) or dyeing of fibres or tex-tiles
x x
9.(b) Plants for the tanning of hides and skins
x x x 9.(c) Installations for the surface treatment of substances, objects or products using organic solvents, in particular for dressing, printing, coating, degreasing, waterproofing, sizing, painting, cleaning or impregnating
x
9.(d) Installations for the production of carbon (hard-burnt coal) or electro-graphite by means of incineration or graphitisation
x
9.(e) Installations for the building of, and painting or removal of paint from ships

52
Appendix 3. Results - Greenhouse gases
Emissions of greenhouse gases to air presented as a percentage of the total number of PRTR-classified facilities reporting emissions to air. The re-
sults are presented as percentage below (<t v) and above (> t v) the threshold values to E-PRTR.
E-PRTR activity
No of PRTR facilities
1. CH4 3. CO2 4. HFC 5. N2O 9. PFC 10. SF6
< t v > t v < t v > t v < t v > t v < t v > t v < t v > t v < t v > t v
% % % % % % % % % % % %
1.(a) 5 20 20 20 80 20 0 0 20 0 0 0 0 1.(c) 128 1 1 37 23 4 2 2 6 0 0 0 0
2.(a) 3 0 0 0 100 0 0 0 0 0 0 0 0 2.(b) 12 0 0 0 42 0 17 0 0 0 0 0 0 2.(c) 1 0 0 0 0 0 0 0 0 0 0 0 0 2.(c).(i) 4 0 0 25 25 0 0 0 0 0 0 0 0 2.(c).(iii) 3 0 0 0 0 0 0 0 0 0 0 0 0 2.(d) 10 0 0 10 0 10 10 0 0 0 0 0 10 2.(e).(i) 6 0 0 17 33 17 0 0 0 0 17 0 0 2.(e).(ii) 6 0 0 17 17 17 0 0 0 0 0 0 0 2.(f) 20 0 0 10 0 5 5 0 0 0 0 0 0
3.(b) 1 0 0 100 0 0 0 0 0 0 0 0 0 3.(c) 10 0 0 10 50 10 0 0 0 0 0 0 0 3.(e) 3 0 0 33 33 0 0 0 0 0 0 0 0 3.(f) 2 0 0 100 0 0 0 0 0 0 0 0 0 3.(g) 4 0 0 0 0 0 0 0 0 0 0 0 0
4.(a) 6 0 0 50 17 33 0 0 0 0 0 0 0 4.(a).(i) 6 17 0 17 17 17 0 0 0 0 0 17 0 4.(a).(ii) 14 0 0 57 7 71 0 7 0 0 0 0 0 4.(a).(iv) 3 0 0 0 0 0 0 0 0 0 0 0 0 4.(a).(viii) 8 0 0 50 0 13 25 0 0 0 0 0 0 4.(b).(i) 4 25 0 0 0 0 0 0 0 0 0 0 0 4.(b).(iii) 1 0 0 0 0 0 0 0 0 0 0 0 0 4.(b).(iv) 3 0 0 33 0 0 0 0 0 0 0 0 0 4.(b).(v) 4 0 0 25 0 0 0 0 0 0 0 0 0 4.(c) 1 0 0 0 0 100 0 0 100 0 0 0 0 4.(e) 6 0 0 0 0 0 0 0 17 0 0 0 0

53
E-PRTR activity
No of PRTR facilities
1. CH4 3. CO2 4. HFC 5. N2O 9. PFC 10. SF6
< t v > t v < t v > t v < t v > t v < t v > t v < t v > t v < t v > t v
% % % % % % % % % % % %
4.(f) 1 0 0 0 0 0 0 0 0 0 0 0 0
5.(a) 8 0 13 13 13 38 0 0 0 0 0 0 0 5.(b) 22 0 0 9 45 0 0 9 18 0 0 0 0 5.(d) 23 22 61 13 0 0 0 4 0 0 0 0 0 5.(e) 2 0 0 100 0 0 0 0 0 0 0 0 0 5.(f) 6 17 50 0 0 0 0 33 50 0 0 0 0
6.(a) 38 50 0 24 74 34 3 13 53 0 0 0 0 6.(b) 11 0 0 64 18 18 0 9 9 0 0 0 0
7.(a) 2 0 0 0 0 0 0 0 0 0 0 0 0 7.(a).(i) 126 0 0 0 0 0 0 1 0 0 0 0 0 7.(a).(ii) 90 0 0 0 0 0 0 0 0 0 0 0 0 7.(a).(iii) 11 0 0 0 0 0 0 0 0 0 0 0 0
8.(a) 6 0 0 83 0 0 0 0 0 0 0 0 0 8.(b) 11 0 0 9 0 9 9 0 0 0 0 0 0 8.(b).(i) 1 0 0 0 0 0 0 0 0 0 0 0 0 8.(b).(ii) 3 0 0 33 0 0 0 0 0 0 0 0 0 8.(c) 3 0 0 33 0 0 0 0 0 0 0 0 0
9.(a) 3 0 0 67 0 33 0 0 0 0 0 0 0 9.(b) 1 0 0 0 0 0 0 0 0 0 0 0 0 9.(c) 22 0 0 9 0 9 0 0 0 0 0 0 0 9.(d) 1 0 0 0 0 0 0 0 0 0 0 0 0 9.(e) 1 0 0 0 0 0 0 0 0 0 0 0 0
Total 666 3 4 14 17 2 7 6 2 0.2 0 0.15 0
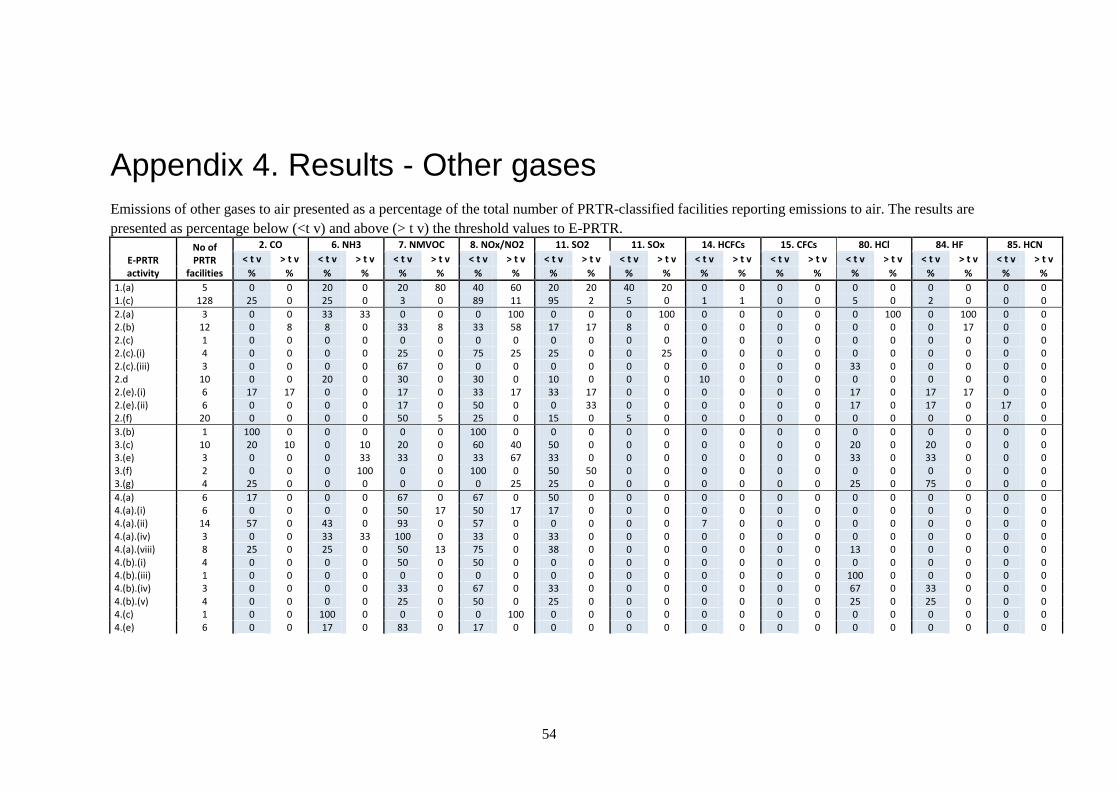
54
Appendix 4. Results - Other gases
Emissions of other gases to air presented as a percentage of the total number of PRTR-classified facilities reporting emissions to air. The results are
presented as percentage below (<t v) and above (> t v) the threshold values to E-PRTR.
E-PRTR activity
No of PRTR
facilities
2. CO 6. NH3 7. NMVOC 8. NOx/NO2 11. SO2 11. SOx 14. HCFCs 15. CFCs 80. HCl 84. HF 85. HCN
< t v > t v < t v > t v < t v > t v < t v > t v < t v > t v < t v > t v < t v > t v < t v > t v < t v > t v < t v > t v < t v > t v
% % % % % % % % % % % % % % % % % % % % % %
1.(a) 5 0 0 20 0 20 80 40 60 20 20 40 20 0 0 0 0 0 0 0 0 0 0 1.(c) 128 25 0 25 0 3 0 89 11 95 2 5 0 1 1 0 0 5 0 2 0 0 0
2.(a) 3 0 0 33 33 0 0 0 100 0 0 0 100 0 0 0 0 0 100 0 100 0 0 2.(b) 12 0 8 8 0 33 8 33 58 17 17 8 0 0 0 0 0 0 0 0 17 0 0 2.(c) 1 0 0 0 0 0 0 0 0 0 0 0 0 0 0 0 0 0 0 0 0 0 0 2.(c).(i) 4 0 0 0 0 25 0 75 25 25 0 0 25 0 0 0 0 0 0 0 0 0 0 2.(c).(iii) 3 0 0 0 0 67 0 0 0 0 0 0 0 0 0 0 0 33 0 0 0 0 0 2.d 10 0 0 20 0 30 0 30 0 10 0 0 0 10 0 0 0 0 0 0 0 0 0 2.(e).(i) 6 17 17 0 0 17 0 33 17 33 17 0 0 0 0 0 0 17 0 17 17 0 0 2.(e).(ii) 6 0 0 0 0 17 0 50 0 0 33 0 0 0 0 0 0 17 0 17 0 17 0 2.(f) 20 0 0 0 0 50 5 25 0 15 0 5 0 0 0 0 0 0 0 0 0 0 0
3.(b) 1 100 0 0 0 0 0 100 0 0 0 0 0 0 0 0 0 0 0 0 0 0 0 3.(c) 10 20 10 0 10 20 0 60 40 50 0 0 0 0 0 0 0 20 0 20 0 0 0 3.(e) 3 0 0 0 33 33 0 33 67 33 0 0 0 0 0 0 0 33 0 33 0 0 0 3.(f) 2 0 0 0 100 0 0 100 0 50 50 0 0 0 0 0 0 0 0 0 0 0 0 3.(g) 4 25 0 0 0 0 0 0 25 25 0 0 0 0 0 0 0 25 0 75 0 0 0
4.(a) 6 17 0 0 0 67 0 67 0 50 0 0 0 0 0 0 0 0 0 0 0 0 0 4.(a).(i) 6 0 0 0 0 50 17 50 17 17 0 0 0 0 0 0 0 0 0 0 0 0 0 4.(a).(ii) 14 57 0 43 0 93 0 57 0 0 0 0 0 7 0 0 0 0 0 0 0 0 0 4.(a).(iv) 3 0 0 33 33 100 0 33 0 33 0 0 0 0 0 0 0 0 0 0 0 0 0 4.(a).(viii) 8 25 0 25 0 50 13 75 0 38 0 0 0 0 0 0 0 13 0 0 0 0 0 4.(b).(i) 4 0 0 0 0 50 0 50 0 0 0 0 0 0 0 0 0 0 0 0 0 0 0 4.(b).(iii) 1 0 0 0 0 0 0 0 0 0 0 0 0 0 0 0 0 100 0 0 0 0 0 4.(b).(iv) 3 0 0 0 0 33 0 67 0 33 0 0 0 0 0 0 0 67 0 33 0 0 0 4.(b).(v) 4 0 0 0 0 25 0 50 0 25 0 0 0 0 0 0 0 25 0 25 0 0 0 4.(c) 1 0 0 100 0 0 0 0 100 0 0 0 0 0 0 0 0 0 0 0 0 0 0 4.(e) 6 0 0 17 0 83 0 17 0 0 0 0 0 0 0 0 0 0 0 0 0 0 0

55
E-PRTR activity
No of PRTR
facilities
2. CO 6. NH3 7. NMVOC 8. NOx/NO2 11. SO2 11. SOx 14. HCFCs 15. CFCs 80. HCl 84. HF 85. HCN
< t v > t v < t v > t v < t v > t v < t v > t v < t v > t v < t v > t v < t v > t v < t v > t v < t v > t v < t v > t v < t v > t v
% % % % % % % % % % % % % % % % % % % % % %
4.(f) 1 0 0 0 0 0 100 100 0 0 0 0 0 0 0 0 0 0 0 0 0 0 0
5.(a) 8 0 0 0 0 13 0 38 0 50 0 0 0 13 0 0 25 0 0 0 0 0 0 5.(b) 22 36 0 64 5 0 0 82 18 64 0 5 0 0 0 0 0 23 0 18 0 0 0 5.(d) 23 4 0 4 4 9 0 13 0 4 0 4 0 0 0 0 0 0 0 0 0 0 0 5.(e) 2 0 0 0 0 0 0 100 0 50 0 0 0 0 0 0 0 0 0 0 0 0 0 5.(f) 6 0 0 33 0 33 0 33 0 0 0 0 0 0 0 0 0 0 0 0 0 0 0
6.(a) 38 24 26 21 37 29 55 32 68 29 18 21 24 8 0 5 0 16 8 0 0 0 0 6.(b) 11 9 9 18 0 0 18 82 18 45 0 9 0 0 0 0 0 9 0 9 0 0 0
7.(a) 2 0 0 50 50 0 0 0 0 0 0 0 0 0 0 0 0 0 0 0 0 0 0 7.(a).(i) 126 0 0 62 38 0 0 0 0 0 0 0 0 0 0 0 0 0 0 0 0 0 0 7.(a).(ii) 90 0 0 60 40 0 0 0 0 0 0 0 0 0 0 0 0 0 0 0 0 0 0 7.(a).(iii) 11 0 0 55 45 0 0 0 0 0 0 0 0 0 0 0 0 0 0 0 0 0 0
8.(a) 6 0 0 17 0 0 0 67 0 50 0 0 0 0 0 0 0 0 0 0 0 0 0 8.(b) 11 0 0 0 0 0 0 100 0 0 0 18 0 0 0 0 0 0 0 0 0 0 0 8.(b).(i) 1 0 0 0 0 0 0 100 0 0 0 0 0 0 0 0 0 0 0 0 0 0 0 8.(b).(ii) 3 33 0 0 0 33 0 100 0 33 0 0 0 0 0 0 0 0 0 0 0 0 0 8.(c) 3 0 0 0 0 0 0 100 0 0 0 0 0 0 0 0 0 0 0 0 0 0 0
9.(a) 3 0 0 0 0 33 0 100 0 100 0 0 0 0 0 0 0 0 0 0 0 0 0 9.(b) 1 0 0 0 0 100 0 0 0 0 0 0 0 0 0 0 0 0 0 0 0 0 0 9.(c) 22 0 0 0 0 91 5 27 0 5 0 0 0 0 5 0 0 0 0 0 0 0 0 9.(d) 1 0 0 0 0 0 0 100 0 100 0 0 0 0 0 0 0 0 0 0 0 0 0 9.(e) 1 0 0 0 0 0 0 100 0 0 0 0 0 0 0 0 0 0 0 0 0 0 0
Total 666 10 2 32 17 16 5 39 11 29 2 4 2 1 0.3 0.3 0.3 5 1 3 1 0.2 0

56
Appendix 5. Results - Metals
Emissions of metals to air presented as a percentage of the total number of PRTR-classified facilities reporting emissions to air. The results are pre-
sented as percentage below (<t v) and above (> t v) the threshold values to E-PRTR.
E-PRTR activity
No of PRTR
facilities
17. As 18. Cd 19. Cr 20. Cu 21. Hg 22. Ni 23. Pb 24. Zn
< t v > t v < t v > t v < t v > t v < t v > t v < t v > t v < t v > t v < t v > t v < t v > t v
% % % % % % % % % % % % % % % %
1.(a) 5 40 0 20 0 20 0 40 0 40 0 0 40 40 0 20 0 1.(c) 128 2 0 6 0 2 0 3 0 15 0 2 0 2 0 0 0
2.(a) 3 67 33 100 0 67 33 67 33 33 67 0 100 67 33 0 100 2.(b) 12 25 0 67 0 25 25 42 0 50 33 25 17 83 0 0 75 2.(c) 1 0 0 0 0 0 0 0 0 0 0 0 0 0 0 0 100 2.(c).(i) 4 0 0 0 0 0 0 0 0 0 0 0 0 0 0 0 0 2.(c).(iii) 3 0 0 0 0 0 0 0 0 0 0 0 0 0 0 67 0 2.d 10 0 0 20 0 10 0 20 0 0 0 20 0 40 0 10 10 2.(e).(i) 6 17 17 17 17 0 0 33 17 17 17 17 0 33 17 17 33 2.(e).(ii) 6 17 0 17 0 17 0 17 0 33 0 0 0 17 0 17 0 2.(f) 20 0 0 0 0 15 0 5 0 0 0 5 0 0 0 5 0
3.(b) 1 100 0 100 0 100 0 100 0 100 0 0 0 100 0 0 0 3.(c) 10 50 0 60 0 50 0 50 0 60 0 40 10 50 0 0 10 3.(e) 3 33 0 33 0 33 0 0 0 33 0 0 0 33 0 0 0 3.(f) 2 0 0 0 0 0 0 0 0 0 0 0 0 0 0 0 0 3.(g) 4 0 0 50 0 0 0 25 0 50 0 25 0 50 0 0 0
4.(a) 6 17 0 17 0 17 0 0 0 17 0 17 0 17 0 0 0 4.(a).(i) 6 0 0 0 0 0 0 0 0 0 0 0 0 0 0 0 0 4.(a).(ii) 14 0 0 0 0 0 0 0 0 0 0 0 0 0 0 0 0 4.(a).(iv) 3 0 0 0 0 0 0 0 0 0 0 0 0 0 0 0 0 4.(a).(viii) 8 0 0 13 0 13 0 13 0 0 13 0 0 13 0 0 0 4.(b).(i) 4 0 0 0 0 0 0 0 0 50 0 0 0 0 0 0 0 4.(b).(iii) 1 0 0 0 0 0 0 0 0 0 0 0 0 0 0 0 0 4.(b).(iv) 3 0 0 0 0 0 0 0 0 0 0 0 0 0 0 0 0 4.(b).(v) 4 0 0 0 0 0 0 0 0 0 0 0 0 0 0 0 0 4.(c) 1 0 0 0 0 0 0 0 0 0 0 0 0 0 0 0 0 4.(e) 6 0 0 0 0 0 0 0 0 0 0 0 0 0 0 0 0

57
E-PRTR activity
No of PRTR
facilities
17. As 18. Cd 19. Cr 20. Cu 21. Hg 22. Ni 23. Pb 24. Zn
< t v > t v < t v > t v < t v > t v < t v > t v < t v > t v < t v > t v < t v > t v < t v > t v
% % % % % % % % % % % % % % % %
4.(f) 1 0 0 0 0 0 0 0 0 0 0 0 0 100 0 0 0
5.(a) 8 0 0 0 0 0 0 0 0 13 0 0 0 0 0 0 0 5.(b) 22 18 0 36 0 27 0 23 0 55 5 27 0 18 0 0 0 5.(d) 23 0 0 0 0 0 4 4 0 0 0 0 4 0 0 0 0 5.(e) 2 0 0 0 0 0 0 0 0 0 0 0 0 0 0 0 0 5.(f) 6 0 0 0 0 0 0 0 0 0 0 0 0 0 0 0 0
6.(a) 38 76 0 82 3 61 0 74 0 84 0 47 29 74 0 39 24 6.(b) 11 9 0 18 0 9 0 18 0 27 0 0 27 18 0 9 9
7.(a) 2 0 0 0 0 0 0 0 0 0 0 0 0 0 0 0 0 7.(a).(i) 126 0 0 0 0 0 0 0 0 0 0 0 0 0 0 0 0 7.(a).(ii) 90 0 0 0 0 0 0 0 0 0 0 0 0 0 0 0 0 7.(a).(iii) 11 0 0 0 0 0 0 0 0 0 0 0 0 0 0 0 0
8.(a) 6 0 0 0 0 0 0 0 0 0 0 0 0 0 0 0 0 8.(b) 11 0 0 0 0 0 0 0 0 0 0 0 0 0 0 0 0 8.(b).(i) 1 0 0 0 0 0 0 0 0 0 0 0 0 0 0 0 0 8.(b).(ii) 3 0 0 0 0 0 0 0 0 0 0 0 0 0 0 0 0 8.(c) 3 0 0 0 0 0 0 0 0 0 0 0 0 0 0 0 0
9.(a) 3 0 0 0 0 0 0 0 0 0 0 0 0 0 0 0 0 9.(b) 1 0 0 0 0 0 0 0 0 0 0 0 0 0 0 0 0 9.(c) 22 0 0 0 0 0 0 0 0 0 0 0 0 0 0 0 0 9.(d) 1 0 0 0 0 0 0 0 0 0 0 0 0 0 0 0 0 9.(e) 1 0 0 0 0 0 0 0 0 0 0 0 0 0 0 0 0
Total 666 8 0 12 0 8 1 9 0 14 1 6 3 11 0 3 4

58
Emissions of metals directly to water presented as a percentage of the total number of PRTR-classified facilities reporting emissions to water. The
results are presented as percentage below (<t v) and above (> t v) the threshold values to E-PRTR.
E-PRTR activity
No of PRTR
facilities
17. As 18. Cd 19. Cr 20. Cu 21. Hg 22. Ni 23. Pb 24. Zn
<t v >t v <t v >t v <t v >t v <t v >t v <t v >t v <t v >t v <t v >t v <t v >t v
% % % % % % % % % % % % % % % %
1.(a) 5 40 40 20 0 20 0 40 0 60 0 20 0 0 20 60 0 1.(c) 17 47 0 47 0 47 0 47 0 53 0 53 0 53 0 59 6
2.(a) 2 50 50 100 0 100 0 100 0 100 0 50 50 100 0 100 0 2.(b) 10 10 20 40 10 60 10 50 0 30 0 50 30 50 10 30 50 2.(c).(i) 3 0 0 0 0 33 33 0 0 0 0 33 33 33 0 0 0 2.(c).(iii) 2 0 0 0 0 0 0 0 0 0 0 50 0 50 0 100 0 2.(e).(i) 5 20 40 20 20 0 0 20 20 20 20 0 20 20 40 20 60 2.(e).(ii) 3 67 0 67 0 100 0 67 0 67 0 33 0 67 0 67 0 2.(f) 38 0 0 8 0 79 0 47 0 0 0 66 3 11 0 66 0
3.(b) 1 0 100 100 0 100 0 0 100 100 0 0 100 100 0 0 100 3.(e) 1 0 0 0 0 0 0 0 0 0 0 0 0 0 0 0 0 3.(f) 1 0 0 0 0 0 0 0 0 0 0 0 0 0 0 0 0 3.(g) 2 0 0 50 0 50 0 50 0 0 0 0 0 50 50 100 0
4.(a) 5 20 0 20 0 20 0 0 0 0 0 0 20 0 0 0 0 4.(a).(i) 3 0 0 0 0 33 33 0 33 0 0 0 33 0 33 0 33 4.(a).(ii) 1 0 0 0 0 0 0 0 0 0 0 0 0 0 0 0 0 4.(a).(iv) 2 0 0 0 0 0 0 0 0 0 0 0 50 0 0 50 0 4.(a).(viii) 6 0 0 17 0 17 0 17 0 17 0 0 0 17 0 17 17 4.(b).(i) 3 0 0 0 0 33 0 33 0 67 0 33 0 0 0 33 0 4.(b).(iv) 3 0 0 0 0 67 0 0 0 0 0 0 0 0 0 0 0 4.(b).(v) 3 33 33 0 0 0 0 0 0 33 0 0 0 0 0 0 0
4.(c) 1 0 0 0 0 0 0 0 0 0 0 0 0 0 0 0 0 4.(e) 3 0 0 0 0 0 0 0 33 0 0 0 33 0 0 33 0 5.(a) 6 17 0 100 0 100 0 83 0 67 0 67 33 100 0 83 17 5.(b) 8 50 0 50 0 50 0 50 0 63 0 50 0 50 0 63 0 5.(c) 1 100 0 100 0 100 0 100 0 100 0 100 0 100 0 100 0 5.(d) 60 57 0 55 0 52 0 48 0 50 0 47 2 52 0 52 0 5.(e) 1 0 0 0 0 0 0 0 0 0 0 0 0 0 0 0 0 5.(f) 14 0 50 100 0 86 14 7 93 64 36 7 93 71 29 0 100
6.(a) 39 31 44 33 49 59 28 31 54 56 18 13 72 31 51 10 82 6.(b) 13 8 15 15 8 15 0 23 8 15 8 8 15 23 0 23 23

59
E-PRTR activity
No of PRTR
facilities
17. As 18. Cd 19. Cr 20. Cu 21. Hg 22. Ni 23. Pb 24. Zn
<t v >t v <t v >t v <t v >t v <t v >t v <t v >t v <t v >t v <t v >t v <t v >t v
% % % % % % % % % % % % % % % %
7.(a).(i) 28 0 0 0 0 0 0 0 0 0 0 0 0 0 0 0 0 7.(a).(ii) 25 0 0 0 0 0 0 0 0 0 0 0 0 0 0 0 0 7.(a).(iii) 3 0 0 0 0 0 0 0 0 0 0 0 0 0 0 0 0
8.(a) 3 0 0 0 0 0 0 0 0 0 0 0 0 0 0 0 0 8.(b) 5 0 0 0 0 0 0 0 0 0 0 0 0 0 0 0 0 8.(b).(ii) 1 0 0 0 0 0 0 0 0 0 0 0 0 0 0 0 0 8.(c) 2 0 0 0 0 0 0 0 0 0 0 0 0 0 0 0 0
9.(b) 1 0 0 0 0 100 0 0 0 0 0 0 0 0 0 0 0 9.(c) 1 0 0 0 0 100 0 0 0 0 0 0 0 0 0 100 0
Total 331 21 11 30 7 42 5 29 12 30 4 27 18 29 9 31 19
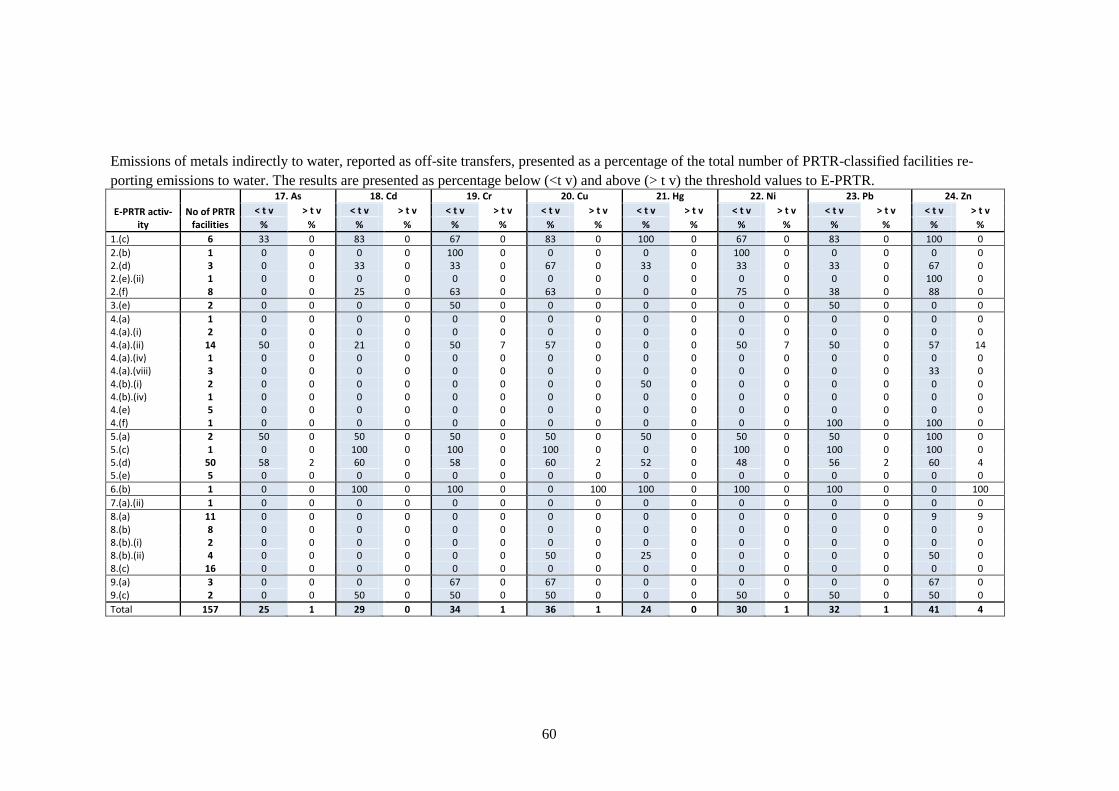
60
Emissions of metals indirectly to water, reported as off-site transfers, presented as a percentage of the total number of PRTR-classified facilities re-
porting emissions to water. The results are presented as percentage below (<t v) and above (> t v) the threshold values to E-PRTR.
E-PRTR activ-ity
No of PRTR facilities
17. As 18. Cd 19. Cr 20. Cu 21. Hg 22. Ni 23. Pb 24. Zn
< t v > t v < t v > t v < t v > t v < t v > t v < t v > t v < t v > t v < t v > t v < t v > t v
% % % % % % % % % % % % % % % %
1.(c) 6 33 0 83 0 67 0 83 0 100 0 67 0 83 0 100 0
2.(b) 1 0 0 0 0 100 0 0 0 0 0 100 0 0 0 0 0 2.(d) 3 0 0 33 0 33 0 67 0 33 0 33 0 33 0 67 0 2.(e).(ii) 1 0 0 0 0 0 0 0 0 0 0 0 0 0 0 100 0 2.(f) 8 0 0 25 0 63 0 63 0 0 0 75 0 38 0 88 0
3.(e) 2 0 0 0 0 50 0 0 0 0 0 0 0 50 0 0 0
4.(a) 1 0 0 0 0 0 0 0 0 0 0 0 0 0 0 0 0 4.(a).(i) 2 0 0 0 0 0 0 0 0 0 0 0 0 0 0 0 0 4.(a).(ii) 14 50 0 21 0 50 7 57 0 0 0 50 7 50 0 57 14 4.(a).(iv) 1 0 0 0 0 0 0 0 0 0 0 0 0 0 0 0 0 4.(a).(viii) 3 0 0 0 0 0 0 0 0 0 0 0 0 0 0 33 0 4.(b).(i) 2 0 0 0 0 0 0 0 0 50 0 0 0 0 0 0 0 4.(b).(iv) 1 0 0 0 0 0 0 0 0 0 0 0 0 0 0 0 0 4.(e) 5 0 0 0 0 0 0 0 0 0 0 0 0 0 0 0 0 4.(f) 1 0 0 0 0 0 0 0 0 0 0 0 0 100 0 100 0
5.(a) 2 50 0 50 0 50 0 50 0 50 0 50 0 50 0 100 0 5.(c) 1 0 0 100 0 100 0 100 0 0 0 100 0 100 0 100 0 5.(d) 50 58 2 60 0 58 0 60 2 52 0 48 0 56 2 60 4 5.(e) 5 0 0 0 0 0 0 0 0 0 0 0 0 0 0 0 0
6.(b) 1 0 0 100 0 100 0 0 100 100 0 100 0 100 0 0 100
7.(a).(ii) 1 0 0 0 0 0 0 0 0 0 0 0 0 0 0 0 0
8.(a) 11 0 0 0 0 0 0 0 0 0 0 0 0 0 0 9 9 8.(b) 8 0 0 0 0 0 0 0 0 0 0 0 0 0 0 0 0 8.(b).(i) 2 0 0 0 0 0 0 0 0 0 0 0 0 0 0 0 0 8.(b).(ii) 4 0 0 0 0 0 0 50 0 25 0 0 0 0 0 50 0 8.(c) 16 0 0 0 0 0 0 0 0 0 0 0 0 0 0 0 0
9.(a) 3 0 0 0 0 67 0 67 0 0 0 0 0 0 0 67 0 9.(c) 2 0 0 50 0 50 0 50 0 0 0 50 0 50 0 50 0
Total 157 25 1 29 0 34 1 36 1 24 0 30 1 32 1 41 4

61
Appendix 6. Results - Inorganic substances
Emissions of inorganic substances to air presented as a percentage of the total number of PRTR-classified facilities reporting emissions to air. The
results are presented as percentage below (<t v) and above (> t v) the threshold values to E-PRTR.
E-PRTR activity
No of PRTR facilities
86. PM 10 < t v > t v
% %
1.(a) 5 20 20 1.(c) 128 5 0
2.(a) 3 0 100 2.(b) 12 0 8 2.(c) 1 0 0 2.(c).(i) 4 0 0 2.(c).(iii) 3 0 0 2.(d) 10 0 0 2.(e).(i) 6 17 0 2.(e).(ii) 6 33 17 2.(f) 20 15 0
3.(b) 1 0 0 3.(c) 10 0 0 3.(e) 3 33 33 3.(f) 2 0 0 3.(g) 4 0 0
4.(a) 6 17 0 4.(a).(i) 6 17 0 4.(a).(ii) 14 0 0 4.(a).(iv) 3 0 0 4.(a).(viii) 8 0 0 4.(b).(i) 4 0 0

62
E-PRTR activity
No of PRTR facilities
86. PM 10 < t v > t v
% %
4.(b).(iii) 1 0 0 4.(b).(iv) 3 0 0 4.(b).(v) 4 0 25 4.(c) 1 0 0 4.(e) 6 0 0 4.(f) 1 0 0
5.(a) 8 0 0 5.(b) 22 14 0 5.(d) 23 0 0 5.(e) 2 0 0 5.(f) 6 0 0
6.(a) 38 16 34 6.(b) 11 0 0
7.(a) 2 0 0 7.(a).(i) 126 0 0 7.(a).(ii) 90 0 0 7.(a).(iii) 11 0 0
8.(a) 6 0 0 8.(b) 11 0 0 8.(b).(i) 1 0 0 8.(b).(ii) 3 0 0 8.(c) 3 0 0
9.(a) 3 0 0 9.(b) 1 0 0 9.(c) 22 0 0 9.(d) 1 0 0 9.(e) 1 0 0
Total 666 4 3

63
Emissions of inorganic substances directly to water presented as a percentage of the total number of PRTR-classified facilities reporting emissions to
water. The results are presented as percentage below (<t v) and above (> t v) the threshold values to E-PRTR.
E-PRTR activity
No of PRTR
facilities
12. NH4-N 12. NO2+NO3-
N 12. N-tot 13. PO4-P 13. P-tot 79. Cl-tot 82. CN-tot 83. F-tot
< t v > t v < t v > t v < t v > t v < t v > t v < t v > t v < t v > t v < t v > t v < t v > t v
% % % % % % % % % % % % % % % %
1.(a) 5 40 0 0 0 80 0 0 0 80 0 0 0 20 0 0 0 1.(c) 17 24 0 0 0 35 0 0 0 29 0 0 0 0 0 0 0
2.(a) 2 50 0 0 0 0 100 0 0 100 0 100 0 0 0 0 100 2.(b) 10 20 0 10 10 20 30 0 0 20 0 0 0 0 10 0 30 2.(c).(i) 3 0 0 0 0 0 33 0 0 0 0 0 0 0 0 0 0 2.(c).(iii) 2 0 0 0 0 0 0 0 0 50 0 0 0 0 0 0 0 2.(e).(i) 5 0 0 0 0 20 0 0 0 0 0 0 0 0 0 0 40 2.(e).(ii) 3 0 0 0 0 33 0 0 0 0 0 0 0 33 0 33 0 2.(f) 38 0 0 0 0 5 0 0 0 21 0 0 0 13 0 13 0
3.(b) 1 0 0 0 0 100 0 0 0 0 0 0 0 0 0 0 0 3.(e) 1 0 0 0 0 0 0 0 0 0 0 0 0 0 0 0 0 3.(f) 1 0 0 0 0 0 0 0 0 0 0 0 0 0 0 0 0 3.(g) 2 0 0 0 0 0 0 0 0 0 0 0 0 0 0 0 0
4.(a) 5 20 0 20 0 40 0 20 0 40 0 0 20 0 0 0 0 4.(a).(i) 3 33 0 0 0 67 33 0 0 33 0 0 0 0 0 0 0 4.(a).(ii) 1 0 0 0 0 0 0 0 0 0 0 0 0 0 0 0 0 4.(a).(iv) 2 0 0 0 0 50 0 0 0 50 0 0 0 50 0 0 0 4.(a).(viii) 6 0 0 0 0 33 0 0 0 50 0 0 0 0 0 0 0 4.(b).(i) 3 0 0 0 0 0 0 0 0 33 0 0 0 0 0 0 0 4.(b).(iv) 3 0 0 0 0 0 0 0 0 33 0 0 0 0 0 0 0 4.(b).(v) 3 0 0 0 0 33 0 0 0 33 0 0 0 0 0 0 33 4.(c) 1 0 0 0 0 0 100 0 0 100 0 0 0 0 0 0 0 4.(e) 3 33 0 0 0 33 33 0 0 67 0 0 0 0 0 0 0
5.(a) 6 0 0 17 0 33 0 17 0 50 0 17 0 17 0 0 0 5.(b) 8 50 0 0 0 25 0 0 0 0 0 13 13 0 0 0 0 5.(c) 1 100 0 0 0 100 0 0 0 100 0 100 0 100 0 0 0 5.(d) 60 57 0 27 0 83 2 2 0 70 0 45 0 7 0 7 0 5.(e) 1 0 0 0 0 100 0 0 0 100 0 0 0 0 0 0 0
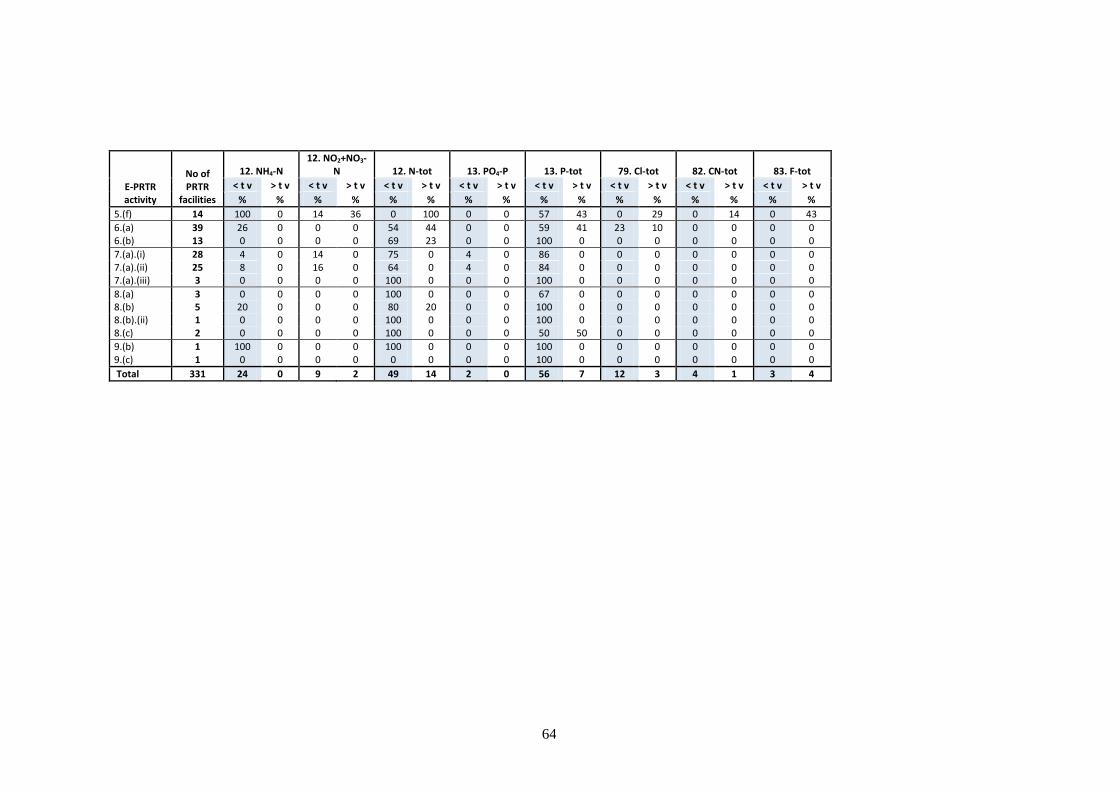
64
E-PRTR activity
No of PRTR
facilities
12. NH4-N 12. NO2+NO3-
N 12. N-tot 13. PO4-P 13. P-tot 79. Cl-tot 82. CN-tot 83. F-tot
< t v > t v < t v > t v < t v > t v < t v > t v < t v > t v < t v > t v < t v > t v < t v > t v
% % % % % % % % % % % % % % % %
5.(f) 14 100 0 14 36 0 100 0 0 57 43 0 29 0 14 0 43
6.(a) 39 26 0 0 0 54 44 0 0 59 41 23 10 0 0 0 0 6.(b) 13 0 0 0 0 69 23 0 0 100 0 0 0 0 0 0 0
7.(a).(i) 28 4 0 14 0 75 0 4 0 86 0 0 0 0 0 0 0 7.(a).(ii) 25 8 0 16 0 64 0 4 0 84 0 0 0 0 0 0 0 7.(a).(iii) 3 0 0 0 0 100 0 0 0 100 0 0 0 0 0 0 0
8.(a) 3 0 0 0 0 100 0 0 0 67 0 0 0 0 0 0 0 8.(b) 5 20 0 0 0 80 20 0 0 100 0 0 0 0 0 0 0 8.(b).(ii) 1 0 0 0 0 100 0 0 0 100 0 0 0 0 0 0 0 8.(c) 2 0 0 0 0 100 0 0 0 50 50 0 0 0 0 0 0
9.(b) 1 100 0 0 0 100 0 0 0 100 0 0 0 0 0 0 0 9.(c) 1 0 0 0 0 0 0 0 0 100 0 0 0 0 0 0 0
Total 331 24 0 9 2 49 14 2 0 56 7 12 3 4 1 3 4

65
Emissions of inorganic substances indirectly to water, reported as off-site transfers, presented as a percentage of the total number of PRTR-classified
facilities reporting emissions to water. The results are presented as percentage below (<t v) and above (> t v) the threshold values to E-PRTR.
E-PRTR activity
No of PRTR
facilities
12. NH4-N 12. NO2+NO3-N 12. N-tot 13. PO4-P 13. P-tot 79. Cl-tot 82. CN-tot 83. F-tot
< t v > t v < t v > t v < t v > t v < t v > t v < t v > t v < t v > t v < t v > t v < t v > t v
% % % % % % % % % % % % % % % %
1.(c) 6 33 0 0 0 33 0 0 0 33 0 0 0 0 0 0 0
2.(b) 1 0 0 0 0 0 0 0 0 100 0 0 0 0 0 0 0 2.(d) 3 0 0 0 0 33 0 0 0 33 0 0 0 0 0 0 0 2.(e).(ii) 1 0 0 0 0 0 0 0 0 0 0 0 0 0 0 0 0 2.(f) 8 0 0 0 0 0 0 0 0 25 0 0 0 0 0 25 0
3.(e) 2 50 0 0 0 0 0 0 0 0 0 0 0 0 0 50 0
4.(a) 1 0 0 0 0 0 0 0 0 0 0 0 0 0 0 0 0 4.(a).(i) 2 0 0 0 0 0 0 0 0 0 0 0 0 0 0 0 0 4.(a).(ii) 14 0 0 0 0 21 0 0 0 14 0 0 0 0 0 0 0 4.(a).(iv) 1 0 0 0 0 0 0 0 0 0 0 0 0 0 0 0 0 4.(a).(viii) 3 0 0 0 0 0 0 0 0 0 0 0 33 0 0 0 0 4.(b).(i) 2 0 0 0 0 50 0 0 0 0 0 0 50 0 0 0 0 4.(b).(iv) 1 0 0 0 0 0 0 0 0 0 0 0 0 0 0 0 0 4.(e) 5 0 0 0 0 0 0 0 0 20 0 0 0 0 0 0 0 4.(f) 1 0 0 0 0 100 0 0 0 0 0 0 0 0 0 0 0
5.(a) 2 50 0 0 0 100 0 0 0 100 0 0 0 0 0 0 0 5.(c) 1 0 0 0 0 0 0 0 0 0 0 0 0 0 0 0 0 5.(d) 50 46 0 8 0 84 4 4 0 74 0 46 0 12 0 6 0 5.(e) 5 0 0 0 0 60 0 0 0 100 0 0 0 0 0 0 0
6.(b) 1 0 0 0 0 100 0 0 0 100 0 0 0 0 0 0 0
7.(a).(ii) 1 100 0 0 0 0 0 0 0 0 0 0 0 0 0 0 0
8.(a) 11 0 0 0 0 82 9 0 0 82 18 0 0 0 0 0 0 8.(b) 8 0 0 0 0 88 0 0 0 63 13 13 0 0 0 0 0 8.(b).(i) 2 0 0 0 0 0 0 0 0 100 0 0 0 0 0 0 0 8.(b).(ii) 4 0 0 0 0 100 0 0 0 50 50 0 0 0 0 0 0 8.(c) 16 0 0 0 0 69 13 0 0 56 44 0 0 0 0 0 0
9.(a) 3 33 0 0 0 100 0 0 0 67 0 0 0 0 0 0 0 9.(c) 2 0 0 0 0 0 0 0 0 0 0 0 0 0 0 0 0
Total 157 18 0 3 0 57 3 1 0 53 8 15 1 4 0 4 0

66
Appendix 7. Results - Chlorinated organic substances
Emissions of chlorinated organic substances to air presented as a percentage of the total number of PRTR-classified facilities reporting emissions to
air. The results are presented as percentage below (<t v) and above (> t v) the threshold values to E-PRTR.
E-PRTR activity
No of PRTR
facilities
34. EDC 35. DCM 42. HCB 47. PCDD+PCDF 52. PER 57. TRI 58. Trichloromethane
< t v > t v < t v > t v < t v > t v < t v > t v < t v > t v < t v > t v < t v > t v
% % % % % % % % % % % % % %
1.(a) 5 0 0 0 0 0 0 0 0 0 60 0 0 0 0 1.(c) 128 0 0 0 0 0 0 9 2 0 0 0 0 0 0
2.(a) 3 0 0 0 0 0 0 0 100 0 0 0 0 0 0 2.(b) 12 0 0 0 0 0 0 50 25 0 8 0 0 0 0 2.(c) 1 0 0 0 0 0 0 0 0 0 0 0 0 0 0 2.(c).(i) 4 0 0 0 0 0 0 0 0 0 0 0 0 0 0 2.(c).(iii) 3 0 0 0 0 0 0 0 0 0 0 0 0 0 0 2.(d) 10 0 0 0 0 0 0 0 0 0 0 0 0 0 0 2.(e).(i) 6 0 0 0 0 0 0 17 17 0 0 0 0 0 0 2.(e).(ii) 6 0 0 0 0 0 0 0 17 0 0 0 0 0 0 2.(f) 20 0 0 0 0 0 0 0 0 5 0 0 0 0 0
3.(b) 1 0 0 0 0 0 0 0 0 0 0 0 0 0 0 3.(c) 10 0 0 0 0 0 0 40 20 0 0 0 0 0 0 3.(e) 3 0 0 0 0 0 0 0 0 0 0 0 0 0 0 3.(f) 2 0 0 0 0 0 0 0 0 0 0 0 0 0 0 3.(g) 4 0 0 0 0 0 0 25 0 0 0 0 0 0 0
4.(a) 6 0 0 0 0 0 0 0 0 0 0 0 0 0 0 4.(a).(i) 6 0 0 0 0 0 0 0 0 0 17 0 0 0 0 4.(a).(ii) 14 0 7 0 0 0 0 0 0 0 0 0 0 0 0 4.(a).(iv) 3 0 0 0 0 0 0 0 0 0 0 0 0 0 0 4.(a).(viii) 8 0 13 0 0 0 0 12.5 0 0 0 0 0 0 13 4.(b).(i) 4 0 0 0 0 0 0 0 0 0 0 0 0 0 0 4.(b).(iii) 1 0 0 0 0 0 0 0 0 0 0 0 0 0 0 4.(b).(iv) 3 0 0 0 0 0 0 0 0 0 0 0 0 0 0 4.(b).(v) 4 0 0 0 0 25 0 0 0 0 0 0 0 0 0 4.(c) 1 0 0 0 0 0 0 0 0 0 0 0 0 0 0 4.(e) 6 0 0 17 0 0 0 0 0 0 0 0 0 17 0

67
E-PRTR activity
No of PRTR
facilities
34. EDC 35. DCM 42. HCB 47. PCDD+PCDF 52. PER 57. TRI 58. Trichloromethane
< t v > t v < t v > t v < t v > t v < t v > t v < t v > t v < t v > t v < t v > t v
% % % % % % % % % % % % % %
4.(f) 1 0 0 0 0 0 0 0 0 0 0 0 0 0 0
5.(a) 8 0 0 0 0 0 0 13 0 0 0 0 0 0 0 5.(b) 22 9 0 0 0 0 0 59 9 5 0 0 0 5 0 5.(d) 23 0 0 0 0 0 0 0 0 0 0 0 0 0 0 5.(e) 2 0 0 0 0 0 0 0 0 0 0 0 0 0 0 5.(f) 6 0 0 0 0 0 0 0 0 33 0 33 0 17 0
6.(a) 38 0 0 0 0 0 0 74 0 0 0 0 0 0 0 6.(b) 11 0 0 0 0 0 0 27 0 0 0 0 0 0 0
7.(a) 2 0 0 0 0 0 0 0 0 0 0 0 0 0 0 7.(a).(i) 126 0 0 0 0 0 0 0 0 0 0 0 0 0 0 7.(a).(ii) 90 0 0 0 0 0 0 0 0 0 0 0 0 0 0 7.(a).(iii) 11 0 0 0 0 0 0 0 0 0 0 0 0 0 0
8.(a) 6 0 0 0 0 0 0 0 0 0 0 0 0 0 0 8.(b) 11 0 0 0 0 0 0 0 0 0 0 0 0 0 0 8.(b).(i) 1 0 0 0 0 0 0 0 0 0 0 0 0 0 0 8.(b).(ii) 3 0 0 0 0 0 0 0 0 0 0 0 0 0 0 8.(c) 3 0 0 0 0 0 0 0 0 0 0 0 0 0 0
9.(a) 3 0 0 0 0 0 0 0 0 0 0 0 0 0 0 9.(b) 1 0 0 0 0 0 0 0 0 0 0 0 0 0 0 9.(c) 22 0 0 0 0 0 0 0 0 0 0 0 0 0 0 9.(d) 1 0 0 0 0 0 0 0 0 0 0 0 0 0 0 9.(e) 1 0 0 0 0 0 0 0 0 0 0 0 0 0 0
Total 666 0.3 0.3 0.2 0 0.2 0 10 2.1 0.6 0.8 0.3 0 0.5 0.2
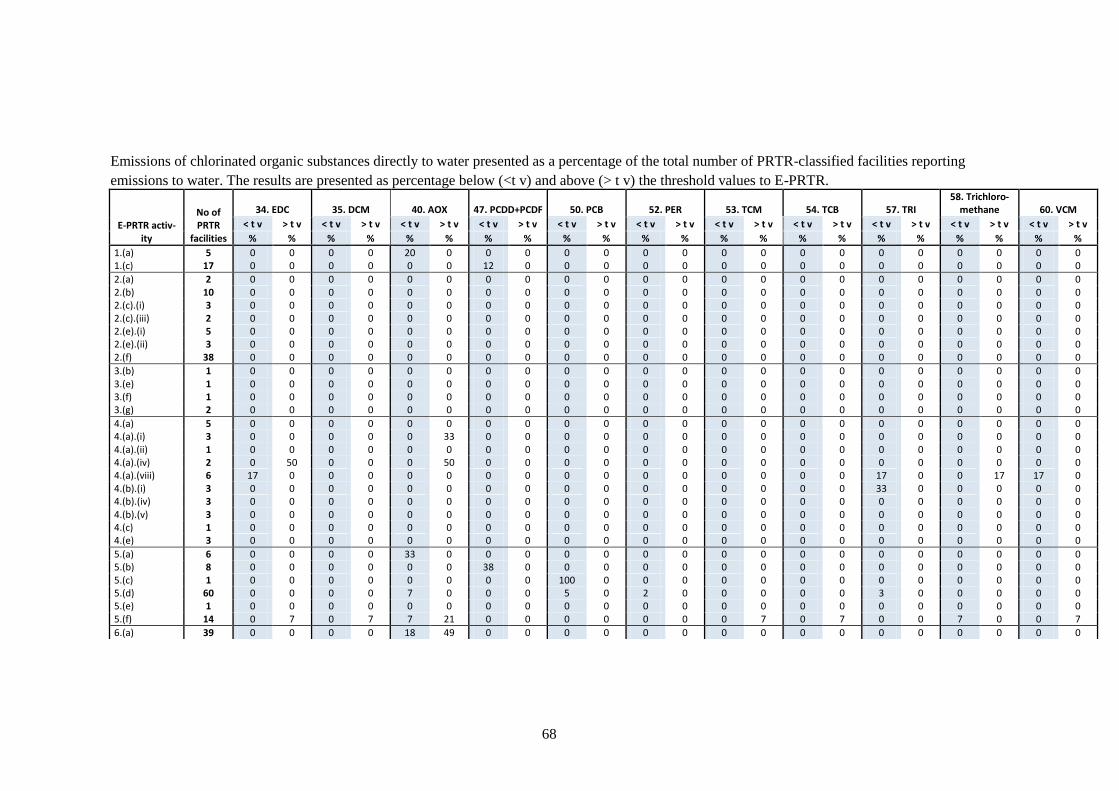
68
Emissions of chlorinated organic substances directly to water presented as a percentage of the total number of PRTR-classified facilities reporting
emissions to water. The results are presented as percentage below (<t v) and above (> t v) the threshold values to E-PRTR.
E-PRTR activ-ity
No of PRTR
facilities
34. EDC 35. DCM 40. AOX 47. PCDD+PCDF 50. PCB 52. PER 53. TCM 54. TCB 57. TRI 58. Trichloro-
methane 60. VCM
< t v > t v < t v > t v < t v > t v < t v > t v < t v > t v < t v > t v < t v > t v < t v > t v < t v > t v < t v > t v < t v > t v
% % % % % % % % % % % % % % % % % % % % % %
1.(a) 5 0 0 0 0 20 0 0 0 0 0 0 0 0 0 0 0 0 0 0 0 0 0 1.(c) 17 0 0 0 0 0 0 12 0 0 0 0 0 0 0 0 0 0 0 0 0 0 0
2.(a) 2 0 0 0 0 0 0 0 0 0 0 0 0 0 0 0 0 0 0 0 0 0 0 2.(b) 10 0 0 0 0 0 0 0 0 0 0 0 0 0 0 0 0 0 0 0 0 0 0 2.(c).(i) 3 0 0 0 0 0 0 0 0 0 0 0 0 0 0 0 0 0 0 0 0 0 0 2.(c).(iii) 2 0 0 0 0 0 0 0 0 0 0 0 0 0 0 0 0 0 0 0 0 0 0 2.(e).(i) 5 0 0 0 0 0 0 0 0 0 0 0 0 0 0 0 0 0 0 0 0 0 0 2.(e).(ii) 3 0 0 0 0 0 0 0 0 0 0 0 0 0 0 0 0 0 0 0 0 0 0 2.(f) 38 0 0 0 0 0 0 0 0 0 0 0 0 0 0 0 0 0 0 0 0 0 0
3.(b) 1 0 0 0 0 0 0 0 0 0 0 0 0 0 0 0 0 0 0 0 0 0 0 3.(e) 1 0 0 0 0 0 0 0 0 0 0 0 0 0 0 0 0 0 0 0 0 0 0 3.(f) 1 0 0 0 0 0 0 0 0 0 0 0 0 0 0 0 0 0 0 0 0 0 0 3.(g) 2 0 0 0 0 0 0 0 0 0 0 0 0 0 0 0 0 0 0 0 0 0 0
4.(a) 5 0 0 0 0 0 0 0 0 0 0 0 0 0 0 0 0 0 0 0 0 0 0 4.(a).(i) 3 0 0 0 0 0 33 0 0 0 0 0 0 0 0 0 0 0 0 0 0 0 0 4.(a).(ii) 1 0 0 0 0 0 0 0 0 0 0 0 0 0 0 0 0 0 0 0 0 0 0 4.(a).(iv) 2 0 50 0 0 0 50 0 0 0 0 0 0 0 0 0 0 0 0 0 0 0 0 4.(a).(viii) 6 17 0 0 0 0 0 0 0 0 0 0 0 0 0 0 0 17 0 0 17 17 0 4.(b).(i) 3 0 0 0 0 0 0 0 0 0 0 0 0 0 0 0 0 33 0 0 0 0 0 4.(b).(iv) 3 0 0 0 0 0 0 0 0 0 0 0 0 0 0 0 0 0 0 0 0 0 0 4.(b).(v) 3 0 0 0 0 0 0 0 0 0 0 0 0 0 0 0 0 0 0 0 0 0 0 4.(c) 1 0 0 0 0 0 0 0 0 0 0 0 0 0 0 0 0 0 0 0 0 0 0 4.(e) 3 0 0 0 0 0 0 0 0 0 0 0 0 0 0 0 0 0 0 0 0 0 0
5.(a) 6 0 0 0 0 33 0 0 0 0 0 0 0 0 0 0 0 0 0 0 0 0 0 5.(b) 8 0 0 0 0 0 0 38 0 0 0 0 0 0 0 0 0 0 0 0 0 0 0 5.(c) 1 0 0 0 0 0 0 0 0 100 0 0 0 0 0 0 0 0 0 0 0 0 0 5.(d) 60 0 0 0 0 7 0 0 0 5 0 2 0 0 0 0 0 3 0 0 0 0 0 5.(e) 1 0 0 0 0 0 0 0 0 0 0 0 0 0 0 0 0 0 0 0 0 0 0 5.(f) 14 0 7 0 7 7 21 0 0 0 0 0 0 0 7 0 7 0 0 7 0 0 7
6.(a) 39 0 0 0 0 18 49 0 0 0 0 0 0 0 0 0 0 0 0 0 0 0 0

69
E-PRTR activ-ity
No of PRTR
facilities
34. EDC 35. DCM 40. AOX 47. PCDD+PCDF 50. PCB 52. PER 53. TCM 54. TCB 57. TRI 58. Trichloro-
methane 60. VCM
< t v > t v < t v > t v < t v > t v < t v > t v < t v > t v < t v > t v < t v > t v < t v > t v < t v > t v < t v > t v < t v > t v
% % % % % % % % % % % % % % % % % % % % % %
6.(b) 13 0 0 0 0 46 15 0 0 0 0 0 0 0 0 0 0 0 0 0 0 0 0
7.(a).(i) 28 0 0 0 0 0 0 0 0 0 0 0 0 0 0 0 0 0 0 0 0 0 0 7.(a).(ii) 25 0 0 0 0 0 0 0 0 0 0 0 0 0 0 0 0 0 0 0 0 0 0 7.(a).(iii) 3 0 0 0 0 0 0 0 0 0 0 0 0 0 0 0 0 0 0 0 0 0 0
8.(a) 3 0 0 0 0 0 0 0 0 0 0 0 0 0 0 0 0 0 0 0 0 0 0 8.(b) 5 0 0 0 0 0 0 0 0 0 0 0 0 0 0 0 0 0 0 0 0 0 0 8.(b).(ii) 1 0 0 0 0 0 0 0 0 0 0 0 0 0 0 0 0 0 0 0 0 0 0 8.(c) 2 0 0 0 0 0 0 0 0 0 0 0 0 0 0 0 0 0 0 0 0 0 0
9.(b) 1 0 0 0 0 0 0 0 0 0 0 0 0 0 0 0 0 0 0 0 0 0 0 9.(c) 1 0 0 0 0 0 0 0 0 0 0 0 0 0 0 0 0 0 0 0 0 0 0
Total 351 0.3 0.6 0 0.3 6 8 1 0 1 0 0.3 0 0 0.3 0 0.3 1 0 0.6 0.3 0.3 0.3

70
Emissions of chlorinated organic substances indirectly to water, reported as off-site transfers, presented as a percentage of the total number of PRTR-
classified facilities reporting emissions to water. The results are presented as percentage below (<t v) and above (> t v) the threshold values to E-
PRTR.
E-PRTR activity
No of PRTR facilities
40. AOX 50. PCB
< t v > t v < t v > t v
% % % %
1.(c) 6 0 0 0 0
2.(b) 1 0 0 0 0 2.(d) 3 0 0 0 0 2.(e).(ii) 1 0 0 0 0 2.(f) 8 0 0 0 0
3.(e) 2 0 0 0 0
4.(a) 1 0 0 0 0 4.(a).(i) 2 0 0 0 0 4.(a).(ii) 14 0 0 0 0 4.(a).(iv) 1 0 0 0 0 4.(a).(viii) 3 0 0 0 0 4.(b).(i) 2 0 0 0 0 4.(b).(iv) 1 0 0 0 0 4.(e) 5 0 0 0 0 4.(f) 1 0 0 0 0
5.(a) 2 0 0 0 0 5.(c) 1 0 0 0 0 5.(d) 50 10 0 4 0 5.(e) 5 0 0 0 0
6.(b) 1 0 100 0 0
7.(a).(ii) 1 0 0 0 0
8.(a) 11 0 0 0 0 8.(b) 8 0 0 0 0 8.(b).(i) 2 0 0 0 0 8.(b).(ii) 4 0 0 0 0 8.(c) 16 0 0 0 0
9.(a) 3 33 0 0 0 9.(c) 2 0 0 0 0
Total 157 4 1 1 0
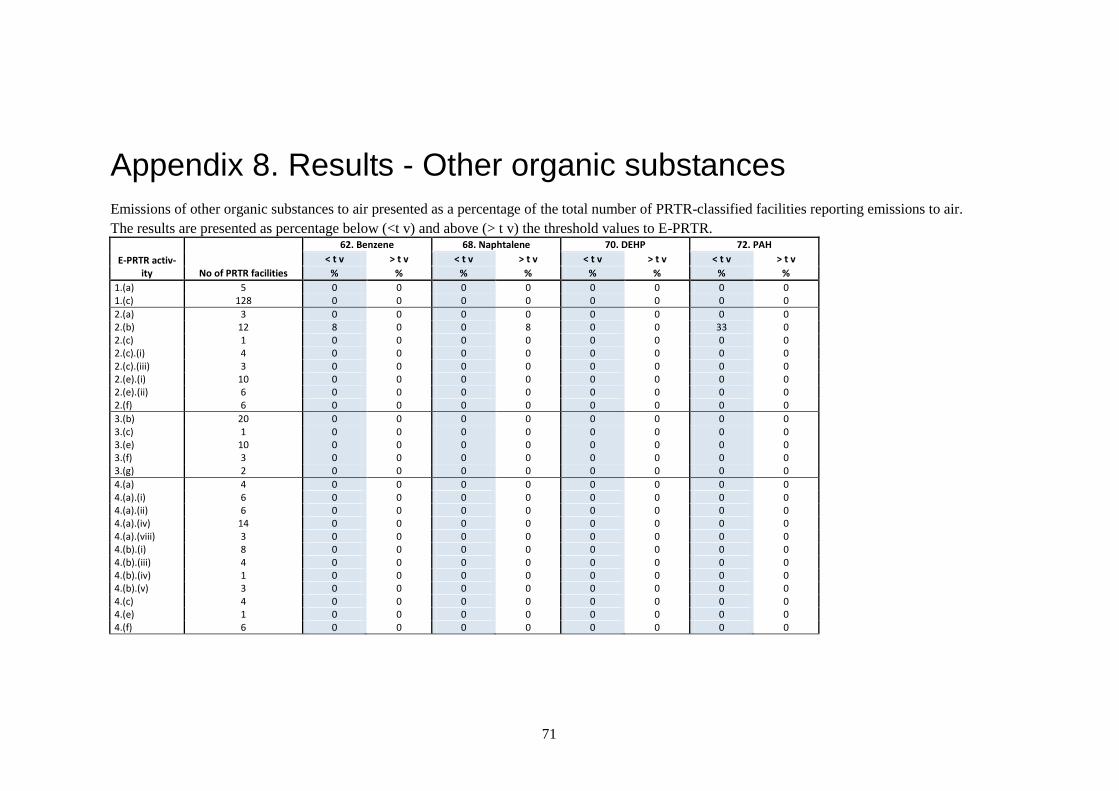
71
Appendix 8. Results - Other organic substances
Emissions of other organic substances to air presented as a percentage of the total number of PRTR-classified facilities reporting emissions to air.
The results are presented as percentage below (<t v) and above (> t v) the threshold values to E-PRTR.
E-PRTR activ-ity No of PRTR facilities
62. Benzene 68. Naphtalene 70. DEHP 72. PAH
< t v > t v < t v > t v < t v > t v < t v > t v
% % % % % % % %
1.(a) 5 0 0 0 0 0 0 0 0 1.(c) 128 0 0 0 0 0 0 0 0
2.(a) 3 0 0 0 0 0 0 0 0 2.(b) 12 8 0 0 8 0 0 33 0 2.(c) 1 0 0 0 0 0 0 0 0 2.(c).(i) 4 0 0 0 0 0 0 0 0 2.(c).(iii) 3 0 0 0 0 0 0 0 0 2.(e).(i) 10 0 0 0 0 0 0 0 0 2.(e).(ii) 6 0 0 0 0 0 0 0 0 2.(f) 6 0 0 0 0 0 0 0 0
3.(b) 20 0 0 0 0 0 0 0 0 3.(c) 1 0 0 0 0 0 0 0 0 3.(e) 10 0 0 0 0 0 0 0 0 3.(f) 3 0 0 0 0 0 0 0 0 3.(g) 2 0 0 0 0 0 0 0 0
4.(a) 4 0 0 0 0 0 0 0 0 4.(a).(i) 6 0 0 0 0 0 0 0 0 4.(a).(ii) 6 0 0 0 0 0 0 0 0 4.(a).(iv) 14 0 0 0 0 0 0 0 0 4.(a).(viii) 3 0 0 0 0 0 0 0 0 4.(b).(i) 8 0 0 0 0 0 0 0 0 4.(b).(iii) 4 0 0 0 0 0 0 0 0 4.(b).(iv) 1 0 0 0 0 0 0 0 0 4.(b).(v) 3 0 0 0 0 0 0 0 0 4.(c) 4 0 0 0 0 0 0 0 0 4.(e) 1 0 0 0 0 0 0 0 0 4.(f) 6 0 0 0 0 0 0 0 0

72
E-PRTR activ-ity No of PRTR facilities
62. Benzene 68. Naphtalene 70. DEHP 72. PAH
< t v > t v < t v > t v < t v > t v < t v > t v
% % % % % % % %
5.(a) 1 0 0 0 0 0 0 0 0 5.(b) 8 0 0 0 0 0 0 0 0 5.(c) 22 0 0 0 0 5 0 0 0 5.(d) 23 0 0 0 0 0 0 0 0 5.(e) 2 0 0 0 0 0 0 0 0 5.(f) 6 0 0 0 0 0 0 0 0
6.(a) 38 0 0 0 0 0 0 50 0 6.(b) 11 0 0 0 0 0 0 0 0
7.(a) 2 0 0 0 0 0 0 0 0 7.(a).(i) 126 0 0 0 0 0 0 0 0 7.(a).(ii) 90 0 0 0 0 0 0 0 0 7.(a).(iii) 11 0 0 0 0 0 0 0 0
8.(a) 6 0 0 0 0 0 0 0 0 8.(b) 11 0 0 0 0 0 0 0 0 8.(b).(i) 1 0 0 0 0 0 0 0 0 8.(b).(ii) 3 0 0 0 0 0 0 0 0 8.(c) 3 0 0 0 0 0 0 0 0
9.(a) 3 0 0 0 0 0 0 0 0 9.(b) 1 0 0 0 0 0 0 0 0 9.(c) 22 0 0 0 0 0 0 0 0 9.(d) 1 0 0 0 0 0 0 0 0 9.(e) 1 0 0 0 0 0 0 0 0
Total 666 0.2 0 0 0.2 0.2 0 3 0

73
Emissions of other organic substances directly to water presented as a percentage of the total number of PRTR-classified facilities reporting emis-
sions to water. The results are presented as percentage below (<t v) and above (> t v) the threshold values to E-PRTR.
E-PRTR activity
No of
PRTR
fa-cili-ties
62. Benzene
64. Alkylphe-nols and
APE
64. Nonyl-phenol
65. Ethylben-
zene
68. Naph-talene 70. DEHP
71. Phenols 72. PAH
73. Toluene
74. Tribu-tyltin* 76. TOC
76. COD-Cr
78. Xylenes
87. Octylphe-
nol 88. PAH-
FA
<t v >t v <t v >t v <t v >t v <t v >t v <t v >t v <t v >t v <t v >t v <t v >t v <t v >t v <t v >t v <t v >t v <t v >t v <t v >t v <t v >t v <t v >t v
% % % % % % % % % % % % % % % % % % % % % % % % % % % % % %
1.(a) 5 0 0 0 0 0 0 0 0 0 0 0 0 40 60 0 0 0 0 0 0 20 0 60 0 0 0 0 0 0 0 1.(c) 17 0 0 0 0 0 0 0 0 0 0 0 0 6 6 0 0 0 0 0 0 6 6 12 0 0 0 0 0 0 0
2.(a) 2 0 0 0 0 0 0 0 0 0 0 0 0 0 0 0 0 0 0 0 0 0 0 0 0 0 0 0 0 0 0 2.(b) 10 0 0 0 0 0 0 0 0 10 0 0 0 0 20 20 0 0 0 0 0 10 0 10 0 0 0 0 0 0 0 2.(c).(i) 3 0 0 0 0 0 0 0 0 0 0 0 0 0 0 0 33 0 0 0 0 0 0 0 0 0 0 0 0 0 0 2.(c).(iii) 2 0 0 0 0 0 0 0 0 0 0 0 0 0 0 0 0 0 0 0 0 0 0 0 0 0 0 0 0 0 0 2.(e).(i) 5 0 0 0 0 0 0 0 0 0 0 0 0 0 0 0 0 0 0 0 0 0 20 0 0 0 0 0 0 0 0 2.(e).(ii) 3 0 0 0 0 0 0 0 0 0 0 0 0 0 0 0 0 0 0 0 0 0 0 33 0 0 0 0 0 0 0 2.(f) 38 0 0 0 0 0 0 0 0 0 0 0 0 0 0 0 0 0 0 16 0 0 0 3 0 0 0 0 0 0 0
3.(b) 1 0 0 0 0 0 0 0 0 0 0 0 0 0 0 0 0 0 0 0 0 0 0 0 0 0 0 0 0 0 0 3.(e) 1 0 0 0 0 0 0 0 0 0 0 0 0 0 0 0 0 0 0 0 0 100 0 0 0 0 0 0 0 0 0 3.(f) 1 0 0 0 0 0 0 0 0 0 0 0 0 100 0 0 0 0 0 0 0 0 0 0 0 0 0 0 0 0 0 3.(g) 2 0 0 0 0 0 0 0 0 0 0 0 0 0 0 0 0 0 0 0 0 0 0 0 0 0 0 0 0 0 0
4.(a) 5 0 0 0 0 0 0 0 0 0 0 0 0 40 0 0 0 0 0 0 0 60 0 20 0 0 0 0 0 0 0 4.(a).(i) 3 0 33 0 0 0 0 33 0 0 0 0 0 33 33 0 0 33 0 0 0 33 33 33 0 33 0 0 0 0 0 4.(a).(ii) 1 0 0 0 0 0 0 0 0 0 0 0 0 0 0 0 0 0 0 0 0 100 0 0 0 0 0 0 0 0 0 4.(a).(iv) 2 0 0 0 50 0 50 0 0 0 0 0 0 0 0 0 0 0 0 0 0 50 0 0 0 0 0 0 0 0 0 4.(a).(viii) 6 0 0 0 0 0 0 17 0 0 0 0 0 0 0 0 0 0 0 0 0 50 17 0 0 0 0 0 0 0 0 4.(b).(i) 3 0 0 0 0 0 0 0 0 0 0 0 0 0 0 0 0 0 0 0 0 0 0 0 0 0 0 0 0 0 0 4.(b).(iv) 3 0 0 0 0 0 0 0 0 0 0 0 0 0 0 0 0 0 0 0 0 0 0 0 0 0 0 0 0 0 0 4.(b).(v) 3 0 0 0 0 0 0 0 0 0 0 0 0 0 0 0 0 0 0 0 0 67 0 33 0 0 0 0 0 0 0 4.(c) 1 0 0 0 0 0 0 0 0 0 0 0 0 0 0 0 0 0 0 0 0 0 0 0 0 0 0 0 0 0 0 4.(e) 3 0 0 0 0 0 0 0 0 0 0 0 0 0 0 0 0 0 0 0 0 67 33 0 0 0 0 0 0 0 0
5.(a) 6 0 0 0 0 0 0 0 0 0 0 0 0 0 33 0 0 0 0 0 0 50 0 50 0 0 0 0 0 0 0 5.(b) 8 0 0 0 0 0 0 0 0 0 0 0 0 0 0 0 0 0 0 0 0 0 0 0 0 0 0 0 0 0 0 5.(c) 1 0 0 0 0 0 0 0 0 0 0 0 0 100 0 0 0 0 0 0 0 0 0 0 0 0 0 0 0 0 0 5.(d) 60 3 0 0 0 0 2 2 0 0 0 0 0 8 0 8 2 2 0 0 0 48 0 28 0 0 0 0 0 0 0

74
E-PRTR activity
No of
PRTR
fa-cili-ties
62. Benzene
64. Alkylphe-nols and
APE
64. Nonyl-phenol
65. Ethylben-
zene
68. Naph-talene 70. DEHP
71. Phenols 72. PAH
73. Toluene
74. Tribu-tyltin* 76. TOC
76. COD-Cr
78. Xylenes
87. Octylphe-
nol 88. PAH-
FA
<t v >t v <t v >t v <t v >t v <t v >t v <t v >t v <t v >t v <t v >t v <t v >t v <t v >t v <t v >t v <t v >t v <t v >t v <t v >t v <t v >t v <t v >t v
% % % % % % % % % % % % % % % % % % % % % % % % % % % % % %
5.(e) 1 0 0 0 0 0 0 0 0 0 0 0 0 0 0 0 0 0 0 0 0 0 0 0 0 0 0 0 0 0 0 5.(f) 14 0 0 0 14 0 7 0 0 0 0 0 36 7 7 0 7 0 0 0 0 0 71 100 0 0 0 7 0 0 7
6.(a) 39 0 0 0 0 0 0 0 0 0 0 0 0 0 0 0 0 0 0 0 0 3 87 46 0 0 0 0 0 0 0 6.(b) 13 0 0 0 0 0 0 0 0 0 0 0 0 0 0 0 0 0 0 0 0 0 23 77 0 0 0 0 0 0 0
7.(a).(i) 28 0 0 0 0 0 0 0 0 0 0 0 0 0 0 0 0 0 0 0 0 0 0 0 0 0 0 0 0 0 0 7.(a).(ii) 25 0 0 0 0 0 0 0 0 0 0 0 0 0 0 0 0 0 0 0 0 0 0 0 0 0 0 0 0 0 0 7.(a).(iii) 3 0 0 0 0 0 0 0 0 0 0 0 0 0 0 0 0 0 0 0 0 0 0 0 0 0 0 0 0 0 0
8.(a) 3 0 0 0 0 0 0 0 0 0 0 0 0 0 0 0 0 0 0 0 0 0 0 33 0 0 0 0 0 0 0 8.(b) 5 0 0 0 0 0 0 0 0 0 0 0 0 0 0 0 0 0 0 0 0 0 20 20 0 0 0 0 0 0 0 8.(b).(ii) 1 0 0 0 0 0 0 0 0 0 0 0 0 0 0 0 0 0 0 0 0 0 0 0 0 0 0 0 0 0 0 8.(c) 2 0 0 0 0 0 0 0 0 0 0 0 0 0 0 0 0 0 0 0 0 0 50 50 0 0 0 0 0 0 0
9.(b) 1 0 0 0 0 0 0 0 0 0 0 0 0 0 0 0 0 0 0 0 0 0 0 100 0 0 0 0 0 0 0 9.(c) 1 0 0 0 0 0 0 0 0 0 0 0 0 0 0 0 0 0 0 0 0 0 0 0 0 0 0 0 0 0 0
Total 331 0.6 0.3 0 0.9 0 0.9 0.9 0 0.3 0 0.3 2 4 3 2 0.9 0.6 0 2 0 15 16 24 0 0.3 0 0.3 0 0 0.3
* Tributyltin belongs to the group of pesticides

75
Emissions of other organic substances indirectly to water, reported as off-site transfers, presented as a percentage of the total number of PRTR-classified facilities
reporting emissions to water. The results are presented as percentage below (<t v) and above (> t v) the threshold values to E-PRTR.
E-PRTR activity
No of PRTR
facilities
64. Alkylphenols and APE
64. Nonylphenol 71. Phenols 72. PAH 73. Toluene 74. Tributyltin 76. TOC 76. COD-Cr
< t v > t v < t v > t v < t v > t v < t v > t v < t v > t v < t v > t v < t v > t v < t v > t v
% % % % % % % % % % % % % % % %
1.(c) 6 0 0 0 0 17 0 0 0 0 0 0 0 0 0 0 0
2.(b) 1 0 0 0 0 0 0 0 0 0 0 0 0 0 0 100 0 2.(d) 3 0 0 0 0 0 0 0 0 0 0 0 0 0 0 33 0 2.(e).(ii) 1 0 0 0 0 0 0 0 0 0 0 0 0 0 0 0 0 2.(f) 8 0 0 0 0 0 0 0 0 0 0 13 0 0 13 0 0
3.(e) 2 0 0 0 0 50 0 0 0 0 0 0 0 0 0 0 0
4.(a) 1 0 0 0 0 100 0 0 0 0 0 0 0 0 0 0 0 4.(a).(i) 2 0 0 0 0 0 0 0 0 0 0 0 0 0 0 100 0 4.(a).(ii) 14 0 7 7 0 0 7 0 0 0 7 0 0 50 43 0 0 4.(a).(iv) 1 0 0 0 0 0 0 0 0 0 0 0 0 0 0 100 0 4.(a).(viii) 3 0 0 0 0 0 0 0 0 0 0 0 0 67 33 33 0 4.(b).(i) 2 0 0 0 0 0 0 0 0 0 0 0 0 50 0 0 0 4.(b).(iv) 1 0 0 0 0 0 0 0 0 0 0 0 0 100 0 0 0 4.(e) 5 0 0 0 0 0 0 0 0 0 0 0 0 40 20 40 0 4.(f) 1 0 0 0 0 0 0 0 0 0 0 0 0 0 0 0 0
5.(a) 2 0 0 0 0 0 50 0 0 0 0 0 0 50 0 0 0 5.(c) 1 0 0 0 0 0 0 0 0 0 0 100 0 0 0 0 0 5.(d) 50 0 0 0 0 18 0 6 0 0 0 0 0 44 2 30 0 5.(e) 5 0 0 0 0 0 0 0 0 0 0 0 0 0 0 20 0
6.(b) 1 0 0 0 0 0 0 0 0 0 0 0 0 0 0 0 0
7.(a).(ii) 1 0 0 0 0 0 0 0 0 0 0 0 0 0 0 0 0
8.(a) 11 0 0 0 0 0 0 0 0 0 0 0 0 0 0 36 0 8.(b) 8 0 0 0 0 0 0 0 0 0 0 0 0 13 25 13 0 8.(b).(i) 2 0 0 0 0 0 0 0 0 0 0 0 0 0 0 0 0 8.(b).(ii) 4 0 0 0 0 0 0 0 0 0 0 0 0 0 50 25 25 8.(c) 16 0 0 0 0 0 0 0 0 0 0 0 0 0 25 19 13
9.(a) 3 0 0 67 0 0 0 0 0 0 0 0 0 67 0 33 0 9.(c) 2 0 0 0 0 0 0 0 0 0 0 0 0 0 0 0 0
Total 157 0 1 2 0 8 1 2 0 0 1 1 0 25 11 22 2

76
Appendix 9. WWTPs in monitoring program
WWTP in the national monitoring programme 2010 (Haglund and Olofsson, 2011).
WWTP Municipality Size Load
Ön Umeå Medium, 129000 peq.
Households, hospital, university, almost no industrial load
Borlänge Borlänge Medium, 25000 peq.
Small industries, hospital, sanitation water from metal industries and paper mill
Henriksdal Stockholm Large, 656000 peq.
Households, industries, hospitals, laundry
Nolhaga Alingsås Medium, 27000 peq.
Industries, laundry, landfill, households
Ryaverket Göteborg Large, 640000 peq.
Households, industries, leachate, hospitals, laundries
Bollebygd Bollebygd Small, 3700 peq. Households, from 2009 also processing water from textile industry
Gässlösa Borås Medium, 73000 pq.
Households, hospital, textile industries
Bergkvara Torsås Small, 2500 peq. Households, almost no industrial load
Ellinge Eslöv Medium, 74000 peq.
Industries (food processing), laundry, house-holds

77
Appendix 10. Results – Ratio (water/sludge) from measure-ments
Parameter No (E-PRTR) Substance WWTP
Sludge or water data below the
detection limit
Total amount in effluent
(kg) Total amount in sludge (kg)
Ratio (wa-ter/sludge)
31 Chloro-alkanes (C10-13) Henriksdal: week 40-2007 x 432 86 5 31 Chloro-alkanes (C10-13) Henriksdal: week 16-2008 x 471 23 20 31 Chloro-alkanes (C10-13) Bromma: week 40-2007 x 216 23 9 31 Chloro-alkanes (C10-13) Bromma: week 16-2008 x 238 0.52 460 31 Chloro-alkanes (C10-13) Bergkvara 2010 - 0.071 31 Chloro-alkanes (C10-13) Bollebygd 2010 - 0.13 31 Chloro-alkanes (C10-13) Borlänge 2010 - 1.2 31 Chloro-alkanes (C10-13) Ellinge 2010 - 0.69 31 Chloro-alkanes (C10-13) Gässlösa 2010 - 1.8 31 Chloro-alkanes (C10-13) Henriksdals 2010 - 31 31 Chloro-alkanes (C10-13) Nolhaga 2010 - 1.5 31 Chloro-alkanes (C10-13) Ryaverket 2010 - 39 31 Chloro-alkanes (C10-13) Öns 2010 - 2.1
34 1,2-dichloroethane (EDC) Henriksdal: week 40-2007 x 86 - 34 1,2-dichloroethane (EDC) Henriksdal: week 16-2008 x 94 - 34 1,2-dichloroethane (EDC) Bromma: week 40-2007 x 43 - 34 1,2-dichloroethane (EDC) Bromma: week 16-2008 x 48 -
35 Dichloromethane (DCM) Henriksdal: week 40-2007 x 259 - 35 Dichloromethane (DCM) Henriksdal: week 16-2008 x 565 - 35 Dichloromethane (DCM) Bromma: week 40-2007 x 129 - 35 Dichloromethane (DCM) Bromma: week 16-2008 x 285 -
43 Hexachlorobutadiene (HCBD) Henriksdal: week 40-2007 x 8.6 0.075 120 43 Hexachlorobutadiene (HCBD) Henriksdal: week 16-2008 x 0.94 0.073 13
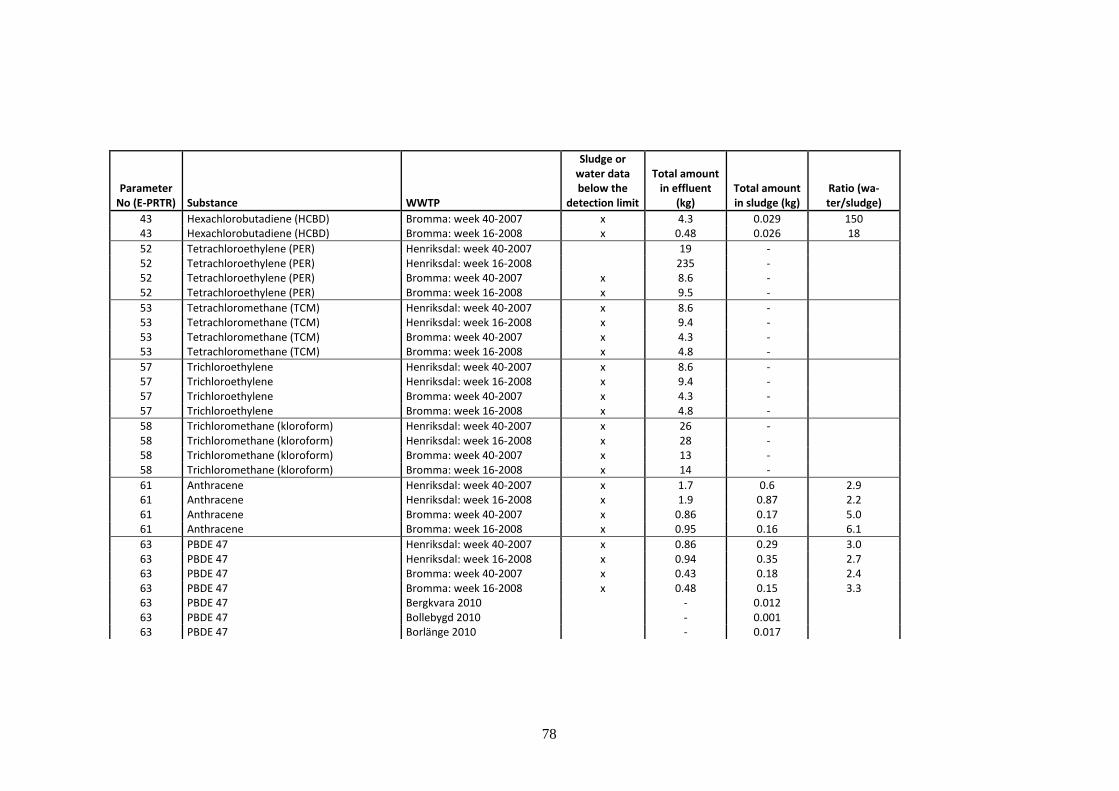
78
Parameter No (E-PRTR) Substance WWTP
Sludge or water data below the
detection limit
Total amount in effluent
(kg) Total amount in sludge (kg)
Ratio (wa-ter/sludge)
43 Hexachlorobutadiene (HCBD) Bromma: week 40-2007 x 4.3 0.029 150 43 Hexachlorobutadiene (HCBD) Bromma: week 16-2008 x 0.48 0.026 18
52 Tetrachloroethylene (PER) Henriksdal: week 40-2007 19 - 52 Tetrachloroethylene (PER) Henriksdal: week 16-2008 235 - 52 Tetrachloroethylene (PER) Bromma: week 40-2007 x 8.6 - 52 Tetrachloroethylene (PER) Bromma: week 16-2008 x 9.5 -
53 Tetrachloromethane (TCM) Henriksdal: week 40-2007 x 8.6 - 53 Tetrachloromethane (TCM) Henriksdal: week 16-2008 x 9.4 - 53 Tetrachloromethane (TCM) Bromma: week 40-2007 x 4.3 - 53 Tetrachloromethane (TCM) Bromma: week 16-2008 x 4.8 -
57 Trichloroethylene Henriksdal: week 40-2007 x 8.6 - 57 Trichloroethylene Henriksdal: week 16-2008 x 9.4 - 57 Trichloroethylene Bromma: week 40-2007 x 4.3 - 57 Trichloroethylene Bromma: week 16-2008 x 4.8 -
58 Trichloromethane (kloroform) Henriksdal: week 40-2007 x 26 - 58 Trichloromethane (kloroform) Henriksdal: week 16-2008 x 28 - 58 Trichloromethane (kloroform) Bromma: week 40-2007 x 13 - 58 Trichloromethane (kloroform) Bromma: week 16-2008 x 14 -
61 Anthracene Henriksdal: week 40-2007 x 1.7 0.6 2.9 61 Anthracene Henriksdal: week 16-2008 x 1.9 0.87 2.2 61 Anthracene Bromma: week 40-2007 x 0.86 0.17 5.0 61 Anthracene Bromma: week 16-2008 x 0.95 0.16 6.1
63 PBDE 47 Henriksdal: week 40-2007 x 0.86 0.29 3.0 63 PBDE 47 Henriksdal: week 16-2008 x 0.94 0.35 2.7 63 PBDE 47 Bromma: week 40-2007 x 0.43 0.18 2.4 63 PBDE 47 Bromma: week 16-2008 x 0.48 0.15 3.3 63 PBDE 47 Bergkvara 2010 - 0.012 63 PBDE 47 Bollebygd 2010 - 0.001 63 PBDE 47 Borlänge 2010 - 0.017

79
Parameter No (E-PRTR) Substance WWTP
Sludge or water data below the
detection limit
Total amount in effluent
(kg) Total amount in sludge (kg)
Ratio (wa-ter/sludge)
63 PBDE 47 Ellinge 2010 - 0.022 63 PBDE 47 Gässlösa 2010 - 0.046
63 PBDE 47 Henriksdals 2010 - 0.31 63 PBDE 47 Nolhaga 2010 - 0.016 63 PBDE 47 Ryaverket 2010 - 0.23 63 PBDE 47 Öns 2010 - 0.039
63 PBDE 99 Henriksdal: week 40-2007 x 0.86 0.56 1.6 63 PBDE 99 Henriksdal: week 16-2008 x 0.94 0.39 2.4 63 PBDE 99 Bromma: week 40-2007 x 0.43 0.21 2.1 63 PBDE 99 Bromma: week 16-2008 x 0.48 0.16 3.0 63 PBDE 99 Bergkvara 2010 - 0.002 63 PBDE 99 Bollebygd 2010 - 0.001 63 PBDE 99 Borlänge 2010 - 0.020 63 PBDE 99 Ellinge 2010 - 0.018 63 PBDE 99 Gässlösa 2010 - 0.077 63 PBDE 99 Henriksdals 2010 - 0.24 63 PBDE 99 Nolhaga 2010 - 0.015 63 PBDE 99 Ryaverket 2010 - 0.34 63 PBDE 99 Öns 2010 - 0.032
63 PBDE 100 Henriksdal: week 40-2007 x 0.86 0.29 3.0 63 PBDE 100 Henriksdal: week 16-2008 x 0.94 0.081 12 63 PBDE 100 Bromma: week 40-2007 x 0.43 0.091 4.7 63 PBDE 100 Bromma: week 16-2008 x 0.48 0.032 15 63 PBDE 100 Bergkvara 2010 - 0.0005 63 PBDE 100 Bollebygd 2010 - 0.002 63 PBDE 100 Borlänge 2010 - 0.005 63 PBDE 100 Ellinge 2010 - 0.005 63 PBDE 100 Gässlösa 2010 - 0.021 63 PBDE 100 Henriksdals 2010 - 0.11

80
Parameter No (E-PRTR) Substance WWTP
Sludge or water data below the
detection limit
Total amount in effluent
(kg) Total amount in sludge (kg)
Ratio (wa-ter/sludge)
63 PBDE 100 Nolhaga 2010 - 0.007 63 PBDE 100 Ryaverket 2010 - 0.035 63 PBDE 100 Öns 2010 - 0.007
63 BDE 85 Henriksdal: week 40-2007 x 0.86 0.29 3.0 63 BDE 85 Henriksdal: week 16-2008 x 0.94 0.001 740 63 BDE 85 Bromma: week 40-2007 x 0.43 0.091 4.7 63 BDE 85 Bromma: week 16-2008 x 0.48 0.006 76
63 PBDE 209 Henriksdal: week 40-2007 x 4.3 3.5 1.3 63 PBDE 209 Henriksdal: week 16-2008 x 0.94 8.4 0.11 63 PBDE 209 Bromma: week 40-2007 x 2.2 1.3 1.7 63 PBDE 209 Bromma: week 16-2008 x 0.48 2.6 0.18 63 PBDE 209 Bergkvara 2010 - 0.24 63 PBDE 209 Bollebygd 2010 - 0.023 63 PBDE 209 Borlänge 2010 - 0.41 63 PBDE 209 Ellinge 2010 - 0.48 63 PBDE 209 Gässlösa 2010 - 1.5 63 PBDE 209 Henriksdals 2010 - 10 63 PBDE 209 Nolhaga 2010 - 0.39 63 PBDE 209 Ryaverket 2010 - 8.4 63 PBDE 209 Öns 2010 - 0.96
64 Nonylphenol Henriksdal: week 40-2007 x 17 135 0.13 64 Nonylphenol Henriksdal: week 16-2008 x 4.7 220 0.021 64 Nonylphenol Bromma: week 40-2007 x 8.6 34 0.26 64 Nonylphenol Bromma: week 16-2008 5.7 70 0.082
64 4-nonylphenol, branched Henriksdal: week 40-2007 x 17 135 0.13 64 4-nonylphenol, branched Henriksdal: week 16-2008 x 4.7 220 0.021 64 4-nonylphenol, branched Bromma: week 40-2007 x 8.6 34 0.26 64 4-nonylphenol, branched Bromma: week 16-2008 5.7 70 0.082 64 4-nonylphenol, branched Bergkvara 2010 x 0.11 0.008 14

81
Parameter No (E-PRTR) Substance WWTP
Sludge or water data below the
detection limit
Total amount in effluent
(kg) Total amount in sludge (kg)
Ratio (wa-ter/sludge)
64 4-nonylphenol, branched Bollebygd 2010 x 0.04 0.006 6.3 64 4-nonylphenol, branched Borlänge 2010 4.0 0.17 23 64 4-nonylphenol, branched Ellinge 2010 x 0.42 0.47 0.88 64 4-nonylphenol, branched Gässlösa 2010 x 1.4 1.0 1.3 64 4-nonylphenol, branched Henriksdals 2010 x 9.2 12 0.74 64 4-nonylphenol, branched Nolhaga 2010 1.0 0.14 7.4 64 4-nonylphenol, branched Ryaverket 2010 x 12 5.0 2.4 64 4-nonylphenol, branched Öns 2010 4.4 10 0.43
64 4-n-Nonylphenol Henriksdal: week 40-2007 x 1.7 0.15 12 64 4-n-Nonylphenol Henriksdal: week 16-2008 x 0.94 0.15 6.5 64 4-n-Nonylphenol Bromma: week 40-2007 x 0.86 0.057 15 64 4-n-Nonylphenol Bromma: week 16-2008 x 0.48 0.052 9.1
64 Nonylphenol ethoxylates Henriksdal: week 40-2007 26 26 1.0 64 Nonylphenol ethoxylates Henriksdal: week 16-2008 x 19 12 1.5 64 Nonylphenol ethoxylates Bromma: week 40-2007 13 4.3 3.0 64 Nonylphenol ethoxylates Bromma: week 16-2008 x 9.5 8.8 1.1
70 DEHP Henriksdal: week 40-2007 104 870 0.12 70 DEHP Henriksdal: week 16-2008 x 94 1378 0.068 70 DEHP Bromma: week 40-2007 x 43 348 0.12 70 DEHP Bromma: week 16-2008 x 48 677 0.070 70 DEHP Bergkvara 2010 - 5.1 70 DEHP Bollebygd 2010 - 2.9 70 DEHP Borlänge 2010 - 59 70 DEHP Ellinge 2010 - 46 70 DEHP Gässlösa 2010 - 112 70 DEHP Henriksdals 2010 - 580 70 DEHP Nolhaga 2010 - 27 70 DEHP Ryaverket 2010 - 931 70 DEHP Öns 2010 - 1572

82
Parameter No (E-PRTR) Substance WWTP
Sludge or water data below the
detection limit
Total amount in effluent
(kg) Total amount in sludge (kg)
Ratio (wa-ter/sludge)
Sum cancerogenic PAH Henriksdal: week 40-2007 x 17 0.45 38 Sum cancerogenic PAH Henriksdal: week 16-2008 x 19 5.2 3.6 Sum cancerogenic PAH Bromma: week 40-2007 x 8.6 0.17 50 Sum cancerogenic PAH Bromma: week 16-2008 x 9.5 0.16 61
Sum other PAH Henriksdal: week 40-2007 x 26 7.8 3.3 Sum other PAH Henriksdal: week 16-2008 x 28 11 2.5 Sum other PAH Bromma: week 40-2007 x 13 0.17 75 Sum other PAH Bromma: week 16-2008 x 14 2.1 6.8
72 Benzo(a)pyrene Henriksdal: week 40-2007 x 1.7 23 0.077 72 Benzo(a)pyrene Henriksdal: week 16-2008 x 1.9 28 0.068 72 Benzo(a)pyrene Bromma: week 40-2007 x 0.86 4.6 0.19 72 Benzo(a)pyrene Bromma: week 16-2008 x 0.95 5.7 0.17
72 Benzo(b,k)fluoranten Henriksdal: week 40-2007 x 1.7 1.2 1.4 72 Benzo(b,k)fluoranten Henriksdal: week 16-2008 x 1.9 1.7 1.1 72 Benzo(b,k)fluoranten Bromma: week 40-2007 x 0.86 0.17 5.0 72 Benzo(b,k)fluoranten Bromma: week 16-2008 x 0.95 0.16 6.1
72 Indeno(1,2,3-cd)pyrene Henriksdal: week 40-2007 x 1.7 0.45 3.8 72 Indeno(1,2,3-cd)pyrene Henriksdal: week 16-2008 x 1.9 0.44 4.3 72 Indeno(1,2,3-cd)pyrene Bromma: week 40-2007 x 0.86 0.17 5.0 72 Indeno(1,2,3-cd)pyrene Bromma: week 16-2008 x 0.95 0.16 6.1
87 4-tert-Oktylfenol Henriksdal: week 40-2007 x 1.7 8.0 0.22 87 4-tert-Oktylfenol Henriksdal: week 16-2008 x 0.94 12 0.081 87 4-tert-Oktylfenol Bromma: week 40-2007 x 0.86 1.7 0.52 87 4-tert-Oktylfenol Bromma: week 16-2008 x 0.48 1.8 0.27 87 4-tert-Oktylfenol Bergkvara 2010 0.009 0.29 0.030 87 4-tert-Oktylfenol Bollebygd 2010 0.005 0.19 0.027 87 4-tert-Oktylfenol Borlänge 2010 0.26 9.7 0.027 87 4-tert-Oktylfenol Ellinge 2010 0.075 12 0.006 87 4-tert-Oktylfenol Gässlösa 2010 0.63 25 0.025

83
Parameter No (E-PRTR) Substance WWTP
Sludge or water data below the
detection limit
Total amount in effluent
(kg) Total amount in sludge (kg)
Ratio (wa-ter/sludge)
87 4-tert-Oktylfenol Henriksdals 2010 x 0.92 119 0.008 87 4-tert-Oktylfenol Nolhaga 2010 0.048 6.6 0.007 87 4-tert-Oktylfenol Ryaverket 2010 x 1.2 222 0.006 87 4-tert-Oktylfenol Öns 2010 4.9 34 0.15
87 Octylphenolethoxylates Henriksdal: week 40-2007 x 0.15 87 Octylphenolethoxylates Henriksdal: week 16-2008 1.9 3.4 0.55 87 Octylphenolsethoxylates Bromma: week 40-2007 x
0.057
87 Octylphenolsethoxylates Bromma: week 16-2008 0.95 0.93 1.0
88 Fluoranthene Henriksdal: week 40-2007 x 1.7 1.2 1.4 88 Fluoranthene Henriksdal: week 16-2008 x 1.9 2.6 0.72 88 Fluoranthene Bromma: week 40-2007 3.0 0.17 18 88 Fluoranthene Bromma: week 16-2008 x 0.95 0.36 2.6
89 Isodrin Henriksdal: week 40-2007 x 8.6 0.015 580 89 Isodrin Henriksdal: week 16-2008 x 0.94 0.015 65 89 Isodrin Bromma: week 40-2007 x 4.3 0.006 760 89 Isodrin Bromma: week 16-2008 x 0.48 0.005 91
91 Benzo (g,h,i) perylene Henriksdal: week 40-2007 x 1.7 0.45 3.8 91 Benzo (g,h,i) perylene Henriksdal: week 16-2008 x 1.9 0.44 4.3 91 Benzo (g,h,i) perylene Bromma: week 40-2007 x 0.86 0.17 5.0 91 Benzo (g,h,i) perylene Bromma: week 16-2008 x 0.95 0.16 6.1
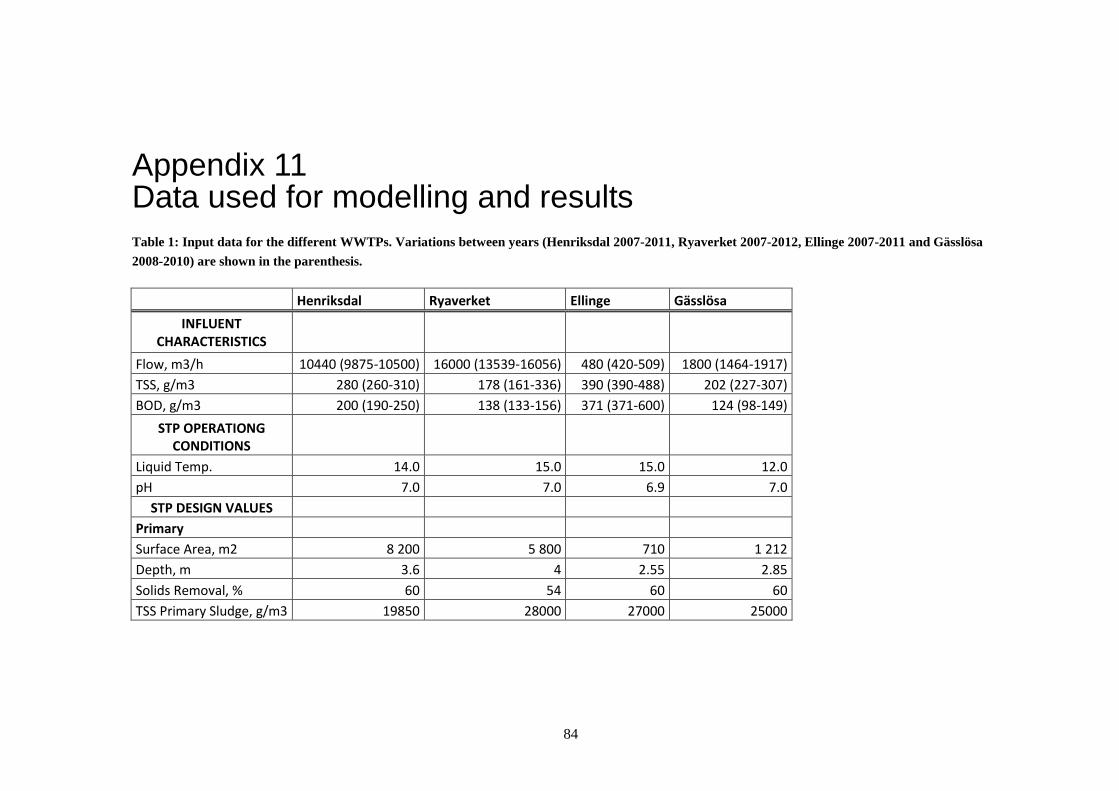
84
Appendix 11 Data used for modelling and results
Table 1: Input data for the different WWTPs. Variations between years (Henriksdal 2007-2011, Ryaverket 2007-2012, Ellinge 2007-2011 and Gässlösa
2008-2010) are shown in the parenthesis.
Henriksdal Ryaverket Ellinge Gässlösa
INFLUENT CHARACTERISTICS
Flow, m3/h 10440 (9875-10500) 16000 (13539-16056) 480 (420-509) 1800 (1464-1917)
TSS, g/m3 280 (260-310) 178 (161-336) 390 (390-488) 202 (227-307)
BOD, g/m3 200 (190-250) 138 (133-156) 371 (371-600) 124 (98-149)
STP OPERATIONG CONDITIONS
Liquid Temp. 14.0 15.0 15.0 12.0
pH 7.0 7.0 6.9 7.0
STP DESIGN VALUES
Primary
Surface Area, m2 8 200 5 800 710 1 212
Depth, m 3.6 4 2.55 2.85
Solids Removal, % 60 54 60 60
TSS Primary Sludge, g/m3 19850 28000 27000 25000

85
Henriksdal Ryaverket Ellinge Gässlösa
Chemical Liq Phase MTC, m/h 0.016 0.016 0.016 0.016
Liq Phase/ Gas Phase MTC Ratio 0.009 0.009 0.009 0.009
Aeration Tank
Surface Area, m2 22 500 2 200 810 2 079
Depth, m 12 10 4.2 6
MLSS, mg/L 2 500 2 400 4 000 3 000
Air flow rate, m3 air/m3 inflow rate 2.6 0.3 10.38 1.17
Sludge Recycle as frac-tion of influent 0.37 0.3 0.3 0.5
Waste Sludge as fraction of influent 0.01 0.006 0.006 0.005
Liq Phase/ Gas Phase MTC Ratio 0.025 0.025 0.025 0.025
Secondary Settler
Surface Area, m2 11 000 21 100 1 100 1 264
Depth, m 5.2 10 3.2 3.52
Effluent TSS, g/m3 7 (2.0-7.0) 10 (4.5-12.5) 5 (4.4-6.4) 15 (6.0-12.0)
Liq Phase/ Gas Phase MTC Ratio 0.009 0.009 0.009 0.009

86
Table 2. Physical-chemical properties used as model input.
Molecular mass g/mol KAW Vapour Pressure, Pa
Water Solubility, g/m3 Log KOW pKa
Log KBW
nonylphenol branched 220.36 0 1.26E-02 5.00E+00 5.92 0 0
4-n-nonylphenol 220.36 0 1.09E-01 7.00E+00 5.76 0 0
oktylphenol 206.33 0 1.30E-02 3.11E+00 5.5 0 0
oktylphenolethoxylate 250.38 0 1.49E-04 4.47E+00 4.96 0 0
BDE 47 485.8 0 8.18E-05 9.28E-03 6.3 0 0
BDE 85 564.69 0 7.64E-06 1.02E-03 6.7 0 0
BDE 99 564.69 0 7.64E-06 1.02E-03 6.7 0 0
BDE 100 564.69 0 7.64E-06 1.02E-03 6.7 0 0
BDE 209 959.17 0 5.42E-11 1.29E-08 9.1 0 0
DEHP 390.57 0 1.89E-05 2.70E-01 7.6 0 0
tetrachloroethylene 165.83 0 2.47E+03 2.06E+02 3.4 0 0
tetrachloromethan 153.82 0 1.53E+04 7.95E+02 2.83 0 0
trichlorobenzene 181.45 0 6.11E+01 3.00E+01 3.93 0 0
1,2-Dichloroethane 98.96 0 1.05E+04 8.60E+03 1.48 0 0
trichloroethylene (tri) 193.89 0 8.45E+04 1.81E+03 2.12 0 0
dichlormethane 84.93 0 5.80E+04 1.30E+04 1.25 0 0
trichloromethane 119.38 0 2.63E+04 7.95E+03 1.97 0 0
benso(a)pyrene 252.32 0 7.32E-07 1.62E-03 6.13 0 0

87
benso(b)fluoranthene 252.32 0 6.67E-05 1.50E-03 5.78 0 0
benso(k)fluoranthene 252.32 0 1.29E-07 8.00E-04 6.11 0 0
indeno(1,2,3-cd)pyren 276.34 0 1.67E-08 1.90E-04 6.7 0 0
anthracene 178.24 0 8.71E-04 4.34E-02 4.45 0 0
flouranthene 202.26 0 1.23E-03 2.60E-01 5.16 0 0
benzo(g,h,i)perylene 276.34 0 1.33E-08 2.60E-04 6.63 0 0
chloroalkanes (C10-13) 410 (320-500) 0 2.10E-02 0.31 (0.15-0.47) 6.54 (4.39-8.69) 0 0
HCBD 260.76 0 2.93E+01 3.20E+00 4.78 0 0
isodrin 364.92 0 5.87E-03 1.42E-02 6.75 0 0

88
Table 3. Degradation half-lives used as model input. Half-lives in different
treatmentsteps are estimated from the aqueous biodeg. half life time according to
Seth et al, 2008.
Half life degradation (h), liquid phase
Primary Tank
Aeration Tank
Secondary Settler
Aqueous biodeg. half-life (h)
nonylphenol bran-ched 10 1 1 360
4-n-nonylphenol 10 1 1 360
oktylphenol 10 1 1 360
oktylphenolethoxylate 10 1 1 360
BDE 47 30 3 3 4320
BDE 85 30 3 3 4320
BDE 99 30 3 3 4320
BDE 100 30 3 3 4320
BDE 209 30 3 3 4320
DEHP 10 1 1 360
tetrachloroethylene 10 1 1 1440
tetrachloromethan 10 1 1 1440
trichlorobenzene 10 1 1 1440
1,2-Dichloroethane 10 1 1 900
trichloroethylene (tri) 10 1 1 900
dichlormethane 10 1 1 900
trichloromethane 10 1 1 900
benso(a)pyrene 10 1 1 1440
benso(b)fluoranthene 10 1 1 1440
benso(k)fluoranthene 10 1 1 1440
indeno(1,2,3-cd)pyren 10 1 1 1440
anthracene 10 1 1 1440
flouranthene 10 1 1 1440
benzo(g,h,i)perylene 10 1 1 1440
chloroalkanes (C10-13) 10 1 1 < 2700
HCBD 30 3 3 4320
isodrin 30 3 3 4320

89
Table 4. Model predicted water/sludge ratios for four different WWTPs, an-
nual averages.
Henriksdal Ryaverket Ellinge Gässlösa
nonylphenol branched 0.029 0.071 0.025 0.096
4-n-nonylfenol 0.027 0.072 0.026 0.093
nonylfenoltoxilat
oktylfenol 0.028 0.076 0.029 0.091
oktylfenoletoxilat 0.033 0.10 0.038 0.11
PBDE (BDE 47) 0.035 0.080 0.026 0.12
PBDE (BDE 85) 0.032 0.073 0.022 0.11
PBDE (BDE 99) 0.032 0.073 0.022 0.11
PBDE (BDE 100) 0.032 0.073 0.022 0.11
PBDE (BDE 209) 0.029 0.069 0.019 0.11
Dietylhexylftalat (DEHP) 0.029 0.069 0.019 0.11
tetrakloretylen (per) 0.16 1.0 0.11 0.88
tetraklormetan (koltetraklo-rid)
0.32 2.5 0.16 2.0
triklorbensener 0.089 0.43 0.088 0.40
1,2-Dikloretan 0.95 9.9 0.94 7.2
trikloretylen (tri) 0.52 4.9 0.16 3.495
diklormetan 0.97 10 0.90 7.5
triklormetan (kloroform) 0.79 7.7 0.69 5.7
benso(a)pyren 0.028 0.070 0.023 0.099
bens(b)fluoranten 0.027 0.072 0.026 0.093
bens(k)fluoranten 0.028 0.070 0.023 0.099
indeno(1,2,3-cd)pyren 0.029 0.069 0.020 0.11
antracen 0.050 0.19 0.056 0.18
flouranten 0.030 0.089 0.034 0.097
benzo(g,h,i)perylen 0.028 0.069 0.021 0.11
kloralkaner (C10-13) 0.028 0.069 0.021 0.11
kloralkaner min 0.053 0.202 0.058 0.20
kloralkaner max 0.029 0.069 0.019 0.11
hexaklorbutadien (HCBD) 0.079 0.25 0.050 0.23
isodrin 0.031 0.073 0.021 0.11