Embed Size (px)
Citation preview

© OECD/IEA 2016
Electric mobility Status, policies and prospects
Clean Transport Forum - 22 September 2016, Bogotá Marine Gorner, International Energy Agency

© OECD/IEA 2016
0
2
4
6
8
10
12
14
2015 2020 2025 2030 2035 2040 2045 2050
We
ll to
wh
ee
l GH
G e
mis
sio
ns
(Gt
CO
₂)
Aviation reduction
Shipping reduction
Rail reduction
Trucks reduction
Buses reduction
Cars and LCVs reduction
2 and 3 wheelers reduction
Aviation
Shipping
Rail
Trucks
Buses
Cars and LCVs
2 and 3 wheelers
The role of electric cars in sustainable transport
0
2
4
6
8
10
12
14
2015 2020 2025 2030 2035 2040 2045 2050
We
ll to
wh
ee
l GH
G e
mis
sio
ns
(Gt
CO
₂)
Aviation reduction
Shipping reduction
Rail reduction
Trucks reduction
Buses reduction
Cars and LCVs reduction
2 and 3 wheelers reduction
Aviation
Shipping
Rail
Trucks
Buses
Cars and LCVs
2 and 3 wheelers
Total GHG emissions – all sectors GHG emissions – transport
0
5
10
15
20
25
30
35
40
45
2015 2020 2025 2030 2035 2040 2045 2050
GH
G e
mis
sio
ns
(Gt
CO
₂)
Other transformation reduction
Power reduction
Transport reduction
Agriculture reduction
Services reduction
Residential reduction
Industry reduction
Other transformation
Power
Transport
Agriculture
Services
Residential
Industry
22% 2DS
4DS
0
2
4
6
8
10
12
14
2015 2020 2025 2030 2035 2040 2045 2050
We
ll to
wh
ee
l GH
G e
mis
sio
ns
(Gt
CO
₂)
Aviation reduction
Shipping reduction
Rail reduction
Trucks reduction
Buses reduction
Cars and LCVs reduction
2 and 3 wheelers reduction
Aviation
Shipping
Rail
Trucks
Buses
Cars and LCVs
2 and 3 wheelers
2DS
4DS
44%
Electric cars can make a major contribution, but are also needed: “avoid, shift, improve” electrified road freight and mass transport
© OECD/IEA 2016
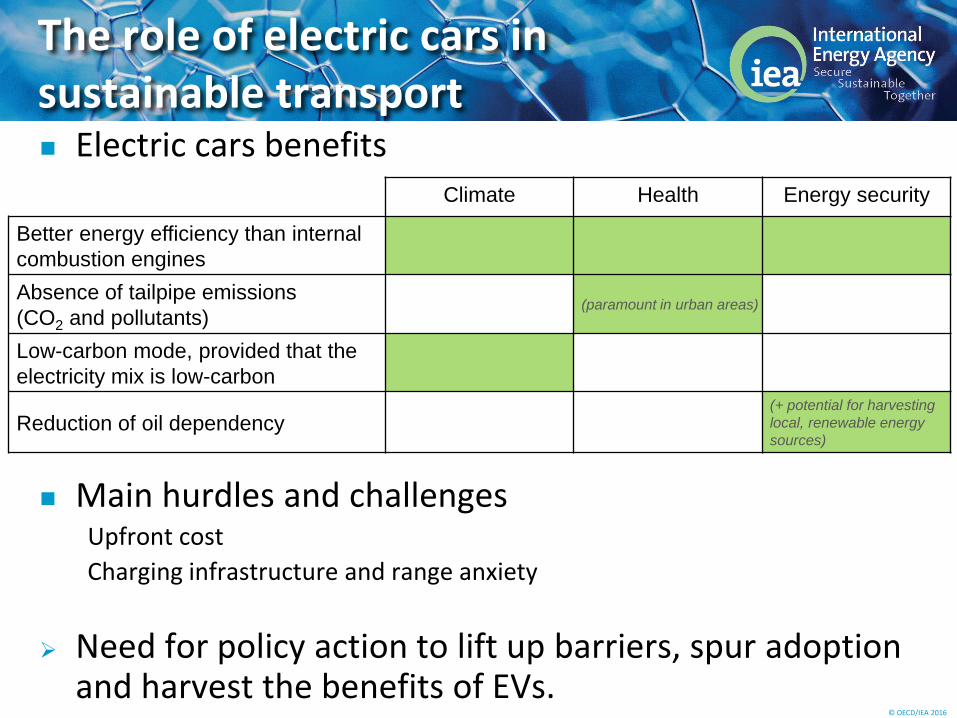
The role of electric cars in sustainable transport Electric cars benefits
Main hurdles and challenges Upfront cost
Charging infrastructure and range anxiety
Need for policy action to lift up barriers, spur adoption and harvest the benefits of EVs.
Climate Health Energy security
Better energy efficiency than internal
combustion engines
Absence of tailpipe emissions
(CO2 and pollutants) (paramount in urban areas)
Low-carbon mode, provided that the
electricity mix is low-carbon
Reduction of oil dependency (+ potential for harvesting
local, renewable energy
sources)
© OECD/IEA 2016
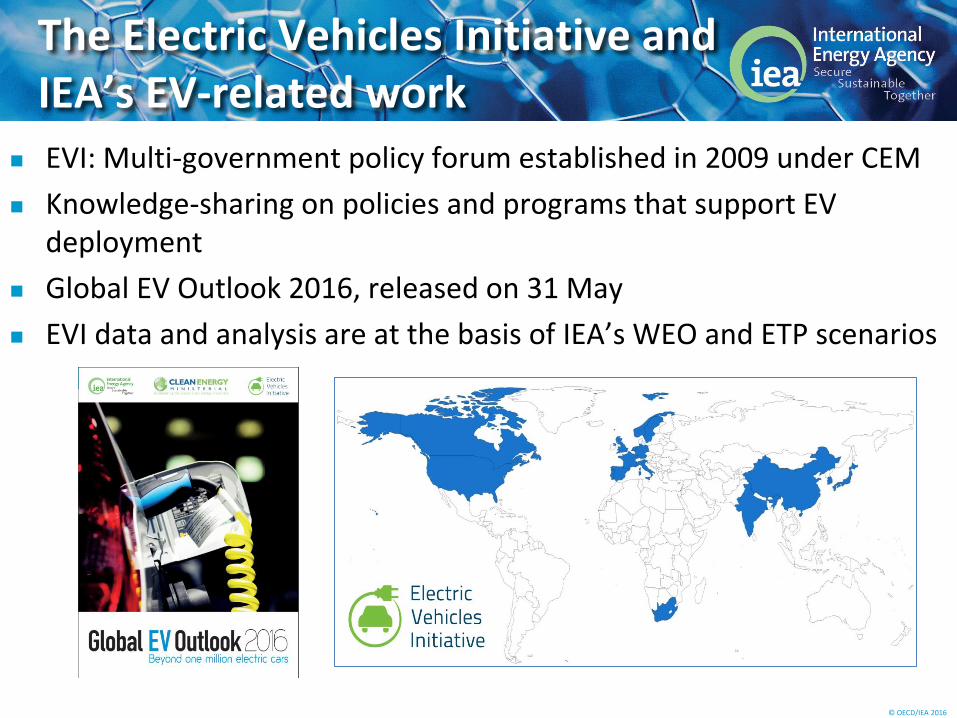
The Electric Vehicles Initiative and IEA’s EV-related work
EVI: Multi-government policy forum established in 2009 under CEM
Knowledge-sharing on policies and programs that support EV deployment
Global EV Outlook 2016, released on 31 May
EVI data and analysis are at the basis of IEA’s WEO and ETP scenarios

© OECD/IEA 2016
550,000 EVs sold in 2015 (+ 70%)
China became the first EV market in 2015
9/10 EVs sold in 8 countries (China, US, Netherlands, Norway, UK, Japan, Germany, France)
7 countries >1% market share (Norway, Netherlands, Sweden, Denmark, France, China, UK)
0%
5%
10%
15%
20%
25%
0
50
100
150
200
250C
hin
a
Un
ite
d S
tate
s
Net
her
lan
ds
No
rway
Un
ite
d K
ingd
om
Jap
an
Ger
man
y
Fran
ce
Swed
en
Oth
ers
Mar
ket
shar
e (2
01
5)
New
ele
ctri
c ca
r re
gist
rati
on
s (t
ho
usa
nd
s)
2010
2011
2012
2013
2014
2015
2015 marketshare
GEVO 2016: the electric car market in 2015

© OECD/IEA 2016
EV stock evolution, 2010-2015
1.26 million EVs in circulation by end of 2015
59% BEVs
4/5 EVs in 5 countries (US, China, Japan, Netherlands, Norway)
Other modes: 200 M e-2Wheelers, 173 k e-buses (mainly in China)
2015: 1 million EVs
0
200
400
600
800
1 000
1 200
1 400
2010 2011 2012 2013 2014 2015
Elec
tric
car
sto
ck (
tho
usa
nd
s)
Others
Canada
Germany
United Kingdom
France
Norway
Netherlands
Japan
China
United States
BEV
BEV + PHEV

© OECD/IEA 2016
RD&D: battery costs and energy density
PHEV battery costs:
-73% in the past 7 years
Ambitious announcements in the next future: -58% to go in the next 7 years
Wider model availability (Renault-Nissan, BMW, GM, Tesla (…) did not offer the same variety of EVs 5 years ago… )
Further improvements needed to enable longer ranges for lower costs,
addressing range anxiety and increasing EV competitiveness
0
50
100
150
200
250
300
350
400
450
500
0
200
400
600
800
1000
1200
2008 2009 2010 2011 2012 2013 2014 2015 2020 2022
Bat
tery
en
ergy
den
sity
(W
h/L
)
Bat
tery
co
st (
USD
/kW
h)
Battery cost (PHEV) 2022 DOE Battery cost target (PHEV)
2020 Tesla Battery cost target (BEV) 2022 GM Battery cost target (BEV)
Energy density (PHEV) 2022 DOE Energy density target (PHEV)
$268/kWh
295Wh/L
400Wh/L
$125/kWh

© OECD/IEA 2016
Purchase incentives and EV market shares, 2015
0%
2%
4%
6%
8%
10%
12%
14%
16%
18%
20%
0
5 000
10 000
15 000
20 000
25 000
Ch
ina
Fran
ce
Jap
an
Net
her
lan
ds
No
rway
Po
rtu
gal
Swed
en
Un
ite
d K
ingd
om
Un
ite
d S
tate
s
Sha
re o
f P
HEV
or
BEV
in
tota
l ca
r m
ark
et
Esti
ma
ted
ma
gnit
ud
e o
f p
urc
ha
se in
cen
tive
(U
SD)
PHEVs
BEVs
BEV market share
PHEV market share
Various policy mechanisms behind the “market pull” Differentiated taxation: CO2-based rebates, technology-based rebates,
feebates, VAT exemptions Waivers on charges, preferential treatment possible if differentiated
number plates are in place
Norway stands out in terms of incentives and EV adoption Difficult to come to conclusions for other markets (very early phase)

© OECD/IEA 2016
EV Supply Equipment
0%
20%
40%
60%
80%
100%
120%
140%
0
200
400
600
800
1 000
1 200
1 400
1 600
2010 2011 2012 2013 2014 2015
Year
-on
-yea
r gr
ow
th r
ate
Ch
argi
ng
ou
tlet
s
Private chargers
Publicly available fastchargers
Publicly available slowchargers
Growth rate of publiclyavailable fast chargers
Growth rate of publiclyaccessible slow chargers
Growth rate of privatechargers
0.82 million
1.45 million
The deployment of publicly accessible chargers is positively correlated with the growth in EV sales
Need for charging network to overcome range anxiety barrier
Incentives are not just needed for vehicle purchase

© OECD/IEA 2016
Policy needs
A policy framework with high taxes on conventional fuels and stringent fuel economy standards is favorable for EVs
Purchase and circulation incentives and the availability of charging infrastructure are positively correlated with EV uptake
Need for fiscal measures (e.g. differentiated taxation, feebates) to kick start the market uptake
Need for mechanisms supporting the deployment of recharging infrastructure
Additional measures can further increase the value proposition of EVs
Examples: waivers on access restrictions (bus lanes) and urban/parking pricing schemes
Incentives can only be transitional Risk of tax revenue losses (incl. from fuel purchase). Need to adapt taxation
mechanisms.
Risk of congestion effects and detrimental effects to public transportation.
Need for close monitoring and periodical revisions to adapt to a fast evolving market

© OECD/IEA 2016
Illustration: a possibly sizeable contribution of EVs to fuel economy targets
GFEI targets
• 2030: fuel consumption per km of new LDVs 50% better than in 2005
IEA 2DS
• GFEI target needs ICE improvement, hybrids & EVs
• EVs (PHEV and BEVs): sizeable impact after 2020
2.0
3.0
4.0
5.0
6.0
7.0
8.0
2005 2010 2015 2020 2025 2030 2035 2040 2045 2050
New
PLD
V a
vera
ge f
uel
eco
no
my
-te
st
valu
es, N
EDC
(Lg
e/1
00
km)
World
4DS
2DS - no EVs
2DS - EVs

© OECD/IEA 2016
EV deployment targets
0
20
40
60
80
100
120
140
160
2010 2015 2020 2025 2030
Elec
tric
car
s in
th
e ve
hic
le s
tock
(m
illio
ns)
Historical
IEA 2DS
Paris Declaration
EVI 2020 target
Cumulative countrytargets
1.26 million 13 million
20 million 100 million
140 million
Horizon 2050 (2DS): ● 450-550 million EVs ● 25% global car stock
0%
2%
4%
6%
8%
10%
12%
14%
0
1
2
3
4
5
6
7
2020 2030
mill
ion
ele
ctri
c ca
rs
PHEV stock
BEV stock
EV sales share
EV stock share
World
Latin America, IEA 2DS

© OECD/IEA 2016
Thank you for your attention